materials recycling and environmental sustainability...
TRANSCRIPT

Theme-IV
Materials Recycling and Environmental
Sustainability (MRES)
Organized by

5th International Conference on Energy, Environment and Sustainable Development 2018 (EESD 2018)
Millet Husk Ash as Environmental Friendly Material in Cement
Concrete
Narain Das Bheela*, Fareed Ahmed Memonb, Shanker Lal Meghwarc Abdul Wahab Abroa, Irfan
Ali Shara
aM.E Scholar, Department of Civil Engineering, Mehran UET, Jamshoro 76062, Sindh, Pakistan. bProfessor, Department of Civil Engineering, Mehran UET, Jamshoro 76062, Sindh, Pakistan. cLecturer, Department of Civil Engineering, Mehran UET, Jamshoro 76062, Sindh, Pakistan.
Abstract
In this research work, the millet husk ash (MHA) used as a partial replacement material with the different percentages
i.e. 0%, 5%, 10%, 15% and 20% by the weight of cement. The aim of this study is to check the behavior of MHA in
concrete. Millet husk is available in abundant quantity in local agricultural fields and considered as waste after separation
of grains. On the other hand, cement production emits a lot of toxic gases in the atmosphere which causes environmental
pollution and greenhouse gases. Thus, MHA can be used as a cementitious material in the replacement of cement in
concrete for sustainable development. In this consequence, total 30 numbers of standard concrete cubes were cast with
the mix proportion of M25 for checking the compressive strength at different curing ages of 7 and 28 days. Further, at
each proportion of MHA, three cubes were cast and tested in Universal Testing Machine (UTM). The experimental
results show that there is a considerable increment in compressive strength at 5% of MHA when replaced with cement.
In addition, the flow of fresh concrete decreases with an increasing percentage of MHA. Therefore, MHA used in
concrete improve the fresh and harden properties of concrete.
© 2018 Naraind Das Bheel; Prof. Dr. Fareed Ahmed Memon; Shanker Lal Meghwar; Abdul Wahab Abro; Irfan Ali Shar. Selection and/or peer-review under responsibility of Energy and Environmental Engineering Research Group (EEERG), Mehran University of Engineering and
Technology, Jamshoro, Pakistan
Keywords: “Millet Husk Ash, environmental pollution, compressive strength, sustainable development”.
1. Introduction:
Concrete is the most broadly utilized and fundamental structural material used in all over the world for the development
of infrastructure [1]. The necessity and significance of concrete in the construction industry are always growing since
its innovation [2]. Lomborg (2007) stated that the use of concrete is greater than any other artificial material on earth
[3-4]. It is an inexpensive, adaptable and tough material and can be converted into several forms and finishes. Mostly,
Concrete reduces the environmental pollution and henceforth concrete structures are designed for long service life [5].
Concrete is an artificial material prepared with ordinary Portland cement and widely used material on the planet earth.
In spite of this, concrete production is one of the universal despairs, having an effect on the environment. The most
alarming effect is global warming which is due to CO2 release during the manufacture of cement [6, 7]. From the year
2005, the country like China manufactured concrete about six billion cubic meters per year that consume the world's
cement production of about 40%. The rate of concrete is comparatively high due to the exuberant cost of its main
integral, the ordinary Portland cement (OPC) [1]. The consumption of OPC was raised from two million tons in 1880 to
about 1.3 billion tons in 1996 and this growth caused the major environmental problem according to Malhorta (2002)
[8]. However, the production of one-ton cement emits approximately one ton of CO2 in the atmosphere [9, 10] and
Malhotra presented a report that manufacturing of cement contributes to being the third biggest carbon-dioxide (CO2)
instigator [8]. Muga et al. (2005) stated that the production of one tone of cement requires about 1.6 tons of natural
resources [11]. Cement is a primary integral of concrete which is not only an expensive but also its manufacture
generates environmental hazardous [1]. Consequently, the industry of cement is striving for other alternatives to reduce
the use of cement by unwanted materials. Many researchers conducted the experimental work by using partially cement
* Corresponding author. Tel.: +0-000-000-0000 ; fax: +0-000-000-0000 .
E-mail address: [email protected]
153

5th International Conference on Energy, Environment and Sustainable Development 2018 (EESD 2018)
replacement materials in concrete with industrial/agricultural wastes such as rice husk ash, sugar cane bagasse ash, corn
cob ash, fly ash, silica fume, wood ash, groundnut husk ash etc. to increase the strength of reinforced concrete structures
and decrease the requirement of ordinary Portland cement [9, 12]. These fillers with pozzolanic properties impart
nominal benefits along with huge amounts of cement replacement to be accomplished [13-19]. Proper use of these
unwanted materials will lead to the enhancement of air quality, the decrease in solid wastes, and the sustainability of the
cement and concrete industry.
Millet crop is grown widely around the world as grains for fodder and human food. Millet is a significant crop in semi-
arid tropics of Asia and Africa [20]. Donough et al (2000) stated that the developing countries produce about 97% of
millet. FAO (2007) presented the report that out of total production of around 28.38 million tons of millet, 40% is
produced in Africa which was ranked as the second biggest producer of millet in the World [21-22].
Further, after processing and separating the grains of millet, the husk is either dumped onsite as waste stuff or spread in
agriculture field and left for months to compost naturally. This composted husk is enriched with minerals essential for
growth of millet plant and act as organic fertilizer. Thus, millet husk (MH) is used as organic fertilizer by a local farmer
who grows this crop. But, on the other hand, this husk when burnet at certain temperature contains cementitious
properties likes cement. Moreover, the Millet Husk Ash (MHA) is obtained by burning the millet husk by using an
uncontrolled burning method [23]. And this ash can be utilized as binding ingredient in the making of concrete. The
number of experimental researches has been carried out by utilizing MHA as a cement substituent material in concrete.
S.M et al. (2015) carried out the research investigation on the hardened properties of concrete intermingled with 0%-
20% of MHA by the weight of cement in concrete. In this research study, the cubes were prepared and cured at 7, 14,
28 and 35 days. It was indicated that the compressive strength measured was -20% by using 10% of MHA in concrete
at 35 days [24].
Solomon et al. (2017) conducted the experimental investigation on the mechanical properties of concrete intermingled
with 0%-40% of MHA as a cement substituent material in concrete. In this study, the concrete blocks were prepared and
cured at 7, 14, 28 days. The result was noted which depicted that the compressive strength measured was -11% by using
10% of MHA in concrete after 28 days [25].
This experimental work was conducted on the use of Millet Husk Ash as a cement substituent material in concrete. It
elaborated the determination of flow of concrete and cubical compressive strength by using various percentages of MHA
as a substituent in concrete.
2. Materials and Methodology:
This research study was investigated to check the workability of fresh and hardened properties of concrete by using
various percentages of MHA as a cement substituent material. For that, five proportion of MHA such as 0%, 5%, 10%,
15%, and 20% were used by the weight of cement. Total 30 cubes (100x100x100mm) were prepared and cured at 7 and
28 days. These concrete cubes were cast for compressive strength at target strength of 25 N/mm2 and ultimately tested
on the universal testing machine (UTM) under the guidance of British Standard (BS) code. For each proportion, three
concrete specimens were cast at every age of curing. This experimental work was completed in the concrete and
structural laboratory, Department of Civil Engineering, MUET Jamshoro, Sindh, Pakistan. Furthermore, the ratio of mix
design and materials used in the experimental work are summarized in Table 1.
Table 1: Mix Design of Concrete
S.No. Mix Ratio Water-cement
ratio
%ages of
MHA
Cement Fine
Aggregates
Coarse
Aggregates
01 1:1.63:2.75 0.54 0 100 100 100
02 1:1.63:2.75 0.54 5 95 100 100
03 1:1.63:2.75 0.54 10 90 100 100
04 1:1.63:2.75 0.54 15 85 100 100
05 1:1.63:2.75 0.54 20 80 100 100
2.1 Materials
2.1.1 Cement
Ordinary Portland Cement (OPC) was used in research work which is locally available in the market of Jamshoro.
154

5th International Conference on Energy, Environment and Sustainable Development 2018 (EESD 2018)
2.1.2 Aggregates
Bolahari Hill sand was used as fine aggregates that passed from #4 sieves and graded to be of zone 2 and the crushed
aggregates were used as coarse aggregates of 20 mm in size which is collected from Petaro Aggregates Crusher Plant.
2.1.3 Millet Husk Ash (MHA)
MHA was achieved by burning the millet husk under the atmosphere for 24 hours at a certain temperature by using the
uncontrolled burning method. The MHA was collected from the region of Tharparkar. And the ash after burning was
left to cool down which was then made to pass through sieve #30 to exclude the coarser particles. After sieving the ash,
it was used in this research.
Photograph 1: Millet Husk Ash
2.1.4 Water:
Clean and drinkable water used in this experimental work which is available in the structural and concrete laboratory of
civil engineering Department, MUET Jamshoro.
3. Result and Discussion: 3.1 Workability of Fresh Concrete:
Standard slump cone was used to determine the workability of fresh concrete in terms of slump loss. The high flow of
fresh concrete was noted at 0% of MHA and lower value of workability of fresh concrete was recorded at 20% of MHA
as a cement replacement material. The flow of fresh concrete blended with MHA is decreased with the increase in the
amounts of MHA. This reduction in workability may be due to the fineness of MHA particles increased the surface area.
Henceforth, MHA particles absorbed some amount of water which caused fall down the flow of concrete. Finally,
decrease due to a shortage of free existing water in the concrete which can impart workability. Experimental values are
given in the graph as shown in Fig. 1.
155

5th International Conference on Energy, Environment and Sustainable Development 2018 (EESD 2018)
Fig. 1. Slump Test
3.2 Compressive Strength of concrete:
The compressive strength of concrete is conducted on cube specimens by following the standard code of British standard
i.e BS EN 12390-3:2009. At each proportion of MHA, three cubes were cast and tested for compressive strength and
finally average of three is taken as a final result. Experimental test results are shown in Table 1 and Table 2 and Figure
2, Figure 3. The maximum compressive strength was recorded 20.90 N/mm2 and 28.80 N/mm2 at 5% of MHA and
minimum compressive strength was noted 17.10 N/mm2 and 23.88 N/mm2 at 20% of MHA as a cement replacement
material at 7 and 28 days respectively. The compressive strength was enhanced due to high amount of silica present in
MHA and its fineness when mixed with concrete increase the transition zone of concrete. This results in maximum
compressive strength up to 10% of MHA. Beyond the 10% of MHA used in concrete, strength starts decreased because
it will affect heat of hydration of cement.
Table 2. Compressive strength of concrete
S.No Curing days % of MHA Average Compressive Strength
(N/mm2)
01 7 days 0% 19.86
02 7 days 5% 20.90
03 7 days 10% 19.29
04 7 days 15% 18.10
05 7 days 20% 17.10
0
0.5
1
1.5
2
2.5
3
0% 5% 10% 15% 20%
Slu
mp
lo
sses
in
in
ch
Workability of Concrete
Percentages of MHA
156

5th International Conference on Energy, Environment and Sustainable Development 2018 (EESD 2018)
Fig. 2. Compressive strength of concrete @ 7 days
Table 02: Compressive Strength of Concrete
S.No Curing days % of MHA Average Compressive Strength
(N/mm2)
01 28 days 0% 26.84
02 28 days 5% 28.80
03 28 days 10% 26.42
04 28 days 15% 24.60
05 28 days 20% 23.88
Fig. 3. Compressive strength of concrete @ 28 days
0
5
10
15
20
25
0% 5% 10% 15% 20%
Co
mp
ress
ive
Str
engt
h (
N/m
m2)
Compressive Strength of Concrete
Percentage of MHA
0
5
10
15
20
25
30
35
0% 5% 10% 15% 20%
Co
mp
ress
ive
Str
en
gth
(N
/mm
2 )
Compressive Strength of Concrete
Percentage of MHA
157

5th International Conference on Energy, Environment and Sustainable Development 2018 (EESD 2018)
4. Conclusion:
Based on the experimental results obtained in the laboratory, it is concluded that:
The workability of fresh concrete blended with MHA is reduced with the increase in percentages of MHA
content.
The maximum compressive strength was recorded 20.90 N/mm2 and minimum compressive strength was noted
17.10 N/mm2 at 5% and 20% of MHA respectively at 7 days.
The maximum compressive strength was noted 7.3% at 5% of MHA as a cement replacement material
respectively at 28 days.
The minimum compressive strength was measured -11.03% at 20% of MHA by the weight of cement
respectively at 28 days.
References:
[1] O. A. U. Uche, M. Adamu, and M. A. Bahuddeen, “Influence of Millet Husk Ash ( MHA ) on The Properties of Plain Concrete,” Epistemics
Sci. Eng. Technol., vol. 2, no. 2, pp. 68–73, 2012. [2] I. B. Ologunagba, A. S. Daramola, and A. O. Aliu, “Feasibility of using Rice Husk Ash as Partial Replacement for Concrete,” vol. 30, no.
5, pp. 267–269, 2015.
[3] Uche, O.A.U., “Influence of recycled concrete aggregate (RCA) on compressive strength of plain concrete”, Continental J. Engineering Sciences 3, pp 30 – 37, 2008.
[4] Lomborg, B., “Measuring the real state of the world”, the skeptical environmentalist, pp 138, 2007.
[5] J. R. Ajayi, B. O. Rasheed, and O. F. Mojirade, “Exploratory assessment of strength characteristics of millet husk ash ( MHA ) blended cement laterized concrete,” Adv. Appl. Sci. Res., vol. 4, no. 1, pp. 452–457, 2013.
[6] N. Malay, M. Kumar, and J. Kujur, “Effect of Partial Replacement of Cement By Marble Dust on Compressive Strength,” no. June 2016,
pp. 633–643, 2015. [7] John Kamau and Ash Ahmed, “SUITABILITY OF MAIZE COB ASH AS A PARTIAL CEMENT REPLACEMENT”, Juniper online
journal Material Science, vol. 2 no. 5, pp: 01-03, 2017.
[8] Malhotra, V.M, “Introduction: Sustainable Development and Concrete Technology”. Concrete International, 24(7), pp 1-22, 2002. [9] BROOMFIELD J. P., “Corrosion of Steel in Concrete, Understanding, Investigation, and Repair”, Second ed., E & FN SPON; 2007, An
imprint of Chapman & Hall. [10] SCHIESSL P., “Corrosion of Steel in Concrete”, Report of Technical Committee, 60-CSC RILEM, 1988, Chapman and Hall, New York.
[11] Muga, H; Betz, K; Walker, J; Pranger, C, and A. Vidor. “Development of appropriate and sustainable construction materials”. Sustainable
Futures Institute, Michigan Technological University: Michigan, USA. Pp 1- 17, 2005. [12] HUSSAIN R.R., AND ISHIDA T., “Critical Carbonation Depth for Initiation of Steel Corrosion in Fully Carbonated Concrete and
Development of Electrochemical Carbonation Induced Corrosion Model”, International Journal of Electrochemical Science, V. 4, pp.
1178-1195, 2009. [13] DEMIREL BAHAR, “The effect of the using waste marble dust as fine sand on the mechanical properties of the concrete”, International
Journal of the Physical Sciences, V.5, Issue 9, pp. 1372-1380, 2010.
[14] BINICI HANIFI, KAPLAN HASAN, AND YILMAZ SALIH, “Influence of marble and limestone dust as additives on some mechanical properties of concrete”, Scientific Research and Essay, V. 29, pp. 372-379, 2007.
[15] ALSHAHWANY R.B.A., “Effect of Partial Replacement of Sand with Limestone Filler on Some Properties of Concrete”, Al- Rafidain
Engineering, V. 19, Issue 3, pp. 37-48, 2011. [16] HEBHOUB H., AOUN H., BELACHIA M. AND HOUARI H., “Use of Waste Marble Aggregate in Concrete”, Elsevier Journal of
Construction and Building Materials, V. 25, Issue 3, pp. 1167-1171, 2011.
[17] RAI BABOO, KHAN N.H., KUMAR A., AND TABIN R.S., “Influence of Marble Powder/granules in Concrete Mix”, IJCSE, V. 1, No. 4, pp. 827-834, 2011.
[18] ALI ERGUN (2011), “Effects of the usage of diatomite and waste marble powder as partial replacement of cement on the mechanical
properties of concrete”, Construction and Building Materials, V.25, issue 2, pp. 806-812, 2011. [19] CORINALDESI V., MORICONI G., NAIK T.R., “Characteristics of marble powder for its use in mortar and concrete”, NMET/ACI
International Symposium on sustainable development of cement and concrete, 2005, Toronto, Canada.
[20] Salau, M.A. & Balogun, L.A., Building & Environment, vol. 34, pp 165-173, 1999. [21] McDonough, C.M., Rooney, L.W. and Serna-Saldivar, S.O. (2000), “The Millets. Food Science and Technology”, Handbook of Cereal
Science and Technology. CRC Press. 99 2nd Edition: 177–210.
[22] FAO (2007). Food and Agriculture Organization; World Millet Production: Economic and Social Department, the Statistics Division, United Nation.
[23] Obilana, A. B. (2002). Manyasa, E., Millet. In Pseudo-Cereals and Less Common Cereals: Grain Properties and Utilization Potential (P.S.
Belton and T.R.N. Taylor eds): 177-217 New York.
[24] S. M. Auta, A. J. Shiwua, and T. Y. Tsado, “Compressive strength of concrete with millet husk ash (MHA) as a partial replacement for
cement,” Mag. Civ. Eng., vol. 59, no. 7, pp. 74–79, 2015.
[25] S. I. Anowai and J. E. Afunanya, “International Research Journal of Engineering and Technology ( IRJET ) MILLET HUSK ASH AS PARTIAL REPLACEMENT OF CEMENT IN SANDCRETE BLOCK International Research Journal of Engineering and Technology (
IRJET ),” Int. Res. J. Eng. Technol., vol. 4, no. 7, pp. 2–5, 2017.
158

5th International Conference on Energy, Environment and Sustainable Development 2016 (EESD 2016)
Comparing the Effects of Straw and Rice Husk on the Durability of
Mud Brick
Sasui Sasuia*, Warcharin Jinwuthb
a Department of Interior Design, Faculty of Arts & Design, Indus University, Karachi, Pakistan bDepartment of Architecture,Faculty of Architecture, Naresuan University, Phitsanulok, Thailand
Abstract
Mud is a sustainable construction material, which is used to produce bricks for the construction of adobe houses.
Unfortunately, this material is highly susceptible to water due to its poor durability which leads to the material
deterioration and capillary action. To improve the lacking properties of mud brick, two natural stabilizers named straw
and rice husk are commonly used to stabilize the soil. In this study, the influence of straw and rice husk as a stabilizer
was investigated on the stability of mud brick against water, water absorption, linear shrinkage and volumetric shrinkage
by adding these stabilizers in a soil at the ratio of 2% of the dry weight of soil. Results showed significantly improved
performance for the specimens containing stabilizers. Comparatively, straw showed more positive effects than the rice
husk on the stability as the specimen containing straw showed sever deterioration on day 5, water absorption rate 11.87%
and shrinkage of mud specimens with 4.21% & 17.37% for linear and volumetric shrinkage respectively. Whereas the
specimen containing rice husk showed severe deterioration on day 4 instability test, 13.61% absorption rate, the
shrinkage with 4.66 & 24.84 % in linear shrinkage test & volumetric shrinkage test respectively. Thus, this study
concludes that the straw is a more effective stabilizer than rice husk for the production of mud bricks to construct the
local adobe houses in areas affected by flood.
© 2018SasuiSasui, WatcharinJinwuth, Selection and/or peer-review under responsibility of Energy and Environmental Engineering Research Group (EEERG), Mehran University of Engineering and Technology, Jamshoro, Pakistan.
Keywords: Durability; Mudbrick; Natural stabilizers
1. Introduction
Building adobe houses with mud bricks the method of choice for many low-income communities in developing countries
due to the availability of soil which makes the construction affordable [1,2]. The adobe houses are in quantity in many
developing countries, Pakistan, Peru and India are the example of the countries where adobe house are built
commonly[3, 4].In the report of annual disaster statistical review 2011, several developing countries are listed where
flooding occurs frequently [5]. The adobe houses are at high-risk when flood occurs because its durability against water
is poor. The material starts to disintegrate on the long-term exposure to flood water. Besides that, the capillary action
and swelling can occur when the wall surface soak in the flood water, whereas on the drying of wall, the material shrinks
[6-9].
In order to improve the durability of mud brick against water, the soil which is used to produce the brick is stabilized
either with natural stabilizer or with chemical or binders [8, 11]. Stabilizing the soil with natural stabilizers for
construction is a common practice in many developing countries and an economic method of improving the properties
[12]. Straw and rice husk are the natural stabilizers which are used widely as a stabilizer for earthen construction as they
are available in abundance [8, 13, 14]. The effects of straws on the adobe brick’s properties were 1st recognized by
Romans [15]. While the rice husk is used as a stabilizer in either raw and ash form for several masonry materials
* Corresponding author. Tel.: +92 342-3745880.
E-mail address: [email protected]
159

5th International Conference on Energy, Environment and Sustainable Development 2016 (EESD 2016)
including mud, because rice husk provides the cementation properties as it retains the siliceous substance which form
pozzolans [14,16-18].
The effects of straw and rice husk on the properties of mud brick have been investigated in past researches particularly
on the strength properties, thermal conductivity and shrinkage of mud brick. Several researches concluded the negative
effects of straw on the strength of mud brick [11, 15]. However, the positive effect of straw is also determined in the
past studies in increasing the strength and reducing the shrinkage of mud brick [9,11, 19]. Whereas the effects of rice
husk on the properties of mud brick is also investigated in the past researches, and the results showed the positive effects
of rice husk in improving the strength properties and durability of mud brick [13, 14, 20].
In the former studies, the stabilizers were investigated in different parameters such as temperature, soil texture and
testing methods. Considering this factor, the effectiveness of stabilizers cannot be compared referring the results of past
investigations. Therefore, in this study the experiments were conducted to investigate the effects of straws and rice husk
to compare the effects of these stabilizers on the durability of mud brick.
2. Materials & Methods
2.1. Materials collection
The soil used to prepare specimens for the experiments was excavated from the place located in Phitsanulok province
Thailand. The soil consist of 48% sand and 52% fines (clay + silt) which is suitable to producemud brick [21]. The
straw was collected from rice paddy and chopped to the length of 4cm as recommended by Bourdreau [22] and the
rice husk was collected from the nearby rice mill. The prepared straw stabilizer and rice husk stabilizer is shown in
Fig 1: (a) and (b) respectively.
In the former studies the specimens with the addition of straws up to 3.5% and rice husk up to 2% of the weight of
soil showed the positive effects in increasing the properties of adobe brick [20, 9 & 19]. Thus, for the comparison
purpose, the study added each stabilizer with the same proportion, therefore, 2% of dry weight of soil in the dry soil;
the percentage of dry mixture is presented in Table 1. The water was added gradually in the dry mixture until the
optimum plasticity for mixtures was observed and was kneaded manually for the proper consistency of the mixture.
(a) (b) Fig. 1. Stabilizers used in the study; straw (a) and rice husk (b)
Table 1. The proportion of dry mixture
Group Mixture Dry soil (wt. %) Stabilizers (wt. %)
G-1 Soil 100 0
G-2 soil + straw 98 2
G-3 soil + rice husk 98 2
2.2. Preparation of specimens
The method of casting specimens for each experiment was manual. Each prepared mixture group therefore un-
stabilized specimens (G-1), straw stabilized specimen (G-2) & rice husk stabilized specimen (G-3) were used to cast
160

5th International Conference on Energy, Environment and Sustainable Development 2016 (EESD 2016)
the specimens for investigation. To cast 30 prism specimens, the wooden mold of dimension 200 x 150 x 100 mm³
was used. Out of 30 prism specimens, 15 were cast for stability test (5 from each mixture group) as shown in Fig 2:
(a) and 15 specimens (5 from each mixture group) were cast for water absorption test as shown in Fig 2: (b). These
30 prism specimens after drying were measured to calculate volumetric shrinkage. The specimens were dried and
cured for 28 days under the semi-covered sheds at 29 (+ 5) °C average temperature and 69 (+5) % average relative
humidity. The dimension of specimens from each group at the age of 28 days was measured as presented in Table 2.
Whereas for linear shrinkage test, the wooden mold of 600 x 40 x 40 mm³ was prepared to measure the linear shrinkage
of materials of group G-1, G-2 and G-3.
Table 2. Mean average dimension of cured prism specimens
Mixture group Dimension: L x W x H (mm³) Volume (mm³) CV (%)
G-1 190.4 x 145.65 x 72.25 2003619.6 1.22
G-2 198.6 x 148.8 x 76.3 2254793.2 1.10
G-3 188.1 x 142.55 x 74.28 1990913.9 1.80
(a)
(b)
Fig. 2. Adobe specimen at the age of 28
2.3. Test method of stability test by submersion
Since the mud brick disintegrate on the soaking in the standing water of flood, this test will determine the time at
which the un-stabilized and stabilized mud brick samples will disintegrate. Several researches used this method to
determine the stability of brick specimen [23-25]. To conduct this test, the plastic buckets of five US gallons was
filled with the water up to the height of 180 mm to submerge the specimen completely in water as illustrated in Fig 3:
(a). Each submerged specimen was assessed by three people with visual and touch sense as shown in Fig 3: (b). The
specimens were assessed repeatedly until the severe deterioration was observed. To check the specimens’ suitability
for construction, the first assessment was made after 45 minutes of submersion[23]. Each specimen after assessing
was rated accordingly.
(ND) No deterioration: When no visual and by touch damage was observed.
(LD) Light deterioration: When only a slight dent was observed on the specimen.
(MD) Moderate: When the slight dent on the specimen and the slight change in the color of water was observed.
(SD) Severe deterioration: When the major dent was observed on the specimen and the water becomes muddy
and brown in colour due to decomposition of submerged specimens.
2.4. Water absorption test method
The water absorption test was conducted to determine the capability of specimen in resisting the absorption of water
by reducing the volume of voids in the specimen. The durability of specimen was determined on the percentage of
water absorbed by the specimen, where the water absorption rate for a durable specimen is 15% or less than 15%
[26].This test was conducted by following the method recommended in Australian earth building handbook [21].
According to the prescribed method, the cured prisms from each group were immersed in the water for 24 hours. Each
specimen was immersed in a separate plastic bucket of five US gallons weighed 0.7 kg and filled with the water up to
161

5th International Conference on Energy, Environment and Sustainable Development 2016 (EESD 2016)
the level of 100 mm as shown in Fig 3: (c). All buckets were placed under the semi-covered sheds where the average
temperature was 29 (+ 5) °C and average relative humidity was 69 (+5) %. After 24 hours of submersion, each bucket
was drilled from the bottom to drain off the water with extra care to prevent the loss of decomposed material. As soon
as the water drained completely, the immersed weight of specimen was obtained by deducing weight of bucket. All
the buckets were placed at the same place under the same temperature and humidity for drying the specimens to get
the optimum dry weight of specimens. The percentage of water absorbed by each specimen ‘W’ was calculated by
computing the values in “Eq. (1)”.
𝑊% = (𝑊𝑎 − 𝑊𝑏) ÷ 𝑊𝑏 × 100 (1)
2.5. Linear & Volumetric shrinkage test method
The linear shrinkage test is also called Alock’s test, the shrinkage of all the samples was determined following the
procedure recommended in Australian earth building handbook [21]. As per testing procedure, each prepared mixture
therefore G-1, G-2 & G-3 was filled and compacted properly in five wooden molds shown in Fig3 (d). Each mold is
of the dimension of 600 mm length, 40 mm width and 40 mm height. The filled mold with length (L1) dried under
the sun for six days in recorded temperature 30 (+ 5) °C and humidity 50 (+ 5) %. After drying, the shrunk length of
samples (L2) was measured to calculate the shrinkage percentage with the expressed “Eq (2)”.
The percentage of volumetric shrinkage was obtained by calculating the reduction in the size of 10 specimens of each
group therefore G-1, G-2 and G-3 at the age of 28 days.
𝑆ℎ𝑟𝑖𝑛𝑘𝑎𝑔𝑒 % = (𝐿1 − 𝐿2) ÷ 𝐿1 × 100 (2)
(a) (b) (c)
(d)
Fig. 3. Experimental setup
3. Results & Analyses
3.1. Stability by submersion test results
The mode average results of five specimens of each group presented in Table 3 indicating the suitability of specimens
of all groups therefor G-1, G-2 and G-3 for the construction as it showed no deterioration (ND)after 45 minutes of
submersion. The specimens of G-1 after one hour showed light deterioration (LD) and within 24 hours of submersion
162

5th International Conference on Energy, Environment and Sustainable Development 2016 (EESD 2016)
it deteriorated severely (SD). The specimens of group G-2 were not observed under deterioration on the following
day of submersion. However, on day 2 and day 3the specimens were observed in light deterioration (LD). These
specimens deteriorated moderately (MD) on day 4 and severely on day 5. The specimens G-3 remained (ND)in the
1st hour of submersion, it deteriorated lightly (LD) on day 1 and moderately (MD) on day 2 and day 3, while on day
4, the severe deterioration (SD) was observed.
From the results, it can be seen that with the stabilizers, the life of specimens extended and thus the stability of
specimens increased on its submersion in water. Comparatively, straw showed more positive effects on the stability
of water than rice husk.
Table 3. Mode average stability test results
Assessment time G-1 G-2 G-3
45 minutes ND ND ND
1 hour LD ND ND
1 day SD ND LD
2 days - LD MD
3 days - LD MD
4 days - MD SD
5 days SD -
The form of specimens was examined at the stage of severe deterioration after draining the water from buckets. From
Fig 4: it is clear that the un-stabilized specimens (G-1) lose its form as the specimens completely decomposed. While
the straws stabilized specimens (G-2) and rice husk stabilized specimens (G-3) showing maintained form. This is due
the straw and husk fiber glued the soil particles together and prevented the specimen from complete decomposition.
(G-1) (G-2) (G-3)
Fig. 4. Specimens’ form at the stage of severe deterioration
3.2. Water absorption test results
The water absorption “W” percentage presented in table 4 showing the durability for G-2 and G-3 specimens as it
absorbed water less than 15%. While the specimens of group G-1are not considered as a durable brick as it absorbed
water more than 15%. From the results, it is clear that the specimens containing straw and rice husk reduced the
volume of voids in specimens which results in the less absorption of water. The reduction in the volume of void is
proportional to the increase inhomogeneity of material. The absorption of less water in the specimens incorporated
with straw and rice husk indicating the good cementing property of straw and rice husk stabilizer; due to this the
homogeneity of material increased which made the specimen less porous. Comparatively, strap stabilizer (G-2)
showed the maximum effectiveness than rice husk stabilizer (G-3) in reducing the water absorption.
The investigated specimens’ condition was viewed after 24 hours of submersion. From Fig 5: it can be seen that the
material of G-1 specimens disintegrated as it loses its binding property on 24 hours of immersion in the water. The
G-2 and G-3 on the other hand remained in a molded form on 24 hours of immersion in water. From this observation
it is attributed that the specimens remained integrated due to the stronger bond between stabilizer and soil.
163

5th International Conference on Energy, Environment and Sustainable Development 2016 (EESD 2016)
Table 4. Mean average results of water absorption
Prism W (%) CV (%)
G-1 20.63 2.83
G-2 11.87 1.01
G-3 13.61 2.57
(G-1) (G-2) (G-3)
Fig. 5. The specimens’ form after 24 hours of soaking
Since the specimens containing straws and rice husk remained in an integrated form after 24 hours of submersion, the
volume of specimens was measured to observe the swelling of material. The specimens containing straws increased
in the volume by 10.01% and the specimen containing rice husk increased by 10.58% in the volume. Comparing the
swelling of specimens with the shrinkage of specimens which is presented in Table 8, the specimen swelled less than
it supposed to swell. Thus, it indicates that the straw and rice husk on soaking prevented the material from excessive
swelling.
3.3. Linear & volumetric shrinkage test results
The linear shrinkage test results for sample G-1, G-2 and G-3 are presented in Table 5, results showing the reduction
in shrinkage percentage for the samples containing straw (G-2) and rice husk (G-3). The maximum reduction in
shrinkage is observed on the sample containing straw (G-2). Each sample after drying was observed on its appearance,
as illustrated in the Fig 6: it can be seen that the cracks appeared on the un-stabilized sample therefore (G-1) while
the stabilized sample therefore (G-2) and (G-3) did not exhibit cracks after drying.
Table 5. Mean Linear shrinkage results
Prism Linear shrinkage (%) CV (%)
G-1 6.48 2.30
G-2 4.21 1.93
G-3 4.66 2.49
(G-1) (G-2) (G-3)
Fig. 6. The samples of linear shrinkage test after drying
The volumetric shrinkage of 10 prism specimens from each group therefore, G-1, G-2 & G-3 was calculated in
percentage on the shrunk volume of specimens which is given in Table 2. The percentage of volumetric shrinkage of
each group presented in Table 6. showing the un-stabilized specimen (G-1) obtained the shrinkage percentile which
is comparatively higher than the percentage obtained by specimens containing straw (G-1) and rice husk (G-2).
Among all the specimens, straw stabilized specimens (G-2) obtained less shrinkage percentage. Additionally, no
cracks was observed on all the group of specimens as they were cured in sheds and were covered at its early age with
thin polythene sheets to prevent the specimens from rapid dry as rapid dry may lead to the shrinkage cracks [27].
164

5th International Conference on Energy, Environment and Sustainable Development 2016 (EESD 2016)
Table 6. Mean volumetric shrinkage result Table
Prism Volumetric shrinkage (%) CV (%)
G-1 33.21 1.18
G-2 17.37 1.13
G-3 24.84 1.09
The reduction in the shrinkage of stabilized samples indicating that, with the addition of straw and rice husk the
plasticity of material decreased which prevent the material from excessive contraction on drying. Comparatively straw
showed more positive effects in reducing the shrinkage of material.
4. Discussion
The Study revealed the stabilizers i.e. straw and rice husk improved the durability of mud brick specimen. This
improvement is due to the increased bond between the stabilizer and soil particles. Comparing the stabilizers’
performance, it is determined that on the exposure of water, straws maintained its cohesive property more than the rice
husk ash as the maximum improvement was observed in the stability test, water absorption and shrinkage test. In the
past research, the bagasse fiber compared to the rice husk showed the maximum improvement in the properties of adobe
and the reason assumed for the efficient performance of bagasse was its long fiber [13]. The long fibers could also be
reason behind the maximum positive effects of straw. Straw with the long fibers provided the stronger bond in the soil
matrix and results in the efficient performance of specimens on its exposure to water. Based on the results, the straw is
recommended over rice husk as a stabilizer for the construction of adobe houses.
Additionally, the results obtained in this study showing the coefficient of variation (CV) as high as 2.83 %, which is
thus acceptable as the specimens were molded manually [2].
5. Conclusion of study
The impact of 2% straw and 2% rice husk on the mud brick durability was investigated by conducting the field tests.
From the results, the conclusions drawn are as follows:
1. The results of the proposed tests showed the positive performance of the specimens stabilized with straws and
rice husk. However, with the addition of straw, the maximum durability of specimens was observed as it
improved the maximum stability of specimens in the static water, reduced the water absorption and shrinkage
more than the rice husk.
2. The straw and rice husk on the soaking for 24 hours prevented the specimens from excessive swelling. Whereas,
the un-stabilized specimens on soaking disintegrated within 24 hours.
3. Based on the results, the straws are determined as an effective stabilizer and thus the study provides the
guideline that the mud brick if stabilized with straw can improve the performance of adobe structure during
flood event. The improved stability of straw stabilized specimens in static water assures that the straw can
increase the life of mud brick wall by delaying the deterioration of brick in the stagnant flood water. Whereas
the reduction in water absorption for straw stabilized specimen assuring the reduction in capillary action, which
can prevent the wall from cracking and also can prevent the plaster from peeling off. While the reduction in
swelling and shrinkage is ensuring the straw can prevent the wall from excessive change in dimensions on its
soaking in flood water and drying.
Therefore, the stabilizer straw is determined as an appropriate stabilizer for the construction low-cost adobe houses in
the areas affected by flood. Further study should be conducted to compare the effects of straw with other natural
stabilizers. This will provide the guide to building the durable adobe houses with the appropriate natural stabilizer.
Acknowledgment
This paper is a part of M.Arch thesis, we thank the faculty of architecture Naresuan University for providing the
facilities, materials and equipment to conduct this research.
165

5th International Conference on Energy, Environment and Sustainable Development 2016 (EESD 2016)
References
[1] MS. Islam, K.Iwashita, ‘Earthquake resistance of adobe reinforced by low-cost traditional materials’,Journal of Natural Disaster Science, 32
(1)(2010)1-21.
[2] W.Jinwuth, ‘A study into the earthquake resistance of circular adobe buildings’,Ph.D. thesis,University Technology of Sydney, (2012).
[3] M.Blondet, G.V.Garcia, S.Brzev, A. Rubiños,‘Earthquake-resistant construction of adobe buildings: A tutorial’,EERI/IAEE world housing
encyclopedia, (2003).
[4] PCO, ‘Population and Housing Census 1998’,Government of Pakistan: Statistics Division, (2001).
[5] D.Guha-Sapir, ‘Annual Disaster Statistical Review 2011’,The Numbers and Trends, Brussels: CERD, (2012).
[6] O.Ruskulis, ‘Mud as a mortar’, United Kingdom, (2009).
[7] H.Varum, N.Tarque, D.Silveira et.al,‘Structural Behaviour and Retrofitting of Adobe Masonry Buildings’,Structural Rehabilitation of Old
Buildings, Verlag Berlin Heidelberg, 2014,doi: 0.1007/978-3-642-39686-1_2.
[8] B.Sidibe, ‘Understanding Adobe’, Volunteers in Technical Assistance, (1985).
[9] M.Bouhicha, F. Aouissi, S. Kenai, ‘Performance. of composite soil reinforced with barley straw’,Cement and Concrete Composites, 27,(2005),
617-21.
[10] H.Varum, N.Tarque, D.Silveira et.al,‘Structural Behaviour and Retrofitting of Adobe Masonry Buildings’,Structural Rehabilitation of Old
Buildings, Verlag Berlin Heidelberg, 2014, doi: 0.1007/978-3-642-39686-1_2.
[11] Ş.Yetgin, Ö. Çavdar, A. Cavdar,‘The effects of the fiber contents on the mechanic properties of the adobes’, Construction and Building
Materials, 22, (2008), 222-7.
[12] H.Houben, H.Guillaud, ‘Earth construction A comprehensive Guide’, First Edition International Technology Development Group, (1994).
[13] P. Lertwattanaruk and J. Choksiriwanna, ‘The physical and thermal properties of adobe brick containing bagasse for earth construction’, Built,
1,(2011), 54-61.
[14] P. Lertwattanaruk, J. Tungsirisakul,‘Effect of natural materials on properties of adobe brick for earth construction’,Journal of
Architectural/Planning Research and Studies, 5, 187-199, (2007).
[15] E.Quagliarini., S. Lenci, ‘The influence of natural stabilizers and natural fibers on the mechanical properties of ancient Roman adobe
bricks’,Journal of Cultural Heritage, 11,(2010), 309-314.
[16] R.Jauberthie, F.Rendell, S. Tambaet.al,‘Origin of the pozzolanic effect of rice husks’, Construction and Building Materials’, Construction and
Building Materials, 14,(2000), 419-423.
[17] P.Speare, K.Eleftheriou, S.Siludom et.al,‘Durability of concrete containing rice husk ash as an additive’, International Seminar on Exploiting
Wastes in Concrete, (1999)
[18] H.Isah, ‘The effect of rice husk on the chemical properties of clay soil’,Proceeding of 2nd International Conference on Chemical, Biological,
and Environmental Sciences, (2015).
[19] G.Chaudhary, V. Kumar, M. Kumar,‘An experimental study on the capacity assessment of mud brick with impregnated straw’,Indian Institute
of Technology Gandhinagar, (2016).
[20] J.Akinyele, O. Olateju, O. Oikelome,‘Rice husk as filler in the production of bricks using gboko clay’, Nigerian Journal of Technology, 34,
(2015), 672-678.
[21] W. Peter‘The Australian earth building handbook’, Standard Australia International, (2002).
[22] E.H. Boudreau, ‘Making the adobe brick’, Berkeley CA. (1971).
[23] J. Micek ‘Adobe brick design’,Senior project [Internet], (2006).
[24] G.Y.Y. Chen, ‘Analysis of stabilized adobe in rural east Africa’,California Polytechnic State University, (2009).
[25] C.Bock-Hueng, AN.Ofori-Boadu, E. Yamb-Bell et.al,‘Mechanical properties of sustainable adobe bricks stabilized with recycled sugarcane
fiber waste’, International Journal of Engineering Research and application, 6, (2016) 50-59.
[26] H. Molla ‘Study of stabilized mud brick as an alternative building material & development of models’,Thesis, Addis Ababa University,(2012).
[27] L. Taghiloha ‘Using rammed earth mixed with recycled aggregate as a construction material’,Masters thesis, UniversitatPolitècnica de
Catalunya, (2013).
166

5th International Conference on Energy, Environment and Sustainable Development 2018 (EESD 2018)
Antibiotic Assisted Formation of Silver Nanoparticles & it’s Application in Sensors
Mehwish S. Abbasia*, Sirajuddinb, Amber R. Solangia,b a*National Centre of Excellence in Analytical Chemistry,
University of Sindh, Jamshoro
Abstract
Since many years Silver Nanoparticles (AgNPs) have been widely used and introduced as antibacterial material and for
the purification of every kind of environmental liquid/water bodies. These nanoparticles have gained wide attention
because these particles have tremendous applications such as cleaning agents, disinfectants, water treatment, textiles
and applied for drug delivery as medicinally, these AgNPs are also used to reduce burn treatment infections and to
prevent bacterial infections and colonization in human being’s skin and body. In this research Antibiotic (Ofloxacin)
assisted silver nanoparticles have been synthesized by chemical reeducation method, which is a well-known, economical,
low time taking and environmentally friendly method. In this method our drug (Ofloxacin) was used as reducing agent
as well as capping agent. UV-Visible Spectroscopy showed the first indication of formation of Ofloxacin assisted AgNPs,
UV-Visible Spectroscopy excited the typical surface plasmon absorption maxima under certain optimization conditions
at 390 nm. Scanning Electron Microscopy (SEM) and X-Ray Diffraction (XRD) showed the morphology characteristics
of synthesized nanoparticles, it was clearly observed about particles with sponge-like structures, crystalline in nature
and synthesized AgNPs were found to be in the size range of 2 to 27 nm. Ofloxacin assisted AgNPs exhibited highly
sensitive and selective calorimetric sensing of copper metal in linear range of 3.3 µM to 300 µM based on decrease in
intensity with R2 value of 0.976 by UV-Vis spectrophotometry and Limit of detection and Limit of quantification was
found to be 0.44 µM & 1.47 µM. The color variation of AgNPs was changed from yellow to white after addition of
different concentration of copper metal ions. The sensor was highly selective to detect Cu metal in the presence of
various possibly interference ions. The sensor was successfully applied to detect Cu2+ in several types of real water
samples. This finding could be suitable for low-level selective determination of Cu2+ in other types of samples such as
body fluids, vegetable and fruits and so on.
© 2018 “MehwishS.Abbasi Dr. Sirajuddinb,Amber R. Solangia” Selection and/or peer-review under responsibility of Energy and Environmental
Engineering Research Group (EEERG), Mehran University of Engineering and Technology, Jamshoro, Pakistan.
Keywords: “Silver Nanoparticles; Copper; Ofloxacin; Antibiotic; Sensor”
1. Introduction
Nanotechnology is defined as the science of matter manipulation with at least single dimension size from 1 nm to 100 nm [1],
nanotechnology in terms of range and size is a broad field including diverse and many fields of science like, organic chemistry,
microbiology, molecular engineering, physics, energy storage, microfabrication and others [2]. Nanotechnology has variety of
applications in all fields of science and technology from synthesis of Nanosized materials and particles with nanoscale dimensions
and having the control on the atomic scale of matter [3, 4]. The science of Nanotechnology itself is an interesting branch of science
which discus with nanosized materials having at least one dimension in nanoscale range. [5] One of the important aspects of
nanotechnology is the development of more reliable, nontoxic and cheap process for the synthesis of nanoparticles with good chemical
composition. [6]
Nanoparticles are defined as the particles having two or more dimensions in the range between 1 nm to 100 nm. [7] The new field of
* Corresponding author. Tel.: +0-000-000-0000 ; fax: +0-000-000-0000 .
E-mail address: [email protected]
167

5th International Conference on Energy, Environment and Sustainable Development 2018 (EESD 2018)
nanoscience and nanotechnology has revolutionized the globe via its numerous wonderful miraculous properties with unbelievable
applications [8, 9] . One of several properties of nanomaterials is their catalytic aspect owing to decreased size and bigger surface
area [10] . The catalytic properties of nanoparticles are crucial for developing diagnostic tools or sensors to get and check and balance
protocol for getting several useful data for various purposes [11].
Due to unique and diverse chemical, electrical and physical properties, nanomaterials while particularly nanoparticles have attracted
wide attention in the research filed, such unique properties are not apparent in other bulk materials that could be attributed at the large
and small-sized specific surface area [12]. In nanotechnology the results of nanoscience are realized as a science of providing the
Nano range materials with functional facilities. Now, Nanochemistry has become the major growing field of nanoscience. [13] Recent
advances, researches and techniques in the field of nanotechnology have developed and robust the highly selective and sensitive
methods for detection, that help to focus on the conventional technology’s loopholes [14].
Silver nanoparticles is powerful tool in imaging and sensing characterization and application because of amazing optical properties
[14]. Silver have the valuable advantages than gold and other metal nanoparticles because silver nanoparticles are higher coefficient,
sharper bands, high enhancement of the field and higher ratio of scattering to extinction [9, 14]. Silver is known as nontoxic and safe
antibacterial agent, it has been used for many hundred years and it has properties of killing 650 types of diseases causing
microorganisms [11]. Its also observed that silver nanoparticles (AgNPs) have been used as antibacterial material [15]. The
physiochemical applications and properties of silver nanoparticles are necessary for their biodistribution, behavioral changes,
efficiency and safety [16, 17]. Several methods are present to study and synthesize AgNPs such as; hydrothermal, sonochemical [18],
electron beam irradiation, extraction of leave [4], seed extract methods and so on [18]. As compare to all these methods which are
being used since last decade its observed that most economical, environmental friendly and less time taking method is chemical
reduction method in which silver nanoparticles are synthesized by using a drug as capping as well as reducing agent [12, 15].
Silver nanoparticles have been widely used in various sensors and products as their functional components due to extraordinary
optical properties of silver nanoparticles. Because of such properties AgNPs efficiently absorb and scatter the light, the shape and
size of particles depends on the color of synthesized particles, which is a different property than other dyes and pigments [4]. Due to
conduction of electrons the nanoparticles go through strong interaction with light, due to such conduction of electrons on metal surface
area the particles at a specific wavelength undergo collective oscillation due to excitation and such specific wavelength defines many
properties of nanoparticles. [19]
We can also define the optical property of silver nanoparticles in simple way that when the silver nanoparticles are exposed to a
specific wavelength of light the magnetic field of light which is oscillating induces a collective coherent oscillation of the free
electrons, which creates a change separation forming the dipole oscillation along the direction of electric field in respect to the ionic
lattice, the oscillation’s amplitude reaches maximum at a certain frequency this phenomenon is known as surface plasmon resonance
(SPR) [20, 21]. The scattering and absorption properties of silver nanoparticles could be changed by controlling the shape, particle’s
size, refractive index which is adjacent to surface area of particle. It can be also understood from the example that particles having
small size possess refractive index near 400 nm while the particles with large size scatter a lot, have broader peaks and shift towards
longer wavelengths. Beside the optical properties AgNPs can also change their characteristics when particles do aggregation [21].
Ofloxacin is vital antibiotic belongs to a class of drug known as quinolone antibiotic, it is used to treat various infections as (for the
respiratory tract, kidney, soft tissues, skin, it is also used for the treatment of acute pelvic inflammatory disease (PID) caused by
susceptible C. trachomatis or N. gonorrhoeae. [22]. It also stops the growth of bacteria and stops several bacterial infections, in adults
it is used for the treatment of urinary tract infections occurred by gram-negative bacteria. [23]
In this study we have prepared Ofloxacin assisted silver nanoparticles by chemical reduction method. According to our knowledge
this is for the very first time Ofloxacin has been used for the formation of AgNPs and used as optical sensors, this ofloxacin derived
synthesis of AgNPs is also controlled synthesis with monodispersed morphology, its also found that previously no research is done
and no method is available for synthesis of AgNPs with Ofloxacin.
2. Experimental
2.1 Method and Materials used
All chemicals for this study were highly purified and of Analytical grade, all chemicals were used without going through extra
purification. Ofloxacin was purchased from a pharmaceutical company named as (SAMI Pharmaceuticals (Pvt.) Ltd. Karachi),
Sodium Hydroxide (NaOH) and Silver nitrate (AgNO3) from Sigma-Aldrich Chemicals. Metals, Iron (Fe), Potassium (K), Copper
(Cu2+), Chromium (Cr), Leas (Pb), also from Sigma-Aldrich Chemicals. Di ionized water was used for every study of this research.
168

5th International Conference on Energy, Environment and Sustainable Development 2018 (EESD 2018)
2.2 Instrumentation
The characteristics of the composite composition of the synthetic material have been studied using powdered X-ray diffraction (XRD;
Eindhoven, Netherlands with CuKα radiation (λ) = 1.5406 Å) in the range of 5-50°. The morphology and microstructure of the product
have been observed using electron microscopy (SEM; JSM-6701F, JEO, Tokyo, Japan) and atomic microscopy by (SEM; Jeol,
Tokyo, Japan). The UV-Visible measurement was done with its instrument named as (UV-Vis 2600 Shimadzu) in the wavelength
range of 200nm to 800nm. ATR-FT-IR spectrometer. FT-IR spectra between the range 4,000–400 cm-1 were recorded to investigate
the nature of synthesized AgNPs chemical bonds.
2.3 Synthesis of Ofloxacin derived AgNPs
Ofloxacin derived AgNPs synthesis procedure was done by taking 500 µLs of 0.01M standard solution of silver nitrate (AgNO3) in
a test tube of 15 ml and then 5 ml of deionized water was added, after the smooth shaking of silver nitrate and water 400 µLs from
Ofloxacin standard solution of 0.01 M was added in same test tube and at last 10 µLs of 0.1 M solution of Sodium hydroxide (NaOH)
was added to enhance the reaction which created the final volume of 6ml in test tube. The first indication of AgNPs was observed
when the color of solution was turned yellow.
Scheme 1: Illustrate the synthetic procedure of synthesis of Ofloxacin derived AgNPs characterization and applications.
2.4 Sample preparation for XRD, FTIR and SEM analysis
For XRD, SEM and FTIR the solution of yellow color of AgNPs was prepared and taken in 500 ml beaker to heat it on hot plate, the
temperature of plate was maintained 60 °C till the solution was evaporated and became of 10 ml then the 10 ml solution was poured
into petri-dish and again heated on hot plate with temperature 60 °C and within 1 h the black color dry product was obtained which
was washed for two times to remove any unreacted species or impurities, washing was done with deionized water and ethanol, later
the impurities and unreacted antibiotic standard which can disturb characterization were removed. Then the product was carefully
heated in oven at temperature of 60 °C for two hrs. Later, the black silver nanoparticles were scratched from petri dish. The resulted
sample of ofloxacin derived silver nanoparticles were collected in a pin drop for each analysis.
Scheme 2: Illustrates the procedure of synthesis of Ofloxacin derived AgNPs for characterization
169

5th International Conference on Energy, Environment and Sustainable Development 2018 (EESD 2018)
2.5 Procedure for detection of Copper (Cu2+) metal by Ofloxacin derived AgNPs
Synthesized Ofloxacin assisted AgNPs were used to detect the metals, in this case we used different metals such as copper, iron,
nickel, sodium, potassium, mercury, tin, lead and chromium. It was observed that AgNPs changed their color and wavelength by
spiking copper metal while particles remained same by spiking other metals. In this process we added 50 µLs of Cu 0.01 M in 3 mL
of synthesized AgNPs the color changed from yellow to white and wavelength was also changed with change in absorbance which is
further discussed in results.
3. Characterization
For evaluation of functional aspects of synthesized AgNPs characterization is the most important tool. Characterization of
nanoparticles is significant to understand the nature of synthesized nanoparticles, and is done by different analytical techniques, such
as, UV-Visible Spectroscopy, X-Ray diffractometry (XRD), Fourier Transform Infrared Spectroscopy (FTIR), Scanning Electron
Microscopy (SEM. For example UV-Visible Spectroscopy is used to confirm the synthesis of nanoparticles by showing the surface
plasmon resonance at specific wavelength. SEM analysis shows the morphology, shape and size of synthesized nanoparticles. The
determination of crystallinity is performed by X-Ray diffraction.
3.1 UV-Vis Characterization
UV-Visible Spectroscopy was performed to do the optimization and time study of silver nitrate, Ofloxacin and sodium hydroxide to
synthesize AgNPs. The UV-Visible Spectroscopy was done after preparing the solution of synthesize AgNPs in yellow colour, the
instrument showed UV-Visible spectra at 390 nm as shown in Fig 1.
Fig. 1. Ofloxacin derived AgNPs from 1 min to 6 hrs showing no turbidity and no change in colour, the time study of Ofloxacin-AgNPs was
observed for six hours, the wavelength was shifted towards blue shift from 390 to 410 nm. After one week the colour of solution was still the
same yellow which proved the stability of synthesized Ag nanoparticles.
3.2 XRD Analysis
The crystallographic nature of Ofloxacin-AgNPs was characterized by using X-Ray Diffraction (XRD) technique, the chemical
specie’s quantitative resolution and qualitative identification was also determined by XRD technique, this showed that synthesized
AgNPs have Face centered cubic structure (FCC) showing the 4 intense Bragg reflections which can be seen in Fig: 2.
Fig. 2. The recorded XRD powder pattern peaks illustrate intense patterns for the synthesized AgNPs
170

5th International Conference on Energy, Environment and Sustainable Development 2018 (EESD 2018)
The diffracted intensities were recorded from 20° to 80°. Four strong Bragg reflections at 33.45°, 39.35°, 64.75° and 78.05°, this Fig
shows synthesized NPs have two more intense planes and these planes are more prominent which reveals the crystalline nature of
OFX-AgNPs. The crystalline nature of OFX-AgNPs is face cubic centered structure (FCC). Furthermore, the size of these XRD
planes was justified by applying Scherer formula.
In which lambda (λ) reveals wavelength of XRD, the crystalline nanometer size represents by (Dp), K represents the shape factor
having value 0.94 and (β 1/2) represents line broadening at half maximum intensity. OFX-AgNPs average crystallite size was
calculated by above formula was 25 nm and range from 2 nm to 27 nm. XRD study estimated that these OFX-A corresponds to the
planes of (43.22), (27.43), (14.64) and (11.82) respectively which can be indexed face centered cubic (FCC) structure of Ofloxacin
assisted silver nanoparticles.
3.3 SEM Analysis
The structural and morphological properties have been confirmed by using Scanning Electron Microscopy (SEM). The scanning SEM
images were examined under low and high magnification. The captured SEM images of Ofloxacin derived silver nanoparticles show
sponge-like structural features.
Fig. 3. SEM Image of Ofloxacin assisted AgNPs at high resolution of 2 µM shows sponge-like structure and confirms the formation of
nanoparticles which a good image
Fig. 4. SEM Images of Ofloxacin assisted AgNPs at low and high resolutions shows sponge-like structure, the resolution is taken from the
lowest 1 µM to the highest 20 µM.
171

5th International Conference on Energy, Environment and Sustainable Development 2018 (EESD 2018)
3.4 FTIR Analysis
Fourier transform infrared (FT-IR) spectroscopy is an analytical technique used for the characterization and identification of an
organic compound by the transmittance of infrared radiation versus the wave number of the sample. It was used for characterizing
functional groups of reducing as well as capping agent that is involved in the synthesis of nanoparticles. Which have discussed in
Table: 1
Spectrum: 1 FTIR spectrum of Ofloxacin drug and Ofloxacin derived AgNPs (OFX-AgNPs) showing the capping of Ofloxacin, stretching is
described in Table: 1
Table 1: Comparing Spectrum of Ofloxacin and Ofloxacin derived AgNPs
OFLOXACIN Spectrum OFLOXACIN derived AgNPs Spectrum
Primary Amine N-H Stretching at 3370.66 was
observed
Primary Amine N-H Stretching at 3370.66 was not observed due to capping
of drug (Ofloxacin)
Imino Compound N-H stretching at 3293.51 was
observed
Imino Compound N-H stretching 3293.51 was not observed due to capping of
drug (Ofloxacin)
Secondary Amine N-H Stretching at 3173.92 was
observed
Secondary Amine N-H Stretching at 3173.92 was not observed due to capping
of drug (Ofloxacin)
Primary Amine N-H bending at 1630.84 was
observed
Primary Amine N-H bending at 1630.84 was observed was not observed due
to capping of drug (Ofloxacin)
Imino Compound/ Secondary amine N2-H2
bending at 1571.05 was observed
Imino Compound/ Secondary amine N2-H2 bending at 1571.05 was observed
was not observed due to capping of drug (Ofloxacin)
C-H Bending was observed at 14856.18, 1447.60
and 1418.67
C-H Bending was observed at 14856.18, 1447.60 and 1418.67 was not
observed due to capping of drug (Ofloxacin
4. Results and Discussion
4.1 Time Study
Synthesized AgNPs were observed for a week to know their stability and if they become turbid or not, this time study was carried out
with the help of UV-Vis Spectroscopy, firstly min study was done then h and finally days study was observed, it was observed that
synthesized AgNPs were stable for 6 hrs and showed no turbidity for 6 hrs while synthesized AgNPs were kept in test tube in room
temperature for a week.
172

5th International Conference on Energy, Environment and Sustainable Development 2018 (EESD 2018)
Spectrum: UV-Visible Spectrum showing the time study of Ofloxacin derived AgNPs from the time of synthesis to 7 hours, the time study confirms
that our synthesized OFX-AgNPs are stable for 6 hours and could be used for application purpose till 6 hours after synthesis
Table: 2 A comparison of our research work with various reported methods of Colorimetric detection of metal ions
METHOD PRECURSOR
SALT
REDUCING
AGENT
COLORIMETRIC
SENSOR
DETECTED
METAL ION
REFERENCE
Chemical
Reduction
AgNO3 Ofloxacin Ofloxacin-AgNPs Cu2+
Present
Research Work
Green
Synthesis
Ag L-Tyrosine AgNPs Hg2+ [23]
Green
Synthesis
Au L-Tyrosine AuNPs Mn2+ [20]
Chemical
Reduction
Au Glutathione AuNPs Cd2+ [21]
Chemical
Reduction
Ag - AgNPs Cr3+ [19]
Chemical
Reduction
Ag Cysteine AgNPs Hg2+ [18]
Chemical
Reduction
Ag Glutathione AgNPs Co2+ [2]
Chemical
Reduction
Ag Iminodiacetic
acid
AgNPs Pb2+ [5]
Chemical
Reduction
Ag N-Acetyl-L-
cysteine
AgNPs Fe3+ [7]
5. Analytical Approach
5.1 Metal Interferences (Cu2+ detected by AgNPs)
Synthesized Ofloxacin derived AgNPs were used to study the stability, wavelength and absorbance of various metals with synthesized
AgNPs, in this regard 0.01 M solution of different metals such copper, sodium, tin, lead, arsenic, vanadium, cadmium, chromium,
mercury, iron, magnesium, potassium were prepared to know the metal interferences, later different volumes of all metals separately
(one by one) of volume 50 µL were spiked into silver nanoparticles, after observing all metals and results, it was observed that after
5 min colour of silver nanoparticles with copper changed from yellow to white. The change in colour from yellow to white is
considered as visual output and the change in absorption and wavelength was also observed. While no change was observed of AgNPs
with other metals. Hence it was concluded that Ofloxacin derived AgNPs can detect Cu2+ easily.
173

5th International Conference on Energy, Environment and Sustainable Development 2018 (EESD 2018)
Spectrum: UV-Visible Spectrum showing the metal interference with OFX-AgNPs, the peak remains same after spiking the different
metals only change could be observed with spiked Cu2+ in OFX-AgNPs.
5.2 Detection of Copper (Cu2+) in real samples
Here the blank samples of various water samples collected from various localities were first mixed with Ofloxacin derived AgNPs
solution one by one, later 3 ml of Ofloxacin AgNPs were spiked with 50 µLs of 0.01M Copper solution in presence of real water
samples and recorded their wavelengths one by one by UV-Vis spectroscopy.
Table: Analytical figures of merit for the determination of Copper
5.2.1 Real Samples Analysis
The environmental real water samples were taken from different resources, lake water was taken from a lake of Jamshoro,
groundwater was taken from a hand pump present near Al Manzar Jamshoro, tap water was taken from tap of nanotechnology lab.
River water of Indus river Jamshoro was used. All real samples were used as matrix and spiked with synthesized AgNPs to evaluate
recovery of AgNPs and performance of methodology.
Hence for this study all types of water samples (lake, tap, ground and river water) were prepared with Copper (Cu) one by one in
different test tubes of concentration 0.01M, and those prepared solutions were spiked ranging from 1 µL to 50 µLs in synthesized
AgNPs of volume 3ml. This method was repeated 3 times for each reading.
The study was evaluated with UV-Vis Spectroscopy it was observed that tap water with concentration of 0.01M was showing
continues blue shift and absorbance was reduced continuously while the lake water with Cu concentrations of 0.0001M to 0.01M also
showed blue shift and increase in absorbance. The same results were observed for river and groundwater.
174

5th International Conference on Energy, Environment and Sustainable Development 2018 (EESD 2018)
Spectrum: Optimization of Copper (Cu2+) prepared with deionized water spiked in 3ml of Ofloxacin derived AgNPs.
Graph 1: Calibration curve of AgNPs with spiked Copper of different concentrations showing the linear line calibration with R2 value of
0.9763.
5.2.3 Percentage Recovery of Cu2+ in real samples %Recovery= (Added/Spiked- Recovered/without spiked value)/spiked ×100
Samples Cu added in (µM) Cu recovered in (µM) Recovery (%)
Groundwater 33.33 32.22±0.11 96.66
Lake water 66.7 67.8±0.14 101.6
River water 233.3 232.0±0.13 99.4
Tap water 166.7 164.8±0.16 98.8
175

5th International Conference on Energy, Environment and Sustainable Development 2018 (EESD 2018)
6. ANALYTICAL ADVANTAGES OF DEVELOPED OFX-AgNPs BASED COLORIMETRIC SENSOR
It is clearly observed that developed colorimetric sensor can detect Cu2+ and Vermox with naked eye; the method to
synthesize this sensor is economical and less time consuming which can help the researchers to perform more work and
applications in environmental pollution and human health. It is also observed that synthesized OFX-AgNPs colorimetric
sensor is stable, low cost, highly sensitive, highly selective and profitable.
7. RECOMMENDATIONS:
It is recommended to public health organizations to concentrate on the exposure of toxic heavy metals
due to their consumption through the use of contaminated water.
Old methods should be replaced by new methods to avoid the toxicity caused due to over usage of
hazardous chemicals, metals and drugs.
An electronic media campaign should be launched for the awareness of public regarding the toxicity
of heavy metals, drugs and other toxic chemicals.
Water should be treated properly before drinking.
The industrial and hospitals waste must be analyzed and purified before consumption and discarding
in rivers and lakes to avoid serious health problems and environmental pollution.
8. Future Direction
The synthesized OFX-AgNPs and its colorimetric sensor in selective and sensitive to Cu2+, in future researchers should
synthesize more nanoparticles like this to remove toxic heavy metals and drugs present in biological and environmental
samples and also use Ofloxacin assisted AgNPs for detection of other metals and drugs.
9. Conclusion
A cost-effective scientific approach for the synthesis of Ofloxacin derived AgNPs was carried out through chemical
reduction method, in which Ofloxacin (an antibiotic) was used as capping and reducing agent and NaOH was used to
enhance the reaction, the yellow transparent colour confirmed the formation of AgNPs which was detected by UV-Vis
spectroscopy with wavelength of 390nm. The pH study showed synthesized AgNPs are neutral in nature with 7 pH.
Then stable sponge-like nanocrystal image of Ofloxacin derived AgNPs was obtained, the sponge-like shape of the
AgNPs was investigate at nanoscale via scanning electron microscopy (SEM). The XRD peaks reveal that the prepared
AgNPs exhibit highly crystalline nature. The synthesized AgNPs were used as optical sensors and they detected copper
in various water samples of environment.
10. Acknowledgment
Support from National Center of excellence in Analytical Chemistry University of Sindh Jamshoro, kind supervision of
Prof. Dr. Sirajuddin and Prof. Dr. Amber Rehana Solangi is acknowledged.
11. REFERENCES [1] Milburn, C., Nanotechnology in the age of posthuman engineering: science fiction as science. Configurations, 2002. 10(2): p. 261-295.
[2] Drexler, K.E., Nanosystems: molecular machinery, manufacturing, and computation1992: John Wiley & Sons, Inc.
[3] Hübler, A.W. and O. Osuagwu, Digital quantum batteries: Energy and information storage in nanovacuum tube arrays. Complexity, 2010.
15(5): p. 48-55.
[4] Shinn, E., et al., Nuclear energy conversion with stacks of graphene nanocapacitors. Complexity, 2013. 18(3): p. 24-27.
[5] Patil, R.S., M.R. Kokate, and S.S. Kolekar, Bioinspired synthesis of highly stabilized silver nanoparticles using Ocimum tenuiflorum leaf
extract and their antibacterial activity. Spectrochimica Acta Part A: Molecular and Biomolecular Spectroscopy, 2012. 91: p. 234-238.
[6] Anandalakshmi, K., J. Venugobal, and V. Ramasamy, Characterization of silver nanoparticles by green synthesis method using Pedalium
murex leaf extract and their antibacterial activity. Applied Nanoscience, 2016. 6(3): p. 399-408.
[7] Alanazi, F.K., A.A. Radwan, and I.A. Alsarra, Biopharmaceutical applications of nanogold. Saudi Pharmaceutical Journal, 2010. 18(4): p.
179-193.
[8] Caro, C., et al., Silver nanoparticles: sensing and imaging applications, in Silver nanoparticles2010, InTech.
[9] Zhang, X.-F., et al., Silver nanoparticles: synthesis, characterization, properties, applications, and therapeutic approaches. International
journal of molecular sciences, 2016. 17(9): p. 1534.
176

5th International Conference on Energy, Environment and Sustainable Development 2018 (EESD 2018)
[10] Eustis, S. and M.A. El-Sayed, Why gold nanoparticles are more precious than pretty gold: noble metal surface plasmon resonance and its
enhancement of the radiative and nonradiative properties of nanocrystals of different shapes. Chemical society reviews, 2006. 35(3): p. 209-
217.
[11] Salata, O.V., Applications of nanoparticles in biology and medicine. Journal of nanobiotechnology, 2004. 2(1): p. 3.
[12] Junejo, Y. and A. Baykal, Green chemical synthesis of silver nanoparticles and its catalytic activity. Journal of Inorganic and Organometallic
Polymers and Materials, 2014. 24(2): p. 401-406.
[13] El-Nour, K.M.A., et al., Synthesis and applications of silver nanoparticles. Arabian journal of chemistry, 2010. 3(3): p. 135-140.
[14] Boulaiz, H., et al., Nanomedicine: application areas and development prospects. International journal of molecular sciences, 2011. 12(5): p.
3303-3321.
[15] Xia, N., et al., Green synthesis of silver nanoparticles by chemical reduction with hyaluronan. Carbohydrate polymers, 2011. 86(2): p. 956-
961.
[16] Duan, X. and Y. Li, Physicochemical characteristics of nanoparticles affect circulation, biodistribution, cellular internalization, and
trafficking. Small, 2013. 9(9‐10): p. 1521-1532.
[17] Zhu, M., et al., Physicochemical properties determine nanomaterial cellular uptake, transport, and fate. Accounts of chemical research, 2012.
46(3): p. 622-631.
[18] Lapshin, R., Feature-oriented scanning probe microscopy, in Encyclopedia of nanoscience and nanotechnology2011, American Scientific
Publishers. p. 105-115.
[19] Monteiro-Riviere, N.A., et al., Protein binding modulates the cellular uptake of silver nanoparticles into human cells: implications for in vitro
to in vivo extrapolations? Toxicology letters, 2013. 220(3): p. 286-293.
[20] Li, W.-R., et al., Antibacterial activity and mechanism of silver nanoparticles on Escherichia coli. Applied microbiology and biotechnology,
2010. 85(4): p. 1115-1122.
[21] Lubick, N., Nanosilver toxicity: ions, nanoparticles or both?, 2008, ACS Publications.
[22] Cai, Z., et al., Application of nanotechnologies for removing pharmaceutically active compounds from water: development and future trends.
Environmental Science: Nano, 2018. 5(1): p. 27-47.
[23] O'brien, T.P., et al., Efficacy of ofloxacin vs cefazolin and tobramycin in the therapy for bacterial keratitis: report from the Bacterial Keratitis
Study Research Group. Archives of Ophthalmology, 1995. 113(10): p. 1257-126
177

5th International Conference on Energy, Environment and Sustainable Development 2018 (EESD 2018)
Benefits of Building Information Modelling (BIM) on Green
Buildings
Danish Kumara*, Muhammad Saleem Razaa, Shafique Ahmeda and Fida Hussain Siddiquia
aDepartment of Civil Engineering, Mehran University of Engineering and Technology, Jamshoro-76062, Sindh, Pakistan
Abstract
The construction industry is one of the major contributors to climate change/bad environment due to generation of large amount of carbon footprint and using lots of energy in construction projects both before and after completion of project. This research reveals that how Building Information Modelling (BIM) can lower the carbon footprint and energy whose resources are getting expensive day by day. It changes different parameters like design and material, compare schedules and estimates at the early design stage so the construction waste is also reduced. It leads to transformation of an ordinary building into green building that will produce less amount of carbon by reducing the amount of energy and water used in building’s project lifecycle. BIM is an efficient approach because it provides better collaboration of Architect, Engineer, interior designer which help in an efficient Green Building design and construction. The paper also reveals different benefits that BIM may have on green buildings, which can impart its role in green buildings from reduction in waste to lesser energy usage and green energy production.
© 2018 Danish Kumara*, Muhammad Saleem Razaa, Shafique Ahmeda and Fida Hussain Siddiquia
Selection and/or peer-review under responsibility of Energy and Environmental Engineering Research Group (EEERG), Mehran University
of Engineering and Technology, Jamshoro, Pakistan.
Keywords: Green Buildings; Carbon footprint; Design; Energy; Environment.
1. Introduction
Climate change is the most important issue in the world now a days and AEC (Architecture, Engineering and
Construction) industry are producing lots of waste and tons of carbon which is affecting the environment heavily.
In a new research done by construction blog Bimhow, it is estimated that construction industry produces 50% of
landfill wastes, contributes to 50% of climatic change, 40% of pollution in drinking water and pollutes the air with
an estimate of 23%. In another research by United States Green Building Council (USGBC), the construction
industry uses 40% of world’s energy whose production generate large amount of carbon footprint. It also estimates
that greenhouse gas emissions from commercial buildings will increase by 1.8%. Lots of work is being done to
cater that with techniques like Prefabrication in construction, building more green and passive buildings to reduce
the amount of carbon produced and make this environment better to live for us and future generations. [1-2].
Using BIM for design of green buildings helps in knowing the cost of green building forehand its construction
and reduce the waste too. So, the client is aware of the project outcomes and how it’s going to save the money in
regard of Electricity, fuel and water whose prices are not going to drop down in near future, specifically in
developing countries like Pakistan.
Since past few years the rise of two major trends- construction of green buildings and the use of BIM tools is
witnessed by the AEC industry. Although these trends have progressed independently, and both have made their
distinguished places in building and construction industry, the industry practitioners have realized the remarkable
synergies between the two. The green design can be best served through an integrated design process and BIM is
best known for facilitating the integrated design. Keeping this in view, the usefulness of BIM is widely being
recognized to facilitate the design and construction of green buildings. The use of BIM in green buildings has
great contribution in forecasting, supervising and monitoring the environmental impacts of construction through
its virtual modelling and visualization technology [5]. Therefore, continuous efforts are also being made to explore
a wide range of BIM tools that can be employed for supporting the green construction for example, energy
simulation, lightening and air flow analyses, construction and demolition waste analysis etc. [5]. Some authors
define Green BIM as “to accomplish established sustainability goals by 3D modelling, producing and working
with coordinating building data during project life cycle to enhance the efficiency, quality and performance of the
178

5th International Conference on Energy, Environment and Sustainable Development 2018 (EESD 2018)
building”. [11]
After witnessing an increasing popularity of the term ‘Green BIM’ in AEC Industry over the last decade, the
growing AEC firms have shifted their focus towards use of BIM in green building practices. Today construction
of Green Buildings using BIM is being promoted by almost every firm and this is just because of its ability to
support sustainable construction through unified design information and collaboration between the architect,
engineer, designer and most importantly the client.[3-5] It should be worth noted that the benefits of BIM on green
buildings is just not limited to the sustainability analysis and the management of design and construction
processes, but it also plays a vital role in the operational, repair, maintenance and demolition processes of the
building (Green building). [3-4-5]. Designs done through BIM are well integrated and more effective sharing of
information is done through BIM which helps engineers and architects to make better designs regarding
sustainability such as day lighting and energy use. [20]. BIM applications perform building analysis and
simulations such as analysis on energy performance. [24, 30, 31, 32, 33]. These applications also analyse carbon
emissions which help in reducing carbon emissions at design stage [28,29]. Through integrated building
performance optimization better green designs can be achieved in early design stage by visualization [24].
Previously the work done is based on benefits or analysis, but this paper does both combines the benefits which
BIM can offer for green buildings and their analysis by using the software like Green Building Studio. The
research shows how Building Information Modelling with use of different software’s reduces the carbon emissions
by reduction in energy use during project lifecycle. Also, it shows how water can be saved during operational
phase by designing through BIM at the start of the project.
2. Literature Review
The purpose of this study is to come up with the benefits of BIM on green buildings by reviewing important
research papers related to green BIM that show us the enhancement of environmental sustainability of buildings
through BIM technology.
Despite the concept of ‘environmental sustainability’ and ‘sustainable development’ being very well known to
the building and construction industry since many past decades, the industry is still considered as immature in
terms controlling and managing the carbon emissions and is criticized as a major carbon emitter [5]. According
to recent facts and figures, the AEC is a major energy consumer, consuming approximately 10% of all global
energy for the manufacturing of building materials. About 30–40% of the total global GHG (greenhouse gas)
emissions take place due to energy consumed during the operation phase of building’s life cycle. [8]. It is also
estimated that construction and demolition waste of the buildings makes up 40% of the total solid waste produced
in the urbanized countries. [5]. After facing the disastrous challenges of global warming, environmental
degradation, the shortage of energy resources and the increasing energy costs, the AEC industry is continuously
being pressurized to minimize their energy consumptions in order to avoid GHG emissions and tackle the
concerns. Therefore, humans in general and AEC industry in particular, have shifted their focus towards the
building and development of low carbon green buildings and Eco cities [6].
The green design can be best served through an integrated design process and BIM till date, is best known for
facilitating the integrated design. Keeping this in view, continuous efforts are being made in exploring the
possibility of BIM in facilitating the development of green buildings. The usefulness of BIM is widely being
recognized to facilitate the design and construction of green buildings. The innovation of BIM technology in the
field of green and sustainable buildings has brought us some latest means to predict, manage and monitor the
environmental impacts of construction through its virtual prototyping and visualization technology. Due to
integration and coordination of BIM with different models like Mechanical, Electrical and Plumbing (MEP) and
architecture it can enclose lots of information within one single model which helps in efficient analyses of
environmental performances and to enhance sustainability measures more precisely. [5]. BIM is possibly a best
tool to integrate the analogue-energy buildings, the air flow analysis and buildings’ sunshine ecosystems. Using
BIM helps us to reduce the energy consumption and construction waste to a greater extent and improve the quality
of construction [6]. With the availability of innovative software’s like Green Building Studio (GBS) which uses
cloud computing technology for the different analysis of building by gathering data from its nearest weather
station. It can perform task like estimate energy consumptions, production and use of renewable energy, and can
calculate the annual carbon footprint of the building. [5].
The different ways through which the BIM can help in planning and design for building sustainability are as
179

5th International Conference on Energy, Environment and Sustainable Development 2018 (EESD 2018)
follows:
Check the orientation of building, Analysing the building's massing, Conducting day lighting analysis. Analysing
the water harvesting potential to reduce water requirements. Modelling building energy performance. Check for
the sustainability of materials. Designing site and logistics management. Focusing on ecological maintenance.
Recycling rainwater. Using natural ventilation. [5]
The environmental impacts of construction and demolition works are getting severe after a growing number of
construction activities are noticed. The ever-increasing amount of construction and demolition waste disposal in
landfills has become a serious socio-environmental concern and a political issue. But with the growing awareness
of environmental sustainability, governments and industries are looking towards effective Construction and
Demolition (C&D) waste management practices. For this purpose, practitioners have also been working hard to
create the BIM based tools for estimating the waste from the demolitions of buildings. SMARTWaste is one of
such tools that provide access for estimating and identifying the types and amounts Establishment. The working
of SMARTWaste is based on the use of available regional data and reliable and accurate records of waste produced
[5].
However, due to the lack of knowledge the practice of BIM for the building projects is still quite low due to
limited knowledge about this innovative technology, but its full potential is yet to be discovered by the experts in
the coming years [5].
Sustainable construction’s aspect of waste reduction can be achieved through BIM. [21, 22]. BIM software’s like
Green Building Studio can calculate the amount of renewable energy production through solar and wind and their
feasibility [25, 26, 27]. BIM helps designers and engineers in choosing optimal design scheme balancing carbon
emissions, energy and cost for client through multi objective optimization model. [23]. BIM software’s like green
building studio provide water analysis mainly at design phase by estimating water usage based on relevant factors.
They help in optimizing water distribution system of buildings [25] of waste products that will be generated at
site. This tool is developed by the UK Building Research. The researchers in Pakistan have not still worked on
effects BIM can have on green buildings. This research will build a pathway for new researchers in the field of
BIM and Green Buildings in Pakistan.
3. Research Methodology
The multi-step methodology of this research is same as in other review articles. [9] [10] which is based on the
factors identified from the literature review of several research papers on Green Buildings and BIM [3-6-13-19]
but most of the literature review was based on the relationship of BIM and Green Buildings or Green BIM. From
those academic papers, top 19 papers were identified for the topic of “Benefits of BIM on Green Buildings”. The
20 factors were the top most factors mentioned in previous research papers which are listed in this paper at later
stage in the table with the name of author and year of publication of the paper. Questionnaire was then designed
and propagated among various AEC professionals to sort out the most common benefits of BIM on green
buildings. Average indices were compiled through the Statistical Package for the Social Sciences (SPSS) software.
The results were compiled through the help of pie charts using MS Excel too. In the end, trials were done on
Green Buildings Studio for a model building to validate the benefits.
180

5th International Conference on Energy, Environment and Sustainable Development 2018 (EESD 2018)
Figure 3.1 Flow Chart of Methodology
4. Research Findings
The research findings were than simulated on a software in which a Hospital model was justified on Green
Building Studio. The rates of Electricity and Fuel were entered according to local government rates. Energy and
water analysis were done. The results in table 4.2 show that because of BIM we can make changes in the model
and make the savings up to 4 lac Pakistani rupees per year.
A trial resulted in saving of nearly 11 tons of carbon emission annually which saves fuel and virgin recourses of
a country and help protect our climate by producing less carbon emissions with saving in cost too. The results in
table 4.3 give the comparison of the trails with respect to base run of project which shows the cost of the designed
model without the changes and give the savings of energy, fuel and carbon emissions.
The results enhance that green building are need of time now with the increasing global warming and architecture
and construction industry being big contributor to that as mentioned earlie
181
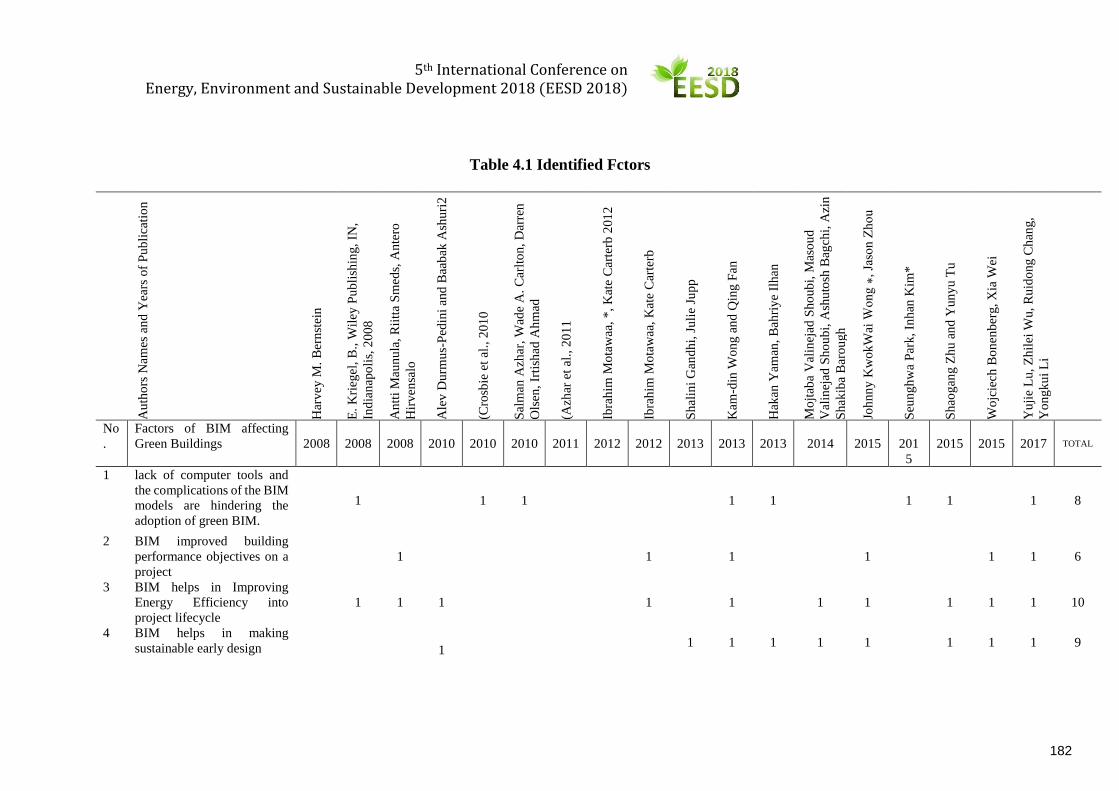
5th International Conference on Energy, Environment and Sustainable Development 2018 (EESD 2018)
Table 4.1 Identified Fctors
Au
tho
rs N
ames
an
d Y
ears
of
Pu
bli
cati
on
Har
vey
M.
Ber
nst
ein
E.
Kri
egel
, B
., W
iley
Pu
bli
shin
g,
IN,
Ind
ian
apo
lis,
20
08
An
tti
Mau
nu
la,
Rii
tta
Sm
eds,
An
tero
Hir
ven
salo
Ale
v D
urm
us-
Ped
ini
and
Baa
bak
Ash
uri
2
(Cro
sbie
et
al.,
201
0
Sal
man
Azh
ar,
Wad
e A
. C
arlt
on
, D
arre
n
Ols
en,
Irti
shad
Ah
mad
(Azh
ar e
t al
., 2
011
Ibra
him
Mo
taw
aa,
*,
Kat
e C
arte
rb 2
01
2
Ibra
him
Mo
taw
aa,
Kat
e C
arte
rb
Sh
alin
i G
and
hi,
Ju
lie
Jup
p
Kam
-din
Wo
ng
an
d Q
ing
Fan
Hak
an Y
aman
, B
ahri
ye
Ilh
an
Mo
jtab
a V
alin
ejad
Sh
oub
i, M
aso
ud
Val
inej
ad S
ho
ub
i, A
shu
tosh
Bag
chi,
Azi
n
Sh
akib
a B
aro
ugh
Joh
nn
y K
wok
Wai
Wo
ng
⁎,
Jaso
n Z
ho
u
Seu
ng
hw
a P
ark
, In
han
Kim
*
Sh
aog
ang
Zh
u a
nd
Yun
yu T
u
Wo
jcie
ch B
on
enb
erg
, X
ia W
ei
Yu
jie
Lu
, Z
hil
ei W
u,
Ru
ido
ng C
han
g,
Yo
ng
ku
i L
i
No
.
Factors of BIM affecting
Green Buildings
2008
2008
2008
2010
2010
2010
2011
2012
2012
2013
2013
2013
2014
2015
201
5
2015
2015
2017 TOTAL
1 lack of computer tools and
the complications of the BIM
models are hindering the
adoption of green BIM.
1 1 1 1 1 1 1 1 8
2 BIM improved building
performance objectives on a
project
1 1 1 1 1 1 6
3 BIM helps in Improving
Energy Efficiency into
project lifecycle
1 1 1 1 1 1 1 1 1 1 10
4 BIM helps in making
sustainable early design
1 1 1 1 1 1 1 1 1 9
182

5th International Conference on Energy, Environment and Sustainable Development 2018 (EESD 2018)
5 operating costs of green
buildings are
around 14% lower than those
of traditional buildings
1 1 1 1 1 1 6
6 using BIM helps in making
recommendations for design
alternatives that will enhance
a building's performance
1 1 1 1
1 1 1 6
7 Carbon foot printing with
BIM helps us test conceptual
designs so we can specify
solutions with the lowest
carbon impact.
1
1 1 3
8 BIM gives us options that
lead to carbon savings during
a building's operation
1 1
9 Tying BIM to materials can
significantly reduce
construction waste and
streamline the supply chain
through more accurate
procurement.
1
1 1 3
10 BIM helps to quantify the
amount of water used in a
building by calculating the
number of fixtures (sinks,
toilets, etc.) and their related
water usage
1
1 2
183

5th International Conference on Energy, Environment and Sustainable Development 2018 (EESD 2018)
11 BIM helps us measure the
potential for greywater
reuse, which is highly
beneficial for reducing
demand on local water
supplies
1
1
12 The amount of water
available for harvesting can
be calculated using BIM,
based on the site, harvesting
system, and the size of
building.
1
1 1 3
13 BIM helps in better design
due to improved
collaboration with the supply
chain and customer,
facilitating green
innovations.
1
1 1 1 1 5
14 BIM helps us in improving
facility management and
enabling the verification and
improvement of the
building’s environmental
performance
1
1 1 1 1 1 6
15 Green Buildings lower life
cycle cost and environmental
impact of the building
through its construction and
operational phase delivering
enhanced asset value
1
1 1 3
16 Green Buildings improve
indoor conditions such as
climate and lighting, driving
improved occupant well-
being and productivity.
1
1 1 1 4
184

5th International Conference on Energy, Environment and Sustainable Development 2018 (EESD 2018)
17 Using BIM Lowers material
wastage and improved
hauling during construction
due to better project
definition
1
1 1 3
18 Using BIM with different
software’s we can know
about the potential green
energy production of the
projects during the design.
1 1 1 1 4
19 BIM tells us about the
energy, water, fuel usages
and tells the yearly and
lifecycle cost of all these
1 1 2
20 BIM provides a means for
modelling the impacts of
facility management by
promoting, sustainable build
environment by using multi-
dimensional visualising
technology.
1
1 1 1 1 1 1 1 8
]
185

5th International Conference on Energy, Environment and Sustainable Development 2018 (EESD 2018)
Table 4.2 Trials on Green Buildings Studio
186

5th International Conference on Energy, Environment and Sustainable Development 2018 (EESD 2018)
Table 4.3 Results with comparison of base run
187

5th International Conference on Energy, Environment and Sustainable Development 2018 (EESD 2018)
5. Results
The results show that BIM has accomplished itself as the best technique in the construction of green buildings.
BIM is very helpful in early design stages in Energy and Water analysis of a construction project. BIM also aids
in reducing carbon emissions of project and lifecycle cost of the project. Following are top thirteen properties of
BIM that benefit the BIM in Green Building construction. These were ranked according to the research conducted
through questionnaire and results generated through SPSS. The Cronbach’s alpha for the results was 0.825 which
is more than 0.75 and satisfactory for results.
i) BIM in integration with software’s like green building studio, can simulate and optimize energy
efficiency of every part of building from energy use to interior climate.
ii) BIM helps in making sustainable early design.
iii) With the help of Green BIM project stakeholders can make early decisions in the design phase.
iv) Green BIM influences the efficiency and working of construction project.
v) Green Building have greater asset value because of its lower lifecycle cost and environmental
impact of the building through its construction and operational phase.
vi) Energy Efficiency can be evaluated by using BIM in design process.
vii) Using BIM helps in making recommendations for design alternatives that will enhance a building's
performance.
viii) Green Buildings improve occupants living by improving indoor conditions such as lighting and
environment of building.
ix) BIM improves buildings environmental performance by improving facility management.
x) Better innovative green designs can be achieved with help of BIM by improving collaboration with
the supply chain and customers.
xi) Waste of material is reduced during construction by using BIM due to improved project
representation and improved transportation of material.
xii) BIM helps in reducing construction waste significantly and streamline the supply chain through
more accurate procurement.
xiii) BIM tells us about the energy, water, fuel usages and tells the yearly and lifecycle cost of these.
6. Conclusions and Future Research
The BIM has proved itself in green building construction industry and it is very effective. Although the use of
BIM is more in early design stage and it gives the best results in this stage because of changes that can be made
after different alternative trials through Green Building Studio and implementing the one which gives the best
results. These softwares integrated with BIM give the yearly and lifecycle cost of energy and carbon emission of
project but is less concerned in construction and demolition phase of the project. There is no any reliable software
to calculate the carbon emission and energy use during design phase including the material which is brought to
site which also consumes energy. There should be an application which can be used for these analyses at
retrofitting and demolition phase of a structure. The software should also include the function of reduce, reuse
and recycle of the waste before the demolition phase has started. It should give choice of construction with less
and recycled material.
References
[1]. https://www.initiafy.com/blog/how-does-construction-impact-the-environment/
[2]. https://www.usgbc.org/articles/green-building-facts
[3]. Yujie Lua, Zhilei Wub, Ruidong Changa, Yongkui Lib, Building Information Modelling (BIM) for green
buildings: A critical review and future directions. Automation in Construction 83 (2017) 134–148.
[4]. Building Information Modeling For Green and Energy Efficient Buildings Design, Nuthan Dummenahally
1 PhD Student, Department of Structural Engineering, Poznan University of Technology, Poznan, Poland 1
[5]. Enhancing environmental sustainability over building life cycles through green BIM: A review Johnny
KwokWai Wong, Jason Zhou
[6]. Wojciech Bonenberg, Xia Wei, Green BIM in sustainable infrastructure. Procedia Manufacturing 3 (2015)
1654 – 1659.
[7]. W. Wu, R. Issa, Integrated process mapping for BIM implementation in green building project delivery, in:
N. Dawood, M. Kassem (Eds.), Proceedings of the 13th International Conference on Construction
188

5th International Conference on Energy, Environment and Sustainable Development 2018 (EESD 2018)
Applications of Virtual Reality, 30–31 October 2013, London, UK, 2013.
[8]. Schlueter, F. Thesseling, Building information model based energy/exergy performance assessment in early
design stages, Autom. Constr. 18 (2008) 153–163.
[9]. Q. He, G. Wang, L. Luo, Q. Shi, J. Xie, X. Meng, Mapping the managerial areas of
[10]. Building Information Modelling (BIM) using scientometric analysis, Int. J. Proj.
[11]. Manag. 35 (4) (2017) 670–685.
A. Bradley, H. Li, R. Lark, S. Dunn, BIM for infrastructure: An overall review and
[12]. Constructor perspective, Autom. Constr. 71 (2016) 139–152.
[13]. Xining Yang, Mingming Hu, Jiangbo Wu, Bin Zhao. “Building-information-modeling enabled life cycle
assessment, a case study on carbon footprint accounting for a residential building in China”, Journal of
cleaner production, 2018.
[14]. ira.lib.polyu.edu.hk
[15]. Seunghwa Park and Inhan Kim, BIM-Based Quality Control for Safety Issues in the Design and Construction
Phases. International Journal of Architectural Research Volume 9 - Issue 3 - November 2015 - (111-129) –
Special Issue.
[16]. Kam‐din Wong, Qing Fan, (2013) "Building information modelling (BIM) for sustainable building design",
Facilities, Vol. 31 Issue: 3/4, pp.138-157.
[17]. Shalini Gandhi, Julie Jupp. Characteristics of Green BIM: Process and Information Management
Requirements. Alain Bernard; Louis Rivest; Debasish Dutta. 10th Product Lifecycle Management for
Society (PLM), Jul 2013, Nantes, France. Springer, IFIP Advances in Information and Communication
Technology, AICT-409, pp.596-605, 2013.
[18]. Shaogang Zhu and Yunyu Tu, Design Study on Green Sports Building Based on BIM. The Open Cybernetics
& Systemics Journal, 2015, 9, 2479-2483.
[19]. Antti Maunula, Riitta Smeds and Antero Hirvensalo. Implementation of Building Information Modeling
(BIM) – A Process Perspective. APMS 2008 Innovations in Networks pp. 379-386.
[20]. Ibrahim Motawaa and Kate Carter. Sustainable BIM-based Evaluation of Buildings Procedia - Social and
Behavioral Sciences 74 (2013) 419 – 428.
[21]. H.-L. Chi, S.-C. Kang, X. Wang, Research trends and opportunities of augmented reality applications in
architecture, engineering, and construction, Autom. Constr. 33 (2013) 116–122.
A. Heydarian, M. Golparvar-Fard, A visual monitoring framework for integrated productivity and carbon
footprint control of construction operations, Proc., International Workshop on Computing in Civil
Engineering, 2011 2011, pp. 504–511.
[22]. R.C. Hill, P.A. Bowen, Sustainable construction: principles and a framework for attainment, Constr. Manag.
Econ. 15 (1997) 223–239
[23]. N. Nisbet, B. Dinesen, Building Information Modelling: Construction the Business
[24]. Case, British Standards Institution, London, 2010.
A. Baldwin, L.Y. Shen, C.S. Poon, S. Austin, I. Wong, Modelling design information to evaluate pre-fabricated
and pre-cast design solutions for reducing construction waste in high rise residential buildings, Autom.
Constr. 17 (2008) 333–341.
[25]. C.Y. Liao, D.L. Tan, Y.X. Li, Research on the application of BIM in the operation stage of green building,
Appl. Mech. Mater. 174 (2012) 2111–2114.
[26]. Associated General Contractors of America, The Contractor's Guide to BIM, 1st ed. Associated General
Contractors of America Research Foundation, Las Vegas, NV, 2005.
[27]. S. Barnes, D. Castro-Lacouture, BIM-enabled integrated optimization tool for LEED decisions, Proceedings
of the 2009 ASCE International Workshop on Computing in
[28]. Civil Engineering, 2009 2009, pp. 258–268.
[29]. P. Bynum, R.R. Issa, S. Olbina, Building information modelling in support of sustainable design and
construction, J. Constr. Eng. Manag. 139 (2012) 24–34.
[30]. S. Curwell, A. Yates, N. Howard, B. Bordass, J. Doggart, The green building challenge in the UK, Build.
Res. Inf. 27 (1999) 286–293.
[31]. Autodesk, Building Information Modeling for Sustainable Design, 2005.
[32]. [30] A.N. Baldwin, S.A. Austin, C.S. Poon, L.Y. Shen, I. Wong, Reducing waste in high rise residential
buildings by information modelling at the design stage, Surv. Built Environ.
[33]. 18 (1) (2007) 51–62.
[34]. [31] L.C. Bank, M. McCarthy, B.P. Thompson, C.C. Menassa, Integrating BIM with system dynamics as a
decision-making framework for sustainable building design and operation, Proceedings of the First
International Conference on Sustainable Urbanization, 2010.
[35]. [32] C.M. Clevenger, R. Khan, Impact of BIM-enabled design-to-fabrication on building delivery, Pract.
Period. Struct. Des. Constr. 19 (2013) 122–128.
189

5th International Conference on Energy, Environment and Sustainable Development 2018 (EESD 2018)
Iron Oxide Modified Zeolite from Coal Power Plant Ash for
Pollutant Treatment – A review
Muzamil Hussain Memon, Suhail A. Soomro, Shaheen Aziz, Uzair A. Kolachi
Chemical Engineering Department, Mehran University of Engineering & Technology, Jamshoro, Sindh Pakistan 76062.
Abstract
In the last few decades, the synthesis of iron oxide modified zeolite (IMOZ) had acquired much attention of
the researchers. Zeolite can be synthesized from a number of resources that may contain alumina-silicate
substance; ranging from clays to waste material from different activities. Coal fly ash is one of such resource;
rich in microspores aluminum-silicate for zeolite synthesis. Furthermore, IMOZ has, however, high surface
area, unique pore characteristics, and excellent ion exchange capacity. The modification of zeolite with iron
oxide increases the capacity and capability of removing pollutants mainly caused by agriculture, domestic and
industrial activities. It is also used for elimination of ionic species (viz., nitrate, phosphate, ammonium, sulfate,
fluoride, and chloride) and heavy metals (viz., mn, w, cr, cd, cu, sr, fe, pb, ni, as, zn, cs, and hg) from waste-
water from domestic, industrial waste, streams’ water, and acid mine drainage. In addition, the iron oxide-
zeolites novel application as sorbent medium in reactive permeable barriers and pollutant barrier inside layer
for the pollutant immobilization. In this article, literature has been reviewed for the synthesis and application
of IOMZ.
© 2018 Muzamil Hussain Memon, Suhail A. Soomro, Shaheen Aziz, Uzair A. Kolachi Selection and/or peer-review under responsibility
of Energy and Environmental Engineering Research Group (EEERG), Mehran University of Engineering and Technology, Jamshoro,
Pakistan.
Keywords: “iron oxide modified zeolite, removal of heavy metal and ionic species, pollutants treatment, applications, coal fly ash, power plant;”
1. Introduction
Mineral coal is one of the minerals which is most important and available evenly in abundant quantity in the
entire globe. Its proven world-wide reserves are nearly one trillion tons. Many countries of the country fulfill
their electricity requirement through coal power plants such as like, the United States {49%}, China {79%},
Poland {92%}, and South Africa {93%} [1]. The main serious problems in the coal power plant are the
production of coal ash which is about its 30% by weight [2]. Almost all coal fly ash is discarded in a landfill
as a waste which is costly and contributes to environmental pollution as well. Therefore, it is a dire need to
focus on the coal fly ash (CFA) utilization. Fly ash (FA) is left-over generated from coal power plants in bulk
quantity [3]. Because of its availability and inexpensive its demand has got pace during since a couple of
decades and it has been used in brick industry [4], in cement industry, as a reinforcing filler in polymers [5].
Besides this CFA is also used for the synthesis of zeolite, silica aerogel has great content of alumina and silica
[6]. Zeolites are natural occurring comb-like sponge material with 3-dimension tetrahedral structure. One of
its unique properties is that it possesses negative on it which makes zeolite unique and huge range of
applications. The formula of a zeolite is F2/mO.Al2O3.aSiO2.bH2O, where F is an alkaline earth element or
alkali, m, is the valence charge on that element, varies from {2 – 11} and b vary from {2 – 8}. Zeolite can also
be synthesized from other resources such as fly ash, biomass, kaolin, slag, and other raw materials.
* Corresponding author. Tel.: +92-315-39869-77.
E-mail address: [email protected]
190

5th International Conference on Energy, Environment and Sustainable Development 2018 (EESD 2018)
Naturally occurring zeolites have limitation to their pore size and channels because of that they have limited
scope and applications, however, synthetic zeolite from fly ash possess a variety of pores and channels hence
it is economically suitable for trapping different contaminants from water and air [7], also as shown Table 1
zeolite types. It has been reported that zeolite fly ash has high sorption’s capacities than fly ash (5-8 times) and
ordinary zeolites (2-6 times) [8].In former studies, it has been acknowledged that iron-oxides have a very high
affinities for pollution present in water. For zero emission, a new method has been developed in which
synthesizing of ZFA/hydrated iron oxide modified zeolite from CFA. In this method neutralization of the waste
alkaline-solution with soluble iron salt to formation ordinary ZFA. This method eliminates not only waste of
alkaline solution but also possesses the high capability for pollutant reduction. In a previous couple of decades
iron oxide has proved for discarding pollutants (anionic); phosphate [11], selenite [10], and arsenates [9] from
contaminated waters.
Table 1 some common zeolites synthesized from fly ash (Koshy et at., 2014)
Zeolite Type Chemical Formula References
Analcime NaAlSi2O6·H2O. Remy and Ferrell (1989)
Cancrinite Na6Ca2Al6Si6O24(CO3)2·2H2O Qiu and Zheng, 2009
Clinoptilolite (Na,K,Ca)2-3Al3(Al,Si)2Si13O36·12H2O Zabochnicka-Świątek and Malińska (2010)
Hydroxy-sodalite Na1.08Al2Si1.68O7.44·1.8H2O Ahmaruzzaman (2010)
Mordenite (Ca, Na2, K2)Al2Si10O24·7H2O Sasaki et al. (2003)
Phillipsite (Ca,Na2,K2)3Al6Si10O32·12H2O Hay (1966)
Na-A Na12Al12Si12O48·24H2O Qiu and Zheng, 2009
Na-P1 Na6Al4Si4O24·4H2O Qiu and Zheng, 2009
Na-Y Na58Al58Si134O384·260H2O Qiu and Zheng, 2009
Na-X NaAlSi1.23O4.46·3.07H2O Ahmaruzzaman (2010)
Scolecite Ca2Al2Si3O10·3H2O Qiu and Zheng, 2009
2. Synthesis of Zeolite & Iron Oxide Zeolite
2.1 Coal Power Plant Ash to Zeolites
Fly ash activation was carried out by basic chemicals like NaOH, KOH, CaOH2 and LiOH, experiences
dissociation and followed by crystallizes into zeolitic minerals. There are several synthesis processes/ methods
such as (i) alkali fusion-assisted hydrothermal treatment [19-25], (ii) conventional refluxing method, (iii)
molten salt method [34, 35], (iv) conventional hydrothermal treatment [6-18], (v) ultra-sonication-assisted
hydrothermal [28-32] and (vi) microwave-assisted hydrothermal treatment [26, 27], as shown Fig. 1. Instead
Syn
thes
is o
f Z
eoli
te M
eth
od
s
Conventional Hydrothermal Treatment
Ultra-sonication-Assisted Hydrothermal
Alkali Fusion-Assisted Hydrothermal Treatment
Microwave-Assisted Hydrothermal Treatment
Molten Salt Method
Conventional Refluxing Method
Fig. 1. Synthesis of Zeolite using different techniques
191

5th International Conference on Energy, Environment and Sustainable Development 2018 (EESD 2018)
of these, alkali leaching of FA is another technique to synthesize pure zeolite from alumina and silica. Particle
size of the original FA decreases due to basic etching on the FA particles surface and followed by nucleation
and crystallizations zeolite patterns minerals, also change in composition FA to zeolite and iron oxide zeolite
as shown in (Fig. 2 and 3) and Table 2, at the end an increase in specific surface area witnesses [36-39].
As a result, this increment in surface-area assists improved sorption’s physical characterize in the final material.
The synthesis of zeolite makes contaminant sorption’s capacity limited due to the abundant quantity of residue
of fly ash present [38]. Hence, it is compulsory to pretreat raw FA to achieve pure zeolites. In fly ash large
particle fractions >252 µm, carbon un-burnt is currently liable on the types of coal and firing system which
can be avoided by employing screening so as to increase zeolization potential, end in a higher surface area
[39,42]. In addition to this, cal-cinations at high temp. (800 ±1 ºC) can eliminate unburnt volatile and carbon
components. More ever, the removal of Fe2O3 and TiO2 with the help of magnetic separation technique
improves purity and structure of zeolites final product.
Quite interestingly it has been observed that the zeolites surface loaded with iron and titanium species to
enhance their cation exchange capacity [43]. By washing (water) of fly ash can reduce the concentration of
soluble molecules/ compounds Na2O, MgO, CaO and K2O [44] and decreases the pH (which is initially >10).
Instead of this, acid treatment removing impurities from the fly ash like ferric oxide and yields a higher
concentration of alumina-silicates [44, 45]. Furthermore zeolites can be prepared using with solution (NaCl)
treated to achieve saturated zeolite cation which differs better ion exchange capacity [38].
2.2 Modification of Zeolite to Iron Oxide Zeolite
Formation of iron oxide zeolite (ZFA/Fe2O3) composite, using different molar solution of (0.66 to .87) M an-
hydrous Fe (III) chloride (FeCl3), hex hydrate iron chloride and another form was added drop wise with stirring
constant, into the combination of waste alkalines material and after process ZFA cool down to normal
temperature at hydro-thermal process. Fe (III) chloride added equally to NaOH solution used in zeolite
preparation. The solution is sufficient for the process of Fe (III) chloride through an alkaline solution, after
addition of Fe (III) chloride material where mixing continually for 4 hours. The ZFA/Fe2O3 combined
compound was then recovered, wash, drying, and powdered. Another method for formation of iron oxide
zeolite is primarily, it was submerged in demineralize water use for 26 hours to decrease its alkali-scenic, and
drying it normal temperature. Natural zeolite sample 0.1 kg was transmitted to a flask-ware container where
2.0 M NaCl solution with 1 L of demin water. The material was mixing for 24 hours at normal temperature
and decantation was used to separate the phases. The sample was washing through demineralized water until
the removal of Cl ions was succeeded, for test chloride ion used with AgNO3 silver nitrate. At the end, zeolite
(NaZ) was treated with sodium and air-dried. Iron-hydro (oxide) modified-zeolite (IHOMZ) synthesized
through, 50 g of NaZ was shifted into a flask holding 500 mL of Fe (NO3) 0.5 molar concentration used, and
the solution pH was adjusted to 3 and 4 using NaOH 0.1 molar concentration and HNO3 0.1 molar concentration
Fig. 2. XRD pattern show crystalline phase peaks fly to zeolite synthesis
192

5th International Conference on Energy, Environment and Sustainable Development 2018 (EESD 2018)
used. The material was shake at 160 rpm for 24 hours., the solid phase has been separated then was washed 2
to 3-time with demin water and dried in open air [47].
CFA treated with alkaline solution where ZFA compound content was changed as show in Table 2. The IOCZ
was prepared in two stages: press oxide planning, trailed by covering iron oxides on the purchased zeolite.
Initial, 200 mL of FeCl3 arrangement was included NaOH with 10 molar concentration at 185 ml arrangement
through dribbling gradually; subsequent precipitates were washed and flushed with demineralize water for 4 or
5 times, and afterward dried in a broiler of 115 for 24 hours; dried iron oxide powder was used consecutively
with demineralize water to rehydrate mud with 46% dampness. Additional, every 50 g of UMZ was blended
with 5 g of mud (iron oxide), and kept the mud being consistently covered on the surface of UMZ; the
subsequent zeolites were then dried at 110 0C for 20 hours, chilled off to filter and discharged with demineralize
water until no pitifully related iron oxides were discharged and also cool down at room temperature. [38].
Table 2 CFA to ZFA & ZFA/ Fe2O3 impact in composition (Xie et al., 2014)
CFA ZFA ZFA/Fe2O3
Fe2O3 2.90 2.77 25.39
Al2O3 38.05 34.19 21.07
MgO 0.67 0.75 0.39
SiO2 48.00 38.67 32.99
CaO 2.32 2.42 0.55
TiO2 1.64 1.34 0.80
Moisture 0.25 6.32 9.10
Na2O 0.47 8.41 3.80
LOI 3.18 4.17 4.55
Other 2.27 0.99 1.34
3. Application of Zeolite & Iron oxide zeolite for pollutant removal
In sole solution or mixed matrix by iron-oxide coated zeolite, IOCZ and unmodified zeolite UMZ the pollutant
including phosphate, sulfide, and ammonium, in batch testing should be detached. The oxidation abiotic of
ammonia is very difficult at the room temperature if there is not the sufficient quantity of microorganisms
available same as herein, catalysis such like as photo-oxidize the ammonia have been exposed using titanium
dioxides [44]. It was discovered that iron-oxides coated a little threatened the subtraction of ammonium but
greatly increased sulfides and phosphates are subtraction in the solution. The pollutant reduction was slow to
process, and normally it took couples of hours or even more to get equilibrium. Therefore, especially for the
removal of phosphate and sulfide some irreversible surface chemical processes like precipitation should be
developed [49].
193

5th International Conference on Energy, Environment and Sustainable Development 2018 (EESD 2018)
3.1 Phosphorus and Ammonia
The treatment of wastewater was recommended to use zeolite for phosphorus and elimination of ammonia by
zeolite and modified zeolite [51], however, a small number of pollutant are removed by zeolite and modified
zeolite, as concluded by the earlier study (0.124 mg/l) , [52]. Though, IOCZ exhibited a higher phosphate
reduction bulk than UMZ with a considerable increase from 0.1191 to 1.009 mg/Pg. As determined by [53],
for effective removal of phosphates the coated iron oxide considered suitable to be used while the phosphate
requisitioning capacity of IOCZ discovered to be less than those as researchers found in many kinds of literature
[54]. For the determination of the IOCZ removal capability for these contaminants, consistent sorption
isotherms on IOCZ and UMZ were also analyzed which are given in Fig. 2.
The simulation of the data was performed with Freundlich and Langmuir equations, and the conforming
parameters. Both IOCZ and UMZ were found having a good sorption capacity with ammonia, while the coated
iron oxides did not greatly affect the ammonia sorption capacities, as their Langmuir maximum sorption
capacity were almost the same (6.78mg/g for IOCZ vs. 7.02 mg/g for UMZ). Though, the sorption isotherms
exposed the IOCZ seems to sorb slightly more ammonia than UMZ under the same concentrations. The minor
variance could be recognized to a smaller amount BET surface (16.02 m2/g for IOCZ vs. 19.7 g for UMZ), as
well as the higher pHpzc on IOCZ, which were expected to attract a less negative charge. The ammonia sorption
by zeolite was usually studied, and the sorption volumes naturally ranged b/w about 4 and 28 mg/Ng [57], in
which the NH4 sorption on UMZ in this study fit.
3.2 Sulfides and Arsenic
In some previous studies found that the less quantity around (0.832 mg/kg) of sulfides can be isolated by UMZ,
but the sulfide separation capacity of IOCZ enhanced to 17.859 mg/kg. Consequently, the iron oxides coated
can rise sulfide elimination, as high-lighted in the former studies [59]. The ammonia elimination was originally
withdrawn by sulfides and also overdue phosphate elimination. Though, these parallel anions appear not to
distress the final separate elimination. Founded on the calculated the simultaneous anions, specifically
phosphates, may enhance the ammonia adsorption capacity on IOCZ. The sequestrated phosphates were mostly
attributed to the increase in the negative charges on the surface of IOCZ. The iron oxides coated through the
process slow in first 14 hours besides this, it greatly promotes the anionic chromate removal, and the IOCZ
was discovered to have a high capacity to illuminate cationic heavy metals. Fe(III) in iron (hydro) oxides may
be compact by the sulfide solution into Fe(II), and sulfide intervening time can be removed by the conversion
from S(II) into S(I)/S(0).
Succeeding, to form precipitates of FeS or FeS2 the Fe(II) obtained can react with the mono-sulfide or more
sulfide . It was considered that the ferri-hydrite as the utmost reactive iron oxides to eliminate sulfides, and it
was found that its conversion to a more crystalline mineral with the aging disfavored the sulfide retardation
[58]. The absorption characteristics of arsenic (As (V)) on iron-coated zeolite (ICZ) were analyzed through
batch and column studies. As (V) was totally illuminated within 30 min in a conc. of 3 mg/l, with a 170 g/l
dose of ICZ. The optimum dose of ICZ was 66.6 g/l at a conc. of 33.24 mg/l and the effect of solution pH was
insignificant at a pH range of 2.1 < pH < 11.1. The sorption characteristics of As (V) were befitting to explain
onto ICZ Langmuir Isotherm Model. The co-existence of ions (sulfate) prevented absorption of As (V) because
of competitive adsorption. The absorption capacity of ICZ for As (V) was 1 mg/g. Based on the outcome, ICZ
is an appropriate material to treat the wastewater or mine drainage bearing As (V) [60].
3.3 Vanadium
Vanadium has a strong liking to various components present in soil like organic materials, clays, and iron
oxides, and can be ascribed as relatively immovable in soils, sediments, and mine tailings. There is no specific
legislature about the vanadium perimeter values because there is no high level of vanadium present in natural
waters, except in a few countries. In China, there is a limitation of 60 µg/l present in surface drinking water
sources while Italy has 145 µg/l for underground water. As Vanadium pentoxide is investigated and found
perhaps carcinogenic to humans, so the concerns for vanadium removal from water have been multiplied. There
are several proven chemical techniques to eliminate vanadium from the water. Vanadium presents mostly in
194

5th International Conference on Energy, Environment and Sustainable Development 2018 (EESD 2018)
its oxidation state +6 in aqueous solution if oxygen is present in solution. V (V) presents as an anionic species
when the pH is higher than ~4. Polynuclear V (V) kind has high concentration whereas mono-vanadate species
exist at lower concentration (~2.6 mg/l). Thus, vanadate for anion exchange has been used effectively.
Pertaining to water humic substances may hold vanadate and the framed edifices shaped may demonstrate
different affinities to the desorption localities. More ever, humid matters contend with vanadate for the sorption
locales. This investigation was deflected the vanadium expulsion from common water gathered from the region
of the Mustavaara vanadium pit in Taivalkoski, north-eastern Finland. Vanadium starts from the V-Fe-Ti store
of the mine site. The principal objective was to look at the productivity of sorption strategies and conjunction
with an iron coagulant. Alkylammonium-functionalized clinoptilolite (Cp) and engineered Na-zeolite-P1, got
from fly slag [19] and additionally, ground ferric oxy-hydroxide (CFH-12) were chosen as adsorbents. Every
one of these materials had been already tried for vanadium expulsion from model arrangements, nonetheless,
not from normal water. The point of the nitty gritty portrayal of crisp and utilized sorbents were to give
understanding of the systems in charge of vanadium take-up. In the co-precipitation tests, a business ferric
sulfate coagulant (PIX-322) was utilized. Furthermore, synchronous adsorption on co-precipitation with iron
(III) and organ-zeolite salt was researched. The iron coagulant is a viable accuse neutralize and responds of the
humic substances of in regular water, by shaping settle-able flocs. At the same time, joining vanadium species
to unsolvable flocs or iron species respond positively.
4. Permeable Barriers
The contaminants such as hazardous and leachates compound in soil penetrate due to rain-water percolation,
because of this both the groundwater and surface water became contaminated [64]. In this sense, permeable
reactive barriers (PRBs) propose in-situ re-mediation at less maintenance charge and less operate [63].The
concept of PRB for treatments of an impurity plume in the soil as shown in Fig 4. PRB is reactive media similar
IOMZ exchange resin, and activated charcoal should have a hydraulics conductivity more than surrounding of
media, e.g., In order the soils, to let the stream flow of the impurity plume throughout the underneath barrier
is ordinary hydraulics grade [62]. Quite interestingly, a soil iron oxide modified zeolite (IMOZ) a technique
called layers has also been consumed for the treatment of contaminated canal water and also this technique has
the potential to be improved via FA base zeolites. [64]. Have proposed that in an FA zeolite PRB with gate and
funnel configuration (a system of walls which channelize the impurity plume in the direction of the PRB), a
subordinate electro-kinetic treat, also it is providing subsequently the treat through the PRB has been finished,
can be engaged for confirming impurity elimination completely.
Fig. 3. Schematic diagram of a permeable reactive barrier (PRB) (Koshy et al., 2014)
195

5th International Conference on Energy, Environment and Sustainable Development 2018 (EESD 2018)
5. Conclusions
Iron oxide modified zeolite (IOMZ) have been represented comprehensively in writing to be a viable scavenger
of harmful or dangerous anions and cations in water. Notwithstanding this, they have the ability in effluent
treatment for evacuation of light and overwhelming metals toxins and for applications, for example, penetrable
receptive obstructions. The toxin expulsion by utilizing IOMZ happens through desorption as well as
precipitation and the evacuation effectiveness relies on the underlying contaminant fixation and the strong to
the fluid proportion of the framework. Just a couple of studies have been directed on the expulsion of mercury
and arsenic by using iron oxide changed zeolite. Bacterial stacking on FAZ can be utilized for phosphate and
substantial metal expulsion, in this manner offers, a financially practical option in contrast to existing
techniques. In spite of the fact that reviews exist for landfill leachate treatment utilizing crude FA remains,
usage of FA-based zeolites could yield better outcomes as found by a couple of past research studies. While
countless have been led on overwhelming metal evacuation, not many investigations exist on other vital
applications, for example, soil remediation utilizing porous responsive hindrances (PRBs). Despite the
examinations on PRBs using the regular and business zeolites, utilizing of fly powder-based zeolites has not
been found much. For regulation of dangerous, radioactive waste and lethal, the achievability of liner materials
utilizing settled fly fiery debris zeolites can be resolved. Encourage more, in situ-remediation studies, would
be very valuable to comprehend the viability of this material in expansive level asset recuperation innovations.
6. Acknowledgments
The authors would like to acknowledge the department of Chemical Engineering, Mehran University of Engineering & Technology for proving laboratory facilities & financial support. The British Council & Higher Education Commission Pakistan is also acknowledged for supporting the Pak-UK Knowledge Economy partnership project for the Utilization of Nagarparker Kaolin to Zeolite.
7. References
[1] Behin, J., Bukhari, S.S., Dehnavi, V., Kazemian, H. and Rohani, S., 2014. Using coal fly ash and wastewater for microwave
synthesis of LTA zeolite. Chemical Engineering & Technology, 37(9), pp.1532-1540. [2] Kouprianov V I 2002 Fuel Process. Technol. 76 187-9
[3] Blissett, R.S. and Rowson, N.A., 2012. A review of the multi-component utilisation of coal fly ash. Fuel, 97, pp.1-23.
[4] Koukouzas, N., Ketikidis, C. and Itskos, G., 2011. Heavy metal characterization of CFB-derived coal fly ash. Fuel Processing Technology, 92(3), pp.441-446.
[5] Woolard, C.D., Strong, J. and Erasmus, C.R., 2002. Evaluation of the use of modified coal ash as a potential sorbent for organic
waste streams. Applied Geochemistry, 17(8), pp.1159-1164.
[6] Holler, H. and Wirsching, U., 1985. Zeolite formation from fly-ash. Fortschritte der mineralogie, 63(1), pp.21-43.
[7] Charbonneau, D., Allen, L.E., Megeath, S.T., Torres, G., Alonso, R., Brown, T.M., Gilliland, R.L., Latham, D.W., Mandushev, G.,
O’Donovan, F.T. and Sozzetti, A., 2005. Detection of thermal emission from an extrasolar planet. The Astrophysical Journal, 626(1), p.523.
[8] Izquierdo, M., Koukouzas, N., Touliou, S., Panopoulos, K.D., Querol, X. and Itskos, G., 2011. Geochemical controls on leaching
of lignite-fired combustion by-products from Greece. Applied Geochemistry, 26(9-10), pp.1599-1606. [9] Jang, J.H., Dempsey, B.A. and Burgos, W.D., 2008. Reduction of U (VI) by Fe (II) in the presence of hydrous ferric oxide and
hematite: Effects of solid transformation, surface coverage, and humic acid. Water research, 42(8-9), pp.2269-2277.
[10] Parida, K.M., Gorai, B., Das, N.N. and Rao, S.B., 1997. Studies on ferric oxide hydroxides: III. Adsorption of selenite (SeO2− 3) on different forms of iron oxyhydroxides. Journal of colloid and interface science, 185(2), pp.355-362.
[11] Pan, B., Wu, J., Pan, B., Lv, L., Zhang, W., Xiao, L., Wang, X., Tao, X. and Zheng, S., 2009. Development of polymer-based
nanosized hydrated ferric oxides (HFOs) for enhanced phosphate removal from waste effluents. Water Research, 43(17), pp.4421-4429.
[12] Murayama, N., Yamamoto, H. and Shibata, J., 2002. Mechanism of zeolite synthesis from coal fly ash by alkali hydrothermal
reaction. International Journal of Mineral Processing, 64(1), pp.1-17. [13] Adamczyk, B. and Bialecka, B., 2005. Hydrothermal Synthesis of Zeolites from Polish Coal Fly Ash. Polish Journal of
Environmental Studies, 14(6).
[14] Cundy, C.S. and Cox, P.A., 2005. The hydrothermal synthesis of zeolites: Precursors, intermediates and reaction mechanism. Microporous and Mesoporous Materials, 82(1-2), pp.1-78.
[15] Moriyama, R., Takeda, S., Onozaki, M., Katayama, Y., Shiota, K., Fukuda, T., and Tani, Y. (2005). “Large-scale synthesis of
artificial zeolite from coal fly ash with a small charge of alkaline solution.” Fuel, 84(12), 1455-1461. [16] Derkowski, A., Franus, W., Beran, E., and Czímerová, A. (2006). “Properties and potential applications of zeolitic materials
produced from fly ash using simple method of synthesis.” Powder Technol., 166, 47-54.
[17] Fansuri, H., Pritchard, D., and Zhang, D. (2008). “Manufacture of Low-Grade zeolites from FA for Fertilizer Applications.” Research Report 91, Cooperative Research Centre for Coal in Sustainable Development, Australia.
[18] Franus, W., Wdowin, M., and Franus, M. (2014). “Synthesis and characterization of zeolites prepared from industrial fly ash.”
Environ. Monit. Assess., 186(9), 5721-5729.
196

5th International Conference on Energy, Environment and Sustainable Development 2018 (EESD 2018)
[19] Shigemoto, N., Hayashi, H., and Miyaura, K. (1993). “Selective formation of Na-X zeolite from coal fly ash by fusion with sodium hydroxide prior to hydrothermal reaction.” J.Mater. Sci., 28(17), 4781-4786.
[20] Ojha, K., Pradhan, N. C., and Samanta, A. N. (2004). “Zeolite from fly ash: synthesis and characterization.” B. Mater. Sci., 27, 555-
564. [21] Terzano, R., Spagnuolo, M., Medici, L., Tateo, F., and Ruggiero, P. (2005). “Zeolite synthesis from pre-treated coal fly ash
in presence of soil as a tool for soil remediation.” Appl. Clay Sci., 29, 99-110.
[22] Mishra, T., and Tiwari, S.K. (2006). “Studies on sorption properties of zeolite derived from Indian fly ash.” J. Hazard. Mater., 137(1), 299-303.
[23] Wu, D., Sui, Y., He, S., Wang, X., Li, C., and Kong, H. (2008). “Removal of trivalent chromium from aqueous solution by zeolite
synthesized from coal fly ash.” J. Hazard. [24] Mater., 155(3), 415-423.
[25] Kazemian, H., Naghdali, Z., Kashani, T.G., and Farhadi, F. (2010). “Conversion of high silicon fly ash to NaP1 zeolite:
Alkaline fusion followed by hydrothermal crystallization.” Adv. Powder Technol., 21(3), 279-283. [26] Jha, B., and Singh, D. N. (2013). “Synthesis of Higher Grade Fly Ash Zeolite X From Fly Ash via Three-Step Fusion.” Materials
Performance and Characterization, ASTM, 2(1), 285-295.
[27] Inada, M., Tsujimoto, H., Eguchi, Y., Enomoto, N., and Hojo, J. (2005). “Microwave-assisted zeolite synthesis from coal fly ash in hydrothermal process.” Fuel, 84(12), 1482-1486.
[28] Garcıa-Sánchez, A., Alastuey, A., and Querol, X. (1999). “Heavy metal adsorption by different minerals: application to the
remediation of polluted soils.” Sci. Total Environ., 242(1), 179-188. [29] Feng, D., Tan, H., and van Deventer, J. S. J. (2004). “Ultrasound enhanced geopolymerisation.” J. Mater.
Sci., 39, 571-580.
[30] Chunfeng, W., Jiansheng, L. I., Xia, S. U. N., Lianjun, W. A. N. G., and Xiuyun, S. U. N. (2009). Evaluation of zeolites synthesized from fly ash as potential adsorbents for wastewater containing heavy metals. J. Environ. Sci., 21(1), 127-136.
[31] Andaç, Ö, Tatlıer, M., Sirkecioğlu, A., Ece, I, and Erdem-Şenatalar, A. (2005). “Effects of ultrasound on zeolite A synthesis.”
Micropor. Mesopor. Mat., 79, 225-233. [32] Kim, W., Choi, D., and Kim, S. (2010). “Sonochemical Synthesis of Zeolite A from Metakaolinite in NaOH Solution.”
Mater. Trans., 51(9), 1694-1698.
[33] Belviso, C., Cavalcante, F., Lettino, A., and Fiore, S. (2011). “Effects of ultrasonic treatment on zeolite synthesized from coal
fly ash.” Ultrason. Sonochem., 18(2), 661-668.
[34] Belviso, C., Cavalcante, F., and Fiore, S. (2013). “Ultrasonic waves induce rapid zeolite synthesis in a seawater solution.”
Ultrason. Sonochem., 20(1), 32-36. [35] Park, M., Choi, C. L., Lim, W. T., Kim, M. C., Choi, J., and Heo, N. H. (2000). “Molten-salt method for the synthesis of zeolitic
materials: I. Zeolite formation in alkaline molten-salt system.” Micropor. Mesopor. Mat., 37, 81-89.
[36] Choi, C. L., Park, M., Lee, D. H., Kim, J., Park, B., and Choi, J. (2001). “Salt-Thermal Zeolitization of fly ash.” Environ. Sci. Technol., 35(13), 2812-2816.
[37] Apiratikul, R., and Pavasant, P. (2008). “Sorption of Cu2+
, Cd2+
, and Pb2+
using modified zeolite from coal fly ash.” Chem.
Eng. J., 144(2), 245-258.
[38] Itskos, G., Koutsianos, A., Koukouzas, N., and Vasilatos, C. (2015). Zeolite development from fly ash and utilization in lignite
mine-water treatment. Int. J. Miner. Process., 139,43-50. [39] Zhang, M., Zhang, H., Xu, D., Han, L., Niu, D., Zhang, L, Wu, W., and Tian, B. (2011b). “Ammonium removal from aqueous
solution by zeolites synthesized from low-calcium and high-calcium fly ashes.” Desalination, 277(1), 46-
53. [40] Visa, M., Isac, L., and Duta, A. (2012). “Fly ash adsorbents for multi-cation wastewater treatment.” Appl. Surf. Sci., 258(17), 6345-
6352.
a. Prasad, B., and Mortimer, R.J. (2011). “Treatment of acid mine drainage using fly ash zeolite.” Water Air Soil Poll., 218(1-4), 667-679.
[41] Cardoso, A.M., Horn, M.B., Ferret, L.S., Azevedo, C.M., and Pires, M. (2015b). “Integrated synthesis of zeolites 4A and NaP1
using coal fly ash for application in the formulation of detergents and swine wastewater treatment.” J. Hazard. Mater., 287, 69-77.
[42] Cardoso, A.M., Paprocki, A., Ferret, L.S., Azevedo, C.M., and Pires, M. (2015a). “Synthesis of zeolite NaP1 under mild conditions
using Brazilian coal fly ash and its application in wastewater treatment.” Fuel, 139, 59-67. [43] Doula, M.K., and Dimirkou, A. (2008). “Use of an iron-overexchanged clinoptilolite for the removal of Cu 2+ ions from heavily
contaminated drinking water samples.” J. Hazard. Mater., 151(2), 738-745. [44] Wang, C., Li, J., Sun, X., Wang, L., and Sun, X. (2009a). “Evaluation of zeolites synthesized from fly ash as potential adsorbents
for wastewater containing heavy metals.” J. Environ.Sci., 21(1), 127-136.
[45] Zhou, L., Chen, Y.L., Zhang, X.H., Tian, F.M., and Zu, Z.N. (2014). Zeolites developed from mixed alkali modified coal fly ash for adsorption of volatile organic compounds.” Mater. Lett., 119, 140-142.
[46] Wei, L., Chen, Y., Zhang, B., and Zu, Z. (2013). “Synthesis of highly selective zeolite topology molecular sieve for adsorption of
benzene gas.” Solid State Sci., 16, 39-44. [47] Nekhunguni, P.M., Tavengwa, N.T. and Tutu, H., 2017. Investigation of As (V) removal from acid mine drainage by iron (hydr)
oxide modified zeolite. Journal of environmental management, 197, pp.550-558.
[48] Zhong, L.S., Hu, J.S., Liang, H.P., Cao, A.M., Song, W.G. and Wan, L.J., 2006. Self‐Assembled 3D flowerlike iron oxide
nanostructures and their application in water treatment. Advanced Materials, 18(18), pp.2426-2431.
[49] Wang, P., Zhai, Y., Wang, D. and Dong, S., 2011. Synthesis of reduced graphene oxide-anatase TiO 2 nanocomposite and its improved photo-induced charge transfer properties. Nanoscale, 3(4), pp.1640-1645.
[50] Biesinger, M.C., Payne, B.P., Grosvenor, A.P., Lau, L.W., Gerson, A.R. and Smart, R.S.C., 2011. Resolving surface chemical states
in XPS analysis of first row transition metals, oxides and hydroxides: Cr, Mn, Fe, Co and Ni. Applied Surface Science, 257(7), pp.2717-2730.
[51] Dutta, S., Bhattacharyya, A., Ganguly, A., Gupta, S. and Basu, S., 2011. Application of response surface methodology for
preparation of low-cost adsorbent from citrus fruit peel and for removal of methylene blue. Desalination, 275(1-3), pp.26-36. [52] Beuckels, A., Smolders, E. and Muylaert, K., 2015. Nitrogen availability influences phosphorus removal in microalgae-based
wastewater treatment. Water research, 77, pp.98-106.
197

5th International Conference on Energy, Environment and Sustainable Development 2018 (EESD 2018)
[53] Ren, Z.A., Che, G.C., Dong, X.L., Yang, J., Lu, W., Yi, W., Shen, X.L., Li, Z.C., Sun, L.L., Zhou, F. and Zhao, Z.X., 2008.
Superconductivity and phase diagram in iron-based arsenic-oxides ReFeAsO1− δ (Re= rare-earth metal) without fluorine doping.
EPL (Europhysics Letters), 83(1), p.17002.
198

5th International Conference on Energy, Environment and Sustainable Development 2018 (EESD 2018)
Impact of Total Quality Management (TQM) Practices on
Sustainable Development
Asif Nawaz, Muhammad Saad Memon*, Sonia Irshad Mari, Miskeen Ali Gopang
Dept. of Industrial Engineering and Management, Mehran University of Engineering and Technology, Jamshoro, Pakistan
Abstract
The aim of this paper is to analyze the impact of total quality management (TQM) practices on the sustainable
performance of manufacturing industries. This study develops an integrated framework to analyze the relationship
between TQM and sustainable practices. An exploratory factor analysis was conducted to analyze the significance of
various TQM practices and their impact on sustainable performance. The findings revealed that the total quality
management and sustainable development are the most important approaches in the success of manufacturing industries.
From the findings, the study suggested the manufacturing industries should improve their quality management programs
and sustainable performance for the success of the company. The results generated the structure of the TQM and
sustainable development framework based on the major practice of the total quality management and sustainable
performance which helps in the success of the companies.
© 2018 “Asif Nawaz, Muhammad Saad Memon, Sonia Irshad Mari, Miskeen Ali Gopang” Selection and/or peer-review under responsibility of Energy and Environmental Engineering Research Group (EEERG), Mehran University of Engineering and Technology, Jamshoro, Pakistan.
Keywords: Total quality management (TQM), Sustainable development, sustainable performance, exploratory factor
analysis
1. Introduction
Quality is the considered a key factor in achieving the success of the business and it is more than ever important for
competing successfully in today’s worldwide market position [1]. Now a day’s quality management must play a major
role in the development of the business. Quality is a compulsory component in the production of goods and services for
the satisfaction of the customers. Quality is defined as circumstances that meet the needs of the customers, which is
measurable and achievable [2,3]. Total quality management is a firm-wide management thinking of continually
improving the quality of products by the focusing on the needs of the customer’s and their expectations to enhance the
satisfaction of the customers and firm performance [4]. Total Quality Management (TQM) is a process started by top
upper management to attain the involvement of employees in the continuous improvement of the performance of all
movement in the organization [5]. Total quality management is the finest way of running an organization to achieve
excellence. Total means everything in organization and quality means in the degree of excellence. Sustainable
development is the managing principle for convention human development aim while at similar time sustaining the
ability of natural systems to provide the natural resources and ecosystem service upon which economy and society
depend. TQM is considered the main aspect of the organization's success. To achieve sustainability goals, the three
aspects of the triple bottom line must be harmonized, integrated and balanced effectively [6]. The purpose of this study
is to determine the key practices of total quality management and their impact on Sustainable development. The aim of
* Corresponding author. Tel.: +92-333-2888606.
E-mail address: [email protected]
199

5th International Conference on Energy, Environment and Sustainable Development 2018 (EESD 2018)
this study is to analyze the implementation of TQM, and its impacts on sustainable practices. Based on the objectives of
the study, the following are the research questions:
1) Which practices of Total Quality Management are found to have the highest impact on sustainable development?
2) Is there is any relationship between TQM practices and sustainable development?
2. Literature Review
TQM has since the 1980s, become a worldwide management focus. The line of total quality management can be outlined
back to the early 1920s. The focus extended from quality of products to the quality of all issues within an organization
[7]. Total quality management is generally considered as a collective organization path for improving the quality of the
product and quality of the service [8]. The TQM focus on improved economic sustainability constitutes one area of
potential synergy [9]. Total Quality Management (TQM) is a concept designed to continuously improve the processes
of an organization as part of the management’s system [10]. The origin of the English word sustain is in the Latin words
sub (under, from below), and tenere (to hold, to hold up). To sustain, then, means to keep up, to maintain, to support, to
prevent from sinking or falling something. Sustainability is the ability to maintain or support an activity or process over
the long term [11]. TQM practices have positive relations with organizational performance [12]. Design optimization,
process optimization and product or service reliability by themselves are sources of quality advantage [13]. TQM is a
customer-focused approach aimed at meeting or exceeding customer expectations with regard to products or services
[14]. There are many perspectives and definitions of quality, which are supported by philosophical frameworks
developed in the past including Deming, Juran, and Crosby [17]. For many years, sustainable development was viewed
as irrelevant for benefit producing business. Traditional production organizations are starting to comprehend and seek
an after a corporate objective of sustainable development. While the term sustainable development is some degree
confusing and indefinable to production organization. Sustainable development is defined as that meets the requirements
of the present generation without compromising the ability of future generations to meet their own needs [18]. In
development of quality activities organizations have focusing on sustainability as mean of organizational development
in terms of organizations strategy [19]. The sustainable development gives a framework under which networks can
utilize assets effectively, make proficient infrastructures, protect and increase the quality of life, and make new
organizations to strengthen economies [20]. Sustainability is the considered one of the most important aspect in
determining growth and development. “Sustainability may be defined as sustaining excellently after a long, perhaps
even an indefinite period” and it is broadly measured one of the most important parts in the growth of the organization
[21]. Sustainable development generally consists of the three main pillars of sustainable development, environmental,
and socially sustainable development.There is a positive relationship between sustainable practices and better
performance of a company [22]. The association between TQM and organizational performance was studied by [23,24].
Table 1. Comparing earlier frameworks of TQM practices and sustainable practices
Research study TQM practices Sustainable development
practices
Area
Nguyen et
al.,(2018)
[21]
Top management
Commitment
Training &
Development
Service design
Process mgt:
Cont: improvement
Rewards
Economic performance
Social performance
Environmental
performance
Vietnam based enterprises
Khoja (2016)
[20]
Training
Process management
Customer focus
Leadership
Continuous
improvement
Creativity
Innovation
Recycling neutralizing
Biodiversity
Culture
Ethics
Libyan Higher Education
System
200

5th International Conference on Energy, Environment and Sustainable Development 2018 (EESD 2018)
Stakeholders
Harm material
Monday et
al,(2015)
[9]
Top Management
Commitment
Strategic planning
Customer focus
Employee involvement
Process management
Innovation
Poverty
Health
Land use
Biodiversity
Productivity
Oil and gas industries in
Nigeria
Mishra & Napier
(2015) [22]
Customer focus
empowerment
Team-based approach
Continuous
improvement
Communication and
Feedback
Environmental focus
Recycling
Disposal
Reuse
Process design
Enhancement of
awareness
Corrective action
Environment of organizations
Kaczmarski (2014)
[15]
Management
commitment
Work environment
change
Training and education
Continuous
improvement
Employee satisfaction
Stakeholders
Triple bottom line
Strategic management
Innovation and learning
Global organizations
E.P.O (2014)
[6]
Continuous
improvement
Teamwork
Change of culture
Total involvement
Training customer
focus
Environmental sustainable
development
Desertification
Environmental pollution in
organizations in Nigeria
Elhuni & Ahmad
(2014) [25]
Customer focus
Continuous
improvement
Top management
Commitment
Vision
Customer focus
Training & education
Process control
Information
technology
Social performance
Economic performance
Environmental
performance
Oil sector
Issakon (2006)
[23]
Top management
Commitment
Focus on the process
Continuous
improvement
Benchmarking
Process management
Employee focus
Stakeholder
Economic performance
Lifecycle
Environmental
performance
Social performance
Manufacturing organizations
Zairi & Ashari Customer satisfaction Sustainable performance Market-based
201

5th International Conference on Energy, Environment and Sustainable Development 2018 (EESD 2018)
[17] Customer orientation
Management
Commitment
Knowledge Learning
Market advancement
Customer satisfaction
Market orientation
Quality orientation
Revenue growth
This table shows the past studies related with the relationship between Total quality management and sustainable
development and their practices with the area of study. But this study shows these practices Top Management
Commitment, Customer focus Employee Focus Leadership, Continuous improvement Compensation Benchmarking,
Customer Satisfaction, Customer Relations, Service Quality, Training & Education, Employee involvement, Employee
Encourage are the important practices of TQM and cost management, research and development, limited
landfilling,pollution,lifecycle, resource consumption, public welfare,industrial health and safet, stakeholder trust are the
important factors of sustainable development in the manufacturing industries .
Fig. 1 . Factors of sustainable development
3. TQM Practices
The identification of factors affecting the successful total quality management implementation has recently come into
view as a significant research course [8,4,9]. The core theory of TQM has been developed from the leaders of quality
and examined the relationship between total quality management and performance [23,24]. Seventy-eight items were
studied, that was set into eight important total quality management practices [25]. Leadership, , employee management,
quality planning, , process management, customer orientation, , information, supplier management are general practices
which help with successful TQM implementation concern for the society and natural environment [26].Strategic quality
management, Top management commitment , process quality, training and education, benchmarking ,design quality
management, statistical process control are nine TQM practices developed by [27]. They all shared practices of
Leadership, Continuous improvement, Compensation Benchmarking Customer Satisfaction, Customer Relations
Service Quality Training & Education Employee Involvement Cost Management Research & Development Limited
Land Filing Pollution Life Cycle Resource Consumption Public Welfare Industrial Health & Safety Stakeholder Trust.
SOCIAL SUSTAINABLE
DEVELOPMENT
ENVIRONMENTAL
SUSTAINABEL DEVELOPMENT
ECONOMIC SUSTAINABELE DEVELOPMENT
SUSTAINABLE
DEVELOPMENTT
202

5th International Conference on Energy, Environment and Sustainable Development 2018 (EESD 2018)
Table 2. TQM and sustainable development practices defined by earlier literature
FACTORS SUBFACTORS AUTHORS
TQM practices
Top management
commitment
Leadership Damen,2017, Sadikoglu & Olcay,2013,
Ibrahim,2013, Tayeb,2008, Salaheldin,2009,
Feng et al,2006, Arshida & Agil,2013, Sila,2006,
Ahmad,2014, Khoja, 2016
Continuous
improvement
Fish,2015, Ukwuom et al,2014, Ibrahim,2013,
Lizarell,2016, Salaheldin, 2009, Khoja,2016,
Damen,2017, Cetindere et al,2015
Compensation
benchmarking
Behra & Gundersen (2001), Fish,2015,
Sila,2006, Milovanović,2014, Elhuni &
Ahmad,2014, WANJIKU,2015, Kasongo &
Moono,2010
Customer
Focus
Customer
Satisfaction
Ibrahim,2013, Fish,2015, Sila,2006, Lau&
Idris,2001, Damen, 2017, Zhang et al. (2000),
Customer
Relations
Zhang et al. (2000), Saraph et al. (1989), Sila &
Ebrahimpour (2002), Quazi et al. (1998)
Service Quality
Leppävaara,2012, Jørgensen & Nielsen,2013,
Ahmadabadi,et al ,2012
Employee Focus
Training&
Education
Sadikoglu & Olcay,2013, Ukwuom et al, 2014,
MAINA,2013, Gul et al,2012, McLean,2015,
Hoang,et al 2010, Sila,2006 , Milovanović,2014,
Elhuni & Ahmad,2014Idris,2011
Employee
involvement
Damen,2017,McLean,2015, Hoang,et al 2010,
Salaheldin,2009, Sila,2006, Milovanović,2014, ,
Kasongo & Moono,2010
Employee
Encourage
Wali et al. (2003) , Talib and Rahman
(2010),Salaheldin,2009, Idris,2011,Yusuf et al.
(2007)
Sustainable
development
Economic focus
Cost
Management
Elhuni & Ahmad,2014, Martens&
Carvalho,2016, Rasul & V,2003,
Diaz&Rodriguez,2016, Sebhatu.2008
Research &
Development
Elhuni& Ahmad,2014, Thirupathi &
Vinodh,2016, BASIAGO,1999, Sebhatu.2008,
Amr et al,2016, Tayouga & Gagne,2016
Limited
Landfilling
Amiril,2014, Peña,2015,Elhuni& Ahmad,2014,
Tayouga&Gagne,2016, Amr et al,2016,
Sebhatu,2008
Environment focus
Pollution Peña,2015,Sebhatu,2008, Amiril,2014, Elhuni&
Ahmad,2014, Thirupathi & Vinodh,2016
Life Cycle Amiril, 2014, Elhuni & Ahmad,2014,Diaz &
Rodriguez,2016, Tayouga & Gagne,2016
Resource
Consumption
Alone & Ahmad, 2014, Tayouga & Gagne,
2016,Sebhatu.2008, Amr et al,2016
Social focus
Public Welfare Elhuni&Ahmad,2014,Chen,2016,
Diaz&Rodriguez,2016,Zinik,2007
Industrial Health
& Safety
Martens&Carvalho,2016, Peña,2015,
Amiril,2014, Peña,2015,Elhuni& Ahmad,2014
Stakeholder Trust
Chen,2015, Isaksson,2006, Elhuni &
Ahmad,2014, Amiril,2014, Idris,2011
203

5th International Conference on Energy, Environment and Sustainable Development 2018 (EESD 2018)
3.1 Relationship between TQM and sustainability
Some studies have supported the notion that TQM and sustainable development have a positive relationship. The total
quality management focus on enhanced economic sustainability constitutes is one part of possible synergy [9].
Primary research indicated that there was a medium to a strong connection between TQM indicators and environmental
indicators.
4. Sustainable Performance
The sustainable performance is idea as an outcome of sustainable organization.Sustainable performance can be
illustrated as “the arrangement of its environmental, economic and social performance”. In this paper, the
sustainable performance is distinct as the reasonable performance among three positions, economic performance,
environmental performance and social performance.
5. Conceptual Model and Research Hypothesis
A literature review shows there is a wide consensus on the importance of TQM practices in the development of a total
quality culture. The conceptual model shows the important practices of total quality management and its effect on the
sustainable development of the organizations. Top Management Commitment, Customer focus Employee Focus
Leadership, Continuous improvement Compensation Benchmarking, Customer Satisfaction, Customer Relations,
Service Quality, Training & Education, Employee involvement, Employee Encourage are the important practices of
TQM.
204

5th International Conference on Energy, Environment and Sustainable Development 2018 (EESD 2018)
Fig. 2. The conceptual framework of TQM practices and sustainable development
TQM
Sustainable
development
Top
management
commitment
Customer
focus
Employee focus
Economical
focus
Environmenta
l focus
Social focus
Leadership
Continuous
improvement
Compensation
Benchmarking
Customer Satisfaction
Customer Relations
Service Quality
Training & Education
Employee involvement
Employee Encourage
Cost Management
Research & Development
Limited Land filing
Pollution
Life Cycle
Resource Consumption
Public Welfare
Industrial Health & Safety
Stakeholder Trust
205

5th International Conference on Energy, Environment and Sustainable Development 2018 (EESD 2018)
6. Analytical Framework
In this paper, a framework is produced to demonstrate the connection between Total quality management practices
and sustainable development,also defines the impacts of TQM practices on sustainable development.
Fig. 3. Analytical framework
7. Questionnaire Design and Data Source
In the process of designing questionnaire surveys, the literature analysis was studied to implement the study. First, we
composed questionnaires in the light of literature investigation.
8. Research Methodology
This is a descriptive research study explaining in detail the concepts, theories, and researches to identify the different
TQM practices implemented and their effect on sustainable development. A survey questionnaire method was used to
collect the data. The questionnaire aimed to identify critical success factors of TQM and sustainable development in
manufacturing industries. A total of 250 copies of the questionnaire were distributed to the employees working within
manufacturing industries (Karachi and Hyderabad) Sindh. Five-point Likert scales (strongly disagree, disagree, neutral,
agree, strongly agree) were used in the questionnaire. The questionnaire includes 50 statements to identify critical
success factors for the implementation of TQM.
Independent variables
TQM Practices
Leadership
Continuous improvement Compensation Benchmarking
Customer Satisfaction
Customer Relations Service Quality Training & Education Employee involvement
Employee encourages
Sustainable development
practices
Cost Management
Research & Development
Limited Land filing
Pollution
Life Cycle
Resource Consumption
Public Welfare
Industrial Health & Safety
Stakeholder Trust
Moderating factors
Type of industry
Firm’s size
Dependent variables
206

5th International Conference on Energy, Environment and Sustainable Development 2018 (EESD 2018)
8.1 Data collection
Data was collected by the extensive literature review. The primary data for the study was collected through the survey
method by using questionnaires. Total 70 responses was collected from manufacturing industries .The Questionnaire
survey was carried out to identify the significant factors and this will be carried out the improving the practices. The
data collected from relevant experts working in different organizations of (Karachi and Hyderabad) Sindh.
8.2 Data Analysis
The data obtained from the data collection methods were analyzed by the use of factor analysis. The data analyzed by
using the Statistical Package for the Social Sciences (SPSS). Descriptive statistics include mean, frequency, standard
deviation and percentages to profile sample characteristics and major patterns from the data.
8.3 Research method
The exploratory factor analysis (EFA) used to find factorial validity. EFA analysis shows accurately what was proposed
to be measured. It is used to identify the structure of the relationship between the variable and respondent.
8.4. Research tools
The results of the collected data were analyzed by SPSS and MS Excel 2013.
9. Results
Out of 250 questionnaires sent to the targeted sample, a total of 70 questionnaires were returned completed. Data
collected were analyzed by using the SPSS programme. The twenty-four practices in the survey were made on the Likert
scale. The 24 items of the questionnaire were intercorrelated and subjected to an exploratory factor examination (EFA)
was led by utilizing SPSS to distinguish the consider structure the variable. Every component of the structure was
deciphered as Likert-scale question.
Table 3. Principle Component Analysis
Initial Extraction
Leadership 1.000 .901
Continuous Improvement 1.000 .946
Comp Benchmarking 1.000 .890
Customer satisfaction 1.000 .977
Customer relations 1.000 .957
Service 1.000 .914
Training 1.000 .931
Involvement 1.000 .956
Encouragement 1.000 .954
Cost management 1.000 .783
Research & development 1.000 .977
Limited landfilling 1.000 .987
Pollution 1.000 .984
Life cycle 1.000 .973
Resource consumption 1.000 .990
Health & safety 1.000 .586
Stakeholder trust 1.000 .981
207

5th International Conference on Energy, Environment and Sustainable Development 2018 (EESD 2018)
9.2 Factor Extraction
Factor analysis with principal element extraction was performed on the twenty-four administration hones things to
decide the number of components. Other than utilizing the scree plot as a manual to choosing the number of elements
to be extricated.
Table 4. Eigenvalues and % of total variance clarified of TQM and sustainable development
Total Variance Explained
Compone
nt
Initial Eigenvalues
Extraction Sums of Squared
Loadings
Total
% of
Variance
Cumulati
ve % Total
% of
Variance
Cumulative
%
1 10.195 59.971 59.971 10.195 59.971 59.971
2 2.289 13.466 73.438 2.289 13.466 73.438
3 2.047 12.041 85.478 2.047 12.041 85.478
4 1.157 6.805 92.284 1.157 6.805 92.284
5 .947 5.569 97.853
6 .179 1.055 98.908
7 .157 .923 99.831
8 .029 .169 100.000
9 1.130E-15 6.650E-15 100.000
10 4.497E-16 2.645E-15 100.000
11 7.626E-17 4.486E-16 100.000
12 -3.272E-17 -1.925E-16 100.000
13 -5.794E-17 -3.408E-16 100.000
14 -4.424E-16 -2.602E-15 100.000
15 -6.618E-16 -3.893E-15 100.000
16 -8.746E-16 -5.144E-15 100.000
-1.675E-15 -9.851E-15 100.000
208

5th International Conference on Energy, Environment and Sustainable Development 2018 (EESD 2018)
Extraction Method: Principal Component Analysis.
.
Fig. 3. Using the scree plot as a guide to choose on the number of elements to be extracted
Table 5. Components extracted Component Matrix
Component
1 2 3 4
Leadership .548 -.413 .333 -.565
Cont. Improvement .888 -.002 -.379 -.121
Comp
Benchmarking .575 -.180 .633 .356
Customer
satisfaction .958 -.018 .135 -.203
Customer relations .817 -.400 -.013 .360
Service .928 -.202 .087 .074
Training .954 .044 -.004 .135
Involvement .869 -.095 .265 -.348
Encouragement .952 -.203 -.072 .036
Cost management .438 .120 -.760 -.008
Research&
development .958 -.018 .135 -.203
Limited landfilling .177 .638 .737 .080
Pollution .467 .860 .028 .159
Lifecycle .778 .556 -.133 -.201
Resource
consumption .890 .338 -.102 .272
Health & safety .627 .244 -.321 -.173
Stakeholder trust .780 -.434 -.145 .403
209

5th International Conference on Energy, Environment and Sustainable Development 2018 (EESD 2018)
According to the column I the continuous improvement, customer satisfaction, customer relations, service quality,
training, employee involvement, employee encouragement are the main practices which have impacts on sustainable
development. The last part of the yield is a relationship matrix among the factor (SPSS). This matrix includes the
correlation coefficient among practices. The results show continuous improvement, customer satisfaction, customer
relations, service quality, training, employee involvement, employee encouragement are the main practices of TQM and
sustainable development which have high value.
10. Discussion and Findings
The study outcomes show that total quality management practices have major impacts on dimensions of sustainable
development. It comes into view that TQM practices have a more considerable impact on environmental, social and
economic performance. A framework was established to find the impact of total quality management practices on
sustainable development. This literature review of the study determines the impact of total quality management practices
on sustainable development and describe the co-relation of TQM and sustainable development practices. The main
practices of total quality management are continuous improvement, customer satisfaction, customer relations, service
quality, training, employee involvement, employee encouragement which has a high impact on the sustainable
development and it is found that these practices have a specific relation to the sustainable development. In summary, it
is obvious that the implementation of total quality management can have surprising advantages to organizations. The
findings also revealed that in the pursuit of sustainable development brings about added value to customers by making
the organizations paying attention to satisfying customer’s needs, while employee involvement and training allow
employees for the continuous improvement of the organization.
11. Conclusion
The past and present study observed that quality could be attained if management is intense and motivates employees
to achieve quality and fulfill the customers for flourishing and business achievement. The conclusions of the study
revealed the importance of the implementation of quality. Total quality management is a continuous process of
incremental improvements. It gives the organization an aggressive edge. This research decides the success practices
essential for the implementation of TQM at different manufacturing industries. A wide review of TQM and sustainable
literature, quality models, and other quality management research results, expose 6 main practices with 18 sub-practices
were defined as a successful practice and considered in the questionnaire. A factor analysis was carried out on the
collected information was used. This helps in to achieve the research questions of our study. The results of the study
visibly show that continuous improvement, customer satisfaction, customer relations, service quality, training, employee
involvement, employee encouragement are the main practices of total quality management which impacts on SD and
also find significant relation on the sustainable development.
12. Acknowledgments
We would like to express our thanks and gratitude for our supervisor for his positive and supportive guidance. Last but
not least I want to thank my family and friends for their support and encouragement.
12. References [1] A. F. Nielsen and K. B. Jørgensen, “The effects of TQM Critical Success Factors on Organizational Performance An empirical study on small
and medium-sized Danish manufacturing companies,” p. 73, 2013. [2] A. Rangone, “Linking organizational effectiveness, key success factors and performance measures: An analytical framework,” Manag.
Account. Res., vol. 8, no. 2, pp. 207–219, 1997.
[3] B. Aquilani, C. Silvestri, and A. Ruggieri, “Sustainability, TQM and Value Co-Creation Processes: The Role of Critical Success Factors,” Sustainability, vol. 8, no. 10, p. 995, 2016.
[4] D. T. Hoang, B. Igel, and T. Laosirihongthong, “Total quality management (TQM) strategy and organisational characteristics: Evidence from
a recent WTO member,” Total Qual. Manag. Bus. Excell., vol. 21, no. 9, pp. 931–951, 2010. [5] E. Sadikoglu and H. Olcay, “The effects of total quality management practices on performance and the reasons of and the barriers to TQM
practices in turkey,” Adv. Decis. Sci., vol. 2014, 2014.
[6] E.P.O “Total Quality Management for Sustainable Development : A Case of the Nigerian Environment Author ’ s Details :,” no. 5, pp. 1–17, 2014.
[7] F. Abusa, “TQM implementation and its impact on organisational performance in developing countries : a case study on Libya,” 2011
210

5th International Conference on Energy, Environment and Sustainable Development 2018 (EESD 2018)
[8] G. O. Tasie, “An Exploratory Review of Total Quality Management and Organizational Performance,” Int. J. Bus. Law Res., vol. 4, no. 1, pp. 39–45, 2016.
[9] I. Journal and S. Development, “total quality management and customers satisfaction in selected service ind ....,” no. February 2016, 2015
[10] I. Sila, “Examining the effects of contextual factors on TQM and performance through the lens of organizational theories: An empirical study,” J. Oper. Manag., vol. 25, no. 1, pp. 83–109, 2007
[11] J. A. Dipalma and D. A. Gremse, “Chronic constipation in children: Rational management,” Consultant, vol. 41, no. 13, pp. 1723–1732, 2001.
[12] K. Clement, C. Kasongo, and M. Moono, “Factors that lead to a successful TQM implementation : a Case Study on the Zambian Tourism Industry,” 2010.
[13] Chen, “Sustainability and company performance : Evidence from the manufacturing industry,” 2015.
[14] M. Oganga, “the Relationship Between Working Capital Management and Profitability of Small and Medium Enterprises in Nairobi County, Kenya By a Research Project Submitted in Partial Fulfillment of the Requirements for the Award of the Degree of Master of Business Ad,” no.
November, 2015.
[15] M. Jasiulewicz-Kaczmarek, “Is Sustainable Development an Issue for Quality Management?,” Found. Manag., vol. 6, no. 2, 2014.
[16] M. M. Yusr, “Innovation capability and its role in enhancing the relationship between TQM practices and innovation performance,” J. Open
Innov. Technol. Mark. Complex., vol. 2, no. 1, p. 6, 201 [17] M. Idris-Ashar and M. Zairi, “Achieving Sustainable Performance Through TQM and Market Orientation: A Proposed Framework for
Empirical Investigations,” Int. J., vol. 2, no. 2, pp. 1–33, 2004.
[18] M. ul Hassan, A. Mukhtar, S. U. Qureshi, and S. Sharif, “Impact of TQM Practices on Firm ’ s Performance of Pakistan ’ s Manufacturing Organizations,” Int. J. Acad. Res. Bus. Soc. Sci., vol. 2, no. 10, pp. 232–259, 2012.
[19] M. M. Arshida and S. O. Agil, “Critical Success Factors for Total Quality Management Implementation Within the Libyan Iron and Steel
Company,” Iss& Mlb, pp. 254–259, 2013. [20] Mabrouka Khoja “The Development of a Sustainable Quality Management Framework for Libyan Higher Education System This thesis is
submitted in partial fulfilment of the requirements of De Montfort University for the award of Doctor of Philosophy Supervised b,” 2016.
[21] Minh Hue Nguyen 1,2,* ID , Anh Chi Phan 1 and Yoshiki Matsui," Contribution of Quality Management Practices to Sustainability Performance of Vietnamese Firms",Article Sustainability 2018, 10, 375,2018.
[22] R. Mishra and R. Napier, “Linking Sustainability to Quality Management and Firm Performance,” Int. J. Bus. Manag., vol. 10, no. 3, pp. 1–14,
2015. [23] R. Isaksson, “Total quality management for sustainable development: Process based system models,” Bus. Process Manag. J., vol. 12, no. 5,
pp. 632–645, 2006.
[24] R. Agrawal and J. Tiwari, “The Integration of Quality Management and Environmental Management - A Review,” pp. 9–13, 2014. [25] R. M. Elhuni and M. M. Ahmad, “An empirical study of TQM and its effect on the organizational sustainability development: A successful
model for implementation,” FAIM 2014 - Proc. 24th Int. Conf. Flex. Autom. Intell. Manuf. Capturing Compet. Advant. via Adv. Manuf. Enterp.
Transform., vol. 8, no. 1, pp. 1109–1117, 2014. [26] S. Qureshi and S. Sharif, “Impact of TQM Practices on Firm ’ s Performance of Pakistan ’ s Manufacturing Organizations Dr . Masood ul
Hassan,” no. November, 2012.
[27] T. A. Joiner, “Total quality management and performance The role of organization support and co-worker support,” no. February, 2016 [28] V. Siva, I. Gremyr, B. Bergquist, R. Garvare, and T. Zobel, “Accepted Manuscript,” 2016.
211

5th International Conference on
Energy, Environment and Sustainable Development 2018 (EESD 2018)
Utilization of Nagarparker Kaolin Purification Plant Waste Material
as Value Added Product
Uzair Ahmed Kolachi, Suhail A. Soomro, Shaheen Aziz, Muzamil H. Memon
Department of Chemical Engineering Mehran University of Engineering & Technology Jamshoro Sindh Pakistan
Abstract
Kaolin is used as an industrial mineral in a wide range of industries. Kaolin is mined from the mining sites & purified
to remove the impurities as per its end use; ranging from the paint industry to ceramics & cosmetics to medical
applications. There is a sufficient quantity of residue is left during the purification process that apparently has no use
and is thrown away. In Nagarparker and Swat, Pakistan, there are huge deposits of Kaolin in Nagarparker, the residue
left is of no use and thrown away near the processing plants. The main focus of the researchers is on the effective
utilization of residue left as waste and converts it into a useful product. Silica Aerogel is one of the products that can be
synthesized from kaolin residue. It is a synthetic porous, light in weight, low density and low thermal conductivity
material produced from silica gel. Due to low chemical reactivity, low thermal conductivity, high surface areas, they
exhibit vast applications in various areas such as the Cherenkov emitters, space science, and super insulating medium.
In the current research, Silica Aerogel was synthesized by employing the sol-gel process. The main focus was on the
impacts of various factors such as calcination, SiO2/Na2CO3 ratios, and alkalinity and aging times.
© 2018 Uzair Ahmed kolachia, Suhail A. Soomrob, Shaheen Azizc, Muzamil H. Memond Selection and/or peer-review under responsibility of Energy and Environmental Engineering Research Group (EEERG), Mehran University of Engineering and Technology, Jamshoro, Pakistan.
Keywords: “Kaolin, waste material, silica gel, aerogel, sol-gel method, adsorbent, value-added product;”
1. Introduction
Kaolin is also known as China Clay. Kaolin is mineral consists of two basic elements “oxides of aluminum and silicate’’
and its molecular formula is (Al2O3-2SiO2-2H2O), and it is derived from Kaolinite mineral comes from the Earth’s Crust.
Historically traces back that it was firstly found in China hence known as China Clay. It is formed by hydrothermal
weathering of feldspar ten to hundred millions of years ago [1,2,3,4]. Pakistan Mineral Development Corporation
explored the kaolin reserves in the period of 1976-1979. Nagar Parker Kaolin reserves were estimated 3.634 million
tons [5], after being carried out number of Bulk Sampling, Physical tests and Chemical analysis [6].
China Clay possesses excellent characteristics such as whiteness, viscosity, chemically inertness and non-abrasiveness.
All these properties make kaolin suitable and widely applicable for variety of applications; some of which are given as,
thermal paper, calcined kaolin, Paper, paints and coating, agricultural, electric wire and cables, plastic and rubber
industry, construction industry [7]. USA had the largest kaolin reserves. Uzbekistan is the second largest contributor of
kaolin and other producers are listed in table.1 given below.
* Corresponding author. Tel.: +92-313-2754664
E-mail address: [email protected]
212

5th International Conference on
Energy, Environment and Sustainable Development 2018 (EESD 2018)
Table 1. Major Producers of Kaolin in world-2010
Country Production in Thousand Metric Tonnes
United States 5,700
Uzbekistan 5,550
Germany 3,250
Czech Republic 2,950
Brazil 2750
Kaolin found in Pakistan is quite comparable with other countries of the kaolin deposits. The chemical composition of
raw kaolin of Nagar Parkar ranges from 48.7% to 59.2% of silica while ideal content of silica is (46.1%) which is little
higher than ideal one. Silica content is abbreviated to (45.1%) by washing. Similarly, the Alumina content in Pakistani
kaolin ranges between 21.3-26.8%, which is little lower than the ideal one (39.5%). But by washing the raw kaolin, the
Alumina content is increased up to 35.1% which is again closer to the ideal one [6]. Silica gel is an amorphous, porous,
vitreous, granular form of silica dioxide (SiO2) manufactured synthetically from sodium silicate. It is a naturally
occurring mineral which can be processed and optimized into desired shape and size. Silica gel having average size of
24 Armstrong can be utilized as an absorbent. Silica gel possesses unique absorption capability and it can absorb as
much as 40% of its weight. Because of which it can be utilized in numerous applications.
The residue from kaolin purification plant is found rich in silica about 92% which is the most desirable raw material for
the synthesis of silica gel. To prepare silica gel with the utilization of residue from kaolin is most viable and inexpensive
as compared to other raw materials such as rice husk ash, coal ash, by using sol-gel method. The chemical composition
of kaolin residue is 92.72% SiO2, 3.42% Al2O3, 0.71% Fe2O3 and Other oxides. [8]. Silica gel can be manufactured from
other industrial wastes (by-product) such as bagasse ash, husk ash, fly ash which are chief source of silica. The silica
gel obtained from these industrial by-products exhibits variation both in characteristics and properties because the nature
of raw materials depending on the parent industry. [9].
It was studied that precipitated silica obtained from metasilicate solution using HCL. He determined that obtained
precipitated silica has a specific surface area between 120–260 m2/g [10,11]. The effect of pH on the formation of
bimodal porous silica (BPS) from rice husk ash and has a high specific surface area. In this work, efforts had been made
to study the synthesis of silica gel. In order to achieve the objective, various parameters were studied. The parameters
are calcination, ratio of kaolin residue to Na2CO3, behavior of product at various pH value. The product obtained was
determined by employing different analytical techniques such as XRD, FTIR and SEM.
2. Experimental Work
2.1 Separation of Kaolin & by Product from raw Kaolin
In this study the kaolin used was PKR-13, 1kilogram of kaolin was dissolved in two liters of demineralized water under
continuous stirring for an hour. The mixture was then allowed to settle down the course material on bottom of container
and the separation of the top layer of kaolin was carried out in another container and repeating the whole practice several
times to achieve pure kaolin by-product and free of kaolin powder. About 400 gm of kaolin by-product is obtained from
1 kilogram of Kaolin (PKR-13).
2.2 Pre-treatment of Kaolin by Product (Residue)
The residue obtained from kaolin was treated with sulfuric acid to illiminate iron oxide from the material. For the
removal iron oxide 250gm of kaolin by product was washed, dried and mixed with 500 ml of 4M solution of H2SO4 and
the mixture was stirred with magnetic stirrer for whole night at room temperature. After acid treatment material obtained
was rinsed with sufficient quantity of demineralized water and dried at 105 oC for 24 hours in forced convection oven.
The dried material obtained was sieved to 200 microns [12]
213
5th International Conference on
Energy, Environment and Sustainable Development 2018 (EESD 2018)
2.3 Calcination of Kaolin by Product mixture
Weighed amount of SiO2 and Sodium Silicate was mixed. The mixture was than calcined in muffle furnace. In muffle
furnace, the material was allowed to react at a high temperature (850 oC) for two hours, where a chemical reaction
between SiO2 and Na2CO3 took place to produce sodium silicate as shown in chemical equation (1) Then material was
then left in open atmosphere for cooling.
3SiO2+Na2CO3⟹ 3SiO2. Na2O+CO2↑ (1)
The product; sodium silicate was sieved to obtained 100micron particle size for further processing [13]. Through
calcination at high temperature less reactive kaolin residue was converted into more reactive form with the addition of
certain ratio of sodium carbonate.
2.4 Kaolin residue & Sodium carbonate ratio
A varying amount of kaolin residue was calculated and mixed with different amount of sodium carbonate to obtain
mixture with varying ratios of kaolin residue to Na2CO3 (i.e. 1,3). The mixture was put in muffle furnace at 850 oC for
two hours to be calcinized. The material was allowed to remain within furnace until it was cooled to room temperature.
The chemical bonds between Si-O-Si and Si-O-Al were being broken if sodium carbonate was mixed with calcinizing
material, and chemical reactions are given below. If Na2CO3 is mixed and heated. The kaolinite was transformed to
reactive products of NaAlSiO4 and NaSiO3. The chemical reactions of the kaolin and Na2CO3 mixture in
3SiO2+Na2CO3⟹ 3SiO2. Na2O+CO2↑ (1)
The traces of Al4Si4O10 in vitreous material reacts with Na2CO3 as shown in equation (2);
Al2O3 ∙ 2SiO2 ∙ 2H2O + Na2CO3 → 2NaAlSiO4 + 2H2O ↑ +CO2 (2)
Adequate amount of sodium silicate is essential for accomplishing complete reactions as shown in above equation (2),
but superfluous Na2CO3 in mixture remains intact as an impurity so, it is necessary to acknowledge its right amount to
be used [17].
2.5 Neutralization of Vitreous Material
Succeeding to the grounding, the resultant product obtained from the calcination usually called vitreous material a
quantity of (10gm) was allowed to dissolve in 250ml of demin water (50 oC) to form hydrated sodium silicate. The pH
of hydrated sodium silicate solution was measured with pH meter under continuous stirring at room temperature. The
vitreous material obtained after calcination was observed basic in nature and its pH was measured about “pH=12.09” of
sample with molar ratio n=1 and pH for sample with molar ratio n=3 was measured “pH=11.5” [19].Now three samples
were formed from each sample with molar ratio (n=1,3) so as to form sample of specific pH (i.e. pH=2, 6, 8) required
for further study. Total six samples were formed from these two ratios. Each sample were tagged with specific name
and pH. The pH of each sample was firstly measured to know its original pH either it is acidic in nature or basic in
nature. It was seen in all six samples that they were basic in nature and pHs were around 11.00-12.09.
2.6 Aging Time
Succeeding to alkalination next step was aging the sol gel. Sol gel was soaked in water bath with demineralized water
and it was changed after every six hours and this practice was repeated for 24 hours. The main purpose of aging sol gel
to promote the structural network of the gel and making the gel free from left cationic contaminations [21]. After aging
of silica sol, drying was carried out in an oven at 105 oC for 24 hours.
214

5th International Conference on
Energy, Environment and Sustainable Development 2018 (EESD 2018)
3. Result and Discussion
3.1 Characterization of kaolin by-product
The XRD of kaolin by-product was performed in which X-ray patterns shows peak of quartz prevailing 2θ at point 27.
Other peaks observed 2θ at 22, 37, 51,60, which is also characteristics of quartz and these peaks confirm the siliceous
nature of kaolin by-product.
Fig. 1. XRD Graph of Kaolin By-Product
3.2 Characterization of Sol-Gel
Analysing of Sol-Gel through FTIR as shown in Fig. 2., FTIR spectrum of precipitate sol-gel formed at various pH
values 2, 6, and 8. The spectra pattern are alike and shows low peaks at IR band at 4450 cm-1 with reference to hydrogen
bond with silanol group physically held water molecules [22]. Similarly, the IR band observed at 4260 cm-1 is because
of to and fro motion of water molecules.
The bold and broad IR band at 4375 cm-1 with a linked branch at 3900 cm-1 is normally allotted to transverse-optic and
longitudinal varying optic modes such ‘transverse and longitudinal’ of the Si–O–Si unsymmetrical full extent vibrations
[23]. The IR band could be allotted to silanol groups at 950 cm -1. In case of alkali silicate materials Si-O- asymmetric
stretching vibrations is assigned to this band. This band becomes more intensify as pH increases. The availability of OH
group on the SiO2 surface has been undoubtedly confirmed by several research data and analysis [33]. IR bands at points
1050 cm-1, 3370 cm-1, 4050 cm-1 are due to Si–O–Si, O–Si–O, and O–Si–O symmetric stretching vibrations respectively.
10 20 30 40 50 60 70
0
100
200
300
400
500
600
700
800
Kiolin By Product
inte
sity
2 theta
Quartz
Muscovite
215

5th International Conference on
Energy, Environment and Sustainable Development 2018 (EESD 2018)
Fig. 2. FTIR spectra For Sol-Gel preparation at different pH (2, 6, and 8)
As it can be seen in Fig. 3. XRD spectra do not exhibits any vivid peaks from which it can be easily confirmed that sol-
gel obtained is not crystalline, but it is amorphous in nature [18]. XRD patterns exhibits wide bands and low intensity
at 2θ 3010 for pH value 2 and at 2θ 2510 for the sol-gel formed at pH values 6 and 8 as shown in Fig. 3 [9]. formed
amorphous SiO2 by using the sol-gel method, and it was subjected to thermally treated, then determined it using the
Rietveld refinement. In this work, an amorphous peak was centered at 2θ at 270.
Fig. 3. XRD pattern of silica gel samples prepared at pH 2, 6 and 8.
In order to investigate the form and structure of porous the silica gel prepared with sol gel method and the kaolin by
product used for this study have been characterized with element scanning microscope (SEM) which magnifies the
product at different magnifications as shown in Fig. 4. The gel sample exhibits great number of pores which looks like
a sponge. The large particle sized investigated by SEM is 2-3 micro meter on average. They make prominent particular
216

5th International Conference on
Energy, Environment and Sustainable Development 2018 (EESD 2018)
morphology and texture for given material.
Fig. 4. SEM micrographics of filtered and dried SiO2 gel obtained (pH 2) at different optical magnifications, (a) x 5000 and (b) x1000
4. Conclusion
This research was intended to exploit indigenous Thar Parkar Kaolin by-product for the synthesizing of silica gel which
is discovered to be outstanding for the purpose of manufacturing of high-quality glass wares. In addition to this siliceous
by-product of Thar Parkar kaolin found ideal for the formation of sodium silicate which is the precursor in synthesis of
silica gel which in turn is used in preparation of high-quality glass wares. The silica gel is obtained by neutralizing
diluted sodium silicate with 2M HCL solution.
In this work, the structure of the silica gel obtained was determined by different analytical techniques. The results
obtained exhibits that silica gel is amorphous in nature which is suitable for glass ware preparation. The filtered and
powder silica gel obtained at pH 2 reached a specific surface area as high as 470.2 m2/g which is closer to the specific
surface area ‘477.9 m2/g’ of the Algerian siliceous by-product of kaolin studied. These characteristics exhibits a great
adsorption capacity and high porous texture. The X-ray diffraction spectra does not highlight a well-defined crystalline
structure which means obtained product (silica gel) is amorphous in nature.
Acknowledgements
The authors acknowledge the Department of Chemical Engineering, Mehran University of Engineering and Technology,
Jamshoro for providing the research facilities.
References
[1]. Dixon, J.B., 1989. Kaolin and serpentine group minerals. Minerals in soil environments, (mineralsinsoile), pp.467-525.
[2]. Kakali, G., Perraki, T.H., Tsivilis, S. and Badogiannis, E., 2001. Thermal treatment of kaolin: the effect of mineralogy on the pozzolanic activity. Applied clay science, 20(1-2), pp.73-80.
[3]. Ross, C.S. and Kerr, P.F., 1930. THE KAOLIN MINERALS 1. Journal of the American Ceramic Society, 13(3), pp.151-160.
[4]. Giese, R.F., 1988. Kaolin minerals; structures and stabilities. Reviews in Mineralogy and Geochemistry, 19(1), pp.29-66. [5]. Hu, W., Li, M., Chen, W., Zhang, N., Li, B., Wang, M. and Zhao, Z., 2016. Preparation of hydrophobic silica aerogel with kaolin dried at
ambient pressure. Colloids and Surfaces A: Physicochemical and Engineering Aspects, 501, pp.83-91.
[6]. Mineral Commodity Summaries 2011. Rep. 2011 ed. Reston, VA: U.S. Geological Survey, 2011. [7]. Brahmi, D., Merabet, D., Belkacemi, H., Mostefaoui, T.A. and Ouakli, N.A., 2014. Preparation of amorphous silica gel from Algerian
siliceous by-product of kaolin and its physico chemical properties. Ceramics International, 40(7), pp.10499-10503.
a b
217

5th International Conference on
Energy, Environment and Sustainable Development 2018 (EESD 2018)
[8]. Musić, S., Filipović-Vinceković, N. and Sekovanić, L., 2011. Precipitation of amorphous SiO2 particles and their properties. Brazilian journal
of chemical engineering, 28(1), pp.89-94. [9]. Vázquez-Durán, A., Araujo-Andrade, C., Castañón, G.M., Ortega-Zarzosa, G., Ruiz, F. and Martínez, J.R., 2006. Spectral characterization
of chlorophyll fluorescence in extract of barley leaves embedded in silica xerogel matrix. Journal of sol-gel science and technology, 39(3),
pp.223-227. [10]. Jesionowski, T., 2002. Characterization of silicas precipitated from solution of sodium metasilicate and hydrochloric acid in emulsion
medium. Powder technology, 127(1), pp.56-65.
[11]. Witoon, T., Chareonpanich, M. and Limtrakul, J., 2008. Synthesis of bimodal porous silica from rice husk ash via sol–gel process using chitosan as template. Materials letters, 62(10-11), pp.1476-1479.
[12]. Zhuravlev, L.T., 2000. The surface chemistry of amorphous silica. Zhuravlev model. Colloids and Surfaces A: Physicochemical and
Engineering Aspects, 173(1-3), pp.1-38. [13]. Ismail, S., Husain, V., Hamid, G. and Bilal, M., 2015. Physico-chemical characteristics of Nagar Parkar kaolin deposits, Thar Parkar district,
Sindh, Pakistan. Journal of Himalayan Earth Science, 48(1).
[14]. Sdiri, A., Higashi, T., Bouaziz, S. and Benzina, M., 2014. Synthesis and characterization of silica gel from siliceous sands of southern Tunisia. Arabian Journal of Chemistry, 7(4), pp.486-493.
[15]. Siddiqui, M.A. and Ahmed, Z., 2005. Mineralogy of the Swat kaolin deposits, Pakistan. Arabian Journal for Science and Engineering, 30(2),
pp.195-218. [16]. Prassas, M., 1981. Synthese Des Gels Du Systeme SiO2-Na2O Et Des Gels Monolithiques De Silice: Etude De Leur Conversion En Verre
(Doctoral dissertation).
[17]. Malkani, M.S., Mahmood, Z., Shaikh, S.I., Arif, S.J. and Alyani, M.I., 2017. Mineral Resources of Sindh, Pakistan. Geological Survey of Pakistan, Information Release, 994, pp.1-38.
[18]. Hyeon-Lee, J., Beaucage, G. and Pratsinis, S.E., 1997. Aero-Sol− Gel Synthesis of Nanostructured Silica Powders. Chemistry of materials,
9(11), pp.2400-2403. [19]. Chen, S., Li, W., Wu, J., Jiang, Q., Tang, M., Shutts, S., Elliott, S.N., Sobiesierski, A., Seeds, A.J., Ross, I. and Smowton, P.M., 2016.
Electrically pumped continuous-wave III–V quantum dot lasers on silicon. Nature Photonics, 10(5), p.307.
[20]. Akolekar, D., Chaffee, A. and Howe, R.F., 1997. The transformation of kaolin to low-silica X zeolite. Zeolites, 19(5-6), pp.359-365. [21]. Stöber, W., Fink, A. and Bohn, E., 1968. Controlled growth of monodisperse silica spheres in the micron size range. Journal of colloid and
interface science, 26(1), pp.62-69.
[22]. Salabat, A., Barati, A. and Banijamali, N., 2011. Synthesis and characterization of the Pt/SiO2 nanocomposite by the sol-gel method. Journal of Nanostructures, 1(1), pp.1-6.
[23]. Tsai, M.S., 2004. The study of formation colloidal silica via sodium silicate. Materials Science and Engineering: B, 106(1), pp.52-55.
[24]. Martínez, J.R., Palomares-Sánchez, S., Ortega-Zarzosa, G., Ruiz, F. and Chumakov, Y., 2006. Rietveld refinement of amorphous SiO2 prepared via sol–gel method. Materials letters, 60(29-30), pp.3526-3529.
[25]. Dong, W., Li, W., Yu, K., Krishna, K., Song, L., Wang, X., Wang, Z., Coppens, M.O. and Feng, S., 2003. Synthesis of silica nanotubes from
kaolin clay. Chemical Communications, (11), pp.1302-1303. [26]. Acimovic, Z., Pavlovic, L., Trumbulovic, L., Andric, L. and Stamatovic, M., 2003. Synthesis and characterization of the cordierite ceramics
from nonstandard raw materials for application in foundry. Materials Letters, 57(18), pp.2651-2656. [27]. Mignoni, M.L., Petkowicz, D.I., Machado, N.R.F. and Pergher, S.B., 2008. Synthesis of mordenite using kaolin as Si and Al source. Applied
Clay Science, 41(1-2), pp.99-104.
[28]. Cao, H.Q., Xu, Y., Hong, J.M., Liu, H.B., Yin, G., Li, B.L., Tie, C.Y. and Xu, Z., 2001. Sol–gel template synthesis of an array of single crystal CdS nanowires on a porous alumina template. Advanced Materials, 13(18), pp.1393-1394.
[29]. Chong, M.N., Vimonses, V., Lei, S., Jin, B., Chow, C. and Saint, C., 2009. Synthesis and characterisation of novel titania impregnated
kaolinite nano-photocatalyst. Microporous and Mesoporous Materials, 117(1-2), pp.233-242. [30]. Zhang, D., Zhou, C.H., Lin, C.X., Tong, D.S. and Yu, W.H., 2010. Synthesis of clay minerals. Applied Clay Science, 50(1), pp.1-11.
[31]. Castelein, O., Soulestin, B., Bonnet, J.P. and Blanchart, P., 2001. The influence of heating rate on the thermal behaviour and mullite formation
from a kaolin raw material. Ceramics International, 27(5), pp.517-522. [32]. Chen, C.Y., Lan, G.S. and Tuan, W.H., 2000. Microstructural evolution of mullite during the sintering of kaolin powder compacts. Ceramics
International, 26(7), pp.715-720.
[33]. Wu, J., Lin, J., Zhou, M. and Wei, C., 2000. Synthesis and properties of starch‐graft‐polyacrylamide/clay superabsorbent composite.
Macromolecular Rapid Communications, 21(15), pp.1032-1034.
218

5th International Conference on Energy, Environment and Sustainable Development 2018 (EESD 2018)
A Revitalization of traffic management Plan and the impacts of Hawker in Saddar bazaar Karachi
Furqan javeda, Sania Rehman Memon b
DUET, Architecture department, Karachi and 75300, Pakistan MUET, Architecture Department, Hyderabad and 71000, Pakistan
Abstract
The urban economy in any society represents primarily the use generating sources the formal organized and also the informal unorganized sector. In most Asian country cities, the urban poor survive by operating within the informal sector. For these urban poor, street vendition is a method of earning a living. However, few hawkers live close to their place of labor and travel long distances by bus or two-wheelers. It is true that hawker’s encroachment reduce the area vacant for walkers and travelers, which creates traffic congestions. Traffic blocking is one main problem that most of public suffer every day in a big city like Karachi. Karachi’s central coach station is additionally set in Saddar, therefore connecting it with different areas of Karachi making an enormous issue as Encroachment in Saddar is outlined because the outlaw occupation or global organization authorized use of belongings and land. Sporadically, anti-encroachment drives by the town government have evicted these hawkers and vendors out of the Bazaar. The proposal present in many alternatives to the traffic plan, Re-routing public transport Remove hawker’s settlement it develop Saddar into a pedestrian zone the concepts behind this proposals type the premise of a future revitalization plan for Saddar and Area cognitive map, then Saddar may often reborn into a multi-class amusement and recreational space that the current day socially fragmented metropolis urgently desires. The data has been collected from the respondent and visitors of Saddar bazaar to gather the main problems through questionnaire survey to observe existing conditions of Saddar habitants Revitalize the original life style of Saddar; making it a shopping and cultural magnet for visitors as well as tourists.
© 2018 Furan jived, Sania Rehman Memon Selection and/or peer-review under responsibility of Energy and Environmental Engineering Research Group
(EEERG), Mehran University of Engineering and Technology, Jamshoro, Pakistan.
Keywords: central bus station, Encroachment, hawker’s settlement
1. Introduction
Many urban areas of Asian cities are environmentally degraded over time because of unplanned transport connected activities
and also the development of hawker areas around them. A number of these areas contain the built-heritage of the cities and were
once centers of culture, amusement and recreation. Saddar is one of such space and which customs greatly of the historical royal
core of the town. Saddar City holds the biggest attention of British colonial architecture in Karachi [1]
Saddar city is that the main business space of city, with the central looking space found within the historic Empress Market
additionally because the Central railway and the Central terminus and therefore the close Port of city [2] Thus it is necessary to
grasp the origin and also the Revitalization of Saddar through Re-routing transport system, habitant hawker’s and Improve Saddar
into a pedestrian zone. [3]
Corresponding author. Tel.03473666814
E-mail address: [email protected]
219

5th International Conference on Energy, Environment and Sustainable Development 2018 (EESD 2018)
Fig.1. Boundaries of Saddar Area in Karachi
2. The problem and its Background
Karachi is that the quickest rising extra-large town with in the world each in proportion and expansion. Its population has enlarged
by over one hundred pc from eleven million (figure of 1998 census) to 22 million once the household amount was shown. As
such, city holds 10% of the population of Pakistan and 22% of its city populance [4]. Karachi is additionally the capital of Sindh
region. It contains 62% of Sindh inner-city populace and 30% of its total populace. Due to movement from Bharat when 1947
and nonstop movement from different components of Pakistan, city could be a multi-ethnic town. [5]
The study area comprises the commercial core of Karachi. Saddar the city center, is the main shopping area of Karachi with
thriving markets.
2.1 Transports system in Saddar Karachi
In spite of Karachi’s importance, its transport connected issues have raised significantly. the quantity of conveyance registered
buses has declined from 22,313 in 2011 to 12,399 in 2014 of that 9,527 are operative because of this failure, folks are enforced
to travel on the roofs of buses that is to be precise extralegal and wait at bus stops for lengthy period to urge a ride. An oversized
variety of buses have born-again from Diesel to CNG as a result of a judicial writ. However, because of deficiency of offer, CNG
sale solely permissible for four days per week and it's only on nowadays that CNG buses will perform. This creates further issues
for the commutation public [6]
Fig.2. Existing and proposed traffic routes at Saddar Karachi
220

5th International Conference on Energy, Environment and Sustainable Development 2018 (EESD 2018)
The significance of the matter may be refereed by the actual fact that in 2011 solely 0.85 % automobiles in metropolis were bus
and 4.04 % were 3-seater motor rickshaws (these square measure three wheeler vehicles), whereas cars deep-seated 81.21 % and
motorcycles deep-seated 49.59 % (for details see, Table -1).
The effect of traffic blocking on the city Decreased mobility, High levels
of nephrotoxic air additionally as sound toxic waste, Environmental degradation and demolition of the
urban landscape, Deteriorating alive values, exaggerated direct and indirect prices being
specifically, prejudicial impact on bus transport as buses area unit stuck in traffic severely moving fleet productivity [7]
Table.1. model distribution of vehicles and passengers and the number of vehicles registered in Karachi in 2013(Source: Transport and
Communication Department, Karachi Municipal Corporation)
2.2 The Hawkers of Saddar Bazaar
In Third World cities, hawkers occupy pavements and in several cases even road area. Their popularity works where poor people
live or work, or in the area where they are transported and traveling. This is often due to the advantages of land or tradesmen of
the city or traders, and there are no plans for their place of sale and the demand for sale. The state government's response to social
problems is to abandon them. It is commonly occurring in Manila, Jakarta, Bombay and Karachi, and the cities of the Third World
[8]
In some cases, governments have wanted to restore hawkers. This rehabilitation has not been complicated, it is not considered a
link between public transport, public transport, buses and hawkers.
In 2001, a serious eviction of hawkers was administered by the authorities within the Saddar space. They were settled from the
most roads to the lanes within the same space. They rejected this relocation and when a three-week amount they managed to bribe
their method back. The URC had opposed the eviction and at a gathering of its board, it absolutely was determined that a practical
set up for hawker’s rehabilitation in Saddar ought to be developed. It absolutely was additional determined that hawkers were a
necessity for the low-income residents of town and conjointly evicting and relocating them would impoverish their families
during an amount of inflation and recession. [9]
221

5th International Conference on Energy, Environment and Sustainable Development 2018 (EESD 2018)
Fig.3. Traffic rushes and hawkers of Saddar
Fig.4. Location of existing hawkers, Encroachers and leased market
3. Model Revitalization Proposal:
Saddar’s issues will solely be solved as a part of a bigger town planning exercise that deals with the traffic and transport
issues of town. Area cognitive map and plan for the revitalization of Saddar have been made as Model Restoration
Proposal. It is tough to contrivance because habitants overlook the realisms that this statement contracts with.
222

5th International Conference on Energy, Environment and Sustainable Development 2018 (EESD 2018)
Fig.5. Mental Mapping of Saddar
Fig.6. Space Recognition Map
As shown in space recognition map hawkers and encroachment occurs in most valuable urban space like empress
market which causes the huge traffic flow problems. 3.1 Alternative Solution
I have mark a substitute plan for this part, I have mark the bazaar area a non-motorized sector and reserve the central
approach street to the place for public transport. As from experience it came to knowledge that pedestrian-friendly streets
are great for business. Second, it provides more opportunities for improved transport services for the more distant areas
served by the Karachi.
223

5th International Conference on Energy, Environment and Sustainable Development 2018 (EESD 2018)
Fig.7. The proposed revitalization map with Pedestrianization rerouting of vehicular movements / Public Transportation
According to the arrange, all the general public transport coming back from MA Jinnah road/ FTC side, presently
terminating at Mansfield Street, Shahrah-I-Iraq, Saddar Dawakhana and encompassing streets, would be taken a turn
from the lucky star chorangi and crossing the Dr daudpoto road and end at MA Jinnah road. Follow up these pattern for
transport routes can less the traffic problems from the town.
4. Conclusion:
Encroachment is the biggest problem in Saddar Town. Which has become a thriving business and the administration
seems to be utterly failed to control the problem. A large number of shopkeepers have put up roadside stalls in complete
violation of laws. Forty to seventy percent width of streets and roads is occupied by vendors, while footpaths are also
mostly occupied by shopkeepers and vendors, allowing very little space on streets and footpaths for vehicular traffic and
pedestrians. The locations where they are Encroaching at present need to be re-plan to accommodate them in a manner
in which they do not adversely affect the existing and proposed transport systems.
5. Recommendations
The authors are grateful to the Almighty Allah, for His kindness. All praises are for Him and all respects are for His
Holly Prophet (PBUH.) who guided us to recognize our Creator. The authors acknowledge the guidance and support
received from teachers and friends. The author would like to thank EESD and Mehran University of Engineering &
Technology, Jamshoro, Pakistan, for providing place and their support in writing this paper.
References [1]. F. Malik , “Heritage Foundation calls for restoration of Calcutta House in Karachi”, The Express Tribune.Karachi,Pakistan (newspaper).
Retrieved 7 April 2018: https://tribune.com.pk/story/1670686/1-heritage-foundation-calls-restoration-calcutta-house-karachi/
[2]. Z .Waseem,”Wandering in wonder: A new way to visit Karachi”, Dawn (newspaper), Published 19 January,2015, Retrieved 7 April ,2018: https://www.dawn.com/news/1158031
[3]. A. Hasan, A. Sadiq, P,Christophe, “THE HAWKERS OF SADDAR BAZAAR A Plan for the Revitalisation of Saddar Bazaar Karachi Through
Traffic Rerouting and the Rehabilitation of its Hawkers”,karachi, Ushba Publishing International,2008: http://arifhasan.org/wp content/uploads/2017/03/SaddarBazaarBook.pdf
[4]. W. Cox, “World Urban Areas Population and Density, New Geography”, 05 March,2012: http://www.demographia.com/db-worldua.pdf
[5]. I. A. Kaimkhani,”Master Plan Group of Offices (MPGO)”, Karachi Strategic Development Plan-2020; CDGK, 2007, https://www.scribd.com/doc/6788059/Karachi-Master-Plan-2020
224

5th International Conference on Energy, Environment and Sustainable Development 2018 (EESD 2018)
[6]. M. Raza, “Karachi’s Transport Issues: A diversity of stakeholder perspectives”, Presentation at the Karachi 9 Conference 2016, 22 November, 2016: http://pubs.iied.org/pdfs/10773IIED.pdf
[7]. D. Bertsimas, S.S. Patterson, “The Traffic Flow Management Rerouting Problem in Air traffic flow control: A Dynamic Network Flow Approach”, Published Online:1 Aug,2000: https://pubsonline.informs.org/doi/10.1287/trsc.34.3.239.12300
[8]. A.Hasan, C. Polak, A. Sadiq, “The Hawkers of Saddar Bazaar. Ushba Publishing International”, Karachi 2008: http://arifhasan.org/books/the-hawkers-of-saddar-bazaar
[9]. Muhammed. S, “URC , Urban Public Transport and Sustainable Livelihoods for the Poor”, a Case Study: Karachi, Pakistan, Loughborough University 2000:https://core.ac.uk/download/pdf/2745440.pdf
225

5th International Conference on Energy, Environment and Sustainable Development 2018 (EESD 2018)
Developing Silver Nano Particles Based Optical Sensor for H2O2
Detection in Environment
Hima Zafara,*, Sirujddinb, Kausar Rajarb, Bhawani Shankar Chowdharya, Rahat Ali Khanc
a Department of Electronics, Mehran University of Engineering & Technology Pakistan 76080 b National Centre of Excellence in Analytical Chemistry University of Sindh Pakistan 76080
c Institute of Information and Communication Technology University of Sindh Pakistan 76080
Abstract
Hydrogen Peroxide has several applications which make it a very useful chemical. The negative side of this chemical is
that when it combines with other compounds and easily turns into an explosive. Further, it has been found to be used
for mass destruction. This paper is about developing optical sensor to detect its presence. The technique used in this
paper is based on the development of colorimetric sensor using Silver Nano-Particles (AgNPs). Silver nano-particles
have been developed after heating the solution mixture of Silver Nitrate and Polyvinyl Pyrolidone (PVP) as capping
agent at an elevated temperature. Later, the synthesized silver nano particles were optimized via several parameters like
pH, capping agents and stability study. The prepared silver nano particles were characterized via different techniques
such as UV-Visible Spectroscopy and Fourier Transform Infrared (FTIR) spectroscopy. Finally, fabricated AgNP was
used to develop colorimetric sensor with an absorbance of 400 nM for the detection of hydrogen peroxide (H2O2)
concentration in the linear range of 1.6 ×10⁻⁶ to 1.6 ×10⁻⁴ M. Likewise, the limit of Detection(LOD) and limit of
Quantification (LOQ)is calculated to be 1.4×10^-7 M and 4.66×10^-7 M. This developed sensor opens new perspective
of detecting on-site reactive oxygen species and other types of analytes in future.
© 2018 Hima Zafar, Sirujddin, Kausar Rajar, Bhawani Shankar Chowdhary, Rahat Ali Khan. Selection and/or peer-review under responsibility of
Energy and Environmental Engineering Research Group (EEERG), Mehran University of Engineering and Technology, Jamshoro, Pakistan.
Keywords: Silver Nano particles, UV-Visible spectrometry, Polyvinyl Pyrolidone, Colorimetric sensor, Hydrogen peroxide
1. Introduction
Hydrogen peroxide (H2O2) is very important industrial chemical. This chemical is used in many fields like electronic
industry, textile industry, waste water treatment industry, chemical synthesis industry and so on [1]. H2O2 is commonly
produced on an industrial scale through a process known as the anthraquinone oxidation process. This process causes
environmental pollution [2], [3].
We have witnessed that several incidents have occurred which have used hydrogen peroxide as an explosive agent. This
chemical could become an explosive because this is an oxidizer and if it reacts with other components it becomes
explosive [4].
This was the motivation for the proposed work that this chemical can easily be detected through the proposed synthesized
sensor. Nanotechnology is the hottest field of investigation and innovation in current scenario. Materials ranging from
1–100 nm are considered to fulfill the definition of nanomaterials. The area of nanotechnology has proved to get
marvelous growth and innovative advances across electronics, medicine, robotics, communication, chemistry and
physics [1, 2]. The metal nanoparticles, especially AgNPs are of special focus to scientists due to their Localized Surface
* Corresponding author. Hima Zafar
E-mail address: [email protected]
226

5th International Conference on Energy, Environment and Sustainable Development 2018 (EESD 2018)
Plasmon Resonance (LSPR) properties, which later define its composition, size, shape, refractive index and surrounding
texture [7]. LSPR produces strong spectra of resonance absorbance peak shift in the visible band of light with a smallest
change in refractive index of the medium [4, 5]. AgNPs are the most commercialized nano-material based products per
year [8]. Generally metal nanoparticles can be synthesized by chemical reduction [5], green [9] and microbial methods
[10]. Among them chemical reduction technique is proved to be the best for the fabrication of nanoparticles with varied
sizes and shapes , nano rods, nano wires, nano prisms and nano plates [11]. The steps required for the development of
AgNPs are (i) Reduction of Silver Nitrate using reducing agent like glucose, sodium borohydride, tri-citrate, etc. [12]
(ii) Prevention of AgNPs from agglomerating. Stabilizing agents play very important role as they protect NPs to bind,
absorb or lose their surface properties. Polymeric compounds like Poly Vinyl pyrrolidine have proved to be excellent
defensive agents, are also as used in this experiment.
The development of highly sensitive and selective analytical tool for the detection of hydrogen peroxide (H2O2) is used
in this process. Similarly, Hydrogen peroxide is strong oxidizer n reducer depending on pH, it is more viscous than
water and used with fuel in Rockets. Low concentration of H2O2 which is 6%, is only being used for medication,
treatment of water, etc., as per Material Safety Data Sheet (MSDS) if higher concentration of H2O2 is used than it acts
as aggressive oxidizer and can be explosive once it encounters any organic compound in surrounding. The nanozyme-
based detecting stages offer promising new ways in H2O2 discovery, however with a specific end goal to acquire and
keep up the high synergist action of the nanozymes, strict control of the examinations and union conditions are ordinary
required [13],[14], [15].
One of the scholar, Tagad et al. [16] from India has used green synthesis method using Locust Beam Gum (LBG) to
detect H2O2 using a U bent sensing probe fabricated by Polymer optical fiber, which is new mechanism towards
engineering, but it’s typical to develop. Another scholar Wenbig et al. [17] from china demonstrated intrinsic activity of
Carbon nano-dots in the catalysis of 3,3’,5,5’ Tetramethylbenzidine (TMB) or is also known as visualizing regent used
in staining procedure in immunochemistry for the detection of Hydrogen peroxide and glucose in serum.
Qi Rui et al.[18] from china used electrochemical approach to develop third generation biosensor based on direct electron
transfer (DET) with modified metalloprotein cytochrome c (cyt.c) achieved at ZnO nano sheet using one step deposition
for the cathodic detection of H2O2 by avoiding O2 interferences and anodic interference like Ascorbic
Acid(A.A),dopamine(DA) at the same time. This biosensor used to determine H2O2 released form living human
hepatoma cells. Another scholar Miao et al.[19] from United states proposed sensory material ,based on cellulose
microfibril coated with Ti(IV) oxo complex for the vapor detection of H2O2 in peroxide explosive such as triacetone
triperoxide (TATP) using paper-based colorimetric sensing system.
There is a need of such sensors and transducers that are hand-carrying and provide efficient, reliable, sensitive and give
accurate results. The sensors can differ according to different nanoparticles core material (whether its metal, polymer,
oxides or composites) size, shape, surface chemistry, and their physical properties (such as electrical, optical, magnetic,
chemical, etc.). Therefore, optical Plasmon and absorption properties of metal nanoparticles has been useful in
colorimetric sensor for detecting various harmful chemicals in an aquatic environment [20].Indeed , solution to this
colorimetric method for sensing, owing the simplicity and cheapness have attracted many to conduct research [21]
.Colorimetric approach Silver nanoparticles shows excellent , easy visualization of colour change between individual
nanoparticles and aggregated ones ; yellow to colourless in real-time [22].
In this paper we have worked on the development of silver nanoparticles which are through chemical reduction method.
The reducing agent in that process was NaBH4 and PVP as capping agent which is polymeric surfactant and saves the
metal nanoparticles from aggregation; to detect Hydrogen peroxide (H2O2) which is found to be an easy method to
construct this, for the first time in the locality of Hyderabad -Pakistan. This method is simple to construct, speedy to
process and economical.
2. Material and Methods
2.1 Reagents and Chemicals
AgNO3 (Silver Nitrate), PVP, NaBH4, NaOH (98%), HCL (37%), NiCl2, Ascorbic Acid (C6H8O6), CoCl2.6H2O, Pb
(NO3)2, ZnCl2, KOH, NaCl2, CuSO4.5H2O, HgSO4. H2O, H2O2 were obtained from Sigma-Aldrich. All stocks solution
was prepared from Mili-Q water.
2.2 Characterization Method
227

5th International Conference on Energy, Environment and Sustainable Development 2018 (EESD 2018)
The prepared Ag nanoparticles were characterized by Ultra violet spectroscopy (UV/Visible) in aqueous form using
Perkin-Elmer 365 instrument on initial stages for the confirmation of the formation of AgNPs through reported peaks.
While to see the functional groups attached, Fourier Transform Infrared Spectroscopy analysis (FTIR) dry powder of
AgNPs was obtained and tested using Thermos Scientific Nicolet TM iS10 (with a range of wavenumber 400- 4000 cm-
1 ) under ATR mode. For 2D image of particles Scanning Electron Microscopy Model: JEOL: JSM-6380Lwas used.
Note: Except U-Visible spectroscopy all other methods used the particles which were dried in petri dish, washed by
acetone and then kept in oven (80 °C) for 10minutes to get impurities free silver nanoparticles in dry-powder form for
further characterization method. The visualizations of the colorimetric essay are discussed further.
2.3 Procedure for synthesis for silver Nano particles
First, we took 0.0001 M of NaBH4 in 10 mL Milli-Q water, kept on stirring for 15 min, by adding 20 µL PVP of 0.7%
M, and then 10 µL of AgNO3 of 0.1 M concentration drop by drop. The transparent solution is gradually converted into
bright crystal yellow color indicating the formation of AgNPs. Once the reaction is completed it is no longer needed to
be kept on stirring plate. This synthesis was realized at room temperature with pH value of 6.0.
3. Results and Discussion
3.1 UV-Visible Analysis
AgNPs show surface plasmonic resonance in UV-Visible spectra, hence UV-Vis spectroscopy was used as key technique
regarding initial characterization of PVP derived Ag-NPs which was centered between 350-470 or 500 nm depending
on the size. The AgNPs were synthesized in aqueous medium using NaBH4 as reducing and PVP as capping agent.
Different optimization parameters of reaction were observed such as: 1) optimization of NaBH4, selecting 0.001 M
concentration in 10 mL water with; 2) PVP of 20 µL along with stirring for 2 min and finally adding 3) 10 µL of AgNO3
of 0.1 M concentration. Once pale-yellow color was developed, it was taken for U.V-Vis test, optimizing some in-vivo
effects like pH, heating and found that 1) there was no pH effect and its original pH 6.0 was selected. 2) Room
temperature found to be suitable for the particles. The perfect absorbance recorded for this Ag NPs is 400 nm as in Fig
1.
Fig 1: UV-Visible spectra of PVP coated AgNPs
3.2 Fourier Transform Infrared (FTIR) spectroscopy Analysis
Each repeating unit of PVP has two functional groups, a C–N group and a C=O group. These groups, due to their N and
O atoms, have great affinity for silver ions and can coordinate metallic silver. PVP-coated AgNPs yielded man strong
absorption of C–N peak of pure PVP at 1017 cm-1 which is separated into two peaks at 1070, and 1000 cm-1. Furthermore,
the peaks at 1408 cm-1, 1603 cm-1, 3333 cm-1 are characteristics of bond vibrations of the NO3-1 group, C-O bonds, and
228

5th International Conference on Energy, Environment and Sustainable Development 2018 (EESD 2018)
O–H stretching bands in Figure 2. Therefore, the spectrum of FTIR show cases the molecular connections between
AgNPs and PVP series.
Fig 2: FTIR spectrum (a) PVP standard (b) PVP coated AgNPs
3.3 Scanning Electron Microscope Analysis (SEM)
A Scanning Electron Microscope (SEM) is a type of electron microscope that produces images of a sample by scanning
the surface with a focused beam of electrons. This technique is useful to visualize the shape of your nanoparticles in 2D
form. Fig 3 illustrates the scanning electron microscopy (SEM) images of AgNPs nanoparticles in 5 µm to 2 µm. It can
be seen clearly in the SEM images of the PVP synthesized AgNPs are well-defined petals-like particles.
(a) (b)
Fig 3: (a) scanning electron microscopy morphology images (a) 5 µm (b) 2 µm
3.4 Detection of H2O2 using synthesized AgNPs
The colorimetric sensing of hydrogen peroxide was performed by taking 10 mL test tube, with 2.5 mL of synthesized
Ag nanoparticles and different concentrations including 70%, 50%, 30% & 10% of H2O2 was added one by one by
following the most recent reported experiment [23] until the solution turned transparent . After optimization we selected
30% of H2O2 for further work. The assay of H2O2 was transferred to quartz cell to investigate the optical changes within
5-minute time on UV-V as shown in Fig 4 (a) to implement potential colorimetric sensing application.
The method exhibited well linearity in the calibration range 1.6 ×10⁻⁶ to 1.6 ×10⁻⁴ shown in Fig 4 (b). The correlation of
determination (R2) was 0.99, with Limit of Detection (LOD) and Limit of Quantification (LOQ) calculated to be 1.4×10-
7 and 4.66×10⁻⁷ M correspondingly.
229

5th International Conference on Energy, Environment and Sustainable Development 2018 (EESD 2018)
(a)
(b)
Fig 4 (a) Decrease in absorbance with decreasing concentration of (b) linear Regression plot between absorbance and hydrogen peroxide
concentrations.
3.5 Selectivity of sensor
To check the selectivity of PVP-coated AgNPs for other heavy metal ions and biologically important analytes, we
observed that the colorimetric results in the presence of various metal ions including Ni2+, A.A, Co2+, Pb2+, Zn2+, K+,
Na+, Cu2+, Hg2+, H2O2 at concentration of 100 micromolar. The selectivity of developed sensor can be checked visually
as reported by the inset photograph in Fig 5 (a) and (b).
200 300 400 500 600 700 800
0.0
0.5
1.0
1.5Absorbance
Wavelength
y = 0.0619x + 0.2501R² = 0.9908
0
0.2
0.4
0.6
0.8
1
1.2
1.4
0 2 4 6 8 10 12 14 16
Chart Title
Ab
sorb
ance
230

5th International Conference on Energy, Environment and Sustainable Development 2018 (EESD 2018)
(a)
(b)
Fig 5 (a) Photograph of heavy metal ions (b) UV-Visible spectrum of Metal ion
3.6 Results
A comparison of the limit of detection for hydrogen peroxide obtained by the present method and existing four methods
is dicussed in this section. Limit of Detection (LOD) should be low as it tells that up to what minor value a sensor can
detect the targetted analyte. Linear Range is the range of spiking the H2O2 in medium that should also be low. This helps
in proofing that a sensor can detect the minimum presence of this dangerous analyte. Linear Range is supporting value
for LOD. As it can be observed that work proposed in [15] used Graphene-Oxide Modified with AgNPs method, [24]
used Tri-Sodium Citrate capped AgNps using Lee-Meisel Method, [25] used Silver Chloride Nano particles Using
Sargassum algae method and the proposed work has used PVP-coated AgNPs method. In proposed work and other
existing works [15], [24] and [25] the medium in which H2O2 was tested is water. In [15] the LOD is 2.0 × 10⁻⁸ M, in
[24] the value of LOD is 2.0 × 10⁻⁸ M, in [25] the value of LOD is 9× 10⁻⁸ M and the proposed work has achieved LOD
value of 0.14× 10⁻⁸ M. This shows that the proposed work has least value of LOD as compared to other existing works
with good sensitivity.
In [15] the Linear Range is 5 × 10⁻⁶ to 8 × 10⁻⁵ M, in [24] the value of LOD is 2.5 × 10⁻⁶ to 4 × 10⁻⁵ M, in [25] the value
of LOD is 1× 10⁻⁶ to 1.1 × 10⁻⁴ M and the proposed work has achieved LOD value 1.6 ×10⁻⁶ to 1.6×10⁻⁴ M. Here [25]
has least value of Linear Range. As discussed earlier that Linear Range supports LOD which means that the proposed
work is better than others because it has the least value of LOD.
4. Conclusion
In summary, we first synthesized the AgNPS using different reagents and found PVP as capping agent suitable for our
work, which showed the stability of five months. Later PVP-coated AgNPs were characterized by UV−visible, SEM
analysis and FT-IR spectroscopy. Moreover, developed fabricated optical sensor, is a simple and rapid and highly stable.
Colori-metric assay was used for quantitative detection of Hydrogen Peroxide (H2O2). H2O2 which is strong oxidizer,
also used widely in food industry, but at the same time is very dangerous if encounters any organic compound in
surrounding. To avoid the usage of this harmful analyte in our locality Hyderabad-Pakistan we developed a simple
AgNPs Ni2+ A.A Co2+ Pb2+ Zn2+ K+ Na+ Cu2+ Hg2+ H2O2
231

5th International Conference on Energy, Environment and Sustainable Development 2018 (EESD 2018)
colorimetric sensor for the detection of H2O2 in medium like water; as tested initially. This method is very sensitive
linear range with limit of detection and quantification found to be 1.4×10⁻⁷ and 4.6×10⁻⁷ M respectively. Hence this
detection method has potential application in environmental monitoring handy kit plus it can be extended for the
development of membrane for the water purification.
Acknowledgement
We are thankful to Roomia Memon, Gulnaz Laghari who helped in the research and National Centre of Excellence in
Analytical Chemistry University of Sindh Pakistan for allowing to use their resources.
References:
[1] Z. Pan, K. Wang, Y. Wang, P. Tsiakaras, and S. Song, “SC,” "Applied Catal. B, Environ., 2018.
[2] S. J. Freakley et al., “Palladium-tin catalysts for the direct synthesis of H 2 O 2 with high selectivity,” vol. 351, no. 6276, 2016.
[3] Z. Yu, Y. Park, L. Chen, B. Zhao, Y. M. Jung, and Q. Cong, “Preparation of a Superhydrophobic and Peroxidase-like Activity Array Chip
for H 2 O 2 Sensing by Surface-Enhanced Raman Scattering,” 2015.
[4] J. S. Kumar, N. C. Murmu, and T. Kuila, “Recent trends in the graphene-based sensors for the detection of hydrogen peroxide,” vol. 5, no.
May, pp. 422–466, 2018.
[5] H. Wang, X. Qiao, J. Chen, and S. Ding, “Preparation of silver nanoparticles by chemical reduction method,” vol. 256, pp. 111–115,
2005.
[6] S. K. Sahoo, S. Parveen, and J. J. Panda, “The present and future of nanotechnology in human health care,” vol. 3, pp. 20–31, 2007.
[7] D. Vilela, M. C. González, and A. Escarpa, “Sensing colorimetric approaches based on gold and silver nanoparticles aggregation:
Chemical creativity behind the assay. A review,” Anal. Chim. Acta, vol. 751, pp. 24–43, 2012.
[8] T. Fafal, P. Taştan, B. S. Tüzün, M. Ozyazici, and B. Kivcak, “Synthesis, characterization and studies on antioxidant activity of silver
nanoparticles using Asphodelus aestivus Brot. aerial part extract,” South African J. Bot., vol. 112, pp. 346–353, 2017.
[9] T. N. J. I. Edison, Y. R. Lee, and M. G. Sethuraman, “Green synthesis of silver nanoparticles using Terminalia cuneata and its catalytic
action in reduction of direct yellow-12 dye,” Spectrochim. Acta - Part A Mol. Biomol. Spectrosc., vol. 161, no. 2, pp. 122–129, 2016.
[10] J. Sarkar et al., “Alternaria alternata mediated synthesis of protein capped silver nanoparticles and their genotoxic activity,” Dig. J.
Nanomater. Biostructures, vol. 6, no. 2, pp. 563–573, 2011.
[11] J. E. Millstone, S. Park, K. L. Shuford, L. Qin, G. C. Schatz, and C. A. Mirkin, “Observation of a quadrupole plasmon mode for a
colloidal solution of gold nanoprisms,” J. Am. Chem. Soc., vol. 127, no. 15, pp. 5312–5313, 2005.
[12] S. Chernousova and M. Epple, “Silver as antibacterial agent: Ion, nanoparticle, and metal,” Angew. Chemie - Int. Ed., vol. 52, no. 6, pp.
1636–1653, 2013.
[13] N. Wang, J. Sun, L. Chen, H. Fan, and S. Ai, “A Cu2(OH)3Cl-CeO2 nanocomposite with peroxidase-like activity, and its application to
the determination of hydrogen peroxide, glucose and cholesterol,” Microchim. Acta, vol. 182, no. 9–10, pp. 1733–1738, 2015.
[14] J. Chen, Q. Chen, J. Chen, and H. Qiu, “Magnetic carbon nitride nanocomposites as enhanced peroxidase mimetics for use in colorimetric
bioassays, and their application to the determination of H2O2and glucose,” Microchim. Acta, vol. 183, no. 12, pp. 3191–3199, 2016.
[15] H. Yang, R. Yang, P. Zhang, Y. Qin, T. Chen, and F. Ye, “A bimetallic (Co/2Fe) metal-organic framework with oxidase and peroxidase
mimicking activity for colorimetric detection of hydrogen peroxide,” Microchim. Acta, vol. 184, no. 12, pp. 4629–4635, 2017.
[16] C. K. Tagad, S. Reddy, R. Aiyer, S. Park, A. Kulkarni, and S. Sabharwal, “Sensors and Actuators B : Chemical Green synthesis of silver
nanoparticles and their application for the development of optical fiber based hydrogen peroxide sensor,” Sensors Actuators B. Chem.,
vol. 183, pp. 144–149, 2013.
[17] F. Gabriel, “D’une alliance, l’autre : la relecture de l’ancienne Loi sous la nouvelle dans l’exégèse du décalogue (xvie-xviies.),” Rev. la
Hist. des Relig., vol. 229, no. 2, pp. 227–255, 2012.
[18] Q. Rui, K. Komori, Y. Tian, H. Liu, Y. Luo, and Y. Sakai, “Analytica Chimica Acta Electrochemical biosensor for the detection of H 2 O
2 from living cancer cells based on ZnO nanosheets,” Anal. Chim. Acta, vol. 670, no. 1–2, pp. 57–62, 2010.
[19] M. Xu, B. R. Bunes, and L. Zang, “Paper-Based Vapor Detection of Hydrogen Peroxide : Colorimetric,” pp. 642–647, 2011.
[20] S. Liu, J. Tian, L. Wang, and X. Sun, “A method for the production of reduced graphene oxide using benzylamine as a reducing and stabilizing agent and its subsequent decoration with Ag nanoparticles for enzymeless hydrogen peroxide detection,” Carbon N. Y., vol. 49,
no. 10, pp. 3158–3164, 2011.
[21] Y. Song, W. Wei, and X. Qu, “Colorimetric biosensing using smart materials,” Adv. Mater., vol. 23, no. 37, pp. 4215–4236, 2011.
[22] R. Shapes, H. K. Sung, S. Y. Oh, C. Park, and Y. Kim, “Colorimetric Detection of Co 2+ Ion Using Silver Nanoparticles with Spherical,
Plate, and Rod Shapes,” 2013.
[23] B. Sinduja and S. A. John, “Ultrasensitive optical sensor for hydrogen peroxide using silver nanoparticles synthesized at room
temperature by GQDs,” Sensors Actuators, B Chem., vol. 247, pp. 648–654, 2017.
[24] A. Üzer, S. Durmazel, E. Erçağ, and R. Apak, “Determination of hydrogen peroxide and triacetone triperoxide (TATP) with a silver
232

5th International Conference on Energy, Environment and Sustainable Development 2018 (EESD 2018)
nanoparticles—based turn-on colorimetric sensor,” Sensors Actuators, B Chem., vol. 247, pp. 98–107, 2017.
[25] M. Farrokhnia, S. Karimi, S. Momeni, and S. Khalililaghab, “Sensors and Actuators B : Chemical Colorimetric sensor assay for detection of hydrogen peroxide using green synthesis of silver chloride nanoparticles : Experimental and theoretical evidence,” Sensors Actuators B.
Chem., vol. 246, pp. 979–987, 2017.
233