materials sector analysis paul lewis steve meredith summer 2013
TRANSCRIPT

MaterialsSector Analysis
Paul Lewis
Steve Meredith
Summer 2013

Sector Overview
• Basic Materials Sector:– 30 companies in the S&P 500 sector– Beta (to S&P 500): 1.20– Mainly mining / processing / development of
raw materials such as:• metals, chemicals, fertilizers, construction,
packaging, and paper products
– Highly cyclical– Sensitive to supply / demand & commodity
pricing levels

Sector Overview
• S&P 500 and SIM Weights (June 2013)
• Sector Size (Market Cap): $515.4B• SIM: Materials is underweight by 159bps

Sector Overview
Materials Sector Industries % of SectorAluminum 1.82%
Commodity Chemicals 1.58%Construction Materials 1.38%Diversified Chemicals 27.47%
Diversified Metals & Minig 6.54%Fertilizers & Agricultural Chemicals 16.86%
Gold 3.45%Industrial Gases 12.33%
Metal & Glass Containers 2.26%Paper Packaging 3.08%Paper Products 4.10%
Specialty Chemicals 11.15%Steel 4.55%

Sector Overview
Date Index Name QTD Return YTD Return 1 Year Return 3 Year Return 5 Year Return
May 31, 2013 S&P 500 3.92% 14.34% 24.45% 49.69% 16.45%May 31, 2013 S&P 500 (TR) 4.31% 15.37% 27.28% 59.64% 30.24%Jun 14, 2013 Materials 1.53% 5.76% 16.17% 11.08% -1.95%Jun 14, 2013 Materials (TR) 1.98% 6.87% 19.07% 13.57% 0.32%

Sector Overview
• Most materials sector stocks are up over the past 12 months
Sector Overview
• Current SIM Stocks: Albemarle & Mosaic• Albemarle Corporation:
– NYSE Ticker: ALB– 2012 Revenue: $2.75B– 2012 Net Income: $311.5M
• Mosaic Corporation– NYSE Ticker: MOS– 2012 Revenue: $11.1B– 2012 Net Income: $1,930.2M
Business Analysis
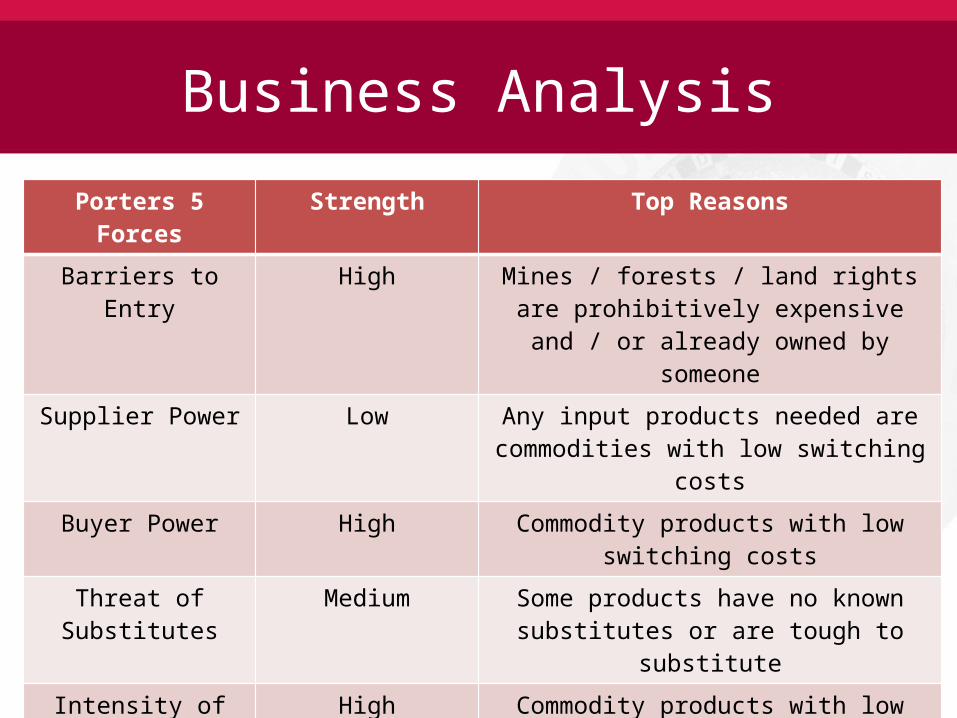
Porters 5 Forces Strength Top Reasons
Barriers to Entry High Mines / forests / land rights are prohibitively expensive and / or already
owned by someone
Supplier Power Low Any input products needed are commodities with low switching costs
Buyer Power High Commodity products with low switching costs
Threat of Substitutes
Medium Some products have no known substitutes or are tough to substitute
Intensity of Rivalry High Commodity products with low product differentiation and low switching costs

• Materials sector is in the mature phase• Slower revenue and earnings growth• Growth at overall economy rate• Higher dividend yields• Margin pressure
Business Analysis - Sector

Business Analysis - Macro
• US and China are still in recovery mode• Many other developed countries are in
contraction or early recovery

Economic Analysis
• Materials & S&P 500

Economic Analysis
• Materials & Dollar Strength (USD / Euro)

Economic Analysis
• Materials & Trade Weighted Dollar

Economic Analysis
• Materials & Commodity Prices

Economic Analysis
• Materials & Real GDP

Economic Analysis
• Materials & Crude Oil (WTI)

Economic Analysis
• Materials & New Machinery Orders

Economic Analysis
• Materials & CPI

Financial Analysis
• Net Profit Margin

Financial Analysis
• Return on Equity

Financial Analysis

Financial Analysis

Valuation Analysis - Sector
Absolute Basis High Low Median CurrentP/Trailing E 34.00 8.10 16.60 17.20P/Forward E 28.60 9.30 15.00 14.70
P/B 3.70 1.30 2.80 2.70P/S 1.50 0.50 1.20 1.20
P/CF 12.70 5.40 9.20 10.20
Relative to SP500 High Low Median CurrentP/Trailing E 1.80 0.68 1.10 1.10P/Forward E 1.90 0.79 1.00 0.99
P/B 1.30 0.80 1.10 1.10P/S 1.10 0.70 0.90 0.90
P/CF 1.10 0.70 0.90 1.00
Materials Sector
Trading inline with 10-year averages

Valuation Analysis – Agricultural Chemicals
Absolute Basis High Low Median CurrentP/Trailing E 56.40 13.00 22.10 16.10P/Forward E 43.10 10.80 20.10 15.80
P/B 9.30 0.90 3.50 3.20P/S 7.60 1.00 3.10 2.80
P/CF 38.00 5.80 13.60 12.80
Relative to SP500 High Low Median CurrentP/Trailing E 3.50 0.65 1.40 1.00P/Forward E 3.00 0.78 1.30 1.10
P/B 3.80 0.30 1.50 1.30P/S 5.50 0.70 2.30 2.00
P/CF 3.60 0.60 1.40 1.20
Agricultural Chemicals Industry

Valuation Analysis – Agricultural Chemicals
• Currently trading under 10-year averages• Relatively cheap vs. S&P 500• Highly price driven industry
– Competes mainly on basis of delivered price– Low threat of substitutes, but very low
switching costs, low product differentiation, and multiple suppliers
• High exposure to a weak global economy– MOS - 2/3 of sales outside the US

Valuation Analysis – Specialty Chemicals

Valuation Analysis – Specialty Chemicals
• Currently trading in line with or above10-year averages• Fairly priced vs. S&P 500• Industry driven by prices and R&D innovations
– New compounds are easily copied, low costs of production and access to mineral reserves are paramount
– Little substitution threat, but many suppliers and low switching costs
– Innovators in Green technologies are likely to gain market share (eg. Oil Refining, Nat. Gas Fracking, LED lights)
• High exposure to global economy– ALB – 44% of sales from Americas; 39% from Europe, Middle
East & Africa; 17% from Asia Pacific

Behavioral Analysis
• 5-Yr Reversal/1-Yr Momentum Theories suggest:– Financials, Utilities, and
Materials should be overweight
– Consumer Discretionary, Healthcare and Consumer Staples should be underweight

Behavioral Analysis
• Furthermore, small-cap Materials names are preferred over large-cap

Recommendation
• Overweight Materials Sector:• Positives:
– Commodity prices have to improve?– US / China picking up growth
• Risks: – Global economy continues to falter– Fed tapers asset purchases – who knows what might
happen? – Commodity prices remain depressed
• Agricultural chemicals, gold, containers, paper products, diversified metals & mining - undervalued
• Specialty chemicals, aluminum, steel - overvalued• Industrial gases, diverse chemicals - inline
+20 bps

Thank You
• Questions?