math high school essential elements draft.pdf web viewex. match two dimes, three nickels, and four...
TRANSCRIPT
Alaska-DLM Essential Elements and
Instructional Examples forMathematics
High School
Revised for Alaska July,
2014
The present publication was developed under grant 84.373X100001 from the U.S. Department of Education, Office of Special Education Programs. The views expressed herein are solely those of the author(s), and no official endorsement by the U.S. Department should be inferred.
223
AK-DLM ESSENTIAL ELEMENTS AND COMPLEXITY EXAMPLES FOR HIGH SCHOOL
High School Mathematics Standards: Number and Quantity - The Real Number System
AK Grade-Level ClustersAK-DLM
Essential Elements Instructional Examples
Extend the properties of exponents to rational exponents.
N-RN.1. Explain how the definition of the meaning of rational exponentsfollows from extending the properties of integer exponents to those values, allowing for a notation for radicals in terms of rational exponents. For example,we define 51/3 to be thecube root of 5 because we want (51/3)3 = 5(1/3)3 to hold, so (51/3)3 must equal 5.
EEN-RN.1. Determine the value of a quantity that is squared or cubed.
Students will:EEN-RN.1. Illustrate concept of remainders using objects and numerical representations.Ex. Divide 15 objects into two groups of six and one group of three. Show representation and objects in numerical representation (e.g., 15/6 = 2 r 3). Ex. A group of six students sits down to have a snack. You have 25 cookies. How many cookies does each student get? Are there any leftover? (e.g., Write number sentence 25/6 = 4 r 1).Ex. If a pack of gum costs $0.49 and there are five sticks per pack, how much does each stick cost? Use real objects (gum and coins) to show division (e.g., 49/5 = 9 r 4).
Students will:EEN-RN.1. Solve division problems with remainders using concrete objects.Ex. Divide 13 into equal groups (two groups of six with a remainder of one, three groups of four with a remainder of one, one group of 13, four groups of three with a remainder of one, six groups of two with a remainder of one, 13 groups of one).Ex. A group of six students sits down to have a snack. You have 15 cookies. How many cookies does each student get? Are there any leftover?Ex. A student has five quarters and wants to buy a soda that costs $1.00. How much money is left over?Ex. A class of seven students earns $20 doing a service project. How much does each student receive? (Solve using money, calculator, etc.)
Students will:EEN-RN.1. Identify the difference between equal and not equal groups. Ex. Using drawings or groups of cubes, determine if the groups are equal
224
AK Grade-Level ClustersAK-DLM
Essential Elements
or not equal.
Instructional Examples
Ex. When passing out 10 pencils to nine people, do you have one for each person? Are there some left over?Ex. Do 10 pennies = $0.10?Ex. Are two nickels equal to $0.11?Ex. Given two clocks, one shows 20 minutes after the hour and another shows 30 minutes after the hour. Which clock shows the later time?
Students will:EEN-RN.1. Recognize that a whole can be divided into parts. Ex. Use models to represent quantities as parts of a whole.Ex. Given two sets of objects with one set divided into smaller groups, point to the quantities that have been divided when prompted.
225
High School Mathematics Standards: Number and Quantity–Quantities
AK Grade-Level ClustersAK-DLM
Essential Elements Instructional Examples
Reason quantitatively and use units to solve problems.
N-Q.1. Use units as a way to understand problems and to guide the solution of multi-step problems; choose and interpret units consistently in formulas; choose and interpret the scale and the origin in graphs and data displays.
N-Q.2. Define appropriate quantities for the purpose of descriptive modeling.
N-Q.3. Choose a level of accuracy appropriate to limitations on measurement when reporting quantities.
EEN-Q.1-3. Express quantities to the appropriate precision of measurement.
Students will:EEN-Q.1-3. Express solutions to problems using the appropriate precision of measurements.Ex. Determine elapsed time (watch a TV show that starts at 8 p.m. and ends at 8:30 p.m.).Ex. Using a measuring tape, determine if a large item purchased in a store will fit in the car to take it home.Ex. If it takes 30 minutes to get home, will I be home by 6:00 p.m. if I leave at 5:45 p.m.?
Students will:EEN-Q.1-3. Express quantities to the appropriate precision of measurement.Ex. Measure the length of an object to the nearest half and quarter of an inch.Ex. Measure time in hours (e.g., determine elapsed time when watching aTV show that starts at 8:00 p.m. and ends at 9:00 p.m.). Ex. Measure ingredients for a recipe accurately.
Students will:EEN-Q.1-3. Select the appropriate type of unit as a measurement tool. Ex. What label would you use to describe the length of a football field (inches, yards, or miles)?Ex. When you want to know how much ground meat you have, what kind of measuring do you need to do? (Weight, length, and temperature.)Ex. What unit of measure would you use to measure the length of the room? (Length, weight, volume.)Ex. What unit of measurement would you use to measure produce at the grocery store? (Weight, volume, length.)Ex. Which is best to describe your weight – pounds or inches? Ex. Record the daily temperature for a week using degrees.Ex. Match a thermometer to two non-standard units of measurement.
226
AK Grade-Level ClustersAK-DLM
Essential Elements
Students will:
Instructional Examples
EEN-Q.1-3. Identify measurement tools. Identify the attribute to be measured (weight, length, and temperature).Ex. Of these items, which is a measurement tool? (pencil, ruler, can) Ex. If I wanted to measure the desk, would I use a ruler or a pen?Ex. Match units of measurement to measurement tools (days and hours measure time, inches and feet measure length).

227
High School Mathematics Standards: Number and Quantity–The Complex Number System
AK Grade-Level ClustersAK-DLM
Essential Elements Instructional Examples
N-CN.2. Use the relation i2
= –1 and the commutative, associative, anddistributive properties to add, subtract, and multiply complex numbers.
EEN-CN.2.a. Use the commutative, associative, and distributive properties to add, subtract, and multiply whole numbers.
EEN-CN.2.b. Solve real-world problems involving addition and subtraction of decimals, using models when needed.
EEN-CN.2.c. Solve real-world problems involving multiplication of decimals and whole numbers, using models when needed.
Students will:EEN-CN.2. Apply the operations of addition, subtraction, and multiplication in real world situations using money as the standard units ($50, $20, $10, $5, $1, $0.25, $0.10, $0.05, and $0.01).Ex. Using a checkbook register: $55.55 – 10.10 = . Ex. Using a checkbook register: $20 x 0.05 = _.Ex. If you have $20, how much change will you receive if you spend$11.75?Ex. Calculate the cost of six movie tickets that are $7.50 each.Ex. If I have $4.20 cents and I buy an item for $3.50, how much change willI get?Ex. Jean earns $7.50 an hour. She worked six hours. How much did she earn?
Students will:EEN-CN.2. Use the operations of addition, subtraction, and multiplication with decimals (decimal value x whole number) in real-world situations using money as the standard units ($20, $10, $5, $1, $0.25, $0.10, $0.05, and $0.01).Ex. Using a checkbook register: Add $6.50 + $3 (e.g., If you have $6.50 in your bank account and you receive a gift for $3.00, how much money do you have in your bank account?)
228
AK Grade-Level ClustersAK-DLM
Essential Elements Instructional Examples
Ex. Calculate the cost of two movie tickets that are $6.50 each. Ex. Find the cost of two pizzas if each pizza is $5.50.
Students will:EEN-CN.2. Use the operations of addition, subtraction, and multiplication up to the tenths place with decimals.Ex. If I have a nickel and two dimes, how much money do I have? Ex. If I have $3.50 and I spend $2.50, how much money do I have?
Students will:EEN-CN.2. Use the operations of addition, subtraction, multiplication, and multiplication with whole numbers less than 20.Ex. If Sam got three cats and they each cost $2, how much did he pay for all three cats (3 x 2 = 6).Ex. 4 + 36 = . Ex. 67 – 33 = .Ex. 20 x 3 = .Ex. Mary got $2 from her uncle and $5 from her sister for her birthday, how much money did she receive?
229
High School Mathematics Standards: Algebra–Seeing Structure in Expressions
AK Grade-Level ClustersAK-DLM
Essential Elements Instructional Examples
Interpret the structure of expressions.
A-SSE.1. Interpret expressions that represent a quantity in terms of its context.� Interpret parts of an
expression, such as terms, factors, and coefficients.
� Interpret complicatedexpressions by viewing one or more of their parts as a single entity. For example, interpret P(1+r)n as the product of P and a factor not depending on P.
EEA-SSE.1. Identify an algebraic expression involving one arithmetic operation to represent a real-world problem.
Students will:EEA-SSE.1. Write or match an algebraic expression for a given word expression involving more than one operation.Ex. Write an expression to represent the problem, six weeks minus two weeks plus four weeks, to find the total number of weeks you are working?Ex. How would you represent five dogs plus two cats plus one mouse to find the total number of animals in a pet store?Ex. Shown pictures representing two expressions, select the one for two drinks, plus three slices of pizza, plus two salads if d represents drinks, s represents salad, and p represents pizza?Ex. Match two dimes, three nickels, and four pennies to an expression when d represents dimes, n represents nickels, and p represents pennies. Ex. Match 2r + 3b + 4y with two red disks, three blue disks, and four yellow when given colored disks.
Students will:EEA-SSE.1. Match an algebraic expression involving one operation to represent a given word expression with an illustration.Ex. Match the correct algebraic expression to a picture of three boys and two girls if b represents boys and g represents girls (3b + 4g) when asked, “Which is the correct way to express three boys and two girls if b represents the number of boys and g represents the number of girls in the classroom?”Ex. Shown a picture of three hamburgers at $4 each, match an expressionto the picture given two expressions when asked, “Which is the correct way to express the cost of three hamburgers if each hamburger is $4.00?” (three hamburgers x $4)Ex. Shown two drinks plus three slices of pizza, match an expression to the picture given two expressions when asked, “Which one shows two drinks plus three slices of pizza if d represents drinks and p represents pizza?”Ex. Match two dimes and three nickels to an expression where d
230
AK Grade-Level ClustersAK-DLM
Essential Elements Instructional Examples
represents dimes and n represents nickels.Ex. Match the expression of 2r + 3b with two red disks and three blue disks when given an assortment of colored disks.
Students will:EEA-SSE.1. Identify the operation used for word expressions as indicated by an illustration.Ex. Nancy has 10 balloons. She gives three away to her friend. What operation (addition or subtraction) do you use to find how many are left as indicated by an illustration or manipulatives.Ex. Dave has 10 cookies. His friend gives him two more cookies. Whatoperation (addition or subtraction) should Dave use to determine how many cookies he has in all as indicated by an illustration or manipulatives? Ex. Jose has three times as many baseball cards as his brother. What operation (addition or multiplication) do you use to find how many baseball cards Jose has as indicated by an illustration?Ex. One box has six books in it and another box only has two. How many books are there together?Ex. Match words (and, more, take away, times) to (addition, subtraction, multiplication).Ex. Given a word problem (June has four marbles and Cho has two marbles. How many marbles do they have all together?) Student will identify if they should add or subtract to find the answer as indicated by an illustration.Ex. When given a pictorial number sentence, complete an algebraic representation of the pictures by placing/drawing in the correct sign for the operation.
Students will:EEA-SSE.1. Recognize the symbol for an operation. Ex. What does this mean? (+ means add)Ex. What does this mean? (– means subtract or take away)
231
AK Grade-Level ClustersAK-DLM
Essential Elements Instructional Examples
Write expressions in equivalent forms to solve problems.
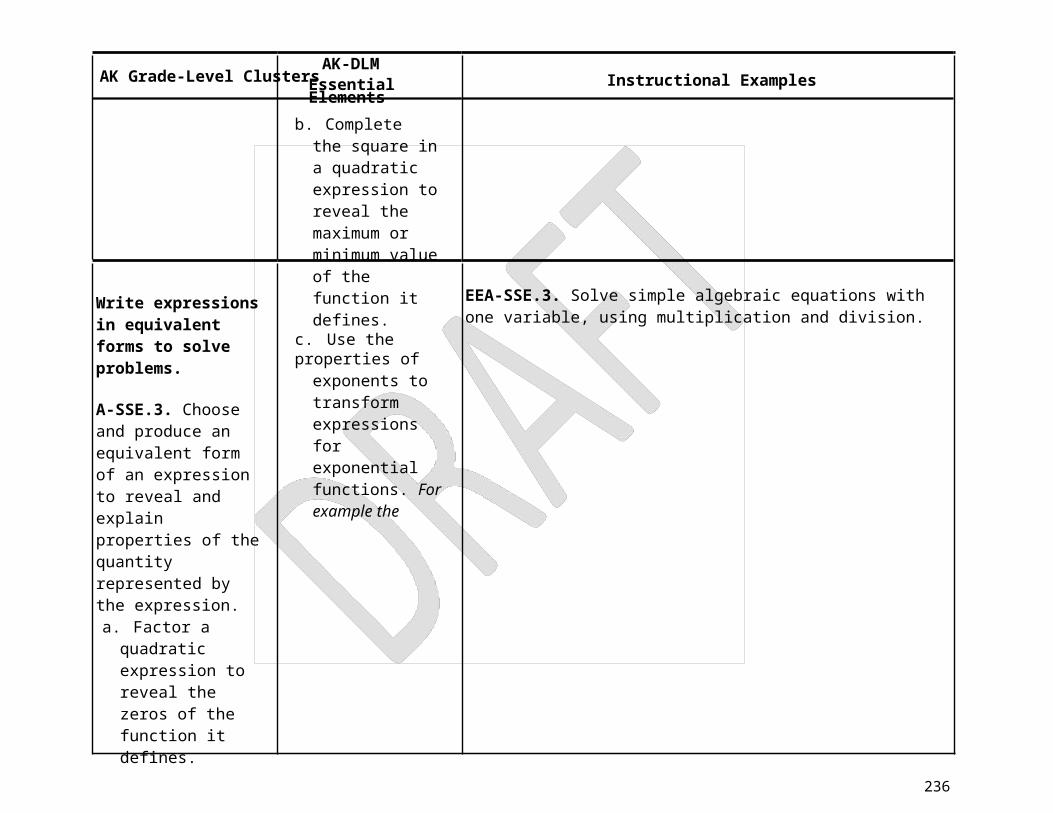
A-SSE.3. Choose and produce an equivalent form of an expression to reveal and explain properties of the quantity represented by the expression.a. Factor a quadratic
expression to reveal the zeros of the function it defines.
b. Complete the square in a quadratic expression to reveal the maximum or minimum value of the function it defines.
c. Use the properties ofexponents to transform expressions for exponential functions. For example the
EEA-SSE.3. Solve simple algebraic equations with one variable, using multiplication and division.
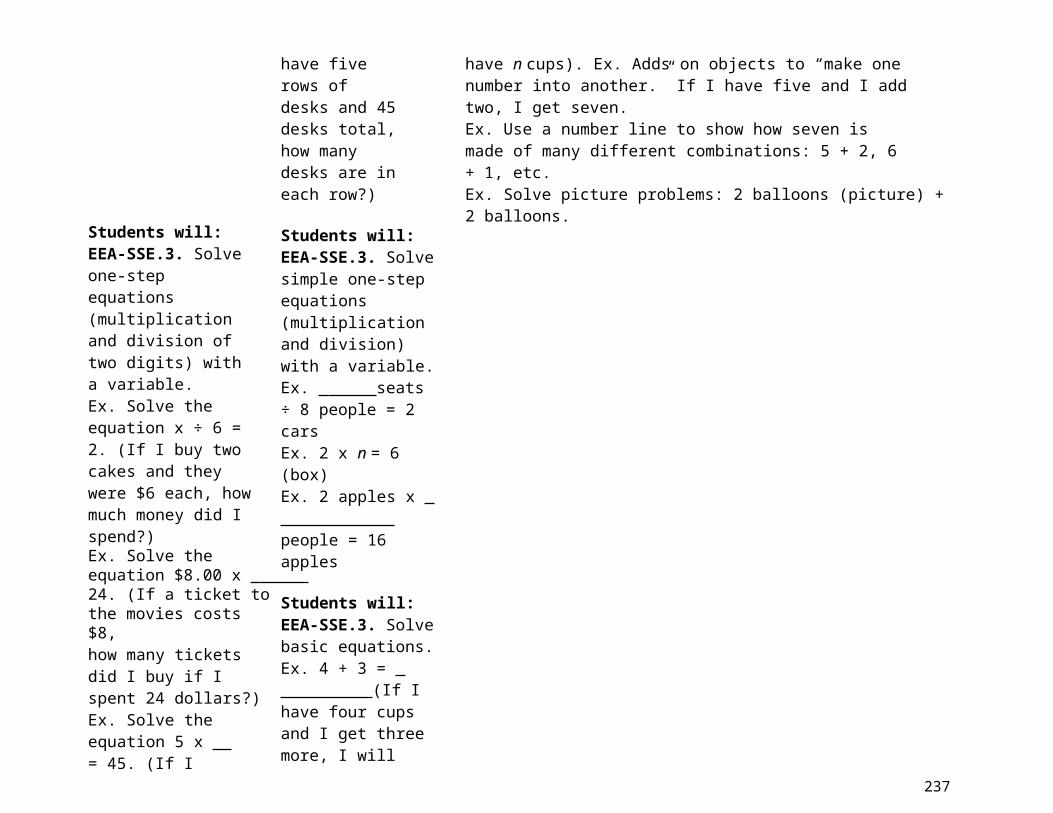
Students will:EEA-SSE.3. Solve one-step equations (multiplication and division of two digits) with a variable.Ex. Solve the equation x ÷ 6 = 2. (If I buy two cakes and they were $6 each, how much money did I spend?)Ex. Solve the equation $8.00 x = 24. (If a ticket to the movies costs $8,how many tickets did I buy if I spent 24 dollars?)Ex. Solve the equation 5 x = 45. (If I have five rows of desks and 45 desks total, how many desks are in each row?)
Students will:EEA-SSE.3. Solve simple one-step equations (multiplication and division)with a variable.Ex. seats ÷ 8 people = 2 carsEx. 2 x n = 6 (box)Ex. 2 apples x people = 16 apples
Students will:EEA-SSE.3. Solve basic equations.Ex. 4 + 3 = (If I have four cups and I get three more, I will have n cups). Ex. Adds on objects to “make one number into another.” If I have five and I add two, I get seven.Ex. Use a number line to show how seven is made of many different combinations: 5 + 2, 6 + 1, etc.Ex. Solve picture problems: 2 balloons (picture) + 2 balloons.
232
AK Grade-Level ClustersAK-DLM
Essential Elements
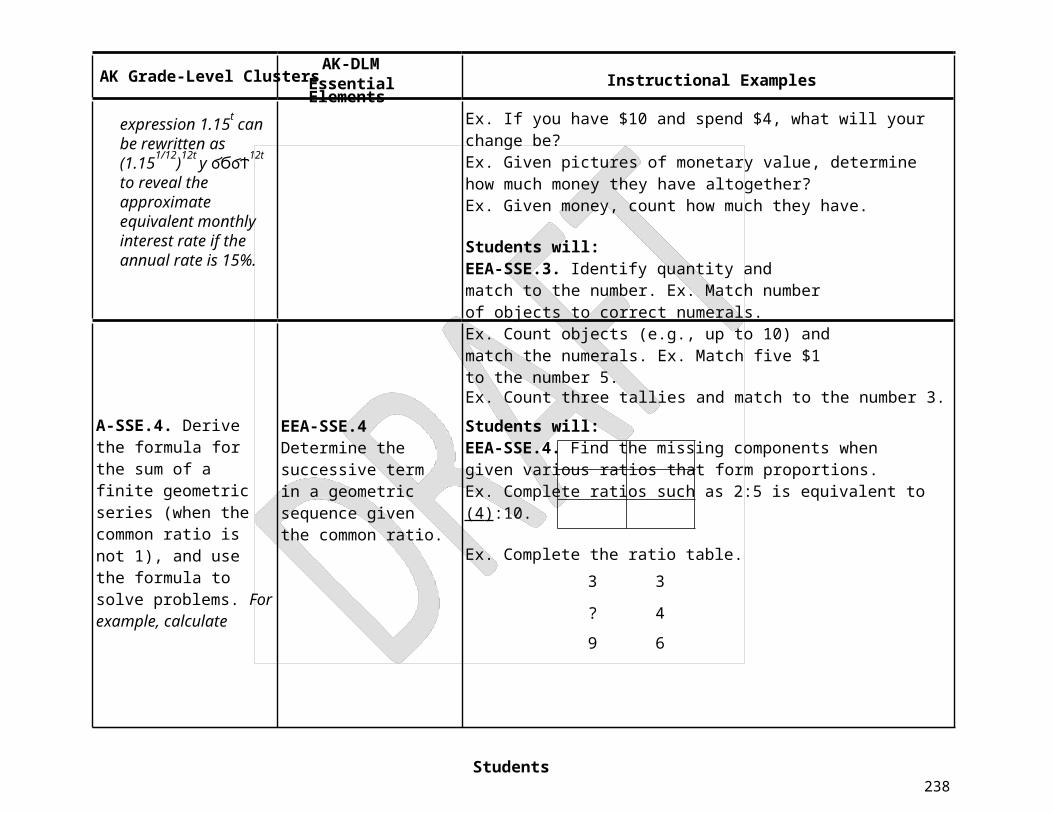
expression 1.15t can be rewritten as (1.151/12)12t
у ϭ ͘ϬϭϮ12t to reveal the approximate equivalent monthly interest rate if the annual rate is 15%.
Instructional Examples
Ex. If you have $10 and spend $4, what will your change be?Ex. Given pictures of monetary value, determine how much money they have altogether?Ex. Given money, count how much they have.
Students will:EEA-SSE.3. Identify quantity and match to the number. Ex. Match number of objects to correct numerals.Ex. Count objects (e.g., up to 10) and match the numerals. Ex. Match five $1 to the number 5.Ex. Count three tallies and match to the number 3.
A-SSE.4. Derive the formula for the sum of a finite geometric series (when the common ratio is not 1), and use the formula to solve problems. For example, calculate
EEA-SSE.4 Determine the successive term in a geometric sequence given the common ratio.
Students will:EEA-SSE.4. Find the missing components when given various ratios that form proportions.Ex. Complete ratios such as 2:5 is equivalent to (4 ) :10.
Ex. Complete the ratio table.3 3
? 4
9 6
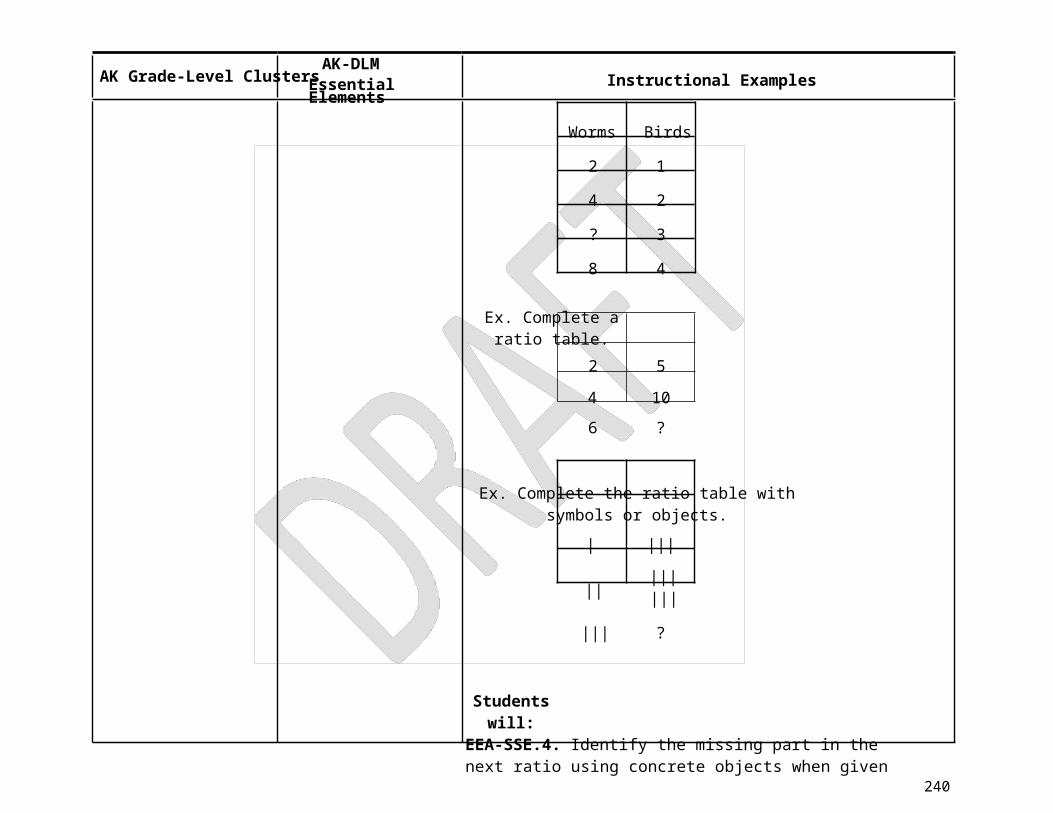
Students will:EEA-SSE.4. Identify the missing part in any other equivalent ratio when given any ratio.Ex. If there are two worms for every bird, how many worms would three birds get?
233
AK Grade-Level ClustersAK-DLM
Essential Elements Instructional Examples
Worms Birds
2 1
4 2
? 3
8 4
Ex. Complete a ratio table.2 5
4 10
6 ?
Ex. Complete the ratio table with symbols or objects.
| |||
||||||||
||| ?
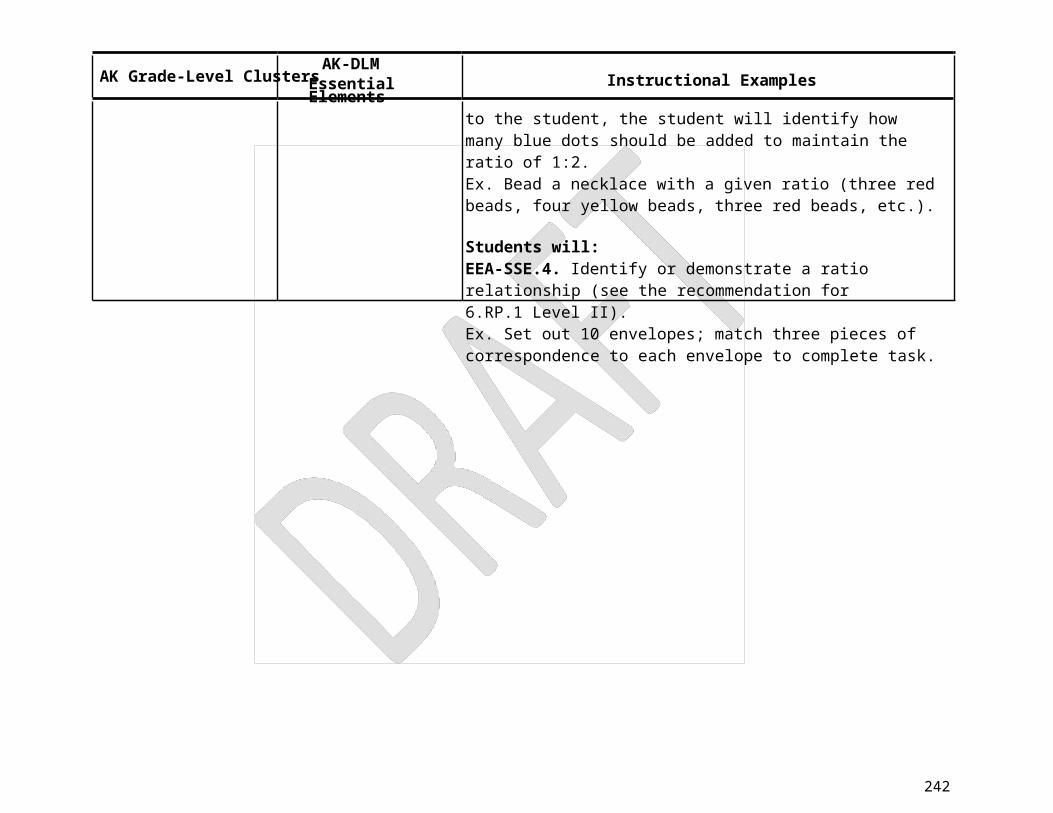
Students will:EEA-SSE.4. Identify the missing part in the next ratio using concrete objects when given a ratio (1:_).Ex. Find the pattern that exists between two-colored chips with the pattern of AABAABAABAAB.Ex. A student has one red dot and two blue dots. If another red dot is given

234
AK Grade-Level ClustersAK-DLM
Essential Elements Instructional Examples
to the student, the student will identify how many blue dots should be added to maintain the ratio of 1:2.Ex. Bead a necklace with a given ratio (three red beads, four yellow beads, three red beads, etc.).
Students will:EEA-SSE.4. Identify or demonstrate a ratio relationship (see the recommendation for 6.RP.1 Level II).Ex. Set out 10 envelopes; match three pieces of correspondence to each envelope to complete task.
235
High School Mathematics Standards: Algebra–Arithmetic with Polynomials and Rational Expressions
AK Grade-Level ClustersAK-DLM
Essential Elements Instructional Examples
Perform arithmetic operations on polynomials.
A-APR.1. Understand that polynomials form a system analogous to the integers, namely, they are closed under the operations of addition, subtraction, and multiplication; add, subtract, and multiply polynomials.
EEA-APR.1 N/A
236
High School Mathematics Standards: Algebra--Creating Equations
AK Grade-Level ClustersAK-DLM
Essential Elements Instructional Examples
Create equations that describe numbers or relationships.
A-CED.1. Create equations and inequalities in one variable and use them to solve problems. Include equations arising from linear and quadratic functions, and simple rational and exponential functions.
EEA-CED.1. Create an equation involving one operation with one variable, and use it to solve a real-world problem.
Students will:EEA-CED.1. Solve an algebraic expression with more than one variable. Ex. If I have two bills, one of them is a $5 and one of them is unknown. What is the value of the unknown bill if I have $10 total?Ex. If I have some money in my pocket and some money in the other pocket and I still need $3 more to buy the bird that cost $10, how much money is in my pockets?
Students will:EEA-SSE.3. Solve an algebraic expression using subtraction.Ex. If I need $10 and I have $5, how much more money do I need?Ex. If I have two bills, one of them is a $5 and one of them is a $1, how much money do I need to have $10?
Students will:EEA-SSE.3. Solve simple equations with unknown/missing values (without variables).Ex. If I have three dogs and one runs away, how many dogs are left? Ex. I walked to the store to buy a book. I gave the cashier $10 and she gives me back $7. How much was the book?Ex. If I have two pens in my backpack when I get to school and I left home with five pens, how many pens were given away on the trip from home to school?Ex. 5 – [ ] = 2. Ex. [ ] x 2 = 8.
Students will:EEA-SSE.3. Identify what is unknown.Ex. John has three cats and some dogs. Do we know the number of dogsJohn has?Ex. Allen ate some apples. Do we know how many he ate?
237
AK Grade-Level ClustersAK-DLM
Essential Elements Instructional Examples
A-CED.2. Create equations in two or more variables to represent relationships between quantities; graph equations on coordinate axes with labels and scales.
A-CED.3. Represent constraints by equations or inequalities, and bysystems of equations and/or inequalities, and interpret solutions asviable or nonviable options in a modeling context. For example, represent inequalities describing nutritional and cost constraints oncombinations of differentfoods.
A-CED.4. Rearrange formulas to highlight a quantity of interest, using the same reasoning as in solving equations. For example, rearrange Ohm’s law V = IR to highlight resistance R.
EEA-CED.2-4. Solve one- step inequalities.
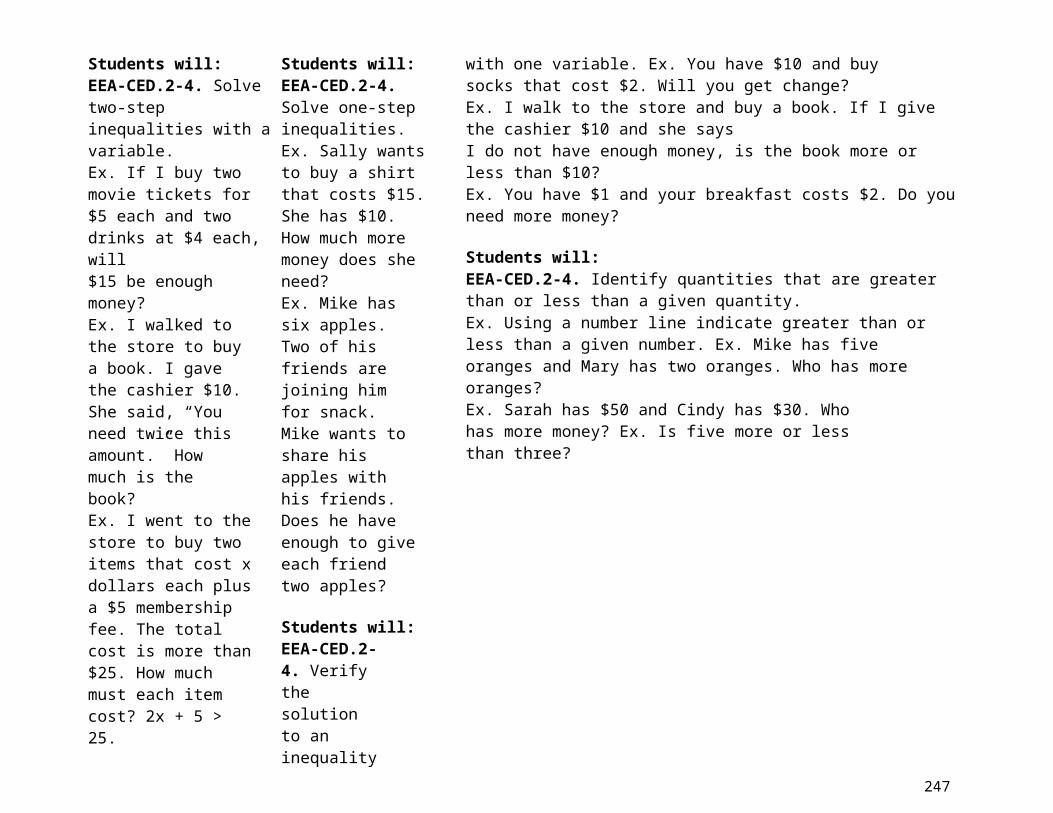
Students will:EEA-CED.2-4. Solve two-step inequalities with a variable.Ex. If I buy two movie tickets for $5 each and two drinks at $4 each, will$15 be enough money?Ex. I walked to the store to buy a book. I gave the cashier $10. She said, “You need twice this amount.” How much is the book?Ex. I went to the store to buy two items that cost x dollars each plus a $5 membership fee. The total cost is more than $25. How much must each item cost? 2x + 5 > 25.
Students will:EEA-CED.2-4. Solve one-step inequalities.Ex. Sally wants to buy a shirt that costs $15. She has $10. How much more money does she need?Ex. Mike has six apples. Two of his friends are joining him for snack. Mike wants to share his apples with his friends. Does he have enough to give each friend two apples?
Students will:EEA-CED.2-4. Verify the solution to an inequality with one variable. Ex. You have $10 and buy socks that cost $2. Will you get change?Ex. I walk to the store and buy a book. If I give the cashier $10 and she saysI do not have enough money, is the book more or less than $10?Ex. You have $1 and your breakfast costs $2. Do you need more money?
Students will:EEA-CED.2-4. Identify quantities that are greater than or less than a given quantity.Ex. Using a number line indicate greater than or less than a given number. Ex. Mike has five oranges and Mary has two oranges. Who has more oranges?Ex. Sarah has $50 and Cindy has $30. Who has more money? Ex. Is five more or less than three?
AK Grade-Level ClustersAK-DLM
Essential ElementsRange of Complexity Examples
Ex. If Sue has baseball cards and Tim has five, who has the most/fewest baseball cards?
238
239
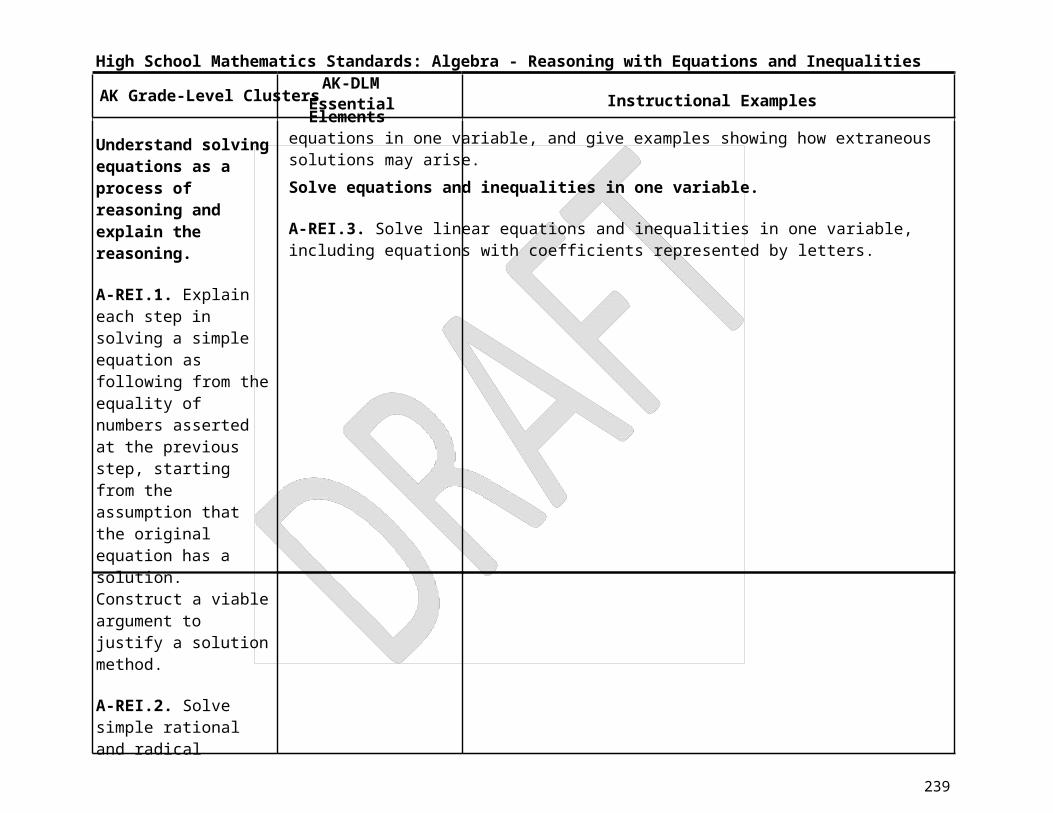
High School Mathematics Standards: Algebra - Reasoning with Equations and Inequalities
AK Grade-Level ClustersAK-DLM
Essential Elements Instructional Examples
Understand solving equations as a process of reasoning and explain the reasoning.
A-REI.1. Explain each step in solving a simpleequation as following from the equality of numbers asserted at the previous step, starting from the assumption that the original equation has a solution. Construct a viable argument to justify a solution method.
A-REI.2. Solve simple rational and radical equations in one variable, and give examples showing how extraneous solutions may arise.Solve equations and inequalities in one variable.
A-REI.3. Solve linear equations and inequalities in one variable, including equations with coefficients represented by letters.
EEA-REI.1-2. N/A
EEA-REI.3. N/A (See EEA- ECED.1-2.)
240
AK Grade-Level ClustersAK-DLM
Essential Elements Instructional Examples
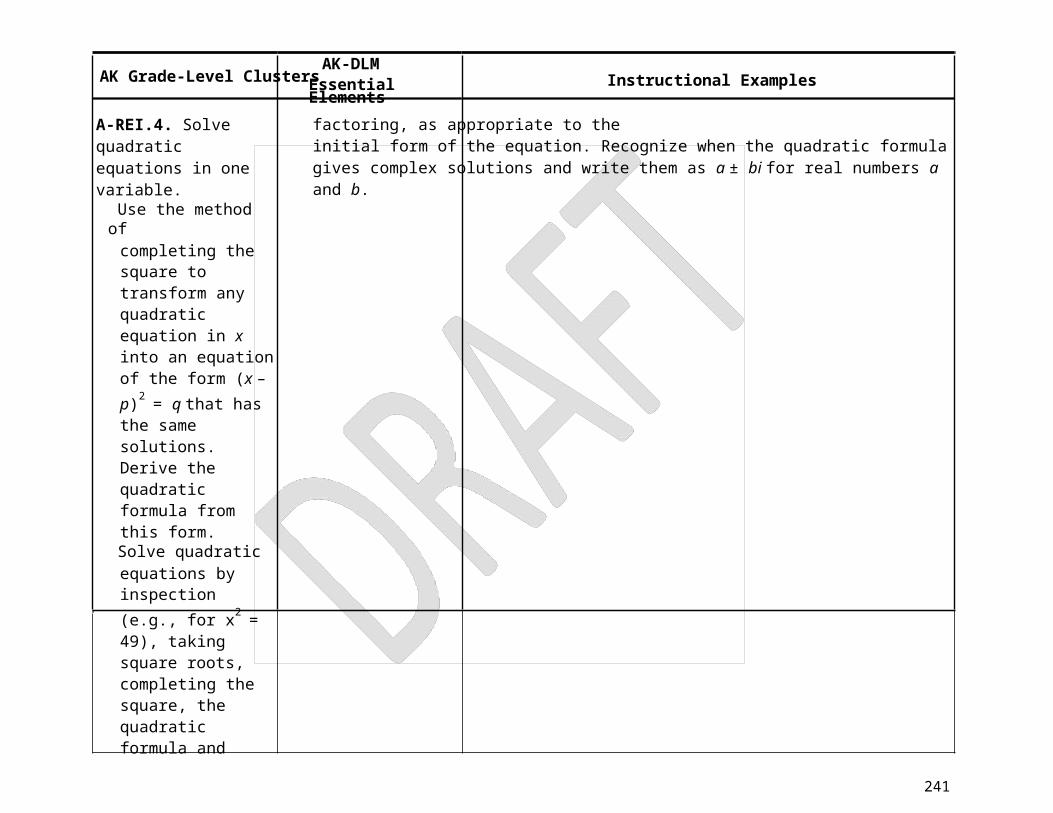
A-REI.4. Solve quadratic equations in one variable.� Use the method of
completing the square to transform any quadratic equation in x into an equation of the form (x – p)2 = q that has the same solutions. Derive the quadratic formula from this form.
� Solve quadraticequations by inspection (e.g., for x2 = 49), taking square roots, completing the square, the quadratic formula and factoring, as appropriate to theinitial form of the equation. Recognize when the quadratic formula gives complex solutions and write them as a ± bi for real numbers a and b.
241
AK Grade-Level ClustersAK-DLM
Essential Elements Instructional Examples
Represent and solve equations and inequalities graphically.
A-REI.10. Understand that the graph of an equation in two variables is the set of all its solutions plotted inthe coordinate plane, oftenforming a curve (which could be a line).
EEA-REI.10.-12. Interpret the meaning of a point on the graph of a line. For example, on a graph of pizza purchases, trace the graph to a point and tell the number of pizzas purchased and the total cost of pizzas.
Students will:EEA-REI.10. Make a prediction using the graph of an equation with two variables that form a line when plotted using the trend of the line.Ex. Given the graph of a linear function based on real-world situations (e.g., How much money do I earn (y) if I work a given number of hours (x) at $5 dollars per hour; (y = 5 x hours), use this information to make predictions (e.g., If you work six hours, how much will you make?).Ex. Given the graph of a linear function based on cost per pizza and thenumber of pizzas bought (e.g., If pizza is $5, then the total cost (y) = 5 x the number bought (x)), use this information to make predictions.
242
AK Grade-Level ClustersAK-DLM
Essential Elements
A-REI.11. Explain why the Students will:
Instructional Examples
x-coordinates of the points where the graphs of the equations y = f(x) and y = g(x) intersect are the solutions of the equation f(x) = g(x); find the solutions approximately, e.g., using technology to graph the functions, make tables of values, or findsuccessive approximations. Include cases where f(x) and/or g(x) are linear, polynomial, rational, absolute value,exponential, andlogarithmic functions.
A-REI.12. Graph the solutions to a linear inequality in two variables as a half-plane (excluding the boundary in the case of a strict inequality), and graph the solution set to a system of linearinequalities in twovariables as the intersection of the corresponding half-planes.
EEA-REI.10. Determine the two pieces of information that are plotted on a graph of an equation with two variables that form a line when plotted.Ex. Follow the line on the graph to tell the two pieces of information in each point (total cost and Items bought).Ex. Given the graph of a linear function based on cost per pizza and the number of pizzas bought (e.g., number of pizzas bought and total price), follow the line on the graph to tell the two pieces of information at a given point.
Students will:A-REI.10. Use a graph of two variables to find the answer to a real-world problem.Ex. Locate objects using a map with pictorial cues using two coordinates tofind one position on a simple map.Ex. Gain basic information from a graph (total cost of two items).
Students will:A-REI.10. Identify major parts of a graph.Ex. Point to the numbers that tell me how many items I bought. Ex. Point to the numbers that tell me how much the total cost is.Ex. Trace the line with your finger – show where the line would go if it continued.
Num
ber o
fDa
ysAm
ount
of P
aint
in th
e Ca
n
243
High School Mathematics Standards: Functions--Interpreting Functions
AK Grade-Level ClustersAK-DLM
Essential Elements Instructional Examples
Understand the concept of EEF-IF.1-3. Use the concept Students will:a function and use function notation.
F-IF.1. Understand that a function from one set (called the domain) to another set (called the range) assigns to each element of the domain exactly one element of the range. If f is a function and x is an element of its domain, then f(x) denotes the output of f corresponding to the input x. The graph of f is the graph of the equation y = f(x).
F-IF.2. Use function notations, evaluate functions for inputs in their domains, and interpret statements that use function notation in terms of a context.
F-IF.3. Recognize that sequences are functions, sometimes defined recursively, whose domain
of function to solve problems.
EEF-IF.1-3. Use the concept of functions to identify how the two variables are affected.Ex. Given a graph showing the growth of a plant over a period of one month, identify that, as the number of days increase, plant height increases.
Plant Height
Ex. Given a graph that shows the amount of paint in can and the area painted, identify that, as the area painted increases, the amount of paint in the can decreases.
Area Painted
Ex. Tell the cost of movie tickets for five people if movies tickets are $3 per ticket.Ex. The amount of change you get from a drink machine if each drink cost$0.65. The amount of change you receive will be a function of how much you put into the machine.
Students will:EEF-IF.1-3. Use the concept of function to solve problems.Ex. Using a store scenario, one store charges students $2 more than another store for the same item. Tom purchases a caramel apple for $5.
244
AK Grade-Level ClustersAK-DLM
Essential Elements
is a subset of the integers. For example, the Fibonacci sequence is defined recursively by f(0) = f(1) = 1, f(n+1) = f(n) + f(n-ϭͿ ĨŽƌ Ŷ ш1.
Instructional Examples
What should Becky expect to pay for an identical apple at the more expensive store?Ex. Look at a graph to identify relationship between two variables (distance--time, cost--product, etc.) If every item cost $1 at a store, how much would five items cost?Ex. Determine the total distance traveled in 20 minutes using a table if you are traveling at a constant speed of one mile every 10 minutes.
Students will:EEF-IF.1-3. Solve problems using a table that shows basic relationships(may not involve a true function).Ex. Look at a weather chart to identify relationships between the day of the week and the temperature.Ex. Determine the number of shoes worn by four people using a graph that incorporates picture representations.Ex. From a given table displaying the cost of movie tickets, determine the cost of one ticket, two tickets, and three tickets.Ex. From a five-day weather forecast, identify the weather for Wednesday.
Interpret functions that
Students will:EEF-IF.1-3. Identify basic information located on graphs.Ex. Tell the day of the week on a graph/point to the activity on the graph. Ex. Identify a line on a line graph.Ex. Identify the highest bar on a bar graph. Ex. Recognize different types of graphs.
EEF-IF.4-6. Interpret rate of Students will:arise in applications in terms of the context.
F-IF.4. For a function that models a relationship between two quantities, interpret key features of
change (e.g., higher/lower, faster/slower).
EEF-IF.4-6. Evaluate key features of a graph (e.g., increasing, decreasing, constant.).Ex. Determine parts of graph illustrating an increase or decrease in speed.Ex. Using a graph illustrating change in temperature over a day, indicate times when the temperature increased, decreased, or stayed the same.
245
AK Grade-Level ClustersAK-DLM
Essential Elements
graphs and tables in terms Students will:
Instructional Examples
of the quantities, and sketch graphs showing key features given a verbal description of the relationship. Key features include intercepts; intervals where the function is increasing, decreasing, positive, or negative; relative maximums and minimums; symmetries;end behavior; and periodicity.
F-IF.5. Relate the domain of a function to its graph and, where applicable, to the quantitative relationship it describes.For example, if the function h(n) gives the number of person-hours it takes to assemble n engines in a factory, then the positive integers would be an appropriate domain for the function.
F-IF.6. Calculate and interpret the average rate of change of a function (presented symbolically or
EEF-IF.4-6. Interpret rate of change (e.g., higher/lower, faster/slower).Ex. Compare two graphs with different slopes to determine faster/slower rateEx. Compare a bus schedule with two buses, look and determine if one bus runs more frequently than the next bus on the route.
Students will:EEF-IF.4-6. Graph a simple linear equation represented by a table of values.Ex. Match the graph to its corresponding story.Ex. Plot the points from a table of values less than 10.
Students will:EEF-IF.4-6. Read a table.Ex. From a given table, find information. Ex. Read a bus schedule.Ex. Given a daily schedule, determine the time of lunch during the school day.
246
AK Grade-Level ClustersAK-DLM
Essential Elements Instructional Examples
as a table) over a specified interval. Estimate the rate of change from a graph.
247
AK Grade-Level ClustersAK-DLM
Essential Elements Instructional Examples
248
AK Grade-Level ClustersAK-DLM
Essential Elements Instructional Examples
249
High School Mathematics Standards: Functions--Building Functions
AK Grade-Level ClustersAK-DLM
Essential Elements Instructional Examples
Build a function that models a relationship between two quantities.
F-BF.1. Write a function that describes a relationship between two quantities.� Determine an explicit
expression, a recursive process, or steps for calculation from a context.
� Combine standardfunction types using arithmetic operations. For example, build a function that models the temperature of a cooling body by addinga constant function to a decaying exponential, and relate these functions to the model.
EEF-BF.1. Select the appropriate graphical representation (first quadrant) given a situation involving constant rate of change.
Students will:EEF.BF.1. Complete the appropriate graphical representation (first quadrant) given a situation involving constant rate of change.Ex. Given this scenario and a graphical representation with missing information: If I mow one lawn and I make $25 and if I mow three lawns and I make $75, how much will I make if I mow two lawns?Ex. Given this scenario and a graphical representation with missing information: If hamburgers are four for $1 and I buy four, it will cost $1; if I buy 12, it will cost $3 – complete the graph for eight hamburgers.
Students will:EEF-BF.1. Select the appropriate graphical representation (first quadrant)given a situation involving constant rate of change.Ex. Given this scenario and two completed graphs, show me the graph that shows the following: If I mow one lawn, I make $25; if I mow two lawns, I will make $50; and if I mow three lawns I will make $75.Ex. Given this scenario and two completed graphs, show me the graph that depicts that there are two cookies for every student.
Students will:EEF-BF.1. Select the appropriate graphical representation (first quadrant) given a situation involving constant rate of change where the difference is very clear.Ex. Every dog has one bone. Pick the graph that would represent this concept when given the following graphs.

250
AK Grade-Level ClustersAK-DLM
Essential Elements
Students will:
Instructional Examples
F-BF.2. Write arithmetic and geometric sequences both recursively and with an explicit formula, use them to model situations, and translate between the two forms.
EEF-BF.2. Determine an arithmetic sequence with whole numbers when provided a recursive rule.
EEF-BF.1. Identify the terms in a sequence.Ex. Identify an ABABABABAB pattern out of two different pattern sets of colored blocks using black (B) and white (W) and one set is BWBWBWBWBW and the other pattern set is BBWBBWBBWBBW.Ex. Place two pencils in front of each student in the classroom.
Students will:EEF-BF.2. Build an arithmetic sequence when provided a recursive rule with decreasing terms, decimals, or fractions.Ex. Starting at 100, subtract five each time to build a sequence.Ex. Starting at $5.50, add/subtract $0.50 each time to build a sequence.
Students will:EEF-FB.2. Build an arithmetic sequence when provided a recursive rule with whole numbers.Ex. Starting at four, add four each time to build a sequence (e.g., If one dog has four legs, how many will two dogs have, three dogs, etc.).Ex. Starting at five, add seven each time to build a sequence (e.g., If I have$5 and I earn $7 each hour – how much money will I have in four hours?).
Students will:EEF-BF.2. Identify a term in a sequence.Ex. Given a clear sequence (2, 4, 6, 8, . . . ), identify the next number in the set.Ex. Given the sequence 4, 2, 5, 1, 3, N, identify what is the value of N.
Students will:EEF-BF.2. Recognize a sequence.Ex. Given two lists of numbers or a set of manipulatives, identify the sequence in 5, 4, 3, 2, 1.Ex. Given two lists of numbers or a set of manipulatives, identify the sequence in 2, 4, 6, 8.Ex. Given a sequence, a picture of a ball, and a fraction, student can select the sequence.
251
AK Grade-Level ClustersAK-DLM
Essential Elements Instructional Examples

252
High School Mathematics Standards: Functions--Linear, Quadratic, and Exponential Models
AK Grade-Level ClustersAK-DLM
Essential Elements Instructional Examples
Construct and compare linear, quadratic, and exponential models and solve problems.
F-LE.1. Distinguish between situations thatcan be modeled with linear functions and with exponential functions.� Prove that linear
functions grow by equal differences over equal intervals, and that exponential functions grow by equal factors over equal intervals.
� Recognize situations inwhich one quantity changes at a constant rate per unit interval relative to another.
� Recognize situations inwhich a quantity grows or decays by a constant percent rate per unit interval relative to another.
F-LE.2. Construct linear and exponential functions,
EEF-LE.1. Model a simple linear function such as y = mx to show functions grow by equal factors over equal intervals.
Students will:EEF-LE.1. Plot points using pictures in first quadrant on a graph using whole numbers and explain how y increases/decreases as x changes.Ex. If you go to the store where every item is one dollar, students should state y = x (the number of items I buy will tell me the cost). Students will then plot this on the graph.Ex. If I get two apples for every orange I buy, students should state that y =2x, or for every orange I buy (x), I will get two apples (y), therefore x times two tells me the number of apples each time. Students should then plot this on the graph.
Student will:EEF-LE.1. Model a simple linear function such as y = mx to show functions grow by equal factors over equal intervals.Ex. Determine a simple relationship of y to x by looking at the first quadrant of a graph.Ex. Identify the cost per item on a simple graph where every item in the store cost the same amount and state the relationship between x and y. Ex. Look at a graph that shows a constant ratio of boys to girls and state the relationship between x and y.
Students will:EEF-LE.1. Identify a specific data point in the first quadrant and explain the meaning behind it.Ex. Given data points in the first quadrant, identify the named point andstate the two pieces of information that one dot provides.Ex. When given a simple graph that shows the total cost of itemspurchased at a store where every item is $1, tell the cost of four items, the cost of two items, etc.
Students will:EEF-LE.1. Interpret major ideas of a graph with linear functions.
253
AK Grade-Level ClustersAK-DLM
Essential Elements
including arithmetic and geometric sequences,given a graph, a description of a relationship, or two input-output pairs (include reading these from atable).
F-LE.3. Observe using graphs and tables that a quantity increasing exponentially eventually exceeds a quantity increasing linearly, quadratically, or (more generally) as a polynomial function.
Instructional Examples
Ex. When shown two lines on a graph, tell which one is rising faster.Ex. When shown a graph of distance driven and gas left in tank, explain that the further one drives the less gas one has left.

254
AK Grade-Level ClustersAK-DLM
Essential Elements Instructional Examples
255
High School Mathematics Standards: Functions--Trigonometric Functions
AK Grade-Level ClustersAK-DLM
Essential Elements Instructional Examples
256
AK Grade-Level ClustersAK-DLM
Essential Elements Instructional Examples
257
High School Mathematics Standards: Geometry—Congruence
AK Grade-Level ClustersAK-DLM
Essential Elements Instructional Examples
Experiment with transformations in the
EEG-CO.1. Know the attributes of perpendicular
Students will:EEG-CO.1. Compare attributes of perpendicular lines, parallel lines, line
plane. lines, parallel lines, and line segments, angles, and circles.
G.CO.1. Know precise definitions of angle, circle, perpendicular line, parallel line, and line segment, based on the undefined notions of point, line, distance along a line, and distance around a circular arc.
segments, angles, and circles.
Ex. Draw examples of perpendicular lines, parallel lines, and line segments, angles, and circles.Ex. How are lines and line segments different? Ex. How are lines and circles similar?
Students will:EEG-CO.1. Know the attributes of perpendicular lines, parallel lines, and line segments, angles, and circles.Ex. How are parallel and perpendicular lines similar? How are they different?Ex. Given two examples, which of these is a(n) ? Ex. Which is perpendicular?+ || OEx. Given a grid on a floor with masking tape, identify parallel lines.Ex. Given a map, identify a road that runs somewhat perpendicular to another road.
Students will:EEG-CO.1. Know the attributes of lines, circles, and angles with equivalent measure.Ex. When shown the trajectory of movement of an object, predict where the object will go.Ex. Determine line, circle, and angles and describe them (e.g., circles are round).Ex. Put two objects next to each other and determine which is longer. Ex. Draw a line, circle, or angle.
Students will:EEG-CO.1. Identify a line and a shape (e.g., circle, square, triangle).
258
AK Grade-Level ClustersAK-DLM
Essential Elements
Ex. Point to a line.
Instructional Examples
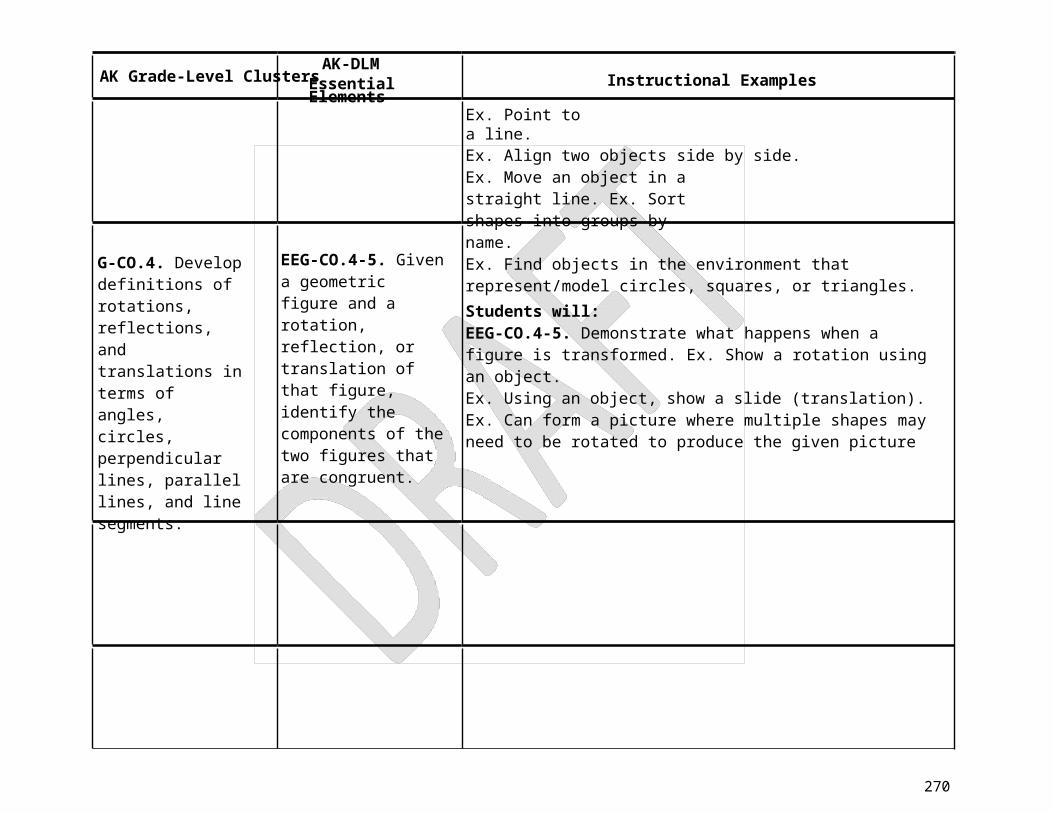
G-CO.4. Develop definitions of rotations, reflections, and translations in terms of angles, circles, perpendicular lines, parallel lines, and line segments.
EEG-CO.4-5. Given a geometric figure and a rotation, reflection, or translation of that figure, identify the components of the two figures that are congruent.
Ex. Align two objects side by side.Ex. Move an object in a straight line. Ex. Sort shapes into groups by name.Ex. Find objects in the environment that represent/model circles, squares, or triangles.Students will:EEG-CO.4-5. Demonstrate what happens when a figure is transformed. Ex. Show a rotation using an object.Ex. Using an object, show a slide (translation).Ex. Can form a picture where multiple shapes may need to be rotated to produce the given picture
259
AK Grade-Level ClustersAK-DLM
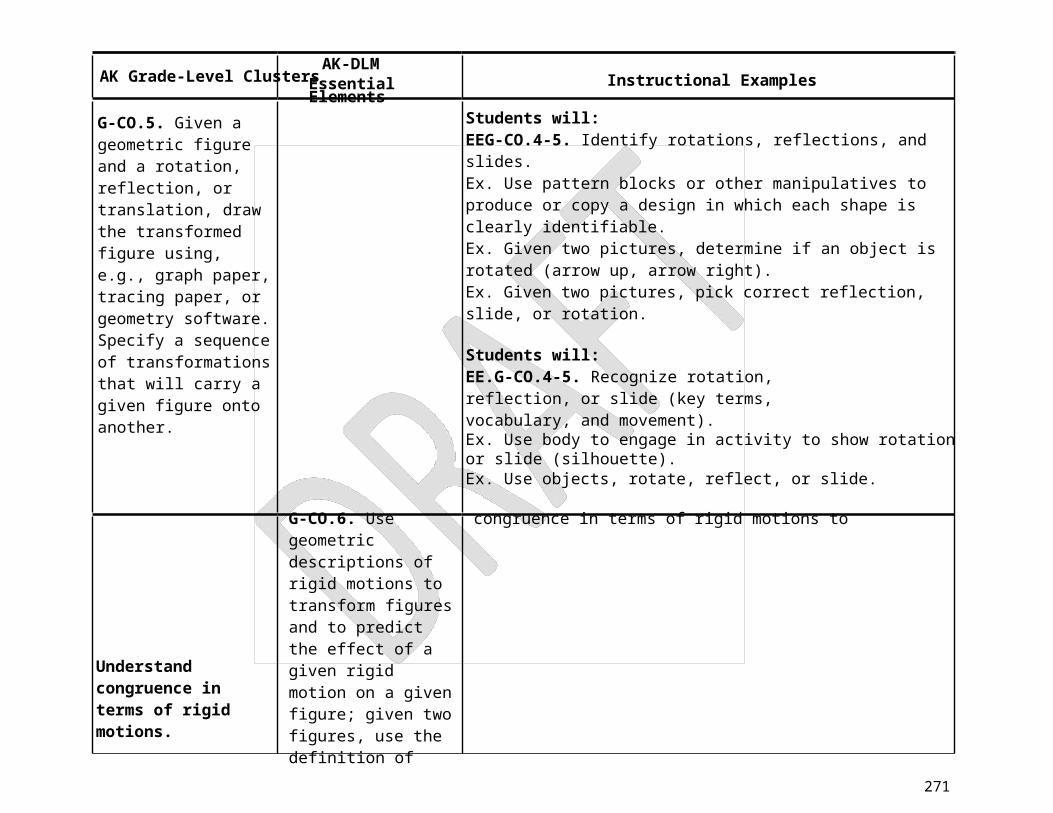
Essential ElementsG-CO.5. Given a geometric figure and a rotation, reflection, or translation, draw the transformed figure using, e.g., graph paper, tracing paper, or geometry software. Specify a sequence of transformations that will carry a given figure onto another.
Instructional Examples
Students will:EEG-CO.4-5. Identify rotations, reflections, and slides.Ex. Use pattern blocks or other manipulatives to produce or copy a design in which each shape is clearly identifiable.Ex. Given two pictures, determine if an object is rotated (arrow up, arrow right).Ex. Given two pictures, pick correct reflection, slide, or rotation.
Students will:EE.G-CO.4-5. Recognize rotation, reflection, or slide (key terms, vocabulary, and movement).Ex. Use body to engage in activity to show rotation or slide (silhouette).Ex. Use objects, rotate, reflect, or slide.
Understand congruence in terms of rigid motions.
G-CO.6. Use geometric descriptions of rigid motions to transform figures and to predict the effect of a given rigid motion on a given figure; given two figures, use the definition of congruence in terms of rigid motions to
EEG-CO.6-8. Identify corresponding congruent and similar parts of shapes.
Students will:EEG-CO.4-5. Attend to movement demonstrating rotations, reflections, and slides.Ex. Teacher slides an object, follow with eyes. Ex. Teacher rotates an object, follow motion.
Students will:EEG-CO.6-8. Demonstrate why shapes are congruent.Ex. Communicate why two given congruent shapes are congruent.Ex. Given two non-congruent shapes, communicate why the shapes are not congruent.
Students will:EEG-CO.6-8. Identify corresponding congruent (the same) parts of shapes. Ex. Given two congruent triangles, identify the corresponding sides.Ex. Given two congruent items (stars, squares, etc.), identify the corresponding parts.Ex. Given two shapes that are not congruent but are similar, identify the
260
AK Grade-Level ClustersAK-DLM
Essential Elements
decide if they are congruent.
similar parts.
Students will:
Instructional Examples
G-CO.7. Use the definition of congruence in terms of rigid motions to show that two triangles are congruent if and only if corresponding pairs of sides and corresponding pairs of angles are congruent.
G-CO.8. Explain how the criteria for triangle congruence (ASA, SAS, and SSS) follow from the definition of congruence in terms of rigid motions.
EEG-CO.6-8. Recognize congruent parts (angles and sides). Ex. Identify the congruent parts of a rectangle.Ex. Identify the congruent angles of an isosceles triangle.
Students will:EEG-CO.6-8. Recognize shapes that are congruent. Ex. Given a shape, match a congruent shape.Ex. Given three shapes, pick the two that are congruent.
261
AK Grade-Level ClustersAK-DLM
Essential Elements Instructional Examples
262
AK Grade-Level ClustersAK-DLM
Essential Elements Instructional Examples
263
High School Mathematics Standards: Geometry - Similarity, Right Triangles, and Trigonometry
AK Grade-Level ClustersAK-DLM
Essential Elements Instructional Examples
264
AK Grade-Level ClustersAK-DLM
Essential Elements Instructional Examples
265
AK Grade-Level ClustersAK-DLM
Essential Elements Instructional Examples
266
High School Mathematics Standards: Geometry--Circles
AK Grade-Level ClustersAK-DLM
Essential Elements Instructional Examples
267
AK Grade-Level ClustersAK-DLM
Essential Elements Instructional Examples
268
High School Mathematics Standards: Geometry - Expressing Geometric Properties with Equations
AK Grade-Level ClustersAK-DLM
Essential Elements Instructional Examples
269
AK Grade-Level ClustersAK-DLM
Essential Elements Instructional Examples
G-GPE.7. Use coordinates to compute perimeters of polygons and areas of triangles and rectangles, e.g., using the distance formula.
EEG-GPE.7. Find perimeter and area of squares and rectangles to solve real- world problems.
Students will:EEG-GPE.7. Use formulas to find perimeter and area of squares and rectangles to solve real-world problems.Ex. Find the perimeter using p = side + side + side + side.Ex. Find the area of the classroom floor using A = length x width.
Students will:EEG-GPE.7. Find perimeter and area of squares and rectangles to solve real-world problems.Ex. Find the perimeter by adding the length of the sides to determine how much fence you will need to go around your garden.Ex. Find the area of a room on a grid to decide how many tiles (one grid each) you will need to cover the area of your room.Ex. Determine the number of one-foot-square sections needed to make a tabletop garden that is four feet by four feet square.
Students will:EEG-GPE.7. Find perimeter or area by counting on a grid.
270
AK Grade-Level ClustersAK-DLM
Essential Elements Instructional Examples
Ex. Find the perimeter of a small room on a grid. Ex. Draw a shape on a grid and find the perimeter.
Students will:EEG-CPE.7. Identify inside, around, and outside of a closed figure. Ex. Identify position of a dog as inside or outside the fenced yard.Ex. Choose the term (inside, around, or outside) to describe position.
271
High School Mathematics Standards: Geometry--Geometric Measurement and Dimension
AK Grade-Level ClustersAK-DLM
Essential Elements Instructional Examples
Explain volume formulas and use them to solve problems.
G-GMD.1. Give an informal argument for the formulas for the circumference of a circle, area of a circle, volume of a cylinder, pyramid, and cone. Use dissection arguments, Cavalieri’s principle, and informal limit arguments.
Visualize relationships between two-dimensional and three-dimensional objects.
EEG-GMD.1-3. Make a prediction about the volume of a container, the area of a figure, and the perimeter of a figure, and then the prediction using formulas or models.
EEG-GMD.4. Identify the shapes of two-dimensional cross-sections of three-dimensional objects.
Students will:EEG-GMD.1-3. Apply knowledge of volume to make appropriate volumetric estimates.Ex. Select appropriate tool to fill a pitcher and estimate the number of proportions needed to fill a five-gallon bucket (teaspoon, cup, bucket). Ex. Select appropriate tool to measure flour for a cake – cup or bucket. Ex. Convert – how many cups in a pint – given cups and a pint container filled with water.
Students will:EEG-GMD.1-3. Make a prediction based on knowledge of volume to identify volume of common containers (cups, pints, gallons, etc.).Ex. Which will hold more than three cups, a gallon or a pint? (Objects: cup, teaspoon, gallon)Ex. Which is a gallon? (Objects: teaspoon, cup, gallon)Ex. If I wanted to carry a gallon of water, would I use a bucket or a cup?
Students will:EEG-GMD.1-3. Which is more or less?Ex. Which shaped peg can fit inside each sculpted hole? Ex. Which container has more marbles in it?Ex. Which container has less marbles in it?
Students will:EEG-GMD.1-3. Experience volume. Ex. Point to the empty cup.Ex. Point to the full container.Ex. Indicate which container will hold more water (e.g., bucket or cup).
Students will:EEG-GMD.4. Use the properties of two-dimensional and three-dimensional objects to solve real-world problems.Ex. Determine how much cereal a container can hold using standard
272
AK Grade-Level ClustersAK-DLM
Essential Elements Instructional Examples
G-GMD.4. Identify the shapes of two-dimensional cross-sections of three- dimensional objects, and identify three-dimensional objects generated by rotations of two- dimensional objects.
Ex. Using the dimensions of a shelf to determine how many boxes would fit.
Students will:EEG-GMD.4. Distinguish between two-dimensional and three-dimensional objects to solve real-world problems.Ex. Build a floor and walls of a building using technology or blocks.Ex. Describe the differences between a map of the school and the model of the school.Ex. Identify height as a dimension of three-dimensional objects.Ex. Show use of spatial relationships by stacking boxes to specified dimensions (length, width, height).
Students will:EEG-GMD.4. Distinguish between two-dimensional and three-dimensional Ex. Classify two-dimensional and three-dimensional objects by their use (e.g., Which of these can you use as a container, a box, or a square?).Ex. Given two examples, which is a cube and which is square?Ex. Given a picture of a silo, a square building, and a box, determine which three-dimensional object corresponds to a circle.Ex. Which can hold cereal: a square or a box?
Students will:EEG-GMD.4. Identify two-dimensional shapes. Ex. Identify squares from non-squares.Ex. Choose polygons from line segments and angles.
273
High School Mathematics Standards: Geometry--Modeling with Geometry
AK Grade-Level ClustersAK-DLM
Essential Elements Instructional Examples
Apply geometric concepts in modeling situations.
G-MG.1. Use geometric shapes, their measures, and their properties to describe objects (e.g., modeling a tree trunk or ahuman torso as a cylinder).
G-MG.2. Apply concepts of density based on area and volume in modeling situations (e.g., personsper square mile, BTUs per cubic foot).
G-MG.3. Apply geometric methods to solve design problems (e.g., designing an object or structure to satisfy physical constraints or minimize cost; working with typographic grid systems based on ratios).
EEG-MG.1-3. Use properties of geometric shapes to describe real-life objects.
Students will:G-MG.1-3. Apply geometric methods to solve design problems.Ex. Identify the two-dimensional shapes that create the three-dimensional figure (e.g., I can see four triangles in a pyramid; I can see six squares on the outside of a cube).Ex. Determine the least number of tiles needed to cover the outside of a cubed figure (glue tiles onto a box).Ex. How many cups of water will this cylinder hold?Ex. Determine the amount of materials needed to wrap a present.
Students will:EEG-MG.1-3. Use properties of geometric shapes to describe real-life objects.Ex. Name everyday objects in terms of geometric shapes (can of soda is a cylinder, box of cereal is a rectangular prism).Ex. Describe the sides of a box of tissues (ends are squares, sides are rectangles).Ex. How many small square boxes (cubes)can I fit into a large cube? Ex. How many boxes (cubes) will fit on this shelf?Ex. Determine the dimensions of a classroom (length, width, and height.)
Students will:EEG-MG.1-3. Identify geometric shapes.Ex. Find real-life objects that have similar characteristics to a sphere.Ex. Given a cube, determine what real-life object has similar characteristics to a cube.
Students will:EEG-MG.1-3. Compare the capacity of three-dimensional objects. Ex. Which has the greatest capacity, a house or a school?Ex. Determine which holds more, a cup or a barrel?
274
High School Mathematics Standards: Statistics and Probability--Interpreting Categorical and Quantitative Data
AK Grade-Level ClustersAK-DLM
Essential Elements
Summarize, represent, and EES-ID.1-2. Given data, Students will:
Instructional Examples
interpret data on a single count or measurement variable.
S-ID.1. Represent data with plots on the real number line (dot plots, histograms, and box plots).
S-ID.2. Use statistics appropriate to the shape of the data distribution to compare center (median, mean) and spread (interquartile range, standard deviation) of two or more different data sets.
Construct a simple graph (line, pie, bar, or picture) or table, and interpret the data.
EES-ID.1-2. Collect and organize data in simple graphs and use findings to draw conclusions from the data.Ex. Ask 10 people how many hours of TV they watch a day. Put the findings into a graph and tell which person watches the most and least TV.Ex. Collect data on a given topic and tell what conclusions they draw from the data, such as most common weather in two cities, cheapest price of jeans, etc.
Students will:EES-ID.1-2. Given data, construct a simple graph (table, line, pie, bar, or picture) and answer questions about the data.Ex. Given data about the cost of jeans at three stores, place the information on a graph (table, line, pie, bar, or picture) and answer questions about the graph.Ex. Read data from a given graph showing the weather for one week and determine how many days it was rainy.Ex. Given data from student surveys (e.g., favorite sport, subject, book) presented on a bar or pie graph and answer questions about the findings (most/least).Ex. Interpret weather data (e.g., temperature changes over time)presented in a line graph.
Students will:EES-ID.1-2. Given a graph, answer simple questions.Ex. Identify the highest and lowest points on a graph (costs the most).Ex. Tell what the simple graph represents (graph about the weather, cell phone plans, or gas prices).Ex. Read data from a given graph showing the weather for one week to tell how many days was it rainy.
275
AK Grade-Level ClustersAK-DLM
Essential Elements
Students will:
Instructional Examples
S-ID.3. Interpret differences in shape, center, and spread in the context of the data sets, accounting for possible effects of extreme data points (outliers).
EES-ID.3. Indicate general trends on a graph or chart.
EES-ID.1-2. Identify any part of a simple graph.Ex. Point to and identify part of simple graph (such as the bar, line, title, labels on the graph).Ex. Point or indicate to answer, “Which is the tallest/highest bar?”
Students will:EES-ID.3. Extend a graph or chart to make a prediction.Ex. If the weatherman says there is a 60% chance of rain, should you wear a rain coat?Ex. Show a graph, predict which direction the line will continue and answer predictive questions.Ex. Using a graph, estimate a future point when the trend of the line is not extremely clear.
Students will:EES-ID.3. Indicate general trends on a graph or chart.Ex. Which chart shows an increase? A chart with an upward slope or a chart with a downward slope.Ex. Which chart shows a decrease? A chart with an upward slope or a chart with a downward slope.Ex. Using a graph, estimate a future point when the trend of the line is clear.
Students will:EES-ID.3. Demonstrate increase and decrease over time. Ex. Is this point more or less than this point?Ex. Is this line (slope) increasing or decreasing?Ex. Collect data that has a trend possibility (e.g., growing plant, collecting money).Ex. Ordinate piles of money, items to show increase/decrease.Ex. When shown two graphs, determine which shows increase and which shows decrease.

276
AK Grade-Level ClustersAK-DLM
Essential Elements
Students will:
Instructional Examples
S-ID.4. Use the mean and standard deviation of a
EES-ID.4. Calculate the mean of a given data set
EES-ID.3. Determine categories needed on a graph.Ex. We are charting plant growth. Should I put the length of the monkey’s tail on the graph?Ex. Describe sample space – are we looking at oranges or apples? Ex. We are counting apples. Do shoes belong on this graph?
Students will:EES-ID.4. Calculate the mean of a given data set (more than five data
data set to fit it to a normal (limit the number of points).distribution and to estimate population percentages. Recognize that there are data sets for which such a procedure is not appropriate. Use calculators, spreadsheets, and tables to estimate areas under the normal curve.
data points to fewer than five).
Ex. Calculate the mean of price lists for a video in six different stores.Ex. Calculate the mean number of hours students spend watching TV over a week.
Students will:EES-ID.4. Calculate the mean of a given data set (limit data points to less than five).Ex. Given rainfall amounts for four days, determine the average rainfall. Ex. Given the price of each pair, determine the average price of four pairs of shoes.
Students will:EES-ID.4 Identify the average between two consecutive numbers.Ex. Given two consecutive numbers on a number line, determine the mean value. (Determine the mean value of 2 and 3.)
Students will:EES-ID.4. Identify the missing number between two data points.Ex. Given two consecutive even numbers or two consecutive odd numbers, determine the number in the middle.
277
AK Grade-Level ClustersAK-DLM
Essential Elements Instructional Examples

278
AK Grade-Level ClustersAK-DLM
Essential Elements Instructional Examples
279
High School Mathematics Standards: Statistics and Probability--Making Inferences and Justifying Conclusions
AK Grade-Level ClustersAK-DLM
Essential Elements Instructional Examples
Understand and evaluate random processes underlying statistical experiments.
S-IC.1. Understand statistics as a process for making inferences about population parameters based on a random sample from that population.
S-IC.2. Decide if a specified model is consistent with results from a given data- generating process, e.g., using simulation. For example, a model says a spinning coin falls heads up with probability 0.5. Would a result of 5 tails in a row cause you to question the model?
EES-IC.1-2. Determine the likelihood of an event occurring when the outcomes are equally likely to occur.
Students will:EES-IC.1-2. Determine the likelihood of an event occurring when the outcomes are not equally likely to occur.Ex. You have a bag of marbles with five red, four blue, six white, and five yellow marbles. What is the probability of choosing a white marble?Ex. Your drawer contains seven pairs of white socks and three pairs of black socks. What is the probability of choosing a white pair?
Students will:EES-IC.1-2. Determine the likelihood of an event occurring when the outcomes are equally likely to occur.Ex. A spinner contains four colors: blue, red, green, and yellow. What is the probability of landing on red?Ex. A die is rolled. What is the probability of landing on a four?Ex. You have three blue candies, seven green candies, and four red candies in a bag. Which color are you most likely to draw out of the bag?
Students will:EES-IC.1-2. Determine the possible outcomes of an event occurring.Ex. A spinner contains four colors (blue, red, green, and yellow). List all of the possible outcomes.Ex. What are the possible outcomes of rolling a die?Ex. What are the possible outcomes when flipping a coin?
Students will:EES-IC.1-2. Identify one event or outcome of an event occurring.Ex. Given a spinner with four colors, identify one color as a possible outcome.Ex. Given a die, identify five as a possible outcome.
280
AK Grade-Level ClustersAK-DLM
Essential Elements Instructional Examples
281
High School Mathematics Standards: Statistics and Probability--Conditional Probability and the Rules of Probability
AK Grade-Level ClustersAK-DLM
Essential Elements Instructional Examples
Understand independence and conditionalprobability and use them to interpret data.
S-CP.1. Describe events as subsets of a sample space (the set of outcomes) using characteristics (or categories) of the outcomes, or as unions, intersections, or complements of other events (“or,” “and,” “not”).
S-CP.2. Understand that two events A and B are independent if the probability of A and B occurring together is the product of their probabilities, and use this characterization to determine if they are independent.S-CP.3. Understand the conditional probability of A given B as P(A and B)/P(B), and interpretindependence of A and B as saying that the conditional probability of A
EES-CP.1-4. Identify when events are independent or dependent.
Students will:EES-CP.1-4. Find the probability of an event after another event has occurred.Ex. Find the probability of the next coin flip after a succession of coin flips (e.g., If Joe flipped a coin four times in row and got heads each time, what is the probability of getting heads on the next flip?).Ex. Find the probability of drawing a particular color after a succession of draws (e.g., If Sam had three dice in a bag--one red, one blue, and one green--what is the probability of drawing and rolling a blue?).Ex. Find the probability of drawing a particular color after the color hasbeen withdrawn (e.g., A bag contains four blue, three red, two yellow, and one black balls. Wes randomly selected the black ball. What is the probability he will select a yellow ball next if the black ball is not replaced in the bag?).
Students will:EES-CP.1-4. Identify when events are independent or dependent.Ex. When asked if winning the lottery depends on the weather, reply no. Ex. When asked if the basketball game is likely to be canceled if it rains, reply no.Ex. When asked if the baseball game is likely to will be canceled if it rains, indicate likely.Ex. When asked whether catching the bus depends upon whether you get up on time, reply yes.
Students will:EES-CP.1-4. Identify the outcomes of an event.Ex. What happens when an egg falls off the table?Ex. Two red and two blue balls are in a bag, two balls are taken out, what colors (two red, two blue, or red and blue) could the balls be?
282
AK Grade-Level ClustersAK-DLM
Essential Elements
given B is the same as the Students will:
Instructional Examples
probability of A, and the conditional probability of B given A is the same as the probability of B.
S-CP.4. Construct and interpret two-way frequency tables of data when two categories are associated with eachobject being classified. Usethe two-way table as a sample space to decide if events are independent and to approximate conditional probabilities. For example, collect data from a random sample of students in your school on their favorite subject among math, science, and English. Estimate theprobability that a randomly selected student from your school will favor science given that the student is in tenth grade. Do the same for other subjects and compare the results.
S-CP.5. Recognize and explain the concepts of
EES-CP.1-4. Determine which event occurs first in a sequence. Ex. Which is put on first, socks or shoes?Ex. Using a daily schedule, what activity would come next?
283
AK Grade-Level ClustersAK-DLM
Essential Elements Instructional Examples
conditional probability and independence in everyday language and everyday situations. For example, compare the chance of having lung cancer if you are a smoker with the chance of being a smoker if you have lung cancer.