mathematical modeling in cancer cell biology...4 figure 16-7: molecular biology of the cell (©...
TRANSCRIPT

1
Mathematical Modeling in Cancer Cell Biology
Takashi Suzuki
Division of Mathematical Science Department of Systems Innovation
Graduate School of Science Osaka University
Benign Tumor and Malignant TumorBenign Tumor and Malignant TumorBenign Tumor and Malignant TumorBenign Tumor and Malignant Tumor
■ Adenoma : glandular system (benign)
■ Adeno-carcinoma :invasion to surrounding tissues (malignant)
■ Stroma:tissue surrounding tumor, ex-cellular matrix, blood cell, glandular cell

2
Hematogenous Metastasis Hematogenous Metastasis Hematogenous Metastasis Hematogenous Metastasis
Figure 20-17 Molecular Biology of the Cell (© Garl and Science 2008)
cell deformationECM degradation
in-traverse
extra-traverse
basement membrane
epithelial cell
stroma
blood vessel
Cell MovementCell MovementCell MovementCell Movement
HT1080Human Adenosarcoma Cell
Physiological
• morphogenesis
• wound healing
• cellular immunity
Pathological
• inflammation
• arteriosclerosis
• cancer invasion,
metastasis

3
Moving Cell Moving Cell Moving Cell Moving Cell
moving direction
filopodia and lamellipodia on cell tip
Moving ProcessMoving ProcessMoving ProcessMoving Process
actin reorganization inside cell close to the membrane ~ a driving force of extrusion

4
Figure 16-7: Molecular Biology of the Cell (© Garla nd Science 2008)
Actin (cell bone) reorganization Actin (cell bone) reorganization Actin (cell bone) reorganization Actin (cell bone) reorganization
C. Sarmiento et al. J Cell Biol 180: 1219-1232 (2008)T. Oikawa et al. Nature Cell Biol 6: 420-426 (2004)M. Martinez-Quiles et al. Nature Cell Biol 3: 484-491 (2001)H. Miki et al. Nature 408: 732-735 (2000)H. Yamaguchi et al. PNAS 97: 12631-12636 (2000)
IRSp53
WIP
PIP3
WASP family proteinsactin control signal network
5
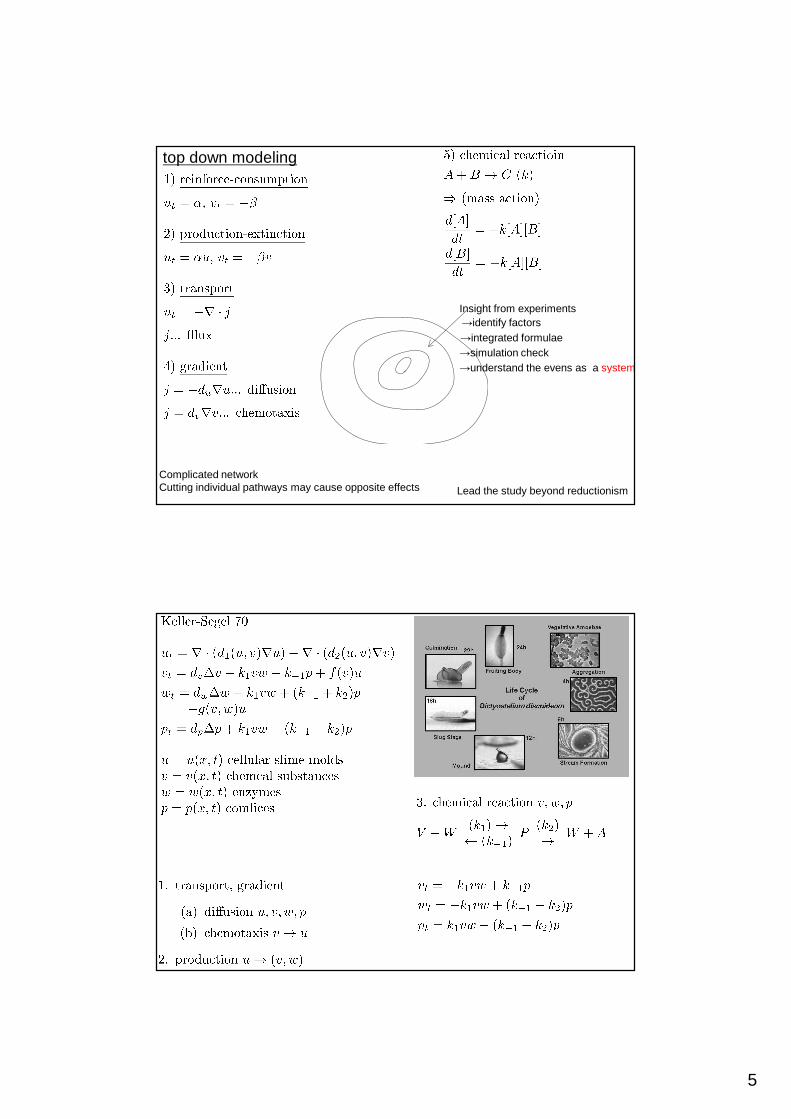
→identify factors
top down modeling
Insight from experiments
→integrated formulae →simulation check →understand the evens as a system
Lead the study beyond reductionism
Complicated networkCutting individual pathways may cause opposite effects
6
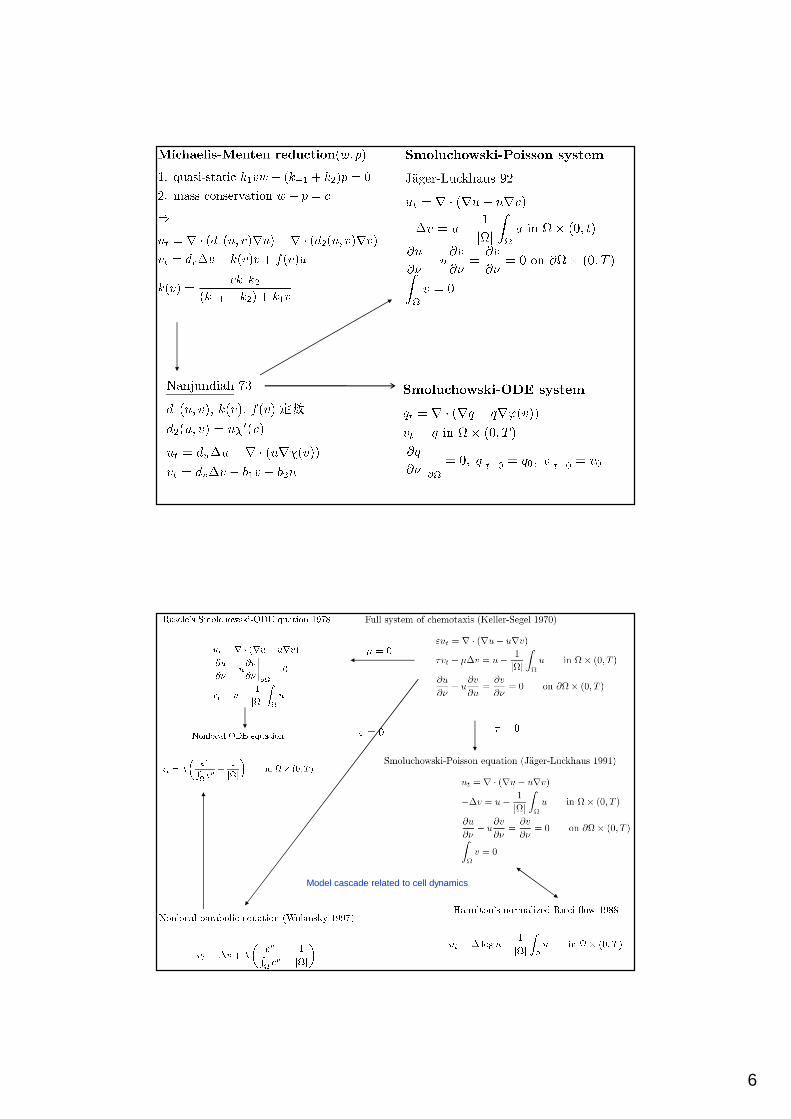
Model cascade related to cell dynamics

7
1. Quantized blowup mechanism 2. recursive hierarchy
3. field-particle duality
T. SuzukiMean Field Theories andDual Variation Atlantis Press Amsterdam-Paris, 2008
T. SuzukiFree Energy and Self-Interacting ParticlesBirkhauser, Boston, 2005
Non-linear/non-equilibrium~principles established by analysis
4. Nonlinear spectral mechanics
General model of cell dynamics (1)
Smoluchowski-ODE system

8
Function ODEPDE
General model of cell dynamics (2)
signal transmission, sensitivitychemical reaction material transport
Chaplain-Anderson 98
1) ODE-PDE system 2) diffusion, haptotaxis 3) chemical reaction 4) production, consumption
Invasion ~~~~ tissue level model
No peak formation in tissue level

9
basementmembrane
Blood bessel
EC (n)Endotherial cell
Avascular tumor
TAF (c)Tumor angiogenesis factor
receptor
haptotaxis
chemotaxis
ECM (f) Extra-cell matrix
hybrid simulation
Angiogenesis top down model
Individual (particles) - continuous (field) hybrid simulation

10
0
0.2
0.4
0.6
0.8
1
1.2
1.4
0 2 4 6 8 10 12 14 16 18 20
m(x
,t)
t
"solution-m.txt"
angiogenesismalignant
Invasion to Extra Cell Matrix
chemical substances, foods, X-rays, ultra-violet, radial rays, virus
gene mutation
Normal
clonalgrowth
Invasion to Blood Bessel
Metastasis to Organs
Cancer Events and Biological Hierarchy
organs
tissues
cells
organelles
proteins
DNA
Primarycarcinoma
Top down
Bottom up

11
Individual (particles) - continuous (field) hybrid simulation
→ individual based simulation
0
0.2
0.4
0.6
0.8
1
1.2
1.4
0 2 4 6 8 10 12 14 16 18 20
m(x
,t)
t
"solution-m.txt"

12
Summary
1. Cancer control is nowadays theme. Its growth is a combination of time series events occurring in biological hierarchy. Malignant tumor is characterized by metastasis which begins with invasion. There is formation of peaks called invadepodia in early stage of invasion
2. In the top down modeling one picks up several factors confirmed experimentally to combine a system of partial differential equations. Then one understands leading principles of the event using hybrid simulation
3. A chemtaxis system has evoked a huge mathematical studies whereby significant analytic methods and mathematical principles are formulated
Physical law
Mathematical model
Molecular interaction
precisioncoarsening
First principle
data
In vivo/in vitro
Experiment
Hybrid simulation
Top down modeling
Bottom up modeling
Cell organelle
protein
DNA
organ
tissue
Mean field

13
Abstract
Several positive feedback loops are observed in early state of invasion. We focus on ECM degradation – actin reorganization and show how a bottom up model to search key paths in molecular level
1. protein signal network (14) 2. basement membrane degradation (2) 3. bottom up modeling (4) 4. key path search (2)
Malignant Tumor
1) infinite reproduction
2) motility
3) invasion to normal tissue
metastasis to other organs
1. Protein signal network
1/22

14
上皮細胞上皮細胞上皮細胞上皮細胞
がん細胞がん細胞がん細胞がん細胞
基底膜基底膜基底膜基底膜 基底膜基底膜基底膜基底膜
内皮細胞内皮細胞内皮細胞内皮細胞
血管血管血管血管
転移したがん転移したがん転移したがん転移したがん
原発巣から
の離脱
組織間移動
再増殖
Metastasis
2/22
XX
XX
XX
XX
Invasion beginning of metastasis
invadepodia
basement membrane
3/22

15
integrincadherin
ECM
A. Weaver (Vanderbilt) 06
Invasion - cell level
peaks②ECM degradation③adhesion regulation
①actin reorganization
F-actin
Invadopodia
4/22
Invadopodia
� cell membrane structure observed in vitro invasive cancer on ECM
� full of actin filaments active to ECM degradation
� observed in cell adenose acted by v-Src, 1989, Wen-Tien Chen
� Actin, adhesion, signal transmission, membrane transport, ECM degradation
� Important in cancer cell invasion, metastasis
5/22

16
Protein signals
6/22
MT1-MMP((((membrane type-1 matrix metalloproteinase) is a proteinase casting
tumor invasion apparatus
1.1.1.1.Manifestation in cancer cells Manifestation in cancer cells Manifestation in cancer cells Manifestation in cancer cells
2.2.2.2.Malignant cancer front Malignant cancer front Malignant cancer front Malignant cancer front
3.3.3.3.Collagen degradation for cancer cell Collagen degradation for cancer cell Collagen degradation for cancer cell Collagen degradation for cancer cell breeding and movement breeding and movement breeding and movement breeding and movement
4.4.4.4.MT1MT1MT1MT1----MMP induced cancer cells begin MMP induced cancer cells begin MMP induced cancer cells begin MMP induced cancer cells begin metastasis metastasis metastasis metastasis
Drill at the front of cancer cell
7/22

17
MT1-MMP research
1. Manifestation from cancer cell, activate MMP2 (secretion type basement membrane protainase) H. Sato, T. Takino, Y. Okada, J. Cao, A. Shinagawa, E. Yamamoto, M. Seiki, Nature1994
2. MT1-MMP polymer + TIMP2-proMMP2 produces activated MMP2 A.Y. Strongin et. al. 1995, Imai-Ohuchi-Aoki-Fujii-Sato-Seiki-Okada, Cancer Res. 1996
3. [MT1-MMP] polymers Y. Itoh, A. Tamura, N. Ito, Y. Maru, H. Sato, T. Aoki, M Seiki, EMBO J. 2001K. Lehti et. al. 2002
4. collagen I, II, III, laminin 1, 5 degradation Ohuchi-Imai-Fujii-Seiki-Okada 1997Koshikawa-Gianneli-Cirulli-Miyazaki-Quaranta, Cell Biol. 2000
5. collagen IV(basement membrance)degradation by activated MMP2 Okada, et.al. 1990
6. EGF receptor activation by DIII filament produced by laminin gamma 2 chain cut by MT1-MMP N. Koshikawa et. al. to appear
8/22
MT1-MMP (f)
EGFR
Actin (n)
ECM (c)
ECM* degradation
ECM
transport
Membrane
signal
F-actin G-actin
9/22
1, 6
4
2, 3
5
Cell
1. Schenk S, Hintermann E, Bilban M, et al. JCell Biol 2003; 161: 197-209.2. Koshikawa N, Minegishi T, Sharabi A,Quaranta V, Seiki M. J Biol Chem 2005; 280:88-933. Koshikawa N, Giannelli G, Cirulli V,Miyazaki K, Quaranta V. J Cell Biol 2000;148: 615-244. Sakurai-Yageta, M. et.al. J. Cell Biol.2008;181: 985-985. den Hartigh JC, van Bergen enHenegouwen PM, Verkleij AJ, Boonstra J. JCell Biol 1992; 119: 349-556. Koshikawa, N. et al. to appear
adhesion
ECM degradation
actin reorganization
Positive feedback loop

18
Cell
Sub-cell
molecular switch
Allen-Cahn model
degradation activityPositive feedback
-1 +1
fluctuation
10/22
slow dynamics
c
ECM degradation
f*10
f**
c*
→activation switch →fluctuation
→localization
→invadopodia?
Activation loop
MT1-MMP EGFR
Actin (n)
ECM (c)
ECM* (c*)
degradation (3)
transport (2)
-1 1
f*
polymerization (4)
Extinction (1)
f
c=1
c=0
reinforce
n* f*
nucleus
MMP(f)
11/22
(4)
(3)
(1)(2)

19
EGFREGFREGFREGFR ⇒⇒⇒⇒ MMP production
MT1-MMP EGFR
actin (n)
ECM (c)
ECM* (c*)
degradation
Cell Extra cell
c
f
transport
n
membrane
f*
polymerization
adhesion
extinction
f
n*
f*
n* c*f*
nucleus
MMP(f)
12/22
activatedMMP2
production
c*production
c*-signal
EGFR signal from ECM fragments
another signal
actin reorganization - ECM degradation positive feedback loop
MT1-MMP EGFR
Actin (n)
ECM (c)
ECM* (c*)
degradation (3)
inside cell
switching
ccell outside
c
f
ECM degradation
Interface
outside cell
transport (2)
n
membrane
membrane-1 1
f*
polymerization (4)
f*
extinction (1)c=1
n*
f**
c*
n* c*f*
nucleous
MMP(f)
c=0n
c
activatedMMP2
production (5)
separation (6)
(4)(6)
(3)
(3)
(1)(2)(5)
Double swicth
13/22

20
0 0.2
0.4 0.6
0.8 1 0
0.2
0.4
0.6
0.8
1
0
0.2
0.4
0.6
0.8
1
t=7000
"solution.txt" u 1:2:3 0.2 0.1
0.02
0 0.2
0.4 0.6
0.8 1 0
0.2
0.4
0.6
0.8
1
0
0.2
0.4
0.6
0.8
1
t=7000
"solution.txt" u 1:2:4 0.9 0.5 0.2 0.1
0.02
0 0.2
0.4 0.6
0.8 1 0
0.2
0.4
0.6
0.8
1
0
0.2
0.4
0.6
0.8
1
t=7000
"solution.txt" u 1:2:6 0.5 0.2 0.1
0.02
0 0.2
0.4 0.6
0.8 1 0
0.2
0.4
0.6
0.8
1
0
0.2
0.4
0.6
0.8
1
t=7000
"solution.txt" u 1:2:5 0.5 0.2 0.1
0.02
0 0.2
0.4 0.6
0.8 1 0
0.2
0.4
0.6
0.8
1
0
0.2
0.4
0.6
0.8
1
t=14000
"solution.txt" u 1:2:4 0.9 0.5 0.2 0.1
0.02
0 0.2
0.4 0.6
0.8 1 0
0.2
0.4
0.6
0.8
1
0
0.2
0.4
0.6
0.8
1
t=14000
"solution.txt" u 1:2:6 0.5 0.2 0.1
0.02
0 0.2
0.4 0.6
0.8 1 0
0.2
0.4
0.6
0.8
1
0
0.2
0.4
0.6
0.8
1
t=14000
"solution.txt" u 1:2:5 0.02
0 0.2
0.4 0.6
0.8 1 0
0.2
0.4
0.6
0.8
1
0
0.2
0.4
0.6
0.8
1
t=14000
"solution.txt" u 1:2:3 0.2 0.1
0.02
MMP concentration to membrane
2D simulation
14/22
n: actin c: ECMf: MMP
c*: ECM fragment
c*→f … localization (peak)c*→n→f … actin extension
Zn
Zn
Pro
ProMMP-2
MT1-MMP
N C
TIMP-2
“ Receptor ”
Zn
TIMP-2-free MT1-MMP
Zn
Active MMP-2
“ Activator ”
MT1-MMP activates ProMMP-2 at the moving front
15/22
2. Basement Membrane Degradation – Molecular Level
Collagen IV(basement membrane)
Collagen I, II, IIIlaminin 1, 5
Cell membrane
inside cell
outside cell

21
ZnZn
MT1-MMP
Fibroblasts
Tumor Cells
Zn
proMMP-2
Zn
Zn
Degradation of Collagen I and IVPromotion of tumor growth and invasion
How MMP-2 expression is induced by tumor cells?
16/22
(active)
MT1-MMP_MT1-MMP_TIMP2_MMP2
17/22
MT1-MMP_MT1-MMP
MT1-MMP, TIMP2, pro-MMP2 → activated MP2
secrete type basement membrane degradation protainase
TIMP2 initial[M]
MT1-MMP-MT1-MMP-TIMP2-MMP2 final[M]
Experimental insights → mathematical model →MMP2 activation research
Key path search → control factor identification
control pathway simulation → new clinical application
3. bottom up modeling
threshold

22
a b c
ab bc cc
abc bcc
abcc bccb
abccb
abccba
hierarchy
Rules
・a→b・b→a,c・c→b, c・one direction ・two connectors in each protein・up to two polymers of c
(a:MMP2 b:TIMP2 c:MT1-MMP)
a b
b a
c
c bc
articulatio
detachment
one peak
18/22
Mass reaction ⇒ ODE system
化学反応での物質濃度の時化学反応での物質濃度の時化学反応での物質濃度の時化学反応での物質濃度の時間変化を記述間変化を記述間変化を記述間変化を記述
初期値を与えると各時刻の物質濃度は
微分方程式に従って決定される
ある程度時間が経過すると
物質濃度の時間変化のない平衡状態に到達する
化学反応: A+B → C
[A],[B],[C] : concentration [M]
Initial concentration
reaction rate
19/22

23
・ make the curve flat by mathematical operation (pathway cut)
20/22
activated MMP2 production
robust network
・total mass conservation of a,b,c elements
・bind-detachment dynamics of a(MMP2), b(TIMP2), c(MT1-MMP) based 12 proteins
・equilibrium realized as three-dimensional algebraic manifold embedded in 9-dimensional Euclidean space
・one peak of b-abcc curve on the manifold
⇒
key path search control pathway simulation
Path cut (1)
Initial b concentration [M]
Final abcc concentration [M]
Bind path ①①①① ②②②② ③③③③ ④④④④ cut
MMP1
4
bMMP2
MMP14・TIMP2
MMP14・TIMP2・MMP2
ab MMP14・MMP14
MMP14・MMP14・TIMP2
abcc MMP14・TIMP2・MMP14・TIMP2
MMP14・TIMP2・MMP14・TIMP2・MMP2
MMP14・TIMP2・MMP2・MMP14・TIMP2・MMP2
①①①①
②②②②
②②②②
③③③③③③③③
④④④④
④④④④
①①①①T2M2 +M14 → M14T2M2②②②②T2M2 +M14M14 → M14M14T2M2③③③③T2M2 +M14M14T2 → M14T2M14T2M2④④④④T2M2 +M14M14T2M2 → M14T2M2M14T2M2
original
peak extinction
21/22
4. Key path search
24
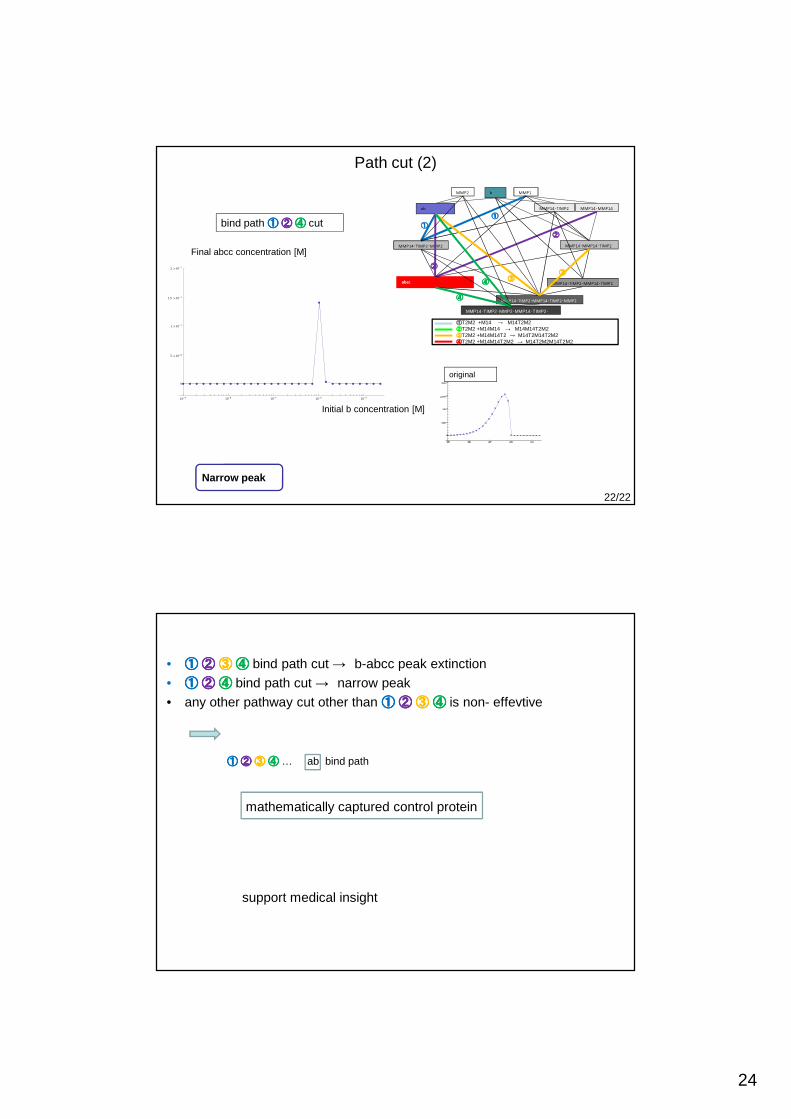
Path cut (2)
æ æ æ æ æ æ æ æ æ æ æ æ æ æ æ æ æ æ æ æ
æ
ææ æ æ æ æ æ æ æ
10-9 10-8 10-7 10-6 10-5
0
5.´10-8
1.´10-7
1.5 ´10-7
2.´10-7
Initial b concentration [M]
Final abcc concentration [M]
bind path ①①①① ②②②② ④④④④ cut
Narrow peak
MMP1
4
bMMP2
MMP14・TIMP2
MMP14・TIMP2・MMP2
ab MMP14・MMP14
MMP14・MMP14・TIMP2
abcc MMP14・TIMP2・MMP14・TIMP2
MMP14・TIMP2・MMP14・TIMP2・MMP2
MMP14・TIMP2・MMP2・MMP14・TIMP2・MMP2
①①①①
①①①①
②②②②
②②②②
③③③③③③③③
④④④④
④④④④
①①①①T2M2 +M14 → M14T2M2②②②②T2M2 +M14M14 → M14M14T2M2③③③③T2M2 +M14M14T2 → M14T2M14T2M2④④④④T2M2 +M14M14T2M2 → M14T2M2M14T2M2
original
22/22
• ①①①① ②②②② ③③③③ ④④④④ bind path cut → b-abcc peak extinction
• ①①①① ②②②② ④④④④ bind path cut → narrow peak
• any other pathway cut other than ①①①① ②②②② ③③③③ ④④④④ is non- effevtive
①①①① ②②②② ③③③③ ④④④④ … ab bind path
mathematically captured control protein
support medical insight

25
Summary
1.MT1-MMP appears at invasion front, which is not only the origin of ECM degradation but also and activates the secrete basement membrane protainase MMP2
2. ECM fragments cut by MT1-MMP attach EGFR
3.This attachment induces at least two positive feedback loops inside cell, actin polymerization→MMP transport, direct MMP up-regulate
Conclusion
1.The above feedback fluctuation realizes invadopodia formation by a top down mathematical model
2. The roles of two feedback are clarified; actin polymerization-MMP transport …actin extension, direct MMP up-regulate … actin localization
3.MT1-MMP, TIMP2, MMP2 pathway mathematical analysis picks up key paths of MMP2 activation, which opens mathematical methods to create new clinics
References
1. T. Suzuki, Parallel optimization applied to MEG, JCAM 183 (2005) 177-190
2. T. Saito, M. Rouzimaimaiti, N. Koshikawa, M. Seiki, K. Ichikawa, T. Suzuki, A sub-cell mathematical model for initial stage of cancer invasion, preprint
3. K. Ichikawa, M. Rouzimaimaiti, T. Suzuki, Reaction diffusion equation with non-local term arises as a mean field limit of the master equation, to appear