math~ematical modelling of b and crystallizers rouillard mathematical... · on various mass...
TRANSCRIPT
PROCESSING
MATH~EMATICAL MODELLING OF A, B AND c CRYSTALLIZERS
E.E.A. Rouillard
Sugar Milling Research lnstitute University of Natal, Durban
ABSTRACT
It was shown that equations developed for predicting the heat and mass transfer coefficients in agitated vessels can be applied to crystal- Zizers.
A mathematical model which takes into account the physical pro- perties of the massecuite and the geometry of the crystallizer was given. Using this model, it is possible to calculate the purity, supersaturation, viscosity and temperature of massecuite for a given residence time, as well as the viscosity of the mother liquor and power required for agitation.
Calculations done using this model showed that the purity drop that can be obtained for a given residence time is a function of the power used for agitation and of the cooling water temperature. If how- ever, equilibrum is reached, the purity obtained will depend only on the properties of the massecuite and the final temperature.
INTRODUCTION
With the development of digital computers, mathematical modelling has become an important engineering technique. Modelling contributes to chemical pro- cessing by enabling complex systems to be undeistood.
Provided that the model faithfully represents the crystallization plocess, mathematical modelling of crystallizers could result in great progress being
b made in the optimization of this equipment, for using this method it is possible to study the influence of each variable on the process in a relatively short time.
A mathematical model for continuous A-massecuite crystalllzers was deve- loped at the sugar Milling Research lnstitute (Rouillard8). This model has been modified so that it can now be used for B and C massecuites.
I 2280 PROCESSING
In this paper, it i s shown how the model was developed. Some of the factors 1 affecting the performance of crystallizers as the model has revealed are also dis- cussed.
Mass and Hear Transfer Coefficients
~r~stalllization is a mass transfer operation which takes place in two steps. Firstly, the sucrose molecules diffuse through the film of molasses surrounding the crystal, and secondly, the molecules are incorporated into the crystal lattice. According to Silig, impure sugar solutions diffusion for high viscosity is rate cori- trolling so that the second step can be neglected. The rate of crystallization can then be represented by the equation.
I == k f m a (Cn- t
(1) '
That is, the mass of sucrose crystallized during the time interval t, Es the product of the film mass transfer coefficient, crystal surface area and the con- centration gradient, which is the difference between the concentration existing in the molasses surrounding the crystals and the concentration at equilibrium. I
Calderbank and Moo young2 have correlated the results of several adies on various mass transfer operations in agitated vessels of different types. they have shown that the film mass transfer coefficient in agitated vessels can be m presented by the equation.
@n Pi I.1 kf = 0,13 (-. -)'I4 / (")w3
~ 2 , V P""" (2) I
Similarly, the rate of heat transfer can be represented by the equation:
4- =' U. A. AT (31 I
t That is, the amount of heat transferred during the time interval t, is the pra- I
dlrct of the overall heat transfer coefficient, oo.oling surface area and: temperature difference between massecuite and cooling media. For water cooled crvstallizen, the resistance of the water film is so small compared to that of the massecuite film that the overall heat transfer coefficient can be taken to be equal to that of the massecuite film coefficient. That is, U = h.
Because of the similarity betweitn heat and mass transfer Calderbank end' I I Moo-Young have proposed an equation similar to equation (2) for heat transfer in I agitated vessels: 1 1
E. E. A. ROUILLARD 2281
The advantage of equations (2) and (4) is that they are independent of the geometry of the crystallizer, but depend only on the power input per unit volume and on the physical properties of the massecuite or i t s mother liquor.
i EXPERIMENTAL PROCEDURE - I
The accuracy of equations (2) and (4) for predicting the mass and heat trans- fer coefficient was verified by comparing with measured values obtained using equations (1) and (3). The measurements were taken on four A, one B anti two C, crystallizers, the details of which are given in Table 1.
The variables of equation (1) were obtained as follows:
The mass of sucrose crystallized was obtained from the difference in crystal content between the inlet and outlet of the crystallizers, a correction being applied when molasses was qdded. The crystal content was calculated from the equation. I
I
x = b m (P, -Pn ) / ( l o o - p n 1 (5) I
The amount of molasses added was given by:
I I and the correction for molasses addition!
The crystal surface area at the outlet was calculated from the following equation derived from Ref. 3
a = 3.779 X I L --P 0 0 0
(8)
The crystal size was obtained by sieving in the case of A sugar and by micros- copic examination in the case of I3 and C sugar. The coefficients of sphericity for A, B and C sugar were taken as 0, 8 and 0, 7 respectively. The crystal size at the inlet was obtained, assuming no change in the number of crystals
1/3 Li = Lo (- (9) XY;
and the area at the inlet was calculated in the same way as the area used in equation
(1) i s (ao + ai)/2.
The concentration of sucrose existing in the mothey liquor was calculated from I
>: >
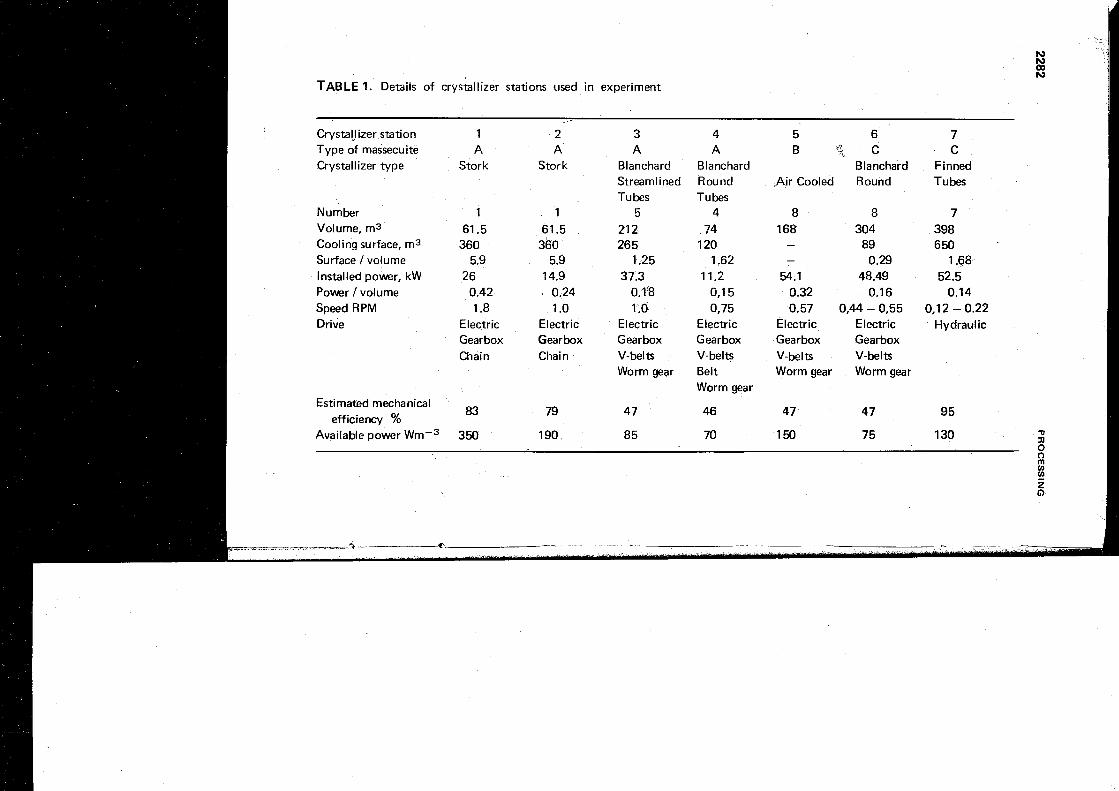
TABLE 1. Details of crystallizer stations used in experiment
CrystaLlizer station 1 2 3 4 5 6 7 Type of massecuite A A A A B C C -7
Crystallizer type Stork Stork Blanchard Blanchard Blanchard Finned Streamlined Round Air Cooled Round Tubes Tubes Tubes
Number 1 1 5 4 8 8 7 Volume, m3 61.5 61.5 21 2 74 168 304 398 Cooling surface, m3 Surface / volume 5.9 5.9 1.25 1.62 - 0.29 1.68 Installed power, kW 26 14.9 37.3 11.2 54.1 48.49 52.5 Power / volume 0.42 0.24 0.1 8 0,15 0.32 0.1 6 0.14 Speed RPM 1.8 1 .O I .O 0,E 0.57 0,44 - 0,55 0.1 2 - 0.22 Drive Electric Electric Electric Electric Electric Electric Hydraulic
Gearbox Gearbox Gearbox Gearbox Gearbox Gearbox Chain Chain V-be1 ts V-belts V-belts V-belts
Worm gear Belt Worm gear Worm gear Worm gear
Estimated mechanical ' efficiency %
83 79 47 46 47 47 95
Available power 350
- a -
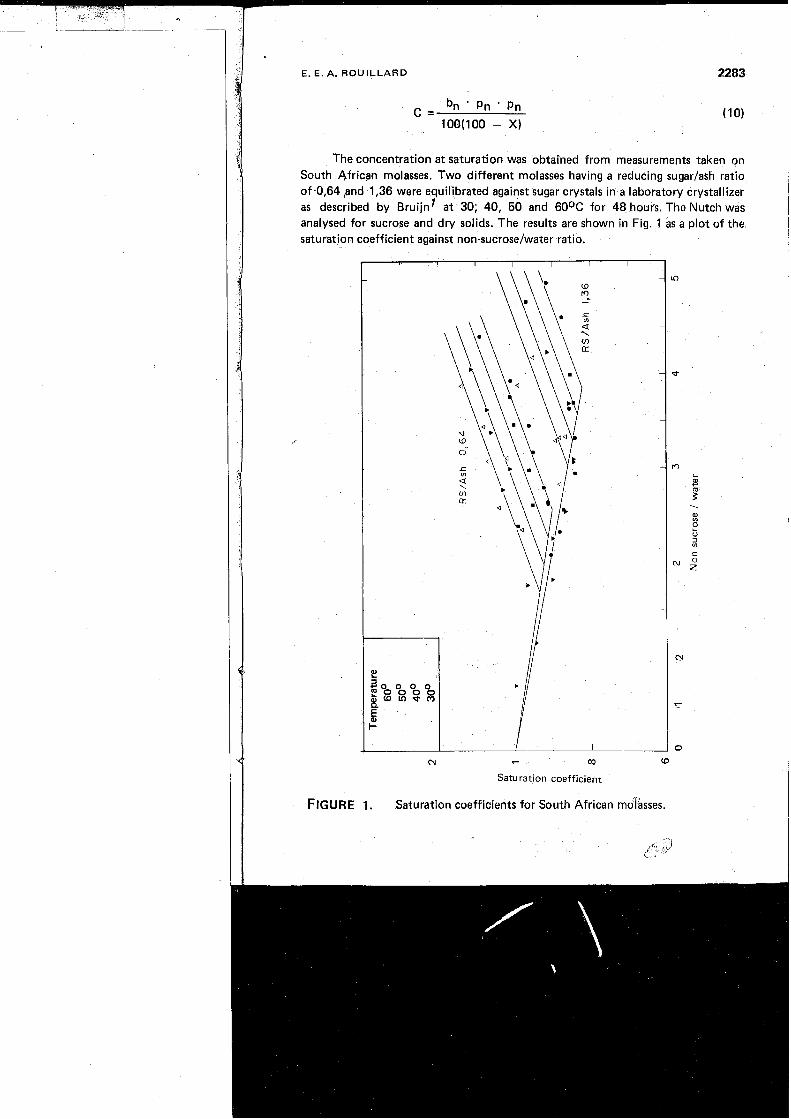
The concentration at saturation was obtained from measurements taken on South African molasses. Two different molasses having a reducing sugar/aSh ratio of 0,64 pnd 1,36 were equili,brated against sugar crystals in a laboratory crystallizer as described by I3ruijn1 at 30; 40, 50 and 60°C for 48 hours. The Nutch was analysed for sucrose and dry solids. The results are shown in Fig. 1 as a plot of the saturation coefficient against non-sucrose/water ratio.
Saturation coeff icient
FIGURE 1. Saturation coefficients for South African mdasses.
P i 'L106n~
i Aq ua~!6 uo!ienba ue 6u!sn x ! ~ q aqi wol4 paleln3le3 seM Aipede3 ikaq a q l
:Jauuew 6u!~o l lo j ay$ u! paiew!isa alaM (p) uo!ienba 40 salqe!JeA a q l
.suopeln3le:, aqi u! pasn seM a3ua~a44!p ,' a~nie~adwal ueaur 601 a q l .s~ez!ll~:sh3 aqi 4 0 a3qJns 6u!loo3 aqi s! eaJe a q l
.lapno pue lalu! aqi uaamlaq a~nie~adwai u! a3ua~aj$!p aql pue ale4 MOIJ Jaim aql woy paieln3le3 seM palJa4sueJi ieaq 40 iunowe a y l
: s~o l l o j se pau!eiqo aJaM ( c ) uo!ienba 40 sa(qelJeA a q l
:s! ley? 'guowa!g pue eJalJal-( Aq paAJasqo se sp~!ql-ow 40 ~ a ~ o d aqi 01 Ai!so3s!~ aqi 40 uo!i3un4 e aq o i apew seM i ! inq uo!iel -ncqh aqi u! pasn seM aso~3ns alnd 40 Ai!~!sn44!p JO Ai!l!qe uo!sn44!p a q l
'sJaz!((eish3 aqi Aq plaq ai!naassew 40 awnloA aqi seM awnloA a q l i!un l a i j sayolis 40 ~aquinu aqi pue ayoJis pue eaJe uols!d aqi'a~nssa~d (10 aqi 40 i3npo~d aqi seM indu! J a ~ o d aql 'a~!.Jp '3!lneJpAq aqi ~ o j ' 1 alqel u! paleapu! se uo!ss!wsueJi aqi 40 Aaua!3!ga le3!ueq3 -alu aqi ~ 0 4 pal~a~~o:, pue uoiow aqi 40 a6e~adwe aqi ~ O J J paieln31e3 seM indu! JaMod a q l 'salqei Aysuap-x!lq wo~4 awe3 k!suap a q l 'a.rnieladwa1 pue Ai!~nd 'sp!los h p aqi 40 uo!ielauo3 e wo~4 pau!eiqo sew Jonb!l yaqiow aqi 40 Al!so3s!~ aqi :Jauuew 6u!~ollo4 aql u! 'pau!eiqo aJaM (1) uo!ienba $0 salqe!JeA a q l
1 .slaz!lleisAl3 aqi q6no~ql MOB 6nld 6u!wr~sse '~0014 ued aqi WOJJ pau!taqo sawnloA ai!n3assow ~ 0 ~ 4 paleln3le3 alaM s a q i aauap!saJ a q l
I
". $2"
'SO!IPJ J ~ ~ M / ~ S O J ~ ~ S - U O U q6!q J O ~ ' ~ a ~ a ~ o q a~nie~adwai ' ;~ uo!isun4 e aq o i ueadde 11 -a~n$e~adwa$4o luapuadapu! s! iua!o!4jao3 uo!iaJnies aqi 'so!ieJ JaieM /asar3ns-uou MOI aqi i~ 'so!leJ .iale~/aso~ans-uou q6!q i e uod '6u!pua3se aqi JO*
(11) IVLEOO'O - V/SH ZLZ'O- NVSN 660.0 + 60'1 = s
pue so !p ~aie~/aso~ons-uou MOI i e a ~ n 3 aqi jo wed 6u!puaDsap aqi 104
E. E. A. ROUILLARD 2285
The density came from brix-density tables.
The viscosity of massecuite was calculated from the following correlation derived at the Sugar Milling Research Institute.
Pm = 89.57 . I.(, . a 2.33 , 1.66 iL 0.765 (15)
The thermal conductivity of the system sucrose-water ( ~ o n i ~ ~ ) , was extra- polated to cover the range from 90 to 100 brix and it was assumed ,that these properties also applied to massecuite.
RESULTS
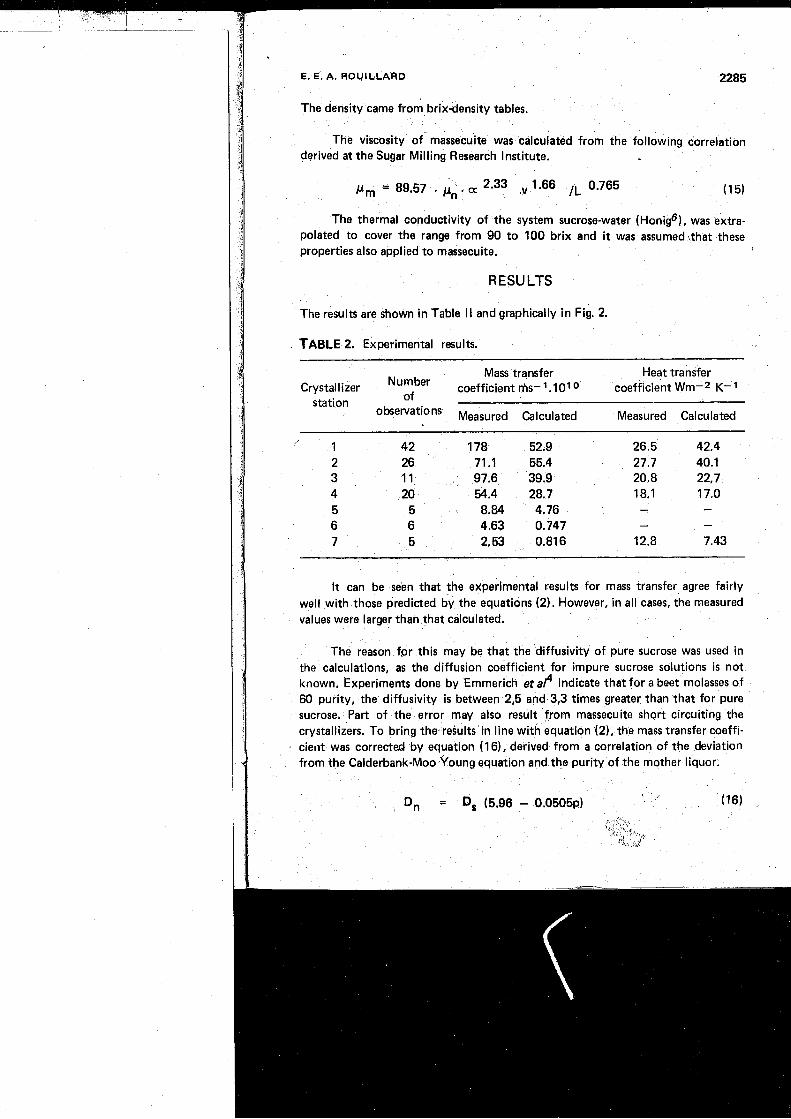
The results are shown in Table I I and graphically in Fig. 2.
TABLE 2. Experimental results.
Mass trqnsfer Heat transfer Crystallizer Number coefficient rhs- .I01 0 coefficient Wm-2 K-1
station of
observations Measured Calculated Measured Calculated
' 1 42 178 52.9 26.5 42.4 2 26 71 .I 55.4 27.7 40.1 3 1 1 97.6 39.9 20.8 22,7 4 20 54.4 28.7 18.1 17.0 5 5 8.84 4.76 - - 6 6 4.63 0.747 - -
7 5 2.53 0.816 12.8 7.43
It can be seen that the experimental results for mass transfer agree fairly well with those predicted by the equations (2). However, in all cases, the measured values were larger than that calculated.
The reason for this may be that the diffusivity of pure sucrose was used in the calculations, as the diffusion coefficient for impure sucrose solutions is not known. Experiments done by Emmerich etaf indicate that for a beet molasses of 60 purity, the diffusivity is between 2,5 and 3,3 times greater than that for pure sucrose. Part of the error may also result from massecuite short circuiting the crystallizers. To bring the results in line with equation (2), the mass transfer coeffi- cient was corrected by equation (16), derived from a correlation of the deviation from the Calderbank-Moo~Young equation and the purity of the mother liquor.
2288 PROCESSING
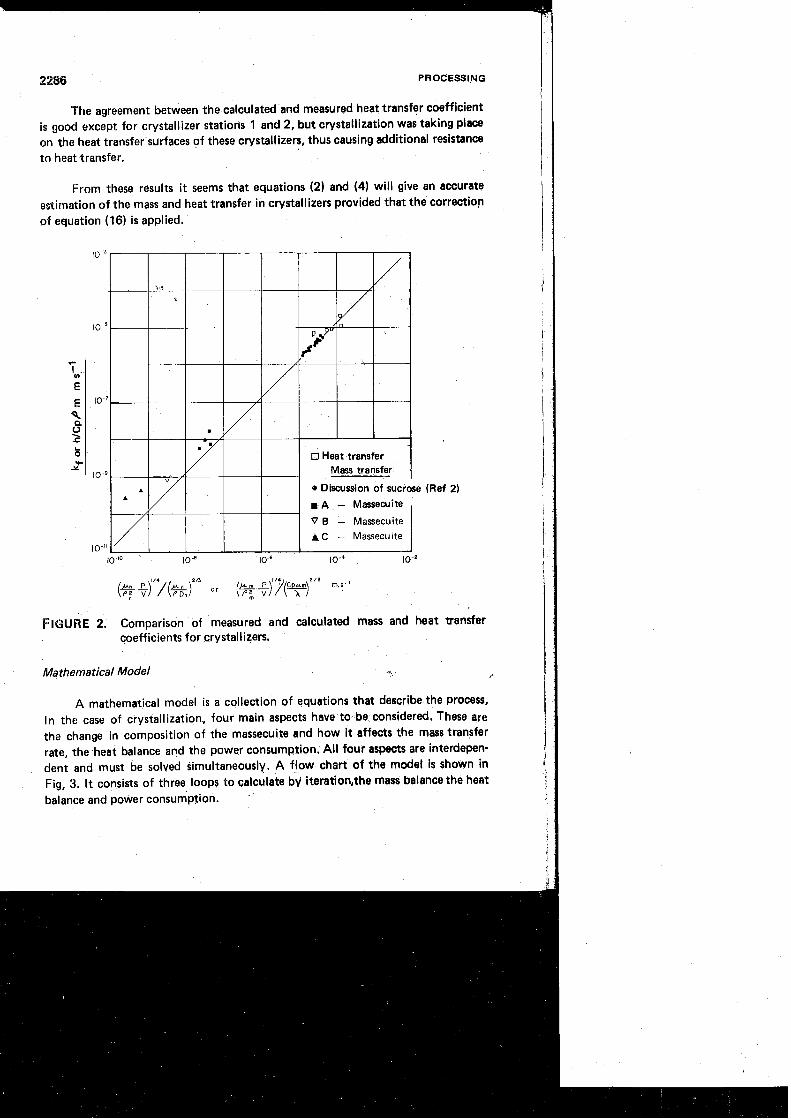
The agreement between the calculated and measured heat transfer coefficient is good except for crystallizer statiohs 1 and 2, but crystallization was taking place on the heat transfer surfaces of these crystallizers, thus causing additional resistance to heat transfer.
From these results it seems that equations (2) and (4) will give an accurate estimation of the mass and heat transfer in crystallizers provided that the correction of equation (16) i s applied.
(Ref 2)
FIGURE 2. Comparison of measured and calculated mass and heat transfer coefficients for crystallizen.
Mathematical Model a
A mathematical model is a collection of equations that describe the process, In the case of crystallization, four main aspects have to be considered. These are the change in composition of the massecuite and how it affects the mass transfer rate, the heat balance and the power consumption. All four aspects are interdepen- dent and must be solved simultaneously. A flow chart of the model is shown in Fig, 3. It consists of three loops to calculate bJ iteration,the mass balance the heat balance and power consumption. '
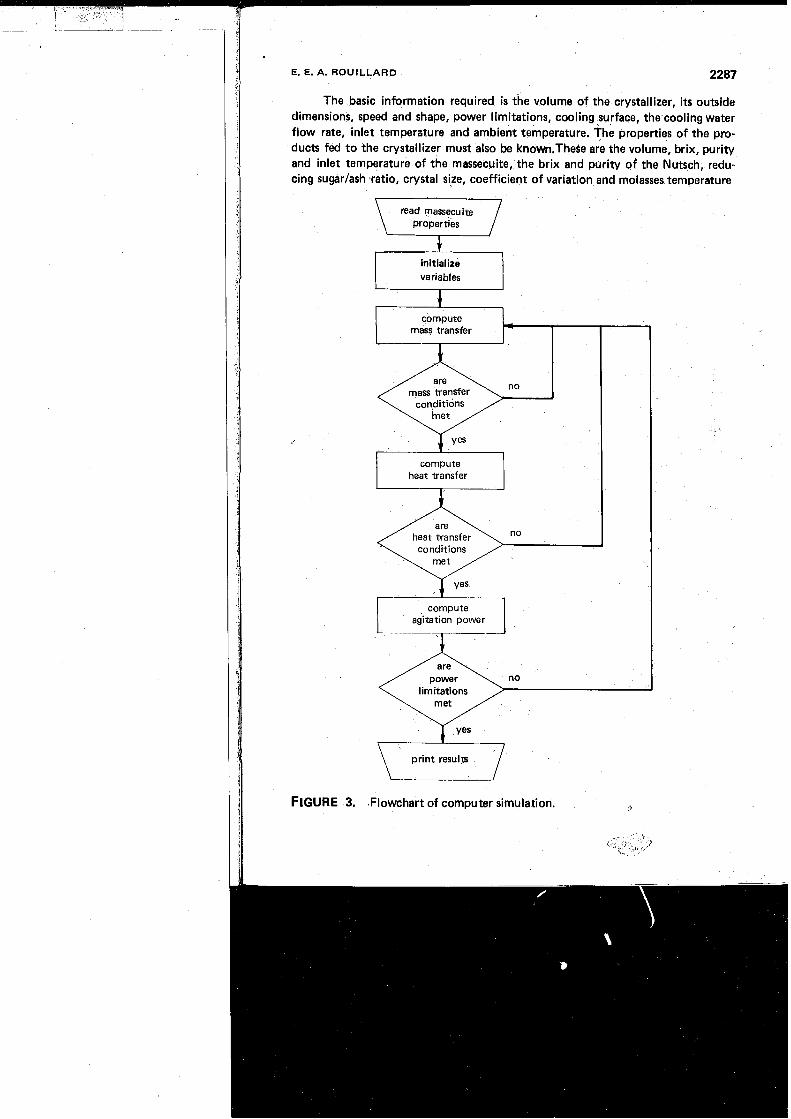
The basic information required is the volume of the crystallizer, i ts outside dimensions, speed and shape, power limitations, cooling surface, the cooling water flow rate, inlet temperature and ambient temperature. he properties of the pro- ducts fed to the crystallizer must also be known.These are the volume, brix, purity and inlet temperature of the massecuite, the brix and purity of the Nutsch, redu- cing sugarlash ratio, crystal size, coefficient of variation and molasses temoerature
properties
initialize variables
mass transfer
compute heat transfer
no
agitation power
no
FIGURE 3. Flowchart of computer simulation. 0
PROCESSI'NG
To initialize the variables, the quantity of sucrose crystalli2ed, of the mollasses added, the brix and purity of the molasses and the outlet massecuite temperature, must be assumed.
The material balance of the water, crystalline sucrose, sucrose in solution and impurities are calculated. Then the surface area of crystals, concentration gradient, retention time, density, viscosity and diffusion coefficient of the mother liquor and mass transfer coefficient are aalculated. The mass of sucrose crystallized is +tained from equation (1 1. I f the quantity of sucrose assumed to have crystallized does not match the calculated value, a new value is assumed.
For the heat balance heat input from the massecuite and molasses and coming from the power for agitation are considered together with the losses to cooling hater and surroundings, the massecuite film heat transfer coefficient being calcula- ted using equation (4). I f the outlet temperature of massecuite assumed does not match the calculated value a new value is assumed.
The power input is calculated from the following equation
where B, i s an experimentally determined constant for this type of crystallizer. I f the power limitations are not met, the quantity of molasses added is altered until an acceptable power demand is achieved.
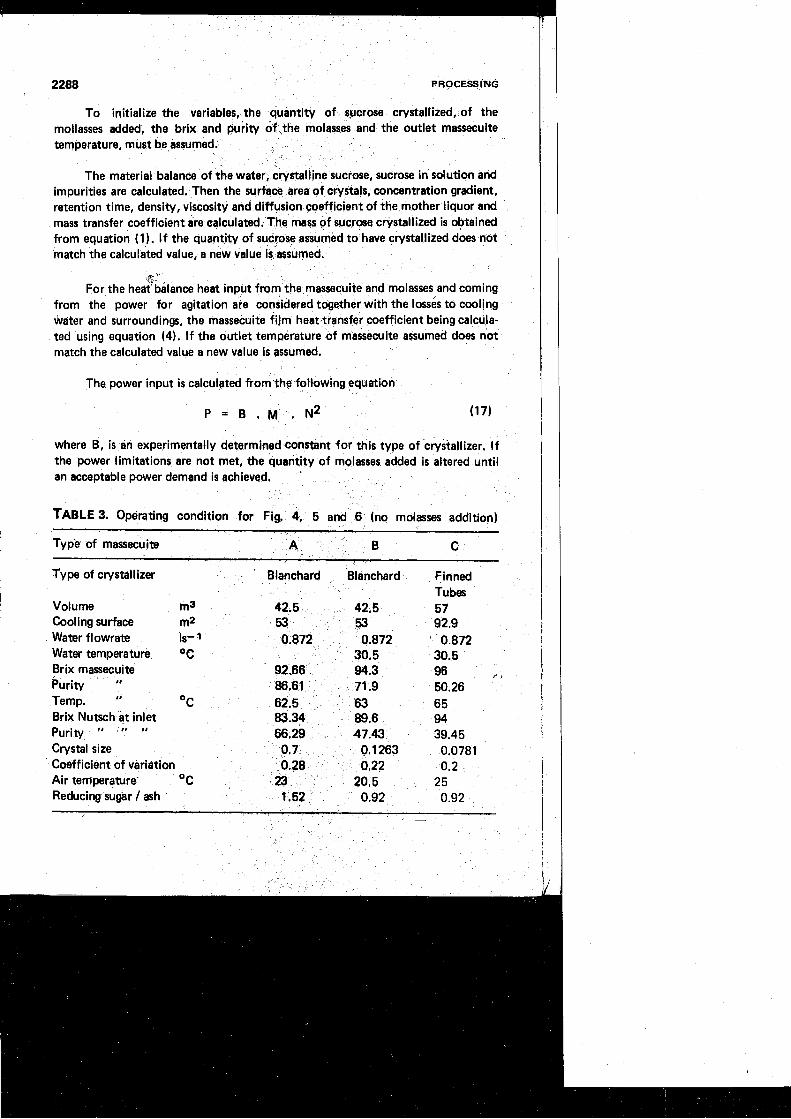
TABLE 3. Operating condition for Fig. 4, 5 and 6 (no molasses addition) -
Type of massecuite A B C
Type of crystallizer Blanchard Blanchard Finned Tubes
Volume m3 42.5 42,5 57 Cooling surface m2 53 53 92.9 Water flowrate Is- 1 0.872 0.872 0.872 Water temperature O C 30.5 30.5 Brix manecuite 92.66 94.3 96
2' )
kurity 86.61 71.9 50.26 Temp. " OC 62.5 63 65 Brix Nutsch at inlet 83.34 89.6 94 Purin/ " " " 66.29 47.43 39.45 Crystal size 0.7 0.1 263 0.0781 Coefficient of variation 0.28 0.22 0.2 Air temperature- O C 23 20.5 2 5 Reducing sugar / ash 1.52 0.92 0.92
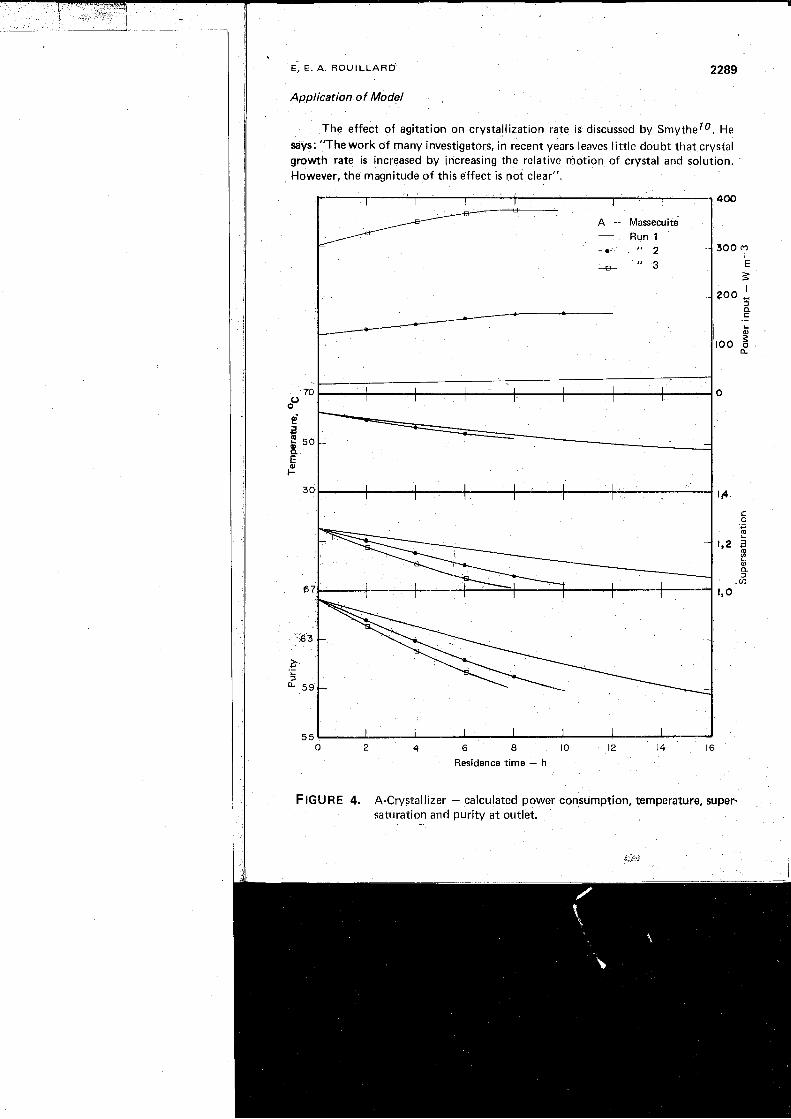
Application of Model
The effect of agitation on crystallization rate is discussed by smythelo. He says: ''The work of many investigators, in recent years leaves little doubt that crystal growth rate is increased by increasing the relative motion of crystal and solution. However, the magnitude of this effect is not clear".
400
- Run 1
-c " 2 300 M I E 3 I
200 , 2 .- L
i $ I00 2
Residence time - h
FIGURE 4. A-Crystallizer - calculated power consumption, temperature, super- saturation and purity at outlet.
,:kt: I
2290 PROCESSING
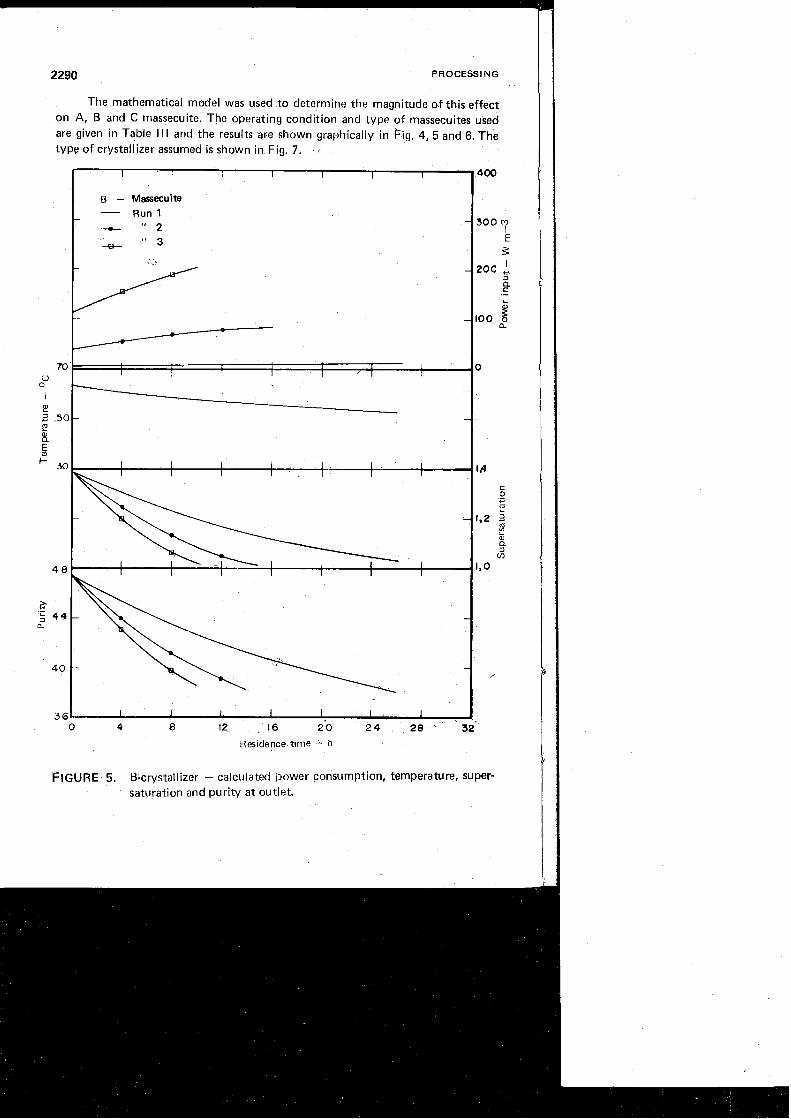
The mathematical model was used to determine the magnitude of this effect on A, 6 and C massecuite. The operating condition and type of massecuites used are given in Table I I I and the results are shown graphically in big. 4, 5 and 6. The type of crystallizer assumed is shown in Fig. 7. ,
B - Massecuite 1 - Run 1
1 I I I I I 1 I 0 4 8 12 16 2.0 2 4 28 32
Residence tlme n 9
FIGURE 5. 6-crystallizer - calculated power consumption, temperature, super- saturation and purity at outlet.
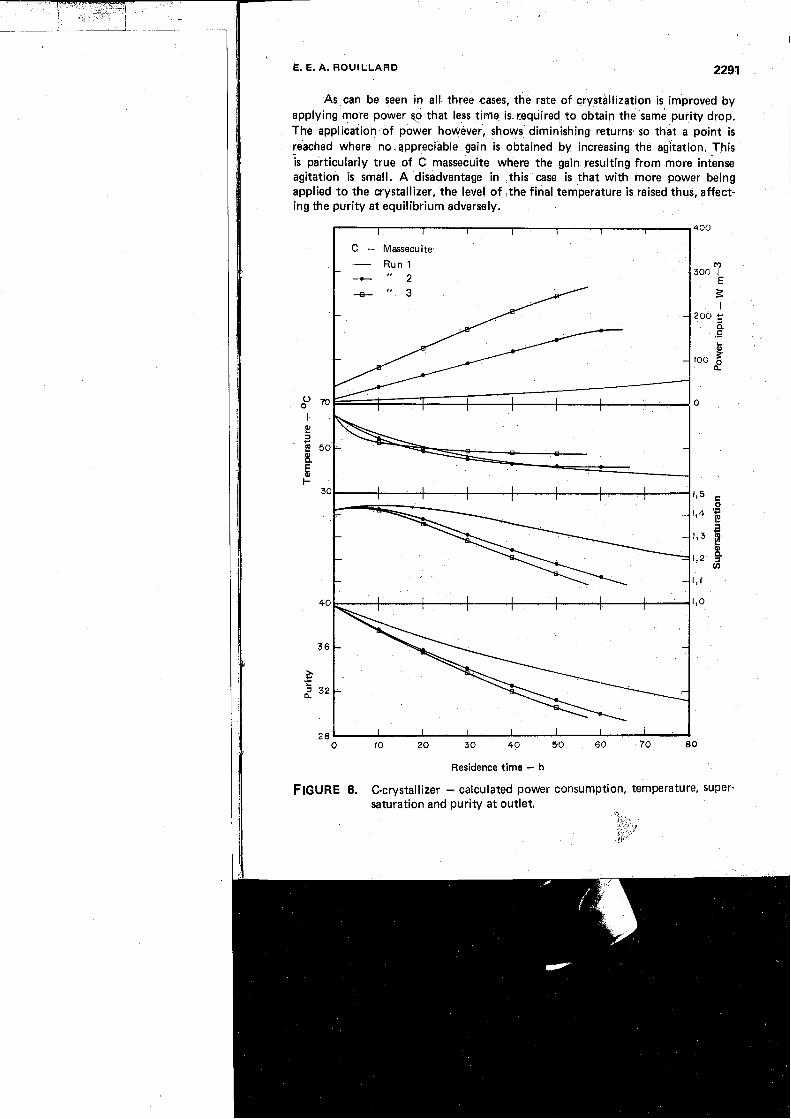
As can be seen in all three cases, the rate of crystallization is improved by applying more power SO that less time is required to obtain the same purity drop. The application of power however, shows diminishing returns1 so that a point is reached where no.appreciable gain is obtained by increasing the agitation. This is particular& true of C massecuite where the gain resulting from more intense agitation is small. A disadvantage in this case is that with more power being applied to the crystallizer, the level of ,the final temperature is raised thus, affect- ing the purity at equilibrium adversely.
I C - Massecuite I Run 1 t I p 1 2
I 11 Residence time - h
1 11 FIGURE 6. C-cwstallizer - calc
PROCESSING
It is possible to calculate the economics of power against retention time to determine the optimum power input. This was done for A-, B- and C-massecuite and the optimum was found to be about 0.25,0,20 and 0.1 5 kWm-3 respectively.
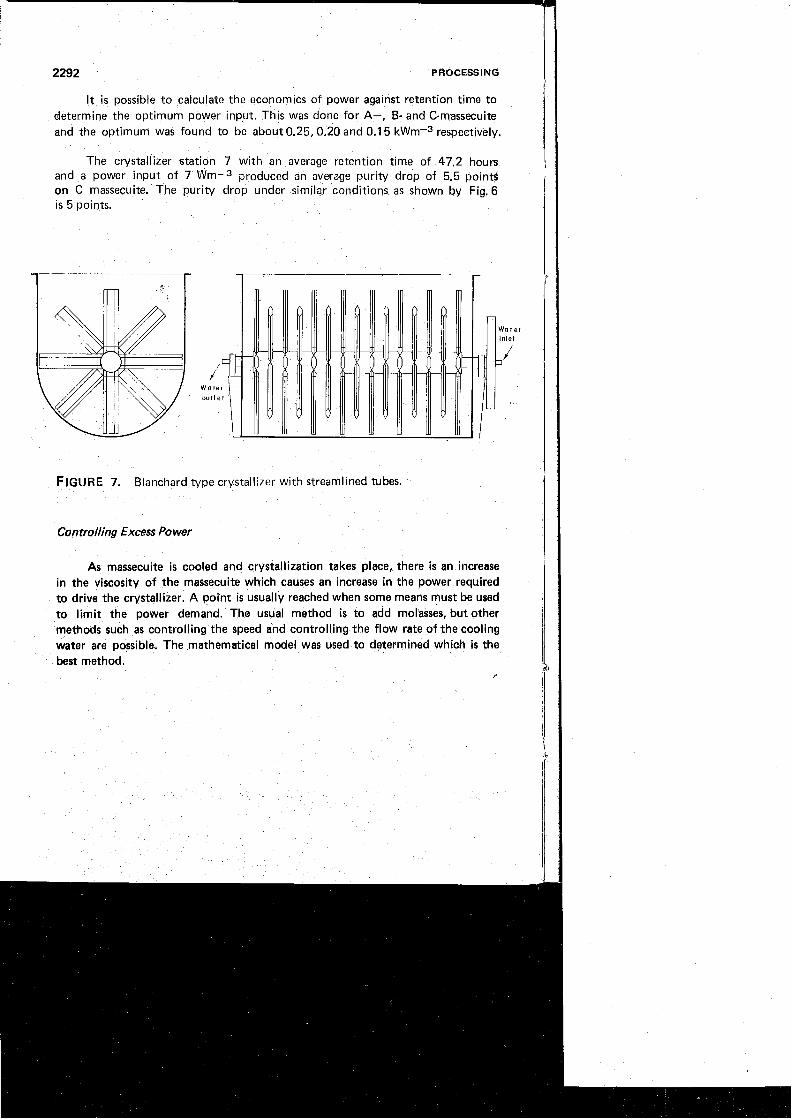
The crystallizer station 7 with an average retention time of 47.2 hours and a power input of 7 Wm-3 produced an average purity drop of 5.5 points on C massecuite. The purity drop under similar conditions as shown by Fig. 6 is 5 points.
FIGURE 7. Blanchard type crystallizer with streamlined tubes.
Controlling Excess Power
As massecuite is cooled and crystallization takes place, there is an increase , in the viscosity of the massecuite which causes an increase in the power required to drive the crystallizer. A polnt is usually reached when some means must be used to limit the power demand. The usual method is to add molasses, but other methods such as controlling the speed and controlling the flow rate of the cooling I
water are possible. The mathematical model was used to determined which is the best method.
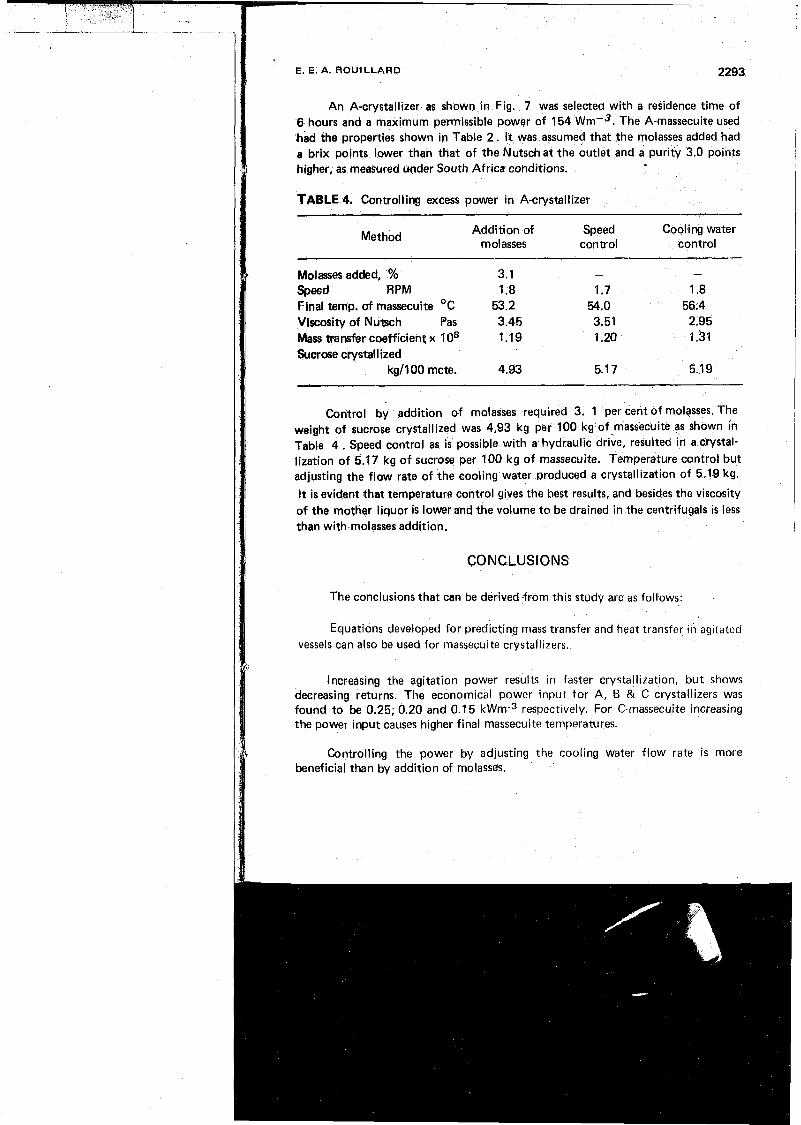
An A-crystallizer as shown in Fig. 7 was selected with a residence time of 6 hours and a maximum permissible power of 154 wmd3. The A-massecuite used 'had the properties shown in Table 2 . It was assumed that the molasses added had a brix points Lower than that of the Nutschat the outlet and a purity 3.0 points
I higher, as measured uoder South Africa conditions.
TABLE 4. Controlling excess power in A-crystallizer
Method Addition of Speed Cooling water
molasses control control
, Molasses added, % Sped RPM Final temp. of massecuite OC Viscosity of Nutsch Pas Mass transfer coefficient x lo8 Sucrose crystallized
kg1100 mcte.
Control by addition of molasses required 3. 1 per cent of molgsses. The weight of sucrose crystallized was 4,93 kg per 100 kg of massecuite as shown in Table 4 . Speed control as is possible with a hydraulic drive, resulted in a Crystal- lization of 5.77 kg of sucrose per 100 kg of massecuite. Temperature control but adjusting the flow rate of the cooling water produced a crystallization of 5.19 kg.
It is evident that temperature control gives the hest results, and besides the viscosity of the mother liquor is lower and the volume to be drained in the centrifugals is less than with molasses addition.
CONCLUSIONS
The conclusions that can be derived from this study are as follows:
Equations developed for predicting mass transfer and heat transfer in agitated vessels can also be used for massecuite crystallizers.
B
Increasing the agitation power results in faster crystallization, but shows decreasing returns. The economical power input for A, B & C crystallizers was found to be 0.25; 0.20 and 0.1 5 kWm3 respectively. For C-massecuite increasing the power input causes higher final massecuite temperatures.
Controlling the power by adjusting the cooling water flow rate is more beneficial than by addition of molasses.
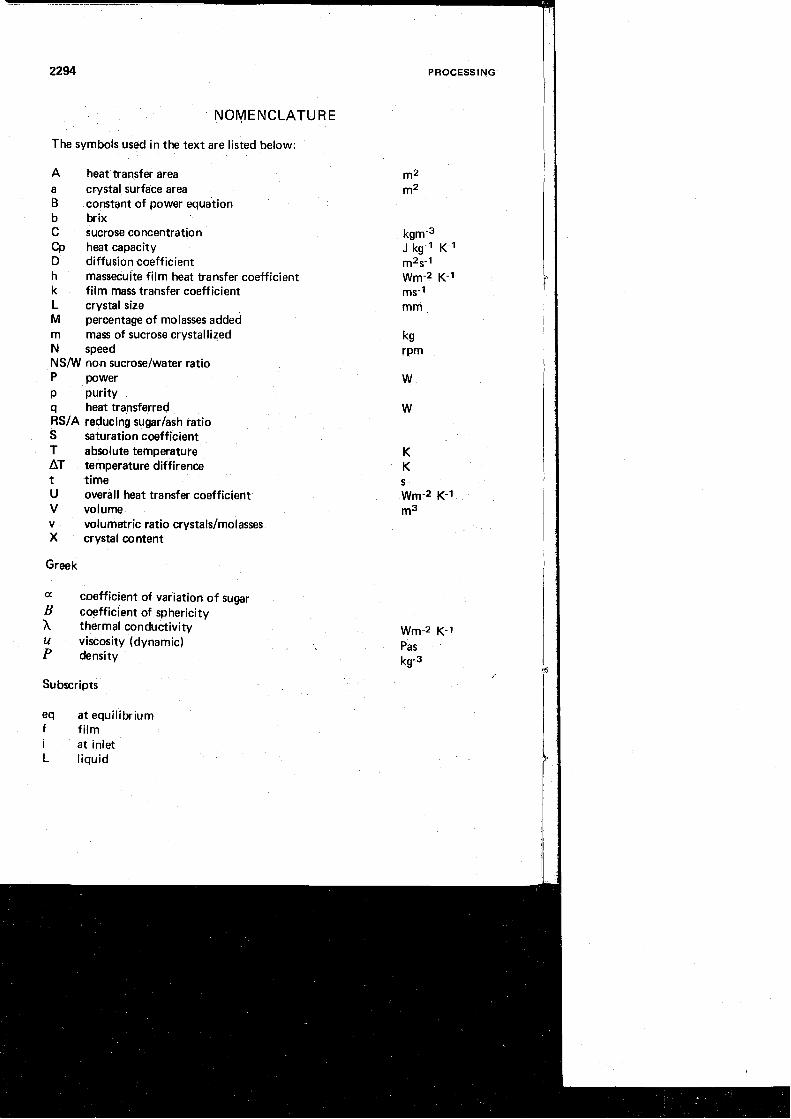
NOMENCLATURE
f he symbols used in the text are listed below:
A heat traqsfer area a crystal surface area B constant of power equation b brix C sucrose concentration Cp heat capacity D diffusion coefficient h massecuite film heat transfer coefficient k film mass transfer coefficient L crystal size M percentage of molasses added m mass of sucrose crystallized N speed NSIW ncm sucrose/water ratio P power p purity q heat transferred RSIA reducing sugarlash ratio S saturation coefficient T absolute temperature AT temperature diffirence t time U overall heat transfer coefficient V volume v volumetric ratio crystalslmolasses X crystal content
Greek
a coefficient of variation of sugar B coefficient of sphericity h thermal conductivity u viscosity (dynamic) P density
Subscripts
PROCESSING
kgm-3 J kg-' K-I m2s-1 Wm-2 K-1 ms-1 mm
Wm-2 K-1 Pas kg-3
eq at equilibrium f film i at inlet L liquid
m masseculte mol molasses n Nutsch 0 out s sucrose
Superscript *corrected value
REFERENCES
1. Bruijn, J. (1977). Exhaustion of molasses equipment to determine target purities, SASTA Proc. 51 : 123-1 24.
2. Calderbank, P. H. and M. B. Moo-Yong (1960). The continuous phase heat and mass transfer properties of dispersions. Chem. Eng. Sci. 16: 39-44.
3. Douwes, Dekker, K. and M. J. Douwes Dekker (1952). Some notes on the properties of raw sugar in connection with deterioration during storage. SASTA Proc. 26: 40-47.
4. Emmerich, A., D. Finke, N. Panitz, and H. Rieck (1976). Investigations of diffusion in pure and technical sucrose solutions. Zucker 29: 302-307.
5. Herrera, R. and S. R. Siemon (1973). Diffusion coefficient in concentrated aqueos sucrose solutions. Latin Amer. J. Chem. Eng. Appl. Chem. 3(2): 79'89.
6. Honig, P. (1953). Principles of sugar technology. Elsevier, Amsterdam.
7. Hugot, E. (1972). Handbook of sugar cane technology. Elsevier, Amsterdam.
8. Rouillard, E. E. A. (1978). The crystallization of high grade massecuite in crystallizers. SASTA Proc. 52: 73-79.
9. Silin, P. M. (1958). Technology of beet sugar production and refining. Pishcepromizdat, Moscow.
10. Smythe, B. M. (1971). Sucrose crystal growth. Sugar Technol. Rev. 1: 191- 231.
2296 'PROCESSING
MODEL0 MATEMATICO PARA CRISTALIZADORES A, 13, Y C
E.E.A. Rouillard
RESUMEN
Se demuestra que las ecuaciones de&trolladas para pre Jecir 10s coeficientes de transmision de calor y de masa en recipientes con agitacion, yueden ser aplicadas a 10s cristalizadores.
?
Se da un modelo matematico que toma en cuenta las propiedades 1 fisicas de la masacocida asi como la geometria de 10s cristalizadores. I
Con la ayuda de este modelo es posible calcular la pureza, grado de sobresaturacion, viscocidad y teinperatura del licor madre y de la fuerza requerida para la agitation. I
Calculos hechos con este modelo han demonstrado la caida de la yureza que puede lograrse con un tiempo de residencia dado esta en funcion de la patencia utilizada en la agitacion y de la temperatura del agua de enfrihiento. Sin embargo si se alcanza el punto de equilibrio, la pureza obtenida depender6 solamente de las propiedades de la masa- cocida y de la temperatura final.
I
I I