mathematics 10 to 12...grade collection chart for applications of mathematics 10 to 12 and...
TRANSCRIPT

Integrated Resource Package 2000
MATHEMATICS 10 TO 12
Applications of Mathematics 10 to 12 Essentials of Mathematics 10 to 12 Principles of Mathematics 10 to 12
Calculus 12
IRP 110

Copyright © 2000 Ministry of Education, Province of British Columbia.
Copyright Notice
No part of the content of this document may be reproduced in any form or by any means, including electronic storage,reproduction, execution or transmission without the prior written permission of the Province.
Proprietary Notice
This document contains information that is proprietary and confidential to the Province. Any reproduction,disclosure or other use of this document is expressly prohibited except as the Province may authorize in writing.
Limited Exception to Non-reproduction
Permission to copy and use this publication in part, or in its entirety, for non-profit educational purposes withinBritish Columbia and the Yukon, is granted to all staff of B.C. school board trustees, including teachers andadministrators; organizations comprising the Educational Advisory Council as identified by Ministerial Order; andother parties providing direct or indirect education programs to entitled students as identified by the School Act or theIndependent School Act.
I
PREFACE: USING THIS INTEGRATED RESOURCE PACKAGE
Preface . . . . . . . . . . . . . . . . . . . . . . . . . . . . . . . . . . . . . . . . . . . . . . . . . . . . . . . . . . . . . . . . . III
INTRODUCTION
The Development of this Integrated Resource Package . . . . . . . . . . . . . . . . . . . . . . . . . 1Rationale . . . . . . . . . . . . . . . . . . . . . . . . . . . . . . . . . . . . . . . . . . . . . . . . . . . . . . . . . . . . . . . . 1The Three Pathways . . . . . . . . . . . . . . . . . . . . . . . . . . . . . . . . . . . . . . . . . . . . . . . . . . . . . . . 5Suggested Instructional Strategies . . . . . . . . . . . . . . . . . . . . . . . . . . . . . . . . . . . . . . . . . . . 6Integration of Cross-Curricular Interests . . . . . . . . . . . . . . . . . . . . . . . . . . . . . . . . . . . . . 8Suggested Assessment Strategies . . . . . . . . . . . . . . . . . . . . . . . . . . . . . . . . . . . . . . . . . . . 10Applications of Mathematics Pathways . . . . . . . . . . . . . . . . . . . . . . . . . . . . . . . . . . . . . 12Essentials of Mathematics Pathways . . . . . . . . . . . . . . . . . . . . . . . . . . . . . . . . . . . . . . . . 13Principles of Mathematics Pathways . . . . . . . . . . . . . . . . . . . . . . . . . . . . . . . . . . . . . . . . 14
THE MATHEMATICS 10 TO 12 CURRICULUM
Applications of Mathematics 10 to 12 . . . . . . . . . . . . . . . . . . . . . . . . . . . . . . . . . . . . . . . 17Essentials of Mathematics 10 to 12 . . . . . . . . . . . . . . . . . . . . . . . . . . . . . . . . . . . . . . . . . . 71Principles of Mathematics 10 to 12 . . . . . . . . . . . . . . . . . . . . . . . . . . . . . . . . . . . . . . . . . 133Calculus 12 . . . . . . . . . . . . . . . . . . . . . . . . . . . . . . . . . . . . . . . . . . . . . . . . . . . . . . . . . . . . . 191
MATHE MATICS 10 TO 12 APPENDICES
Appendix A: Prescribed Learning Outcomes Applications of Mathematics 10 . . . . . . . . . . . . . . . . . . . . . . . . . . . . . . . A-3 Applications of Mathematics 11 . . . . . . . . . . . . . . . . . . . . . . . . . . . . . . . A-7 Applications of Mathematics 12 . . . . . . . . . . . . . . . . . . . . . . . . . . . . . . A-11 Essentials of Mathematics 10 . . . . . . . . . . . . . . . . . . . . . . . . . . . . . . . . A-15 Essentials of Mathematics 11. . . . . . . . . . . . . . . . . . . . . . . . . . . . . . . . . A-19 Essentials of Mathematics 12 . . . . . . . . . . . . . . . . . . . . . . . . . . . . . . . . A-23 Principles of Mathematics 10 . . . . . . . . . . . . . . . . . . . . . . . . . . . . . . . . A-27 Principles of Mathematics 11 . . . . . . . . . . . . . . . . . . . . . . . . . . . . . . . . A-33 Principles of Mathematics 12 . . . . . . . . . . . . . . . . . . . . . . . . . . . . . . . . A-37 Calculus 12 . . . . . . . . . . . . . . . . . . . . . . . . . . . . . . . . . . . . . . . . . . . . . . . . A-41
TABLE OF CONTENTS

II
Appendix B: Learning Resources . . . . . . . . . . . . . . . . . . . . . . . . . . . . . . . . . . . . . . . . . . B-3Appendix C: Cross-Curricular Interests . . . . . . . . . . . . . . . . . . . . . . . . . . . . . . . . . . . . C-3
MATHE MATICS 10 TO 12 APPENDICES
Appendix D: Assessment and Evaluation . . . . . . . . . . . . . . . . . . . . . . . . . . . . . . . . . . D-3Appendix E: Acknowledgments . . . . . . . . . . . . . . . . . . . . . . . . . . . . . . . . . . . . . . . . . . E-3Appendix F: Glossary . . . . . . . . . . . . . . . . . . . . . . . . . . . . . . . . . . . . . . . . . . . . . . . . . . . F-3Appendix G: Illustrative Examples . . . . . . . . . . . . . . . . . . . . . . . . . . . . . . . . . . . . . . . . G-3 Applications of Mathematics 10 . . . . . . . . . . . . . . . . . . . . . . . . . . . . . . . G-7 Applications of Mathematics 11 . . . . . . . . . . . . . . . . . . . . . . . . . . . . . . G-37 Applications of Mathematics 12 . . . . . . . . . . . . . . . . . . . . . . . . . . . . . . G-65 Essentials of Mathematics 10 . . . . . . . . . . . . . . . . . . . . . . . . . . . . . . . . G-91 Essentials of Mathematics 11. . . . . . . . . . . . . . . . . . . . . . . . . . . . . . . . G-113 Essentials of Mathematics 12 . . . . . . . . . . . . . . . . . . . . . . . . . . . . . . . G-135 Principles of Mathematics 10 . . . . . . . . . . . . . . . . . . . . . . . . . . . . . . . G-155 Principles of Mathematics 11 . . . . . . . . . . . . . . . . . . . . . . . . . . . . . . . G-183 Principles of Mathematics 12 . . . . . . . . . . . . . . . . . . . . . . . . . . . . . . . G-207 Calculus 12 . . . . . . . . . . . . . . . . . . . . . . . . . . . . . . . . . . . . . . . . . . . . . . . G-227Appendix H: Additional Support for Instruction . . . . . . . . . . . . . . . . . . . . . . . . . . . . H-3
TABLE OF CONTENTS

III
PREFACE: USING THIS INTEGRATED RESOURCE PACKAGE
This Integrated Resource Package (IRP)provides some of the basicinformation that teachers will require
to implement Applications of Mathematics10 to 12, Essentials of Mathematics 10 to 12,Principles of Mathematics 10 to 12, andCalculus 12. The information contained inthis IRP is also available through theInternet. Contact the Ministry of Education’shome page: http://www.bced.gov.bc.ca/
THE INTRODUCTION
The Introduction provides generalinformation about the Grade 10 to 12Mathematics curriculum, including specialfeatures and requirements. It also provides arationale for the subject—why mathematicsis taught in BC schools—and an explanationof the curriculum organizers.
THE GRADE 10 TO 12 MATHEMATICS
CURRICULUM
The provincially prescribed curriculum forGrade 10 to 12 Mathematics is structured interms of curriculum organizers. The mainbody of this IRP consists of four columns ofinformation for each organizer. Thesecolumns describe:• provincially prescribed learning outcome
statements for Grade 10 to 12 Mathematics• suggested instructional strategies for
achieving the outcomes• suggested assessment strategies for
determining how well students areachieving the outcomes provincially
• recommended learning resources
Prescribed Learning Outcomes
Learning outcome statements are contentstandards for the provincial education system.Learning outcomes set out the knowledge,enduring ideas, issues, concepts, skills, andattitudes for each subject. They are statements
of what students are expected to know and beable to do in each grade. Learning outcomesare clearly stated and expressed in measurableterms. All learning outcomes complete thisstem: “It is expected that students will. . . . ”
Outcome statements have been written toenable teachers to use their experience andprofessional judgment when planning andevaluating. The outcomes are benchmarksthat will permit the use of criterionreferenced performance standards. It isexpected that actual student performancewill vary. Evaluation, reporting, and studentplacement with respect to these outcomesdepends on the professional judgment ofteachers, guided by provincial policy.
Suggested Instructional Strategies
Instruction involves the use of techniques,activities, and methods that can be employedto meet diverse student needs and to deliverthe prescribed curriculum. Teachers are free toadapt the suggested instructional strategies orsubstitute others that will enable their studentsto achieve the prescribed outcomes. Thesestrategies have been developed by specialistand generalist teachers to assist theircolleagues; they are suggestions only.
Suggested Assessment Strategies
The assessment strategies suggest a varietyof ways to gather information about studentperformance. Some assessment strategiesrelate to specific activities; others are general.As with the instructional strategies, thesestrategies have been developed by specialistand generalist teachers to assist theircolleagues; they are suggestions only.
Provincially Recommended LearningResources
The Ministry of Education promotes theestablishment of a resource-rich learning

IV
PREFACE: USING THIS INTEGRATED RESOURCE PACKAGE
environment through the evaluation ofeducationally appropriate materials intendedfor use by teachers and students. The mediaformats include, but are not limited to,materials in print, video, and software, as wellas combinations of these formats. Learningresources for Applications of Math 10 to 12 andPrinciples of Math 10 to 12 were reviewed andrecommended as part of the Western CanadianProtocol (WCP) Mathematics LearningResource Evaluation. The WCP recommendedlearning resources have been approved by theMinister and have been incorporated into theGrade Collection for each course.
The Grade Collection package contains agrade collection chart for Applications ofMathematics 10 to 12 and Principles ofMathematics 10 to 12. These charts list boththe comprehensive and additional resourcesfor each curriculum organizer for the course.Each chart is followed by an annotatedbibliography. Please confirm with suppliersfor complete and up-to-date information.
Provincially recommended learningresources for Calculus 12 are materials thathave been reviewed and evaluated by BritishColumbia teachers in collaboration with theMinistry of Education.
Provincially recommended learningresources for Essentials of Mathematics 10 to12 are being developed and will be identifiedat a later date. As an interim measure theministry has provided schools withphotocopy masters of learning resourcesdeveloped for a similar curriculum.
It is expected that teachers will selectresources from those that meet the provincialcriteria and that suit their particularpedagogical needs and audiences. Teacherswho wish to use non-provinciallyrecommended resources to meet specific localneeds must have these resources evaluatedthrough a local district approval process.
THE APPENDICES
A series of appendices provides additionalinformation about the curriculum, andfurther support for the teacher.
• Appendix A contains a listing of theprescribed learning outcomes for thecurriculum.
• Appendix B contains a comprehensivelisting of the provincially recommendedlearning resources for this curriculum. Asnew resources are evaluated, thisappendix will be updated.
• Appendix C outlines the cross-curricularreviews used to ensure that concerns suchas equity, access, and the inclusion ofspecific topics are addressed by allcomponents of the IRP.
• Appendix D contains assistance forteachers related to provincial evaluationand reporting policy. Prescribed learningoutcomes have been used as the source forexamples of criterion-referencedevaluations.
• Appendix E acknowledges the manypeople and organizations that have beeninvolved in the development of this IRP.
• Appendix F contains an illustrated glossaryof terms used in this IRP.
• Appendix G contains illustrative exampleswhich show the competencies an averagestudent is expected to demonstrate foreach of the prescribed learning outcomes.
• Appendix H contains more detailedinformation related to specific teachingstrategies referred to in the IRP. Thisinformation is provided in cases whereexplanations of strategies and activities aretoo extensive to fit in the SuggestedInstructional Strategies column, or wherethe same activity is referred to several times.

V
SUGGESTED INSTRUCTIONAL STRATEGIESPRESCRIBED LEARNING OUTCOMES
SUGGESTED ASSESSMENT STRATEGIES RECOMMENDED LEARNING RESOURCES
PRINCIPLES OF MATHEMATICS 10 • Patterns and Relations (Patterns)
Suggested AssessmentStrategies
The SuggestedAssessment Strategies
offer a wide range ofdifferent assessmentapproaches useful in
evaluating the prescribedlearning outcomes.
Teachers should considerthese as examples they
might modify to suit theirown needs and theinstructional goals.
Suggested InstructionalStrategies
The SuggestedInstructional Strategiescolumn of this IRPsuggests a variety ofinstructional approachesthat include group work,problem solving, and theuse of technology. Teachersshould consider these asexamples that they mightmodify to suit thedevelopmental levels oftheir students.
Prescribed LearningOutcomes
The Prescribed LearningOutcomes column of this
IRP lists the specificlearning outcomes for
each curriculumorganizer.
Grade Curriculum Organizer
Grade Curriculum Organizer
Recommended LearningResources
The RecommendedLearning Resourcescomponent of this IRP is acompilation of provinciallyrecommended resourcesthat support the prescribedlearning outcomes. Acomplete list including ashort description of theresource, its media type,and distributor isincluded in Appendix Bof this IRP.
PRINCIPLES OF MATHEMATICS 10 • Patterns and Relations (Patterns)
PREFACE: USING THIS INTEGRATED RESOURCE PACKAGE
It is expected that students will generate and analysenumber patterns.
It is expected that students will:
• generate number patterns exhibiting arithmeticgrowth
• use expressions to represent general terms andsums for arithmetic growth, and apply theseexpressions to solve problems
• relate arithmetic sequences to linear functionsdefined over the natural numbers
• generate number patterns exhibiting geometricgrowth
Many natural phenomena and man-made processes growand shrink according to easily defined mathematical rules.An understanding of arithmetic and geometric growthhelps students to better understand how the world aroundthem changes.
• Give students a collection of arithmetic or geometricsequences with blanks either between the numbers or atthe end of the sequence for students to fill in. Have themstate the common difference or ratio and give a word-based rule describing how one term is calculated fromthe previous term.
• Have students find three examples of arithmetic orgeometric sequences found in nature or used by peoplein their day-to-day lives.
• Ask students to match a column of linear equations to acolumn of arithmetic sequences.
• Have students describe or model natural phenomenathat incorporate geometric sequences in their structure(e.g., flowers, spiral shells, paper folding).
• Give students numerical and non-numerical patterns andask them to define the rule(s) for each pattern. Havethem use the rules to make predictions and classify thepatterns.
• Have students use concepts of arithmetic and geometricgrowth to solve problems such as:- If $1000 is deposited each year into an account that
earns 12% compounded annually, how much moneywill have accumulated after 25 years?
Then have them:- generate a model of this situation- identify it as geometric or arithmetic- discuss the answer (Is it surprising? Reasonable?)
Assessment strategies should demonstrate algebraicskills as well as holistic pattern recognition. Studentsshould also be able to articulate methods to aid inpattern discovery.
Observe
• How quickly do students see the patterns in partiallycompleted sequences:- with no hints (2, 5, 8…)- with hints (2, _, _, 16, _… - geometric)
• Can students develop a mathematical equation from asequence?
Question
• Can students articulate what to look for indetermining whether a collection of numbers is anarithmetic sequence, geometric sequence, or neither?
Collect
• Have students collect five arithmetic, five geometric,and five other sequences. Provide them withequations or descriptions of how to generate eachsequence.
Peer/Self Assessment
• Have each student develop a connect-the-dots puzzleusing a combination of sequences and linearequations. Ask them to have another student do thepuzzle and check it for accuracy.
Print Materials
• Exploring Advanced Algebra with the TI-83• An Introduction to the TI-82 Graphing Calculator• Modeling Motion: High School Math Activities with
the CBR• Pure Mathematics 10 (Distance Learning Package)• A Visual Approach to Algebra
Multi-media
• The Learning Equation: Mathematics 10Lessons 22 - 24
• Mathematics 10, Western Canadian EditionCh. 1 (Sections 1.1, 1.2, 1.4)Ch. 5 (Section 5.5)
• MATHPOWER 10, Western EditionCh. 2 (Sections 2.3, 2.5, 2.7)
Software
• Secondary Math Lab Toolkit• Understanding Math Series
Games/Manipulatives
• Radical Math: Math Games Using Cards and Dice(Volume VII)
CD-ROM
• Geometry Blaster

1
INTRODUCTION TO MATHEMATICS 10 TO 12
This Integrated Resource Package (IRP) setsout the provincially prescribed curriculumfor the Grade 10 to 12 Mathematicscurriculum. The development of this IRP hasbeen guided by the principles of learning:
• Learning requires the active participationof the student
• People learn in a variety of ways and atdifferent rates
• Learning is both an individual and agroup process
THE DEVELOPMENT OF THIS INTEGRATED
RESOURCE PACKAGE
A variety of resources were used in thedevelopment of this IRP:
• The prescribed learning outcomes,suggested instructional strategies,suggested assessment strategies, andIllustrative Examples for Applications ofMathematics 10 to 12 and Principles ofMathematics 10 to 12 were developed withreference to The Common CurriculumFramework for K to 12 Mathematics (WesternCanadian Protocol for Collaboration inBasic Education, 1996)
• The prescribed learning outcomes,suggested instructional strategies,suggested assessment strategies, andIllustrative Examples for Essentials ofMathematics 10 to 12 were developed withreference to Consumer Mathematics (Senior2, 3, & 4): A Foundation for Implementationand Student Handbooks (ManitobaEducation & Training, 1999)
• Other written resources used include- Curriculum and Evaluation Standards for
School Mathematics (National Council ofTeachers of Mathematics, 1989)
- Guidelines for Student Reporting- provincial reference sets Evaluating
Problem Solving Across Curriculum and
Evaluating Mathematical DevelopmentAcross Curriculum
- Report of the BCAMT Shape/Space(Geometry) Sub-Committee (BC Associationof Mathematics Teachers, 1999)
- Assessment Handbook Series- Summary of Responses to the Draft Grade
10 to 12 Mathematics IRP- Mathematics Proficiencies for Post-
Secondary Mathematics/Statistics Courses:Project Report (Neufeld, 1999)
This IRP represents the ongoing effort of theprovince to provide education programs thatput importance on high standards ineducation while providing equity and accessfor all learners. In addition to this printversion, the Grade 10 to 12 Mathematics IRPwill also be available in electronic format.
RATIONALE
Mathematics is increasingly important in ourtechnological society. Students today requirethe ability to reason and communicate, tosolve problems, and to understand and usemathematics. Development of these skillshelps students become numerate.
Numeracy can be defined as thecombination of mathematical knowledge,problem solving and communicationskills required by all persons to functionsuccessfully within our technologicalworld. Numeracy is more than knowingabout numbers and number operations.(British Columbia Association ofMathematics Teachers, 1998)
Becoming numerate involves developing theability to explore, conjecture, reason logically,and use a variety of mathematical methodsto solve problems. It also involves thedevelopment of self-confidence and theability to use quantitative and spatialinformation in problem solving and decision

2
INTRODUCTION TO MATHEMATICS 10 TO 12
making. As students develop their numeracyskills and concepts, they generally growmore confident and motivated in theirmathematical explorations. This growthoccurs as they learn to enjoy and valuemathematics, to think analytically, and tounderstand and appreciate the role ofmathematics in everyday life.
The provincial mathematics curriculumemphasizes the development of numeracyskills and concepts and their practicalapplication in higher education and theworkplace. The curriculum places emphasison probability and statistics, reasoning andcommunication, measurement, and problemsolving. To ensure that students are preparedfor the demands of both further educationand the workplace, the graduate years of themathematics curriculum (Grades 11 and 12)help students develop a more sophisticatedsense of numeracy. At the same time, thecurriculum investigates the creative andaesthetic aspects of mathematics byexploring the connections betweenmathematics, art, and design.
Developing Positive Attitudes
Research, including provincial assessments,consistently indicates that there is a positivecorrelation between student attitudes andperformance. Mathematics activities shouldbe interesting and engaging, so that studentswill be more likely to take risks to developtheir mathematical thinking. Classroompractice and teaching strategies shouldpromote positive attitudes towardmathematics for all students.
Becoming Mathematical Problem Solvers
Problem solving is the cornerstone ofmathematics instruction. Students must learnthe skills of effective problem solving, whichinclude the ability to:
• read and analyse a problem• identify the significant elements of a
problem• select an appropriate strategy to solve a
problem• work alone or in groups• verify and judge the reasonableness of an
answer• communicate solutions
Acquiring these skills can help studentsbecome reasoning individuals able tocontribute to society.
As students move through the grades, thecurriculum presents them with increasinglydiverse and complex mathematical problemsto solve. To encourage students’ abilities tocommunicate, explore, create, adjust tochanges, and actively acquire newknowledge throughout their lives,mathematical problem solving should evolvenaturally out of their experiences and be anintegral part of all mathematical activity.Effective problem solving consists of morethan being able to solve many different typesof problems. Students need to be able tosolve mathematical problems that arise inany subject area and to draw upon skillsdeveloped in more than one area ofmathematics. Becoming a mathematicalproblem solver requires a willingness to takerisks and persevere when faced withproblems that do not have an immediatelyapparent solution.
Communicating Mathematically
Mathematics is a language—a way ofcommunicating ideas. Communication playsan important role in helping students buildlinks between their informal, intuitivenotions and the abstract language andsymbolism of mathematics. Communicationalso plays a key role in helping students

3
INTRODUCTION TO MATHEMATICS 10 TO 12
make important connections amongphysical, pictorial, graphic, symbolic, verbal,descriptive, and mental representations ofmathematical ideas. All activities that helpstudents explore, explain, investigate,describe, and justify their decisions promotethe development of communication skills.The Kindergarten to Grade 12 mathematicscurriculum emphasizes discussing, writing,and representing mathematical thinking invarious ways.
Connecting and ApplyingMathematical Ideas
Learning activities should help studentsunderstand that mathematics is a changingand evolving domain to which manycultural groups have contributed. Studentsbecome aware of the usefulness ofmathematics when mathematical ideas areconnected to everyday experiences. Learningactivities should therefore help studentsrelate mathematical concepts to real-worldsituations and allow them to see how onemathematical idea can help them understandothers. This approach emphasizes thatmathematics helps students solve problems,describe and model real-world phenomena,and communicate complex thoughts andinformation with conciseness and precision.
Reasoning Mathematically
Mathematics instruction should helpstudents develop confidence in their abilitiesto reason and to justify their thinking.Students should understand thatmathematics is not simply memorizing rules.Mathematics should make sense, be logical,and also be enjoyable. The ability to reasonlogically usually develops on a continuumfrom concrete to formal to abstract. Studentsuse inductive reasoning when they makeconjectures by generalizing from a pattern of
observations; they use deductive reasoningwhen they test those conjectures. To developmathematical reasoning skills, studentsrequire the freedom to explore, conjecture,validate, and convince others. It is importantthat their ability to reason is valued as muchas their ability to find correct answers.
Using Technology
The Grade 10 to 12 Mathematics curriculumrequires students to be proficient in usingtechnology as a problem-solving tool. Newtechnology has changed the level ofsophistication of mathematical problemsencountered today as well as the methodsthat mathematicians use to investigate them.Graphing tools such as computers andcalculators are powerful aids to problemsolving. The power to compute rapidly andto graph mathematical relationshipsinstantly can help students explore manymathematical concepts and relationships ingreater depth. When students haveopportunities to use technology, theirgrowing curiosity can lead to richermathematical invention.
It is important to recognize that calculatorsand computers are tools that simplify, but donot accomplish, the work at hand. Theavailability of calculators does not eliminatethe need for students to learn basic facts andalgorithms. Students must have access toand be able to select and use the mostappropriate tool or method for a calculation.In each of the mathematics courses,technology is used extensively to assist in theinvestigation and exploration ofmathematical concepts.
4
INTRODUCTION TO MATHEMATICS 10 TO 12
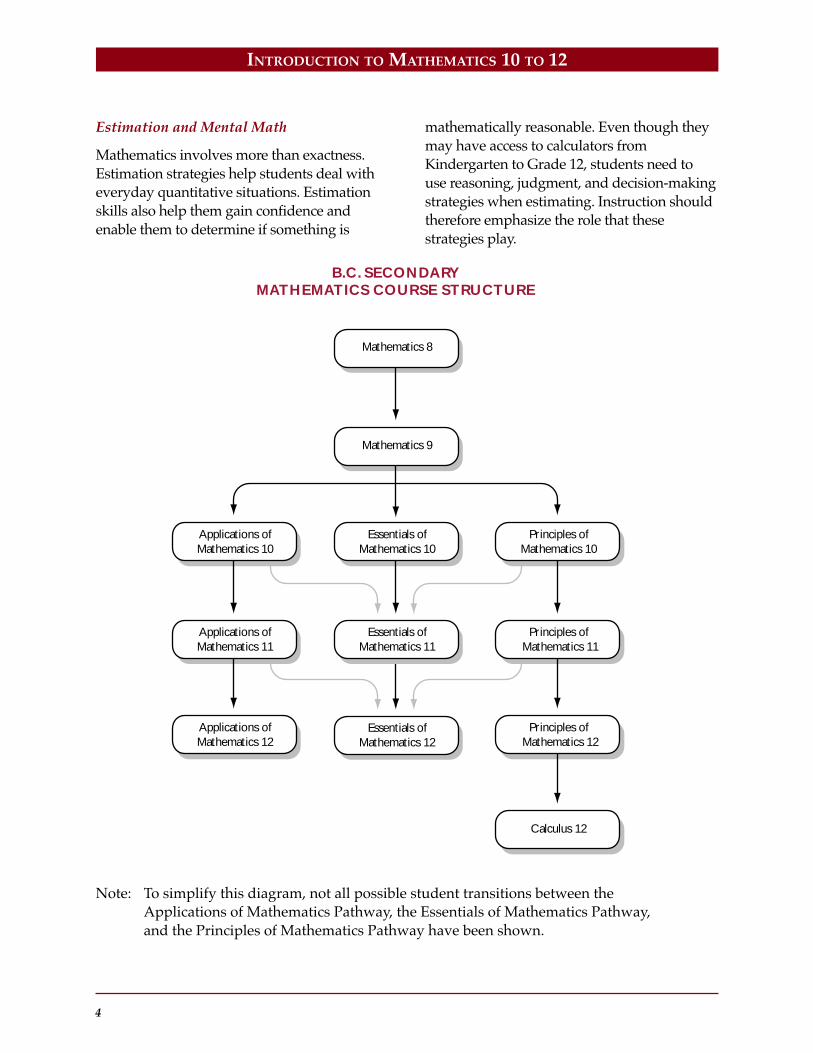
Note: To simplify this diagram, not all possible student transitions between theApplications of Mathematics Pathway, the Essentials of Mathematics Pathway,and the Principles of Mathematics Pathway have been shown.
Essentials ofMathematics 12
B.C. SECONDARY MATHEMATICS COURSE STRUCTURE
Mathematics 8
Mathematics 9
Essentials ofMathematics 10
Essentials ofMathematics 11
Principles ofMathematics 10
Principles of Mathematics 11
Applications ofMathematics 10
Applications ofMathematics 11
Principles of Mathematics 12
Calculus 12
Applications ofMathematics 12
Estimation and Mental Math
Mathematics involves more than exactness.Estimation strategies help students deal witheveryday quantitative situations. Estimationskills also help them gain confidence andenable them to determine if something is
mathematically reasonable. Even though theymay have access to calculators fromKindergarten to Grade 12, students need touse reasoning, judgment, and decision-makingstrategies when estimating. Instruction shouldtherefore emphasize the role that thesestrategies play.

5
INTRODUCTION TO MATHEMATICS 10 TO 12
THE THREE PATHWAYS
The mathematics curriculum for Grades 10to 12 offers students a choice of routesthrough the different mathematics coursesoffered. Although each student’s exact routewill depend on a variety of factors, there arethree main pathways:
• Applications of Mathematics• Essentials of Mathematics• Principles of Mathematics and Calculus 12
The Applications of Mathematics Pathway
The Applications of Mathematics pathwayprovides a practical, contextual focus thatencourages students to develop theirmathematical knowledge, skills, andattitudes in the context of their lives andpossible careers. The instructionalapproaches used to develop the requiredmathematical concepts emphasize concreteactivities and modeling, with less emphasison symbol manipulation. When needed,students should have access to technologythat extends their basic skills and knowledgeand allows them to repeatedly investigate andmodel mathematical concepts and issues.
Students from the Applications ofMathematics pathway will be well preparedfor many post-secondary programs that donot require calculus as part of the program ofstudies. The breadth of the Applications ofMathematics curriculum is intended toprepare students for entrance into manycertificate programs, diploma programs,continuing education programs, tradesprograms, technical programs, and somedegree programs.
The Essentials of Mathematics Pathway
In order to meet the challenges of society,high school graduates must be numerate.Students following this pathway will have
opportunities to improve their numeracyskills and concepts. Developing a sense ofnumeracy will help them to understand howmathematical concepts permeate daily life,business, industry, and government.Students need to be able to use mathematicsnot just in their work lives, but in theirpersonal lives as citizens and consumers.It is intended that students will learn tovalue mathematics and become confident intheir mathematical abilities.
The Principles of Mathematics Pathway
Students following the Principles ofMathematics pathway will spend more timedeveloping their understanding of symbolmanipulation and of generalizations of moresophisticated mathematical concepts.Although there is an increased focus in thispathway on the applications of mathematics,one of the primary purposes of Principles ofMathematics will be to develop theformalism students will need to continue onwith the study of calculus.
Both Applications of Mathematics 12 andPrinciples of Mathematics 12 have aprovincial exam component. Students whosuccessfully complete Applications ofMathematics 11, Essentials of Mathematics11, or Principles of Mathematics 11 will meetBritish Columbia’s graduation requirements.
Calculus 12
Calculus 12 is intended for students whohave completed (or are concurrently taking)Principles of Mathematics 12 or who havecompleted an equivalent college preparatorycourse that includes algebra, geometry, andtrigonometry.
Students taking Calculus 12 should beprepared to write the UBC - SFU - UVic -UNBC Challenge Examination if they choose
6
INTRODUCTION TO MATHEMATICS 10 TO 12
to do so. For more information concerningthe Challenge Examination contact theMathematics Department at one of theseuniversities.
Some schools may choose to developarticulation agreements with their localcolleges. Students under these agreementsmay receive credit for first-term calculus(depending upon the particular agreement).
Calculus 12 Prerequisites
In Mathematics Proficiencies for Post-SecondaryMathematics/Statistics Courses: Project Report(Neufeld, 1999), the following concepts andskills (listed in descending order ofimportance) were identified as “essential” to“marginally important” for students to possessin order to attempt a course in calculus:
• the function concept• polynomial expressions• exponential expressions• straight line and linear functions• solving equations and inequalities• circular trigonometric functions• rational expressions• triangle trigonometry• the quadratic function• logarithmic function• radical expressions• the geometry of lines and points• polynomial functions• quadratic relations• sequences and series• the geometry of circles
Teachers are urged to assess their students’mathematics proficiency as it relates to thesetopics so that any deficiencies can beaddressed before new calculus concepts aretaught.
ORGANIZATION OF THE CURRICULUM
The prescribed learning outcomes for thecourses described in this IntegratedResource Package are grouped under anumber of curriculum organizers. Thesecurriculum organizers reflect the mainareas of mathematics that students areexpected to address. They form theframework of the curriculum and act asconnecting threads across all grade levelsfor each pathway. The organizers are notequivalent in terms of number of outcomesor the time that students will require inorder to achieve these outcomes.Suggestions for estimated instructionaltimes have been included in this IRP.Teachers are expected to adjust theseestimated instructional times to meet theirstudents’ diverse needs.
Within each course, the prescribed learningoutcomes under many of the curriculumorganizers are grouped under one, two, orthree suborganizers. Each set of prescribedlearning outcomes is introduced by a broadstatement of the associated general learningoutcomes for mathematics. (Material relatedto the general outcomes or suborganizers isnot addressed in every course.)
The ordering of organizers and outcomes inthe Grade 10 to 12 mathematics curriculumdoes not imply an order of instruction. Theorder in which various outcomes and topicsare addressed is left to the professionaljudgment of teachers.
SUGGESTED INSTRUCTIONAL STRATEGIES
Instructional strategies have been includedfor each curriculum organizer (orsuborganizer) and grade level. Thesestrategies are suggestions only, designed toprovide guidance for generalist andspecialist teachers planning instruction to

7
INTRODUCTION TO MATHEMATICS 10 TO 12
meet the prescribed learning outcomes.Some links to other subjects are indicated.
The strategies may be teacher directed,student directed, or both. There is notnecessarily a one-to-one relationshipbetween learning outcomes and instructionalstrategies, nor is this organization intendedto prescribe a linear approach to coursedelivery; it is expected that teachers willadapt, modify, combine, and organizeinstructional strategies to meet the needs ofstudents and respond to local requirements.
Context Statements
Each set of instructional strategies starts witha context statement followed by severalexamples of learning activities. The contextstatement links the prescribed learningoutcomes with instruction. It also states whythese outcomes are important for thestudent’s mathematical development.
Instructional Activities
The mathematics curriculum is designed toemphasize the skills needed in theworkplace, including those involving the useof probability and statistics, reasoning,communicating, measuring, and problemsolving.
Additional emphasis is given to strategiesand activities that:
• foster the development of positive attitudes
Students should be exposed to experiencesthat encourage them to enjoy and valuemathematics, develop mathematical habits ofmind, and understand and appreciate therole of mathematics in human affairs. Theyshould be encouraged to explore, take risks,exhibit curiosity, and make and correcterrors, so that they gain confidence in theirabilities to solve complex problems. The
assessment of attitudes is indirect, and basedon inferences drawn from students’behaviour. We can see what students doand hear what they say, and from theseobservations make inferences and drawconclusions about their attitudes.
• apply mathematics
For students to view mathematics as relevantand useful, they must see how it can beapplied to a wide variety of real-worldapplications. Mathematics helps studentsunderstand and interpret their world andsolve problems that occur in their daily lives.
• use manipulatives
Using manipulatives is a good way toactively involve students in mathematics.Manipulatives encourage students toexplore, develop, estimate, test, and applymathematical ideas in relation to the physicalworld. Manipulatives range fromcommercially developed materials to simplecollections of materials such as boxes, cans,or cards. They can be used to introduce newconcepts or to provide a visual model of amathematical concept.
• use technology
The use of technology in our society isincreasing. Technological skills are becomingmandatory in the workplace. Instruction andassessment strategies that use a range oftechnologies such as calculators, computers,CD-ROMs, and videos will help studentsrelate mathematics to their personal livesand prepare them for the future. The use oftechnology in developing mathematicalconcepts and as an aid in solving complexproblems is encouraged to a greater extent asthe student moves from grade to grade.
8
INTRODUCTION TO MATHEMATICS 10 TO 12
• require problem solving
For students to develop decision-making andproblem-solving skills, they need learningexperiences that challenge them to recognizeproblems and actively try to solve them, todevelop and use various strategies, and tolearn to represent solutions in waysappropriate to their purposes. Problems thatoccur within the students’ environment canbe used as the vehicle or context for studentsto achieve the learning outcomes in any ofthe curriculum organizers.
Instructional Focus
The Grade 10 to 12 mathematics courses arearranged into a number of organizers,including the Problem Solving organizer.Decreasing emphasis on rote calculation,drill and practice, and the size of numbersused in paper and pencil calculations allowsmore time for concept development.
In addition to problem solving, other criticalthinking processes—reasoning and makingconnections—are vital to increasing students’mathematical power and must be integratedthroughout the program. A minimum of halfthe available time within all organizersshould be dedicated to activities related tothese processes.
Instruction should provide a balancebetween estimation and mental mathematics,paper and pencil exercises, and theappropriate use of technology, includingcalculators and computers. (It is assumedthat all students have regular access toappropriate technology such as graphingcalculators, or computers with graphingsoftware and standard spreadsheetprograms.) Concepts should be introducedusing manipulatives, and graduallydeveloped from the concrete to the pictorialto the symbolic.
INTEGRATION OF CROSS-CURRICULAR
INTERESTS
Integration of Cross-Curricular Interests
Throughout the curriculum developmentand revision process, the advice of expertshas been invited to ensure that relevance,equity, and accessibility issues are addressedin all Integrated Resource Packages.
The recommendations of these cross-curricular reviews have been integrated intothe prescribed learning outcomes, suggestedinstructional strategies, and assessmentstrategies components of all curricula withrespect to the following:
• Applied Focus• Career Development• Multiculturalism and Anti-Racism• English as a Second Language (ESL)• Special Needs• Aboriginal Studies• Gender Equity• Information Technology• Media Education• Science-Technology-Society• Environment and Sustainability
See Appendix C: Cross-Curricular Interestsfor more information.
Gender Issues in Mathematics
The education system is committed tohelping both male and female studentssucceed equally well. In British Columbia,significant progress has been made inimproving the participation and success rateof female students in secondary mathcourses. They now take about the samenumber of secondary math courses as males.There continues, however, to be a relativelylow rate of female participation in math-related careers and education. Positiveattitudes toward the practice of mathematics,

9
INTRODUCTION TO MATHEMATICS 10 TO 12
as well as skill in mathematics, are essentialto the workplace and to everyone’s abilityto participate fully in society. Teaching,assessment materials, learning activities,and classroom environments should placevalue on the mathematical experiences andcontributions of both men and women andpeople of diverse cultures.
Research regarding gender andmathematics has raised a number ofimportant issues that teachers shouldconsider when teaching mathematics. Theseinclude the diversity of learning styles,gender bias in learning resources, andunintentional gender bias in teaching. Thefollowing instructional strategies aresuggested to help the teacher deliver agender-sensitive mathematics curriculum.
• Feature both females and males who aremathematicians, or who make extensiveuse of mathematics in their careers, asguest speakers or subjects of study in theclassroom.
• Design instruction to acknowledgedifferences in experiences and interestsbetween young women and young men.
• Demonstrate the relevance ofmathematics to a variety of careers and toeveryday life in ways that are apt toappeal to particular students in the classor school. Successful links includebiology, environmental issues, andcurrent topics in mass media.
• Explore not only the practicalapplications of mathematics, but also thehuman elements, such as ways in whichideas have changed throughout historyand the social and moral implications ofmathematics.
• Explore ways of approaching mathematicsthat will appeal to a wide variety ofstudents. Use co-operative rather thancompetitive instructional strategies. Focuson concept development, encouragingstudents to question until they can say“I’ve got it.” Include a wide variety ofapplications that demonstrate the role ofmath in the social fabric of our world.Varying approaches appeal to a widervariety of students.
• Emphasize that mathematics is used byordinary people with a variety of interestsand responsibilities.
• Allowing for informal social interactionwith successful “math using” members ofthe community will help change thenegative stereotypes of mathematiciansand their social style.
• Provide opportunities for visual andhands-on activities, which most studentsenjoy. Experiments, demonstrations, fieldtrips, and exercises that provideopportunities to explore the relevance ofmathematics are particularly important.
Adapting Instruction for DiverseStudent Needs
When students with special needs areexpected to achieve or surpass the learningoutcomes set out in the mathematicscurriculum, regular grading practices andreporting procedures are followed. However,when students are not expected to achievethe learning outcomes, adaptations andmodifications must be noted in theirIndividual Education Plans (IEPs).Instructional and assessment methodsshould be adapted to meet the needs of allstudents.
10
INTRODUCTION TO MATHEMATICS 10 TO 12
The following strategies may help studentswith special needs succeed in mathematics:
• Adapt the Environment- Change the student’s seat in the
classroom.- Make use of co-operative grouping.
• Adapt Presentations- Provide students with advance
organizers of the key mathematicalconcepts.
- Demonstrate or model new concepts.- Adapt the pace of activities as required.
• Adapt Materials- Use techniques, such as colour coding
the steps to solving a problem, to makethe organization of activities moreexplicit.
- Use manipulatives such as large-sizedice, cards, and dominoes.
- Use large-print charts such as a 100schart or a times-table chart.
- Provide students with a talkingcalculator or a calculator with a largekeypad.
- Use large print on activity sheets.- Use opaque overlays on text pages to
reduce the quantity of print that isvisible.
- Highlight key points on activity sheets.
• Adapt Methods of Assistance- Have peers or volunteers assist students
with special needs.- Have students with special needs help
younger students learn mathematics.- Have teacher assistants work with
individuals and small groups ofstudents with special needs.
- Work with consultants and supportteachers to develop problem-solvingactivities and strategies for
- mathematics instruction for studentswith special needs.
• Adapt Methods of Assessment- Allow students to demonstrate their
understanding of mathematicalconcepts in a variety of ways, such asmurals, displays, models, puzzles, gameboards, mobiles, and tape recordings.
- Modify assessment tools to matchstudent needs. For example, oral tests,open-book tests, and tests with no timelimit may allow students to betterdemonstrate their learning than atraditional timed paper-and-pencil test.
- Set achievable goals.- Use computer programs that provide
opportunities for students to practisemathematics as well as record and tracktheir results.
• Provide Opportunities for Extension andPractice- Require the completion of only a small
amount of work at a given time.- Simplify the way questions are worded
to match the student’s level ofunderstanding.
- Provide functional, everyday contexts(e.g., cooking) in which students canpractise measurement skills.
SUGGESTED ASSESSMENT STRATEGIES
Teachers determine the best assessmentmethods for their students. The assessmentstrategies in this document describe a varietyof ideas and methods for gathering evidenceof student performance. The assessmentstrategies column for a particular organizeralways includes specific examples ofassessment strategies. Some strategies relateto particular activities, while others aregeneral and could apply to any activity.These specific strategies may be introducedby a context statement that explains howstudents at this age can demonstrate theirlearning, what teachers can look for, and
11
INTRODUCTION TO MATHEMATICS 10 TO 12
how this information can be used to adaptfurther instruction.
About Assessment in General
Assessment is the systematic process ofgathering information about students’learning in order to describe what theyknow, are able to do, and are workingtoward. From the evidence and informationcollected in assessments, teachers describeeach student’s learning and performance.They use this information to providestudents with ongoing feedback, plan furtherinstructional and learning activities, setsubsequent learning goals, and determineareas requiring diagnostic teaching andintervention. Teachers base their evaluationof a student’s performance on theinformation collected through assessment.
Teachers determine the purpose, aspects, orattributes of learning on which to focus theassessment; when to collect the evidence;and the assessment methods, tools, ortechniques most appropriate to use.Assessment focuses on the critical orsignificant aspects of the learning to bedemonstrated by the student.
The assessment of student performance isbased on a wide variety of methods andtools, ranging from portfolio assessment topencil-and-paper tests. Appendix D includesa more detailed discussion of assessment andevaluation.

12
INTRODUCTION TO MATHEMATICS 10 TO 12
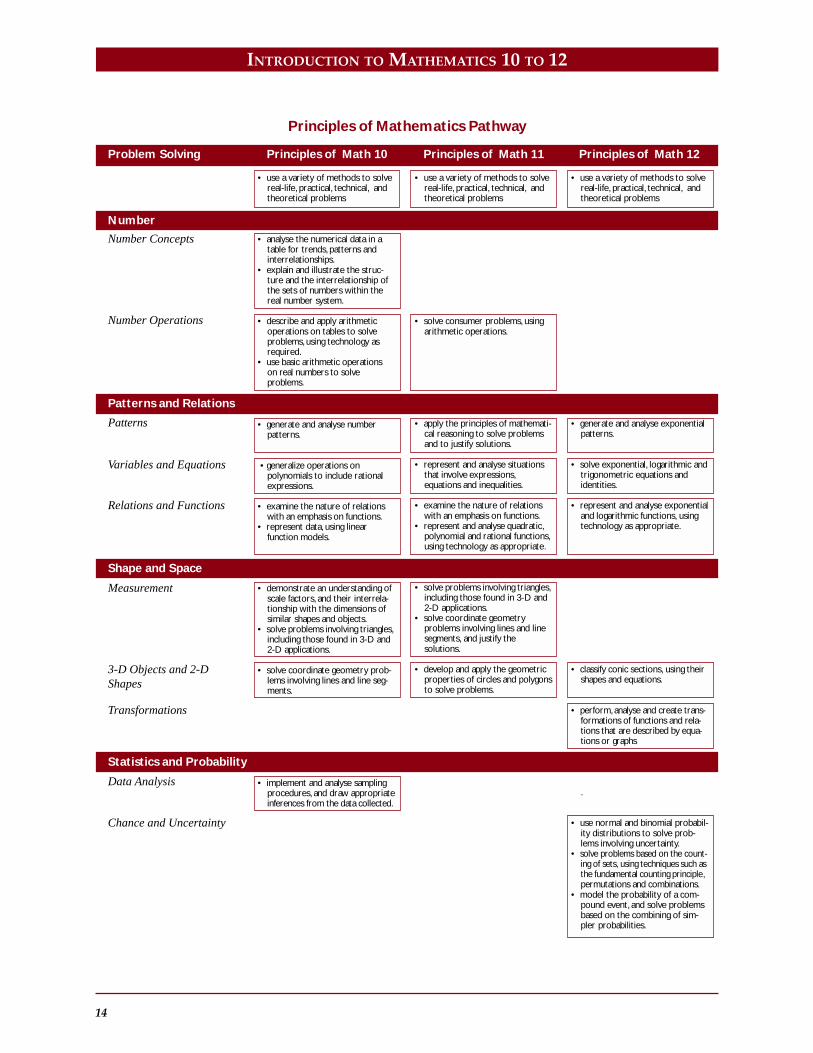
Applications of Mathematics Pathway
Number Concepts
Number Operations
Patterns
Variables and Equations
Relations and Functions
Measurement
3-D Objects and 2-DShapes
Data Analysis
Chance and Uncertainty
Applications of Math 10 Applications of Math 11 Applications of Math 12Problem Solving
Number
Patterns and Relations
Shape and Space
Statistics and Probability
• use a variety of methods to solvereal-life, practical, technical, andtheoretical problems
• analyse the numerical data in atable for trends, patterns andinterrelationships.
• use basic arithmetic operationon real numbers to solveproblems.
• describe and apply arithmeticoperations on tables to solveproblems, using technology asrequired.
• examine the nature of relationswith an emphasis on functions.
• represent data, using functionmodels.
• demonstrate an understanding ofscale factors, and their interrela-tionship with the dimensions ofsimilar shapes and objects.
• solve problems involving triangles,including those found in 3-D and2-D applications.
• solve coordinate geometryproblems involving lines and linesegments.
• implement and analyse samplingprocedures, and draw appropriateinferences from the data collected.
• use a variety of methods to solvereal-life, practical, technical, andtheoretical problems
• solve consumer problems, usingarithmetic operations.
• represent and analyse situationsthat involve expressions, equa-tions and inequalities.
• use linear programming to solveoptimization problems.
• represent and analyse quadratic,polynomial and rational functions,using technology as appropriate.
• demonstrate an understanding ofscale factors, and their interrela-tionship with the dimensions ofsimilar shapes and objects.
• use measuring devices to makeestimates and to performcalculations in solving problems.
• develop and apply the geometricproperties of circles and polygonsto solve problems.
• analyse graphs or charts of givensituations to derive specificinformation.
• use a variety of methods to solvereal-life, practical, technical, andtheoretical problems
• describe and apply operationson matrices to solve problems,using technology as required.
• design or use a spreadsheet tomake and justify financialdecisions.
• generate and analyse cyclic,recursive and fractal patterns.
• analyse objects, shapes and pro-cesses to solve cost and designproblems.
• solve problems involving polygonsand vectors, including both 3-Dand 2-D applications.
• use normal and binomialprobability distributions to solveproblems involving uncertainty.
• solve problems based on the count-ing of sets, using techniques such asthe fundamental counting principle,permutations and combinations.
• model the probability of a com-pound event, and solve problemsbased on the combining ofsimpler probabilities.

13
INTRODUCTION TO MATHEMATICS 10 TO 12
Essentials of Mathematics Pathway
Essentials of Math 10
Problem Solving• use a variety of methods to solve
real-life, practical, technical, andtheoretical problems
Personal Banking• prepare bank forms including
cheques, deposit slips, cheque-book activity record andreconcilation statements
Wages, Salaries and Expenses• solve problems involving wage,
salaries and expenses
Spreadsheets• design and use a spreadsheet to
make and justify decisions
Rate, Ratio and Proportion• apply the concepts of rate, ratio
and proportion to solve problems
Trigonometry• demonstrate an understanding of
ratio and proportion and applythese concepts in solving triangles
Geometry Project• complete a project that includes
a 2-D plan and a 3-D model ofsome physical structure
Probability and Sampling• develop and implement a plan for
the collection, display and analysisof data using technology asrequired
Essentials of Math 12
Problem Solving• use a variety of methods to solve
real-life, practical, technical, andtheoretical problems
Personal Finance• solve consumer problems
involving insurance, mortgagesand loans
Taxation• demonstrate an ability to fill out
an income tax form
Government Finances• demonstrate an awareness of the
income and expenditures offederal, provincial and municipalgovernments
Investments• demonstrate and recognize the
differences concerning differenttypes of financial investments
Variation and Formulas• use algebraic and graphical mod-
els to generate patterns, makeprediction and solve patterns
Design and Measurements• analyse objects, shapes and
processes to solve cost anddesign problems
Life/Career Project• research career choices and
perform a comparative study
Essentials of Math 11
Problem Solving• use a variety of methods to solve
real-life, practical, technical, andtheoretical problems
Income and Debt• demonstrate an awareness of
selected forms of personalincome and debt
Personal Income Tax• prepare a simple income tax form
Owning and Operatinga Vehicle
• analyse the cost of acquiring andoperating a vehicle
Relations and Formulas• represent and interpret relations
in a variety of contexts
Measurement Technology• determine measurements in
Systeme International (SI) andImperial systems using differentmeasuring devices
Applications of Probability• demonstrate an awareness of the
applications of probability to realworld situations
Data Analysis andInterpretation
• analyse data with a focus on thevalidity of its presentation andthe inferences made
Business Plan• prepare a plan and operate a
successful business
14
INTRODUCTION TO MATHEMATICS 10 TO 12
Number Concepts
Number Operations
Patterns
Variables and Equations
Relations and Functions
Measurement
3-D Objects and 2-DShapes
Transformations
Data Analysis
Chance and Uncertainty
Principles of Math 10 Principles of Math 11 Principles of Math 12Problem Solving
Principles of Mathematics Pathway
Patterns and Relations
Shape and Space
• use a variety of methods to solvereal-life, practical, technical, andtheoretical problems
• generate and analyse exponentialpatterns.
• solve exponential, logarithmic andtrigonometric equations andidentities.
• represent and analyse exponentialand logarithmic functions, usingtechnology as appropriate.
• classify conic sections, using theirshapes and equations.
• perform, analyse and create trans-formations of functions and rela-tions that are described by equa-tions or graphs
.
• use normal and binomial probabil-ity distributions to solve prob-lems involving uncertainty.
• solve problems based on the count-ing of sets, using techniques such asthe fundamental counting principle,permutations and combinations.
• model the probability of a com-pound event, and solve problemsbased on the combining of sim-pler probabilities.
Number
• use a variety of methods to solvereal-life, practical, technical, andtheoretical problems
• analyse the numerical data in atable for trends, patterns andinterrelationships.
• explain and illustrate the struc-ture and the interrelationship ofthe sets of numbers within thereal number system.
• describe and apply arithmeticoperations on tables to solveproblems, using technology asrequired.
• use basic arithmetic operationson real numbers to solveproblems.
• generate and analyse numberpatterns.
• generalize operations onpolynomials to include rationalexpressions.
• examine the nature of relationswith an emphasis on functions.
• represent data, using linearfunction models.
• demonstrate an understanding ofscale factors, and their interrela-tionship with the dimensions ofsimilar shapes and objects.
• solve problems involving triangles,including those found in 3-D and2-D applications.
• solve coordinate geometry prob-lems involving lines and line seg-ments.
• implement and analyse samplingprocedures, and draw appropriateinferences from the data collected.
• use a variety of methods to solvereal-life, practical, technical, andtheoretical problems
• solve consumer problems, usingarithmetic operations.
• apply the principles of mathemati-cal reasoning to solve problemsand to justify solutions.
• represent and analyse situationsthat involve expressions,equations and inequalities.
• examine the nature of relationswith an emphasis on functions.
• represent and analyse quadratic,polynomial and rational functions,using technology as appropriate.
• solve problems involving triangles,including those found in 3-D and2-D applications.
• solve coordinate geometryproblems involving lines and linesegments, and justify thesolutions.
• develop and apply the geometricproperties of circles and polygonsto solve problems.
Statistics and Probability

RECOMMENDED LEARNING RESOURCESSUGGESTED ASSESSMENT STRATEGIES
15
CURRICULUMApplications of Mathematics 10

PRESCRIBED LEARNING OUTCOMES SUGGESTED INSTRUCTIONAL STRATEGIES
16

RECOMMENDED LEARNING RESOURCESSUGGESTED ASSESSMENT STRATEGIES
17
ESTIMATED INSTRUCTIONAL TIME
Applications of Mathematics 10 has been developed assuming that teachers have 100 instructionalhours available to them. The following chart shows the estimated instructional time for eachcurriculum suborganizer, expressed as a percentage of total time available to teach the course.
When delivering the prescribed curriculum, teachers may freely adjust the instructional time to meettheir students’ diverse needs. These estimated instructional times have been recommended by the IRPwriters to assist their colleagues; they are suggestions only.
Organizer (Suborganizer) % of Time
Problem Solving Integrated Throughout
Number (Number Concepts) 5 - 15
Number (Number Operations) 15 - 25
Patterns and Relations (Relations and Functions) 20 - 30
Shape and Space (Measurement) 10 - 20
Shape and Space (3-D Objects and 2-D Shapes) 10 - 20
Statistics and Probability (Data Analysis) 10 - 20
APPLICATIONS OF MATHEMATICS 10

PRESCRIBED LEARNING OUTCOMES SUGGESTED INSTRUCTIONAL STRATEGIES
18
APPLICATIONS OF MATHEMATICS 10 • Problem Solving
It is expected that students will use a variety ofmethods to solve real-life, practical, technical,and theoretical problems.
It is expected that students will:
• solve problems that involve a specific contentarea such as, geometry, algebra, trigonometry,statistics, probability, etc.
• solve problems that involve more than onecontent area
• solve problems that involve mathematicswithin other disciplines
• analyse problems and identify the significantelements
• develop specific skills in selecting and usingan appropriate problem-solving strategy orcombination of strategies chosen from, but notrestricted to, the following:- guess and check- look for a pattern- make a systematic list- make and use a drawing or model- eliminate possibilities- work backward- simplify the original problem- develop alternative original approaches- analyse keywords
• demonstrate the ability to work individuallyand co-operatively to solve problems
• determine that their solutions are correct andreasonable
• clearly communicate a solution to a problemand the process used to solve it
• use appropriate technology to assist inproblem solving
Problem solving is a key aspect of any mathematicscourse. Working on problems involving a range ofmathematical disciplines can give students a sense ofthe excitement involved in creative and logicalthinking. It can also help students developtransferable real-life skills and attitudes. Multi-strandand interdisciplinary problems should be includedthroughout Applications of Mathematics 10.
• In a class discussion, define problem solving withstudents, pointing out that in mathematicsproblem solving involves many disciplines,including algebra, geometry, trigonometry,statistics, and probability.
• Introduce new types of problems directly tostudents (i.e., without demonstration), andfacilitate as they attempt to solve them.
• Have students work in small co-operative groupsof three to five when introducing new types ofproblems.
• Model and reinforce student use of a variety ofapproaches to problem solving (e.g., algebraic andgeometric).
• Emphasize that many problems may not be solvedin one try and that it is sometimes necessary torevisit the problem, start over, and try again.
• Have students or groups discuss their thoughtprocesses as they attempt to solve a problem.Point out the strategies inherent in their thinking(e.g., guessing and checking, looking for a pattern,making and using a drawing or model).
• Ask leading questions such as:- What are you being asked to find out?- What do you already know?- Do you need additional information?- Have you ever seen similar problems?- What else can you try?
• When students arrive at solutions to particularproblems, encourage them to generalize from orextend the problem situations.
Note: See Appendix G for examples of multi-strandand interdisciplinary problems that most studentsshould be able to solve. These problems are indicatedwith an asterisk (*)

RECOMMENDED LEARNING RESOURCESSUGGESTED ASSESSMENT STRATEGIES
19
APPLICATIONS OF MATHEMATICS 10 • Problem Solving
Students analyse problems and solve them using avariety of approaches. Assessment of problem-solving skills is made over time, based onobservations of many situations.
Observe• Have students present solutions to the class
individually, in pairs, or in small groups. Note theextent to which they clarify their problems andhow succinctly they describe the processes used.
Question• To check the approaches students use when solving
problems, ask questions that prompt them to:- paraphrase or describe the problem in their
own words- explain the processes used to derive an answer- describe alternative methods to solve a problem- relate the strategies used in new situations- link mathematics to other subjects and to the
world of work
Collect• On selected problems, have students annotate
their work to describe the processes they used.Alternatively, have them provide briefdescriptions of what worked and what did not forparticular problems.
• Have students use mind maps and flowcharts todescribe and display problem solutions.
Self-Assessment• Ask students to keep journals to describe the
processes they used in dealing with problems.Have them include descriptions of strategies thatworked and those that did not.
• Develop with students a set of criteria to self-assess problem-solving skills. The reference set,Evaluating Problem Solving Across Curriculum, maybe helpful in identifying such criteria
.
Please see the introduction to Appendix B for alist of suggested utility software that supportsthis course.
The Western Canadian Protocol LearningResource Evaluation Process has also identifiednumerous teacher resources and professionalreferences. These are generally cross-gradeplanning resources that include ideas for avariety of activities and exercises.
These resources, while not part of the GradeCollections, have Provincially Recommendedstatus.
Appendix B includes an annotated bibliographyof these resources for ordering convenience.

PRESCRIBED LEARNING OUTCOMES SUGGESTED INSTRUCTIONAL STRATEGIES
20
APPLICATIONS OF MATHEMATICS 10 • Number (Number Concepts)
It is expected that students will analyse thenumerical data in a table for trends, patterns andinterrelationships.
It is expected that students will:
• use words and algebraic expressions todescribe the data and the interrelationships ina table with rows that are not relatedrecursively (not calculated from previousdata)
• use words and algebraic expressions todescribe the data and the interrelationships ina table with rows that are related recursively(calculated from previous data)
Using tables enhances students’ ability to see data ina compact and easily readable format. Students canextract specific information from tables, and use themto do general comparisons and find relationships.
• Distribute single newspapers to groups of three orfour students and have them browse through thepaper to find the sections that contain the mosttables. Ask the groups to give two reasons whythose particular sections use tables extensively.
• Have each student find three specific pieces ofinformation in a table from a newspaper,magazine, or the Internet and share with a partner.Have pairs share their findings with the rest of theclass.
• Place a multi-column, non-recursive table (e.g.,hockey standings, stock market data) on anoverhead. In a class discussion, encouragestudents to compare and contrast the data in thetable. As a class, produce a word list ofconnections between the rows and columns ofdata.
• Provide students with a recursive table (e.g.,mortgage, credit card account, savings account).Point out that the closing balance for any month isthe opening balance of the next month. Askstudents to analyse the repetitive nature of thecalculations. Have them calculate the balance afterthree payments, given an opening balance, amonthly rate of interest, and the payment amount.

RECOMMENDED LEARNING RESOURCESSUGGESTED ASSESSMENT STRATEGIES
21
APPLICATIONS OF MATHEMATICS 10 • Number (Number Concepts)
Tables are commonly used to represent real life data.Assess students’ ability to use tables in a practicalway.
Observe• While students are drawing meaning from tabular
representations of data, note their ability to:- use words to describe data- identify specific facts from tables- determine trends where they exist- develop recursive tables in the form of
spreadsheets
Collect• Give students multi-column tables such as sports
standings, and note the extent to which studentsare able to glean information. Have students write anewspaper article based on the information and notethe extent to which they are able to interpret data.
Question• Ask students to suppose that they are responsible
for adding 10 new items to the inventory of aclothing store. Have them create a spreadsheetthat shows price, GST, PST, and cost. Ask them toexplain how the value for each cell in theirspreadsheet is calculated.
Print Materials
• Applied Mathematics 10, Western CanadianEditionCh. 2 (Sections 2.1 - 2.5)

PRESCRIBED LEARNING OUTCOMES SUGGESTED INSTRUCTIONAL STRATEGIES
22
APPLICATIONS OF MATHEMATICS 10 • Number (Number Operations)
It is expected that students will:
• use basic arithmetic operations on realnumbers to solve problems.
• describe and apply arithmetic operations ontables to solve problems, using technology asrequired.
It is expected that students will:
• communicate a set of instructions used tosolve an arithmetic problem
• perform arithmetic operations on irrationalnumbers, using appropriate decimalapproximations.
• create and modify tables from both recursiveand nonrecursive situations
• use and modify a spreadsheet template tomodel recursive situations
• solve problems involving combinations oftables, using:- addition or subtraction of two tables- multiplication of a table by a real number- spreadsheet functions and templates
.
Many calculations in science, industry, and financeinvolve irrational numbers. Students need to be ableto perform simple calculations with irrationalnumbers and to properly interpret the results.Although many questions can be solved adequatelyusing approximate values, students should be able towork with exact representations of irrationalnumbers where possible.
Tables enable organized data to be recognized andfacilitate calculations.
• Provide students with a descriptive paragraph orset of written instructions for guessing a secretnumber, and have them work out the series ofmathematical steps required. Ask them to confirmtheir process with a partner to test its accuracy.
• Provide students with a descriptive paragraphcontaining numeric data (e.g., mutual funds over a10-year period) and ask them to organize the datainto a table.
• Give students a collection of sale papers and havethem comparison shop for specific items. Havethem place the results of the comparison in a tableand underline the best price.
• Provide students with a basic spreadsheet template forcalculating the cost of building a house. Have themchange the dimensions of the house and number ofbathrooms and bedrooms to see how the construction,electrical, plumbing, and total costs change.
• Have students work in pairs to design a templateto show balance owing on a sample credit cardaccount at the end of one month after a paymenthas been made.
RECOMMENDED LEARNING RESOURCESSUGGESTED ASSESSMENT STRATEGIES
23
APPLICATIONS OF MATHEMATICS 10 • Number (Number Operations)
Number operations are the tools students use tosolve problems. Students need to demonstrate a clearunderstanding of the processes involved inperforming various operations involving irrationalnumbers and how the operations are used.
Observe• Ask students to draw several regular polygons
and have them count the number of sides,diagonals, and intersection points and prepare atable showing this data. Observe students’ abilitiesto use the tables to describe how the values of eachpolygon can be predicted without counting.
Self-/Peer Assessment• Have students create a three- or four-step
expression that requires order of operation steps tosolve, then use it to develop a written flow chartthat describes the solution process.
• Given a spreadsheet template of a recursivesituation, have students modify it. Have studentsdescribe their ability to modify spreadsheets andunderstand the implications of the changes.
Collect• Ask students to create a spreadsheet that would
show bills for a credit card account that wouldoccur in a situation in which no payments aremade. Assume the amount borrowed was $1000and the annual interest rate is 18% compoundedmonthly. Have them extend the table to show 12months of account balances. Ask students to writea letter from the bank explaining the table to thecredit card holder.
• Give students a table that is missing values andhave them use the values presently there tocomplete the table.
Presentation• Have students collect data from a school sports
team (e.g., free-throw percentage, penalties orfouls vs. minutes played) and create a table thatshows an analysis of calculated values. Havestudents present their results to the class.
Print Materials
• Applied Mathematics 10, Western CanadianEditionCh. 1 (Section 1.7)Ch. 2 (Sections 2.1, 2.3 - 2.5)Projects: Sports Statistics, Health CarePlanning, Snow Board Design, Hockey Pool,The Sawmill, Cross Canada Tours

PRESCRIBED LEARNING OUTCOMES SUGGESTED INSTRUCTIONAL STRATEGIES
24
APPLICATIONS OF MATHEMATICS 10 • Patterns and Relations (Relations and Functions)
It is expected that students will :
• examine the nature of relations with anemphasis on functions.
• represent data, using functionmodels.
It is expected that students will:
• plot linear and nonlinear data, usingappropriate scales
• represent data, using function models• use a graphing tool to draw the graph of a
function from its equation• describe a function in terms of:
- ordered pairs- a rule, in word or equation form- a graph
• use function notation to evaluate andrepresent functions
• determine the domain and range of a relationfrom its graph
• determine the following characteristics of thegraph of a linear function, given its equation:- intercepts- slope- domain- range
• use partial variation and arithmetic sequencesas applications of linear functions
Understanding and describing functionalrelationships is essential to interpreting andpredicting the behavior of the world around us.Students will explore how to translate betweenalgebraic and graphical representations and use theseskills to make inferences and solve problems.
• Ask students to explore non-linear functions withgraphing technology (calculators or software) anddiscuss the similarities and differences in thegraphs and equations.
• Have students use graphing calculators orcomputers to graph y x= and investigate thegraphic changes as a number is added (e.g.,y x 3= + ) and when x is multiplied by a constant(e.g., y x= −2 ) to develop the concept y mx b= + .Have them record their findings in their journals.
• Ask students to work in groups to determinetechniques that will generate linear equations,given information other than slope and intercept.
• To explore the relationship of linear equations incomputer programming, have students work inco-operative groups to generate short programsthat produce linear drawings, then share thesewith the class.
• Organize a carousel activity in which studentsmove in groups around various stations set upwith activities to generate data. Students decide asa group how best to graph or display the data.Discuss as a class the similarities and differencesin the solutions.
• Use a bakery model (ingredients in → pastry out)or a sawmill/pulp model (logs in → lumberpulp/paper out) to illustrate the concept ofdomain and range.
• Have students use a function machine to calculatethe range of a function from its domain.
• Have students generate two data points in a linearfunction (e.g., kilometres driven and car rentalcost) and graph them. Ask them to generate modelfunctions to answer questions about the intercepts(fixed costs) and slope (variable costs).
• Ask students to use maps and scale diagrams tocalculate distances and sizes.
RECOMMENDED LEARNING RESOURCESSUGGESTED ASSESSMENT STRATEGIES
25
APPLICATIONS OF MATHEMATICS 10 • Patterns and Relations (Relations and Functions)
Plotting data, and the subsequent analysis of relationsand functions, are key to students’ understanding ofpatterns. Assessment in this area should focus onstudents’ ability to perform individual outcomes (suchas graphing and analyzing functions derived from thephysical world), and reflect students’ understanding ofthe uses of graphs.
Collect• Have students collect data on relations between
pizza costs and diameters. This data could berepresented as a list of ordered pairs, expressed asa rule, described in equation form, as a handsketched graph, and finally drawn using agraphing calculator. Check particularly forstudents’ ability to select scale, find slope inappropriate units, and select window parameters.
Question• As students work on using function notation,
evaluating functions and determining domain,range, intercepts and slope, check for their abilityto work competently using both sketches andgraphing tools. Note students’ abilities to translatetheir graphing skills to understand the real-worldimplications of the data.
Presentation • Give students ordered pairs such as (0,32),
(100,212), and (-40,-40) that show convertedtemperatures in both Fahrenheit and Celsiusscales. Ask students to graph the data to see if it islinear, then determine the slope and y-intercept.Have students then reverse the axes and re-graphthe data. Circulate through the classroom toensure that students’ graphs are correct. Askstudents to determine where the two temperaturescales meet. Have them generate a conversionformula for Fahrenheit and Celsius.
Peer Assessment• Ask students to work in pairs using graphing
calculators. Students can display graphs on theircalculators, then challenge their partners toreproduce the graphs on their own calculators.
• Have one student generate an equation in slope-intercept form and a partner change it to generalform and vice versa. Students can check eachother’s work for accuracy.
Print Materials
• Applied Mathematics 10, Western CanadianEditionCh. 3 (Sections 3.1 - 3.6)Ch. 6 (Sections 6.1 - 6.6)Projects: Safety Technology, Scuba DivingTours, Hair Products, Anthropology, SpaceTechnology
• Exploring Functions with the TI-82 GraphicsCalculator
• Graphing Calculator Activities for EnrichingMiddle School Mathematics
• An Introduction to the TI-82 GraphingCalculator
• Modeling Motion: High School MathActivities with the CBR
• Using the TI-81 Graphics Calculator toExplore Functions
• A Visual Approach to Algebra• What If ...?: The Straight Line: Investigations
with the TI-81 Graphics Calculator• What If ...?: The Straight Line: Investigations
with the TI-82 Graphics Calculator
Software
• GrafEq (Macintosh & Windows Version 2.09)• Green Globs & Graphing Equations
Games/Manipulatives
• Radical Math: Math Games Using Cards andDice (Volume VII)
PRESCRIBED LEARNING OUTCOMES SUGGESTED INSTRUCTIONAL STRATEGIES
26
APPLICATIONS OF MATHEMATICS 10 • Shape and Space (Measurement)
It is expected that students will:
• demonstrate an understanding of scale factors,and their interrelationship with thedimensions of similar shapes and objects
• solve problems involving triangles, includingthose found in 3-D and 2-D applications
It is expected that students will:
• calculate the volume and surface area of asphere, using formulas that are provided
• determine the relationships among linear scalefactors, areas, the surface areas and thevolumes of similar figures and objects
• solve problems involving two right triangles• extend the concepts of sine and cosine for
angles through to 180˚• apply the sine and cosine laws, excluding the
ambiguous case, to solve problems• select and apply appropriate instruments,
units of measure (in SI and Imperial systems)and measurement strategies to find lengths,areas and volumes
• analyse the limitations of measuringinstruments and measurement strategies,using the concepts of precision and accuracy
• solve problems involving length, area,volume, time, mass and rates derived fromthese
• interpret drawings, and use the information tosolve problems
Many worthwhile and practical problems in mathematicsinvolve calculations of shape and space and are most easilysolved by making and labeling a drawing. Some drawingswork best when reduced to scale, while in other cases anannotated sketch is sufficient. Visualizing shape and space isa critical component of learning mathematics.
• Bring a collection of spherical balls related to varioussports into the classroom. Have students find thecircumference of each ball using a fabric tape, and, fromthe circumference, calculate radius-diameter-area of thegreatest circle. Ask them to place the results in a table andfind the relationship between each column and classify itas linear or non-linear.
• Discuss why smaller animals require faster metabolisms tomaintain a constant body temperature, and why theyrequire more food as volume decreases faster than surfacearea decreases.
• Have students use equipment such as a parallax viewer (forrange) and clinometer (for height) to analyse the motion of afootball thrown on a field, resolving the motion intohorizontal and vertical components. Point out that thehorizontal motion vs. time is linear while the vertical motionvs. time is described using a quadratic function (i.e., non-linear).
• Provide students with pictures of non-right triangles thatshow either two sides and one angle or two angles andone side. Have students calculate the missing side orangle. A practical example might involve using anorienteering map.
• Give instructions to students (in terms of angles andsides) to move to a certain point in two steps (two sides ofa triangle), using Law of Cosines or Law of Sine tocalculate how to return to the starting point.
• Divide the class into small groups and supply each groupwith a measuring instrument (e.g., ruler, meter stick,measuring tape, 10 cm piece of string, 5 cm x 5 cm square ofpaper). Give students a list of objects of various sizes andshapes in the classroom and have them measure specificaspects of each one. In a class discussion, ask students todetermine which measuring instruments were best formeasuring which object, which measurements were mostprecise, and which measurements were most accurate.
• Develop a five-station carousel where each station has onetype of measurement problem (e.g., length, area, volume,mass, time). Include time dependent questions involvingrate. Design a treasure hunt or rally to send students fromstation to station to solve problems.

RECOMMENDED LEARNING RESOURCESSUGGESTED ASSESSMENT STRATEGIES
27
APPLICATIONS OF MATHEMATICS 10 • Shape and Space (Measurement)
Being able to measure using instruments andunderstanding measurement limitation isfundamental to applying mathematics. Assessingstudents’ abilities to solve formula type, or drawinginterpretation type problems should be done in avariety of ways, reflecting real world methodologies.
Observe• As students approach measurement problems
check on their ability to use instruments andobtain results that are both precise and accurate.Particularly where group work is involved, checkfor individual students’ abilities to measure andreport.
• Note students ability to translate written problemsinto sketches, including those whose angles rangefrom 0° to 180°. Observe students’ ability to usecalculators and manipulate angle representationsto solve problems.
Collect• Check students’ solutions to problems for clarity
and presentation. Students should be able toexplain the strategy they used to solve selectedproblems.
• Check that students develop criteria that can beused to review their plans for a parking design.Criteria might include:- Will a large car fit in the designed spaces?- Can cars easily get in and out of the spaces?- Are the identified dimensions reasonable?- Is there a sufficient number of spaces?
Self-/Peer Assessment• Ask students to comment or reflect on their ability
to visualize relative size and predict the scaling of3-D objects. For example, ask them if they feel ableto predict surface areas given dimensions ofobjects such as spheres.
• Have students create two or three problemsinvolving sine and cosine laws, includingsolutions. Have them exchange problems with apartner. Partners complete, and then comment on,the construction of the problem and its solution.
• Encourage students to check each other’smeasurements and compare results. Team andgroup analysis of others performance is anexcellent way of providing alternate assessments.
Print Materials
• Applied Mathematics 10, Western CanadianEditionCh. 1 (Sections 1.1 - 1.8)Ch. 7 (Sections 7.1 - 7.7)Projects: Jewelry Design, Candy Boxes, JetPropulsion, Reach for the Top, RemoteSensing
Software
• The Geometer’s Sketchpad
CD-ROM
• Geometry Blaster

PRESCRIBED LEARNING OUTCOMES SUGGESTED INSTRUCTIONAL STRATEGIES
28
APPLICATIONS OF MATHEMATICS 10 • Shape and Space (3-D Objects and 2-D Shapes)
It is expected that students will solve coordinategeometry problems involving lines and linesegments.
It is expected that students will:
• solve problems involving distances betweenpoints in the coordinate plane
• solve problems involving midpoints of linesegments
• solve problems involving rise, run and slopeof line segments
• determine the equation of a line, giveninformation that uniquely determines the line
• solve problems using slopes of:- parallel lines- perpendicular lines
Describing linear relationships is essential tointerpreting and predicting the behaviour of theworld around us.
• Using a geoboard, have students stretch an elasticbetween two posts to form a line segment, thenstretch one side of the elastic around theappropriate post to form a right triangle. Havethem measure the orthogonal sides by countingthe posts and use the Pythagorean Theorem tofind the length of the original line segment(hypotenuse of triangle).
• Have students use a clinometer to measure theangle to the top of a building and connect thetangent of the angle to the slope of the line to thetop of the building.
• Develop a five-station carousel where each stationhas a different type of word problem (e.g.,distance, midpoint, slope, equations of lines,parallel and perpendicular lines). Design atreasure hunt or rally to send students from stationto station to solve problems. Use a point system toaward prizes for the most accurate solutions.
• Given an equation for a line, have students list fiveunique pieces or types of information that theycould use to find that equation. For example,given 2 3 6x y− = students could list the following:- different points on the line (6,2),(9,4),...- slope of line is m=2/3- y-intercept is b = -2 or the point (0,-2)- x-intercept = 3 or the point (3,0)- standard form of equation, 2 3 6x y− =
- slope intercept form is: y x= −23
2
• Have students use a graphing calculator orgraphing software to explore the similar attributesof parallel or perpendicular lines. Give studentssix lines to graph and have them note which linesare parallel or perpendicular, analysing thesimilarities in their equations.
• Have students use technology with dynamicgeometry software to draw two lines, then rotateone line. Have them note how its slope changes asit first becomes parallel, then perpendicular to theother line.

RECOMMENDED LEARNING RESOURCESSUGGESTED ASSESSMENT STRATEGIES
29
APPLICATIONS OF MATHEMATICS 10 • Shape and Space (3-D Objects and 2-D Shapes)
Solving problems in the coordinate plane is a naturalextension of graphing, geometry, and algebraic skills.Assessment should focus students’ conceptualizationof the coordinate plane and its uses in understandingthe world around them.
Observe• Take note of students’ approaches to word
problems that require line and segment solutions.Students should be able to explain the steps theytook to translate word problems into a drawing onthe coordinate system. Observe students’ abilitiesto draw and label clearly.
Question• For select problems, question students as to the
method they used. For example, ask if the studentcan check a pen-and-paper solution using agraphing tool or vice versa.
Presentation• Ask students to select a graphic representation of a
solution to a problem they have created. Havethem present the problem to members of a smallgroup and then teach the problem solution. Usestudent created problems on teacher tests whereappropriate.
• Ask students to create a poster that shows therelationship between a linear equation and itscomponents.
Collect• Place information about various linear equations
on file cards on a table. Give students one file cardand have them list or collect cards with datarelated to the equation on their card.
Peer Assessment• Ask students to work in pairs using graphing
calculators. Students can display graphs on theircalculators, then challenge their partners toreproduce the graphs on their own calculators.
• Have one student generate an equation in slope-intercept form and a partner change it to generalform and vice versa. Students can check eachother’s work for accuracy.
Print Materials
• Applied Mathematics 10, Western CanadianEditionCh. 5 (Sections 5.1 - 5.5)Ch. 6 (Section 6.5)Project: Skiing in San Diego
Software
• The Geometer’s Sketchpad• Green Globs & Graphing Equations
Games/Manipulatives
• Radical Math: Math Games Using Cards andDice (Volume VII)
CD-ROM
• Geometry Blaster

PRESCRIBED LEARNING OUTCOMES SUGGESTED INSTRUCTIONAL STRATEGIES
30
APPLICATIONS OF MATHEMATICS 10 • Statistics and Probability (Data Analysis)
It is expected that students will implement andanalyse sampling procedures, and drawappropriate inferences from the data collected.
It is expected that students will:
• choose, justify and apply sampling techniquesthat will result in an appropriate, unbiasedsample from a given population
• defend or oppose inferences andgeneralizations about populations, based ondata from samples
• determine the equation of a line of best fit,using:- estimate of slope and one point- least squares method with technology
• use technological devices to determine thecorrelation coefficient r
• interpret the correlation coefficient r and itslimitations for varying problem situations,using relevant scatterplots
Most data collection involves the use of samplesrather than populations. Understanding the uses,advantages, and disadvantages of sampling is criticalto interpreting statistical information.
• Ask students to identify ways of using samplingto deliberately skew survey results (e.g., survey ofprobable Stanley Cup winners by polling only fansof one team, survey of favourite musical groupsby polling people from only one age group). Havestudents identify examples of biased or invalidsamples on data reported in the media. Ask themto work in groups to analyse the data anddetermine what the sample population might havebeen. Discuss as a class.
• Have students suggest real-world applications forusing distributions (e.g., knowing the sizedistribution, how many of each shoe size a shoestore should stock).
• Give students a series of case studies involvingsurvey information and have them critique thestudies and support or reject conclusions in thecase studies. Alternatively, limit the case study tothe survey setup and data and then have studentsdevelop their own conclusions.
• Have students plot anonymous class scores from amath test to develop a median-median best fit line,then find its equation. Have them use a graphingcalculator or graphing software to find the leastsquares best fit line then calculate its equation. Askstudents to compare and contrast the two andcomment on which one is the best representation.Ask them to analyse the point-slope method foraccuracy and ease of use.
• Produce six scatterplots with correlationcoefficients approximately equal to -1, -0.5, 0, 0.25,0.75, and 1. Have students calculate thecorrelations for each graph (perhaps as a smallgroup exercise) using graphing calculators andhave them define the difference between strong,weak, and zero coefficients as well as positive andnegative coefficients.
• Present students with a series of business- orschool-based case studies involving either rawdata, scatterplots or pre-calculated correlationcoefficients. Have students use the data to makedecisions within the context of the case study.
RECOMMENDED LEARNING RESOURCESSUGGESTED ASSESSMENT STRATEGIES
31
APPLICATIONS OF MATHEMATICS 10 • Statistics and Probability (Data Analysis)
While many students are able to collect experimental data,their ability to make meaning of it mathematically willhelp their understanding of science, social sciences, andtechnology.
Collect• Have students design and conduct research projects
requiring them to choose and apply samplingtechniques. As students work on their projects, askquestions such as:- How did you choose your sampling technique?- Can you justify your choice?- Can you identify possible sources of bias or error in
your sample?- When might someone want to bias a sample and how
might they do it?- What makes the graphical representations you are
using appropriate for your data?- How are your conclusions affected by your sample?
• Work with students to develop criteria they can use toassess their projects. Students use the criteria to assesstheir own work, then describe how their projects couldbe changed to correct identified problems. Criteriamight include:- a clear description of sampling procedures- justification for the sampling technique- accurate identification of possible reasons for bias or
error- effective graphical representations of data summaries- appropriate references, clearly linked to the data,
about the population from which the sample wastaken
Question• Where student collected data contains obvious
anomalies (or outliers) ask students if these should beincluded or excluded and have them explain why.
Self-/Peer Assessment• Provide students with materials necessary to develop
study cards describing terms and concepts related todata analysis. Have students quiz one another using thecards. Small groups of students can use the cards tocompose tests for other groups to take. Give studentsbasic test requirements such as length and type of items.
Print Materials
• Applied Mathematics 10, Western CanadianEditionCh. 4 (Sections 4.1 - 4.5)Ch. 6 (Sections 6.6 - 6.9)Projects: Student Choice Awards, EcosystemStudy, The News, Hair Products,Anthropology
• Exploring Statistics with the TI-82 GraphicsCalculator
• Graphing Calculator Activities for EnrichingMiddle School Mathematics
• An Introduction to the TI-82 GraphingCalculator
• Modeling Motion: High School MathActivities with the CBR
• Using the TI-81 Graphics Calculator to ExploreStatistics
• What If ...?: The Straight Line: Investigationswith the TI-82 Graphics Calculator


RECOMMENDED LEARNING RESOURCESSUGGESTED ASSESSMENT STRATEGIES
33
CURRICULUMApplications of Mathematics 11

PRESCRIBED LEARNING OUTCOMES SUGGESTED INSTRUCTIONAL STRATEGIES
34

RECOMMENDED LEARNING RESOURCESSUGGESTED ASSESSMENT STRATEGIES
35
ESTIMATED INSTRUCTIONAL TIME
Applications of Mathematics 11 has been developed assuming that teachers have 100 instructionalhours available to them. The following chart shows the estimated instructional time for eachcurriculum suborganizer, expressed as a percentage of total time available to teach the course.
When delivering the prescribed curriculum, teachers may freely adjust the instructional time to meettheir students’ diverse needs. These estimated instructional times have been recommended by the IRPwriters to assist their colleagues; they are suggestions only.
Organizer (Suborganizer) % of Time
Problem Solving Integrated Throughout
Number (Number Operations) 15 - 25
Patterns and Relations (Variables and Equations) 15 - 20
Patterns and Relations (Relations and Functions) 15 - 20
Shape and Space (Measurement) 10 - 20
Shape and Space (3-D Objects and 2-D Shapes) 10 - 20
Statistics and Probability (Chance and Uncertainty) 10 - 20
APPLICATIONS OF MATHEMATICS 11

PRESCRIBED LEARNING OUTCOMES SUGGESTED INSTRUCTIONAL STRATEGIES
36
APPLICATIONS OF MATHEMATICS 11 • Problem Solving
It is expected that students will use a variety ofmethods to solve real-life, practical, technical,and theoretical problems
It is expected that students will:
• solve problems that involve a specific contentarea such as geometry, algebra, trigonometry,statistics, or probability
• solve problems that involve more than onecontent area
• solve problems that involve mathematicswithin other disciplines
• analyse problems and identify the significantelements
• develop specific skills in selecting and usingan appropriate problem-solving strategy orcombination of strategies chosen from, but notrestricted to, the following:- guess and check- look for a pattern- make a systematic list- make and use a drawing or model- eliminate possibilities- work backward- simplify the original problem- develop alternative original approaches- analyse keywords
• demonstrate the ability to work individuallyand co-operatively to solve problems
• determine that their solutions are correct andreasonable
• clearly communicate a solution to a problemand the process used to solve it
• use appropriate technology to assist inproblem solving
Problem solving is a key aspect of any mathematicscourse. Working on problems involving a range ofmathematical disciplines can give students a sense ofthe excitement involved in creative and logicalthinking. It can also help students developtransferable real-life skills and attitudes. Multi-strandand interdisciplinary problems should be includedthroughout Applications of Mathematics 11.
• In a class discussion, define problem solving withstudents, pointing out that in mathematicsproblem solving involves many disciplines,including algebra, geometry, trigonometry,statistics, and probability.
• Introduce new types of problems directly tostudents (i.e., without demonstration), andfacilitate as they attempt to solve them.
• Have students work in small co-operative groupsof three to five when introducing new types ofproblems.
• Model and reinforce student use of a variety ofapproaches to problem solving (e.g., algebraic andgeometric).
• Emphasize that many problems may not be solvedin one try and that it is sometimes necessary torevisit the problem, start over, and try again.
• Have students or groups discuss their thoughtprocesses as they attempt to solve a problem.Point out the strategies inherent in their thinking(e.g., guessing and checking, looking for a pattern,making and using a drawing or model).
• Ask leading questions such as:- What are you being asked to find out?- What do you already know?- Do you need additional information?- Have you ever seen similar problems?- What else can you try?
• When students arrive at solutions to particularproblems, encourage them to generalize from orextend the problem situations.
Note: See Appendix G for examples of multi-strandand interdisciplinary problems that most studentsshould be able to solve. These problems are indicatedwith an asterisk (*)
RECOMMENDED LEARNING RESOURCESSUGGESTED ASSESSMENT STRATEGIES
37
APPLICATIONS OF MATHEMATICS 11 • Problem Solving
Students analyse problems and solve them using avariety of approaches. Assessment of problem-solving skills is made over time, based onobservations of many situations.
Observe• Have students present solutions to the class
individually, in pairs, or in small groups. Note theextent to which they clarify their problems andhow succinctly they describe the processes used.
Question• To check the approaches students use when
solving problems, ask questions that prompt themto:- paraphrase or describe the problem in their
own words- explain the processes used to derive an answer- describe alternative methods to solve a problem- relate the strategies used to new situations- link mathematics to other subjects and to the
world of work.
Collect• For selected problems, have students annotate
their work to describe the processes they used.Alternatively, have them provide briefdescriptions of what worked and what did notwork for particular problems.
Self-Assessment• Ask students to keep journals to describe the
processes they used in dealing with problems.Have them include descriptions of strategies thatworked and those that did not.
• Develop with students a set of criteria to self-assess problem-solving skills. The reference set,Evaluating Problem Solving Across Curriculum, maybe helpful in identifying such criteria.
Please see the introduction to Appendix B for alist of suggested utility software that supportsthis course.
The Western Canadian Protocol LearningResource Evaluation Process has also identifiednumerous teacher resources and professionalreferences. These are generally cross-gradeplanning resources that include ideas for avariety of activities and exercises.
These resources, while not part of the GradeCollections, have Provincially Recommendedstatus.
Appendix B includes an annotated bibliographyof these resources for ordering convenience.

PRESCRIBED LEARNING OUTCOMES SUGGESTED INSTRUCTIONAL STRATEGIES
38
APPLICATIONS OF MATHEMATICS 11 • Number (Number Operations)
It is expected that students will solve consumerproblems, using arithmetic operations.
It is expected that students will:
• solve consumer problems, including:- wages earned in various situations- property taxation- exchange rates- unit prices
• reconcile financial statements including:- cheque books with bank statements- cash register tallies with daily receipts
• solve budget problems, using graphs andtables to communicate solutions
• solve investment and credit problemsinvolving simple and compound interest
A working knowledge of the skills involved inmoney management is of advantage to all studentsthroughout their lives. An understanding ofprocedures and applications of mathematics can helpstudents make rational economic decisions.
• Explain various deductions from earnings, thenhave students determine the effects of thesedeductions on pay. Students who have jobs coulduse their pay slips as examples.
• Have students use tables, calculators, andcomputer spreadsheets to compare the effects ofvarious rates of compounding interest on personalinvestments and loans.
• Invite a guest speaker (e.g., accountant, banker,financial planner) to talk about credit andborrowing. Have students prepare questions thatfocus on the underlying mathematics involved.
• Ask students to use information collected fromadvertising (e.g., print, television, on-line) tocompare the cost of paying cash for an item to thecost of buying on a variety of credit plans.
• Have students use spreadsheet software to:- record and track expenditures- build mortgage and other repayment schedules
• Have each student use spreadsheet software toprepare a budget, given:- an income (e.g., salary, wages, commissions,
investments, pension)- fixed expenses (e.g., utilities, rent, insurance,
deductions, savings, investment)- variable expenses (e.g., clothes, entertainment)
• Ask students questions that require interpretationof a budget (e.g., How long would it take to saveenough money to make a major purchase?).

RECOMMENDED LEARNING RESOURCESSUGGESTED ASSESSMENT STRATEGIES
39
APPLICATIONS OF MATHEMATICS 11 • Number (Number Operations)
Consumer problems play an important role in thedaily lives of students. To assess students’ thinkingand the strategies they are using, note their abilitiesto estimate, predict, calculate (using appropriateformulae and technology), make financial decisions,and verify the reasonableness of their conclusions. Asthey check their solutions and justify theirmathematical thinking, look for evidence ofdeveloping abilities to communicate mathematically.
Observe• Observe how well students perform basic
calculations manually and how effectively theyuse available technology to solve problemsinvolving simple and compound interest. Usethese observations to determine what practiceswould benefit the student.
• While students solve consumer problems, note theextent to which they:- estimate and verify their results using
appropriate technology- apply a variety of strategies- generalize from their solutions- observe soundness of reasoning for financial
decisions
Question• Have each student interview someone who works
in a financial field, write a report summarizing theresearch, and develop an educational plan for theoccupation. Review each report, looking forevidence that the student is able to:- identify all facets of the job- give information about the use of technology in
the industry- identify personal attributes and required skills
for workers in the field- generate a list of educational requirements
Collect• Have students use spreadsheets to develop
examples that illustrate the relative advantage ofusing compound versus simple interest over aspecified period of time.
• Have students create budgets of income andexpenses for their personal situations usingspreadsheet and graphics programs.
Print Materials
• Applied Mathematics 11, Western CanadianEdition
PRESCRIBED LEARNING OUTCOMES SUGGESTED INSTRUCTIONAL STRATEGIES
40
APPLICATIONS OF MATHEMATICS 11 • Patterns and Relations (Variables and Equations)
It is expected that students will:
• represent and analyse situations that involveexpressions, equations and inequalities.
• use linear programming to solveoptimization problems.
It is expected that students will:
• graph linear inequalities, in two variables• solve systems of linear equations, in two
variables:- algebraically (elimination and
substitution)- graphically
• solve nonlinear equations, using a graphingtool.
• solve systems of linear inequalities in twovariables using graphing technology
• design and solve linear and nonlinearsystems, in two variables, to model problemsituations
• apply linear programming to find optimalsolutions to decision-making problems
When students create, identify, and interpret linearand non-linear function graphs that represent real-world situations or events, they connect theirknowledge of linear systems and graphs with theirtechnology and problem-solving skills.
• Consult with science teachers to obtain laboratorydata that represents real-world events and that canbe modeled with linear or non-linear relations.Have students use a graphing utility to generate aline of best-fit and to analyse the function in context.Technology such as a Calculator Based Laboratory(CBL) could also be used to generate data.
• Model the process of creating and analysinggraphs on a variety of topics (e.g., populationgrowth, car value depreciation, radioactive decay),paying special attention to the patterns andcharacteristics of each graph.
• Emphasize the relationship between two variablesby encouraging students to use relationalterminology (e.g., the distance an object fallsdepends on or is a function of, the time that it falls).
• Ask students to compare various company rates(e.g., vehicle towing, cellular phones, automobilerentals) to conduct a break-even analysis.
• Emphasize that relations between two variablesgive a line on the Cartesian plane, and thatproblems of multiple relations can be solvedgraphically and algebraically.
• Use graphing calculators or computer software tointroduce the concepts of linear inequalities andsystems of linear inequalities. Have students:- shade the solution planes and mark the
boundaries of graphs of linear inequalities- shade and find areas of overlap for systems of
linear inequalities- determine vertices and possible restrictions to
the solution of systems of linear inequalities- determine maximum and minimum values
• Present students with models of problemsituations and have them determine the linearequations, inequalities, and/or systems thatdefinine the problem. Have students discuss theproblems and ways of solving them, analyseconstraints on the problems, and discuss feasibilityof the constraints.
RECOMMENDED LEARNING RESOURCESSUGGESTED ASSESSMENT STRATEGIES
41
APPLICATIONS OF MATHEMATICS 11 • Patterns and Relations (Variables and Equations)
Linear and non-linear functions occur in real-lifesituations (e.g., maximizing profit and productivity,exponential growth of bacteria, earthquakes,radiocarbon dating). It is important to observestudents’ abilities to recognize patterns andfunctional relationships as well as their abilities toselect and use techniques to solve various types ofproblems. Assessment of students’ linearprogramming and graphing skills should focus onthe extent to which students apply the concepts tomodel and solve optimization problems.
Observe• While students are designing and solving linear
systems, note the extent to which they:- use linear programming to accurately model
various problems- use correct terminology such as optimization,
objective functions, constraints- draw graphs accurately- correctly use graphing calculators with shade
and trace capabilities- draw appropriate conclusions and
interpretations- recognize discrete or continuous data
Collect• Assign a series of problems that require students to:
- use graphing calculators- identify the appropriate graph with its
associated function Check students’ work for evidence that they:
- clearly understand the requirements of theproblem
- use efficient strategies and procedures to solvethe problem
- can verify the accuracy and reasonableness oftheir answers
Presentation• Have students work in small groups to complete a
project to design and analyse a profit andproductivity problem using linear programming.Look for evidence that they:- interpreted and modeled the problem correctly- arrived at logical conclusions or solutions- logically and clearly presented the work
Print Materials
• Applied Mathematics 11, Western CanadaEdition
• Explore Quadratic Functions with the TI-83 orTI-82
• Exploring Functions with the TI-82 GraphicsCalculator
• An Introduction to the TI-82 GraphingCalculator
• Modeling Motion: High School MathActivities with the CBR

PRESCRIBED LEARNING OUTCOMES SUGGESTED INSTRUCTIONAL STRATEGIES
42
APPLICATIONS OF MATHEMATICS 11 • Patterns and Relations (Relations and Functions)
It is expected that students will represent andanalyse quadratic, polynomial and rationalfunctions, using technology as appropriate.
It is expected that students will:
• determine the following characteristics of thegraph of a quadratic function:- vertex- domain and range- axis of symmetry- intercepts
In order to fully describe a function or relation,students need to be able to extract key data fromeither the graph of the function or the equation.Students should be able to describe, whereappropriate the vertices, domain and range,symmetry, or intercepts of a relation.
• Provide real-life situations modeled by quadraticequations (e.g., parabolic sound reflectors inauditoriums, curves created by origami art,reflecting surfaces of search lights) and havestudents use graphing calculators to determine:- maximum (or minimum) value and its meaning
in context- x-intercept(s) and its meaning in context- y-intercept(s) and its meaning in contextAsk students to explain how these values relate tothe real-life situations.
• Using visual aids such as flip cards, overheadprojectors, or graphing calculators with overheaddisplays, present students with examples ofseveral quadratic equations of varying levels ofcomplexity and their corresponding graphs. Forexample:y = x2, y = –3x2, y = – —x2, y = 2x2 + 3.
Ask students to make generalizations about therelationship between the form of the equation andthe shape of its corresponding graph. Repeat thisprocess with the other types of functions.
• Work with science teachers to set up experimentsto obtain parabolic data (e.g., use a CalculatorBased Laboratory to obtain the heights of fallingobjects or projectiles and generate a modelfunction to solve for roots, vertices, and time at agiven height).
• Make BINGO Cards with the following setup:
Provide a page with a number of options thatstudents can fill in under each category. Using anoverhead projector, display the graph or equationof a function. Students may mark under anycategory a correct feature of the graph or equationwhich appears on their card.
12
B I N G Omax/min x-int y-int axis of domain
symmetry & range

RECOMMENDED LEARNING RESOURCESSUGGESTED ASSESSMENT STRATEGIES
43
APPLICATIONS OF MATHEMATICS 11 • Patterns and Relations (Relations and Functions)
Assessment strategies must emphasize thestudents’ ability to extract key descriptiveinformation from parabolic graphs or equations.
Observe• Parabola Aerobics: Students begin with their
arms up in a parabola shape. Ask students todescribe where the vertex is on their body;where the axis of symmetry is. Ask them toshow you what the graph would look like if thex-intercepts (in this case the vertex) went from(0,0) to (-3,0) and (3,0). Observe that studentsmake their parabola move down. Ask them toshow you what would happen if the new axis ofsymmetry was x=2. All students should movesideways, etc.
• As students use the BINGO Cards, keep track ofpossible correct solutions. As they play thegame, observe the extent to which they canglean the graph or equation features from thegiven graph or equations.
Question• Circulate and ask students:
- how they select the window for their graphs- what happens when the TRACE feature is
used- what the x and y values mean- why the y value changes when the x value
changes- why a regression equation is used - what are
its benefits
Collect• Writing assignment: Given a particular problem
or application, ask students to explain theimportance and use of:- maximum or minimum points- x-intercepts- y-intercepts- the axis of symmetry- the domain- the range Assess student responses according to apreviously developed set of criteria developedwith the class.
Print Materials
• Applied Mathematics 11, Western CanadianEdition
• Explore Quadratic Functions with the TI-83 orTI-82
• Exploring Functions with the TI-82 GraphicsCalculator
• An Introduction to the TI-82 GraphingCalculator
• Modeling Motion: High School MathActivities with the CBR
• Using the TI-81 Graphics Calculator to ExploreFunctions
• What If ...?: The Straight Line: Investigationswith the TI-81 Graphics Calculator
• What If ...?: The Straight Line: Investigationswith the TI-82 Graphics Calculator
Software
• GrafEq (Macintosh & Windows Version 2.09)

PRESCRIBED LEARNING OUTCOMES SUGGESTED INSTRUCTIONAL STRATEGIES
44
APPLICATIONS OF MATHEMATICS 11 • Shape and Space (Measurement)
It is expected that students will:
• demonstrate an understanding of scale factors,and their interrelationship with thedimensions of similar shapes and objects.
• use measuring devices to make estimates andto perform calculations in solving problems.
It is expected that students will:
• enlarge or reduce a dimensioned object,according to a specified scale
• calculate maximum and minimum values,using tolerances, for lengths, areas andvolumes
• solve problems involving percentage errorwhen input variables are expressed withpercentage errors
• design an appropriate measuring process ordevice to solve a problem
Understanding the concept of scale, including theimplications of tolerances and errors involved, isimportant in many jobs and projects that requireaccuracy and precision in measurement. Knowledgeof measurement processes transcends many fields.
• Demonstrate the concept of tolerance, using ahigh-quality machined mechanical componentand a low-quality mechanical component.
• Discuss the effect of absolute error and percentageerror when comparing the quality of machines.
• Have students compare the errors generated when anumber of small values are added to those generatedwhen fewer but larger amounts are added.
• To bring relevant labs and experiences into theclassroom, consult with science teachers forcurrent applications of error in measurements andwith shop teachers regarding precision of tools.
• Have students investigate applications of scale,including:- enlargement techniques for artists- metal tooling machines making small parts
from larger initial diagrams- blueprints produced with Computer Aided
Design programs- links to trigonometry and similar triangles
• Have students analyse the difference in accuracywhen measuring using:- an Erlenmeyer flask- a volumetric flask- a graduated cylinderDiscuss effects the shape of each has on themeasuring error.
• Provide students with opportunities to use variousmethods of showing scale (e.g., the linear scale, theratio method, the statement method, the scalefactor method). Encourage students to becomeefficient and confident at making conversions anddetermining scale factors and ratios.
• Have each student select a scale and use it to makea scale diagram of the classroom.
• Provide a number of small items such asthumbtacks, paper clips, or stickers, and have eachstudent make an enlargement scale diagram of oneitem. As a class, discuss differences in howselected scales are stated.

RECOMMENDED LEARNING RESOURCESSUGGESTED ASSESSMENT STRATEGIES
45
APPLICATIONS OF MATHEMATICS 11 • Shape and Space (Measurement)
Assessment should centre on students’ ability tocalculate errors as well as the development of anintuitive understanding of how much error isallowed and how much error will be introduced byvarious measurement procedures.
Observe• Assign projects that involve 3-D scales and
observe the extent to which students:- use appropriate ratios and scale- can use connecting blocks to build an object
from an orthographic diagram
Question• Have students critique different methods used in
making scale diagrams and suggest changes inprocedures.
• Analyse situations when percent accuracy is morefavorable than absolute accuracy.
• Have students suggest methods of minimizingvarious types of errors in measurement.
Collect/Observe• Have students make a list of various devices used
for measuring a particular attribute (e.g., length)and rank them in terms of their precision.
• Have students sort a list of questions according towhich would require absolute error and whichwould require percent error to solve
• Have students list various measuring devices usedin other shop or science courses at your school. Insmall groups have students discuss the precisionof each tool. Ask students to:- give examples of projects which might require
two or more measuring tools- explain how the precision of their
measurements are affected when two or moretools are used
Peer/Assessment• Have students perform a simple physics lab (such
as rolling a marble down a ramp) and do thecalculations to find the marble’s average velocity.Have students calculate all experimental error andshare their findings with peers. Groups can switchcalculations and check each other’s work
Print Materials
• Applied Mathematics 11, Western CanadianEdition
Software
• The Geometer’s Sketchpad
CD-ROM
• Geometry Blaster

PRESCRIBED LEARNING OUTCOMES SUGGESTED INSTRUCTIONAL STRATEGIES
46
APPLICATIONS OF MATHEMATICS 11 • Shape and Space (3-D Objects and 2-D Shapes)
It is expected that students will develop andapply the geometric properties of circles andpolygons to solve problems.
It is expected that students will:
• use technology with dynamic geometrysoftware to confirm and apply the followingproperties:- the perpendicular from the centre of a circle
to a chord bisects the chord- the measure of the central angle is equal to
twice the measure of the inscribed anglesubtended by the same arc
- the inscribed angles subtended by the samearc are congruent
- the angle inscribed in a semicircle is a rightangle
- the opposite angles of a cyclic quadrilateralare supplementary
- a tangent to a circle is perpendicular to theradius at the point of tangency
- the tangent segments to a circle, from anyexternal point, are congruent
- the sum of the interior angles of an n-sidedpolygon is equal to (2n – 4) right angles
• use properties of circles and polygons to solvedesign and layout problems
Applications of geometry, which connects the physicalworld with students’ mathematical knowledge, will helpstudents understand the practical importance of geometryand reinforce the concept of rules and patterns inmathematics. Exploring geometric ideas encourages thedevelopment of critical thinking and analysis skills, andhelps students recognize geometry’s wide applicability insolving problems.
• Have students apply the properties of a circle to:- create a graphic design using computer graphics
software- determine the centre of curvature of an arc in order to
replicate it• Encourage divergent thinking by providing students
with geometry applications that include problems withmore than one possible solution or that require multiplemethods for solving the problem.
• Have students research and report on an area ofgeometry of personal interest or build a model thatillustrates a geometric concept. Examples could include:- fractal geometry- transformational geometry- models of Platonic solids- exploring optical illusions- researching careers that use geometry- topology- tessellationsHave them explain the model to the class.
• Have students develop experiments in which theymeasure chord and tangent circle properties and useinductive reasoning to draw conclusions from results.
• Show students how to construct hexagons and octagonsusing a straightedge and compass. Ask students to findways to construct other regular polygons.
• Have students form cooperative groups and provideeach group with a length of string that represents eitherthe radius or the length of one side of a regular polygon.Have each group find a way to lay out a foundation fora small structure (e.g., a regular polygon-shaped patio, agazebo foundation).
• Arrange a class field trip to a local community college orengineering office to observe a demonstration ofcomputer-aided design.
• Using examples of applications of geometry (e.g.,construction projects, landscape design, computergraphics, quilting or tiling) have students complete alayout project.

RECOMMENDED LEARNING RESOURCESSUGGESTED ASSESSMENT STRATEGIES
47
APPLICATIONS OF MATHEMATICS 11 • Shape and Space (3-D Objects and 2-D Shapes)
Students demonstrate their understanding ofgeometric principles when solving problems thatinvolve making connections between the physicalworld and the geometric models that represent it.
Observe• Provide students with examples of art from
different cultures, such as Aboriginal beadwork,mandalas from India and Mexico, Celtic knotdesigns, Icelandic sweater designs, Japanese andChinese lattice designs, and patterns in Islamic art.Have them analyse the art for the extent to whichthe artist used geometric principles (e.g.,symmetry, circle properties, transformations).
Collect• Have students keep a scrapbook or math journal
of practical relationships or applications in whichgeometry and corresponding terms are used.Require them to provide a brief writtenexplanation of how each entry is an example ofsome aspect of geometry they have studied.Assess their collections based on criteriadeveloped with students. Criteria might include:- knowledge of properties- representation of geometric ideas with models
or diagrams- recognition of mathematical interrelationships- application of geometry to solve problems
Self-/Peer Assessment• Have students work in pairs to create geometry
problems involving properties of circles. Each pairexchanges problems with another pair of students,solves the problems, then compares the differentsolutions and processes used.
• Ask students to exchange the writtencommunication of a design with a partner. Havethe partner reproduce the design from thiscommunication. Was the communication clearenough for reproduction of the design? Whatwould improve the communication?
Print Materials
• Applied Mathematics 11, Western CanadianEdition
Software
• The Geometer’s Sketchpad
CD-ROM
• Geometry Blaster

PRESCRIBED LEARNING OUTCOMES SUGGESTED INSTRUCTIONAL STRATEGIES
48
APPLICATIONS OF MATHEMATICS 11 • Statistics and Probability (Data Analysis)
It is expected that students will analyse graphs orcharts of given situations to derive specificinformation.
It is expected that students will:
• extract information from given graphs ofdiscrete or continuous data, using:- time series- continuous data- contour lines
• draw and validate inferences, includinginterpolations and extrapolations, fromgraphical and tabular data
• design different ways of presenting data andanalyzing results, by focusing on the truthfuldisplay of data and the clarity of presentation
• collect experimental data and use best-fitexponential and quadratic functions, to makepredictions and solve problems
Creating and interpreting graphs and charts areimportant real-life skills. Students will encountermany day-to-day situations in which they will berequired to interpret and analyse graphs and makereasonable inferences about the data.
• Have students use previously learned samplingskills to collect bivariate data such as:- the number of absences from class and
corresponding course grade- age of the school bus and cost of upkeep of the
bus the previous month- points scored by a professional sport team at
home compared to the attendance at the gameand attendance at the next game
• Use the calculator based laboratory (CBL) to :- generate data and scatter plots (e.g., motion
data, data from science labs- plot data for populations from various age
groups to confirm or disprove the occurrence ofa baby boom
• Present data from spreadsheets in different forms(e.g., pie chart, histogram, broken line) anddetermine the appropriate use of differing formsof data presentation. Note: Translating from data→ functions is a good way to relate tangibleproblems to theoretical mathematicalmanipulations.
• With collected data, have students create a scatterplot and then determine the line of best fit. Theycompare the resulting plots and determine thelinear correlation coefficient of the data. Finally,they draw conclusions based on the lines of bestfit, keeping in mind the limitations associated withthe correlation coefficient.
• Have students research examples that exhibitmisuse of statistics such as:- assumed cause and effect based on calculated
correlation- linear projections made beyond the relevant
range of the data- use of inappropriate data (e.g., outliers) to
calculate the correlation coefficient• Provide samples that may be misleading from
sources such as political pamphlets oradvertisements, and encourage students toquestion conclusions drawn from the data.

RECOMMENDED LEARNING RESOURCESSUGGESTED ASSESSMENT STRATEGIES
49
APPLICATIONS OF MATHEMATICS 11 • Statistics and Probability (Data Analysis)
Statistics is the science of collecting, organizing, andinterpreting data. In assessing student progress indata analysis, look for evidence that students candetermine the curve of best fit for the data.
Observe• In assessing student performance in analysing
data, look for evidence that they can:- differentiate between discrete and continuous
data- determine the equation of the curve of best fit- use functions to extrapolate and interpolate
trends- use reasoning to choose the appropriate
regression curves based on trend of data andthe context from which the problem is based
• As students work with graphing calculators andtables of data obtained from experiments,circulate, asking questions and observing howeffectively they are able to:- enter the data into their calculators- sketch, on graph paper, an accurate
representation of the calculator’s resultinggraph
- determine the regression equation that bestmodels the date
- use the regression equation to solve appliedproblems
Collect• Have students investigate real-life situations to
determine possible relationships among the data(e.g., education and income, deaths and carspeed). For each data set, ask them to construct thescatter plot, determine the curve of best fit, andcalculate the correlation coefficient. Assess theirwork for the extent to which they accuratelydetermine the line of best fit.
Self Assessment• Students can discuss and debate the validity of
other student’s analyses of data. Look for reasonswhy they choose particular regression lines,displayed data in particular way, and how theyreached a conclusion based on data.
Print Materials
• Applied Mathematics 11, Western CanadianEdition
• Exploring Statistics with the TI-82 GraphicsCalculator
• An Introduction to the TI-82 GraphingCalculator
• Modeling Motion: High School MathActivities with the CBR
• Using the TI-81 Graphics Calculator to ExploreStatistics
• What If ...?: The Straight Line: Investigationswith the TI-82 Graphics Calculator


RECOMMENDED LEARNING RESOURCESSUGGESTED ASSESSMENT STRATEGIES
51
CURRICULUMApplications of Mathematics 12

PRESCRIBED LEARNING OUTCOMES SUGGESTED INSTRUCTIONAL STRATEGIES
52
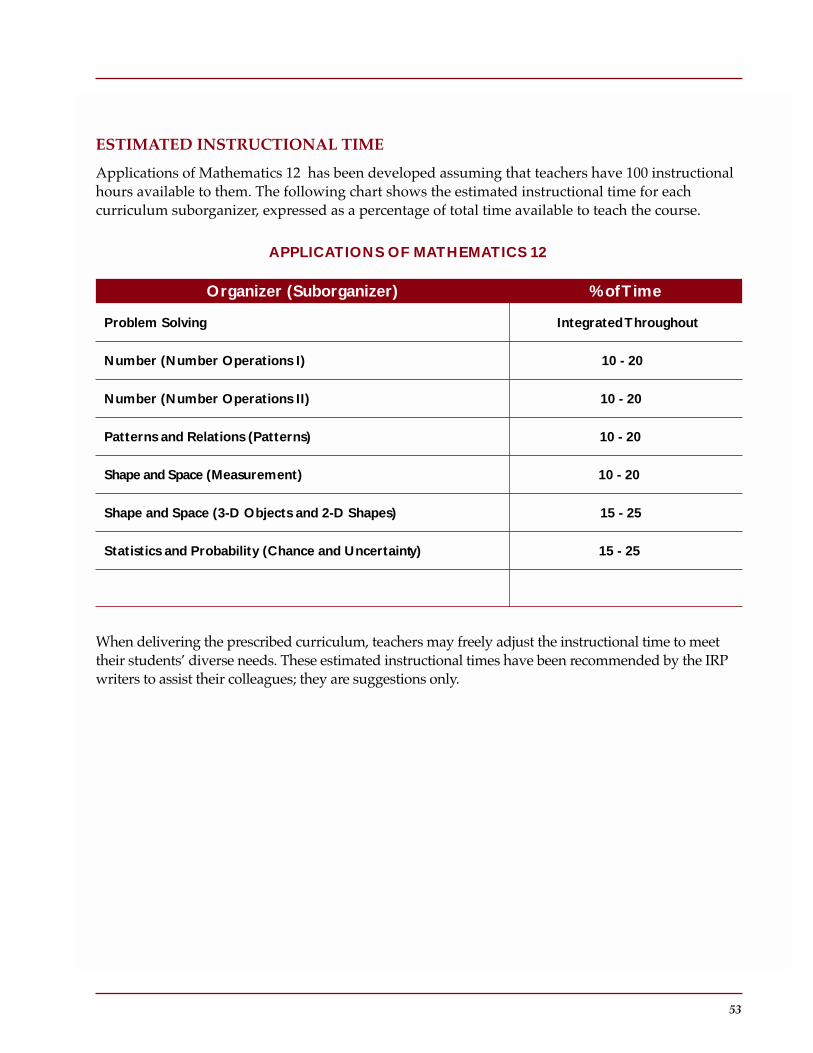
RECOMMENDED LEARNING RESOURCESSUGGESTED ASSESSMENT STRATEGIES
53
ESTIMATED INSTRUCTIONAL TIME
Applications of Mathematics 12 has been developed assuming that teachers have 100 instructionalhours available to them. The following chart shows the estimated instructional time for eachcurriculum suborganizer, expressed as a percentage of total time available to teach the course.
When delivering the prescribed curriculum, teachers may freely adjust the instructional time to meettheir students’ diverse needs. These estimated instructional times have been recommended by the IRPwriters to assist their colleagues; they are suggestions only.
Organizer (Suborganizer) % of Time
Problem Solving Integrated Throughout
Number (Number Operations I) 10 - 20
Number (Number Operations II) 10 - 20
Patterns and Relations (Patterns) 10 - 20
Shape and Space (Measurement) 10 - 20
Shape and Space (3-D Objects and 2-D Shapes) 15 - 25
Statistics and Probability (Chance and Uncertaint y) 15 - 25
APPLICATIONS OF MATHEMATICS 12

PRESCRIBED LEARNING OUTCOMES SUGGESTED INSTRUCTIONAL STRATEGIES
54
APPLICATIONS OF MATHEMATICS 12 • Problem Solving
It is expected that students will use a variety ofmethods to solve real-life, practical, technical,and theoretical problems
It is expected that students will:
• solve problems that involve a specific contentarea such as geometry, algebra, trigonometry,statistics, probability, etc.
• solve problems that involve more than onecontent area
• solve problems that involve mathematicswithin other disciplines
• analyse problems and identify the significantelements
• develop specific skills in selecting and usingan appropriate problem-solving strategy orcombination of strategies chosen from, but notrestricted to, the following:- guess and check- look for a pattern- make a systematic list- make and use a drawing or model- eliminate possibilities- work backward- simplify the original problem- develop alternative original approaches- analyse keywords
• demonstrate the ability to work individuallyand co-operatively to solve problems
• determine that their solutions are correct andreasonable
• clearly communicate a solution to a problemand the process used to solve it
• use appropriate technology to assist inproblem solving
Problem solving is a key aspect of any mathematicscourse. Working on problems involving a range ofmathematical disciplines can give students a sense ofthe excitement involved in creative and logicalthinking. It can also help students developtransferable real-life skills and attitudes. Multi-strandand interdisciplinary problems should be includedthroughout Applications of Mathematics 12.
• In a class discussion, define problem solving withstudents, pointing out that in mathematicsproblem solving involves many disciplines,including algebra, geometry, trigonometry,statistics, and probability.
• Introduce new types of problems directly tostudents (i.e., without demonstration), andfacilitate as they attempt to solve them.
• Have students work in small co-operative groupsof three to five when introducing new types ofproblems.
• Model and reinforce student use of a variety ofapproaches to problem solving (e.g., algebraic andgeometric).
• Emphasize that many problems may not be solvedin one try and that it is sometimes necessary torevisit the problem, start over, and try again.
• Have students or groups discuss their thoughtprocesses as they attempt to solve a problem.Point out the strategies inherent in their thinking(e.g., guessing and checking, looking for a pattern,making and using a drawing or model).
• Ask leading questions such as:- What are you being asked to find out?- What do you already know?- Do you need additional information?- Have you ever seen similar problems?- What else can you try?
• When students arrive at solutions to particularproblems, encourage them to generalize from orextend the problem situations.
Note: See Appendix G for examples of multi-strandand interdisciplinary problems that most studentsshould be able to solve. These problems areindicated with an asterisk (*)

RECOMMENDED LEARNING RESOURCESSUGGESTED ASSESSMENT STRATEGIES
55
APPLICATIONS OF MATHEMATICS 12 • Problem Solving
Students analyse problems and solve them using avariety of approaches. Assessment of problem-solving skills is made over time, based onobservations of many situations.
Observe• Have students present solutions to the class
individually, in pairs, or in small groups. Note theextent to which they clarify their problems andhow succinctly they describe the processes used.
Question• To check the approaches students use when
solving problems, ask questions that prompt themto:- paraphrase or describe the problem in theirown
words- explain the processes used to derive an answer- describe alternative methods to solve a problem- relate the strategies used in new situations- link mathematics to other subjects and to the
world of work.
Collect• For selected problems, have students annotate
their work to describe the processes they used.Alternatively, have them provide briefdescriptions of what worked and what did notwork for particular problems.
Self-Assessment• Ask students to keep journals to describe the
processes they used in dealing with problems.Have them include descriptions of strategies thatworked and those that did not.
• Develop with students a set of criteria to self-assess problem-solving skills. The reference set,Evaluating Problem Solving Across Curriculum, maybe helpful in identifying such criteria.
Please see the introduction to Appendix B for alist of suggested utility software that supportsthis course.
The Western Canadian Protocol LearningResource Evaluation Process has also identifiednumerous teacher resources and professionalreferences. These are generally cross-gradeplanning resources that include ideas for avariety of activities and exercises.
These resources, while not part of the GradeCollections, have Provincially Recommendedstatus.
Appendix B includes an annotated bibliographyof these resources for ordering convenience.

PRESCRIBED LEARNING OUTCOMES SUGGESTED INSTRUCTIONAL STRATEGIES
56
APPLICATIONS OF MATHEMATICS 12 • Number (Number Operations)
It is expected that students will describe andapply operations on matrices to solve problems,using technology as required.
It is expected that students will:
• model and solve problems, including thosesolved previously, using technology toperform matrix operations of addition,subtraction, and scalar multiplication asrequired
• model and solve consumer and networkproblems using technology to perform matrixmultiplication as required
Matrices offer an excellent way for students toexplore problem solving, modeling and itslimitations, and interpretations of results. Matrixoperations give students the tools to analyse andsolve complex problems that they may have beenpreviously unable to solve.
• As a class, brainstorm situations that require theuse of matrices (e.g., scheduling a tournament,finding the most direct and economical route totravel to a desired location, tracing consumerpreferences).
• Have students discuss various ways of organizingraw data so that it can be displayed and analysedin a data table, diagram, or graph. Ask students todetermine when using a matrix is the mostappropriate way to display certain types of data.
• Provide students with various scenarios that allowthem to explore the specific matrix operationsneeded to generate new information for (orsolutions to) a problem. Have students analyse theresulting matrix to verify hypotheses or generatenew questions.
• Have students work in groups on projects thatrequire the use of matrices to make informeddecisions. For example, they might determine:- the type and quantity of coffee to purchase for a
coffee shop, based on consumer preferences- the number of T-shirts and baseball caps that
should be purchased for the year, given a setschool store budget and a known schoolpopulation
• Ask each student to develop a project related tomatrices using resources such as the NCTMAddenda Series, the Internet, or consumerpreference surveys of their school orneighborhood.
RECOMMENDED LEARNING RESOURCESSUGGESTED ASSESSMENT STRATEGIES
57
APPLICATIONS OF MATHEMATICS 12 • Number (Number Operations)
Matrices provide an effective way to organize,manipulate, and interpret data in tabular form;assessment should focus on students’ abilities tosolve complex problems using matrix operations.
Observe• In their oral or written work, look for evidence
that students are able to :- use matrix terminology such as elements, rows,
columns, dimensions, scalar, scalar product,product, and identity matrix
- use matrices to represent and organizeinformation
- generate new information- use appropriate technology to perform matrix
calculations- interpret the results
Presentation• Have students present data in matrix form
generated from business or industry, and havethem explain what problem is being analysed orsolved using this model. Look for evidence thatstudents have:- accurately represented the information in
matrix form- chosen and used appropriate operations- interpreted results correctly- understood the limitations of the data
Peer Assessment• Ask small groups of students to design a test for
their classmates, given parameters for the test suchas length, topics, and type of questions. Acondition of administering their tests to othergroups is that all students in the author groupmust be able to answer each question correctly.
Print Materials
• Applied Mathematics 12 available June 2001
Software
• Secondary Math Lab Toolkit
PRESCRIBED LEARNING OUTCOMES SUGGESTED INSTRUCTIONAL STRATEGIES
58
APPLICATIONS OF MATHEMATICS 12 • Number (Number Operations)
It is expected that students will design or use aspreadsheet to make and justify financialdecisions.
It is expected that students will:
• design a financial spreadsheet template toallow users to input their own variables
• analyse the costs and benefits of renting orbuying an increasing asset, such as land orproperty, under various circumstances
• analyse the costs and benefits of leasing orbuying a decreasing asset, such as a vehicle orcomputer, under various circumstances
• analyse an investment portfolio applying suchconcepts as interest rate, rate of return andtotal return
Financial decisions are justified by analysing howvariables affect the time value of money. Thisanalysis is readily achieved when using financialspreadsheet templates.
• Give students an existing spreadsheet template(e.g., compound interest, annuity) and have theminput values and analyse how the outputchanges.
• Have students modify an existing template sothat it will generate additional information. Forexample:- modify amortization tables to find the total
interest over a specific period or change theinterest rate part way through the term(refinancing plan)
- personalize budget templates to reflectstudents’ individual financial situations
• Have students create a template (financialspreadsheet) that will give monthly details ofborrowing $80,000 for 20 years at 8.5% interest.The information wanted is monthly payment,monthly debt remaining, interest paid monthly,and amount of principle paid monthly.
RECOMMENDED LEARNING RESOURCESSUGGESTED ASSESSMENT STRATEGIES
59
APPLICATIONS OF MATHEMATICS 12 • Number (Number Operations)
To make wise financial decisions, consumers mustunderstand the mathematics involved in borrowingand investing money. Assessment should involve theuse of spreadsheet templates and provide evidence ofstudents’ abilities to analyse situations so they canmake informed decisions.
Observe• While students are working on the templates, look
for evidence they can:- manipulate the variables within the template to
solve the given problem- modify the template to include additional
information to address a different problemsituation
- modify the template to address differentproblems
- use technology with relative ease andconfidence
Collect• Provide each student with a unique financial
profile, including income and debt load. Havestudents prepare five versions of an amortizationtemplate to reflect various input variables (e.g.,periods, interest rates, down payments). Havethem analyse the results of the manipulations anddetermine which combination of variables is mostappropriate.
Self-Assessment• Have students select and use a template or
spreadsheet of personal finances, moneymanagement in general, or a home mortgage. Askthem to answer the following questions:- What would happen if _____________________?- What would be true if ______________________?- What would be the result if __________________?- What if ______________ had happened instead?- What does this information suggest?- What rule applies in this case?
Print Materials
• Applied Mathematics 12 available June 2001
Software
• Secondary Math Lab Toolkit

PRESCRIBED LEARNING OUTCOMES SUGGESTED INSTRUCTIONAL STRATEGIES
60
APPLICATIONS OF MATHEMATICS 12 • Patterns and Relations (Patterns)
It is expected that students will generate andanalyze cyclic, recursive, and fractal paterns
It is expected that students will:
• describe periodic events, including thoserepresented by sinusoidal curves, using theterms amplitude, period, maximum andminimum values, vertical and horizontal shift
• collect sinusoidal data; graph the graph usingtechnology, and, represent the data with a bestfit equation of the form:- y = a sin (bx + c) + d
• use best fit sinusoidal equations, and theirassociated graphs, to make predictions(interpolation, extraction)
• use technology to generate and graphsequences that model real-life phenomena
• use technology to contruct a fractal pattern byrepeatedly applying a procedure to ageometric figure
• use the concept of self-similarity to compareand/or predict the perimeters, areas andvolumes of fractal patterns
The study of cyclic, recursive, or fractal patternsrequires the use of spatial reasoning to model andanalyse complex natural patterns such as biologicalstructures, coastlines, or snowflakes. Periodic eventsand fractal geometry also offers students a chance toexplore the aesthetic aspects of mathematics.
• Have students analyse patterns found in computersimulations that model transformations ofgeometric figures. Ask them to identify examplesof divergent, convergent, oscillating, or staticpatterns.
• Encourage students to use their geometric andanalytical skills to construct pencil-and-paperdrawings (e.g., Koch snowflake, Sierpinskitriangle), paper-and-scissors constructions (e.g.,pop-up fractals), and computer software (e.g.,fractal generators and drawing software). Askstudents to record the changes observed in theperimeters, areas, and volumes of the fractals theyconstruct. Ask them to use their observations tomake generalizations such as the volume-to-arearatio found in naturally occurring fractal-likeobjects (e.g., sponges, lungs).
• Invite students to conduct a group or individualresearch project on fractal geometry examining:- its historical development- specific career applications (e.g., botany,
animation, cartography, climatology, medicine,art)
• Have students use periodic functions to modeland graph common periodic patterns (e.g., tidalflow, the beating of a heart, and seasonal changes),and to analyse and make predictions about them.
• Have students identify and collect data about anumber of events that are cyclic over time. Theythen sketch graphs of these periodic events withtime represented on the x-axis. Examples that mayhelp stimulate ideas include:- the depth of water at a beach over a 48-hour
period- the temperature in a house where the heat is
controlled by a thermostat- the height of a pendulum in a grandfather clock
as the pendulum swings- the firing sequence of cylinders in a four-
cylinder car- the current in a household circuit
RECOMMENDED LEARNING RESOURCESSUGGESTED ASSESSMENT STRATEGIES
61
APPLICATIONS OF MATHEMATICS 12 • Patterns and Relations (Patterns)
Many complex phenomena can only be modeledusing periodic or fractal patterns. Fractal geometryprovides a way to solve problems involvingirregularity and similarity under changes of scale.Assessment of students’ representations of cyclic datashould focus on the accuracy of their graphs of thedata, their abilities to interpret and make predictionsbased on their graphs, and the extent to which theyaccurately represent sinusoidal graphs with equations.
Observe• While students are working with computer
software that generates sequences or drawings,look for evidence of students’ abilities to:- use computers with relative ease and
confidence- analyse patterns in the simulation runs- use the software application to calculate
lengths, areas, and volumes of resultingpatterns
• While students are constructing paper-and-pencildrawings, computer-generated images, or 3-Dconstructions, look for evidence that they use theconcept of self-similarity.
• While students are graphing sinusoidal data, lookfor evidence that they:- use correct terminology- accurately construct the graphs from different
sets of cyclic data- use the graphs to make predictions- represent the graphs with the correct equations
• Have small groups of students each research aproblem that requires the collection of data aboutnaturally occurring events. Have them graph thedata and use the graphs to make predictions tosolve the problems. As groups present their work,look for evidence of the extent to which they:- understand periodic functions- accurately graph the data- use the graphs to solve problems (e.g., make
predictions)- present their solutions to the problems in a
clear and logical manner
Print Materials
• Applied Mathematics 12 available June 2001• Exploring Advanced Algebra with the TI-83• An Introduction to the TI-82 Graphing
Calculator
Software
• Secondary Math Lab Toolkit• GrafEq (Macintosh & Windows Version 2.09)

PRESCRIBED LEARNING OUTCOMES SUGGESTED INSTRUCTIONAL STRATEGIES
62
APPLICATIONS OF MATHEMATICS 12 • Shape and Space (Measurement)
It is expected that students will analyse objects,shapes and processes to solve cost and designproblems.
It is expected that students will:
• use dimensions and unit prices to solveproblems involving perimeter, area andvolume
• solve problems involving estimation andcosting for objects, shapes or processes when adesign is given
• design an object, shape, layout or processwithin a specified budget
• use simplified models to estimate thesolutions to complex measurement problems
Real-world activities involving measurementformulae and trigonometry enable students toexplore the physical world.
• Have students investigate building costs, technicaldrawings, and related documents, then invite abuilder, architect, interior designer, or otherappropriate professional to explain her or hismeasurement techniques, procedures, and “tricksof the trade.”
• Have students work in pairs using two methods todetermine the trigonometric ratios of righttriangles. One student measures the sides and usesthese measurements to calculate the ratios; theother student measures the angles and uses acalculator or trigonometric table to determine theratios. They then compare their results andidentify and discuss discrepancies betweencalculated and measured results.
• Where possible, have students estimateinaccessible distances or dimensions (e.g., theheight of a building, width of a river, gradient of ahill). Have them confirm the estimates by usingcalculations that include:- ratio and proportion- the Pythagorean theorem- trigonometry

RECOMMENDED LEARNING RESOURCESSUGGESTED ASSESSMENT STRATEGIES
63
APPLICATIONS OF MATHEMATICS 12 • Shape and Space (Measurement)
Measurement experiences are a powerful applicationof mathematical theory to everyday phenomena.Students demonstrate their knowledge ofmeasurement concepts by generalizing aboutpatterns and procedures and by solving problemsinvolving area, perimeter, surface area, and volume.
Observe• While students are working on measurement
activities, circulate and provide feedback on:- their abilities to match the correct measurement
formula to a given figure- their abilities to recognize and apply the sine
and cosine laws- the extent to which they consider the
reasonableness of their answers- their overall understanding of measurement
concepts in solving problems- their abilities to select the appropriate
trigonometric ratio to solve problems involvingright triangles
Collect• Review students’ written work in solving
measurement problems for evidence that they can:- explain the method used in finding the area or
volume of a composite figure- use various methods for finding the answers- solve various types of problems based on the
interpretation of measurements (e.g., from a setof blueprints)
- show the connection between a model, itsrelated equation, and the physical situation(e.g., string art, building application, computeranimation, business applications, graphicdesign)
Print Materials
• Applied Mathematics 12 available June 2001
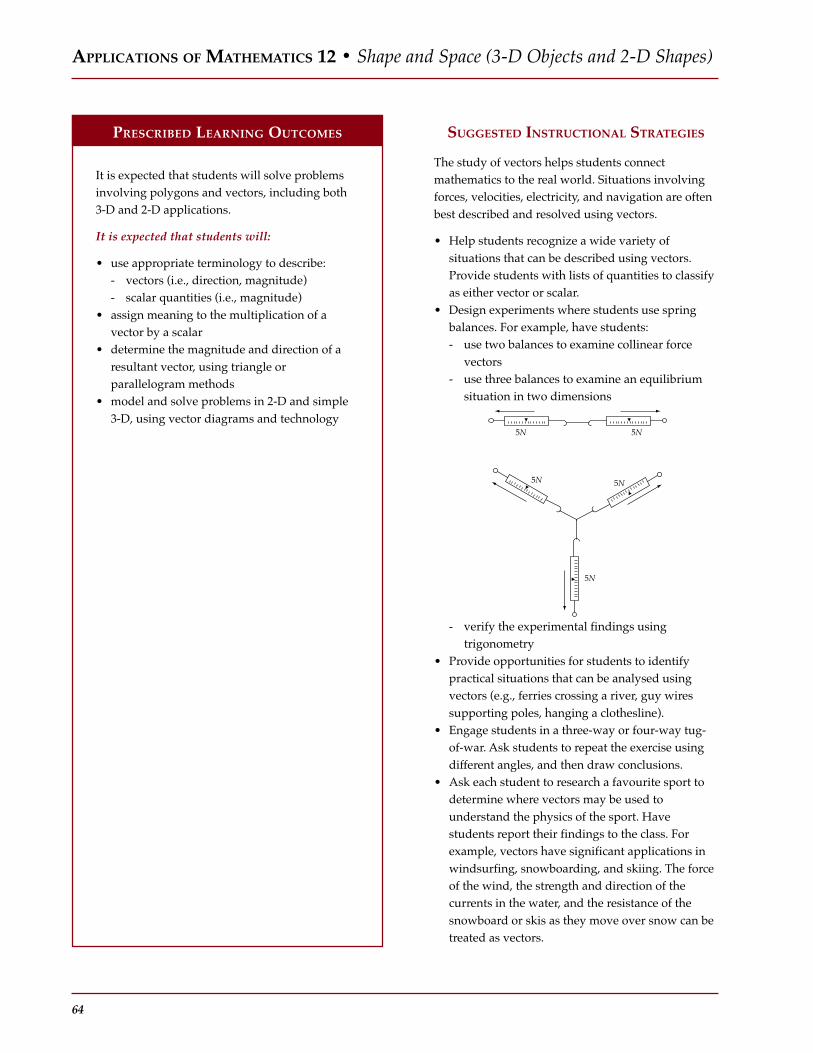
PRESCRIBED LEARNING OUTCOMES SUGGESTED INSTRUCTIONAL STRATEGIES
64
APPLICATIONS OF MATHEMATICS 12 • Shape and Space (3-D Objects and 2-D Shapes)
It is expected that students will solve problemsinvolving polygons and vectors, including both3-D and 2-D applications.
It is expected that students will:
• use appropriate terminology to describe:- vectors (i.e., direction, magnitude)- scalar quantities (i.e., magnitude)
• assign meaning to the multiplication of avector by a scalar
• determine the magnitude and direction of aresultant vector, using triangle orparallelogram methods
• model and solve problems in 2-D and simple3-D, using vector diagrams and technology
The study of vectors helps students connectmathematics to the real world. Situations involvingforces, velocities, electricity, and navigation are oftenbest described and resolved using vectors.
• Help students recognize a wide variety ofsituations that can be described using vectors.Provide students with lists of quantities to classifyas either vector or scalar.
• Design experiments where students use springbalances. For example, have students:- use two balances to examine collinear force
vectors- use three balances to examine an equilibrium
situation in two dimensions
5N
5N 5N
5N
5N
- verify the experimental findings usingtrigonometry
• Provide opportunities for students to identifypractical situations that can be analysed usingvectors (e.g., ferries crossing a river, guy wiressupporting poles, hanging a clothesline).
• Engage students in a three-way or four-way tug-of-war. Ask students to repeat the exercise usingdifferent angles, and then draw conclusions.
• Ask each student to research a favourite sport todetermine where vectors may be used tounderstand the physics of the sport. Havestudents report their findings to the class. Forexample, vectors have significant applications inwindsurfing, snowboarding, and skiing. The forceof the wind, the strength and direction of thecurrents in the water, and the resistance of thesnowboard or skis as they move over snow can betreated as vectors.

RECOMMENDED LEARNING RESOURCESSUGGESTED ASSESSMENT STRATEGIES
65
APPLICATIONS OF MATHEMATICS 12 • Shape and Space (3-D Objects and 2-D Shapes)
Vectors provide a clear method for students to modeland solve 2-D and 3-D problems. Assessment focuseson students’ abilities to use vectors to accuratelyrepresent physical situations, select appropriateproblem-solving methods, and use trigonometryappropriately.
Observe• As students conduct experiments or solve
problems involving vectors, observe howeffectively they can:- relate vector quantities to the physical world- use appropriate vector terminology and
associated notation- use protractors and other measuring devices
effectively- follow directions to measure angles and vector
lengths- calculate vector lengths- select and use appropriate trigonometric
concepts to solve problems- explain the problem-solving processes they use- communicate their conclusions
• Work with students to develop a table ofspecifications for a test on this organizer. Identifyfor them the content categories along a verticalaxis and the intellectual levels along the horizontalaxis. After the weighting is identified for each cell,have students work in groups to developquestions for each cell.
Self-Assessment• Ask students to describe to the class ways in
which a student might make errors whenevaluating vectors. Ask them to then share how tocircumvent those errors by using rules or remindersystems.
Print Materials
• Applied Mathematics 12 available June 2001
Software
• Secondary Math Lab Toolkit

PRESCRIBED LEARNING OUTCOMES SUGGESTED INSTRUCTIONAL STRATEGIES
66
APPLICATIONS OF MATHEMATICS 12 • Statistics and Probability (Chance and Uncertainty)
It is expected that students will:
• use normal and binomialprobability distributions to solve problemsinvolving uncertainty.
• solve problems based on the counting of sets,using techniques such as the fundamentalcounting principle, permutations andcombinations.
• model the probability of a compound event,and solve problems based on the combining ofsimpler probabilities.
It is expected that students will:
• find the population standard deviation of adata set or a probability distribution, usingtechnology
• use z-scores and the normal distribution tosolve problems
• use the normal approximation to the binomialdistribution to solve problems involvingprobability calculations for large samples(where npq>10)
• solve pathway problems, interpreting andapplying any constraints
• use the fundamental counting principle todetermine the number of different ways toperform multistep operations
• construct a sample space for two or threeevents
• classify events as independent or dependent• solve problems, using the probabilities of
mutually exclusive and complementary events
Decision-making situations that involve probabilityand uncertainty occur frequently in daily life.Students need opportunities to learn how to use thenormal probability distribution as a tool wheninterpreting and solving such problems.
• In a large group discussion, point out that inproblems involving probability, words often havea meaning different from their ordinary Englishusage. Help students distinguish betweenmathematical usage and common usage.
• Provide students with examples that do not fit thenormal curve and ask them to determine whyusing the z-score is inappropriate, emphasizingthat the z-score will not solve all probabilityproblems. Some examples include:- a crown-and-anchor game in which every
number is equally likely (i.e., no cluster aboutthe mean)
- the median age of teachers is 45 and their meanis 50 (i.e., not symmetric about the mean)
• Help students develop a list of important things toconsider when calculating the probability of anevent. The list could include:- trying to organize the events of the sample
space using tables or tree diagrams whenpossible
- recalling the difference between AND and ORand how it relates to union and intersection
- determining if each part of the problem is apermutation or combination
- trying to solve a simpler version of the problemby taking a small sample of the same eventusing the counting principle
• Use real-life problem situations to introduce newconcepts. For example:- Monica and André play a tennis match in
which the first person to win two games in arow (or a total of three games) wins the match.How many possibilities are there to a finaloutcome? (Using a tree diagram may behelpful.)
- Is selecting three people from a class to be onthe student council any different from picking aperson from the class to be president, another tobe treasurer, and a third to be secretary?
• Have students research the role of probability inthe field of genetics (e.g., eye colour, blood type).

RECOMMENDED LEARNING RESOURCESSUGGESTED ASSESSMENT STRATEGIES
67
APPLICATIONS OF MATHEMATICS 12 • Statistics and Probability (Chance and Uncertainty)
The study of statistics relies heavily on the theory ofprobability. Probability provides concepts andmethods for dealing with uncertainty and forinterpreting predictions based on uncertainty.Evidence of students’ abilities to use probability canbest be collected in the context of experimentaldesign and problem-solving activities.
Observe• While students are working on problems
involving uncertainty, look for evidence that theycan:- use the appropriate terminology- distinguish between permutation and
combination and provide an example of each- identify appropriate uses of the normal
distribution- correctly calculate the mean and standard
deviation of a data set or distribution- correctly use normal distribution and z-scores- make sound conclusions using data at hand
• To assess students’ work on statistics projects, lookfor evidence that they can:- compile appropriate data for the project- identify the problem to be analysed and explain
how the data contribute to the solution- calculate appropriate statistics from the
following: mean, standard deviation, and z-score
- summarize data using tables, diagrams, orgraphs
- draw conclusions and inferences based onanalyses of the data
Question• To assess students’ understanding of basic
concepts, pose questions such as the following:- What is the difference between possible
outcomes and the probability of an outcome?- What is the difference in meaning between
combination and permutation?- How does the use of AND and OR in the
context of compound events affect themeaning?
Print Materials
• Applied Mathematics 12 available June 2001• Exploring Advanced Algebra with the TI-83• Exploring Statistics with the TI-82 Graphics
Calculator• Using the TI-81 Graphics Calculator to Explore
Statistics
Software
• Secondary Math Lab Toolkit


RECOMMENDED LEARNING RESOURCESSUGGESTED ASSESSMENT STRATEGIES
69
CURRICULUMEssentials of Mathematics 10

PRESCRIBED LEARNING OUTCOMES SUGGESTED INSTRUCTIONAL STRATEGIES
70

RECOMMENDED LEARNING RESOURCESSUGGESTED ASSESSMENT STRATEGIES
71
ESTIMATED INSTRUCTIONAL TIME
Essentials of Mathematics 10 has been developed assuming that teachers have 100 instructionalhours available to them. The following chart shows the estimated instructional time for eachcurriculum suborganizer, expressed as a percentage of total time available to teach the course.
When delivering the prescribed curriculum, teachers may freely adjust the instructional time to meettheir students’ diverse needs. These estimated instructional times have been recommended by the IRPwriters to assist their colleagues; they are suggestions only.
Organizer (Suborganizer) % of Time
Problem Solving Integrated Throughout
Personal Banking 10 - 15
Wages, Salaries and Expenses 10 - 20
Spreadsheets 10 - 15
Rate, Ratio and Proportion 10 - 15
Trigonometry 10 - 15
Geometry Project 10 - 20
Probability and Sampling 15 - 25
ESSENTIALS OF MATHEMATICS 10
PRESCRIBED LEARNING OUTCOMES SUGGESTED INSTRUCTIONAL STRATEGIES
72
ESSENTIALS OF MATHEMATICS 10 • Problem Solving
It is expected that students will use a variety ofmethods to solve real-life, practical, technical,and theoretical problems
It is expected that students will:
• solve problems that involve a specific contentarea
• solve problems that involve more than onecontent area
• solve problems that involve mathematicswithin other disciplines
• analyse problems and identify the significantelements
• develop specific skills in selecting and usingan appropriate problem-solving strategy orcombination of strategies chosen from, but notrestricted to, the following:- guess and check- look for a pattern- make a systematic list- make and use a drawing or model- eliminate possibilities- work backward- simplify the original problem- develop alternative original approaches- analyse keywords
• demonstrate the ability to work individuallyand co-operatively to solve problems
• determine that their solutions are correct andreasonable
• clearly communicate a solution to a problemand the process used to solve it
• interpret their solutions by describing whatthe solution means within the context of theoriginal problem
• use appropriate technology to assist inproblem solving
Problem solving is a key aspect of any mathematicscourse. Working on problems involving estimation,measurement, and constructing can give students asense of the excitement involved in creative andlogical thinking. It can also help students developtransferable real-life skills and attitudes. Multi-strandand interdisciplinary problems should be includedthroughout Essentials of Mathematics 10.
• Reinforce the concept that “problem solving” ismore than just word problems and includes otheraspects of mathematics than algebra.
• Introduce new types of problems directly tostudents (without demonstration) and play therole of facilitator as they attempt to solve suchproblems.
• Recognize when students use a variety ofapproaches; avoid becoming prescriptive aboutapproaches to problem solving.
• Reiterate that problems might not be solved in onesitting and that “playing around” with theproblem—revisiting it and trying again—issometimes needed.
• Frequently engage small groups of students (threeto five) in co-operative problem solving whenintroducing new types of problems.
• Have students or groups discuss their thoughtprocesses as they attempt a problem. Point out thestrategies inherent in their thinking (e.g., guessand check, look for a pattern, make and use adrawing or model).
• Ask leading questions such as:- What are you being asked to find out?- What do you already know?- Do you need additional information?- Have you ever seen similar problems?- What else can you try?
• Once students have arrived at solutions toparticular problems, encourage them to generalizeor extend the problem situation.
• See Appendix G for examples of multi-strand andinterdisciplinary problems that most studentsshould be able to solve. These types of problemsare indicated with an asterisk (*).
RECOMMENDED LEARNING RESOURCESSUGGESTED ASSESSMENT STRATEGIES
73
ESSENTIALS OF MATHEMATICS 10 • Problem Solving
Students analyse problems and solve them using avariety of approaches. Assessment of problem-solving skills is made over time, based onobservations of many situations.
Observe• Have students present solutions to the class
individually, in pairs, or in small groups. Note theextent to which they clarify their problems andhow succinctly they describe the processes used.
Question• To check the approaches students use when
solving problems, ask questions that prompt themto:- paraphrase or describe the problem in their- own words- explain the processes used to derive an answer- describe alternative methods to solve a problem- relate the strategies used in new situations- link mathematics to other subjects and to the
world of work
Collect• On selected problems, have students annotate
their work to describe the processes they used.Alternatively, have them provide briefdescriptions of what worked and what did notwork as they solved particular problems.
Self-Assessment• Ask students to keep journals to describe the
processes they used in dealing with problems.Have them include descriptions of strategies thatworked and those that did not.
• Develop with students a set of criteria to self-assess problem-solving skills. The reference setEvaluating Problem Solving Across Curriculum maybe helpful in identifying such criteria.
Comprehensive learning resources for this courseare currently under development. As an interimmeasure, schools are encouraged to use theteacher-developed learning resources distributedto schools (student and teacher resources). Pleasenote that the student materials requirephotocopying for student use.
Print Materials
• Problem Solving: What You Do When YouDon’t Know What To Do
Please see the introduction to Appendix B for alist of suggested utility software that supportsthis course.
PRESCRIBED LEARNING OUTCOMES SUGGESTED INSTRUCTIONAL STRATEGIES
74
It is expected that students will prepare bankforms including cheques, deposit slips,chequebook activity record and reconcilationstatements
It is expected that students will:
• name and describe various types of commonlyused consumer bank accounts
• complete various banking forms• describe the use of a bank card for automated
teller machines (ATMs) and debit payments• identify different types of bank service charges
and their relative costs• reconcile financial statements, such as
chequebooks and electronic bank transactionswith bank statements
ESSENTIALS OF MATHEMATICS 10 • Personal Banking
Using the services and facilities of banks, trustcompanies, and credit unions involves important lifeskills. This unit will give students opportunities togain familiarity with many available bankingprocedures and appropriate banking forms.
• Invite a bank employee as a guest speaker to visitthe classroom to talk about basic banking services.Ask the guest speaker to discuss the importance ofusing banking forms correctly and accurately. Heor she could also relate stories of common errorsand their implications.
• Have students complete bank forms, such ascheques and deposit and withdrawal forms.
• Have students update a sample chequebookrecord that includes cheques, deposits,withdrawals, and ATM, Internet, and telephonebanking transactions (e.g., bill payments,transfers).
• Have students complete a statement reconciliationfor a given sample chequebook record andcorresponding bank statement.
• Brainstorm and record a list of typical banktransactions that might occur over the period of amonth. From the list, have students create achequebook record and corresponding bankstatement and statement reconciliation.
• Have students work in pairs to create a poster thatshows the interrelationship of chequebooks,activity records, bank statements, andreconciliation documents.

RECOMMENDED LEARNING RESOURCESSUGGESTED ASSESSMENT STRATEGIES
75
ESSENTIALS OF MATHEMATICS 10 • Personal Banking
Being able to use bank forms correctly and knowingcurrent chequing account balances are valuable skills.Assessment should focus on students’ completion ofvarious bank forms, noting the extent to which theypay attention to the details. Look for evidence ofstudents’ ability to effectively use and reconcile bankstatements.
Observe• As students complete forms, pay close attention to
the completion of pertinent parts such as lastname, date, and the listing of individual chequeson deposit slips.
• While students complete chequebook activityrecords, note the extent to which they are able toplace items in the correct places. Also payattention to students’ ability to carry a runningtotal.
Collect• Collect students’ individual best examples of each
of the following:- cheque- deposit slip- chequebook activity record- reconciliation formLook for clarity, accuracy, and completeness.
Question• Ask students to explain the benefits of accuracy
and completeness when completing bankdocuments.
Self-Assessment• Place examples of correctly completed bank forms
in the classroom and encourage students tocompare their work to the examples. Ask studentsto comment on any differences they observe (e.g.,short forms of dates).
Comprehensive learning resources for this courseare currently under development. As an interimmeasure, schools are encouraged to use theteacher-developed learning resources distributedto schools (student and teacher resources). Pleasenote that the student materials requirephotocopying for student use.
Video
• The ABC’s of Personal Finance

PRESCRIBED LEARNING OUTCOMES SUGGESTED INSTRUCTIONAL STRATEGIES
76
ESSENTIALS OF MATHEMATICS 10 • Wages, Salaries and Expenses
It is expected that students will solve problemsinvolving wage, salaries and expenses
It is expected that students will:
• calculate hours worked and gross pay• calculate net income using deduction tables
(focus on weekly) with different pay periods• calculate changes in income• develop a budget that matches predicted
income
This unit may be immediately applicable for studentsholding part-time jobs. The ability to calculate grosspay, net pay, and percentage changes in income areimportant skills for everyone.
• Provide students with a range of hourly pay ratesthat they might expect to earn upon reaching theireducational goals. Have them calculate monthlygross pay for several of the given rates.
• Ask students to list ways in which their incomesmight change and to show how the changeswould affect their monthly gross pay.
• Have students select two monthly incomes, onehigher and one lower, then use deduction tables tofind the take-home pay for each income level.
• Using newspaper classified ads for data on rent orleasing costs, have student produce appropriatemonthly and/or yearly budgets for a variety ofincomes.
• Set up a mock payroll for students, giving eachstudent a weekly wage. Charge weekly expensesfor missed time, desk rental, calculator or otherequipment rental, and services such as sharpeningpencils. Have students look up payroll deductions(i.e., taxes, EI, CPP) in tables to determine their netpay. Students record gross pay, deductioncalculations, and net pay in deposit books.Students write “cheques” for the weekly expenses,deducting the cheque amount from theircumulative pay totals. At appropriate intervals,give students a pay raise and have them calculatethe percentage increase in dollars.

RECOMMENDED LEARNING RESOURCESSUGGESTED ASSESSMENT STRATEGIES
77
ESSENTIALS OF MATHEMATICS 10 • Wages, Salaries and Expenses
Understanding how income and expenses are used todevelop budgets is a key life skill. Assessment shouldfocus on students’ understanding of the entireprocess.
Observe• Have students present a budget and note to what
extent they are able to:- justify the inclusion of budget items (expenses)- describe how they went about selecting the
appropriate weighting of the items- present their data
• As students work on their net pay, note to whatextent they- choose the appropriate table- accurately subtract the deductions from the
gross pay- present their data
Collect• On selected problems, have students explain by
annotation how they filled in given tables.• Collect student deposit books and check for
accuracy, neatness, and completeness.
Self Assessment• Provide a pay stub which included deductions
and have students comment on whetherdeduction calculations are reasonable.
Comprehensive learning resources for this courseare currently under development. As an interimmeasure, schools are encouraged to use theteacher-developed learning resources distributedto schools (student and teacher resources). Pleasenote that the student materials requirephotocopying for student use.
Software
• Green Globs & Graphing Equations
PRESCRIBED LEARNING OUTCOMES SUGGESTED INSTRUCTIONAL STRATEGIES
78
ESSENTIALS OF MATHEMATICS 10 • Spreadsheets
It is expected that students will design and use aspreadsheet to make and justify decisions
It is expected that students will:
• create a spreadsheet using various formattingoptions
• use a spreadsheet template to solve problems• create a spreadsheet using formulas and
functions• use a spreadsheet to answer “what-if”
questions• identify where spreadsheets could be
effectively used
This unit is intended to introduce students to the“how” and “what-if” questions that spreadsheetsmay be used to answer. Students should be able touse pre-existing spreadsheets such as loan analysers.Students will also learn to create simple spreadsheetsand analyse their usefulness.
• Give students a simple spreadsheet template, suchas one that lists length and width of a rectangleand calculates area. Have students add a columnthat calculates perimeter. Show students how tomake the value appear as a rounded number.Modify the spreadsheet and demonstrate how itcould be used to calculate the cost of carpet givena unit price or baseboard quantity for arectangular room. Ask students how thecalculations would change if hardwood flooringwere installed. Have them insert an appropriatenew unit price and find the new costs.
• Ask students to brainstorm real-life circumstanceswhere spreadsheets would be useful (e.g.,budgets, tracking investments).
• Demonstrate how a spreadsheet might be used inthe following circumstances:- pricing items in a store given wholesale cost- producing a household budget- tracking statistics on a sports team
• Give students a spreadsheet template to calculateweekly wages and EI, CPP, and taxes payable.Have them enter the appropriate data andcomplete the calculations.
• Have students use a spreadsheet to keep track oftheir marks for a set period of time.
RECOMMENDED LEARNING RESOURCESSUGGESTED ASSESSMENT STRATEGIES
79
ESSENTIALS OF MATHEMATICS 10 • Spreadsheets
Assessment in this section should focus on studentsunderstanding of when spreadsheets are anappropriate tool to use, as well as theirunderstanding of how to create and applyspreadsheets.
Observe• Watch students as they create or use spreadsheets.
Note the extent to which they are able to:- grasp how cells are filled using simple formulas- insert columns or rows- change values of cells- copy information from cell to cell- format the spreadsheet for better presentation
Collect• Using selected print copies of student generated
spreadsheets have students show how the cellvalues were obtained.
Peer Assessment• Have peers access other students’ spreadsheet
solutions to individual problem. Have them sharecomments such as whether the answers makesense.
Self Assessment• Have individual students:
- describe benefits of using spreadsheets- brainstorm other uses for spreadsheets
Comprehensive learning resources for this courseare currently under development. As an interimmeasure, schools are encouraged to use theteacher-developed learning resources distributedto schools (student and teacher resources). Pleasenote that the student materials requirephotocopying for student use.
Software
• Hot Dog Stand: The Works• Math Tools

PRESCRIBED LEARNING OUTCOMES SUGGESTED INSTRUCTIONAL STRATEGIES
80
ESSENTIALS OF MATHEMATICS 10 • Rates, Ratio and Proportion
It is expected that students will apply theconcepts of rate, ratio and proportion to solveproblems
It is expected that students will:
• use the concept of unit rate to determine thebest buy on a consumer item and justify thedecision
• solve problems on the application of sales taxin Canada
• describe a variety of sales promotiontechniques and their financial implications forthe consumer
• solve rate, ratio, and proportion problemsinvolving length, area, volume, time, mass,and rates derived from these
The ability to make financial decisions based oncalculations of unit rate, percent taxes, and discounts,and to calculate rates such as fuel consumption areimportant real-life skills.
• Have students, using information in groceryflyers, calculate unit prices and make pricecomparisons in order to identify the best buy.
• Brainstorm items that students would beinterested in purchasing. Have students choose anitem from the list and collect advertising data onprices and features. Have them select what theybelieve is the best deal offered and justify theirdecision. Ask them to calculate the actual cost ofthe item, including sales tax. Using a given valuefor hourly take-home pay, students find thenumber of hours they would need to work to earnenough money to buy the item.
• Ask students to select a retail item to purchase(e.g., mountain bike, snowboard). Based on areasonable hourly rate of pay, ask them tocalculate, taking deductions into account, howmany hours they would have to work to purchasethe item.
• Using a recipe for waffles for four people, guidestudents in determining the amounts ofingredients that would be needed to make wafflesfor 20 people.
RECOMMENDED LEARNING RESOURCESSUGGESTED ASSESSMENT STRATEGIES
81
ESSENTIALS OF MATHEMATICS 10 • Rates, Ratio and Proportion
As rate, ratio, and proportion are often difficultconcepts, assessment should focus on students’abilities to apply appropriate strategies to solveproblems.
Observe• As students work in pairs on problems, observe
the extent to which they show their understandingthrough their discussions on how to proceed tosolve them.
Collect• Have students make a poster showing a chart
indicates the varying number of servings forwaffles and the resulting changes in ingredientamounts.
Self Assessment• Develop with students methods for testing their
solutions by applying common sense, estimationand reasoning.
Peer Assessment• Have students solve problems, showing all their
work. Ask them to exchange solutions and usekeys to mark each other’s work. Students canidentify the errors in their peers’ solutions andexplain the errors and how to fix them.
Discussion• Provide a list of problems and ask students to
identify which of them can be solved using rate,ratio, and/or proportion strategies.
Comprehensive learning resources for this courseare currently under development. As an interimmeasure, schools are encouraged to use theteacher-developed learning resources distributedto schools (student and teacher resources). Pleasenote that the student materials requirephotocopying for student use.
Software
• Hot Dog Stand: The Works

PRESCRIBED LEARNING OUTCOMES SUGGESTED INSTRUCTIONAL STRATEGIES
82
ESSENTIALS OF MATHEMATICS 10 • Trigonometry
It is expected that students will demonstrate anunderstanding of ratio and proportion and applythese concepts in solving triangles
It is expected that students will:
• apply ratio and proportion in similar triangles• use the trigonometric ratios sine, cosine, and
tangent in solving right triangles
The study of trigonometry, starting with similartriangles, enables students to solve many ratio,proportion, and distance problems as well asproblems that require determining the lengths ofsides of triangles and the measure of unknownangles. These skills are particularly useful forconstruction trades such as carpentry.
Similar Triangles• Have students draw (possibly using dynamic
geometry software) a triangle in which two of theangles are between 10° and 60°. Ask them to:- avoid using a 30°-60°-90° triangle- draw the base horizontally- label the base a, and the sides b and c
(clockwise)- label the corresponding angles A, B, and CHave them draw a second triangle larger than thefirst, where the angles of the new triangle areequal to the angles of the previous triangle, andlabel the new triangle a’, b’, and c’. Have studentsdraw a line segment, perpendicular to the bases,that ends at A and A’, and label it D.
• Have students fill in a data table comparing allaspects of the two triangles; the measures of theangles, ratio of corresponding angles, lengths ofthe sides and their corresponding ratios, and theratio of the areas of the two triangles. Ask them todraw conclusions about the relationships betweenthe two triangles.
Trigonometry• Have students use calculators or tables to find
sine, cosine, and tangent for angles from 5° to 85°in 5° jumps. Have them compare the values fromtheir previous tables for the 30° and 60° measures.Point out that the ratios of the lengths of the sidesare what make up the values found intrigonometry tables or calculators.
• Demonstrate how to find the length of anunknown side (when given an angle and thelength of one side) using derivations of the basictrigonometry formulas.
• Have students solve problems in real-worldcontexts that illustrate how knowledge of similartriangles and solving right triangles are usefulskills (e.g., simple navigation problems,calculating inaccessible measurements such as thewidth of a river).
RECOMMENDED LEARNING RESOURCESSUGGESTED ASSESSMENT STRATEGIES
83
ESSENTIALS OF MATHEMATICS 10 • Trigonometry
Assessment focuses on students’ understanding ofthe basic properties of similar triangles andapplications of their properties. Assessment ofstudents’ comprehension of trigonometry shouldfocus on their ability to use sine, cosine, and tangentto solve simple right triangle problems.
Observe• Review students’ work as they draw, label, and
measure the components of right triangles. Notetheir ability to label correctly and use protractor,calculator, and trigonometry table (or drawingutility) effectively. Look for proper use andfunction of calculators.
Question• Ask students to explain or demonstrate the
processes they used to solve similar trianglequestions. Note the extent to which they are ableto describe the ratios involved and theirusefulness.
Collect• Have students create tables of values that relate
the lengths of sides of right triangles to angles fortriangles they have drawn. Evaluate students’ability to find unknown lengths and angles usingdirect measure and to calculate using the basictrigonometry identities.
• Collect students’ solutions to problems involvingright triangles. Assess to what extent students areable to justify their answers.
• Ask students to solve right triangle problems andnote the extent to which they are able to draw,label, and show the calculations leading to theiranswers.
Self Assessment• Have students develop a study guide to solving
problems using similar triangle ratios ortrigonometry. Ask students to describe when andhow to use the information in the guide (e.g.,when to use sine or cosine when solvingproblems). Ask them to describe strategies thatworked as well as those that did not.
Comprehensive learning resources for this courseare currently under development. As an interimmeasure, schools are encouraged to use theteacher-developed learning resources distributedto schools (student and teacher resources). Pleasenote that the student materials requirephotocopying for student use.
Print Materials
• Exploring Trigonometry with the Geometer’sSketchpad
Software
• The Geometer’s Sketchpad

PRESCRIBED LEARNING OUTCOMES SUGGESTED INSTRUCTIONAL STRATEGIES
84
ESSENTIALS OF MATHEMATICS 10 • Geometry Project
It is expected that students will complete aproject that includes a 2-D plan and a 3-D modelof some physical structure
It is expected that students will:
• measure lengths using both SI Metric andImperial units
• estimate measurements of objects in SI andImperial systems including:- length- area- volume- mass
• draw top, front and side views for both 3-Drod or block objects and their sketches
• sketch and build 3-D designs using isometricdot paper
• determine the relationships among linear scalefactors, areas, surface areas, and volumes ofsimilar figures and objects
• enlarge or reduce a dimensioned objectaccording to a specified scale
• solve problems involving linear dimensions,area, and volume
• interpret drawings and use the information tosolve problems
• complete a project that includes a 2-D planand a 3-D model of some physical structure
The ability to make sense of 2-D and 3-D scalerepresentations is an important skill for solvingconstruction problems. Study of geometry givesstudents opportunities to acquire a sense ofproportion and shape.
• Provide students with a 3-D model using straightlines, and ask students to produce top, front, andside views in 1:1 scale.
• Ask students to produce a 2:1 and a 1:2 version ofthe same view.
• Using examples of simple 3-D objects, askstudents to produce 2-D representations to asimple scale.
• Ask students to find the surface areas andvolumes of several objects (e.g., cuisinaire rods,dice, shoebox, blocks).
• Provide drawings of simple 3-D objects, and askstudents to build models of the objects usingblocks. Have them solve for missingmeasurements, either directly or by calculation.
• Provide students with the dimensions of a heliumor hot-air balloon (e.g., the Hindenberg) and havethem calculate the volume of gas needed to inflateit (volume).
• Provide students with the dimensions of a locallandmark (e.g., the HR MacMillan Planetarium)and ask them to calculate the volume of paint thatwould be needed to cover it (surface area).
• Ask students to calculate the length of fencing(perimeter) that would be required to surround awell-known structure (e.g., Stonehenge), if thefence remains exactly 75m away from the outerperimeter of the structure.

RECOMMENDED LEARNING RESOURCESSUGGESTED ASSESSMENT STRATEGIES
85
ESSENTIALS OF MATHEMATICS 10 • Geometry Project
Being able to measure using instruments andmodeling 2-D and 3-D objects is fundamental toapplying mathematics practically. Students should beable to devise a plan to construct a 3-D object.
Observe• Notice how students are able to grasp the concept
of scale. Use simple 3-D objects such as smallblocks or toys to observe if students areunderstanding view point and scale.
Collect• Have students create a 3-D model from given
plans. Use materials such as firm cardboard, wax,soap or modeling clay. Use a rubric to assess howwell the students meet the criteria previouslyidentified for spatial understanding.
Question• Ask students to comment on advantages and
difficulties of working with scale models and noteto what extent they are able to list them. Ask themto describe how they overcame difficulties.
Self-Assessment• Ask students to estimate and record how far they
can throw an object. Then have students completethe activity and measure the distance. Repeat thisactivity with golf clubs and balls, hockey pucks,and empty boxes. Have students examine theirrecording and notice how the measurements arebecoming more closely aligned.
Comprehensive learning resources for this courseare currently under development. As an interimmeasure, schools are encouraged to use theteacher-developed learning resources distributedto schools (student and teacher resources). Pleasenote that the student materials requirephotocopying for student use.
Software
• 3-D Images• Math Tools

PRESCRIBED LEARNING OUTCOMES SUGGESTED INSTRUCTIONAL STRATEGIES
86
ESSENTIALS OF MATHEMATICS 10 • Probability and Sampling
It is expected that students will develop andimplement a plan for the collection, display andanalysis of data using technology as required
It is expected that students will:
• read and interpret graphs• discuss how collected data are affected by the
nature of the sample, the method of collection,the sample size and biases
• describe issues to be considered whencollecting data (e.g., appropriate language,ethics, cost, privacy, cultural sensitivity)
• select, defend and use appropriate methods ofcollecting data:- designing and using questionnaires- interviews- experiments- research
• determine and use measures of centraltendency to support decisions
• use sample data to make predictions anddecisions
• use suitable graph types to display data (byhand or using technology)
• critique ways in which statistical informationand conclusions are presented by the mediaand other sources
In everyday life, we are frequently faced withimportant information that is survey-based and/orgraphically presented. This unit gives studentsopportunities to select appropriate methods of datacollection and to read, interpret, and analyse thevalidity of data presentations.
• Lead a class discussion on ethics of data collectionand reporting of results, including experimentaldesign and questionnaire design. Ensure thatdiscussion is centered on issues of appropriatelanguage, privacy, and cultural sensitivity.
• Have students create a survey for a restaurantowner who wants to offer three flavours of icecream in an area that serves high school students.Ask students to decide which ice cream flavours toinclude in the survey and to choose a method forcollecting and ranking the data.
• Students design a survey on an issue that intereststhem, drawing their sample from the school orcommunity at large. Have students justify theirsurvey content and sampling method. Askstudents to draw valid, non-trivial conclusionsfrom their data.

RECOMMENDED LEARNING RESOURCESSUGGESTED ASSESSMENT STRATEGIES
87
ESSENTIALS OF MATHEMATICS 10 • Probability and Sampling
Assessment should focus on students’ ability toidentify poor sampling techniques and to improvethem. Students’ work should also be assessed onappropriate choice of sampling technique.
Collect• Ask students to collect data and draw conclusions
from that data. Note the extent to which studentsare able to justify their conclusions.
Question• Ask students to examine and comment on surveys
provided by the teacher. Ask students to describehow they might be improved both in terms of datagathering and data analysis.
Peer Assessment• Have students in small groups create and
complete a simple survey. Have them report theirresults to the class. Ask the class to criticize theirpresentations.
• Have students design and conduct researchprojects requiring them to choose and applysampling techniques. As students work on theirprojects, ask questions such as:- How did you choose your sampling technique?- Can you justify your choice?- Can you identify possible sources of bias or
error in your sample?- When might someone want to bias a sample
and how might they do it?- What makes the graphical representations you
are using appropriate for your data?- How are your conclusions affected by your
sample?
Comprehensive learning resources for this courseare currently under development. As an interimmeasure, schools are encouraged to use theteacher-developed learning resources distributedto schools (student and teacher resources). Pleasenote that the student materials requirephotocopying for student use.
Print Materials
• Problem Solving: What You Do When YouDon’t Know What To Do
• Triple ‘A’ Mathematics Program: DataManagement & Probability
Software
• Math Tools• Probability Constructor
Games/Manipulatives
• D.I.M.E. Probability Pack A• D.I.M.E. Probability Pack B


RECOMMENDED LEARNING RESOURCESSUGGESTED ASSESSMENT STRATEGIES
89
CURRICULUMEssentials of Mathematics 11

PRESCRIBED LEARNING OUTCOMES SUGGESTED INSTRUCTIONAL STRATEGIES
90
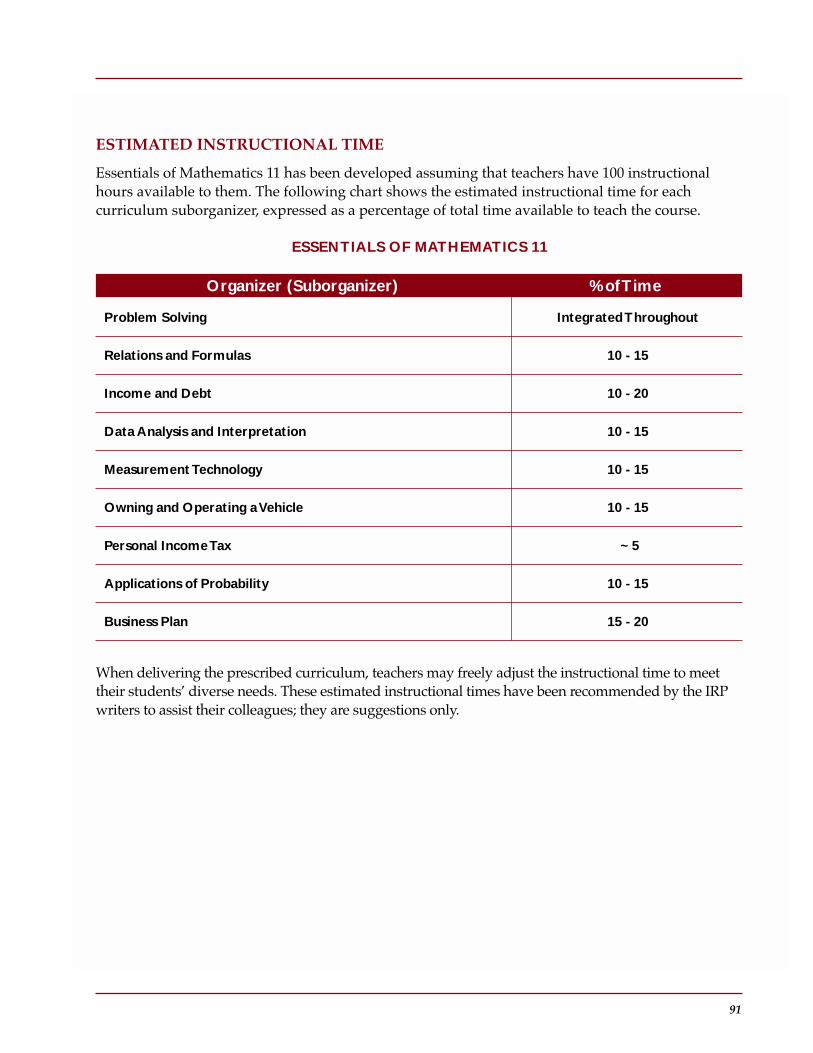
RECOMMENDED LEARNING RESOURCESSUGGESTED ASSESSMENT STRATEGIES
91
ESTIMATED INSTRUCTIONAL TIME
Essentials of Mathematics 11 has been developed assuming that teachers have 100 instructionalhours available to them. The following chart shows the estimated instructional time for eachcurriculum suborganizer, expressed as a percentage of total time available to teach the course.
When delivering the prescribed curriculum, teachers may freely adjust the instructional time to meettheir students’ diverse needs. These estimated instructional times have been recommended by the IRPwriters to assist their colleagues; they are suggestions only.
Organizer (Suborganizer) % of Time
Problem Solving Integrated Throughout
Relations and Formulas 10 - 15
Income and Debt 10 - 20
Data Analysis and Interpretation 10 - 15
Measurement Technology 10 - 15
Owning and Operating a Vehicle 10 - 15
Personal Income Tax ~ 5
Applications of Probability 10 - 15
Business Plan 15 - 20
ESSENTIALS OF MATHEMATICS 11

PRESCRIBED LEARNING OUTCOMES SUGGESTED INSTRUCTIONAL STRATEGIES
92
It is expected that students will use a variety ofmethods to solve real-life, practical, technical,and theoretical problems
It is expected that students will:
• solve problems that involve a specific contentarea
• solve problems that involve more than onecontent area
• solve problems that involve mathematicswithin other disciplines
• analyse problems and identify the significantelements
• develop specific skills in selecting and usingan appropriate problem-solving strategy orcombination of strategies chosen from, but notrestricted to, the following:- guess and check- look for a pattern- make a systematic list- make and use a drawing or model- eliminate possibilities- work backward- simplify the original problem- develop alternative original approaches- analyse keywords
• demonstrate the ability to work individuallyand co-operatively to solve problems
• determine that their solutions are correct andreasonable
• clearly communicate a solution to a problemand the process used to solve it
• interpret their solutions by describing whatthe solution means within the context of theoriginal problem
• use appropriate technology to assist inproblem solving
Problem solving is a key aspect of any mathematicscourse. Working on problems involving estimation,analysis, and measurement can give students a senseof the excitement involved in creative and logicalthinking. It can also help students developtransferable real-life skills and attitudes. Multi-strandand interdisciplinary problems should be includedthroughout Essentials of Mathematics 11
• Reinforce the concept that “problem solving” ismore than just word problems and includes otheraspects of mathematics than algebra.
• Introduce new types of problems directly tostudents (without demonstration) and play therole of facilitator as they attempt to solve suchproblems.
• Recognize when students use a variety ofapproaches; avoid becoming prescriptive aboutapproaches to problem solving.
• Reiterate that problems might not be solved in onesitting and that “playing around” with theproblem—revisiting it and trying again—issometimes needed.
• Frequently engage small groups of students (threeto five) in co-operative problem solving whenintroducing new types of problems.
• Have students or groups discuss their thoughtprocesses as they attempt a problem. Point out thestrategies inherent in their thinking (e.g., guessand check, look for a pattern, make and use adrawing or model).
• Ask leading questions such as:- What are you being asked to find out?- What do you already know?- Do you need additional information?- Have you ever seen similar problems?- What else can you try?
• Once students have arrived at solutions toparticular problems, encourage them to generalizeor extend the problem situation.
• See Appendix G for examples of multi-strand andinterdisciplinary problems that most studentsshould be able to solve. These types of problemsare indicated with an asterisk (*).
ESSENTIALS OF MATHEMATICS 11 • Problem Solving
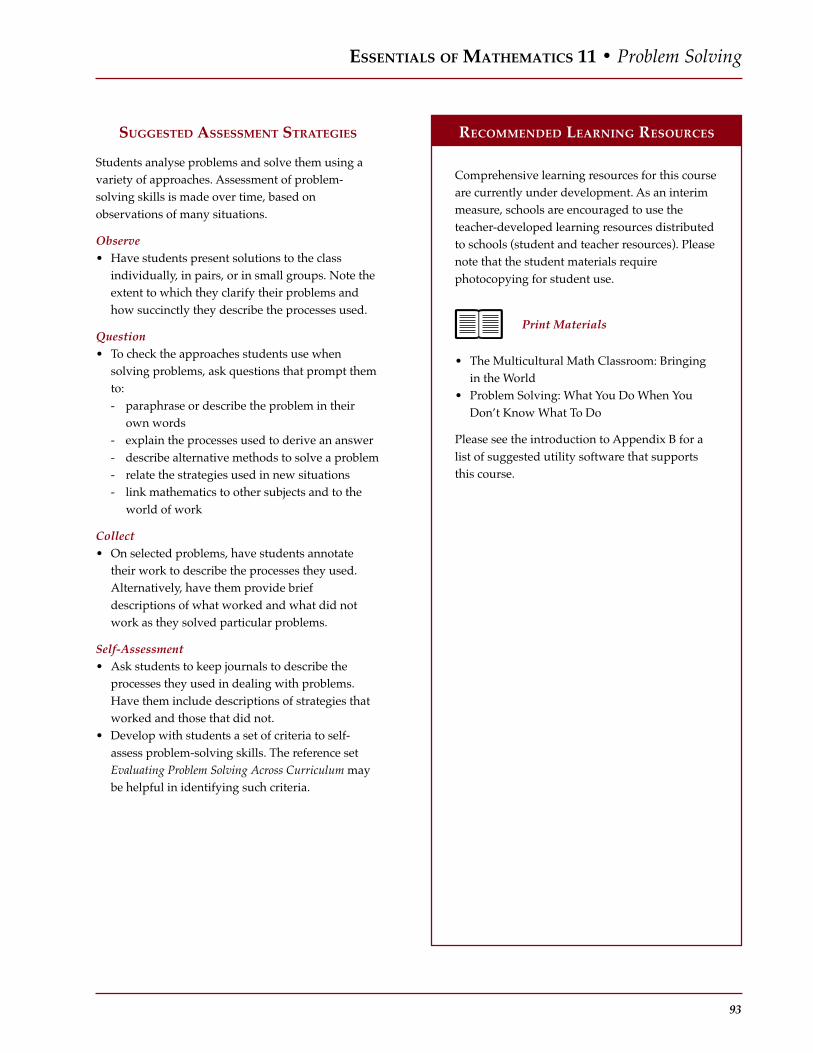
RECOMMENDED LEARNING RESOURCESSUGGESTED ASSESSMENT STRATEGIES
93
Students analyse problems and solve them using avariety of approaches. Assessment of problem-solving skills is made over time, based onobservations of many situations.
Observe• Have students present solutions to the class
individually, in pairs, or in small groups. Note theextent to which they clarify their problems andhow succinctly they describe the processes used.
Question• To check the approaches students use when
solving problems, ask questions that prompt themto:- paraphrase or describe the problem in their
own words- explain the processes used to derive an answer- describe alternative methods to solve a problem- relate the strategies used in new situations- link mathematics to other subjects and to the
world of work
Collect• On selected problems, have students annotate
their work to describe the processes they used.Alternatively, have them provide briefdescriptions of what worked and what did notwork as they solved particular problems.
Self-Assessment• Ask students to keep journals to describe the
processes they used in dealing with problems.Have them include descriptions of strategies thatworked and those that did not.
• Develop with students a set of criteria to self-assess problem-solving skills. The reference setEvaluating Problem Solving Across Curriculum maybe helpful in identifying such criteria.
Comprehensive learning resources for this courseare currently under development. As an interimmeasure, schools are encouraged to use theteacher-developed learning resources distributedto schools (student and teacher resources). Pleasenote that the student materials requirephotocopying for student use.
Print Materials
• The Multicultural Math Classroom: Bringingin the World
• Problem Solving: What You Do When YouDon’t Know What To Do
Please see the introduction to Appendix B for alist of suggested utility software that supportsthis course.
ESSENTIALS OF MATHEMATICS 11 • Problem Solving

PRESCRIBED LEARNING OUTCOMES SUGGESTED INSTRUCTIONAL STRATEGIES
94
ESSENTIALS OF MATHEMATICS 11 • Relations and Formulas
It is expected that students will represent andinterpret relations in a variety of contexts
It is expected that students will:
• express a linear relation of the form y = mx + b- in words- as a formula- with a table of values- as a graph
• interpolate and extrapolate values from thegraph of a linear relation
• determine the slope of a linear relation anddescribe it in words and interpret its meaningin a problem context
• interpret the graph of a relation and describe itin words
• construct a graph of a relation from itsdescription in words
• evaluate formulas
Using graphs of linear relations to represent real-lifesituations, and interpreting graphs of relations arekey components of many problem solving situations.It is important for students to be able to makeappropriate conclusions and interpretations based ongraphical data.
• Provide students with graphs showing the wagesearned versus hours worked for jobs typically heldby young temporary workers (e.g., cashier, server).Ask students the following questions:- What is the hourly wage?- Can the wages earned be predicted for a point
off the graph?- How would the graph change if a raise were
incorporated into the hourly wage?- What type of job would result in wages earned
for 0 hours of work?• Have students research in newspapers, trade
reports, and the Internet to collect tables of datafor graphing. Ask them to define the variables,determine the appropriate scaling of axes, plot thedata, and draw conclusions. Then have studentsidentify the linear relationships, identify the slopeand y-intercepts, and develop equations todescribe the relations.
• Give pairs of students two sets of data showingthe relationship between two different basesalaries and two different rates of commission.One partner graphs the first set of data, and theother graphs the second. Have students discusstheir graphs in relation to slope and y-intercepts.Ask them to generate an equation for each graphto predict each income for a given value of sales.Ask students:- What effect will the change in commission rate
have on the graph and equation?- Can you suggest other applications for this type
of relationship?• Have one group of students find car rental
advertisements in newspapers or magazines, andgraph the costs of renting a vehicle for one day forseveral distances. Have another group predict thecosts of renting the same vehicle driven for longerdistances or for distances in between the plottedpoints.
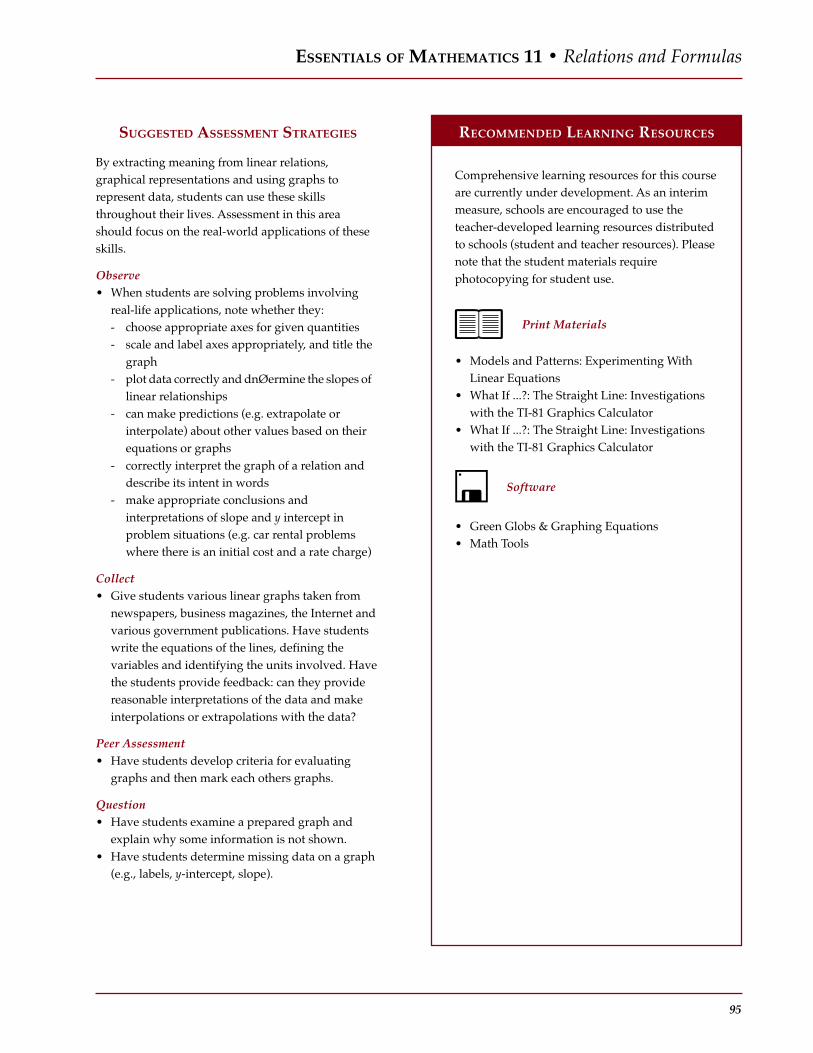
RECOMMENDED LEARNING RESOURCESSUGGESTED ASSESSMENT STRATEGIES
95
ESSENTIALS OF MATHEMATICS 11 • Relations and Formulas
By extracting meaning from linear relations,graphical representations and using graphs torepresent data, students can use these skillsthroughout their lives. Assessment in this areashould focus on the real-world applications of theseskills.
Observe• When students are solving problems involving
real-life applications, note whether they:- choose appropriate axes for given quantities- scale and label axes appropriately, and title the
graph- plot data correctly and dnØermine the slopes of
linear relationships- can make predictions (e.g. extrapolate or
interpolate) about other values based on theirequations or graphs
- correctly interpret the graph of a relation anddescribe its intent in words
- make appropriate conclusions andinterpretations of slope and y intercept inproblem situations (e.g. car rental problemswhere there is an initial cost and a rate charge)
Collect• Give students various linear graphs taken from
newspapers, business magazines, the Internet andvarious government publications. Have studentswrite the equations of the lines, defining thevariables and identifying the units involved. Havethe students provide feedback: can they providereasonable interpretations of the data and makeinterpolations or extrapolations with the data?
Peer Assessment• Have students develop criteria for evaluating
graphs and then mark each others graphs.
Question• Have students examine a prepared graph and
explain why some information is not shown.• Have students determine missing data on a graph
(e.g., labels, y-intercept, slope).
Comprehensive learning resources for this courseare currently under development. As an interimmeasure, schools are encouraged to use theteacher-developed learning resources distributedto schools (student and teacher resources). Pleasenote that the student materials requirephotocopying for student use.
Print Materials
• Models and Patterns: Experimenting WithLinear Equations
• What If ...?: The Straight Line: Investigationswith the TI-81 Graphics Calculator
• What If ...?: The Straight Line: Investigationswith the TI-81 Graphics Calculator
Software
• Green Globs & Graphing Equations• Math Tools

PRESCRIBED LEARNING OUTCOMES SUGGESTED INSTRUCTIONAL STRATEGIES
96
ESSENTIALS OF MATHEMATICS 11 • Income and Debt
It is expected that students will demonstrate anawareness of selected forms of personalincome and debt
It is expected that students will:
• solve problems involving performance-basedincome, including commission sales, piecework, and salary plus commission
• use simple and compound interestcalculations to solve problems
• solve consumer problems involving:- credit cards- exchange rates- personal loans
The ability to use skills involved in moneymanagement is needed throughout a person’slifetime. An understanding of procedures andapplications of mathematics can help students makereasonable economic decisions.
• Invite a guest speaker (e.g., accountant, banker,financial planner) to address topics related tocredit and borrowing. Students should preparequestions to focus on the underlying mathematicsinvolved.
• Have students research and compare credit cardsfor interest rates charged and beneficial features(e.g., frequent-flyer miles or points, dividends, lowinterest rates, purchase insurance).
• Have students use examples of credit cardstatements to calculate interest owed and balanceforward for a variety of scenarios, includingpartial payment and late payment of amountowing.
• Provide students with descriptions of variousemployment situations (e.g., pension plans, benefitplans, salaries and/or wages, taxes) and havethem determine the effects of deductions on grosspay.
• Provide students with descriptions of variousfinancial situations (e.g., inheritance in trust,retirement plans, appreciating assets, a firstvehicle purchase). Have students use tables,calculators, and computer spreadsheets tocompare the effects of various rates ofcompounding interest on personal investments orloans for each situation.
• Ask students to use information collected fromadvertisements to compare the cost of paying cashfor an item to the cost of buying on a variety ofcredit plans.

RECOMMENDED LEARNING RESOURCESSUGGESTED ASSESSMENT STRATEGIES
97
ESSENTIALS OF MATHEMATICS 11 • Income and Debt
Earning, spending, and saving money are importantlife skills. To assess students’ thinking and thestrategies they are using, note their abilities toestimate, predict, calculate, make financial decisions,and verify the reasonableness of their conclusions.
Observe• As students work on problems involving income
and debt, observe their abilities to:- compare various pay scenarios using graphs
and explain the advantages and disadvantagesof straight wages, commission, salary, orgraduated commissions
- explain the advantages and disadvantages ofusing credit cards, installment plans, and bankloans (e.g., monthly payments, interestpayments, principal)
• Observe how students perform basic calculationsmanually, and how effectively they use availabletechnology to solve problems involving simpleand compound interest. Use these observations todetermine what types of learning experienceswould benefit them (e.g. review sheets, re-teaching, peer teaching).
Question• Ask each student to write a report summarizing
the visit of a bank or financial institutionemployee. Review each report, looking forevidence that the student is able to:- identify all facets of the job- give information about the use of technology in
the industry- generate a list of educational requirements- identify personal attributes and required skills
for workers in the field
Collect• Review written work for evidence of students’
ability to explain the relative advantages of wage-earning options and incentives offered by theemployer for each wage earning option.
• Have students complete loan applications.• Review written work for evidence of students’
abilities to explain the advantages anddisadvantages of using credit cards and debitcards.
Comprehensive learning resources for this courseare currently under development. As an interimmeasure, schools are encouraged to use theteacher-developed learning resources distributedto schools (student and teacher resources). Pleasenote that the student materials requirephotocopying for student use.
Print Materials
• Math Projects: Organization, Implementation,and Assessment
Video
• The ABC’s of Personal Finance
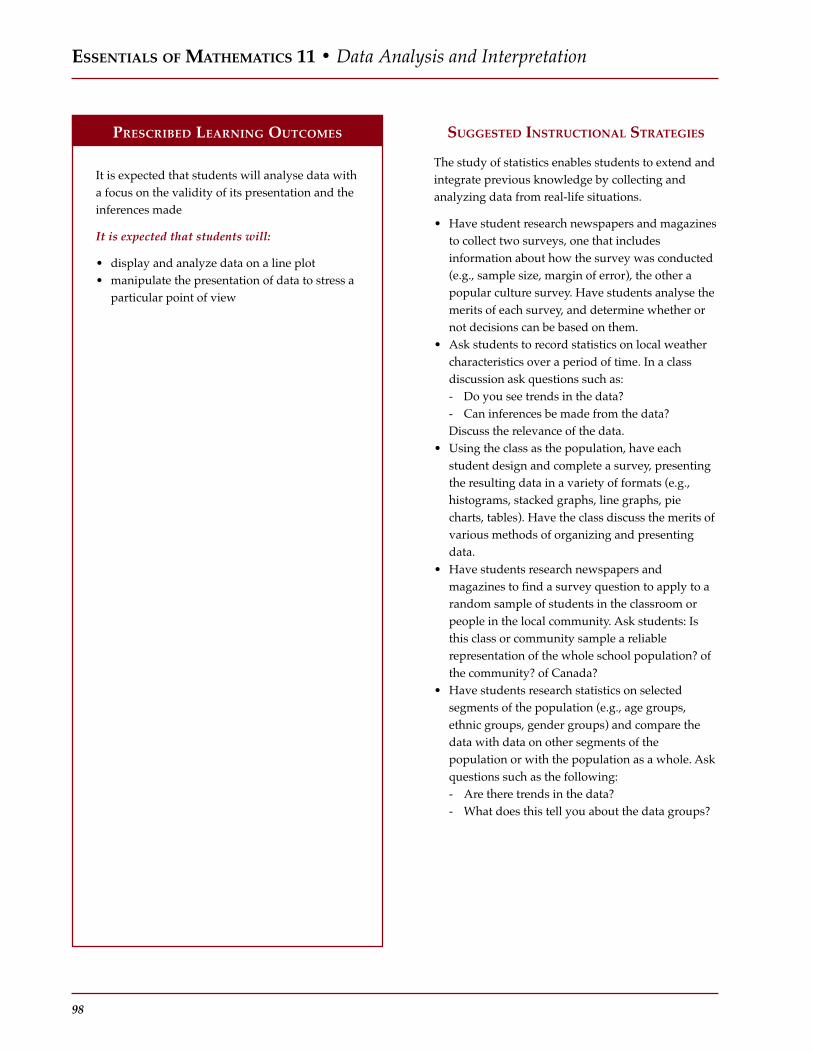
PRESCRIBED LEARNING OUTCOMES SUGGESTED INSTRUCTIONAL STRATEGIES
98
ESSENTIALS OF MATHEMATICS 11 • Data Analysis and Interpretation
It is expected that students will analyse data witha focus on the validity of its presentation and theinferences made
It is expected that students will:
• display and analyze data on a line plot• manipulate the presentation of data to stress a
particular point of view
The study of statistics enables students to extend andintegrate previous knowledge by collecting andanalyzing data from real-life situations.
• Have student research newspapers and magazinesto collect two surveys, one that includesinformation about how the survey was conducted(e.g., sample size, margin of error), the other apopular culture survey. Have students analyse themerits of each survey, and determine whether ornot decisions can be based on them.
• Ask students to record statistics on local weathercharacteristics over a period of time. In a classdiscussion ask questions such as:- Do you see trends in the data?- Can inferences be made from the data?Discuss the relevance of the data.
• Using the class as the population, have eachstudent design and complete a survey, presentingthe resulting data in a variety of formats (e.g.,histograms, stacked graphs, line graphs, piecharts, tables). Have the class discuss the merits ofvarious methods of organizing and presentingdata.
• Have students research newspapers andmagazines to find a survey question to apply to arandom sample of students in the classroom orpeople in the local community. Ask students: Isthis class or community sample a reliablerepresentation of the whole school population? ofthe community? of Canada?
• Have students research statistics on selectedsegments of the population (e.g., age groups,ethnic groups, gender groups) and compare thedata with data on other segments of thepopulation or with the population as a whole. Askquestions such as the following:- Are there trends in the data?- What does this tell you about the data groups?

RECOMMENDED LEARNING RESOURCESSUGGESTED ASSESSMENT STRATEGIES
99
ESSENTIALS OF MATHEMATICS 11 • Data Analysis and Interpretation
Working with statistics allows students todemonstrate their understanding of the practicalapplications of mathematics. As students conductdata-analysis activities, teachers have an opportunityto observe the processes students use to organize andsummarize data and to make predictions.
Observe• While students are working with data, circulate,
ask questions, observe, and check to see howeffectively they are able to:- design and collect data from simple surveys- represent data effectively using tables, charts,
plots, and graphs- make predictions and inferences based on
graphs- identify, analyse, and explain the misuse of
statistics- use appropriate terminology
Collect• After students have had the opportunity to
display information in a variety of ways, ask theclass to make a list of decisions that need to bemade when summarizing and displaying data.
• Give students examples of statistical informationand conclusions taken from the media, theInternet, or professional journals. Have them writeevaluations analysing how the data was gathered,and the validity of conclusions.
Question• Ask students to explain why someone might
intentionally manipulate the presentation of dataand how this is done.
• Ask students if inferences can be made aboutgeneral weather patterns based on one weeks’recorded temperature and precipitation.
Peer Assessment• While students are presenting their analyses of
data, have others assess the effectiveness of thepresentations using criteria developed by the classas a whole.
Comprehensive learning resources for this courseare currently under development. As an interimmeasure, schools are encouraged to use theteacher-developed learning resources distributedto schools (student and teacher resources). Pleasenote that the student materials requirephotocopying for student use.
Print Materials
• Triple ‘A’ Mathematics Program: DataManagement and Probability
Software
• Green Globs & Graphing Equations• Hot Dog Stand: The Works

PRESCRIBED LEARNING OUTCOMES SUGGESTED INSTRUCTIONAL STRATEGIES
100
ESSENTIALS OF MATHEMATICS 11 • Measurement Technology
It is expected that students will determinemeasurements in Systeme International (SI) andImperial systems using different measuringdevices
It is expected that students will:
• select and use appropriate measuring devicesand measurement units in Imperial or SIsystems
• perform basic conversions within andbetween the Imperial and SI systems, usingtechnology as appropriate
• use measurement strategies to solve problems
Real-world activities involving measuring,converting between systems, and estimating enablestudents to explore, describe, and manipulate thephysical world around them.
• Divide the class into small groups and providestudents with a variety of measuring instruments(e.g., calipers, micrometers, scales, metre-sticks,measuring tapes, trundle wheels). Assign objectsto be measured to each group and have studentsreport to the class their choice of measuringdevice, the ease or difficulty of measurement, andthe precision of the resulting measurement.
• Use models and manipulatives to demonstrate themultiplication of units in two and threedimensions (e.g., cm, cm2, cm3). Have studentsresearch relationships in the metric system (e.g.,1 cm3 = 1 ml = 1 g of water).
• Have students create posters that displayconversion factors or simple instructions forconversions between Imperial measures andcorresponding SI measures, and vice versa.Compile the posters into a large book forclassroom use, or display individual posters in ahall display. Have students use the posters topractice conversion problems.
• Have students measure the diameter of a roundtable in metres. Have them convert the distance tofeet, then measure again in feet to check theirwork.

RECOMMENDED LEARNING RESOURCESSUGGESTED ASSESSMENT STRATEGIES
101
ESSENTIALS OF MATHEMATICS 11 • Measurement Technology
Measurement experiences are a powerful applicationof mathematical theory to everyday phenomena.Students demonstrate their knowledge ofmeasurement concepts by generalizing aboutstrategies and performing basic conversions.
Observe• While students are working on measurement
activities, circulate and provide feedback on:- their abilities to use the correct measuring
devices and measurement units- the extent to which they consider the
reasonableness of their answers- their overall understanding of measurement
concepts in solving problems
Collect• Review students’ written work in using
measurement technology for evidence that theycan:- give a situation in which using one particular
measuring device is preferable to another- give examples of situations in which a most
appropriate device for measurement exists- change units of linear measure from SI to
Imperial and vice versa• Have students research the history or
development of a particular unit of measure.
Self Assessment• Ask students to keep journals to describe the
processes they used in dealing with problems.Have them include descriptions of strategies thatworked, and those that did not. Have studentskeep a journal or scrapbook on the advantages ofthe SI system over the Imperial system.
Peer Assessment• Have students check each other’s work using
appropriate measuring systems.
Comprehensive learning resources for this courseare currently under development. As an interimmeasure, schools are encouraged to use theteacher-developed learning resources distributedto schools (student and teacher resources). Pleasenote that the student materials requirephotocopying for student use.
[no resources]

PRESCRIBED LEARNING OUTCOMES SUGGESTED INSTRUCTIONAL STRATEGIES
102
ESSENTIALS OF MATHEMATICS 11 • Owning and Operating a Vehicle
It is expected that students will analyse the costof acquiring and operating a vehicle
It is expected that students will:
• solve problems involving the acquisition andoperation of a vehicle, including- renting- leasing- buying- licensing- insuring- operating (e.g., fuel and oil)- maintaining (e.g., repairs, tune-ups)
Learning to make sound decisions about acquiring amotor vehicle helps students to make connectionsbetween needs and personal budgets. Understandingthe costs of vehicle acquisition and operation canhelp students make rational economic decisions.
• Provide students with newspapers or otheradvertisements that show the price of purchasinga vehicle and the cost of leasing the same vehicle.Have students calculate the costs of owning and ofleasing a vehicle of a given price, and ask them toresearch the advantages and disadvantages ofeach method by interviewing a loan manager, cardealership employee, car owner, or accountant.
• Have students research the cost of operating avehicle for a year. Ask students to prepare a reportsuitable for class presentation that includes allanticipated costs (e.g., fuel, oil, tires, tune-ups,insurance). Have students convert the overall costto cost per kilometer.
• Have each student find a new or used vehiclelisted in a newspaper classified section, on theInternet, or in a specialized “buy-and-sell”magazine. Ask students to research and prepare areport on the reliability of the vehicle, the vehiclecondition, specifications (e.g., engine size, gasmileage), and options (e.g., power features, airconditioning, car alarm, stereo system), thedepreciation amount, and the cost of financing.
• Ask students to contact insurance agents todetermine costs of insurance for various classes ofvehicle and types of driver (e.g., age of vehicle,age of driver, type of vehicle).

RECOMMENDED LEARNING RESOURCESSUGGESTED ASSESSMENT STRATEGIES
103
ESSENTIALS OF MATHEMATICS 11 • Owning and Operating a Vehicle
Acquiring and operating a vehicle involves costs thatwill have an impact on the present and futurebudgets of students. Assessment should focus onstudents’ abilities to estimate, predict, research,calculate (using appropriate technology), andcompare costs in the acquisition and operation of avehicle, and to verify the reasonableness of theirconclusions.
Observe• As students work on problems involving the costs
of acquiring and operating a vehicle, observe theirabilities to:- explain the advantages and disadvantages of
leasing, renting, or buying a vehicle- estimate the cost of a vehicle given the monthly
payments and other charges- estimate the operating expenses of a vehicle,
given published mileage figures and a setyearly mileage
• Note the extent to which students can read, create,and display vehicle acquisition and operatingcosts using a variety of forms such as tables,graphs, and histograms.
Collect• Have each student interview an automotive
technician, an insurance agent, or a loan managerand develop a report outlining the acquisition andoperating costs associated with a vehicle. Revieweach report, looking for evidence that the studentis able to:- compare and contrast the maintenance costs of
new and pre-owned vehicles- identify basic motor vehicle insurance
requirements- identify other costs associated with leasing a
vehicle- create a personal budget to operate a vehicle
Peer Assessment• Have students enter their information on
operating and maintenance on a table. Have themanalyse each other’s projects based on size andutility of vehicle.
Comprehensive learning resources for this courseare currently under development. As an interimmeasure, schools are encouraged to use theteacher-developed learning resources distributedto schools (student and teacher resources). Pleasenote that the student materials requirephotocopying for student use.
Video
• The ABC’s of Personal Finance
PRESCRIBED LEARNING OUTCOMES SUGGESTED INSTRUCTIONAL STRATEGIES
104
ESSENTIALS OF MATHEMATICS 11 • Personal Income Tax
It is expected that students will prepare a simpleincome tax form
It is expected that students will:
• prepare an income tax form for an individualwho is single, employed, and withoutdependents
A working knowledge of the skills involved in thepreparation of an income tax return will be essentialto most students.
• Ask each student to find a description, includingsalary, of a job that is of personal interest to themin the careers section of a newspaper or on theInternet. Have students prepare a basic income taxreturn for one year of employment in that job.
• Have groups of students report to the rest of theclass on the effects of RRSPs, donations, andeducational tuition fees on an income tax returnfor a fixed income.
• Have students research and create tables of thelevels of taxation according to income amount andof the various rates of taxation according toprovince or territory of residence.
• Have students report on the effects of levels oftaxation if a given income is increased ordecreased substantially.
• Discuss with students provincial and federal taxes,including how one is based on the other and howthey can change.

RECOMMENDED LEARNING RESOURCESSUGGESTED ASSESSMENT STRATEGIES
105
ESSENTIALS OF MATHEMATICS 11 • Personal Income Tax
Preparing an income tax return involves skills thatstudents can use throughout life. As much aspossible, assessment should relate to the real-worldapplications of this skill.
Collect• Give students job descriptions, including wages,
and have them choose an occupation andcomplete an income tax form for a singleindividual without dependents. Collect the forms,noting the extent to which students:- properly complete arithmetic operations- use tables and forms properly- properly calculate provincial taxes and surtaxes
Self-Assessment• Ask students to note the effects on income tax of:
- deductions, including RRSPs- the amount of income- taxable benefits
Comprehensive learning resources for thiscourse are currently under development. As aninterim measure, schools are encouraged to usethe teacher-developed learning resourcesdistributed to schools (student and teacherresources). Please note that the student materialsrequire photocopying for student use.
[no resources]
PRESCRIBED LEARNING OUTCOMES SUGGESTED INSTRUCTIONAL STRATEGIES
106
ESSENTIALS OF MATHEMATICS 11 • Applications of Probability
It is expected that students will demonstrate anawareness of the applications of probability toreal world situations
It is expected that students will:
• express probabilities as ratios, fractions,decimals, percents, and in words
• use probability to predict the result in a givensituation
• determine the odds for and against aparticular event occurring
• compare experimental observations withtheoretical predictions
• use probabilities to calculate expected gainsand losses
• communicate and justify solutions toprobability problems
Applications of probability that connect the realworld with students’ mathematical knowledge willhelp students understand the importance ofprobability. The study of applications of probabilityenables students to explore how probability affectsour daily decision making.
• Have students work in groups to develophypotheses that they can test. Provide each groupwith coins, cards, or identically shaped objects ofdifferent colours (e.g., plastic “chips,” marbles) todraw from a bag. Have the students calculate thetheoretical probabilities of a given activity (e.g.,coin toss, card match, object match), then conductexperiments to test their hypotheses.
• Ask students to search newspaper or magazinearticles for words such as chance, probability, andlikelihood. As a class, discuss the followingquestions:- How are these terms used?- Are they used “correctly” by the media?- Are they always used in relation to
mathematical calculations?- In what ways are probabilities expressed, other
than as a percent?• Provide students with a table of odds for major
catastrophic events (e.g., lightning striking a givenlocation, earthquake occurrence, volcano eruption)or other natural phenomena (e.g., crop failure orsuccess, meteor striking earth, weatherprediction). Discuss the following questions as aclass:- Does the event with the best odds always
occur? Why or why not?- How are such odds calculated?
• Have students examine actuarial tables outliningvarious probability relationships (e.g., lifeexpectancy of men and women in relation tocountry, relationship of nutrition to health,relationship of location to baby mortality rates).

RECOMMENDED LEARNING RESOURCESSUGGESTED ASSESSMENT STRATEGIES
107
ESSENTIALS OF MATHEMATICS 11 • Applications of Probability
Probability provides concepts and methods forinterpreting predictions based on uncertainty.Evidence of students’ abilities to use probabilityformulae can best be assessed in the context ofexperimental design and problem-solving activities.
Observe• While students are working with data, ask
questions, observe, and note how effectively theyare able to:- make predictions and inferences based on
probabilities- compare collected data with expected results- use appropriate terminology
Collect• Have students conduct a research project
comparing the probabilities of different eventsoccurring (e.g., lightning striking a given location,earthquake occurrence, volcano eruption). Askstudents to present their findings to the class,explaining how they acquired their data and whatit means in terms of risk.
Question• To assess students’ understanding of basic
concepts, pose questions that require students toexpress probabilities as words.
• Ask students to identify situations in their livesand in society where it would be useful to be ableto calculate probabilities (e.g., weather prediction,management of natural resources).
Self-Assessment• At the start of the unit, have students note in their
journals what they already know about this fieldof mathematics and what else they would like toknow. After completing the organizer, ask them toreflect back on their earlier journal entries, identifyany new knowledge they gained, and determine iftheir initial questions have been answered.
Comprehensive learning resources for this courseare currently under development. As an interimmeasure, schools are encouraged to use theteacher-developed learning resources distributedto schools (student and teacher resources). Pleasenote that the student materials requirephotocopying for student use.
Print Materials
• Triple ‘A’ Mathematics Program: DataManagement and Probability
Software
• Math Tools• Probability Constructor
Games/Manipulatives
• D.I.M.E. Probability Pack A• D.I.M.E. Probability Pack B

PRESCRIBED LEARNING OUTCOMES SUGGESTED INSTRUCTIONAL STRATEGIES
108
ESSENTIALS OF MATHEMATICS 11 • Business Plan
It is expected that students will prepare a planand operate a successful business
It is expected that students will:
• prepare a business plan to own and operate abusiness that includes the followinginformation as appropriate:- monthly cost of operation (e.g., inventory,
rent, wages, insurance, advertising, loanpayments, etc.)
- hours of operation- estimated daily sales (average)- gross/net profit- hourly earnings
• draw a scale floor plan of the store
Realistic activities involving the research and designof a business plan enable students to recognize theconnections between mathematical skills they havelearned and the concrete situations these skillsrepresent. An understanding of procedures andapplications of mathematics can help students makereasonable business decisions.
• Have students choose a business in theircommunity at which they might like to work, andinterview the owner or manager. Ask them toreport their findings to the class, including thefollowing information:- size of the store including inventory storage- number of staff- hours of operation- type of clientele- special features of the store (e.g., service, price,
inventory)• Ask each student to choose the inventory for a
self-owned business from a store catalogue. Afterchoosing their inventories, students set criteria fortheir businesses, including retail prices and costsof:- purchasing the inventory- rental of floor space- insurance and utilities (rough estimates)- staffing- advertising and promotion
• Have students develop a business plan, including:- estimates of gross revenue and gross profit- estimates of daily profit and annual profit
• Discuss the following questions as a class:- What are the advantages and disadvantages of
operating your own business?- What are the advantages and disadvantages of
working for others?- What mathematical skills do you need to
operate your own business?• Invite a business owner and/or operator to
discuss with the class how he or she manages thebusiness. Have students prepare questions relatedto the topic beforehand.
• Have students investigate real-world situations bycomparing their business plans with the plans ofestablished businesses.

RECOMMENDED LEARNING RESOURCESSUGGESTED ASSESSMENT STRATEGIES
109
ESSENTIALS OF MATHEMATICS 11 • Business Plan
The study of a business plan provides an excellentopportunity for students to demonstrate theirmathematical knowledge in a meaningful fashion.The plan to own and operate a successful businesscan connect students’ understanding of theunderlying mathematics to relevant and practicalapplications.
Collect• Have students identify factors that might
contribute to the success of their model businesses.• Work with students to develop criteria and use
them to assess their plans for their businesses.Criteria might include:- Will the business have sufficient space for
inventory?- Will the business have enough staff to operate
properly?- Are all costs considered, including rent,
utilities, wages, insurance and advertising?- Are the identified daily sales and profit figures
reasonable?
Self-/Peer Assessment• Have students assess peer business plans, to
determine whether the factors considered arerelevant and/or important, and to propose otherfactors.
Question• Ask students to what extent they have considered
non-inventory costs such as franchise, advertisingcosts, environmental factors, and businesslocation.
Comprehensive learning resources for this courseare currently under development. As an interimmeasure, schools are encouraged to use theteacher-developed learning resources distributedto schools (student and teacher resources). Pleasenote that the student materials requirephotocopying for student use.
Print Materials
• Math Projects: Organization, Implementation,and Assessment
Software
• Hot Dog Stand: The Works

RECOMMENDED LEARNING RESOURCESSUGGESTED ASSESSMENT STRATEGIES
111
CURRICULUMEssentials of Mathematics 12

PRESCRIBED LEARNING OUTCOMES SUGGESTED INSTRUCTIONAL STRATEGIES
112

RECOMMENDED LEARNING RESOURCESSUGGESTED ASSESSMENT STRATEGIES
113
ESTIMATED INSTRUCTIONAL TIME
Essentials of Mathematics 12 has been developed assuming that teachers have 100 instructionalhours available to them. The following chart shows the estimated instructional time for eachcurriculum suborganizer, expressed as a percentage of total time available to teach the course.
When delivering the prescribed curriculum, teachers may freely adjust the instructional time to meettheir students’ diverse needs. These estimated instructional times have been recommended by the IRPwriters to assist their colleagues; they are suggestions only.
Organizer (Suborganizer) % of Time
Problem Solving Integrated Throughout
Personal Finance 10 - 20
Design and Measurement 10 - 20
Government Finances 10 - 20
Investments 10 - 20
Taxation 10 - 15
Variation and Formulas 10 - 15
Life/Career Project 10 - 20
ESSENTIALS OF MATHEMATICS 12

PRESCRIBED LEARNING OUTCOMES SUGGESTED INSTRUCTIONAL STRATEGIES
114
ESSENTIALS OF MATHEMATICS 12 • Problem Solving
It is expected that students will use a variety ofmethods to solve real-life, practical, technical,and theoretical problems
It is expected that students will:
• solve problems that involve a specific contentarea
• solve problems that involve more than onecontent area
• solve problems that involve mathematicswithin other disciplines
• analyse problems and identify the significantelements
• develop specific skills in selecting and usingan appropriate problem-solving strategy orcombination of strategies chosen from, but notrestricted to, the following:- guess and check- look for a pattern- make a systematic list- make and use a drawing or model- eliminate possibilities- work backward- simplify the original problem- develop alternative original approaches- analyse keywords
• demonstrate the ability to work individuallyand co-operatively to solve problems
• determine that their solutions are correct andreasonable
• clearly communicate a solution to a problemand the process used to solve it
• interpret their solutions by describing whatthe solution means within the context of theoriginal problem
• use appropriate technology to assist inproblem solving
Problem solving is a key aspect of any mathematicscourse. Working on problems involving finances,modeling, and analysis can give students a sense ofthe excitement involved in creative and logicalthinking. It can also help students developtransferable real-life skills and attitudes. Multi-strandand interdisciplinary problems should be includedthroughout Essentials of Mathematics 12
• Reinforce the concept that “problem solving” ismore than just word problems and includes otheraspects of mathematics than algebra.
• Introduce new types of problems directly tostudents (without demonstration) and play therole of facilitator as they attempt to solve suchproblems.
• Recognize when students use a variety ofapproaches; avoid becoming prescriptive aboutapproaches to problem solving.
• Reiterate that problems might not be solved in onesitting and that “playing around” with theproblem—revisiting it and trying again—issometimes needed.
• Frequently engage small groups of students (threeto five) in co-operative problem solving whenintroducing new types of problems.
• Have students or groups discuss their thoughtprocesses as they attempt a problem. Point out thestrategies inherent in their thinking (e.g., guessand check, look for a pattern, make and use adrawing or model).
• Ask leading questions such as:- What are you being asked to find out?- What do you already know?- Do you need additional information?- Have you ever seen similar problems?- What else can you try?
• Once students have arrived at solutions toparticular problems, encourage them to generalizeor extend the problem situation.
• See Appendix G for examples of multi-strand andinterdisciplinary problems that most studentsshould be able to solve. These types of problemsare indicated with an asterisk (*).

RECOMMENDED LEARNING RESOURCESSUGGESTED ASSESSMENT STRATEGIES
115
ESSENTIALS OF MATHEMATICS 12 • Problem Solving
Students analyze problems and solve them using avariety of approaches. Assessment of problem-solving skills is made over time, based onobservations of many situations.
Observe• Have students present solutions to the class
individually, in pairs, or in small groups. Note theextent to which they clarify their problems andhow succinctly they describe the processes used.
Question• To check the approaches students use when
solving problems, ask questions that prompt themto:- paraphrase or describe the problem in their- own words- explain the processes used to derive an answer- describe alternative methods to solve a problem- relate the strategies used in new situations- link mathematics to other subjects and to the
world of work.
Collect• On selected problems, have students annotate
their work to describe the processes they used.Alternatively, have them provide briefdescriptions of what worked and what did notwork as they solved particular problems.
Self-Assessment• Ask students to keep journals to describe the
processes they used in dealing with problems.Have them include descriptions of strategies thatworked and those that did not.
• Develop with students a set of criteria to self-assess problem-solving skills. The reference setEvaluating Problem Solving Across Curriculum maybe helpful in identifying such criteria.
Comprehensive learning resources for this courseare currently under development. As an interimmeasure, schools are encouraged to use theteacher-developed learning resources distributedto schools (student and teacher resources). Pleasenote that the student materials requirephotocopying for student use.
Print Materials
• Problem Solving: What You Do When YouDon’t Know What To Do
Please see the introduction to Appendix B for alist of suggested utility software that supportsthis course.
PRESCRIBED LEARNING OUTCOMES SUGGESTED INSTRUCTIONAL STRATEGIES
116
It is expected that students will solve consumerproblems involving insurance, mortgages andloans
It is expected that students will:
• solve problems involving different types ofinsurance
• determine the costs involved in purchasing ahome, including gross debt service ratio
• solve problems involving different types ofmortgages
Purchasing insurance and acquiring a mortgage involveimportant decision-making skills that will pay animportant role in every student’s future. By analysingvarious types of insurance and mortgage scenarios andconsidering additional cost factors, students are betterable to make informed financial decisions.
• Brainstorm a class list of types of insurance (e.g.,renter’s, home-owner’s, life, health, dental, eye-care, long-term disability).
• Have students discuss in small groups, research,and report on the following questions:- Why purchase life insurance?- How much life insurance is needed in various
situations?- What types of life insurance are available?- Why do smokers pay more for life insurance?- Why do people pay more for life insurance as
they age?• As a class, discuss home-owner’s insurance,
including:- deciding how much insurance is needed,
including contents coverage- the importance of reviewing exactly what is
covered by a particular life insurance plan- the difference between standard and
comprehensive home-owner’s insurance- the need for renter’s insurance
• Have students research the following terms, andprovide a brief definition for each: down payment,inspection fee, mortgage, application fee, servicecharges, legal fee, closing cost, land transfer tax, assets,debt-equity ratio, liabilities.
• Ask students to make a list of additional costs to amortgage beyond the cost of the building. Havethem include reasons for buying a home withintheir price range.
• Discuss gross debt service ratio and demonstratehow it is used by financial institutions todetermine eligibility for loans:monthly mortgage payment + prop. taxes + heating
gross monthly income• Conduct a class discussion on types of mortgages,
including closed, open, convertible, fixed-rate, andvariable-rate.
• Have students analyse the relationships betweenprincipal, length of term, and interest rate using amortgage calculator.
ESSENTIALS OF MATHEMATICS 12 • Personal Finance

RECOMMENDED LEARNING RESOURCESSUGGESTED ASSESSMENT STRATEGIES
117
To make wise financial decisions when purchasinginsurance or acquiring a mortgage, consumers mustunderstand the mathematics involved. Assessmentshould center around real-life scenarios involvingpremium and amortization tables and the use ofspreadsheets. Look for evidence of students’ abilitiesto analyze situations so they can make informeddecisions.
Observe• While students are working on problems
involving insurance or mortgages, look forevidence that they can:- use the appropriate terminology (e.g., standard
and broad insurance, comprehensive coverage,guaranteed replacement cost, N/C [notcovered], deductible, down payment,mortgage, equity, appraisal, principal,amortization period, gross debt service ratio,net worth)
- distinguish between the various types ofinsurance
- distinguish between closed, open, convertible,fixed-rate and variable-rate mortgages
- correctly calculate gross debt service ratio andnet worth
- identify an appropriate insurance plan andmortgage plan
- identify additional costs involved in purchasinga home
- use amortization tables
Collect• Have students investigate real-life situations in
purchasing an insurance plan or a mortgage plan.Assess their work for the extent to which they:- accurately determine the factors involved- set up and fill a spreadsheet to determine
insurance cost, additional costs, mortgage- interpret the results from the insurance and
mortgage calculation
Question• After students have analyzed a real-life situation,
ask them to answer the following questions:- what would happen if _____?- what if _____ had happened instead?- what does this information suggest?
Comprehensive learning resources for this courseare currently under development. As an interimmeasure, schools are encouraged to use theteacher-developed learning resources distributedto schools (student and teacher resources). Pleasenote that the student materials requirephotocopying for student use.
Video
• The ABC’s of Personal Finance
Software
• Math Tools
ESSENTIALS OF MATHEMATICS 12 • Personal Finance

PRESCRIBED LEARNING OUTCOMES SUGGESTED INSTRUCTIONAL STRATEGIES
118
It is expected that students will analyse objects,shapes and processes to solve cost and designproblems
It is expected that students will:
• analyze objects shown in “exploded” format• draw objects in “exploded” format• solve problems involving estimation and
costing for objects, shapes, or processes whena design is given
• design an object within a specified budget
In this unit, students will have opportunities to usegeometric ideas in design and measurment of 3-Dobjects. Combined with their skills in usingtechnology and problem solving, these design andmeasurement skills will have broad real-lifeapplications.
• Ask students to bring to class examples ofillustrations or diagrams in “exploded” format.(These are available from hardware stores, homeimprovement stores, or lumber yards.) Have themchoose an object and illustrate it in the sameformat.
• Invite a builder, architect, interior designer, orother appropriate professional to visit theclassroom. Have students prepare and askquestions about his or her measurementtechniques, design and/or constructionprocedures, and “tricks of the trade.”
• Have each student design a 3-D object (e.g., picnictable, bird house, dog house, item of clothing)within a specified budget. Have them consider thefollowing steps in completing the project:- set a budget- make a design plan- compile a list of materials- perform a cost comparison of the material by
researching at least two suppliers- if necessary, adjust materials list to lower costs
within the proposed budgetAsk students to present the design project to therest of the class.
ESSENTIALS OF MATHEMATICS 12 • Design and Measurements
RECOMMENDED LEARNING RESOURCESSUGGESTED ASSESSMENT STRATEGIES
119
Project design and modeling are a powerfulapplication of mathematical theory to everydayphenomena. Students demonstrate their knowledgeof geometric principles, scale factors, measuringdevices and measurement concepts by solvingproblems involving scale drawing, area, perimeter,surface area, and volume.
Observe• While students are working on measurement
activities, circulate and provide feedback on:- their abilities to match the correct measurement
formula to a given figure- the extent to which they consider the
reasonableness of their answers- their overall understanding of measurement
concepts in solving problems- their ability to provide an “exploded” view of
the sketch of an object- their methods for calculating the cost of a
design
Collect• Review students’ written work in solving
measurement problems for evidence that they canexplain the method used in finding the cost of adesign, and solve various types of problems basedon the interpretation of measurements from ablueprint or 3-D sketch.
Presentation• As students complete a project to design and
analyze the cost of an object given a specifiedbudget and present results to the class, look forevidence that they can:- logically and clearly present their work- model an object accurately- provide calculations to support their solution to
the problem
Question• Ask students to critique the presentation of a guest
speaker, comment on the usefulness of the “tricksof the trade” and analyse the degree to which theyapplied these tricks to their own projects.
Comprehensive learning resources for this courseare currently under development. As an interimmeasure, schools are encouraged to use theteacher-developed learning resources distributedto schools (student and teacher resources). Pleasenote that the student materials requirephotocopying for student use.
Print Materials
• Math Projects: Organization, Implementation,and Assessment
Software
• Math Tools
ESSENTIALS OF MATHEMATICS 12 • Design and Measurements
PRESCRIBED LEARNING OUTCOMES SUGGESTED INSTRUCTIONAL STRATEGIES
120
It is expected that students will demonstrate anawareness of the income and expenditures offederal, provincial and municipal governments
It is expected that students will:
• describe government expenditures includingthe amounts spent on social welfare benefits,social security, education, health care, policing,armed forces, and employee wages andsalaries
• solve problems involving the calculation ofselected federal taxes (e.g., GST, excise tax andduties)
• calculate provincial taxes, (e.g., PST,corporation capital, licenses, gasoline)
• determine how selected municipal taxes arecalculated (e.g., property)
Every student will one day be a taxpayer and as suchwill encounter a wide range of payroll deductionsand taxes. It is important that students understandthe motivation for these and how the moneycollected through them is used. This knowledge willhelp students to become informed citizens.
• Ask students to discuss in cooperative groups, thefollowing questions:- Why do governments impose taxes?- Where does the money come from?- How is tax money distributed?- What are GST and PST and what are they used
for?- What is the purpose of custom duties and
excise taxes?Bring the class together to discuss their answers.• Provide students with examples of real-life tax
assessments, such as property tax assessments.Have students analyse how the statements arecalculated.
• Have students research and discuss the followingquestions on municipal taxes:- Where does the tax money come from?- How is the collected tax money used?- What is the major source of revenue for cities?
• Explain what an educational levy is and how it isused, then have students calculate municipal taxbills for a variety of real-life situations.
• Provide students with examples of the localcommunity tax bill. In a class discussion, reviewthe layout of the form and the types of informationincluded. Ask students to locate the followingitems:- the tax rate- the municipal mill rate- the educational mill rate
• Have students examine a summary of a federal orprovincial budget presented over the last four tofive years, then discuss as a class.
ESSENTIALS OF MATHEMATICS 12 • Government Finances
RECOMMENDED LEARNING RESOURCESSUGGESTED ASSESSMENT STRATEGIES
121
Reading tax assessments and payroll deductions canbe a tedious job and requires an understanding of theunderlying math. To assess students’ knowledge ofincome and expenditures of federal, provincial andmunicipal taxes, note their ability to discuss theseitems, calculate taxes, and verify given taxstatements.
Observe• As students discuss taxes, observe their ability to:
- correctly label taxes.- identify the tax rate involved- provide a reason for the tax- explain what the tax is used for
• Observe how completely students analyse taxstatements and the extent to which they verifygiven calculations.
Presentation• Have students analyse real-life situations that
involve a variety of tax calculations and have thempresent their solutions to the class.
Collect• Have students design a flow chart or pie chart
showing how our tax dollars are distributed.Assess their work with respect to:- presentation- accuracy- completeness
Peer Assessment• Have students calculate tax bills for realistic
situations and swap their work with a peer to haveit checked for accuracy.
Comprehensive learning resources for this courseare currently under development. As an interimmeasure, schools are encouraged to use theteacher-developed learning resources distributedto schools (student and teacher resources). Pleasenote that the student materials requirephotocopying for student use.
[no resources]
ESSENTIALS OF MATHEMATICS 12 • Government Finances
PRESCRIBED LEARNING OUTCOMES SUGGESTED INSTRUCTIONAL STRATEGIES
122
It is expected that students will demonstrate andrecognize the differences concerning differenttypes of financial investments
It is expected that students will:
• determine a financial plan to achieve personalgoals
• describe different investment vehicles (e.g.,GICs, bonds, mutual funds, stocks, and realestate)
• compare and contrast different investmentvehicles in terms of risk factors, rates ofreturn, costs, and lengths of term
• identify reasons for investing money in RRSPsand RESPs
• investigate how to purchase and sell stocks
The ability to make sound financial decisions is acritical factor in financial independence. Financialdecisions are influenced by an individual’s values,goals, attitudes, age, level of education, and income.
• Ask students to produce point-form paragraphson the following topics:- List three goals you hope to achieve this year.
Provide reasons why they are important to youand how you plan on achieving them. Considerany financial implications these goals mayhave.
- List the ten things you value most in life. Brieflydescribe why each item on your list isimportant to you.
- List three financial goals for people at differentstages of life (e.g., 20s single, 50s married).
• Have students in small groups discuss thefollowing questions:- What is an acceptable level of income to
support your current life style?- What is a desired level of income to support a
predicted life style in your future?- What factors can you influence to increase
future income and benefits?Discuss their answers as a class.
• Invite a guest speaker (e.g., investment agent,banker, financial advisor) to address topics relatedto investment. Have students prepare questionsthat address the underlying mathematics ofsavings and investment options.
• Provide students with information on RRSPs andRESPs (e.g., bank pamphlets, web sites). Workingin small groups, students list pros and cons foreach.
• Have each student, given a fixed amount ofmoney to invest, research and select stocks, “sell”old stocks, and “buy” new stocks according topredetermined rules. Students keep track of thestocks over a fixed period of time using aspreadsheet. Periodically compare the results as aclass.
ESSENTIALS OF MATHEMATICS 12 • Investments

RECOMMENDED LEARNING RESOURCESSUGGESTED ASSESSMENT STRATEGIES
123
Students need experience in setting financial goalsand making financial decisions. It is thereforeimportant that students demonstrate anunderstanding of the underlying mathematicsinvolved in investment options and provide evidencethat they are able to research and contrast a variety ofinvestments.
Observe• Note the extent to which students are able to
establish a financial plan.• Look for evidence that students differentiate
between the different types of investment duringgroup discussions.
• Observe the students’ ability to explainadvantages and disadvantages of a variety ofinvestments during the research on a variety ofinvestments.
Collect• Have students investigate in depth one type of
investment vehicle, and write a reportsummarizing their findings. Look for evidencethat:- a description of the investment vehicle is
provided- a variety of pros and cons are listed- a spreadsheet is used to analyze the
performance of the investment- a visual description (e.g., time graph, bar graph,
pie graph) is given comparing a number ofinvestments within that investment vehicle(e.g., mutual funds: resource, technology,European, Asian)
- risk factors involved in making investments vs.potential returns or losses
Self-Assessment• During the stock market competition, have
students note in their journals the reasons for anyaction or non-action they are taking about theirstock portfolio. After the competition, ask them toreflect back on their earlier journal entries, identifypositive and negative decisions they made, anddetermine the factors that are important in makinginvestment decisions.
Comprehensive learning resources for this courseare currently under development. As an interimmeasure, schools are encouraged to use theteacher-developed learning resources distributedto schools (student and teacher resources). Pleasenote that the student materials requirephotocopying for student use.
Video
• The ABC’s of Personal Finance
Software
• Math Tools
ESSENTIALS OF MATHEMATICS 12 • Investments

PRESCRIBED LEARNING OUTCOMES SUGGESTED INSTRUCTIONAL STRATEGIES
124
It is expected that students will demonstrate anability to fill out an income tax form
It is expected that students will:
• fill out income tax forms for:- a single parent with child- a married couple with one person earning
an income- a married couple with child
Understanding the mathematics of a variety ofincome tax situations helps students prepare for atime when they may be acquiring property andinvestments, forming a family, and/or starting abusiness.
• Have students work in small groups to createmindmaps that illustrate what they already knowabout personal income tax. In a class discussion,pool the groups’ information to create a classmindmap.
• Invite a guest speaker (e.g., taxation lawyer, taxconsultant) to talk to students about importantissues related to personal income tax. Havestudents prepare questions that identify and applythe underlying mathematics.
• Encourage students to include an income taxreturn in connection with their Life/Career Projectdiscussion of budgets, life style, and personalfinances.
• Provide students with blank income tax forms andappropriate financial data for the followinglifestyle situations:- a single parent earning and income, with one
child- a married couple, one person earning an
income, with no children- a married couple, both earning an income, with
one childHave students complete the forms and, as a class,discuss the tax implications of the varioussituations.
ESSENTIALS OF MATHEMATICS 12 • Taxation

RECOMMENDED LEARNING RESOURCESSUGGESTED ASSESSMENT STRATEGIES
125
Modeling a variety of living and working scenarioswill provide a basis for students to fill out an incometax form. Assessment should focus on students’abilities to read and interpret income tax documents,perform the appropriate tax calculations, selectappropriate deductions, and solve problemsassociated with filling out an income tax form.
Observe• As students fill out an income tax form, look for
evidence that they- use appropriate calculation techniques- are able to interpret documentation for the
income tax form- refer to the relevant section in the
documentation for specific lines on the incometax form
- are able to follow the steps laid out in theincome tax form
Poster Presentation• Choosing one scenario, have small groups of
students prepare a poster for each section of theincome tax form. Have them annotate their workto explain how they arrived at each answer andwhat method they used. Assess their posters for:- presentation- completeness- clarity- annotation- correctness
Comprehensive learning resources for this courseare currently under development. As an interimmeasure, schools are encouraged to use theteacher-developed learning resources distributedto schools (student and teacher resources). Pleasenote that the student materials requirephotocopying for student use.
[no resources]
ESSENTIALS OF MATHEMATICS 12 • Taxation

PRESCRIBED LEARNING OUTCOMES SUGGESTED INSTRUCTIONAL STRATEGIES
126
It is expected that students will use algebraic andgraphical models to generate patterns, makeprediction and solve patterns
It is expected that students will:
• plot and analyse examples of direct variation,partial variation, and inverse variation
• given data, graph, or a situation, recognize thevariation represented
• use formulas to solve problems
The ability to identify relationships between variousquantities is essential to solving most problems.Students need to develop the ability to visualize andidentify the appropriate variation given a variety ofinformation and situations.
• In a class discussion, encourage students todetermine the relationship between sets of datasuch as the following:- pay to hours worked- light intensity to water depth- profit to fixed and variable costs- electrical components for current, voltage, and
resistance• Have students work in groups to identify the type
of variation represented in each situation (e.g.,direct, inverse, partial) and develop anappropriate equation representing the variation.For example, the electrical resistance R of a wirevaries directly as the length L and inversely as thesquare of the diameter D of the wire:
R = k—– where k is a constant.
• Have students use appropriate technology tocreate graphs and tables of each variation.
• Provide students with data from modeling real-lifesituations (e.g., raising a flag on a pole, pouringwater out of a container) and ask them to drawdiagrams, find a formula, and solve bysubstitution for an unknown quantity.
• Provide students with several graphs, and askthem to describe the real-life scenarios that wouldhave produced them.
• Have students design a puzzle work sheet offormulas and their answers, together with ananswer key.
LD2
ESSENTIALS OF MATHEMATICS 12 • Variation and Formulas

RECOMMENDED LEARNING RESOURCESSUGGESTED ASSESSMENT STRATEGIES
127
As students work with algebraic and graphicalrepresentations, assessment should focus on theircompetency in solving problems involving severalkinds of variation.
Observe• As students work with graphing calculators,
observe their abilities to:- set appropriate domain and range values- verify their results- generate examples that demonstrate an
understanding of the different types ofvariation
Self-Assessment• Assign experiments that require students to
demonstrate the type of variation involved in real-life situations (e.g., intensity of light variesinversely as the square of the distance from thesource). Let students check their ownunderstanding and accuracy by:- using graphing calculators or software.- checking work against models that are
provided
Peer Assessment• Have students share the puzzle worksheets with
their peers and have them assess the puzzle bycompleting it and checking it against the providedkey.
Comprehensive learning resources for this courseare currently under development. As an interimmeasure, schools are encouraged to use theteacher-developed learning resources distributedto schools (student and teacher resources). Pleasenote that the student materials requirephotocopying for student use.
Print Materials
• What If ...?: The Straight Line: Investigationswith the TI-81 Graphics Calculator
• What If ...?: The Straight Line: Investigationswith the TI-81 Graphics Calculator
Software
• Green Globs & Graphing Equations
ESSENTIALS OF MATHEMATICS 12 • Variation and Formulas

PRESCRIBED LEARNING OUTCOMES SUGGESTED INSTRUCTIONAL STRATEGIES
128
It is expected that students will research careerchoices and perform a comparative study
It is expected that students will:
• determine what factors are important inanalysing careers
• describe two specific career opportunities• identify mathematical educational
requirements for two careers• compare two careers in terms of salary,
working hours, training time and cost, cost ofliving, and benefits
It is expected that today’s student will hold severaldifferent careers in his or her lifetime. To be able tomake informed decisions about future employment,students need opportunities to practise job-searchskills and to analyse career information objectively.
• Brainstorm with the whole class to find as manyfactors as possible that influence students’ careeropportunities and decisions (e.g., food, shelter,salary, education, transportation, insurance,recreation, job security).
• Have students research two careers in fieldsappropriate to their individual interests andabilities. This research should include:- a job description for each selected career- the educational background required and
associated costs, including a detaileddescription of the mathematical educationalbackground required
- the salary or wage levels offered, includingstarting rates, potential income, and benefitsavailable
- an indication of the employment opportunitiesin the two fields
- health issues, including stress, that might berelevant to each career
- a description of the life style each career cansupport, with a supporting budgetary analysis
- an individual statement of the long-termpersonal and educational requirements foradvancement in each career
• Ask students to use spreadsheets, graphs, and/ordiagrams to display their budgetary analysis ofthe two careers for the rest of the class.
ESSENTIALS OF MATHEMATICS 12 • Life/Career Project

RECOMMENDED LEARNING RESOURCESSUGGESTED ASSESSMENT STRATEGIES
129
Analysing career choices is an important life skill andrequires a working knowledge of the underlyingmathematics. Assessment should focus on thestudents’ ability to research, compile, interpret, andpresent career factors related to two types of careers.
Observe• Observe the extent to which students:
- use a variety of sources to research the twocareers
- collect information on areas necessary to makean informed decision (e.g., salary, educationalbackground required)
- use technology to display information
Collect• Have students write-up the comparative study for
the two careers. Assess their items for presentationand the extent to which their items demonstrate ananalysis of:- job description- requirements: education, budgetary analysis,
income- resume- salary factors- health issues- life style
Presentation• Have students present the pros and cons of one or
two careers to the class and have their peers assessthe presentation according to criteria establishedas a class beforehand.
Comprehensive learning resources for this courseare currently under development. As an interimmeasure, schools are encouraged to use theteacher-developed learning resources distributedto schools (student and teacher resources). Pleasenote that the student materials requirephotocopying for student use.
Print Materials
• Math Projects: Organization, Implementation,and Assessment
Video
• The ABC’s of Personal Finance
Software
• Math Tools
ESSENTIALS OF MATHEMATICS 12 • Life/Career Project

RECOMMENDED LEARNING RESOURCESSUGGESTED ASSESSMENT STRATEGIES
131
CURRICULUMPrinciples of Mathematics 10

PRESCRIBED LEARNING OUTCOMES SUGGESTED INSTRUCTIONAL STRATEGIES
132

RECOMMENDED LEARNING RESOURCESSUGGESTED ASSESSMENT STRATEGIES
133
ESTIMATED INSTRUCTIONAL TIME
Principles of Mathematics 10 has been developed assuming that teachers have 100 instructionalhours available to them. The following chart shows the estimated instructional time for eachcurriculum suborganizer, expressed as a percentage of total time available to teach the course.
When delivering the prescribed curriculum, teachers may freely adjust the instructional time to meettheir students’ diverse needs. These estimated instructional times have been recommended by the IRPwriters to assist their colleagues; they are suggestions only.
Organizer (Suborganizer) % of Time
Problem Solving Integrated Throughout
Number (Number Concepts) 5 - 15
Number (Number Operations) 10 - 20
Patterns and Relations (Variables and Equations) 10 - 20
Patterns and Relations (Relations and Functions) 10 - 20
Shape and Space (Measurement) 10 - 20
Shape and Space (3-D Objects and 2-D Shapes) 10 - 20
Statistics and Probability (Data Analysis) 10 - 20
PRINCIPLES OF MATHEMATICS 10

PRESCRIBED LEARNING OUTCOMES SUGGESTED INSTRUCTIONAL STRATEGIES
134
It is expected that students will use a variety ofmethods to solve real-life, practical, technical,and theoretical problems
It is expected that students will:
• solve problems that involve a specific contentarea such as geometry, algebra, trigonometry,statistics, probability
• solve problems that involve more than onecontent area
• solve problems that involve mathematicswithin other disciplines
• analyse problems and identify the significantelements
• develop specific skills in selecting and usingan appropriate problem-solving strategy orcombination of strategies chosen from, but notrestricted to, the following:- guess and check- look for a pattern- make a systematic list- make and use a drawing or model- eliminate possibilities- work backward- simplify the original problem- develop alternative original approaches- analyse keywords
• demonstrate the ability to work individuallyand co-operatively to solve problems
• determine that their solutions are correct andreasonable
• clearly explain the solution to a problem andjustify the processes used to solve it
• use appropriate technology to assist inproblem solving
Problem solving is a key aspect of any mathematicscourse. Working on problems involving a range ofmathematical disciplines can give students a senseof the excitement involved in creative and logicalthinking. It can also help students developtransferable real-life skills and attitudes. Multi-strand and interdisciplinary problems should beincluded throughout Principles of Mathematics 10.
• In a class discussion, define problem solving withstudents, pointing out that in mathematicsproblem solving involves many disciplines,including algebra, geometry, trigonometry,statistics, and probability.
• Introduce new types of problems directly tostudents (i.e., without demonstration), andfacilitate as they attempt to solve them.
• Have students work in small co-operative groupsof three to five when introducing new types ofproblems.
• Model and reinforce student use of a variety ofapproaches to problem solving (e.g., algebraicand geometric).
• Emphasize that many problems may not besolved in one try and that it is sometimesnecessary to revisit the problem, start over, andtry again.
• Have students or groups discuss their thoughtprocesses as they attempt to solve a problem.Point out the strategies inherent in their thinking(e.g., guessing and checking, looking for apattern, making and using a drawing or model).
• Ask leading questions such as:- What are you being asked to find out?- What do you already know?- Do you need additional information?- Have you ever seen similar problems?- What else can you try?
• When students arrive at solutions to particularproblems, encourage them to generalize from orextend the problem situations.
Note: See Appendix G for examples of multi-strand and interdisciplinary problems that moststudents should be able to solve. These problemsare indicated with an asterisk (*)
PRINCIPLES OF MATHEMATICS 10 • Problem Solving

RECOMMENDED LEARNING RESOURCESSUGGESTED ASSESSMENT STRATEGIES
135
Students analyse problems and solve them using avariety of approaches. Assessment of problem-solving skills is made over time, based onobservations of many situations.
Observe• Have students present solutions to the class
individually, in pairs, or in small groups. Note theextent to which they clarify their problems andhow succinctly they describe the processes used.
Question• To check the approaches students use when solving
problems, ask questions that prompt them to:- paraphrase or describe the problem in their
own words- explain the processes used to derive an answer- describe alternative methods to solve a problem- relate the strategies used in new situations- link mathematics to other subjects and to the
world of work
Collect• On selected problems, have students annotate
their work to describe the processes they used.Alternatively, have them provide briefdescriptions of what worked and what did not forparticular problems.
• Have students use mind maps and flowcharts todescribe and display problem solutions.
Self-Assessment• Ask students to keep journals to describe the
processes they used in dealing with problems.Have them include descriptions of strategies thatworked and those that did not.
• Develop with students a set of criteria to self-assess problem-solving skills. The reference set,Evaluating Problem Solving Across Curriculum, maybe helpful in identifying such criteria.
PRINCIPLESS OF MATHEMATICS 10 • Problem Solving
Please see the introduction to Appendix B for alist of suggested utility software that supportsthis course.
The Western Canadian Protocol LearningResource Evaluation Process has also identifiednumerous teacher resources and professionalreferences. These are generally cross-gradeplanning resources that include ideas for avariety of activities and exercises.
These resources, while not part of the GradeCollections, have Provincially Recommendedstatus.
Appendix B includes an annotated bibliographyof these resources for ordering convenience.

PRESCRIBED LEARNING OUTCOMES SUGGESTED INSTRUCTIONAL STRATEGIES
136
It is expected that students will:
• analyse the numerical data in a table fortrends, patterns and interrelationships.
• explain and illustrate the structure and theinterrelationship of the sets of numbers withinthe real number system.
It is expected that students will:
• use words and algebraic expressions todescribe the data and the interrelationships ina table with rows that are not relatedrecursively (not calculated from previous data)
• use words and algebraic expressions todescribe the data and the interrelationships ina table with rows that are related recursively(calculated from previous data)
• classify numbers as natural, whole, integer,rational or irrational, and show that thesenumber sets are “nested” within the realnumber system
Using tables enhances students’ ability to see data ina compact and easily readable format. Students canextract specific information from tables, and use themto do general comparisons and find relationships.
• Distribute single newspapers to groups of three orfour students and have them browse through thepaper to find the sections that contain the mosttables. Ask the groups to give two reasons whythose particular sections use tables extensively.
• Have each student find three specific pieces ofinformation in a table from a newspaper,magazine, or the Internet and share with a partner.Have pairs share their findings with the rest of theclass.
• Place a multi-column, non-recursive table (e.g.,hockey standings/stock market data) on anoverhead. In a class discussion, encouragestudents to compare and contrast the data in thetable. As a class, produce a word list ofconnections between the rows and columns ofdata.
• Provide students with a recursive table (e.g.,mortgage, credit card account, savings account).Point out that the closing balance for any month isthe opening balance of the next month. Askstudents to analyse the repetitive nature of thecalculations. Have them calculate the balance afterthree payments, given an opening balance, amonthly rate of interest, and the payment amount.
• Discuss the definitions of the various numbersystems. Use a set of nested measuring cups withappropriate labels to illustrate how the numbersystems fit inside one another. Illustrate theanomaly of irrational numbers by slipping a pieceof paper between the rational-number cup and thereal-number cup. Have students transfer theseconcepts to Venn diagrams in their notebooks.
• Draw a number line on the board and havestudents place rational numbers in appropriateplaces, then ask them to place irrational numberson the line. Point out that a decimalapproximation of the number is necessary to allowfor the proper placement and that more decimalplaces lead to greater accuracy.
PRINCIPLES OF MATHEMATICS 10 • Number (Number Concepts)

RECOMMENDED LEARNING RESOURCESSUGGESTED ASSESSMENT STRATEGIES
137
Tables are commonly used to represent real life data.Assess students’ ability to use tables in a practicalway. Students demonstrate their understanding ofthe structure and interrelationship within the numbersystem when they explain the processes they use asthey experiment with and manipulate numbers.
Observe• While students are drawing meaning from tabular
representations of data, note their ability to:- use words to describe data- identify specific facts from tables- determine trends where they exist- develop recursive tables in the form of
spreadsheets• Provide students with a nested Venn Diagram and
have them place numbers appropriately. Observestudents’ abilities to place numbers in such a waythat they fit all the appropriate numbers systems.
Collect• Give students multi-column tables such as sports
standings, and note the extent to which students areable to glean information. Have students write anewspaper article based on the information and notethe extent to which they are able to interpret data.
Question• Ask students to suppose that they are responsible
for adding 10 new items to the inventory of aclothing store. Have them create a spreadsheetthat shows price, GST, PST, and cost. Ask them toexplain how the value for each cell in theirspreadsheet is calculated.
Self/Peer Assessment• Work with students to develop criteria they can
use to assess their posters. Criteria might include:- it is easy to use for classifying numbers- it makes sense to others- it gives accurate examples
Students can use these criteria to assess their work,then compare their assessment to the teacher’sassessment.
Presentation• Have students gather similar information on each
of five scientists and present it in tabular form toanother student or class.
PRINCIPLESS OF MATHEMATICS 10 • Number (Number Concepts)
Print Materials
• Pure Mathematics 10 (Distance LearningPackage)
Multi-media
• The Learning Equation: Mathematics 10Lessons 1 - 4
• Mathematics 10, Western Canadian EditionCh. 1 (Sections 1.6, 1.7)Ch. 2 (Sections 2.1, 2.5)
• MATHPOWER 10, Western EditionCh. 1 (Sections 1.1, 1.3)Ch. 2 (Sections 2.1, 2,2)
Software
• Understanding Math Series
PRESCRIBED LEARNING OUTCOMES SUGGESTED INSTRUCTIONAL STRATEGIES
138
It is expected that students will:
• use basic arithmetic operations on realnumbers to solve problems.
• describe and apply arithmetic operations ontables to solve problems, using technology asrequired.
• use exact values, arithmetic operations andalgebraic operations on real numbers to solveproblems.
It is expected that students will:
• communicate a set of instructions used tosolve an arithmetic problem
• perform arithmetic operations on irrationalnumbers, using appropriate decimalapproximations
• create and modify tables from both recursiveand nonrecursive situations
• use and modify a spreadsheet template tomodel recursive situations
• perform operations on irrational numbers ofmonomial and binomial form, using exactvalues
• explain and apply the exponent laws forpowers of numbers and for variables withrational exponents
Many calculations in science, industry, and financeinvolve irrational numbers. Students need to be ableto perform simple calculations with irrationalnumbers and properly interpret the results. Althoughmany questions can be solved adequately usingapproximate values, students should be able to workwith exact representations of irrational numberswhere possible. Operations of radicals and exponentswith rational exponents build on algebraic andexponential skills previously learned.
A table enables organized data to be recognized andfacilitates calculations.
• Provide students with a descriptive paragraph orset of written instructions for guessing a secretnumber, and have them work out the series ofmathematical steps required. Ask them to confirmtheir process with a partner to test its accuracy.
• Ask students to find the maximum lengthumbrella that can fit in a rectangular gift box,bottom corner to top corner, for a box with rationallengths and for one with irrational lengths.
• Provide students with a descriptive paragraphcontaining numeric data (e.g., mutual funds over a10-year period) and ask them to organize the datainto a table.
• Give students a collection of sale papers and havethem comparison shop for specific items. Havethem place the results of the comparison in a tableand underline the best price.
• Provide students with a basic spreadsheettemplate for calculating the cost of building ahouse. Have them change the dimensions of thehouse and number of bathrooms and bedrooms tosee how the construction, electrical, plumbing, andtotal costs change.
• Have students work in pairs to design a templateto show balance owing on a sample credit cardaccount at the end of one month after a paymenthas been made.
• Discuss with the class the historical necessity ofoperations on radicals (e.g., calculators not yetinvented) and their place in the language ofmathematics.
• Assign an activity sheet to parallel the operationson radicals with operations on variables (e.g.,questions on both 2 7 3 7 5 7+ = and2 3 5x x x+ = ).
PRINCIPLES OF MATHEMATICS 10 • Number (Number Operations)
RECOMMENDED LEARNING RESOURCESSUGGESTED ASSESSMENT STRATEGIES
139
Number operations are the tools students use tosolve problems. Students need to demonstrate a clearunderstanding of the processes involved inperforming various operations involving irrationalnumbers and how the operations are used.
Observe• Note students’ abilities to use their calculators to
approximate 2 7 5× × , have them find 70
and compare.• Ask students to draw several regular polygons
and have them count the number of sides,diagonals, and intersection points and prepare atable showing this data. Observe students’ abilitiesto use the tables to describe how the values of eachpolygon can be predicted without counting.
Self-/ Peer Assessment• Have each student create a question involving
irrational numbers and submit the question and itssolution. Display students’ questions on theoverhead for the class to answer. Ask the class tocompare its solutions with those of the originatorsand determine whether students have correctlysolved their own questions.
• Have students write out a description of how toproduce Pascal’s Triangle and have a classmateuse their instructions to produce the first six rows.
Collect• Ask students to create a spreadsheet that would
show bills for a credit card account that wouldoccur in a situation in which no payments aremade. Assume the amount borrowed was $1000and the annual interest rate is 18% compoundedmonthly. Have them extend the table to show 12months of account balances. Ask students to writea letter from the bank explaining the table to thecredit card holder.
Presentation• Have students collect data from a school sports
team (e.g., free-throw percentage, penalties orfouls vs. minutes played) and create a table thatshows an analysis of calculated values. Havestudents present their results to the class.
PRINCIPLESS OF MATHEMATICS 10 • Number (Number Operations)
Print Materials
• Pure Mathematics 10 (Distance LearningPackage)
Multi-media
• The Learning Equation: Mathematics 10Lessons 5 - 11
• Mathematics 10, Western Canadian EditionCh. 1 (Section 1.5 - 1.8)Ch. 2 (Sections 2.2 - 2.4, 2.6 - 2.10)
• MATHPOWER 10, Western EditionCh. 1 (Sections 1.3 - 1.5, 1.7, 1.8)Ch. 2 (Section 2.1)
Software
• Secondary Math Lab Toolkit• Understanding Math Series
PRESCRIBED LEARNING OUTCOMES SUGGESTED INSTRUCTIONAL STRATEGIES
140
It is expected that students will generate andanalyse number patterns.
It is expected that students will:
• generate number patterns exhibitingarithmetic growth
• use expressions to represent general terms andsums for arithmetic growth, and apply theseexpressions to solve problems
• relate arithmetic sequences to linear functionsdefined over the natural numbers
• generate number patterns exhibitinggeometric growth
Many natural phenomena and man-made processesgrow and shrink according to easily definedmathematical rules. An understanding of arithmeticand geometric growth helps students to betterunderstand how the world around them changes.
• Give students a collection of arithmetic orgeometric sequences with blanks either betweenthe numbers or at the end of the sequence forstudents to fill in. Have them state the commondifference or ratio and give a word-based ruledescribing how one term is calculated from theprevious term.
• Have students find three examples of arithmetic orgeometric sequences found in nature or used bypeople in their day-to-day lives.
• Ask students to match a column of linearequations to a column of arithmetic sequences.
• Have students describe or model naturalphenomena that incorporate geometric sequencesin their structure (e.g., flowers, spiral shells, paperfolding).
• Give students numerical and non-numericalpatterns and ask them to define the rule(s) for eachpattern. Have them use the rules to makepredictions and classify the patterns.
• Have students use concepts of arithmetic andgeometric growth to solve problems such as:- If $1000 is deposited each year into an account
that earns 12% compounded annually, howmuch money will have accumulated after 25years?
Then have them:- generate a model of this situation- identify it as geometric or arithmetic- discuss the answer (Is it surprising?
Reasonable?)
PRINCIPLES OF MATHEMATICS 10 • Patterns and Relations (Patterns)

RECOMMENDED LEARNING RESOURCESSUGGESTED ASSESSMENT STRATEGIES
141
Assessment strategies should demonstrate algebraicskills as well as holistic pattern recognition. Studentsshould also be able to articulate methods to aid inpattern discovery.
Observe• How quickly do students see the patterns in
partially completed sequences:- with no hints (2, 5, 8…)- with hints (2, _, _, 16, _… - geometric)
• Can students develop a mathematical equationfrom a sequence?
Question• Can students articulate what to look for in
determining whether a collection of numbers is anarithmetic sequence, geometric sequence, orneither?
Collect• Have students collect five arithmetic, five
geometric, and five other sequences. Provide themwith equations or descriptions of how to generateeach sequence.
Peer/Self Assessment• Have each student develop a connect-the-dots
puzzle using a combination of sequences andlinear equations. Ask them to have anotherstudent do the puzzle and check it for accuracy.
PRINCIPLESS OF MATHEMATICS 10 • Patterns and Relations (Patterns)
Print Materials
• Exploring Advanced Algebra with the TI-83• An Introduction to the TI-82 Graphing
Calculator• Modeling Motion: High School Math
Activities with the CBR• Pure Mathematics 10 (Distance Learning
Package)• A Visual Approach to Algebra
Multi-media
• The Learning Equation: Mathematics 10Lessons 22 - 24
• Mathematics 10, Western Canadian EditionCh. 1 (Sections 1.1, 1.2, 1.4)Ch. 5 (Section 5.5)
• MATHPOWER 10, Western EditionCh. 2 (Sections 2.3, 2.5, 2.7)
Software
• Secondary Math Lab Toolkit• Understanding Math Series
Games/Manipulatives
• Radical Math: Math Games Using Cards andDice (Volume VII)
CD-ROM
• Geometry Blaster
PRESCRIBED LEARNING OUTCOMES SUGGESTED INSTRUCTIONAL STRATEGIES
142
It is expected that students will generalizeoperations on polynomials to include rationalexpressions.
It is expected that students will:
• factor polynomial expressions of the formax bx c2 + + and a x b x2 2 2 2−
• find the product of polynomials• divide a polynomial by a binomial and
express the result in the forms:
-P
DQ
R
D= +
- P DQ R= +- P x D x Q x R( ) ( ) ( )= +
• determine equivalent forms of simple rationalexpressions with polynomial numerators, anddenominators that are monomials, binomialsor trinomials that can be factored
• determine the nonpermissible values for thevariable in rational expressions
• perform the operations of addition,subtraction, multiplication, and division onrational expressions
• find and verify the solutions of rationalequations that reduce to linear form
Extensive exposure to factoring will help studentsincrease their skills in manipulating algebraicexpressions and consolidate their understanding ofalgebraic ideas and procedures. Appropriatetechnology can enhance student learning and extendskill development.
• Model the use of algebra tiles to representquadratic equations. Have students work in pairsto manipulate the tiles to do factoring.
• Demonstrate types and methods of factoring.Provide or have students create examples offactoring and ask them to create the types andtherefore the processes to be used. Have studentsjustify and discuss their solutions in groups.
• Discuss as a class the ideas that not all data in real-world problems fit a linear model and that theremay be more than one solution to a problem. Pointout that solutions for such problems are usuallymore difficult to calculate than those for problemsthat fit the linear model (e.g., 10 11 6 02x x+ − = ).Present a quadratic that does not factor anddiscuss possible solutions with the class. Are thereany solutions?
• Have students use available technology tocompare graphs of the quadratic functions withthe equation, and to relate the zeros to the factors.
• Ask students to suggest reasons for simplifyingexpressions (e.g., to solve complex problemsinvolving polynomial functions and equations).
• Have students factor polynomial expressions(trinomials) using trial and error. Give examples ofpolynomial equations that students would havedifficulty recognizing without the skills offactoring or simplifying.
• Encourage students to develop their skills infactoring perfect square trinomials, by practisingsquaring binomials by sight.
• Ask students to graph rational functions on theirgraphing calculator to link the excluded value
with the asymptote (e.g., yx
x= −
+32
).
• Shuffle a card deck consisting of factored and non-factored pairs of polynomials, give each student acard, and ask them to find their partners.
PRINCIPLES OF MATHEMATICS 10 • Patterns and Relations (Variables and Equations)

RECOMMENDED LEARNING RESOURCESSUGGESTED ASSESSMENT STRATEGIES
143
In order to solve equations and problems based onquadratic and rational expressions, students must beable to factor polynomials and understand when aroot is extraneous. Assessment strategies shouldfocus on observing student proficiency of these twoconcepts.
Observe• Develop a concentration card game using cards
that consist of polynomials in factored and non-factored form. Observe the speed at whichstudents can match cards and win the game.
• Have students model factored polynomials usingalgebra tiles.
Question• Encourage students to verbalize the patterns
involved in factoring various types ofpolynomials.
• Have students draw connections betweenrestrictions for a rational expression and theasymptotes on its graph.
Collect• Give students a worksheet of non-simplified
rational expressions. Post simplified answers andrestrictions around the room on posters and havestudents record the locations of correct answers.
• Have each student develop a one-page summaryof skills involved in factoring. Alternatively, havethem write the summaries in flow chart form.
Peer/Self Evaluation• Have students work in pairs to develop a factoring
puzzle or rational expression. Photocopy the workof each pair and give it to another pair to solveand assess by criteria supplied by the teacher ordeveloped as a class activity.
PRINCIPLES OF MATHEMATICS 10 • Patterns and Relations (Variables and Equations)
Print Materials
• Exploring Advanced Algebra with the TI-83• Exploring Functions with the TI-82 Graphics
Calculator• Graphing Calculator Activities for Enriching
Middle School Mathematics• An Introduction to the TI-82 Graphing
Calculator• Modeling Motion: High School Math
Activities with the CBR• Pure Mathematics 10 (Distance Learning
Package)• A Visual Approach to Algebra
Multi-media
• The Learning Equation: Mathematics 10Lessons 25 - 33
• Mathematics 10, Western Canadian EditionCh. 6 (Sections 6.4 - 6.6, 6.10)Ch. 7 (Sections 7.1 - 7.7)
• MATHPOWER 10, Western EditionCh. 3 (Sections 3.3, 3.4, 3.6, 3.8 - 3.10)Ch. 4 (Sections 4.2 - 4.9)
Software
• Green Globs & Graphing Equations• Secondary Math Lab Toolkit• Understanding Math Series
Games/Manipulatives
• Radical Math: Math Games Using Cards andDice (Volume VII)

PRESCRIBED LEARNING OUTCOMES SUGGESTED INSTRUCTIONAL STRATEGIES
144
It is expected that students will:
• examine the nature of relations with anemphasis on functions.
• represent data, using linearfunction models.
It is expected that students will:
• plot linear and nonlinear data, usingappropriate scales
• represent data, using function models• use a graphing tool to draw the graph of a
function from its equation• describe a function in terms of:
- ordered pairs- a rule, in word or equation form- a graph
• use function notation to evaluate andrepresent functions
• determine the domain and range of a relationfrom its graph
• determine the following characteristics of thegraph of a linear function, given its equation:- intercepts- slope- domain- range
• use partial variation and arithmetic sequencesas applications of linear functions
Describing functional relationships is essential tointerpreting and predicting the behavior of the worldaround us. Students will explore ways to translatebetween algebraic and graphical representations anduse these skills to make inferences and solve problems.
• Ask students to explore non-linear functions withgraphing technology such as calculators orcomputer software programs. Discuss thesimilarities and differences in the graphs andequations with the class.
• Have students use graphing calculators orcomputers to graph y x= and investigate thegraphic changes as a number is added (e.g.,y x 3= + and when is multiplied by a constant(e.g., y x= −2 ) to develop the concept y mx b= + .Have them record their findings in their journals,using their own words.
• Ask students to work in groups to determinetechniques that will generate linear equations,given information other than slope and intercept.
• To explore the relationship of linear equations incomputer programming, have students work inco-operative groups to generate short programsthat produce linear drawings, then share thesewith the class.
• Organize a carousel activity in which studentsmove in groups around various stations set upwith activities to generate data. Students decide asa group how best to graph or display the data.Discuss as a class the similarities and differencesin the solutions.
• Use a bakery model (ingredients in → pastry out)or a sawmill/pulp model (logs in → lumberpulp/paper out) to illustrate the concept ofdomain and range.
• Have students use a function machine to calculatethe range of a function from its domain.
• Have students generate two data points in a linearfunction (e.g., kilometres driven and car rentalcost) and graph them. Ask them to generate modelfunctions to answer questions about the intercepts(fixed costs) and slope (variable costs).
• Ask students to use maps and scale diagrams tocalculate distances and sizes.
PRINCIPLES OF MATHEMATICS 10 • Patterns and Relations (Relations and Functions)

RECOMMENDED LEARNING RESOURCESSUGGESTED ASSESSMENT STRATEGIES
145
Plotting data, and the subsequent analysis ofrelations and functions, are key to studentunderstanding of patterns. Assessment in this areashould focus on students’ ability to performindividual outcomes (such as graphing andanalyzing functions derived from the physicalworld), and reflect students’ understanding of theuses of graphs.
Collect• Have students collect data on relations between
pizza costs and diameters. This data could berepresented as a list of ordered pairs, expressed asa rule, described in equation form, as a handsketched graph, and finally drawn using agraphing calculator. Check particularly forstudents’ ability to select scale, find slope inappropriate units, and select window parameters.
Question• As students work on using function notation,
evaluating functions and determining domain,range, intercepts and slope, check for their abilityto work competently using both sketches andgraphing tools. Note students’ abilities to translatetheir graphing skills to understand the real-worldimplications of the data.
Presentation• Have students conduct research into the cost of
video rentals over time and present the data as alist of ordered pairs and the graph of the function.Note students’ understanding of the use of thegraph they have created (e.g., At what point hasthe rental cost exceeded purchase price?).
Peer Assessment• Ask students to work in pairs using graphing
calculators. Students can display graphs on theircalculators, then challenge their partners toreproduce the graphs on their own calculators.
PRINCIPLES OF MATHEMATICS 10 • Patterns and Relations (Relations and Functions)
Print Materials
• Exploring Functions with the TI-82 GraphicsCalculator
• Graphing Calculator Activities for EnrichingMiddle School Mathematics
• An Introduction to the TI-82 Graphing Calculator• Modeling Motion: High School Math
Activities with the CBR• Pure Mathematics 10 (Distance Learning
Package)• Using the TI-81 Graphics Calculator to Explore
Functions• A Visual Approach to Algebra• What If ...?: The Straight Line: Investigations
with the TI-81 Graphics Calculator• What If ...?: The Straight Line: Investigations
with the TI-82 Graphics Calculator
Multi-media
• The Learning Equation: Mathematics 10Lessons 34 - 42
• Mathematics 10, Western Canadian EditionCh. 5 (Sections 5.1 - 5.7)
• MATHPOWER 10, Western EditionCh. 5 (Sections 5.1 - 5.6)Ch. 6 (Sections 6.5 - 6.8)
Software
• GrafEq (Macintosh & Windows Version 2.09)• Green Globs & Graphing Equations• Secondary Math Lab Toolkit
Games/Manipulatives
• Radical Math: Math Games Using Cards andDice (Volume VII)

PRESCRIBED LEARNING OUTCOMES SUGGESTED INSTRUCTIONAL STRATEGIES
146
It is expected that students will:
• demonstrate an understanding of scale factors,and their interrelationship with thedimensions of similar shapes and objects.
• solve problems involving triangles, includingthose found in 3-D and 2-D applications.
It is expected that students will:
• calculate the volume and surface area of asphere, using formulas that are provided
• determine the relationships among linear scalefactors, areas, the surface areas and thevolumes of similar figures and objects
• solve problems involving two right triangles• extend the concepts of sine and cosine for
angles through to 180˚• apply the sine and cosine laws, excluding the
ambiguous case, to solve problems
Many worthwhile and practical problems inmathematics involve shape and space and are mosteasily solved by labeling a drawing. Some drawingswork best when reduced to scale while in other casesan annotated sketch is sufficient. Visualizing shapeand space is a critical component of learningmathematics.
• Bring a collection of spherical balls related tovarious sports into the classroom. Have studentsfind the circumference of each ball using a fabrictape, and, from the circumference, calculateradius-diameter-area of the greatest circle. Askthem to place the results in a table and find therelationship between each column and classify itas linear or non-linear.
• Discuss the limitations in manufacturing that largestructures increase in weight faster than thesurface area increases which results in the need forspecial bracing to keep them from collapsing.
• Discuss why smaller animals require fastermetabolisms to maintain a constant bodytemperature, and require more food as volumedecreases faster than the surface area decreases.
• Have students use equipment such as a parallaxviewer (for range) and clinometer (for height) toanalyse the motion of a ball thrown on a field,resolving the motion into horizontal and verticalcomponents. Point out that the horizontal motionvs. time is linear while the vertical motion vs. timeis described using a quadratic function (i.e.,non-linear).
• Provide students with pictures of non-righttriangles that show either two sides and one angleor two angles and one side. Have studentscalculate the missing side or angle. A practicalexample might involve using an orienteering map.
• Give instructions to students (in terms of anglesand sides) to move to a certain point in two steps(two sides of a triangle), using Law of Cosines orLaw of Sine to calculate how to return to thestarting point.
PRINCIPLES OF MATHEMATICS 10 • Shape and Space (Measurement)

RECOMMENDED LEARNING RESOURCESSUGGESTED ASSESSMENT STRATEGIES
147
Assessment of students’ measurement skills reflectstheir abilities to calculate using formulas, and to seeand use the relationships that exist among scalefactors, areas, and volumes. Assessment should focuson students’ abilities to extract relevant triangleinformation from drawn or written problems, as wellas their abilities to solve simple triangle problems.
Observe• While students are solving problems involving
scale, note their ability to transfer skills to newsituations. Ask them, for example, to estimate thechange in surface area that occurs as a result ofincreasing one of the dimensions of an object.Check their results and ask them to explain anydifferences.
• Note students’ ability to translate writtenproblems into sketches, including those whoseangles range from 0° to 180°. Observe students’ability to use calculators and manipulate anglerepresentations to solve problems.
Collect• Check students’ solutions to problems for clarity
and presentation. Students should be able toexplain the strategy they used to solve selectedproblems.
• Post a number of sketches around the classroom.Give students a worksheet with word problems onit. Have them match sketches to appropriateproblems. To make it interesting, give out differentsheets with the problems scrambled. Provide oneor two problems with no sketch and post moresketches than problems.
Peer/Self-Assessment• Have students create two or three problems
involving sine and cosine laws, including solutions.Students should exchange problems with a partnerand have the partner complete, and then commenton, the construction of the problem and its solution.
Presentation• Have students work in pairs on problems from the
construction or other industry, and have themwrite up and present solutions to the rest of theclass.
PRINCIPLESS OF MATHEMATICS 10 • Shape and Space (Measurement)
Print Materials
• Pure Mathematics 10 (Distance LearningPackage)
Multi-media
• The Learning Equation: Mathematics 10Lessons 12 - 16
• Mathematics 10, Western Canadian EditionCh. 6 (Sections 6.1, 6.2)Ch. 8 (Sections 8.4 - 8.6)
• MATHPOWER 10, Western EditionCh. 7 (Sections 7.2, 7.3, 7.5 - 7.8)
Software
• The Geometer’s Sketchpad• Understanding Math Series
CD-ROM
• Geometry Blaster

PRESCRIBED LEARNING OUTCOMES SUGGESTED INSTRUCTIONAL STRATEGIES
148
It is expected that students will solve coordinategeometry problems involving lines and linesegments.
It is expected that students will:
• solve problems involving distances betweenpoints in the coordinate plane
• solve problems involving midpoints of linesegments
• solve problems involving rise, run and slopeof line segments
• determine the equation of a line, giveninformation that uniquely determines the line
• solve problems using slopes of:- parallel lines- perpendicular lines
Being able to measure using instruments andunderstanding measurement limitation isfundamental to applying mathematics practically.Assessing students’ abilities to solve formulaproblems, or drawing interpretation problems shouldbe done in a variety of ways that reflect real worldmethodologies.
• Using a geoboard, have students stretch an elasticbetween two posts to form a line segment, thenstretch one side of the elastic around theappropriate post to form a right triangle. Havethem measure the orthogonal sides by countingthe posts and use the Pythagorean Theorem tofind the length of the original line segment(hypotenuse of triangle).
• Have students use a clinometer to measure theangle to the top of a building and connect thetangent of the angle to the slope of the line to thetop of the building.
• Develop a five-station carousel where each stationhas a different type of word problem (e.g.,distance, midpoint, slope, equations of lines,parallel and perpendicular lines). Design atreasure hunt or rally to send students from stationto station to solve problems. Use a point system toaward prizes for the most accurate solutions.
• Given an equation for a line, have students list fiveunique pieces or types of information that theycould use to find that equation. For example,given 2 3 6x y− = students could list the following:- different points on the line (6,2),(9,4),...- slope of line is m=2/3- y-intercept is b = -2 or the point (0,-2)- x-intercept = 3 or the point (3,0)- standard form of equation, 2 3 6x y− =
- slope intercept form is: y x= −23
2
• Have students use a graphing calculator orgraphing software to explore the similar attributesof parallel or perpendicular lines. Give studentssix lines to graph and have them note which linesare parallel or perpendicular, analysing thesimilarities in their equations.
• Have students use technology with dynamicgeometry software to draw two lines, then rotateone line. Have them note how its slope changes asit first becomes parallel, then perpendicular to theother line.
PRINCIPLES OF MATHEMATICS 10 • Shape and Space (3-D Objects and 2-D Shapes)
RECOMMENDED LEARNING RESOURCESSUGGESTED ASSESSMENT STRATEGIES
149
Solving problems on the coordinate plane is a naturalextension of graphing, geometry, and algebraic skills.Assessment should focus students’ conceptualizationof the coordinate plane and its uses in understandingthe world around them.
Observe• Take note of students’ approaches to word
problems that require line and segment solutions.Students should be able to explain the steps theytook to translate word problems into a coordinaterendering. Observe students’ abilities to draw andlabel clearly.
• Have students model solutions to problems on ageoboard where appropriate.
Question• For select problems, question students as to the
method they used. For example, ask if the studentcan check a pen-and-paper solution using agraphing tool or vice versa.
Presentation• Ask students to select a graphic representation of a
solution to a problem they have created. Havethem present the problem to members of a smallgroup and then teach the problem solution. It ismotivational and good assessment to use studentcreated problems on teacher tests whereappropriate.
Collect• Place information about various lineal equations
on file cards on a table. Give students one file cardand have them list or collect cards with datarelated to the equation on their card.
Peer Assessment• Ask students to work in pairs using graphing
calculators. Students can display graphs on theircalculators, then challenge their partners toreproduce the graphs on their own calculators.
• Have one student generate an equation in slope-intercept form and a partner change it to generalform and vice versa. Students can check eachother’s work for accuracy.
PRINCIPLES OF MATHEMATICS 10 • Shape and Space (3-D Objects and 2-D Shapes)
Print Materials
• Pure Mathematics 10 (Distance LearningPackage)
Multi-media
• The Learning Equation: Mathematics 10Lessons 17 - 21
• Mathematics 10, Western Canadian EditionCh. 3 (Sections 3.1 - 3.5)Ch. 4 (Sections 4.1 - 4.5)
• MATHPOWER 10, Western EditionCh. 6 (Sections 6.1 - 6.7)
Software
• The Geometer’s Sketchpad• Green Globs & Graphing Equations• Secondary Math Lab Toolkit
Games/Manipulatives
Radical Math: Math Games Using Cards andDice (Volume VII)
CD-ROM
• Geometry Blaster

PRESCRIBED LEARNING OUTCOMES SUGGESTED INSTRUCTIONAL STRATEGIES
150
It is expected that students will implement andanalyse sampling procedures, and drawappropriate inferences from the data collected.
It is expected that students will:
• choose, justify and apply sampling techniquesthat will result in an appropriate, unbiasedsample from a given population
• defend or oppose inferences andgeneralizations about populations, based ondata from samples
Most data collection involves the use of samplesrather than populations. Understanding the uses,advantages, and disadvantages of sampling is criticalto interpreting statistical information.
• Ask students to identify ways of using samplingto deliberately skew survey results (e.g., survey ofprobable Stanley Cup winners by polling only fansof one team, survey of favourite musical groupsby polling people from only one age group). Havestudents identify examples of biased or invalidsamples on data reported in the media. Ask themto work in groups to analyse the data anddetermine what the sample population might havebeen. Discuss as a class.
• Have students suggest real-world applications forusing distributions (e.g., knowing the sizedistribution, how many of each shoe size a shoestore should stock).
• Invite a pollster to speak to the class about pollingas a sampling technique. Discuss various types ofpolls (e.g., random selection, target market, phone-in polls). Ask students: Are each of these samplingtechniques unbiased? If they are biased, how?(e.g., a telephone sample would not includepeople who do not speak English well enough toanswer the questions)
• Students could design a survey, drawing theirsample from the school or community at large.Have students justify their survey content andsampling method. Ask students to draw validnon-trivial conclusions from their data.
• Give students a series of case studies involvingsurvey information and have them critique thestudies and support or reject conclusions in thecase studies. Alternatively, limit the case study tothe survey setup and data and then have studentsdevelop their own conclusions.
PRINCIPLES OF MATHEMATICS 10 • Statistics and Probability (Data Analysis)

RECOMMENDED LEARNING RESOURCESSUGGESTED ASSESSMENT STRATEGIES
151
Projects of both long and short duration provide abasis for ongoing assessment and summativeevaluation. Assessment in this area should givestudents a chance to demonstrate their skills andknowledge while completing projects they findmeaningful.
Collect• Have students design and conduct research
projects requiring them to choose and applysampling techniques. As students work on theirprojects, ask questions such as:- How did you choose your sampling technique?- Can you justify your choice?- Can you identify possible sources of bias or
error in your sample?- When might someone want to bias a sample
and how might they do it?- What makes the graphical representations you
are using appropriate for your data?- How are your conclusions affected by your
sample?• Work with students to develop criteria they can
use to assess their projects. Students use thecriteria to assess their own work, then describehow their projects could be changed to correctidentified problems. Criteria might include:- a clear description of sampling procedures- justification for the sampling technique- accurate identification of possible reasons for
bias or error- effective graphical representations of data
summaries- appropriate references, clearly linked to the
data, about the population from which thesample was taken
Self-/ Peer Assessment• Provide students with materials necessary to
develop study cards describing terms andconcepts related to data analysis. Have studentsquiz one another using the cards. Small groups ofstudents can use the cards to compose tests forother groups to take. Give students basic testrequirements such as length and type of items.Students should be able to answer their ownquestions.
PRINCIPLES OF MATHEMATICS 10 • Statistics and Probability (Data Analysis)
Print Materials
• Exploring Statistics with the TI-82 GraphicsCalculator
• Graphing Calculator Activities for EnrichingMiddle School Mathematics
• An Introduction to the TI-82 GraphingCalculator
• Modeling Motion: High School MathActivities with the CBR
• Pure Mathematics 10 (Distance LearningPackage)
• What If ...?: The Straight Line: Investigationswith the TI-82 Graphics Calculator
Multi-media
• The Learning Equation: Mathematics 10Lessons 43 & 44
• Mathematics 10, Western Canadian EditionCh. 9 (Sections 9.1 - 9.4)
• MATHPOWER 10, Western EditionCh. 8 (Sections 8.1 - 8.4)
Software
• Secondary Math Lab Toolkit


RECOMMENDED LEARNING RESOURCESSUGGESTED ASSESSMENT STRATEGIES
153
CURRICULUMPrinciples of Mathematics 11

PRESCRIBED LEARNING OUTCOMES SUGGESTED INSTRUCTIONAL STRATEGIES
154

RECOMMENDED LEARNING RESOURCESSUGGESTED ASSESSMENT STRATEGIES
155
ESTIMATED INSTRUCTIONAL TIME
Principles of Mathematics 11 has been developed assuming that teachers have 100 instructionalhours available to them. The following chart shows the estimated instructional time for eachcurriculum suborganizer, expressed as a percentage of total time available to teach the course.
When delivering the prescribed curriculum, teachers may freely adjust the instructional time to meettheir students’ diverse needs. These estimated instructional times have been recommended by the IRPwriters to assist their colleagues; they are suggestions only.
Organizer (Suborganizer) % of Time
Problem Solving Integrated Throughout
Number (Number Operations) 10 - 20
Patterns and Relations (Patterns) 5 - 15
Patterns and Relations (Variables and Equations) 15 - 25
Patterns and Relations (Relations and Functions) 20 - 25
Shape and Space (Measurement) 5 - 10
Shape and Space (3-D Objects and 2-D Shapes) 20 - 30
PRINCIPLES OF MATHEMATICS 11

PRESCRIBED LEARNING OUTCOMES SUGGESTED INSTRUCTIONAL STRATEGIES
156
PRINCIPLES OF MATHEMATICS 11 • Problem Solving
It is expected that students will use a variety ofmethods to solve real-life, practical, technical,and theoretical problems
It is expected that students will:
• solve problems that involve a specific contentarea such as geometry, algebra, trigonometry,statistics, probability
• solve problems that involve more than onecontent area
• solve problems that involve mathematicswithin other disciplines
• analyse problems and identify the significantelements
• develop specific skills in selecting and usingan appropriate problem-solving strategy orcombination of strategies chosen from, but notrestricted to, the following:- guess and check- look for a pattern- make a systematic list- make and use a drawing or model- eliminate possibilities- work backward- simplify the original problem- develop alternative original approaches- analyse keywords
• demonstrate the ability to work individuallyand co-operatively to solve problems
• determine that their solutions are correct andreasonable
• clearly explain the solution to a problem andjustify the processes used to solve it
• use appropriate technology to assist inproblem solving
Problem solving is a key aspect of any mathematicscourse. Working on problems involving a range ofmathematical disciplines can give students a sense ofthe excitement involved in creative and logicalthinking. It can also help students developtransferable real-life skills and attitudes. Multi-strandand interdisciplinary problems should be includedthroughout Principles of Mathematics 11.
• In a class discussion, define problem solving withstudents, pointing out that in mathematicsproblem solving involves many disciplines,including algebra, geometry, trigonometry,statistics, and probability.
• Introduce new types of problems directly tostudents (i.e., without demonstration), andfacilitate as they attempt to solve them.
• Have students work in small co-operative groupsof three to five when introducing new types ofproblems.
• Model and reinforce student use of a variety ofapproaches to problem solving (e.g., algebraic andgeometric).
• Emphasize that many problems may not be solvedin one try and that it is sometimes necessary torevisit the problem, start over, and try again.
• Have students or groups discuss their thoughtprocesses as they attempt to solve a problem.Point out the strategies inherent in their thinking(e.g., guessing and checking, looking for a pattern,making and using a drawing or model).
• Ask leading questions such as:- What are you being asked to find out?- What do you already know?- Do you need additional information?- Have you ever seen similar problems?- What else can you try?
• When students arrive at solutions to particularproblems, encourage them to generalize from orextend the problem situations.
Note: See Appendix G for examples of multi-strandand interdisciplinary problems that most studentsshould be able to solve. These problems are indicatedwith an asterisk (*)

RECOMMENDED LEARNING RESOURCESSUGGESTED ASSESSMENT STRATEGIES
157
PRINCIPLESS OF MATHEMATICS 11 • Problem Solving
Students analyse problems and solve them using avariety of approaches. Assessment of problem-solving skills is made over time, based onobservations of many situations.
Observe• Have students present solutions to the class
individually, in pairs, or in small groups. Note theextent to which they clarify their problems andhow succinctly they describe the processes used.
Question• To check the approaches students use when
solving problems, ask questions that prompt themto:- paraphrase or describe the problem in their
own words- explain the processes used to derive an answer- describe alternative methods to solve a problem- relate the strategies used in new situations- link mathematics to other subjects and to the
world of work
Collect• For selected problems, have students annotate
their work to describe the processes they used.Alternatively, have them provide briefdescriptions of what worked and what did not forparticular problems.
Self-Assessment• Ask students to keep journals to describe the
processes they used in dealing with problems.Have them include descriptions of strategies thatworked and those that did not.
• Develop with students a set of criteria to self-assess problem-solving skills. The reference set,Evaluating Problem Solving Across Curriculum, maybe helpful in identifying such criteria.
Please see the introduction to Appendix B for alist of suggested utility software that supportsthis course.
The Western Canadian Protocol LearningResource Evaluation Process has also identifiednumerous teacher resources and professionalreferences. These are generally cross-gradeplanning resources that include ideas for avariety of activities and exercises.
These resources, while not part of the GradeCollections, have Provincially Recommendedstatus.
Appendix B includes an annotated bibliographyof these resources for ordering convenience.

PRESCRIBED LEARNING OUTCOMES SUGGESTED INSTRUCTIONAL STRATEGIES
158
PRINCIPLES OF MATHEMATICS 11 • Number (Number Operations)
It is expected that students will solve consumerproblems, using arithmetic operations.
It is expected that students will:
• solve consumer problems, including:- wages earned in various situations- property taxation- exchange rates- unit prices
• reconcile financial statements including:- cheque books with bank statements- cash register tallies with daily receipts
• solve budget problems, using graphs andtables to communicate solutions
• solve investment and credit problemsinvolving simple and compound interest
A working knowledge of the skills involved inmoney management is of advantage to all studentsthroughout their lifetimes. An understanding ofprocedures and applications of mathematics can helpstudents make rational economic decisions.
• Explain various deductions from earnings, thenhave students determine the effects of thesedeductions on gross pay. Students who have jobscould use their pay slips as examples.
• Have students use tables, calculators, andcomputer spreadsheets to compare the effects ofvarious rates of compounding interest on personalinvestments and loans.
• Invite a guest speaker (e.g., accountant, banker,financial planner) to talk about credit and loans.Have students prepare questions that focus on theunderlying mathematics involved.
• Ask students to use information collected fromadvertising (e.g., print, television, on-line) tocompare the cost of paying cash for an item to thecost of buying on a variety of credit plans.
• Have students use spreadsheet software to:- record and track expenditures- build mortgage and other repayment schedules
• Have each student use spreadsheet software toprepare a budget, given:- an income (e.g., salary, wages, commissions,
investments, pension)- fixed expenses (e.g., utilities, rent, insurance,
deductions, savings, investment)- variable expenses (e.g., clothes, entertainment)
• Ask students questions that require interpretationof the budget (e.g., How long would it take to saveenough money to make a major purchase?).
RECOMMENDED LEARNING RESOURCESSUGGESTED ASSESSMENT STRATEGIES
159
PRINCIPLESS OF MATHEMATICS 11 • Number (Number Operations)
Consumer problems play an important role in thedaily lives of students. To assess students’ thinkingand the strategies they are using, note their abilitiesto estimate, predict, calculate (using appropriateformulae and technology), make financial decisions,and verify the reasonableness of their conclusions. Asthey check their solutions and justify theirmathematical thinking, look for evidence ofdeveloping abilities to communicate mathematically.
Observe• As students work on problems involving money
management, observe their abilities to:- accurately create and modify various tables.- explain the advantages and disadvantages of
using credit cards, installment plans, and bankloans
• While students solve consumer problems, note theextent to which they:- estimate and verify their results using
appropriate technology- apply a variety of strategies- generalize from their solutions- assess the usefulness of different Suggested
Instructional Strategies- observe soundness of reasoning for financial
decisions
Question• Have each student interview someone who works
in the financial field, and write a reportsummarizing the research. Review each report,looking for evidence that the student is able to:- identify all facets of the job- give information about the use of technology in
the industry- identify personal attributes and required skills
for workers in the field- general a list of educational requirements
Collect• Have students create budgets of income and
expenses for their personal situations usingspreadsheet and graphics programs.
Print Materials
• Mathematics 11, Western Canadian EditionCh. 1 (Sections 1.1 - 1.8)
• MATHPOWER 11, Western EditionCh. 9 (Sections 9.1 - 9.7)
Software
• Secondary Math Lab Toolkit

PRESCRIBED LEARNING OUTCOMES SUGGESTED INSTRUCTIONAL STRATEGIES
160
PRINCIPLES OF MATHEMATICS 11 • Patterns and Relations (Patterns)
It is expected that students will apply theprinciples of mathematical reasoning to solveproblems and to justify solutions.
It is expected that students will:
• differentiate between inductive and deductivereasoning
• explain and apply connecting words, such asand, or, and not, to solve problems
• use examples and counterexamples to analyseconjectures
• distinguish between an if–then proposition, itsconverse and its contrapositive
• prove assertions in a variety of settings, usingdirect and indirect reasoning
Students need to understand the language used inlogic and reasoning. This understanding assistsstudents in drawing conclusions distinguishingbetween facts and propaganda. These concepts ofmathematical reasoning need to be reinforced in allareas of mathematical study.
• Give students examples of deductive andinductive reasoning and have students work insmall groups to decide whether examples belongin either of two columns in a table, where onecolumn will contain deductive examples and onewill contain inductive examples.
• Have students use Venn diagrams to illustrateAND, OR, NOT and combinations of these. Useexamples from law where deductive proof is used.
• Have students analyse the logic used innewspaper articles or videos of television newsprograms that report statistical results and thatdraw oversimplified conclusions.
• Provide examples of debatable or controversialissues argued in a short paragraph and havestudents find flaws in the arguments.

RECOMMENDED LEARNING RESOURCESSUGGESTED ASSESSMENT STRATEGIES
161
PRINCIPLESS OF MATHEMATICS 11 • Patterns and Relations (Patterns)
Students should be able to recognize valid argumentsand reject invalid arguments. These skills should beassessed in all areas of mathematics.
Observe• While students are working in pairs and reading a
newspaper article or report, observe the extent towhich they are able to:- determine the valid arguments or facts- determine the point or conclusion of the
argument- distinguish between points that are logically
reached and conclusions that are sweepingstatements or simply do not follow logically
Question• Ask students to:
- list examples of if-then propositions, conversesand contrapositives
- design an if-then game where, for example, aperson’s turn ends when a connectingstatement cannot be made or when a conversestatement is made
- explain how they would prove that the sum ofthe angles in a polygon of n sides is (n- 2) x 180˚
- prove that objects with the same perimeter mayhave different areas
Collect• Ask students to collect newspaper articles that
present good arguments, some that jump toconclusions, and some that contradict themselves.
• Ask students to collect cartoon strips that showcausal relationships and give examples of if-thensituations.
Self-Assessment• Provide students with arguments that are either
flawed or not flawed. Have a student try toconvince the class of the conclusion and see if thegroup is correct in accepting or rejecting thearguments. This may lead to a class discussion(e.g., on how people can be swayed into believingothers such as sales pitches).
• Have students list necessary criteria for a goodargument.
Print Materials
• An Introduction to the TI-82 GraphingCalculator
• Mathematics 11, Western Canadian EditionCh. 6 (Sections 6.1 - 6.7)Ch. 7 (Section 7.5)Ch. 9 (Sections 9.4, 9.5)
• MATHPOWER 11, Western EditionCh. 6 (Sections 6.1 - 6.6)
• Modeling Motion: High School MathActivities with the CBR
Software
• Secondary Math Lab Toolkit
CD-ROM
• Geometry Blaster

PRESCRIBED LEARNING OUTCOMES SUGGESTED INSTRUCTIONAL STRATEGIES
162
PRINCIPLES OF MATHEMATICS 11 • Patterns and Relations (Variables and Equations)
It is expected that students will represent andanalyse situations that involve expressions,equations and inequalities.
It is expected that students will:
• graph linear inequalities, in two variables• solve systems of linear equations, in two
variables:- algebraically (elimination and substitution)- graphically
• solve systems of linear equations, in threevariables:- algebraically- with technology
• solve non-linear equations, using a graphingtool
• solve non-linear equations:- by factoring- graphically
• use the Remainder Theorem to evaluatepolynomial expressions, the Rational ZerosTheorem, and the Factor Theorem todetermine factors of polynomials
• determine the solution to a system ofnonlinear equations, using technology asappropriate
Polynomial functions can be used to model many complex,real-world situations. Students can use these functions andthe appropriate technology to solve problems that wouldotherwise be too difficult.
• Have students graph two equations on the samecoordinate plane, identify points of intersection, andcheck whether these satisfy each equation. Discuss thelimitations of graphing by referring to a system for whichthe solution values cannot be accurately determined bygraphing.
• Discuss solving a system of two equations in twovariables by reducing to one equation in one variable(start with simple examples).Substitution Method Elimination Method
3x + y = 6 2x + y = 7y = x + 2 2x – y = 3
• As enrichment, discuss possible ways of solving systemsof four equations in four variables, up to n equations invariables. Information Technology students could beencouraged to create programs that do this.
• Have students graph equation families such as:y = 2x, y = 2x + 3, and y = 2x + 4x + 2y = 4, 2x + 4y = 8, and 3x + 6y =12Have students identify the patterns that group thesefunctions into families. Ask them what relationshipsbetween coefficients and constants would result insystems having:- no solutions (parallel lines)- infinite solutions (concurrent lines)- a unique solution (intersecting lines)
• Have students use graphing calculators or computersoftware to introduce concepts related to polynomialfunctions, such as:- the effect on the graph when the sign of the leading
term is changed- the effect on the graph when multiple factors are
introduced- the relationship between factors of a polynomial and
zeros of the associated polynomial function- the relationship between the degree of a polynomial
and its general shape- the relationship of the constant term to the y-intercept
of the graph• Have students create functions that contain specified
characteristics (e.g., tangent, multiple zeros). Use theseexamples to illustrate the connections between thefunction and its graph.

RECOMMENDED LEARNING RESOURCESSUGGESTED ASSESSMENT STRATEGIES
163
PRINCIPLESS OF MATHEMATICS 11 • Patterns and Relations (Variables and Equations)
In assessing student performance involving relationsand functions, it is important to observe students’abilities to recognize patterns and functionalrelationships. In working with polynomial functionsand equations, students demonstrate their reasoningthrough the application of algebraic skills andgraphical skills and by making interpretations,generalizations, and representations.
Observe• As students solve systems of linear equations,
watch for and provide feedback on the extent towhich they are able to:- use a variety of methods to solve problems- determine the domain and range for given
relations- solve applied problems
• Note students’ efforts to create functions or graphsthat adhere to prescribed conditions, using paperand pencil or graphing technology. For example,have students write a polynomial function with adouble zero at (-2,0), single zero at (30,0), andpassing through the point (1,5)). Observe to whatextent students give logical reasons for the choicesthey made.
Self-Assessment• Pose questions such as the following to help
students review what they learned:- What are the most important ideas you learned
about solving linear equations?- How are these ideas connected to what you
already knew and to the world around you?• To assess students’ command of nonlinear
functions and equations, have them list commonmisconceptions or difficulties they encounter insolving the equations, or while graphing thefunctions.
Collect• Discuss with students the relative merits of the
various methods of analyzing and displayingsolutions for nonlinear equations. Have themsummarize in writing their understanding of themerits of each. Work with them to develop a set ofcriteria to assess the summaries.
Print Materials
• Explore Quadratic Functions with the TI-83 orTI-82
• Exploring Functions with the TI-82 GraphicsCalculator
• An Introduction to the TI-82 GraphingCalculator
• Mathematics 11, Western Canadian EditionCh. 4 (Sections 4.1 - 4.8)Ch. 5 (Sections 5.1 - 5.8)
• MATHPOWER 11, Western EditionCh. 1 (Sections 1.2 - 1.6)Ch. 2 (Sections 2.1, 2.3)Ch. 4 (Sections 4.1, 4.8 - 4.10)
• Modeling Motion: High School MathActivities with the CBR
Software
• Green Globs & Graphing Equations• Secondary Math Lab Toolkit

PRESCRIBED LEARNING OUTCOMES SUGGESTED INSTRUCTIONAL STRATEGIES
164
PRINCIPLES OF MATHEMATICS 11 • Patterns and Relations (Relations and Functions)
It is expected that students will:
• represent and analyse quadratic, polynomaland rational functions, using technology asappropriate
• examine the nature of relations with anemphasis on functions
It is expected that students will:
• determine the following characteristics of thegraph of a quadratic function:- vertex- domain and range- axis of symmetry- intercepts
• perform operations on functions andcompositions of functions
• determine the inverse of a function• connect algebraic and graphical
transformations of quadratic functions, usingcompleting the square as required
• model real-world situations, using quadraticfunctions
• solve quadratic equations, and relate thesolutions to the zeros of a correspondingquadratic function, using:- factoring- the quadratic formula- graphing
• determine the character of the real and non-real roots of a quadratic equation, using:- the discriminant in the quadratic formula- graphing
• describe, graph, and analyse polynomial andrational functions, using technology
• formulate and apply strategies to solveabsolute value equations, radical equations,rational equations, and inequalities
Describing functional relationships is essential tointerpreting and predicting the behaviour of theworld around us. Students will explore how totranslate between algebraic and graphicalrepresentations and use these skills to makeinferences and solve problems.
• Demonstrate the concept of a function as amachine (e.g., g(x) = x2 + 3, the “g” functionalways takes what you give it, squares it, and addsthree to it).
• To demonstrate substitution of functions, alwaysshow the same function in the same color,especially when substituting into another.
• To develop the concept of the inverse of a function,provide five or six functions and have students:- make tables of values for them and graph them
all in blue ink- switch x and y in the original equations and call
the new equations the “inverse” equations- graph the new “inverse” equations on the same
grid as the originals in red ink, pointing outthat it may be easier to first solve the equationsfor y and then to make a table of values tograph the inverses
- analyse the relationship between the originalblue function and the new red function on eachgrid, describe the transformation,and draw the“mirror” line as a black dashed line
- describe the “mirror” line as an algebraicequation
• Have students:- use programmable calculators or calculators with
built-in programs to solve quadratic equations- use graphing calculators or computer graphing
programs to illustrate the solutions of quadraticequations
• Suggest that students create a question comparingticket price to revenue. Display the graph of thefunction on the graphing calculator and analysekey values (e.g., maximum value, intercepts, curveshape). As algebraic techniques are introduced,compare the algebraic results with the graphingcalculator results.
• Obtain non-linear data through experiments orcalculator based laboratory (e.g., heights of fallingobjects) and solve them for the roots, vertices, andtime at a given height.
RECOMMENDED LEARNING RESOURCESSUGGESTED ASSESSMENT STRATEGIES
165
PRINCIPLES OF MATHEMATICS 11 • Patterns and Relations (Relations and Functions)
Students should demonstrate the ability to describefunctional relationships. Assessment focusses onstudents’ abilities to move easily between graphicaland algebraic representations.
Observe• As students work with non-linear equations,
circulate, asking questions and observing howeffectively they are able to:- solve non-linear equations using a variety of
methods- understand the concept of extraneous root- test for extraneous roots- determine if solutions are reasonable within the
context of the problem
Question• Probe students’ problem-solving strategies as they
work on quadratic equations by asking questionssuch as:- How did you decide which method to use to
solve the equation?- How did you identify the proper form of the
equation for each method?
Collect• Ask students to find examples of real-world
situations that involve quadratic relations. Havethem present their situations, using some type ofelectronic technology. Observe the extent to whichstudents:- make use of quadratic relations- use real-world situations- identify the correct quadratic to fit each situation- use research to verify their results
Self- and Peer Assessment• Have students summarize and assess their results
from a set of review exercises, noting what they dowell and where they need to improve. Ask them torecord how they plan to improve in the identifiedareas.Ask students to reflect on the various methodsthey use to solve quadratic equations:- Which methods do they clearly understand?- Which forms of the equations do they have
trouble dealing with?- To what extent can they generalize from what
they have learned by restating results in morewidely applicable terms?
Print Materials
• Explore Quadratic Functions with the TI-83 orTI-82
• Exploring Functions with the TI-82 GraphicsCalculator
• An Introduction to the TI-82 GraphingCalculator
• Mathematics 11, Western Canadian EditionCh. 2 (Sections 2.1 - 2.7)Ch. 3 (Sections 3.1 - 3.9)
• MATHPOWER 11, Western EditionCh. 3 (Sections 3.1, 3.3, 3.5)Ch. 4 (Sections 4.1, 4.2, 4.4, 4.6, 4.7)Ch. 5 (Sections 5.1 - 5.7)
• Modeling Motion: High School MathActivities with the CBR
• Using the TI-81 Graphics Calculator to ExploreFunctions
• What If ...?: The Straight Line: Investigationswith the TI-81 Graphics Calculator
Software
• GrafEq (Macintosh & Windows Version 2.09)• Green Globs & Graphing Equations• Secondary Math Lab Toolkit• ZAP-A-GRAPH
PRESCRIBED LEARNING OUTCOMES SUGGESTED INSTRUCTIONAL STRATEGIES
166
PRINCIPLES OF MATHEMATICS 11 • Shape and Space (Measurement)
It is expected that students will:
• solve problems involving triangles, includingthose found in 3-D and 2-D applications.
• solve coordinate geometry problems involvinglines and line segments, and justify thesolutions.
It is expected that students will:
• solve problems involving ambiguous casetriangles in 3-D and 2-D
• solve problems involving distances betweenpoints and lines
• verify and prove assertions in plane geometry,using coordinate geometry
Students are surrounded by geometric forms innature, architecture, technology, science, and visualarts. In their study of geometry, students developskills in deductive reasoning, problem solving, andthe visual representation of ideas.
• Have students use trigonometry to calculateheights or lengths of items around the school (e.g.,lamppost, flagpole, totem pole).
• Include numerous non-traditional learningopportunities such as;- participating in field studies (e.g., a
construction site, airport)- interviewing guest speakers (e.g., engineers,
surveyors)- investigating the operation of tools such as the
commercial clinometer, or compass- researching projects involving real-life
applications such as navigation, surveying, andastronomy
• Provide students with several examples ofambiguous case triangles and ask them to identifywhy the ambiguous case triangle has twopossibilities. Have students describe the onesituation where there is no ambiguity.
• Encourage students to develop an appreciation ofthe use of coordinate geometry in many real-worldapplications.
• Demonstrate the definition of a circle by using astudent volunteer as the center and another as thelocus point (x, y). As the student moves around theclassroom, point out that the (x, y) values areconstantly changing. Show the same effect usingthe trace feature on the graphing calculator.
• Encourage students to draw detailed diagramswhenever attempting geometry problems.
• Demonstrate concepts by using paper folding orother physical examples.
• Whenever possible, model inductive reasoning,and have students discover rules and theoremsthrough experiments.

RECOMMENDED LEARNING RESOURCESSUGGESTED ASSESSMENT STRATEGIES
167
PRINCIPLES OF MATHEMATICS 11 • Shape and Space (Measurement)
Students apply their understanding of terms andprocedures when solving problems using geometricproperties of angles, lines, triangles, polygons, and thedistance formula. Assessment in this area can focus on theimportance of problem-solving skills.
Observe• Observe the extent to which students communicate
with each other using appropriate mathematicallanguage and descriptions.
• Have students complete problems involving non-righttriangles. Observe:- their ability to recognize the ambiguous case- how accurately students use mathematical language
and symbols- the extent to which they demonstrate appropriate
knowledge and understanding of concepts andprocedures
- the extent to which they persevere with assignedtask
- how accurately they complete diagrams andcalculations
Question• Ask groups or pairs of students to list as many
applications of geometry as they can.
Collect• Check students’ study sheets for accuracy, clarity, and
the effectiveness of their illustrations.
Self-Assessment• Have students make up a general marking rubric for
geometry questions. Ask students to select a number ofcriteria that they need to improve.
• Give students a series of word problems and have themwork in pairs. Ask pairs to compare their work withother pairs to verify their methods and solutions. Havethem make individual action plans that include howthey will overcome any weaknesses or how they willchallenge themselves to learn more about the topic.
Presentation• Have each students present an example of a problem
from another discipline that requires a trigonometricsolution. Examples could include physics (e.g., lightrefraction—Snell’s law), chemistry (e.g., bond angles),geography (e.g., map projections). Prior to thepresentations, develop assessment criteria withstudents.
Print Materials
• Mathematics 11, Western Canadian EditionCh. 9 (Sections 9.1 - 9.3)
• MATHPOWER 11, Western EditionCh. 8 (Section 8.7)
Software
• The Geometer’s Sketchpad
CD-ROM
• Geometry Blaster

PRESCRIBED LEARNING OUTCOMES SUGGESTED INSTRUCTIONAL STRATEGIES
168
PRINCIPLES OF MATHEMATICS 11 • Shape and Space (3-D Objects and 2-D Shapes)
It is expected that students will develop and apply thegeometric properties of circles and polygons to solve
problems.
It is expected that students will:
• use technology with dynamic geometry software toconfirm and apply the following properties:- the perpendicular from the center of a circle to a
chord bisects the chord- the measure of the central angle is equal to twice the
measure of the inscribed angle subtended by thesame arc
- the inscribed angles subtended by the same arc arecongruent
- the angle inscribed in a semicircle is a right angle- the opposite angles of a cyclic quadrilateral are
supplementary- a tangent to a circle is perpendicular to the radius at
the point of tangency- the tangent segments to a circle, from any external
point, are congruent- the angle between a tangent and a chord is equal to
the inscribed angle on the opposite side of the chord- the sum of the interior angles of an n-sided polygon
is 180(n-2)• prove the following general properties, using
established concepts and theorems:- the perpendicular bisector of a chord contains the
center of the circle- the measure of the central angle is equal to twice the
measure of the inscribed angle subtended by thesame arc (for the case when the center of the circle isin the interior of the inscribed angle)
- the inscribed angles subtended by the same arc arecongruent
- the angle inscribed in a semicircle is a right angle- the opposite angles of a cyclic quadrilateral are
supplementary- a tangent to a circle is perpendicular to the radius at
the point of tangency- the tangent segments to a circle from any external
point are congruent- the angle between a tangent and a chord is equal to
the inscribed angle on the opposite side of the chord- the sum of the interior angles of an n-sided polygon
is 180(n-2)• solve problems, using a variety of circle properties, and
justify the solution strategy used
Students will investigate, hypothesize, and verifyproperties of circle geometry and apply theseproperties to solve problems. The deductivereasoning used to solve problems involving circlegeometry can be employed to make decisions in avariety of fields e.g., landscape architecture,meteorology, and civil engineering.
Note: Although the prescribed learning outcomes do notrequire students to use formal two-column proof,students are nevertheless expected to logically justifyconjectures regarding geometric properties andexplain their solutions to the problems.
• Have groups of students experiment (e.g.,investigate, hypothesize, confirm, discuss, useinductive reasoning) to identify the properties of acircle. Encourage students to verify their resultsthrough measurements, calculations, andreasoning. Possible experiments include:- constructing a perpendicular bisector with
compass and straightedge- drawing circles of varying sizes, and using
chords of different length on these circles toconstruct the perpendicular bisectors
Have students discuss the importance of accuracywhile presenting their conclusions to the class.
• As enrichment, have students research and reporton the life and work of a famous mathematician(historical or contemporary). Discuss withstudents the concept of mathematics as anevolving discipline and not as a static set of rules.For example Euclid’s Elements is an in-depth setof rules that were deduced inductively.
• Have students write a logical-sequential verbalexplanation of a solution to a problem or a proof.

RECOMMENDED LEARNING RESOURCESSUGGESTED ASSESSMENT STRATEGIES
169
PRINCIPLES OF MATHEMATICS 11 • Shape and Space (3-D Objects and 2-D Shapes)
To enable them to work effectively with properties ofcircles, students need a solid understanding of theproperties of parallel lines, similar and congruentfigures, polygons, and angle relationships. Studentsdemonstrate their learning when they solvegeometric problems by applying circle properties andtheir converse statements.
Observe• Before advancing in this topic, assess students’
background knowledge of the properties ofparallel lines, similar and congruent figures,polygons, and angle relationships previouslylearned. Look for evidence of students’ recognitionof properties and their abilities to solve problemsusing:- parallel lines- congruent triangles- basic geometric constructions- properties of polygons
• Ask students to perform experiments with circleproperties, observe how effectively they can:- use a protractor and compass correctly and
accurately- follow directions to draw the figures and
measure the angles- explain orally the process of experimentation to
derive conclusions- communicate their conclusions clearly in
writing; explain the basis of their conclusions- identify the appropriate circle properties used
to find the measurements of sides and angles
Self-/Peer Assessment• Work with students to develop a table of
specifications for a test on this unit of work.Identify for them the content categories along thevertical axis and the intellectual levels along thehorizontal axis. After the weighing is identified foreach cell, have students work in groups to developquestions for each cell.
Print Materials
• Mathematics 11, Western Canadian EditionCh. 7 (Sections 7.1 - 7.4)Ch. 8 (Sections 8.1 - 8.6)
• MATHPOWER 11, Western EditionCh. 7 (Sections 7.2 - 7.7)Ch. 8 (Sections 8.1 - 8.5)
Software
• The Geometer’s Sketchpad• Green Globs & Graphing Equations• Secondary Math Lab Toolkit
CD-ROM
• Geometry Blaster


RECOMMENDED LEARNING RESOURCESSUGGESTED ASSESSMENT STRATEGIES
171
CURRICULUMPrinciples of Mathematics 12

PRESCRIBED LEARNING OUTCOMES SUGGESTED INSTRUCTIONAL STRATEGIES
172

RECOMMENDED LEARNING RESOURCESSUGGESTED ASSESSMENT STRATEGIES
173
ESTIMATED INSTRUCTIONAL TIME
Principles of Mathematics 12 has been developed assuming that teachers have 100 instructionalhours available to them. The following chart shows the estimated instructional time for eachcurriculum suborganizer, expressed as a percentage of total time available to teach the course.
When delivering the prescribed curriculum, teachers may freely adjust the instructional time to meettheir students’ diverse needs. These estimated instructional times have been recommended by the IRPwriters to assist their colleagues; they are suggestions only.
Organizer (Suborganizer) % of Time
Problem Solving Integrated Throughout
Patterns and Relations (Patterns) 5 - 15
Patterns and Relations (Variables and Equations) 10 - 20
Patterns and Relations (Relations and Functions) 15 - 25
Shape and Space (3-D Objects and 2-D Shapes) 10 - 20
Shape and Space (Transformations) 10 - 20
Statistics and Probability (Chance and Uncertainty) 20 - 30
PRINCIPLES OF MATHEMATICS 12
PRESCRIBED LEARNING OUTCOMES SUGGESTED INSTRUCTIONAL STRATEGIES
174
PRINCIPLES OF MATHEMATICS 12 • Problem Solving
It is expected that students willuse a variety ofmethods to solve real-life, practical, technical,and theoretical problems
It is expected that students will:
• solve problems that involve a specific contentarea such as geometry, algebra, trigonometry,statistics, probability
• solve problems that involve more than onecontent area
• solve problems that involve mathematicswithin other disciplines
• analyse problems and identify the significantelements
• develop specific skills in selecting and usingan appropriate problem-solving strategy orcombination of strategies chosen from, but notrestricted to, the following:- guess and check- look for a pattern- make a systematic list- make and use a drawing or model- eliminate possibilities- work backward- simplify the original problem- develop alternative original approaches- analyse keywords
• demonstrate the ability to work individuallyand co-operatively to solve problems
• determine that their solutions are correct andreasonable
• clearly explain the solution to a problem andjustify the processes used to solve it
• use appropriate technology to assist inproblem solving
Problem solving is a key aspect of any mathematicscourse. Working on problems involving a range ofmathematical disciplines can give students a sense ofthe excitement involved in creative and logicalthinking. It can also help students developtransferable real-life skills and attitudes. Multi-strandand interdisciplinary problems should be includedthroughout Principles of Mathematics 12.
• In a class discussion, define problem solving withstudents, pointing out that in mathematicsproblem solving involves many disciplines,including algebra, geometry, trigonometry,statistics, and probability.
• Introduce new types of problems directly tostudents (i.e., without demonstration), andfacilitate as they attempt to solve them.
• Have students work in small co-operative groupsof three to five when introducing new types ofproblems.
• Model and reinforce student use of a variety ofapproaches to problem solving (e.g., algebraic andgeometric).
• Emphasize that many problems may not be solvedin one try and that it is sometimes necessary torevisit the problem, start over, and try again.
• Have students or groups discuss their thoughtprocesses as they attempt to solve a problem.Point out the strategies inherent in their thinking(e.g., guessing and checking, looking for a pattern,making and using a drawing or model).
• Ask leading questions such as:- What are you being asked to find out?- What do you already know?- Do you need additional information?- Have you ever seen similar problems?- What else can you try?
• When students arrive at solutions to particularproblems, encourage them to generalize from orextend the problem situations.
Note: See Appendix G for examples of multi-strandand interdisciplinary problems that most studentsshould be able to solve. These problems are indicatedwith an asterisk (*)
RECOMMENDED LEARNING RESOURCESSUGGESTED ASSESSMENT STRATEGIES
175
PRINCIPLESS OF MATHEMATICS 12 • Problem Solving
Students analyse problems and solve them using avariety of approaches. Assessment of problem-solving skills is made over time, based onobservations of many situations.
Observe• Have students present solutions to the class
individually, in pairs, or in small groups. Notethe extent to which they clarify their problemsand how succinctly they describe the processesused.
Question• To check the approaches students use when
solving problems, ask questions that promptthem to:- paraphrase or describe the problem in
theirown words- explain the processes used to derive an
answer- describe alternative methods to solve a
problem- relate the strategies used in new situations- link mathematics to other subjects and to the
world of work
Collect• For selected problems, have students annotate
their work to describe the processes they used.Alternatively, have them provide briefdescriptions of what worked and what did notwork for particular problems.
Self-Assessment• Ask students to keep journals to describe the
processes they used in dealing with problems.Have them include descriptions of strategies thatworked and those that did not.
• Develop with students a set of criteria to self-assess problem-solving skills. The reference set,Evaluating Problem Solving Across Curriculum,may be helpful in identifying such criteria.
Please see the introduction to Appendix B for alist of suggested utility software that supportsthis course.
The Western Canadian Protocol LearningResource Evaluation Process has also identifiednumerous teacher resources and professionalreferences. These are generally cross-gradeplanning resources that include ideas for avariety of activities and exercises.
These resources, while not part of the GradeCollections, have Provincially Recommendedstatus.
Appendix B includes an annotated bibliographyof these resources for ordering convenience.

PRESCRIBED LEARNING OUTCOMES SUGGESTED INSTRUCTIONAL STRATEGIES
176
PRINCIPLES OF MATHEMATICS 12 • Patterns and Relations (Patterns)
It is expected that students will generate andanalyse exponential patterns.
It is expected that students will:
• derive and apply expressions to representgeneral terms and sums for geometric growthand to solve problems
• connect geometric sequences to exponentialfunctions over the natural numbers
• estimate values of expressions for infinitegeometric processes
Sequences and series can be used to model thepatterns observed in phenomena such as a launchedrocket, a bouncing ball, and plant or animal growth.Limit theory, a fundamental building block ofcalculus, extends from the concepts of sequences andseries.
• Give students numerical and non-numericalpatterns and ask them to define the rule(s) for eachpattern. Have them use the rules to makepredictions and classify the patterns (e.g.,arithmetic, geometric, neither).
• Have students find examples and describe thetype of pattern of geometric sequences and seriesoccurring in real-world tools and scales (e.g., thef-stops on a camera lens, rule of five).
• Have students research and report on pattern-related topics such as;- recursive definitions of a sequence (e.g.,
computer programming)- development and significance of mathematical
symbolism (e.g., summation notation)- the relationship between infinite geometric
series and limits (e.g., Zeno’s paradox, Koch’ssnowflake curve, fractal curves, the notion ofinfinity)
• Encourage students to use a variety of media andto refer to a range of real-life examples to showpatterns (e.g., in history, fine arts, science,economics).
• Have students use concepts of sequence and seriesto solve compounding interest problems (e.g., If$1000.00 is deposited each year into an accountthat earns 8% compounded annually, how muchmoney will have accumulated after 25 years?). Askstudents to:- generate a sequence or series modeling each
situation- use the appropriate format to answer the
questions- discuss the reasonableness of the answers
RECOMMENDED LEARNING RESOURCESSUGGESTED ASSESSMENT STRATEGIES
177
PRINCIPLESS OF MATHEMATICS 12 • Patterns and Relations (Patterns)
Students provide a variety of evidence of their abilityto develop sequences and series and to apply thesewhen they solve problems. Using a variety ofassessment procedures will give the most completepicture of students’ abilities to solve such problems.
Observe• While students are working on problems
involving patterns, look for evidence that they can:- recognize, classify, and make predictions and
generalizations from functional relationshipsand patterns
- recognize patterns in a sequence and generatesuccessive terms of that sequence
- classify different types of sequences and series
Question• To discover how well students can recognize and
explain a fallacy, give them a problem such as:
S
S
therefore S S
and S S
soS
= + + + += + + + +( )= +
− == −
1 2 4 8
1 2 1 2 4
1 2
2 1
1
...
...
In their analyses, look for evidence that theyunderstand infinite geometric series whendiscussing the fallacy. For example, do they:- recognize that something is wrong- identify what it is that is wrong and explain
why• Have students brainstorm real world examples of
geometric sequences and then encourage them tosee that they are examples of exponentialfunctions.
Collect• Ask student to research fractal-like objects that are
naturally occurring, such as broccoli or lungtissue. Ask them to explain, using geometricseries, how lung tissue might benefit from amaximum surface area.
Collect/Present• Have students state five geometric and five non-
geometric sequences and defend why each isplaced in a particular group. Alternatively, givestudents a list of sequences, and have them sortthem and defend their choices.
Patterns and Relations - Patterns
Print Materials
• Exploring Advanced Algebra with the TI-83• An Introduction to the TI-82 Graphing
Calculator• Modeling Motion: High School Math
Activities with the CBR
Multi-media
• Mathematics 12, Western Canadian EditionCh. 2 (Sections 2.7 - 2.9)
• MATHPOWER 12, Western EditionCh. 6 (Sections 6.3, 6.5, 6.6)
Software
• Secondary Math Lab Toolkit
PRESCRIBED LEARNING OUTCOMES SUGGESTED INSTRUCTIONAL STRATEGIES
178
PRINCIPLES OF MATHEMATICS 12 • Patterns and Relations (Variables and Equations)
It is expected that students will solveexponential, logarithmic and trigonometricequations and identities.
It is expected that students will:
• solve exponential equations having bases thatare powers of one another
• solve and verify exponential and logarithmicequations and identities
• distinguish between degree and radianmeasure, and solve problems using both
• determine the exact and the approximatevalues of trigonometric ratios for anymultiples of 0˚, 30˚, 45˚, 60˚ and 90˚ and 0,π π π π6 4 3 2
, , ,
• solve first and second degree trigonometricequations over a domain of length 2π:- algebraically- graphically
• determine the general solutions totrigonometric equations where the domain isthe set of real numbers
• analyse trigonometric identities:- graphically- algebraically for general cases
• use sum, difference,and double angleidentities for sine and cosine to verify andsimplify trigonometric expressions
Many real-world problems (e.g., in navigation,engineering, surveying, chemistry) require theapplication of exponential, logarithmic, ortrigonometric equations. Trigonometry also linksgeometry and algebra (e.g., through its applicationsin matrix representations of rotations and directionangles of vectors).
• Provide students with a list of logarithmicequations. Have students categorize the equationsin terms of the equation-solving techniquerequired (e.g., 2 4 4 3 1log logx x− +( ) = would besolved by the power law and equatingarguments).
• Have students generate multiple-choice questionswith emphasis on creating good distracters. Usethese questions created by the class as a review.
• Present examples illustrating the need for radianmeasure when modeling real-world situations(e.g., amount of air in lungs as a function of time,tide problems).
• As students simplify trigonometric expressions,encourage them to develop and state usefulstrategies such as:- express in terms of sine and cosine only- simplify fractions using conjugates, factoring,
and common denominators- make substitutions using equivalent identities
• Relate solving trigonometric equations to solvingalgebraic equations with similar forms:Algebraic Equations
2 3 2 0
2 1 2 0
12
2
2x x
x x
x or x
− − =+( ) −( ) =
= =
Trigonometric Equations
Solve for θ to the nearest degree 0 360°≤ < °( )θ .
no solution
2 3 2 0
2 1 2 0
12
2
120 240
2cos cos
cos cos
cos cos
θ θθ θ
θ θ
θ θ
− − =+( ) −( ) =
= − =
= =
or
oro o
• Have students analyse and discuss incorrectsolutions to trigonometric equations.

RECOMMENDED LEARNING RESOURCESSUGGESTED ASSESSMENT STRATEGIES
179
PRINCIPLES OF MATHEMATICS 12 • Patterns and Relations (Variables and Equations)
The ability to solve problems involving exponential,logarithmic, and trigonometric functions is importantin fields such as engineering. Knowing how wellstudents can manipulate equations and identities ofthese types is important. Assessment strategiesshould focus on the demonstration of algebraic skillsand, to a lesser degree, the translation of wordproblems into algebraic equations.
Observe• While students are working on trigonometric and
logarithmic functions, observe that:- when solving bases other than 10, students
convert them to base 10 or are comfortable withthe base they are in
- where necessary, students can convert all basesto a single appropriate base
- students memorize tables of special angles orthey can derive them quickly as needed
- when proving trigonometric identities, studentsshould apply appropriate techniques such asconverting everything to sine and cosine
• Provide samples of student work on proofs thatare not complete. Observe the extent to whichstudents are able to:- determine the errors in the formal proof- correct the errors in the formal proof- assign a mark to the proof based on a criterion-
based rubric
Question• Can students differentiate between specific
solutions and general solutions to trigonometricequations?
Self-/PeerAsssessment• Design a puzzle sheet which requires the solution
to many trigonometric or logarithmic equations tofind the answer. Encourage students to have apeer solve their puzzle and check their work foraccuracy.
• Ask students to select three proofs from theirhomework assignment and have partners markeach others’ work using a criterion-based rubric.
Print Materials
• Exploring Advanced Algebra with the TI-83• Exploring Functions with the TI-82 Graphics
Calculator• An Introduction to the TI-82 Graphing
Calculator• Modeling Motion: High School Math
Activities with the CBR
Multi-media
• Mathematics 12, Western Canadian EditionCh. 2 (Sections 2.1, 2.11, 2.12)Ch. 3 (Sections 3.2, 3.5)Ch. 5 (Section 5.1 - 5.6)
• MATHPOWER 12, Western EditionCh. 2 (Sections 2.4, 2.7)Ch. 4 (Sections 4.1, 4.2)Ch. 5 (Sections 5.1 - 5.5)
Software
• Secondary Math Lab Toolkit
PRESCRIBED LEARNING OUTCOMES SUGGESTED INSTRUCTIONAL STRATEGIES
180
PRINCIPLES OF MATHEMATICS 12 • Patterns and Relations (Relations and Functions)
It is expected that students will represent andanalyse exponential and logarithmic functions,using technology as appropriate.
It is expected that students will:
• model, graph, and apply exponentialfunctions to solve problems
• change functions from exponential form tologarithmic form and vice versa
• model, graph, and apply logarithmicfunctions to solve problems
• explain the relationship between the laws oflogarithms and the laws of exponents
• describe the three primary trigonometricfunctions as circular functions with referenceto the unit circle and an angle in standardposition
• draw (using technology), sketch, and analysethe graphs of sine, cosine, and tangentfunctions, for:- amplitude, if defined- period- domain and range- asymptotes, if any- behavior under transformations
• use trigonometric functions to model andsolve problems
The inverse relationship between exponential andlogarithmic functions makes possible the solution ofa number of equations not readily solvedalgebraically (e.g., investment analysis, populationgrowth, earthquake magnitudes, radioactive decay).
• Give students an exponential function and itsinverse (logarithmic). Have them work in groups,using graphing calculators or computer softwareto identify the relationship between the two.
• Demonstrate for students the impossibility ofgraphing an exponential function with a negativebase, using anything but integer values of x. Referto the resulting difficulties to emphasize the needfor domain and range restrictions when dealingwith exponential and logarithmic functions. As afollow up, discuss base e and natural logarithms.
• Use the graphing calculator to discuss the effectsof changing A, B, C, and D on the graph ofy = A sinB( - C) + Dθ
• Provide students with real sinusoidal data. Askthem to graph the data, estimate the amplitudeand suggest possible equations to represent thedata. The data can then be entered into thegraphing calculator and the sinusoidial regressionfunction can be applied. Students can compare thecalculator results to their own predicted equation.
• Have students display the parallels of the log lawsand exponent laws on an 81/2"x11" poster
• Develop a model of the wrapping function (e.g.,sine, cosine) using a circle of cardboard and anacetate overlay to show how x, y and x/y changeas the angle changes. Alternatively use geometrysoftware to model the relationships of theinscribed right angle and the change in the centralangle.
• Use a graphing calculator or graphing software tomatch a given graph to a trigonometric equation.
• Given a solution, have students write a problemthat matches it.
• Play trigonometric graph bingo Have studentschoose a number of equations from a list to makeup their card, then graph equations on overheaduntil someone gets 5 in a row.
RECOMMENDED LEARNING RESOURCESSUGGESTED ASSESSMENT STRATEGIES
181
PRINCIPLES OF MATHEMATICS 12 • Patterns and Relations (Relations and Functions)
Trigonometric, exponential, and logarithmicfunctions enable students to solve more complexproblems in areas such as science, engineering, andfinance. Students should be able to demonstratetheir knowledge of the relationship betweenlogarithms and exponential functions, both intheory and in applications, in a variety of problemsituations. Assessment of students’ understandingof trigonometric concepts includes the observationof the processes they use when they relate thephysical world to mathematical representations.
Observe• Ask students to outline how they would teach a
classmate:- the inverse relationship between exponential
and logarithmic functions- the restrictions associated with exponential
and logarithmic functionsNote the extent to which the outlines:- include general steps to follow- use mathematical terms correctly- provide clear examples- describe common errors and how they can be
avoided• When reviewing students’ work, note the extent
to which they can:- generate several different equations to
describe the graph of a given cosine or sinefunction
- graph a particular sine or cosine functionusing pencil and paper
- check their solutions using graphingtechnology
Collect• Assign a series of problems that require students
to apply their knowledge of the relationshipbetween logarithms and exponential functions.Check their work for evidence that they:- clearly understood the requirements of the
problem- used efficient strategies and procedures to
solve the problem- recognized when a strategy or procedure was
not appropriate- verified that their solutions were accurate and
reasonable
Print Materials
• Exploring Functions with the TI-82 GraphicsCalculator
• An Introduction to the TI-82 GraphingCalculator
• Modeling Motion: High School MathActivities with the CBR
• Using the TI-81 Graphics Calculator to ExploreFunctions
Multi-media
• Mathematics 12, Western Canadian EditionCh. 2 (Sections 2.1 - 2.6, 2.10)Ch. 3 (Sections 3.1, 3.3 - 3.9)Ch. 4 (Sections 4.1, 4.4 - 4.6)Ch. 5 (Section 5.6)
• MATHPOWER 12, Western EditionCh. 2 (Sections 2.2, 2.5, 2.6, 2.8)Ch. 4 (Sections 4.2 - 4.6)
Software
• GrafEq (Macintosh & Windows Version 2.09)• Secondary Math Lab Toolkit• ZAP-A-GRAPH
PRESCRIBED LEARNING OUTCOMES SUGGESTED INSTRUCTIONAL STRATEGIES
182
PRINCIPLES OF MATHEMATICS 12 • Shape and Space (3-D Objects and 2-D Shapes)
It is expected that students will classify conicsections, using their shapes and equations.
It is expected that students will:
• classify conic sections according to shape• classify conic sections according to a given
equation in general or standard (completedsquare) form (vertical or horizontal axis ofsymmetry only)
• convert a given equation of a conic sectionfrom general to standard form and vice versa
The study of quadratic relations helps studentsconnect geometry and algebra. The theory of conicsections finds application in fields ranging fromconstruction and telecommunications to aerospaceand astronomy.
• Have students define quadratic relations in termsof their component functions so that they can usetheir graphing calculators. For example, a circle ofradius 5 can be entered as:y x
y orx
= − −
= −
25
25
21
2 y2 = -y12
This allows students to explore domain, range,and limits as they relate to asymptotes.
• Ask students to collect examples of how quadraticrelations are applied. Examples could include:- satellite dishes- jet engines- domed stadiums- car headlights- parabolic microphones
• Demonstrate, using a “take-apart” model, thatconic sections result from the intersection of aplane and a cone.
• Discuss the advantages of writing equations ingeneral or in standard form.

RECOMMENDED LEARNING RESOURCESSUGGESTED ASSESSMENT STRATEGIES
183
PRINCIPLES OF MATHEMATICS 12 • Shape and Space (3-D Objects and 2-D Shapes)
As students explore problems involving quadraticfunctions and relations, they develop anunderstanding of how algebra and analyticgeometry are applied in a real-world context. Inassessing students’ abilities to use variables,graphing techniques, and algebraic representations,the focus is on the presentations (in words, symbols,and graphs) and explanations they use to illustratetheir understanding of the concepts.
Observe• To check students’ understanding of quadratic
functions and relations, circulate through theclassroom and note:- the extent to which students can analyse a
particular quadratic relation given a graphinganalysis outline
- whether students can recognize the decliningcharacteristics (locus) and properties of eachtype of quadratic relation, and can relate thetype of conic to specific equations
- whether students can explain the effect of an x2
term in an equation — how does it affect thepossible values of x (domain)? What about y2?
Question• Give students data or a list of measurements that
describe various relationships or structures foundin the real world. Have them develop anappropriate equation to describe each of theserelationships. Ask students to predict othervalues, and answer associated questions based ontheir equations.
Collect• Place a number of conics in graphic form or
standard form and general form around theclassroom. Have students sort them according totype and either- defend their choices- develop/present the criteria used in making
their choices
Present• Have students use a poster to summarize the
characteristics of each conic as a subset of thegeneral conic.
Multi-media
• Mathematics 12, Western Canadian EditionCh. 9 (Sections 9.1 - 9.3, 9.5, 9.6)
• MATHPOWER 12, Western EditionCh. 3 (Sections 3.1, 3.3 - 3.6)
Software
• Secondary Math Lab Toolkit
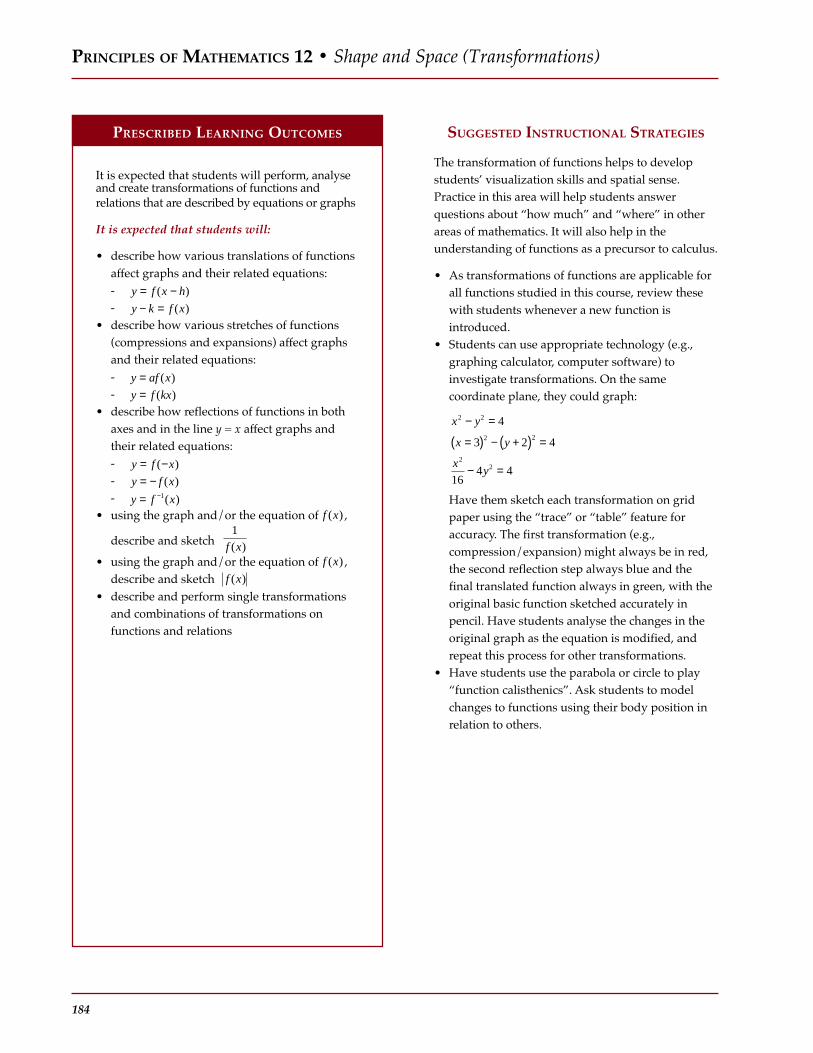
PRESCRIBED LEARNING OUTCOMES SUGGESTED INSTRUCTIONAL STRATEGIES
184
PRINCIPLES OF MATHEMATICS 12 • Shape and Space (Transformations)
It is expected that students will perform, analyseand create transformations of functions andrelations that are described by equations or graphs
It is expected that students will:
• describe how various translations of functionsaffect graphs and their related equations:- y f x h= −( )- y k f x− = ( )
• describe how various stretches of functions(compressions and expansions) affect graphsand their related equations:- y af x= ( )- y f kx= ( )
• describe how reflections of functions in bothaxes and in the line y = x affect graphs andtheir related equations:- y f x= −( )
- y f x= − ( )- y f x= −1( )
• using the graph and/or the equation of f x( ) ,
describe and sketch 1
f x( )• using the graph and/or the equation of f x( ) ,
describe and sketch f x( )
• describe and perform single transformationsand combinations of transformations onfunctions and relations
The transformation of functions helps to developstudents’ visualization skills and spatial sense.Practice in this area will help students answerquestions about “how much” and “where” in otherareas of mathematics. It will also help in theunderstanding of functions as a precursor to calculus.
• As transformations of functions are applicable forall functions studied in this course, review thesewith students whenever a new function isintroduced.
• Students can use appropriate technology (e.g.,graphing calculator, computer software) toinvestigate transformations. On the samecoordinate plane, they could graph:
x y
x y
xy
2 2
2 2
22
4
3 2 4
164 4
− =
=( ) − +( ) =
− =
Have them sketch each transformation on gridpaper using the “trace” or “table” feature foraccuracy. The first transformation (e.g.,compression/expansion) might always be in red,the second reflection step always blue and thefinal translated function always in green, with theoriginal basic function sketched accurately inpencil. Have students analyse the changes in theoriginal graph as the equation is modified, andrepeat this process for other transformations.
• Have students use the parabola or circle to play“function calisthenics”. Ask students to modelchanges to functions using their body position inrelation to others.

RECOMMENDED LEARNING RESOURCESSUGGESTED ASSESSMENT STRATEGIES
185
PRINCIPLES OF MATHEMATICS 12 • Shape and Space (Transformations)
Transforming functions requires both anunderstanding of algorithms and a developed spatialsense. Assessment strategies should focus on bothabstract and concrete transformation skills.
Question• To check students’ understanding of
transformations, have them work in reverse.Provide the graph of a transformed relation, andask them to write or identify its equation. Look forevidence that the student can match a basicfunction equation to the graph and adjust theequation based on how the graph is transformedfrom the basic graph (e.g., 2 right, 3 down).
Collect• Have students compile portfolios containing
examples of their work modeling each basic typeof relation studied. Ask them to give examples andexplain how various transformations can beapplied to each type. Assess portfolios withstudents for completeness, variety, organization,accuracy, presentation, and for specific criteriasets.
• Have students graph the transformations of thebasic equations manually. Look for their abilitiesto draw the graphs with paper and pencil, withoutthe use of a graphing calculator.
Self-Assessment• Based on a previously developed, student-
generated checklist of graphing criteria, studentscould summarize analyses of their own work bylisting what they do well and where they need toimprove.
Multi-media
• Mathematics 12, Western Canadian EditionCh. 1 (Sections 1.1 - 1.6)Ch. 4 (Section 4.7)Ch. 9 (Sections 9.4 - 9.5)
• MATHPOWER 12, Western EditionCh. 1 (Sections 1.1, 1.3, 1.4, 1.6)
Software
• Secondary Math Lab Toolkit• ZAP-A-GRAPH
Games/Manipulatives
• String Invision Conics Model

PRESCRIBED LEARNING OUTCOMES SUGGESTED INSTRUCTIONAL STRATEGIES
186
PRINCIPLES OF MATHEMATICS 12 • Statistics and Probability (Chance and Uncertainty)
It is expected that students will:
• use normal and binomial probabilitydistributions to solve problems involvinguncertainty.
• solve problems based on the counting of sets,using techniques such as the fundamentalcounting principle, permutations andcombinations.
• model the probability of a compound event,and solve problems based on the combining ofsimpler probabilities.
It is expected that students will:
• find the standard deviation of a data set or aprobability distribution, using technology
• use z-scores and the normal distribution tosolve problems
• use the normal approximation to the binomialdistribution to solve problems involvingprobability calculations for large sampleswhere npq>10
• solve pathway problems, interpreting andapplying any constraints
• use the fundamental counting principle todetermine the number of different ways toperform multistep operations
• determine the number of permutations of ndifferent objects taken r at a time, and use thisto solve problems
• determine the number of combinations of ndifferent objects taken r at a time, and use thisto solve problems
• solve problems, using the binomial theoremwhere N belongs to the set of natural numbers
• construct a sample space for two or three events• classify events as independent or dependent• solve problems, using the probabilities of
mutually exclusive and complementary events• determine the conditional probability of two
events• solve probability problems involving
permutations, and combinations andconditional probability
Decision-making situations that involve probabilityand uncertainty occur frequently in daily life.Students need opportunities to learn how to use thenormal probability distribution as a tool wheninterpreting and solving such problems.
• In a large-group discussion, point out that inproblems involving probability, words often havea meaning different from their ordinary Englishusage. Help students distinguish betweenmathematical usage and common usage (e.g.,validity, percentage).
• Provide students with examples that do not fit thenormal curve and ask them to determine whyusing the z-score is inappropriate, emphasizingthat the z-score will not solve all probabilityproblems. Some examples include:- a crown-and-anchor game in which every
number is equally likely (i.e., no cluster aboutthe mean)
- the median age of teachers is 45 and their meanis 50 (i.e., not symmetric about the mean)
• Help students develop a list of important items toconsider when calculating the probability of anevent. The list could include:- trying to organize the events of the sample
space using tables or tree diagrams whenpossible
- recalling the difference between AND and ORand how it relates to union and intersection
- determining if each part of the problem is apermutation or combination
- trying to solve a simpler version of the problemby taking a small sample of the same eventusing the counting principle
• Use real-life problem situations to introduce newconcepts. For example a tennis match in which thefirst person to win two games in a row wins thematch. How many possibilities are there to a finaloutcome? (Using a tree diagram may be helpful).
• Have students research the role of probability inthe field of genetics (e.g., eye colour, blood type).
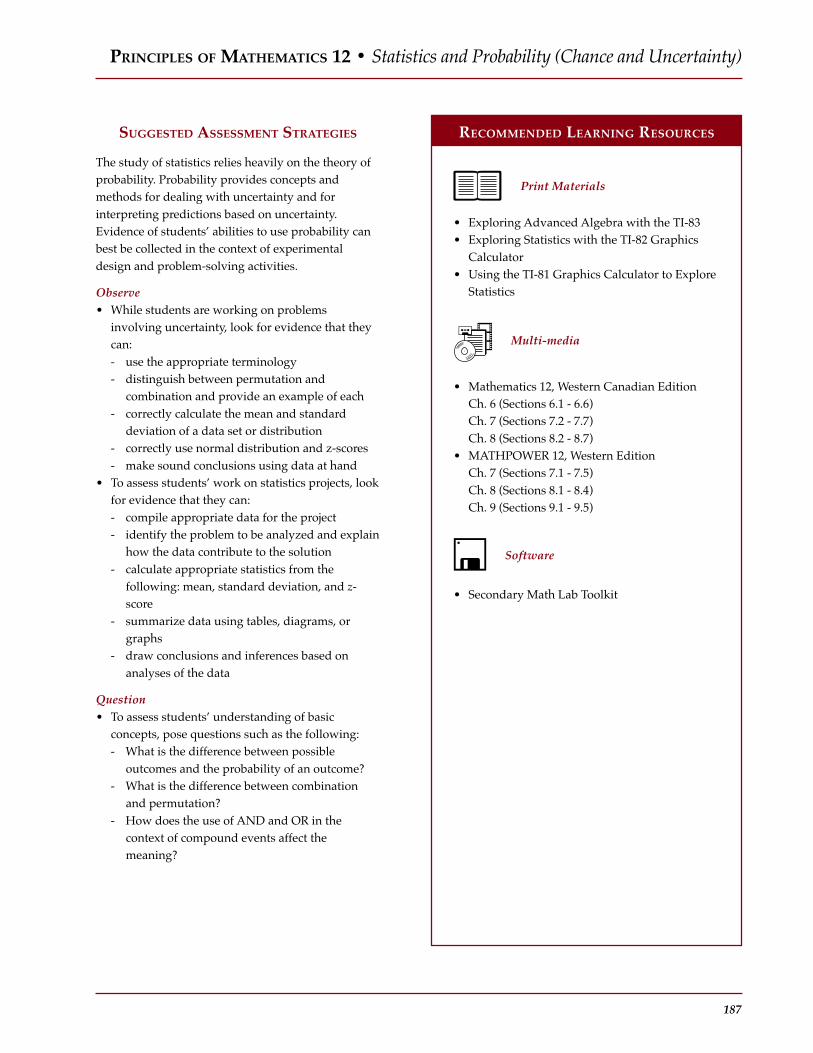
RECOMMENDED LEARNING RESOURCESSUGGESTED ASSESSMENT STRATEGIES
187
PRINCIPLES OF MATHEMATICS 12 • Statistics and Probability (Chance and Uncertainty)
The study of statistics relies heavily on the theory ofprobability. Probability provides concepts andmethods for dealing with uncertainty and forinterpreting predictions based on uncertainty.Evidence of students’ abilities to use probability canbest be collected in the context of experimentaldesign and problem-solving activities.
Observe• While students are working on problems
involving uncertainty, look for evidence that theycan:- use the appropriate terminology- distinguish between permutation and
combination and provide an example of each- correctly calculate the mean and standard
deviation of a data set or distribution- correctly use normal distribution and z-scores- make sound conclusions using data at hand
• To assess students’ work on statistics projects, lookfor evidence that they can:- compile appropriate data for the project- identify the problem to be analyzed and explain
how the data contribute to the solution- calculate appropriate statistics from the
following: mean, standard deviation, and z-score
- summarize data using tables, diagrams, orgraphs
- draw conclusions and inferences based onanalyses of the data
Question• To assess students’ understanding of basic
concepts, pose questions such as the following:- What is the difference between possible
outcomes and the probability of an outcome?- What is the difference between combination
and permutation?- How does the use of AND and OR in the
context of compound events affect themeaning?
Print Materials
• Exploring Advanced Algebra with the TI-83• Exploring Statistics with the TI-82 Graphics
Calculator• Using the TI-81 Graphics Calculator to Explore
Statistics
Multi-media
• Mathematics 12, Western Canadian EditionCh. 6 (Sections 6.1 - 6.6)Ch. 7 (Sections 7.2 - 7.7)Ch. 8 (Sections 8.2 - 8.7)
• MATHPOWER 12, Western EditionCh. 7 (Sections 7.1 - 7.5)Ch. 8 (Sections 8.1 - 8.4)Ch. 9 (Sections 9.1 - 9.5)
Software
• Secondary Math Lab Toolkit


CURRICULUMCalculus 12

PRESCRIBED LEARNING OUTCOMES SUGGESTED INSTRUCTIONAL STRATEGIES
190
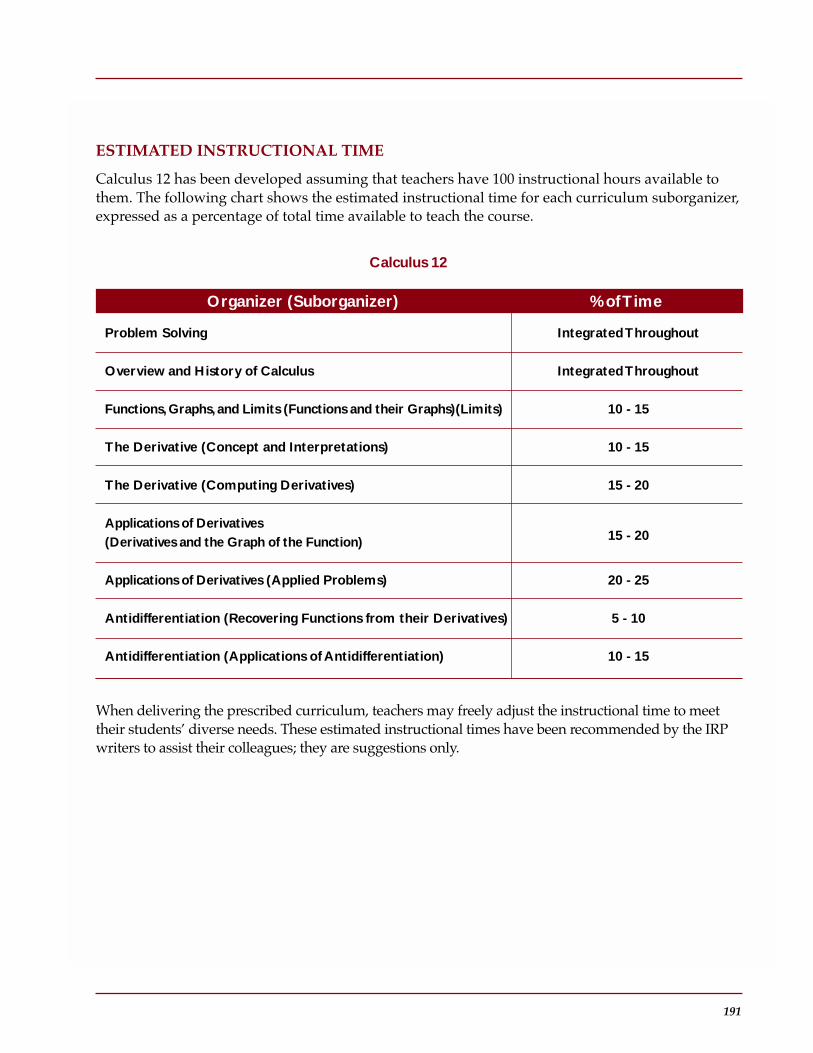
RECOMMENDED LEARNING RESOURCESSUGGESTED ASSESSMENT STRATEGIES
191
ESTIMATED INSTRUCTIONAL TIME
Calculus 12 has been developed assuming that teachers have 100 instructional hours available tothem. The following chart shows the estimated instructional time for each curriculum suborganizer,expressed as a percentage of total time available to teach the course.
When delivering the prescribed curriculum, teachers may freely adjust the instructional time to meettheir students’ diverse needs. These estimated instructional times have been recommended by the IRPwriters to assist their colleagues; they are suggestions only.
Organizer (Suborganizer) % of Time
Problem Solving Integrated Throughout
Overview and History of Calculus Integrated Throughout
Functions, Graphs, and Limits (Functions and their Graphs)(Limits) 10 - 15
The Derivative (Concept and Interpretations) 10 - 15
The Derivative (Computing Derivatives) 15 - 20
Applications of Derivatives(Derivatives and the Graph of the Function) 15 - 20
Applications of Derivatives (Applied Problems) 20 - 25
Antidifferentiation (Recovering Functions from their Derivatives) 5 - 10
Antidifferentiation (Applications of Antidifferentiation) 10 - 15
Calculus 12

PRESCRIBED LEARNING OUTCOMES SUGGESTED INSTRUCTIONAL STRATEGIES
192
It is expected that students will use a variety of
methods to solve real-life, practical, technical,
and theoretical problems.
It is expected that students will:
• solve problems that involve a specific contentarea (e.g., geometry, algebra, trigonometrystatistics, probability)
• solve problems that involve more than onecontent area
• solve problems that involve mathematicswithin other disciplines
• analyse problems and identify the significantelements
• develop specific skills in selecting and usingan appropriate problem-solving strategy orcombination of strategies chosen from, but notrestricted to, the following:- guess and check- look for a pattern- make a systematic list- make and use a drawing or model- eliminate possibilities- work backward- simplify the original problem- develop alternative original approaches- analyse keywords
• demonstrate the ability to work individuallyand co-operatively to solve problems
• determine that their solutions are correct andreasonable
• clearly communicate a solution to a problemand justify the process used to solve it
• use appropriate technology to assist inproblem solving
Problem solving is a key aspect of any mathematicscourse. Working on problems can give students asense of the excitement involved in creative andlogical thinking. It can also help students developtransferable real-life skills and attitudes. Problemsmay come from various fields, including algebra,geometry, and statistics. Multi-strand andinterdisciplinary problems should be includedthroughout Calculus 12.
• Introduce new types of problems directly tostudents (without demonstration) and play the roleof facilitator as they attempt to solve suchproblems.
• Recognize when students use a variety ofapproaches (e.g., algebraic and geometricsolutions); avoid becoming prescriptive aboutapproaches to problem solving.
• Reiterate that problems might not be solved in onesitting and that “playing around” with theproblem-revisiting it and trying again-is sometimesneeded.
• Frequently engage small groups of students (threeto five) in co-operative problem solving whenintroducing new types of problems.
• Have students or groups discuss their thoughtprocesses as they attempt a problem. Point out thestrategies inherent in their thinking (e.g., guess andcheck, look for a pattern, make and use a drawingor model).
• Ask leading questions such as:- What are you being asked to find out?- What do you already know?- Do you need additional information?- Have you ever seen similar problems?- What else can you try?
• Once students have arrived at solutions toparticular problems, encourage them to generalizeor extend the problem situation.
CALCULUS 12 • Problem Solving

RECOMMENDED LEARNING RESOURCESSUGGESTED ASSESSMENT STRATEGIES
193
CALCULUS 12 • Problem Solving
Students analyse problems and solve them using avariety of approaches. Assessment of problem-solvingskills is made over time, based on observations of manysituations.
Observe• Have students present solutions to the class
individually, in pairs, or in small groups. Note theextent to which they clarify their problems and howsuccinctly they describe the processes used.
Question• To check the approaches students use when solving
problems, ask questions that prompt them to:- paraphrase or describe the problem in their- own words- explain the processes used to derive an answer- describe alternative methods to solve a problem- relate the strategies used in new situations- link mathematics to other subjects and to the
world of work
Collect• On selected problems, have students annotate their
work to describe the processes they used.Alternatively, have them provide brief descriptionsof what worked and what did not work as theysolved particular problems.
Self-Assessment• Ask students to keep journals to describe the
processes they used in dealing with problems. Havethem include descriptions of strategies that workedand those that did not.
• Develop with students a set of criteria to self-assessproblem-solving skills. The reference set EvaluatingProblem Solving Across Curriculum may be helpfulin identifying such criteria.
Please see the introduction to Appendix B for alist of suggested utility software that supportsthis course.
The Western Canadian Protocol LearningResource Evaluation Process has also identifiednumerous teacher resources and professionalreferences. These are generally cross-gradeplanning resources that include ideas for avariety of activities and exercises.
These resources, while not part of the GradeCollections, have Provincially Recommendedstatus.
Appendix B includes an annotated bibliographyof these resources for ordering convenience.

PRESCRIBED LEARNING OUTCOMES SUGGESTED INSTRUCTIONAL STRATEGIES
194
It is expected that students will understand thatcalculus was developed to help model dynamicsituations.
It is expected that students will:
• distinguish between static situations anddynamic situations
• identify the two classical problems that weresolved by the discovery of calculus:- the tangent problem- the area problem
• describe the two main branches of calculus:- differential calculus- integral calculus
• understand the limit process and that calculuscenters around this concept
Students will quickly come to realize that calculus isvery different from the mathematics they havepreviously studied. Of greatest importance is anunderstanding that calculus is concerned with changeand motion. It is a mathematics of change that enablesscientists, engineers, economists, and many others tomodel real-life, dynamic situations.
• The concepts of average and instantaneous velocityare a good place to start. These concepts could berelated to the motion of a car. Ask students if thedisplacement of the car is given by f(t), what is theaverage velocity of the car between times t = t1 andt = t2 , and the instantaneous velocity at t = t1? Pointout that calculus is not needed to determine the
average velocity f t f t
t t
( ) ( )2 1
2 1
−−
, but is needed to
determine the velocity at t1 (the speedometerreading).
• As a way of solving the tangent problem (i.e., theneed for two points and the fact that only one pointis available), create a secant line that can be movedtoward the tangent line. Ask students if they canmove the secant line towards the tangent line usingalgebraic techniques.
• Ask students to determine the area under a curve byestimating the answer using rectangles. Introducethe concept of greater accuracy when the rectanglesare of smaller and smaller widths (the idea of limit).
• Present the following statement for discussion:
112
14
18
2+ + + + =...
Use geometry to illustrate the relationship betweenthe left-hand and right-hand sides.
CALCULUS 12 • Overview and History of Calculus (Overview of Calculus)

RECOMMENDED LEARNING RESOURCESSUGGESTED ASSESSMENT STRATEGIES
195
To demonstrate their achievement of the outcomes forthis organizer, students need opportunities to engage inopen-ended activities that allow for a range ofresponses and representations.
Although formative assessment of students’achievement of the outcomes related to this organizershould be ongoing, summative assessment can only becarried out effectively toward the end of the course,when students have sufficient understanding of thedetails of calculus to appreciate the “big picture.”
Self-Assessment• Work with the students to develop criteria and rating
systems they can use to assess their own descriptionsof the two main branches of calculus. They canrepresent their progress with symbols to indicatewhen they have addressed a particular criterion intheir work. Appropriate criteria might include theextent to which they:- make connections to other branches of
mathematics- demonstrate understanding of the classical
problems- consider the different attempts to solve the
classical problem(s)- explain the significance of limits with reference to
specific examples- accurately and comprehensively describe the
relationship between integral and differentialcalculus (methodology and purpose)
CALCULUS 12 • Overview and History of Calculus (Overview of Calculus)
Print Materials
• Calculus: Graphical, Numerical, Algebraicpp. 83-85, 95, 190, 262, 272-273,375
• Calculus of a Single Variable EarlyTranscendental Functions, Second Editionpp. 57 - 61, 63
• Single Variable Calculus EarlyTranscendentals, Fourth EditionCh. 2 (Section 2.2)pp. 3-4, 6-9, 85, 351
Multimedia
• Calculus: A New Horizon, Sixth Editionpp. 2, 112, 114, 375
• Calculus of a Single Variable, Sixth EditionCh. 1 (Section 1.1)Ch. 4 (Section 4.2, 4.3pp. 41-45, 91, 265

PRESCRIBED LEARNING OUTCOMES SUGGESTED INSTRUCTIONAL STRATEGIES
196
It is expected that students will understand thehistorical background and problems that lead tothe development of calculus.
It is expected that students will:
• describe the contributions made by variousmathematicians and philosophers to thedevelopment of calculus, including:- Archimedes- Fermat- Descartes- Barrow- Newton- Leibniz- Jakob and Johann Bernoulli- Euler- L’Hospital
Students gain a better understanding and appreciationfor this field of mathematics by studying the lives ofprincipal mathematicians credited for the invention ofcalculus, including the period in which they lived andthe significant mathematical problems they wereattempting to solve.
• Conduct a brief initial overview of the historicaldevelopment of calculus, then deal with specifichistorical developments when addressing relatedtopics (e.g., the contributions of Fermat and Descaresto solving the tangent line problem can be coveredwhen dealing with functions, graphs, and limits).For additional ideas, see the suggested instructionalstrategies for other organizers.
• Encourage students to access the Internet forinformation on the history of mathematics.
• Ask students to investigate various mathematiciansand the associated periods of calculus developmentand to present their findings to the class.
• Point out the connection between integral anddifferential calculus when students are working onthe “area under the curve” problem.
• Conduct a class discussion about the contributions ofLeibniz and Newton when the derivative is being
introduced (e.g., the notation dy
dx for the derivative
and y dx∫ for the integral are due to Leibniz; thef ' (x) notation is due to Lagrange).
• Have students research the historical context of theapplications of antidifferentiation. For example:- The area above the x axis, under y = x2, from x = 0
to x = b is b3/3. Archimedes was able to show thiswithout calculus, using a difficult argument.
- The area problem for y = –– was still unsolvedin the early 17th century. Using antiderivatives,the area under the curve y = –– from t = 1 tot = x is ln x.
- The area under y = sin x, from x = 0 to x = ––, wascalculated by Roberval, without calculus, using adifficult argument. It can be solved easily usingantiderivatives.
CALCULUS 12 • Overview and History of Calculus (Historical Development of Calculus)
1x
1t
π2

RECOMMENDED LEARNING RESOURCESSUGGESTED ASSESSMENT STRATEGIES
197
When students are aware of the outcomes they areresponsible for and the criteria by which their work willbe assessed, they can represent their comprehension ofthe historical development of calculus more creativelyand effectively.
Observe• Have students construct and present a calculus
timeline, showing important discoveries andprominent mathematicians. Check the extent towhich students’ work is:- accurate- complete- clear
Collect• Ask students to write a short article about one
mathematician’s contributions to calculus. Thearticle should describe the mathematical contextwithin which the person lived and worked and thecontributions as seen in calculus today.
Research• Use a research assignment to assess students’
abilities to synthesize information from more thanone source. Have each student select a topic ofpersonal interest, develop a list of three to five keyquestions, and locate relevant information from atleast three different sources. Ask students tosummarize what they learn by responding to each ofthe questions in note form, including diagrams ifneeded. Look for evidence that they are able to:- combine the information, avoiding duplications
or contradictions- make decisions about which points are most
important
Peer Assessment• To check on students’ knowledge of historical figures,
form small groups and ask each group to prepare aseries of three to five questions about the contributionof a particular mathematician. Have groups exchangequestions, then discuss, summarize, and present theiranswers. For each presentation, the group thatdesigned the questions offers feedback on the extent towhich the answers are thorough, logical, relevant, andsupported by specific explanation of the mathematicsinvolved.
CALCULUS 12 • Overview and History of Calculus (Historical Development of Calculus)
Print Materials
• Calculus: Graphical, Numerical, AlgebraicIntegrated Throughout
• Calculus of a Single Variable EarlyTranscendental Functions, Second EditionIntegrated Throughout
• Single Variable Calculus EarlyTranscendentals, Fourth EditionIntegrated Throughout
Multimedia
• Calculus: A New Horizon, Sixth Editionpp. 10-11, 15, 19, 99, 225, 237, 278, 352, 378,638, A3
• Calculus of a Single Variable, Sixth EditionIntegrated Throughout
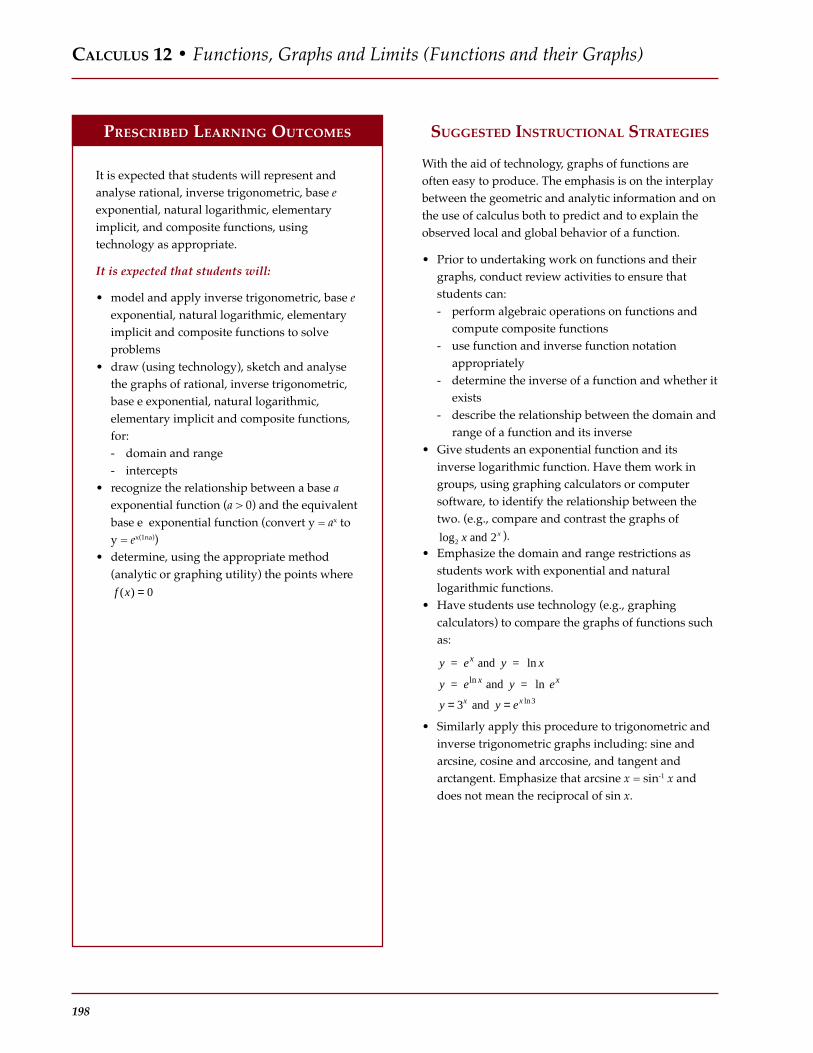
PRESCRIBED LEARNING OUTCOMES SUGGESTED INSTRUCTIONAL STRATEGIES
198
It is expected that students will represent andanalyse rational, inverse trigonometric, base eexponential, natural logarithmic, elementaryimplicit, and composite functions, usingtechnology as appropriate.
It is expected that students will:
• model and apply inverse trigonometric, base eexponential, natural logarithmic, elementaryimplicit and composite functions to solveproblems
• draw (using technology), sketch and analysethe graphs of rational, inverse trigonometric,base e exponential, natural logarithmic,elementary implicit and composite functions,for:- domain and range- intercepts
• recognize the relationship between a base aexponential function (a > 0) and the equivalentbase e exponential function (convert y = ax toy = ex(1na))
• determine, using the appropriate method(analytic or graphing utility) the points wheref x( ) = 0
With the aid of technology, graphs of functions areoften easy to produce. The emphasis is on the interplaybetween the geometric and analytic information and onthe use of calculus both to predict and to explain theobserved local and global behavior of a function.
• Prior to undertaking work on functions and theirgraphs, conduct review activities to ensure thatstudents can:- perform algebraic operations on functions and
compute composite functions- use function and inverse function notation
appropriately- determine the inverse of a function and whether it
exists- describe the relationship between the domain and
range of a function and its inverse• Give students an exponential function and its
inverse logarithmic function. Have them work ingroups, using graphing calculators or computersoftware, to identify the relationship between thetwo. (e.g., compare and contrast the graphs of
log2 2x x and ).• Emphasize the domain and range restrictions as
students work with exponential and naturallogarithmic functions.
• Have students use technology (e.g., graphingcalculators) to compare the graphs of functions suchas:
y e y x
y e y e
y y e
x
x x
x x
= and =
= and =
and
ln
lnln
ln= =3 3
• Similarly apply this procedure to trigonometric andinverse trigonometric graphs including: sine andarcsine, cosine and arccosine, and tangent andarctangent. Emphasize that arcsine x = sin-1 x anddoes not mean the reciprocal of sin x.
CALCULUS 12 • Functions, Graphs and Limits (Functions and their Graphs)

RECOMMENDED LEARNING RESOURCESSUGGESTED ASSESSMENT STRATEGIES
199
The exponential and natural logarithmic functionsenable students to solve more complex problems inareas such as science, engineering, and finance.Students should be able to demonstrate theirknowledge of the relationship between naturallogarithms and exponential functions, both in theoryand in application, in a variety of problem situations.
Observe• Ask students to outline how they would teach a
classmate to explain:- the inverse relationship between base e
exponential and natural logarithmic functions- the restrictions associated with base e exponential
and natural logarithmic, and trigonometric andinverse trigonometric functions
Note the extent to which the outlines:- include general steps to follow- use mathematical terms correctly- provide clear examples- describe common errors and how they can be
avoided
Collect• Assign a series of problems that require students to
apply their knowledge of the relationship betweenlogarithms and exponential functions. Check theirwork for evidence that they:- clearly understood the requirements of the
problem- used efficient strategies and procedures to solve
the problem- recognized when a strategy or procedure was not
appropriate- verified that their solutions were accurate and
reasonable
Self-Assessment• Discuss with students the criteria for assessing
graphing skills. Show them how to develop a ratingscale. Have them use the scale to assess their owngraphing skills.
CALCULUS 12 • Functions, Graphs and Limits (Functions and their Graphs)
Print Materials
• Calculus: Graphical, Numerical, Algebraicpp. 12, 16, 23, 36-37, 45-51, 165
• Calculus of a Single Variable EarlyTranscendental Functions, Second EditionCh. 1 (Sections 1.4, 1.5, 1.6)Ch. 4 (Section 4.6)pp. 5, 20, 26-27, 41, 51-52, 63, 158, 182
• Single Variable Calculus EarlyTranscendentals, Fourth Editionpp. 43-46, 61-63, 69-72, A31-A34
Multimedia
• Calculus: A New Horizon, Sixth Editionpp. 49, 57, 240, 242-243, 246, 254, 261, 308
• Calculus of a Single Variable, Sixth EditionCh. 5 (Section 5.1, 5.4, 5.5, 5.8)pp. 20, 26, 27, 75, 134, 380

PRESCRIBED LEARNING OUTCOMES SUGGESTED INSTRUCTIONAL STRATEGIES
200
CALCULUS 12 • Functions, Graphs and Limits (Limits)
It is expected that students will understand theconcept of limit of a function and the notationused, and be able to evaluate the limit of afunction.
It is expected that students will:
• demonstrate an understanding of the conceptof limit and notation used in expressing thelimit of a function f x( ) as x approaches a:lim ( )x a
f x→
• evaluate the limit of a function- analytically- graphically- numerically
• distinguish between the limit of a function as xapproaches a and the value of the function atx = a
• demonstrate an understanding of the conceptof one-sided limits and evaluate one-sidedlimits
• determine limits that result in infinity (infinitelimits)
• evaluate limits of functions as x approachesinfinity (limits at infinity)
• determine vertical and horizontal asymptotesof a function, using limits
• determine whether a function is continuous atx = a
Students require a firm understanding of limits in orderto fully appreciate the development of calculus.
• Although the concept of limit should be introducedat the beginning of the course, particular limits (e.g.,
limsin
x
x
x→0) need only be introduced as needed to deal
with new derivatives.• Using diagrams, introduce students in a general way
to the two classic problems in calculus: the tangentline problem and the area problem and explain howthe concept of limit is used in the analysis.
• Give students a simple function such as f x x( ) = 2
and have them:- determine the slope of the tangent line to
f x x( ) = 2 at the point (2,4) by evaluating the slope
of the secant lines through (2,4) and (2.5, ƒ(2.5)),(2.1, ƒ(2.1)), (2.05, ƒ(2.05)), (2.01, ƒ(2.01)), thendraw conclusions about the value of the slope ofthe tangent line
- determine the area under y x= 2 above the x axisfrom x = 0 to x = 2 by letting the number ofrectangles be 4, 8, and 16, then inferring the exactarea under the curve.
• Give students limit problems that call for analytic,graphical, and/or numerical evaluation, as in thefollowing examples:
- limx
x
x→
−−2
2 42
(evaluate analytically)
- limsin
x
x
x→0 (evaluate numerically, geometrically, and
using technology)
- limx
x
x→0
+−
3 54
2
2 (evaluate analytically and numerically)
- limx x→
= ∞0 2
1 (draw conclusions numerically)
• When introducing students to one-sided limits thatresult in infinity, have them draw conclusions aboutthe vertical asymptote to y f x= ( ) , as in the following
example: from limx x→ + −3
13
and limx x→ − −3
13
, conclude that
x = 3 is the vertical asymptote for f xx
( ) =−1
3.
• Have students explore the limits to infinity of afunction and draw conclusions about the horizontalasymptote, as in the following example: because
limx
x
x
e
e→+∞ +=
11 and because lim
x
x
x
e
e→ -∞ +=
10 , y=1 and
y=0 are horizontal asymptotes for f xe
e
x
x( ) =+1
.

RECOMMENDED LEARNING RESOURCESSUGGESTED ASSESSMENT STRATEGIES
201
CALCULUS 12 • Functions, Graphs and Limits (Limits)
Limits form the basis of how calculus can be used tosolve previously unsolvable problems. Students shouldbe able to demonstrate their knowledge of both thetheory and application of limits in a variety of problemsituations.
Observe• While students are working on problems involving
limits, look for evidence that they can:- distinguish between the limit of a function and
the value of a function- Identify and evaluate one-sided limits- recognize and evaluate infinite limits and limits at
infinity- determine any vertical or horizontal asymptote of
a function- determine whether a function is continuous over
a specified range or point• To check students’ abilities to reason mathematically,
have them describe orally the characteristics of limitsin relation to one-sided limits, infinite limits, limitsat infinity, asymptotes, and continuity of a function.To what extent do they give explanations that aremathematically correct, logical, and clearlypresented.
Collect• Assign a series of problems that require students to
apply their knowledge of limits. Check their workfor evidence that they:- clearly understood the requirements of the
problem- used the appropriate method to evaluate the limit
in the problem- verified that their solutions were accurate and
reasonable
Self-Assess/Peer Assess• Have students explain concepts such as “limit” and
“continuity” to each other in their own words.
Print Materials
• Calculus: Graphical, Numerical, Algebraicpp. 55-61, 65-77
• Calculus of a Single Variable EarlyTranscendental Functions, Second Editionpp. 63, 72, 75, 84, 96-97, 113, 227-228
• Single Variable Calculus EarlyTranscendentals, Fourth EditionCh. 2 (Sections 2.2, 2.5, 2.6)
Multimedia
• Calculus: A New Horizon, Sixth Editionpp. 115, 118, 120, 122-124, 131, 148, 161
• Calculus of a Single Variable, Sixth EditionCh. 1 (Section 1.2, 1.4, 1.5)Ch. 3 (Section 3.5)

PRESCRIBED LEARNING OUTCOMES SUGGESTED INSTRUCTIONAL STRATEGIES
202
It is expected that students will understand theconcept of a derivative and evaluate derivativesof a function using the definition of derivative.
It is expected that students will:
• describe geometrically a secant line and atangent line for the graph of a function atx = a
• define and evaluate the derivative at x = a as:
lim( ) ( )
h
f a h f a
h→
+ −0
and lim( ) ( )
x a
f x f a
x a→
−−
• define and calculate the derivative of afunction using:
f xf x h f x
hh' ( ) lim
( ) ( )= + −→0
or
f xf x x f x
xx' ( ) lim
( ) ( )= + −→∆
∆∆0
or
f xy
xx' ( ) lim=
→∆
∆∆0
• use alternate notation interchangeably to
express derivatives (i.e., f xdy
dxy' ( ), , ' , etc.)
• compute derivatives using the definition ofderivative
• distinguish between continuity anddifferentiability of a function at a point
• determine when a function is non-differentiable, and explain why
• determine the slope of a tangent line to acurve at a given point
• determine the equation of the tangent line toa curve at a given point
• for a displacement function s s t= ( ) , calculatethe average velocity over a given timeinterval and the instantaneous velocity at agiven time
• distinguish between average andinstantaneous rate of change
The concept of the derivative can be used to calculateinstantaneous rate of change. Students can best understandthis concept if it is presented to them geometrically,analytically, and numerically. This allows them to makeconnections between the various forms of presentation.
• Present an introduction to the “tangent line”problem by discussing the contribution made byFermat, Descartes, Newton, and Leibniz.
• Use a graphing utility to graph
f x x x x( ) = − + −2 4 3 53 2 .On the same screen, add the graphs of y = x - 5,y = 2x - 5, y = 3x - 5. Have students identify which ofthese lines appears to be tangent to the graph at thepoint (0, -5). Have them explain their answers.
• Sketch a simple parabola y = x2 on the board. Attach astring at a point and show how it can be moved froma given secant line to a tangent line at a different pointon the graph. Show how the slope of the secant lineapproaches that of the tangent line as ∆x → 0.
• Have students calculate the slope of a linear functionat a point x = a (e.g., f x x x( ) = + =3 2 1 at ), using the
formula lim( ) ( )
∆
∆∆x
f a x f a
x→
+ −0
. Have students use the
same formula to find the slope of the tangent lines tothe graph of a non-linear function such as f(x) = x2 - 4at a = 1, and then find the equation of the tangent lines.
• Ask students to use technology to:- reinforce the result found when using the
definition to calculate the derivative of a function- verify that the tangent line as calculated, appears
to be the tangent to the curve. As an extension,have students zoom in at the point of tangencyand describe the relationship between the tangentline and the curve
• Introduce the differentiability of a function bygenerating problems that require students to create,using technology, graphs with sharp turns andvertical tangent lines.
• Have students work in groups to prepare apresentation on tangent lines and the use ofmathematics by the ancient Greeks (circle, ellipse,parabola). Ask them to include an explanation ofhow the initial work of the Greeks was surpassed bythe work of Fermat and Descartes and howpreviously difficult arguments were made intoessentially routine calculations.
CALCULUS 12 • The Derivative (Concept and Interpretations)
RECOMMENDED LEARNING RESOURCESSUGGESTED ASSESSMENT STRATEGIES
203
The concept of the derivative facilitates the solving ofcomplex problems in fields such as science,engineering, and finance. Students should be able todemonstrate knowledge of the derivative in relation toproblems involving instantaneous rate of change.
Observe• As students work, circulate through the classroom
and note:- the extent to which they relate their algebraic
work to their graphing work- whether they can recognize the declining nature
of the x values• Have students develop a table of values to calculate
a “slope predictor” in the parabola y = x2 at a point.In small groups they can justify the concept of a limitusing technology. Higher magnifications willeliminate the difference in the slope values of secantand tangent lines at a point. Ask one student fromeach group to explain this phenomenon, using thegroup’s ‘unique’ sample slope calculation. Note howsuccinctly they describe the processes used.
• When students work with technology (e.g., graphingcalculator), check the extent to which they:- select appropriate viewing windows- enter the functions correctly- interpret the results correctly
Question• Have students explain in their own words the concepts
of average and instantaneous rates of change.
Research• When students report on the contributions of
various mathematicians to the tangent line problem,check the extent to which they:- clearly address key concepts (e.g., explain how
Fermat found the length of the subtangent; howDescartes found the slope of the normal)
- include careful graphic illustrations
CALCULUS 12 • The Derivative (Concept and Interpretations)
Print Materials
• Calculus: Graphical, Numerical, Algebraicpp. 83-85, 95-97, 105-107, 122-124, 152
• Calculus of a Single Variable EarlyTranscendental Functions, Second Editionpp. 60, 110, 112-117, 123, 125-129, 137, 142, 174,662, 675
• Single Variable Calculus EarlyTranscendentals, Fourth EditionCh. 2 (Sections 2.7, 2.8, 2.9)
Multimedia
• Calculus: A New Horizon, Sixth EditionCh. 3pp. 170, 172, 175, 178-180, 186, 187, 353
• Calculus of a Single Variable, Sixth EditionCh. 2 (Section 2.1 )pp. 92-97, 108-109, 166

PRESCRIBED LEARNING OUTCOMES SUGGESTED INSTRUCTIONAL STRATEGIES
204
It is expected that students will determinederivatives of functions using a variety oftechniques.
It is expected that students will:
• compute and recall the derivatives ofelementary functions including:
-d
dxx rxr r( ) = −1 , r is real
-d
dxe ex x( ) =
-d
dxx
x(ln ) =
1
-d
dxx x(cos ) sin= −
-d
dxx x(sin ) cos=
-d
dxx x(tan ) sec= 2
-d
dxx
x(sin )− =
−1 1
1 2
-d
dxx
x(tan )− =
+1 1
1 2
• use the following derivative formulas tocompute derivatives for the correspondingtypes of functions:
- constant times a functiond
dxcu c
du
dx= :
-d
dxu v
du
dx
dv
dx( )+ = + (sum rule)
-d
dxuv u
dv
dxv
du
dx( ) = + (product rule)
- d
dx
u
v
vdu
dxu
dv
dxv
( ) =−
2 (quotient rule)
-d
dxu nu
du
dxn n( ) = −1 (power rule)
• use the Chain Rule to compute the derivative
of a composite function: dy
dx
du
dx
dy
du= or
d
dxF g x g x F g x( ( ( ))) ' ( ) ' ( ( ))=
• compute the derivative of an implicit function• use the technique of logarithmic differentiation• compute higher order derivatives
Knowledge of a variety of techniques for computing thederivatives of different types of functions allowsstudents to solve an ever-increasing range of problems.To become efficient problem solvers students need tounderstand when and how to use derivative formulas,but will also find it useful to memorize some basicderivatives.
• Point out to students that the derivatives of a few
functions (e.g., x2, 1x
, x ) will already have been
obtained using the definition of a derivative.• To help students connect the limit concept to the
derivative of sin x, demonstrate the details ofd
dxx x(sin ) cos= , using the known fact that
sin(x + h) = cos x sin h + sin x cos h and that
limsin
h
h
h→=
01. Alternatively, you can provide these
known facts to students and have them work ingroups to develop the solution.
• Have students work in groups to differentiate
f xx x
x( )
( ) ( )= + −1 1 25 7
3 , using two different methods:
1) the chain, product, and quotient rules2) logarithmic differentiationAsk students to compare the two methods.
• Demonstrate that the derivatives of functions such asln x, sin-1 x, and cos-1 x can be found using implicit
differentiation. For example, given y x= −sin 1 ,dy
dx can
be determined implicitly, as follows:
Since , then
Thus , which means
Since , then
Substituting we get .
Now substitute this into
-
-
-
-
- to get
y x y x
ydy
dxx
dy
dx y
y y y y
y x y x
dy
dx y
dy
dx x
= =
= =
= − = −
= = −
= =−
−sin sin
coscos
cos sin cos sin
sin , cos
cos
1
2 2 2
2
2
1
1 1
1
1 1
1
• Although full proof of the chain rule isuninformative, a graphing calculator can be used to
show quite persuasively that for example d
dxxsin3( )
ought to be 3 cos 3x at any particular place x [given
that d
dxx xsin cos= ].
CALCULUS 12 • The Derivative (Computing Derivatives)
RECOMMENDED LEARNING RESOURCESSUGGESTED ASSESSMENT STRATEGIES
205
CALCULUS 12 • The Derivative (Computing Derivatives)
As students develop confidence and proficiencycomputing the derivative of elementary functions, theyare better prepared to solve more complex problemsthat involve derivative formulas. Assessment shouldfocus on students’ ability to recall derivatives ofelementary functions and apply this knowledgeappropriately when computing the derivative of a morecomplex function (using formulas, implicitdifferentiation, or logarithmic differentiation).
Observe• As students are working on problems, circulate and
provide feedback on their notation use. Havestudents verify their work using a graphingcalculator.
Collect• For a question where f(x) = (x2+ x) 3 ask students to
debate the effectiveness of finding the derivativeusing expansion, the chain rule, the product rule,and logarithmic differentiation. To what extent dotheir arguments illustrate their ability to expand oncurrent mathematical idea?
• Have students present to the class research on someelementary functions and their derivatives.
• Discuss with students the merits of the variousmethods of taking derivatives. Have themsummarize in writing their understanding of themerits of each. Work with them to develop a set ofcriteria to assess the summaries.
Self-Assessment• To assess students’ command of the chain rule, have
them list common difficulties they encounter intaking derivatives. Let them work in pairs todevelop checklists of reminders to use when they’rechecking their work.
• Ask students to summarize derivatives ofelementary functions, making notes on notationerrors. Allow students to complete assignmentsusing their summaries.
Print Materials
• Calculus: Graphical, Numerical, AlgebraicCh. 3 (Sections 3.3, 3.5, 3.6, 3.7, 3.8, 3.9)pp. 119, 151-154, 169
• Calculus of a Single Variable EarlyTranscendental Functions, Second Editionpp. 121, 125-126, 133-134, 137, 139, 143, 149,158, 163, 168, 170
• Single Variable Calculus EarlyTranscendentals, Fourth EditionCh. 3 (Sections 3.1, 3.2, 3.4, 3.5, 3.6, 3.7 3.8)
Multimedia
• Calculus: A New Horizon, Sixth Editionpp. 189, 191-196, 200, 204, 246, 257, 258, 261
• Calculus of a Single Variable, Sixth EditionCh. 2 (Section 2.5)pp. 103, 105-107, 114-120,125-126, 315-316, 340,380
PRESCRIBED LEARNING OUTCOMES SUGGESTED INSTRUCTIONAL STRATEGIES
206
It is expected that students will use the first andsecond derivatives to describe the characteristicof the graph of a function.
It is expected that students will:
• given the graph of y f x= ( ) :- graph y f x= ′( ) and y f x= ′′ ( )
- relate the sign of the derivative on aninterval to whether the function isincreasing or decreasing over that interval.
- relate the sign of the second derivative tothe concavity of a function
• determine the critical numbers and inflectionpoints of a function
• determine the maximum and minimum valuesof a function and use the first and/or secondderivative test(s) to justify their solutions
• use Newton’s iterative formula (withtechnology) to find the solution of givenequations, f x( ) = 0
• use the tangent line approximation to estimatevalues of a function near a point and analysethe approximation using the second derivative
CALCULUS 12 • Applications of Derivatives (Derivatives and the Graph of the Function)
The first and second derivatives of a function provide agreat deal of information concerning the graph of thefunction. This information is critical to solvingproblems involving calculus and helps studentsunderstand what the graph of a function represents.
• Ask students to compare the questions, “Where is− + +x x x3 214 20 increasing most rapidly? Where is− + +x x x3 214 20 increasing?” Have students developsimilar questions.
• Have students work in teams of two to determinewhy the calculator is not helpful in questions suchas: “let f x ax x( ) = −3 25 . Describe in terms of theparameter a, where f x( ) reaches a maximum orminimum.”
• Have students use technology to explore features offunctions such as the following:- when a function has maximum/minimum points
or neither- where the inflection points occur- where curves are concave up or down- vertical or horizontal tangent lines- the relationship among graphs of the 1st, 2nd
derivatives of a function and the function- the impact that endpoints have on the maximum/
minimum• Use a summary chart to demonstrate increasing and
decreasing aspects of a function. Have studentsdescribe how this relates to the 1st derivative.
• Have groups of students learn particular concepts,(e.g., Newton’s method) and teach these to theirpeers. Have them examine situations where it worksvery efficiently, situations where it works veryslowly (e.g., x5 0= ), and situations where it does not
work (e.g., x1
3 0= ). Challenge them to develop
hypotheses as to why it does or does not work.• Have students research and report on the history of
Newton’s method for determining square roots (e.g.,mentioning Heron of Alexandria, and the work ofmathematicians in Babylon, India).
• Discuss with students the relative merits of using ornot using a graphing calculator “to do” calculus.Present them with questions such as
g x x x x( ) = − + −8 5 33 2 contrasted with
f x x x( ) ,= − +13
10 000 1003 . Note that the calculator
does not always give the necessary detail.

RECOMMENDED LEARNING RESOURCESSUGGESTED ASSESSMENT STRATEGIES
207
CALCULUS12 • Applications of Derivatives (Derivatives and the Graph of the Function)
Students demonstrate their understanding of first andsecond derivatives by relating the information theyobtain from these to the graph of a function (i.e., criticalnumbers, inflection points, maximum and minimumvalues, and concavity).
Observe• When reviewing students work, note the extent to
which they can:- accurately determine the 1st and 2nd derivative- apply the respective tests- recognize and describe the relationship among the
graphs of f(x), f’(x), f”(x)
Collect• Ask the students to sketch a cubic graph and
determine what the slopes of the tangent line wouldbe at the local maximum and minimum points. Havethem present their summary to the class. Considerthe extent to which they can explain why thederivative is 0 at a local maximum/minimum.
Peer assessment• Have students critique each others’ graphs using
criteria generated by the class. These criteria couldinclude the extent to which:- a graph is appropriate to the function it is
supposed to represent- the axes are accurately labelled- appropriate scales have been chosen for the axes- the graphs present smooth curves- domain, range, asymptotes, intercepts, and
vertices have been correctly determined- inflection points, maximum and minimum points,
and region of concavity have been correctlyidentified
Print Materials
• Calculus: Graphical, Numerical, AlgebraicCh. 4 (Sections 4.4, 4.6)
• Calculus of a Single Variable EarlyTranscendental Functions, Second Editionpp. 82, 127-128, 173, 247
• Single Variable Calculus EarlyTranscendentals, Fourth EditionCh. 3 (Section 3.10)Ch. 4 (Sections 41, 4.7)
Multimedia
• Calculus: A New Horizon, Sixth Editionpp. 172, 270, 329Calculus of a Single Variable, Sixth EditionCh. 2 (Section 2.6)Ch. 3 (Section 3.7)

PRESCRIBED LEARNING OUTCOMES SUGGESTED INSTRUCTIONAL STRATEGIES
208
It is expected that students will solve appliedproblems from a variety of fields including thePhysical and Biological Sciences, Economics, andBusiness.
It is expected that students will:
• solve problems involving displacement,velocity, acceleration
• solve related rates problems• solve optimization problems (applied
maximum/minimum problems)
Calculus was developed to solve problems that hadpreviously been difficult or impossible to solve. Suchproblems include related rate and optimizationproblems, which arise in a variety of fields thatstudents may be studying (e.g., the physical andbiological sciences, economics, and business).
• Have a student demonstrate a “student trip” in frontof the class — constant speed, accelerate, stop, slowdown, stop, back up. Have students sketch a graphof displacement against time for the movements.
• Discuss average velocity over a specified interval,instantaneous velocity at specified times. Havestudents in pairs create a graph and have theirpartner perform the motion.
• Have students brainstorm examples of the need forcalculus in the real world:- population growths of bacteria- the optimum shape of a container- water draining out of a tank- the path that requires the least time to travel- marginal cost and profit
• Challenge students to create their own “new”problems, which they must then try to solve. Theseproblems could be used to develop tests or unitreviews.
• Have students use technology (e.g., graphingcalculators) to investigate problems and confirmtheir analytical solutions graphically.
• Discuss with students the merits of using versus notusing a graphing calculator “to do” calculus.
CALCULUS 12 • Applications of Derivatives (Applied Problems)

RECOMMENDED LEARNING RESOURCESSUGGESTED ASSESSMENT STRATEGIES
209
Students develop their knowledge of derivatives bysolving problems involving rates of change, maximum,and minimum. When assessing student performance inrelation to these problems, it is important to considerstudents’ abilities to make generalizations andpredictions about how calculus is used in the real world.
Observe• While students are working on problems involving
derivatives, look for evidence they:- clearly understand the requirements of the problem- recognized when a strategy was not appropriate- can explain the process used to determine their
answers- used a graphing calculator where appropriate to
help visualize their solution- verified that their solutions where correct and
reasonable• Provide a number of problems where students are
required to use average velocity or instantaneousvelocity. Observe the extent to which students areable to:- determine whether the situation calls for the
calculation of average velocity or instantaneousvelocity
- explain the differences between the two- provide other examples
Collect• Assign a series of problems that require students to
apply their knowledge of the dynamics of change:how, at certain time the speed of an object is relatedto its height, and how, at a certain time the speed ofan object is related to the change in velocity.
• To discover how well students can recognize andexplain the concepts of change and rapid changegive them a problem such as:
A bacterial colony grows at a rate dydt
yC y= −( ) .
How large is the colony when it is growing mostrapidly? In their analysis look for evidence that theyunderstand the rate of change of “the rate of change.”
Question• While students are working on simple area problems
based on real-life applications, ask them to explainthe relationship between the graph’s units (on eachaxis) and the units of area under the curve.
CALCULUS 12 • Applications of Derivatives (Applied Problems)
Print Materials
• Calculus: Graphical, Numerical, AlgebraicCh. 4 (Sections 4.3, 5.4)pp. 97-98, 172, 180, 198, 202
• Calculus of a Single Variable EarlyTranscendental Functions, Second Editionpp. 182, 184, 195, 197, 209, 219-221, 247, 257
• Single Variable Calculus EarlyTranscendentals, Fourth EditionCh. 2 (Section 2.9)Ch. 3 (Section 3.11)Ch. 4 (Sections 4.2, 4.3, 4.9)
Multimedia
• Calculus: A New Horizon, Sixth Editionpp. 211, 290, 299, 363
• Calculus of a Single Variable, Sixth EditionCh. 3 (Sections 3.2, 3.3, 3.8, 3.9)pp. 157, 171-175, 182-183

PRESCRIBED LEARNING OUTCOMES SUGGESTED INSTRUCTIONAL STRATEGIES
210
It is expected that students will recognizeantidifferentiation (indefinite integral) as thereverse of the differentiation process.
It is expected that students will:
• explain the meaning of the phrase “F(x) is anantiderivative (or indefinite integral) of f(x)”
• use antiderivative notation appropriately (i.e.,f x dx( )∫ for the antiderivative of f x( ) )
• compute the antiderivatives of linearcombinations of functions whose individualantiderivatives are known including:
- k dx kx C = +∫- x dx
x
rCr
r
=+
++
∫1
1 if r ≠ −1
-dx
xx C= +∫ ln
- e dx e Cx x= +∫- sin cosx dx x C = − +∫- cos sinx dx x C = +∫- sec tan2 x dx x C = +∫-
dx
xx C
1 2
1
−= +−∫ sin
-dx
xx C
1 21
+= +−∫ tan
• compute f ax b dx( )+∫ if f u du( ) ∫ is known• create integration formulas from the known
differentiation formulas• solve initial value problems using the concept
that if F x G x' ( ) ' ( )= on an interval, then Fx()and Gx() differ by a constant on that interval
CALCULUS 12 • Antidifferentiation (Recovering Functions from their Derivatives)
Students need to recognize that antidifferentiation isthe reverse of the differentiation process. Thisunderstanding will enable them to calculate or verify.
• Use a variety of methods to explain the need for theconstant, “C”:
- computational: dy
dxC()= 0
- geometrical: if we draw curves y = F(x), y = F(x) +C, one curve is obtained from the other by simplylifting, so slopes of tangent lines match
- kinematic: if v(t) (velocity) is specified, thenvtdt()∫ represents all possible position
(displacement) functions (we can’t reconstructposition from velocity unless we know where wewere at some time)
• To ensure students understand the arbitrary natureof assigning letters to variables, use a reasonablevariety of letters in doing integration problems. Forexample, sin2udu edtat , ∫∫ .
• Integrals such as ( )1 2 9+∫ xdx or 7 4e dxx/∫ can becalculated by a “guess and check” process; there isno need at this stage for a substitution rule ofintegrals. For example, to find 5 6sinxdx ∫ , a studentmight “guess” that an answer is cos 6x, check bydifferentiating to get -6 sin 6x, then adjust to
determine that the indefinite integral is
− +56 6cos x C .
• Initial value problems can be treated very informally.For example, suppose that f’(x) = e2x and f(1) = 3.
What is f(x)? One antiderivative of e2x is ex2
2 (check
by differentiating), but this function does not satisfythe initial condition. To fix it, students can simply
remember that the general antiderivative is e Cx2
2 + ,
then choose C appropriately.• Play a game by challenging students to write down
as fast as possible antiderivatives of simplefunctions, such as ∫ f(au + b)du where ∫ f(x)dx is oneof the standard integrals obtained by reversingfamiliar differentiation results.
• Introduce students to integration tables or softwareapplications for symbolic integration.

RECOMMENDED LEARNING RESOURCESSUGGESTED ASSESSMENT STRATEGIES
211
CALCULUS 12 • Antidifferentiation (Recovering Functions from their Derivatives)
In making connections between antidifferentiation anddifferentiation, students should relate the physicalworld to abstract calculus representations. To assessstudents’ learning, it is appropriate to consider theiroral and written explanations of the meaning ofantidifferentiation as well as evidence from theircomputation, their drawing, and their problem-solvingactivities.
Peer Assessment• Have students work in pairs to find
antidifferentiation problems on the Internet (e.g., atuniversity mathematics department web pages), tryto solve the problems they find, and verify theirsolutions.
Observe/Question• Ensure students’ notation is correct at all times (e.g.,
edxe
Cxx
33
3= +∫ ). It is not necessary to try to justify
the dx part of the notation, but the C (constant) partshould be understood. Use questions to checkunderstanding, such as “Can you think of a functionwhose derivative is x2?”
• Divide the students into small groups, and givethem a problem whose conventional solution uses atechnique that they have not learned, (e.g., generalsubstitution or integration by parts). For example,(∫ xe3x dx, or x xdx2ln ∫ . Observe the degree ofworking control students have of antiderivatives(and derivatives) by seeing how efficiently they canexperiment their way to an answer (i.e., generate avariety of plausible ideas).
Collect• Collect samples of students’ worksheets dealing with
recovery of functions from their derivatives. Assessthe extent to which students are able to compute theantiderivation of functions and determine the valueof C, when given initial conditions.
Self/Peer Assessment• Have students make up tests or quizzes on
antidifferentiation techniques and exchange theirtests with partners. The partners should check eachothers’ work. Allow the partners time to discuss thework and help each other formulate a plan toaddress areas of weakness.
Print Materials
• Calculus: Graphical, Numerical, AlgebraicCh. 6 (Sections 6.1, 6.2)pp. 190, 304 - 307
• Calculus of a Single Variable EarlyTranscendental Functions, Second Editionpp. 278, 279-282, 319, 325, 342, 347, 374, 490,495
• Single Variable Calculus EarlyTranscendentals, Fourth EditionCh. 4 (Section 4.10)Ch. 5 (Section 5.4, 5.5)p. 585
Multimedia
• Calculus: A New Horizon, Sixth Editionpp. 382, 384, 388, 392, 581Calculus of a Single Variable, Sixth Editionpp. 241, 243, 246, 290-291, 366, 385

PRESCRIBED LEARNING OUTCOMES SUGGESTED INSTRUCTIONAL STRATEGIES
212
It is expected that students will useantidifferentiation to solve a variety of problems.
It is expected that students will:
• use antidifferentiation to solve problems aboutmotion of a particle along a line that involve:- computing the displacement given initial
position and velocity as a function of time- computing velocity and/or displacement
given suitable initial conditions andacceleration as a function of time
• use antidifferentiation to find the area under
the curve y fx= (), above the x-axis, from x = a
to x = b
• use differentiation to determine whether agiven function or family of functions is asolution of a given differential equation
• use correct notation and form when writingthe general and particular solution fordifferential equations
• model and solve exponential growth anddecay problems using a differential equation
of the form: dydt
ky=
• model and solve problems involvingNewton’s Law of Cooling using a differential
equation of the form: dydt
ay b= +
CALCULUS 12 • Antidifferentiation (Applications of Antidifferentiation)
Antidifferentiation enables students to solve problemsthat are otherwise unsolvable (e.g., problems related toexponential growth and decay). These problems arefound in a variety of contexts, from science to business.
• Demonstrate how physics formulae about motionunder constant acceleration can be justified usingantidifferentiation. If a(t) = -g, then v(t) = -gt + C forsome C, and therefore st gt Ct D()= − + +1
22 for some
D. The two constants of integration can be found byusing initial conditions. Given g = 9.81 and a rockthrown upward at a given speed from a 100 m tower,it is possible to calculate the maximum heightreached and the time it takes for the rock to hit theground. There are many variations on this problem.
• To explain why antiderivatives can be used to solvearea problems, let f(x) be some given function, andlet A(u) be the area under y = f(x), above the x axis,
from x=a to x=u. By looking at Au h Au
h( ) ()+ −
, we
can argue reasonably that A’(u) = f(u), at the sametime reinforcing the concept of derivative from thedefinition. So A(u) is an antiderivative of f(u). A(a)=0.
• Many calculators have a numerical integrationfeature that approximates fxdx
a
b()∫ . Have students
find the area from a to b under a curve y=f(x) forwhich they can find ∫ f(x)dx. Compare this solutionwith the calculator’s approximation.
• Give students a function such as f(x) = ln x and askthem to make a rough sketch of an antiderivativeF(x) of f(x) such that F(1) = 0.
• Illustrate the wide applicability of the concepts byusing examples that are not from the physicalsciences. For example, let C(x) be the cost ofproducing x tons of a certain fertilizer. Suppose that(for reasonable x), C’(x) is about 30 - 0.02x. The costof producing 2 tons is $5000. What is the cost ofproducing 100 tons?
• Have students generate and maintain a list ofphenomena other than radioactive decay that aredescribed by the same differential equation. Forexample, the illumination I(x) that reaches x metresbelow the surface of the water can be described bydIdx
kI= − . Under constant inflation, the buying
power V(t) of a dollar t years of now can be
described by dVdt
kV= − .

RECOMMENDED LEARNING RESOURCESSUGGESTED ASSESSMENT STRATEGIES
213
CALCULUS 12 • Antidifferentiation (Applications of Antidifferentiation)
An understanding of antidifferentiation and itsapplications is essential to the solution of the “areaunder the curve” problems. Students can demonstratetheir understanding of antidifferentiation ideas andskills through their problem-solving work.
• To check whether the meaning of the phrase“solution of a differential equation” is fullyunderstood, have students work in groups to discussand solve problems such as the following:- show that y = x8 is a solution of the differential
equation xdydx
y= 8
- find a solution of the above differential equationwith y(2) = 16
• When students are asked to solve problems such asthe following, verify that they are able to identify sinkt and cos kt as solutions of the differential equationand that they can find other solutions as well:- A weight hangs from an ideal spring. It is pulled
down a few centimetres then released. If y is thedisplacement of the weight from its rest position,
it turns out that d y
dtk y
2
2
2= − for some constant k
• Take a problem (e.g., an exponential decay problemwith several parts) and ask for the solution to bewritten up as a prose report, in complete sentences,with the reasons for each step clearly explained.Criteria for assessment include clarity andgrammatical correctness.
• Pose the problem, “In how many different ways canwe find the area under y = x2, above the x axis, fromx = 0 to x = a, exactly or approximately?” Studentscan write a report on this. Students should be able toidentify- Archimedes’ method- standard antiderivative method- approximation techniques of their own devising
• Ask students to use standard Internet resources tofind information about differential equations invarious areas of application, and to report on an areaof interest to them. Assess the extent to which theyare able to express their findings coherently and intheir own words.
Print Materials
• Calculus: Graphical, Numerical, AlgebraicCh. 6 (Section 6.1, 6.4)pp. 262 - 263, 311, 333-334
• Calculus of a Single Variable EarlyTranscendental Functions, Second Editionpp. 278, 290, 373-374, 377, 381-382, 385, 409
• Single Variable Calculus EarlyTranscendentals, Fourth EditionCh. 4 (Section 4.10)Ch. 5 (Sections 5.1, 5.4)pp. 586, 603, 611
Multimedia
• Calculus: A New Horizon, Sixth Editionpp. 328, 408, 433, 580, 601, 611
• Calculus of a Single Variable, Sixth EditionCh. 4 (Section 4.4)Ch. 5 (Section 5.5)pp. 242, 362


APPENDICESMathematics 10 to 12


A-1
APPENDIX A: PRESCRIBED LEARNING OUTCOMES • Applications of Mathematics 10
Prescribed Learning Outcomes
Prescribed Learning Outcomes
APPENDIX A

A-2
APPENDIX A: PRESCRIBED LEARNING OUTCOMES • Applications of Mathematics 10
Prescribed Learning Outcomes

A-3
APPENDIX A: PRESCRIBED LEARNING OUTCOMES • Applications of Mathematics 10
Prescribed Learning Outcomes
NUMBER
(Number Concepts)
It is expected thatstudents will analyse thenumerical data in a tablefor trends, patterns andinterrelationships.
It is expected that students will:
• solve problems that involve a specific content area such as, geometry,algebra, trigonometry, statistics, probability, etc.
• solve problems that involve more than one content area• solve problems that involve mathematics within other disciplines• analyse problems and identify the significant elements• develop specific skills in selecting and using an appropriate problem-
solving strategy or combination of strategies chosen from, but notrestricted to, the following:- guess and check- look for a pattern- make a systematic list- make and use a drawing or model- eliminate possibilities- work backward- simplify the original problem- develop alternative original approaches- analyse keywords
• demonstrate the ability to work individually and co-operatively to solveproblems
• determine that their solutions are correct and reasonable• clearly communicate a solution to a problem and the process used to
solve it• use appropriate technology to assist in problem solving
PROBLEM SOLVING
It is expected thatstudents will use a varietyof methods to solve real-life, practical, technical,and theoretical problems.
It is expected that students will:
• use words and algebraic expressions to describe the data and theinterrelationships in a table with rows that are not related recursively(not calculated from previous data)
• use words and algebraic expressions to describe the data and theinterrelationships in a table with rows that are related recursively(calculated from previous data)
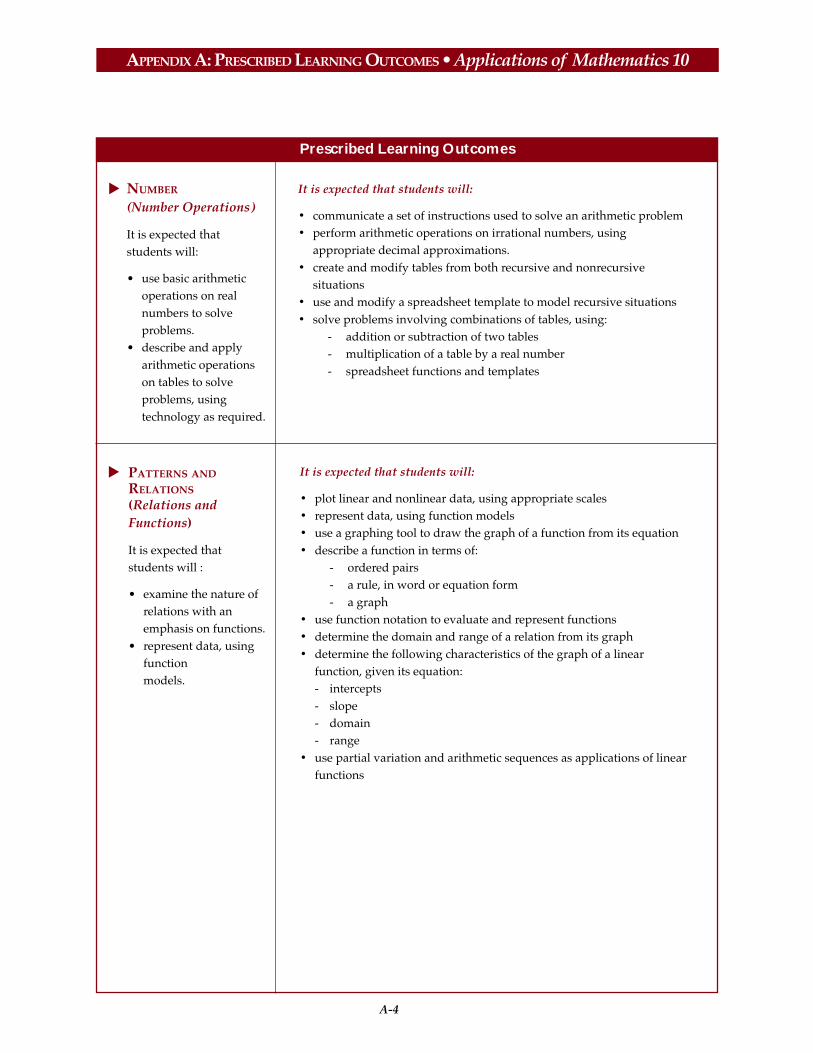
A-4
APPENDIX A: PRESCRIBED LEARNING OUTCOMES • Applications of Mathematics 10
Prescribed Learning Outcomes
NUMBER
(Number Operations)
It is expected thatstudents will:
• use basic arithmeticoperations on realnumbers to solveproblems.
• describe and applyarithmetic operationson tables to solveproblems, usingtechnology as required.
It is expected that students will:
• communicate a set of instructions used to solve an arithmetic problem• perform arithmetic operations on irrational numbers, using
appropriate decimal approximations.• create and modify tables from both recursive and nonrecursive
situations• use and modify a spreadsheet template to model recursive situations• solve problems involving combinations of tables, using:
- addition or subtraction of two tables- multiplication of a table by a real number- spreadsheet functions and templates
PATTERNS AND
RELATIONS
(Relations andFunctions)
It is expected thatstudents will :
• examine the nature ofrelations with anemphasis on functions.
• represent data, usingfunctionmodels.
It is expected that students will:
• plot linear and nonlinear data, using appropriate scales• represent data, using function models• use a graphing tool to draw the graph of a function from its equation• describe a function in terms of:
- ordered pairs- a rule, in word or equation form- a graph
• use function notation to evaluate and represent functions• determine the domain and range of a relation from its graph• determine the following characteristics of the graph of a linear
function, given its equation:- intercepts- slope- domain- range
• use partial variation and arithmetic sequences as applications of linearfunctions

A-5
APPENDIX A: PRESCRIBED LEARNING OUTCOMES • Applications of Mathematics 10
Prescribed Learning Outcomes
SHAPE AND SPACE
(3-D Objects and 2-DShapes)
It is expected thatstudents will solvecoordinate geometryproblems involvinglines and line segments.
SHAPE AND SPACE
(Measurment)
It is expected thatstudents will:
• demonstrate anunderstanding ofscale factors, and theirinterrelationship withthe dimensions ofsimilar shapes andobjects
• solve problemsinvolving triangles,including those foundin 3-D and 2-Dapplications
It is expected that students will:
• calculate the volume and surface area of a sphere, using formulas that areprovided
• determine the relationships among linear scale factors, areas, the surfaceareas and the volumes of similar figures and objects
• solve problems involving two right triangles• extend the concepts of sine and cosine for angles through to 180˚• apply the sine and cosine laws, excluding the ambiguous case, to solve
problems• select and apply appropriate instruments, units of measure (in SI and
Imperial systems) and measurement strategies to find lengths, areas andvolumes
• analyse the limitations of measuring instruments and measurementstrategies, using the concepts of precision and accuracy
• solve problems involving length, area, volume, time, mass and ratesderived from these
• interpret drawings, and use the information to solve problems
It is expected that students will:
• solve problems involving distances between points in the coordinateplane
• solve problems involving midpoints of line segments• solve problems involving rise, run and slope of line segments• determine the equation of a line, given information that uniquely
determines the line• solve problems using slopes of:
- parallel lines- perpendicular lines

A-6
APPENDIX A: PRESCRIBED LEARNING OUTCOMES • Applications of Mathematics 10
Prescribed Learning Outcomes
STATISTICS AND
PROBABILITY
(Data Analysis)
It is expected thatstudents will implementand analyse samplingprocedures, and drawappropriate inferencesfrom the data collected.
It is expected that students will:
• choose, justify and apply sampling techniques that will result in anappropriate, unbiased sample from a given population
• defend or oppose inferences and generalizations about populations,based on data from samples
• determine the equation of a line of best fit, using:- estimate of slope and one point- least squares method with technology
• use technological devices to determine the correlation coefficient r• interpret the correlation coefficient r and its limitations for varying
problem situations, using relevant scatterplots

A-7
APPENDIX A: PRESCRIBED LEARNING OUTCOMES • Applications of Mathematics 11
Prescribed Learning Outcomes
NUMBER
(Number Operations)
It is expected that studentswill solve consumerproblems, using arithmeticoperations.
PROBLEM SOLVING
It is expected thatstudents will use avariety of methods tosolve real-life, practical,technical, and theoreticalproblems
It is expected that students will:
• solve problems that involve a specific content area such as geometry,algebra, trigonometry, statistics, or probability
• solve problems that involve more than one content area• solve problems that involve mathematics within other disciplines• analyse problems and identify the significant elements• develop specific skills in selecting and using an appropriate problem-
solving strategy or combination of strategies chosen from, but notrestricted to, the following:- guess and check- look for a pattern- make a systematic list- make and use a drawing or model- eliminate possibilities- work backward- simplify the original problem- develop alternative original approaches- analyse keywords
• demonstrate the ability to work individually and co-operatively tosolve problems
• determine that their solutions are correct and reasonable• clearly communicate a solution to a problem and the process used to
solve it• use appropriate technology to assist in problem solvingIt is expected
that students will use a variety of methods to solve real-life, practical,technical, and theoretical problems.
It is expected that students will:
• solve consumer problems, including:- wages earned in various situations- property taxation- exchange rates- unit prices
• reconcile financial statements including:- cheque books with bank statements- cash register tallies with daily receipts
• solve budget problems, using graphs and tables to communicatesolutions
• solve investment and credit problems involving simple and compoundinterestIt is expected that students will analyse the numerical data in atable for trends, patterns and interrelationships.

A-8
APPENDIX A: PRESCRIBED LEARNING OUTCOMES • Applications of Mathematics 11
Prescribed Learning Outcomes
PATTERNS AND
RELATIONS
(Variables andEquations)
It is expected thatstudents will:
• represent and analysesituations that involveexpressions, equationsand inequalities.
• use linearprogramming to solveoptimization problems.
It is expected that students will:
• graph linear inequalities, in two variables• solve systems of linear equations, in two variables:
- algebraically (elimination and substitution)- graphically
• solve nonlinear equations, using a graphing tool.• solve systems of linear inequalities in two variables using graphing
technology• design and solve linear and nonlinear systems, in two variables, to
model problem situations• apply linear programming to find optimal solutions to decision-
making problems
PATTERNS AND
RELATIONS
(Relations andFunctions)
It is expected thatstudents will representand analyse quadratic,polynomial andrational functions,using technology asappropriate.
It is expected that students will:
• determine the following characteristics of the graph of a quadraticfunction:- vertex- domain and range- axis of symmetry- intercepts

A-9
APPENDIX A: PRESCRIBED LEARNING OUTCOMES • Applications of Mathematics 11
Prescribed Learning Outcomes
SHAPE AND SPACE
(3-D Objects and 2-DShapes)
It is expected thatstudents will developand apply the geometricproperties of circles andpolygons to solveproblems.
SHAPE AND SPACE
(Measurment)
It is expected thatstudents will:
• demonstrate anunderstanding ofscale factors, and theirinterrelationship withthe dimensions ofsimilar shapes andobjects.
• use measuring devicesto make estimates andto performcalculations in solvingproblems.
It is expected that students will:
• enlarge or reduce a dimensioned object, according to a specified scale• calculate maximum and minimum values, using tolerances, for lengths,
areas and volumes• solve problems involving percentage error when input variables are
expressed with percentage errors• design an appropriate measuring process or device to solve a problem
It is expected that students will:
• use technology with dynamic geometry software to confirm and applythe following properties:- the perpendicular from the centre of a circle to a chord bisects the
chord- the measure of the central angle is equal to twice the measure of the
inscribed angle subtended by the same arc- the inscribed angles subtended by the same arc are congruent- the angle inscribed in a semicircle is a right angle- the opposite angles of a cyclic quadrilateral are supplementary- a tangent to a circle is perpendicular to the radius at the point of
tangency- the tangent segments to a circle, from any external point, are
congruent- the sum of the interior angles of an n-sided polygon is equal to (2n –
4) right angles• use properties of circles and polygons to solve design and layout
problems

A-10
APPENDIX A: PRESCRIBED LEARNING OUTCOMES • Applications of Mathematics 11
Prescribed Learning Outcomes
STATISTICS AND
PROBABILITY
(Data Analysis)
It is expected thatstudents will analysegraphs or charts ofgiven situations toderive specificinformation.
It is expected that students will:
• extract information from given graphs of discrete or continuous data,using:- time series- continuous data- contour lines
• draw and validate inferences, including interpolations andextrapolations, from graphical and tabular data
• design different ways of presenting data and analyzing results, byfocusing on the truthful display of data and the clarity of presentation
• collect experimental data and use best-fit exponential and quadraticfunctions, to make predictions and solve problems
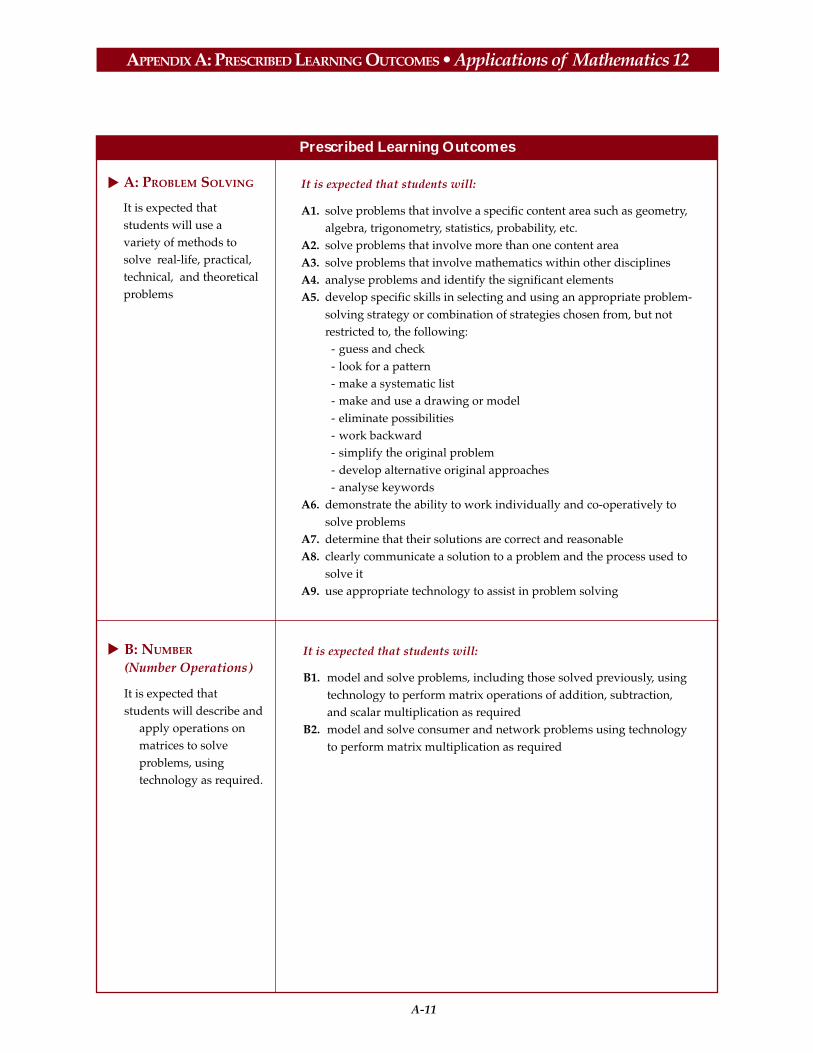
A-11
APPENDIX A: PRESCRIBED LEARNING OUTCOMES • Applications of Mathematics 12
Prescribed Learning Outcomes
A: PROBLEM SOLVING
It is expected thatstudents will use avariety of methods tosolve real-life, practical,technical, and theoreticalproblems
It is expected that students will:
A1. solve problems that involve a specific content area such as geometry,algebra, trigonometry, statistics, probability, etc.
A2. solve problems that involve more than one content areaA3. solve problems that involve mathematics within other disciplinesA4. analyse problems and identify the significant elementsA5. develop specific skills in selecting and using an appropriate problem-
solving strategy or combination of strategies chosen from, but notrestricted to, the following:
- guess and check- look for a pattern- make a systematic list- make and use a drawing or model- eliminate possibilities- work backward- simplify the original problem- develop alternative original approaches- analyse keywords
A6. demonstrate the ability to work individually and co-operatively tosolve problems
A7. determine that their solutions are correct and reasonableA8. clearly communicate a solution to a problem and the process used to
solve itA9. use appropriate technology to assist in problem solving
B: NUMBER
(Number Operations)
It is expected thatstudents will describe and
apply operations onmatrices to solveproblems, usingtechnology as required.
It is expected that students will:
B1. model and solve problems, including those solved previously, usingtechnology to perform matrix operations of addition, subtraction,and scalar multiplication as required
B2. model and solve consumer and network problems using technologyto perform matrix multiplication as required
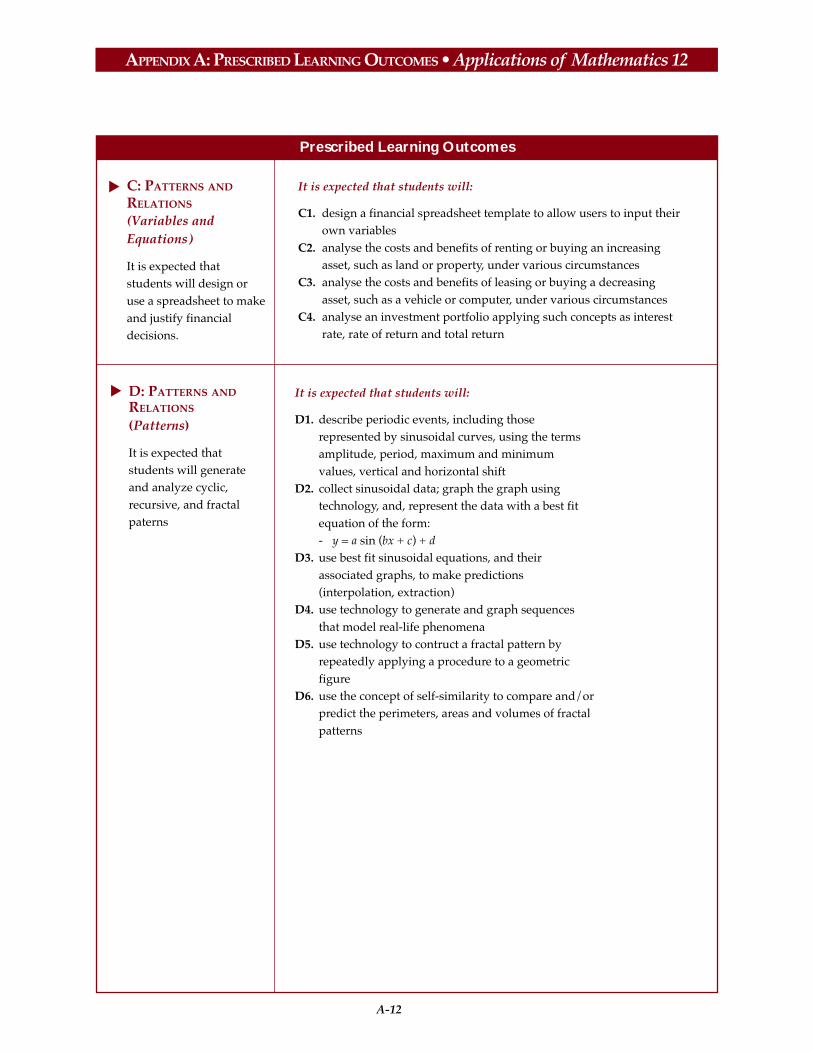
A-12
APPENDIX A: PRESCRIBED LEARNING OUTCOMES • Applications of Mathematics 12
Prescribed Learning Outcomes
C: PATTERNS AND
RELATIONS
(Variables andEquations)
It is expected thatstudents will design oruse a spreadsheet to makeand justify financialdecisions.
It is expected that students will:
C1. design a financial spreadsheet template to allow users to input theirown variables
C2. analyse the costs and benefits of renting or buying an increasingasset, such as land or property, under various circumstances
C3. analyse the costs and benefits of leasing or buying a decreasingasset, such as a vehicle or computer, under various circumstances
C4. analyse an investment portfolio applying such concepts as interestrate, rate of return and total return
D: PATTERNS AND
RELATIONS
(Patterns)
It is expected thatstudents will generateand analyze cyclic,recursive, and fractalpaterns
It is expected that students will:
D1. describe periodic events, including thoserepresented by sinusoidal curves, using the termsamplitude, period, maximum and minimumvalues, vertical and horizontal shift
D2. collect sinusoidal data; graph the graph usingtechnology, and, represent the data with a best fitequation of the form:- y = a sin (bx + c) + d
D3. use best fit sinusoidal equations, and theirassociated graphs, to make predictions(interpolation, extraction)
D4. use technology to generate and graph sequencesthat model real-life phenomena
D5. use technology to contruct a fractal pattern byrepeatedly applying a procedure to a geometricfigure
D6. use the concept of self-similarity to compare and/orpredict the perimeters, areas and volumes of fractalpatterns
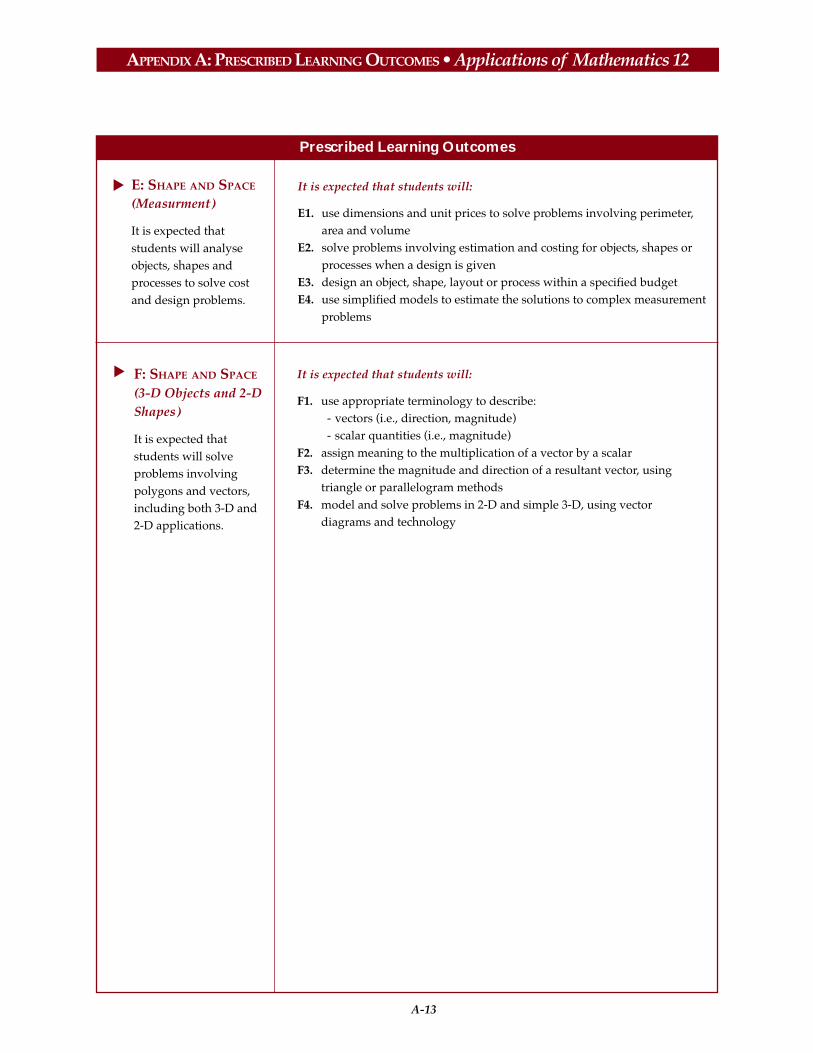
A-13
APPENDIX A: PRESCRIBED LEARNING OUTCOMES • Applications of Mathematics 12
Prescribed Learning Outcomes
F: SHAPE AND SPACE
(3-D Objects and 2-DShapes)
It is expected thatstudents will solveproblems involvingpolygons and vectors,including both 3-D and2-D applications.
E: SHAPE AND SPACE
(Measurment)
It is expected thatstudents will analyseobjects, shapes andprocesses to solve costand design problems.
It is expected that students will:
E1. use dimensions and unit prices to solve problems involving perimeter,area and volume
E2. solve problems involving estimation and costing for objects, shapes orprocesses when a design is given
E3. design an object, shape, layout or process within a specified budgetE4. use simplified models to estimate the solutions to complex measurement
problems
It is expected that students will:
F1. use appropriate terminology to describe:- vectors (i.e., direction, magnitude)- scalar quantities (i.e., magnitude)
F2. assign meaning to the multiplication of a vector by a scalarF3. determine the magnitude and direction of a resultant vector, using
triangle or parallelogram methodsF4. model and solve problems in 2-D and simple 3-D, using vector
diagrams and technology
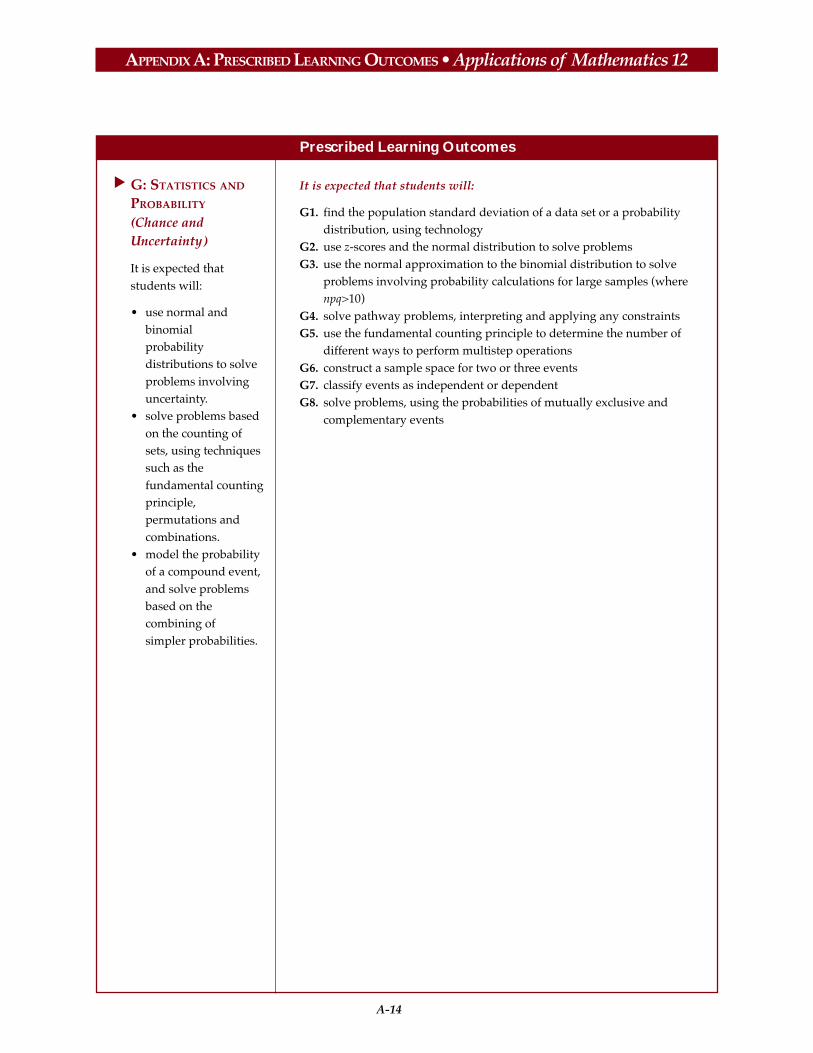
A-14
APPENDIX A: PRESCRIBED LEARNING OUTCOMES • Applications of Mathematics 12
Prescribed Learning Outcomes
G: STATISTICS AND
PROBABILITY
(Chance andUncertainty)
It is expected thatstudents will:
• use normal andbinomialprobabilitydistributions to solveproblems involvinguncertainty.
• solve problems basedon the counting ofsets, using techniquessuch as thefundamental countingprinciple,permutations andcombinations.
• model the probabilityof a compound event,and solve problemsbased on thecombining ofsimpler probabilities.
It is expected that students will:
G1. find the population standard deviation of a data set or a probabilitydistribution, using technology
G2. use z-scores and the normal distribution to solve problemsG3. use the normal approximation to the binomial distribution to solve
problems involving probability calculations for large samples (wherenpq>10)
G4. solve pathway problems, interpreting and applying any constraintsG5. use the fundamental counting principle to determine the number of
different ways to perform multistep operationsG6. construct a sample space for two or three eventsG7. classify events as independent or dependentG8. solve problems, using the probabilities of mutually exclusive and
complementary events

A-15
APPENDIX A: PRESCRIBED LEARNING OUTCOMES • Essentials of Mathematics 10
Prescribed Learning Outcomes
PROBLEM SOLVING
It is expected thatstudents will use avariety of methods tosolve real-life, practical,technical, and theoreticalproblems
It is expected that students will:
• solve problems that involve a specific content area• solve problems that involve more than one content area• solve problems that involve mathematics within other disciplines• analyse problems and identify the significant elements• develop specific skills in selecting and using an appropriate problem-
solving strategy or combination of strategies chosen from, but notrestricted to, the following:- guess and check- look for a pattern- make a systematic list- make and use a drawing or model- eliminate possibilities- work backward- simplify the original problem- develop alternative original approaches- analyse keywords
• demonstrate the ability to work individually and co-operatively to solveproblems
• determine that their solutions are correct and reasonable• clearly communicate a solution to a problem and the process used to
solve it• interpret their solutions by describing what the solution means within
the context of the original problem• use appropriate technology to assist in problem solving
PERSONAL BANKING
It is expected thatstudents will preparebank forms includingcheques, deposit slips,chequebook activityrecord and reconcilationstatements
It is expected that students will:
• name and describe various types of commonly used consumer bankaccounts
• complete various banking forms• describe the use of a bank card for automated teller machines (ATMs)
and debit payments• identify different types of bank service charges and their relative costs• reconcile financial statements, such as chequebooks and electronic
bank transactions with bank statements

A-16
APPENDIX A: PRESCRIBED LEARNING OUTCOMES • Essentials of Mathematics 10
Prescribed Learning Outcomes
WAGES, SALARIES AND
EXPENSES
It is expected thatstudents will solveproblems involving wage,salaries and expenses
It is expected that students will:
• calculate hours worked and gross pay• calculate net income using deduction tables (focus on weekly) with
different pay periods• calculate changes in income• develop a budget that matches predicted income
SPREADSHEETS
It is expected thatstudents will designand use a spreadsheetto make and justifydecisions
RATES, RATIO AND
PROPORTION
It is expected thatstudents will apply theconcepts of rate, ratioand proportion to solveproblems
It is expected that students will:
• use the concept of unit rate to determine the best buy on a consumer itemand justify the decision
• solve problems on the application of sales tax in Canada• describe a variety of sales promotion techniques and their financial
implications for the consumer• solve rate, ratio, and proportion problems involving length, area, volume,
time, mass, and rates derived from these
It is expected that students will:
• create a spreadsheet using various formatting options• use a spreadsheet template to solve problems• create a spreadsheet using formulas and functions• use a spreadsheet to answer “what-if” questions• identify where spreadsheets could be effectively used
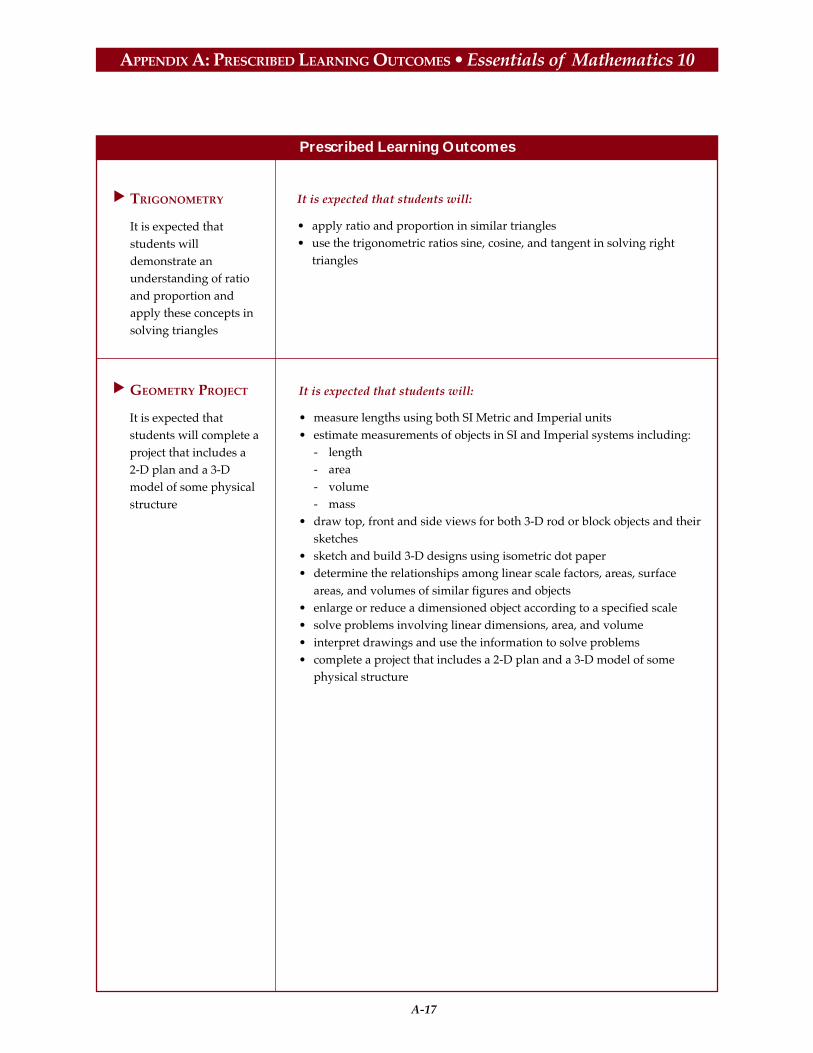
A-17
APPENDIX A: PRESCRIBED LEARNING OUTCOMES • Essentials of Mathematics 10
Prescribed Learning Outcomes
TRIGONOMETRY
It is expected thatstudents willdemonstrate anunderstanding of ratioand proportion andapply these concepts insolving triangles
It is expected that students will:
• apply ratio and proportion in similar triangles• use the trigonometric ratios sine, cosine, and tangent in solving right
triangles
GEOMETRY PROJECT
It is expected thatstudents will complete aproject that includes a2-D plan and a 3-Dmodel of some physicalstructure
It is expected that students will:
• measure lengths using both SI Metric and Imperial units• estimate measurements of objects in SI and Imperial systems including:
- length- area- volume- mass
• draw top, front and side views for both 3-D rod or block objects and theirsketches
• sketch and build 3-D designs using isometric dot paper• determine the relationships among linear scale factors, areas, surface
areas, and volumes of similar figures and objects• enlarge or reduce a dimensioned object according to a specified scale• solve problems involving linear dimensions, area, and volume• interpret drawings and use the information to solve problems• complete a project that includes a 2-D plan and a 3-D model of some
physical structure
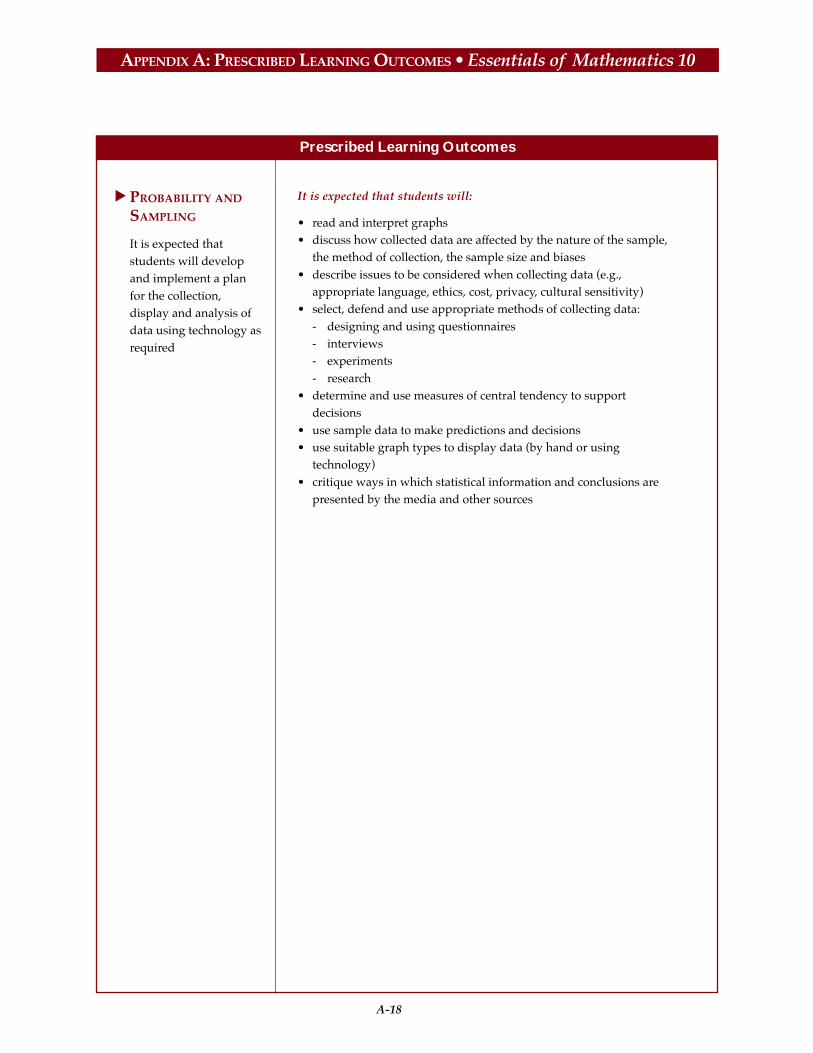
A-18
APPENDIX A: PRESCRIBED LEARNING OUTCOMES • Essentials of Mathematics 10
Prescribed Learning Outcomes
PROBABILITY AND
SAMPLING
It is expected thatstudents will developand implement a planfor the collection,display and analysis ofdata using technology asrequired
It is expected that students will:
• read and interpret graphs• discuss how collected data are affected by the nature of the sample,
the method of collection, the sample size and biases• describe issues to be considered when collecting data (e.g.,
appropriate language, ethics, cost, privacy, cultural sensitivity)• select, defend and use appropriate methods of collecting data:
- designing and using questionnaires- interviews- experiments- research
• determine and use measures of central tendency to supportdecisions
• use sample data to make predictions and decisions• use suitable graph types to display data (by hand or using
technology)• critique ways in which statistical information and conclusions are
presented by the media and other sources

A-19
APPENDIX A: PRESCRIBED LEARNING OUTCOMES • Essentials of Mathematics 11
Prescribed Learning Outcomes
PROBLEM SOLVING
It is expected thatstudents will use avariety of methods tosolve real-life, practical,technical, and theoreticalproblems
It is expected that students will:
• solve problems that involve a specific content area• solve problems that involve more than one content area• solve problems that involve mathematics within other disciplines• analyse problems and identify the significant elements• develop specific skills in selecting and using an appropriate problem-
solving strategy or combination of strategies chosen from, but notrestricted to, the following:- guess and check- look for a pattern- make a systematic list- make and use a drawing or model- eliminate possibilities- work backward- simplify the original problem- develop alternative original approaches- analyse keywords
• demonstrate the ability to work individually and co-operatively to solveproblems
• determine that their solutions are correct and reasonable• clearly communicate a solution to a problem and the process used to
solve it• interpret their solutions by describing what the solution means within
the context of the original problem• use appropriate technology to assist in problem solving• determine that their solutions are correct and reasonable• clearly communicate a solution to a problem and the process used to
solve it• interpret their solutions by describing what the solution means within
the context of the original problem• use appropriate technology to assist in problem solving
RELATIONS AND
FORMULAS
It is expected thatstudents will representand interpret relations ina variety of contexts
It is expected that students will:
• express a linear relation of the form y = mx + b- in words- as a formula- with a table of values- as a graph
• interpolate and extrapolate values from the graph of a linear relation• determine the slope of a linear relation and describe it in words and
interpret its meaning in a problem context• interpret the graph of a relation and describe it in words• construct a graph of a relation from its description in words• evaluate formulas

A-20
APPENDIX A: PRESCRIBED LEARNING OUTCOMES • Essentials of Mathematics 11
Prescribed Learning Outcomes
INCOME AND DEBT
It is expected thatstudents will demonstratean awareness of selectedforms of personalincome and debt
It is expected that students will:
• solve problems involving performance-based income, includingcommission sales, piece work, and salary plus commission
• use simple and compound interest calculations to solve problems• solve consumer problems involving:
- credit cards- exchange rates- personal loans
DATA ANALYSIS AND
INTERPRETATION
It is expected that studentswill analyse data with afocus on the validity of itspresentation and theinferences made
MEASUREMENT
TECHNOLOGY
It is expected thatstudents will determinemeasurements inSysteme International(SI) and Imperial systemsusing differentmeasuring devices
It is expected that students will:
• display and analyze data on a line plot• manipulate the presentation of data to stress a particular point of
view
It is expected that students will:
• select and use appropriate measuring devices and measurement units inImperial or SI systems
• perform basic conversions within and between the Imperial and SI systems,using technology as appropriate
• use measurement strategies to solve problems
OWNING AND
OPERATING A VEHICLE
It is expected thatstudents will analysethe cost of acquiringand operating a vehicle
It is expected that students will:
• solve problems involving the acquisition and operation of a vehicle,including- renting- leasing- buying- licensing- insuring- operating (e.g., fuel and oil)- maintaining (e.g., repairs, tune-ups)

A-21
APPENDIX A: PRESCRIBED LEARNING OUTCOMES • Essentials of Mathematics 11
Prescribed Learning Outcomes
PERSONAL INCOME
TAX
It is expected thatstudents will prepare asimple income tax form
It is expected that students will:
• prepare an income tax form for an individual who is single, employed,and without dependents
APPLICATIONS OF
PROBABILITY
It is expected thatstudents willdemonstrate anawareness of theapplications ofprobability to real worldsituations
It is expected that students will:
• express probabilities as ratios, fractions, decimals,percents, and in words
• use probability to predict the result in a givensituation
• determine the odds for and against a particular eventoccurring
• compare experimental observations with theoreticalpredictions
• use probabilities to calculate expected gains andlosses
• communicate and justify solutions to probabilityproblems
BUSINESS PLAN
It is expected thatstudents will prepare aplan and operate asuccessful business
It is expected that students will:
• prepare a business plan to own and operate abusiness that includes the following information asappropriate:- monthly cost of operation (e.g., inventory, rent,
wages, insurance, advertising, loan payments, etc.)- hours of operation- estimated daily sales (average)- gross/net profit- hourly earnings
• draw a scale floor plan of the store


A-23
APPENDIX A: PRESCRIBED LEARNING OUTCOMES • Essentials of Mathematics 12
Prescribed Learning Outcomes
A: PROBLEM SOLVING
It is expected thatstudents will use avariety of methods tosolve real-life, practical,technical, and theoreticalproblems
It is expected that students will:
• solve problems that involve a specific content area• solve problems that involve more than one content area• solve problems that involve mathematics within other disciplines• analyse problems and identify the significant elements• develop specific skills in selecting and using an appropriate problem-
solving strategy or combination of strategies chosen from, but notrestricted to, the following:- guess and check- look for a pattern- make a systematic list- make and use a drawing or model- eliminate possibilities- work backward- simplify the original problem- develop alternative original approaches- analyse keywords
• demonstrate the ability to work individually and co-operatively to solveproblems
• determine that their solutions are correct and reasonable• clearly communicate a solution to a problem and the process used to
solve it• interpret their solutions by describing what the solution means within
the context of the original problem• use appropriate technology to assist in problem solving
B: PERSONAL FINANCE
It is expected thatstudents will solveconsumer problemsinvolving insurance,mortgages and loans
It is expected that students will:
• solve problems involving different types of insurance• determine the costs involved in purchasing a home, including gross
debt service ratio• solve problems involving different types of mortgages
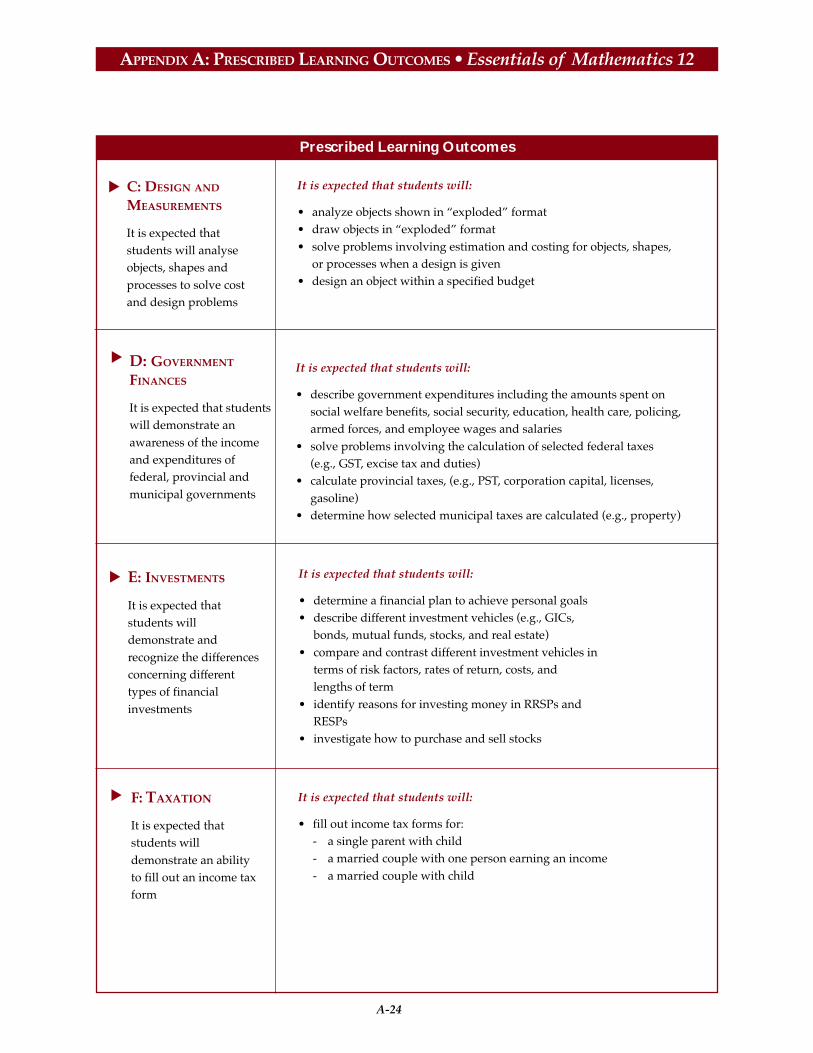
A-24
APPENDIX A: PRESCRIBED LEARNING OUTCOMES • Essentials of Mathematics 12
Prescribed Learning Outcomes
C: DESIGN AND
MEASUREMENTS
It is expected thatstudents will analyseobjects, shapes andprocesses to solve costand design problems
It is expected that students will:
• analyze objects shown in “exploded” format• draw objects in “exploded” format• solve problems involving estimation and costing for objects, shapes,
or processes when a design is given• design an object within a specified budget
D: GOVERNMENT
FINANCES
It is expected that studentswill demonstrate anawareness of the incomeand expenditures offederal, provincial andmunicipal governments
E: INVESTMENTS
It is expected thatstudents willdemonstrate andrecognize the differencesconcerning differenttypes of financialinvestments
It is expected that students will:
• describe government expenditures including the amounts spent onsocial welfare benefits, social security, education, health care, policing,armed forces, and employee wages and salaries
• solve problems involving the calculation of selected federal taxes(e.g., GST, excise tax and duties)
• calculate provincial taxes, (e.g., PST, corporation capital, licenses,gasoline)
• determine how selected municipal taxes are calculated (e.g., property)
F: TAXATION
It is expected thatstudents willdemonstrate an abilityto fill out an income taxform
It is expected that students will:
• determine a financial plan to achieve personal goals• describe different investment vehicles (e.g., GICs,
bonds, mutual funds, stocks, and real estate)• compare and contrast different investment vehicles in
terms of risk factors, rates of return, costs, andlengths of term
• identify reasons for investing money in RRSPs andRESPs
• investigate how to purchase and sell stocks
It is expected that students will:
• fill out income tax forms for:- a single parent with child- a married couple with one person earning an income- a married couple with child

A-25
APPENDIX A: PRESCRIBED LEARNING OUTCOMES • Essentials of Mathematics 12
Prescribed Learning Outcomes
G: VARIATION AND
FORMULAS
It is expected thatstudents will usealgebraic and graphicalmodels to generatepatterns, make predictionand solve patterns
It is expected that students will:
• plot and analyse examples of direct variation, partial variation, andinverse variation
• given data, graph, or a situation, recognize the variation represented• use formulas to solve problems
H: LIFE/CAREER
PROJECT
It is expected thatstudents will researchcareer choices andperform a comparativestudy
It is expected that students will:
• determine what factors are important in analysing careers• describe two specific career opportunities• identify mathematical educational requirements for two careers• compare two careers in terms of salary, working hours, training time
and cost, cost of living, and benefits


A-27
APPENDIX A: PRESCRIBED LEARNING OUTCOMES • Principles of Mathematics 10
Prescribed Learning Outcomes
NUMBER
(Number Concepts)
It is expected thatstudents will:
• analyse the numericaldata in a table fortrends, patterns andinterrelationships.
• explain and illustratethe structure and theinterrelationship of thesets of numbers withinthe real numbersystem.
PROBLEM SOLVING
It is expected thatstudents will use a varietyof methods to solve real-life, practical, technical,and theoretical problems
It is expected that students will:
• solve problems that involve a specific content area such as geometry,algebra, trigonometry, statistics, probability
• solve problems that involve more than one content area• solve problems that involve mathematics within other disciplines• analyse problems and identify the significant elements• develop specific skills in selecting and using an appropriate problem-
solving strategy or combination of strategies chosen from, but notrestricted to, the following:- guess and check- look for a pattern- make a systematic list- make and use a drawing or model- eliminate possibilities- work backward- simplify the original problem- develop alternative original approaches- analyse keywords
• demonstrate the ability to work individually and co-operatively to solveproblems
• determine that their solutions are correct and reasonable• clearly explain the solution to a problem and justify the processes used to
solve it• use appropriate technology to assist in problem solving
It is expected that students will:
• use words and algebraic expressions to describe the data and theinterrelationships in a table with rows that are not related recursively(not calculated from previous data)
• use words and algebraic expressions to describe the data and theinterrelationships in a table with rows that are related recursively(calculated from previous data)
• classify numbers as natural, whole, integer, rational or irrational, andshow that these number sets are “nested” within the real number system

A-28
APPENDIX A: PRESCRIBED LEARNING OUTCOMES • Principles of Mathematics 10
Prescribed Learning Outcomes
NUMBER
(Number Operations)
It is expected thatstudents will:
• use basic arithmeticoperations on realnumbers to solveproblems.
• describe and applyarithmetic operationson tables to solveproblems, usingtechnology as required.
• use exact values,arithmetic operationsand algebraicoperations on realnumbers to solveproblems.
It is expected that students will:
• communicate a set of instructions used to solve an arithmetic problem• perform arithmetic operations on irrational numbers, using
appropriate decimal approximations• create and modify tables from both recursive and nonrecursive
situations• use and modify a spreadsheet template to model recursive situations• perform operations on irrational numbers of monomial and binomial
form, using exact values• explain and apply the exponent laws for powers of numbers and for
variables with rational exponents
PATTERNS AND
RELATIONS
(Patterns)
It is expected thatstudents will generateand analyse numberpatterns.
It is expected thatstudents will generatenumber patternsexhibiting arithmeticgrowth
• use expressions to represent general terms and sums for arithmeticgrowth, and apply these expressions to solve problems
• relate arithmetic sequences to linear functions defined over the naturalnumbers
• generate number patterns exhibiting geometric growth
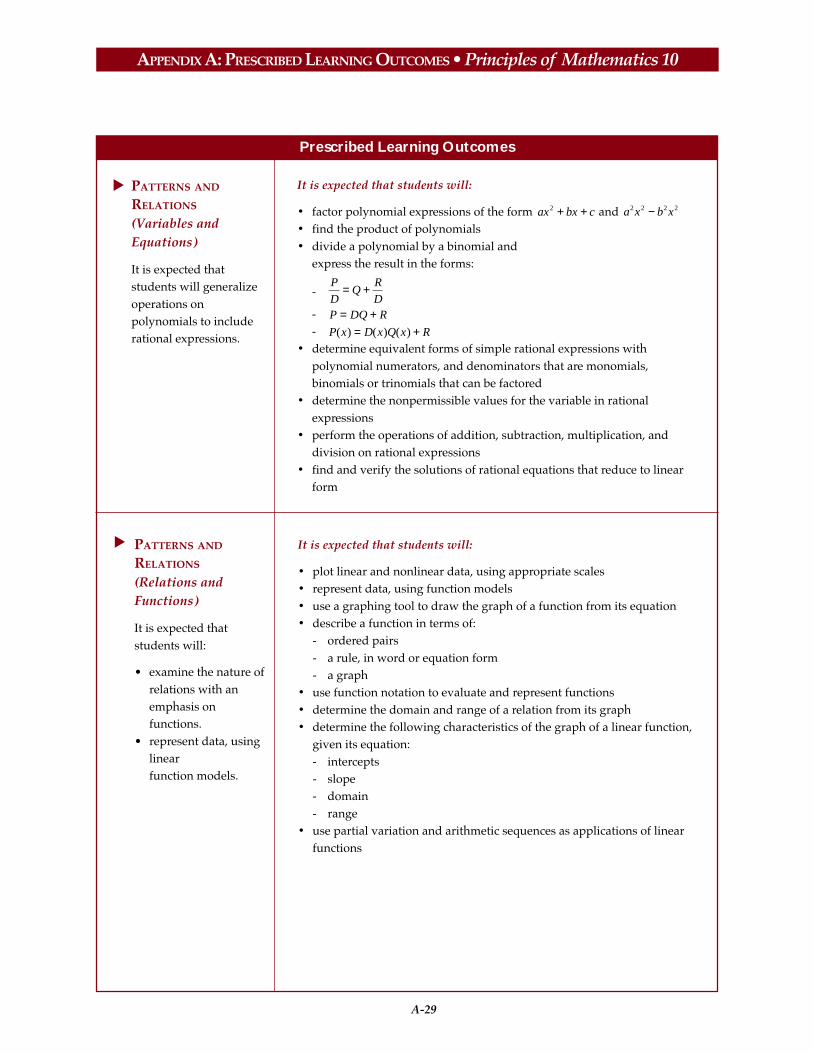
A-29
APPENDIX A: PRESCRIBED LEARNING OUTCOMES • Principles of Mathematics 10
Prescribed Learning Outcomes
PATTERNS AND
RELATIONS
(Relations andFunctions)
It is expected thatstudents will:
• examine the nature ofrelations with anemphasis onfunctions.
• represent data, usinglinearfunction models.
PATTERNS AND
RELATIONS
(Variables andEquations)
It is expected thatstudents will generalizeoperations onpolynomials to includerational expressions.
It is expected that students will:
• factor polynomial expressions of the form ax bx c2 + + and a x b x2 2 2 2−• find the product of polynomials• divide a polynomial by a binomial and
express the result in the forms:
-P
DQ
R
D= +
- P DQ R= +- P x D x Q x R( ) ( ) ( )= +
• determine equivalent forms of simple rational expressions withpolynomial numerators, and denominators that are monomials,binomials or trinomials that can be factored
• determine the nonpermissible values for the variable in rationalexpressions
• perform the operations of addition, subtraction, multiplication, anddivision on rational expressions
• find and verify the solutions of rational equations that reduce to linearform
It is expected that students will:
• plot linear and nonlinear data, using appropriate scales• represent data, using function models• use a graphing tool to draw the graph of a function from its equation• describe a function in terms of:
- ordered pairs- a rule, in word or equation form- a graph
• use function notation to evaluate and represent functions• determine the domain and range of a relation from its graph• determine the following characteristics of the graph of a linear function,
given its equation:- intercepts- slope- domain- range
• use partial variation and arithmetic sequences as applications of linearfunctions

A-30
APPENDIX A: PRESCRIBED LEARNING OUTCOMES • Principles of Mathematics 10
Prescribed Learning Outcomes
SHAPE AND SPACE
(Measurement)
It is expected thatstudents will:
• demonstrate anunderstanding ofscale factors, andtheirinterrelationshipwith the dimensionsof similar shapes andobjects.
• solve problemsinvolving triangles,including thosefound in 3-D and 2-Dapplications.
It is expected that students will:
• calculate the volume and surface area of a sphere, using formulas that areprovided
• determine the relationships among linear scale factors, areas, the surfaceareas and the volumes of similar figures and objects
• solve problems involving two right triangles• extend the concepts of sine and cosine for angles through to 180˚• apply the sine and cosine laws, excluding the ambiguous case, to solve
problems
SHAPE AND SPACE
(3-D Objects and 2-DShapes)
It is expected thatstudents will solvecoordinate geometryproblems involvinglines and line segments.
It is expected that students will:
• solve problems involving distances between points inthe coordinate plane
• solve problems involving midpoints of line segments• solve problems involving rise, run and slope of line
segments• determine the equation of a line, given information
that uniquely determines the line• solve problems using slopes of:
- parallel lines- perpendicular lines
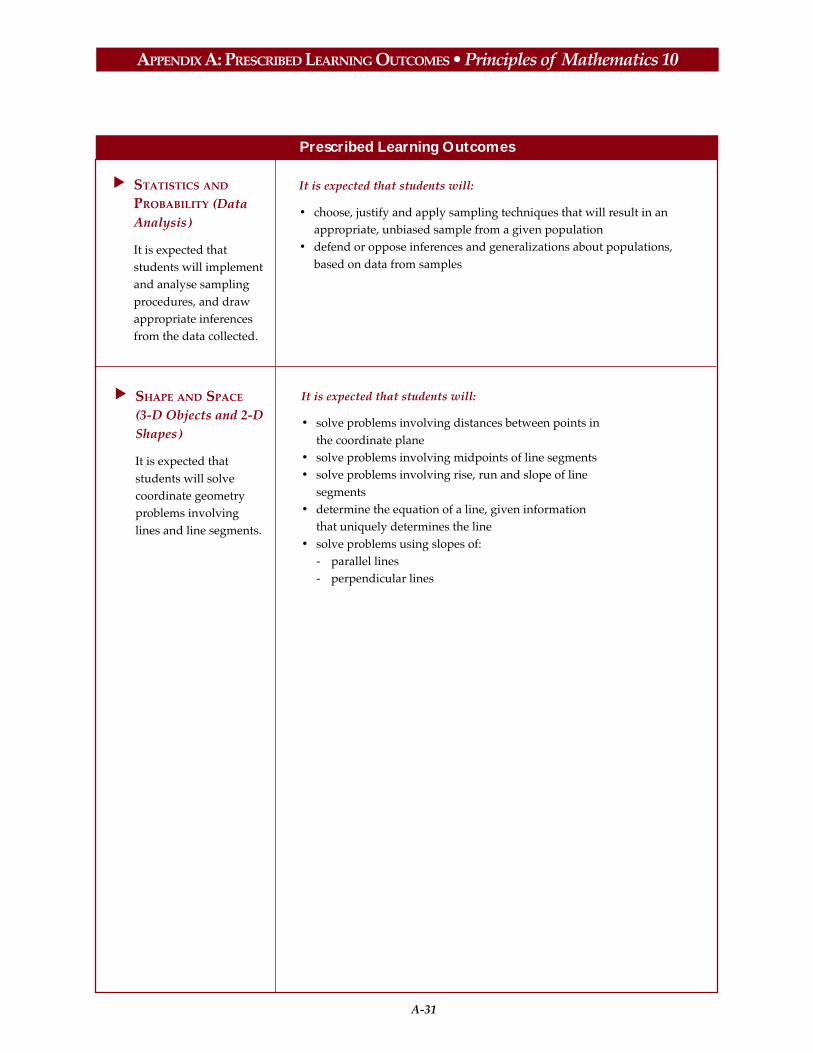
A-31
APPENDIX A: PRESCRIBED LEARNING OUTCOMES • Principles of Mathematics 10
Prescribed Learning Outcomes
STATISTICS AND
PROBABILITY (DataAnalysis)
It is expected thatstudents will implementand analyse samplingprocedures, and drawappropriate inferencesfrom the data collected.
It is expected that students will:
• choose, justify and apply sampling techniques that will result in anappropriate, unbiased sample from a given population
• defend or oppose inferences and generalizations about populations,based on data from samples
SHAPE AND SPACE
(3-D Objects and 2-DShapes)
It is expected thatstudents will solvecoordinate geometryproblems involvinglines and line segments.
It is expected that students will:
• solve problems involving distances between points inthe coordinate plane
• solve problems involving midpoints of line segments• solve problems involving rise, run and slope of line
segments• determine the equation of a line, given information
that uniquely determines the line• solve problems using slopes of:
- parallel lines- perpendicular lines


A-33
APPENDIX A: PRESCRIBED LEARNING OUTCOMES • Principles of Mathematics 11
Prescribed Learning Outcomes
NUMBER
(Number Operations)
It is expected thatstudents will solveconsumer problems, usingarithmetic operations.
PROBLEM SOLVING
It is expected thatstudents will use a varietyof methods to solve real-life, practical, technical,and theoretical problems
It is expected that students will:
• solve problems that involve a specific content area such as geometry,algebra, trigonometry, statistics, probability
• solve problems that involve more than one content area• solve problems that involve mathematics within other disciplines• analyse problems and identify the significant elements• develop specific skills in selecting and using an appropriate problem-
solving strategy or combination of strategies chosen from, but notrestricted to, the following: - guess and check- look for a pattern- make a systematic list- make and use a drawing or model- eliminate possibilities- work backward- simplify the original problem- develop alternative original approaches- analyse keywords
• demonstrate the ability to work individually and co-operatively to solveproblems
• determine that their solutions are correct and reasonable• clearly explain the solution to a problem and justify the processes used to
solve it• use appropriate technology to assist in problem solving
It is expected that students will:
• solve consumer problems, including:- wages earned in various situations- property taxation- exchange rates- unit prices
• reconcile financial statements including:- cheque books with bank statements- cash register tallies with daily receipts
• solve budget problems, using graphs and tables to communicatesolutions
• solve investment and credit problems involving simple and compoundinterest

A-34
APPENDIX A: PRESCRIBED LEARNING OUTCOMES • Principles of Mathematics 11
Prescribed Learning Outcomes
PATTERNS AND
RELATIONS
(Patterns)
It is expected thatstudents will apply theprinciples ofmathematical reasoningto solve problems and tojustify solutions.
It is expected that students will:
• differentiate between inductive and deductive reasoning• explain and apply connecting words, such as and, or, and not, to solve
problems• use examples and counterexamples to analyse conjectures• distinguish between an if–then proposition, its converse and its
contrapositive• prove assertions in a variety of settings, using direct and indirect
reasoning
PATTERNS AND
RELATIONS
(Variables andEquations)
It is expected thatstudents will representand analyse situationsthat involve expressions,equations andinequalities.
It is expected that students will:
• graph linear inequalities, in two variables• solve systems of linear equations, in two variables:
- algebraically (elimination and substitution)- graphically
• solve systems of linear equations, in three variables:- algebraically- with technology
• solve non-linear equations, using a graphing tool• solve non-linear equations:
- by factoring- graphically
• use the Remainder Theorem to evaluate polynomial expressions, theRational Zeros Theorem, and the Factor Theorem to determine factorsof polynomials
• determine the solution to a system of nonlinear equations, usingtechnology as appropriate
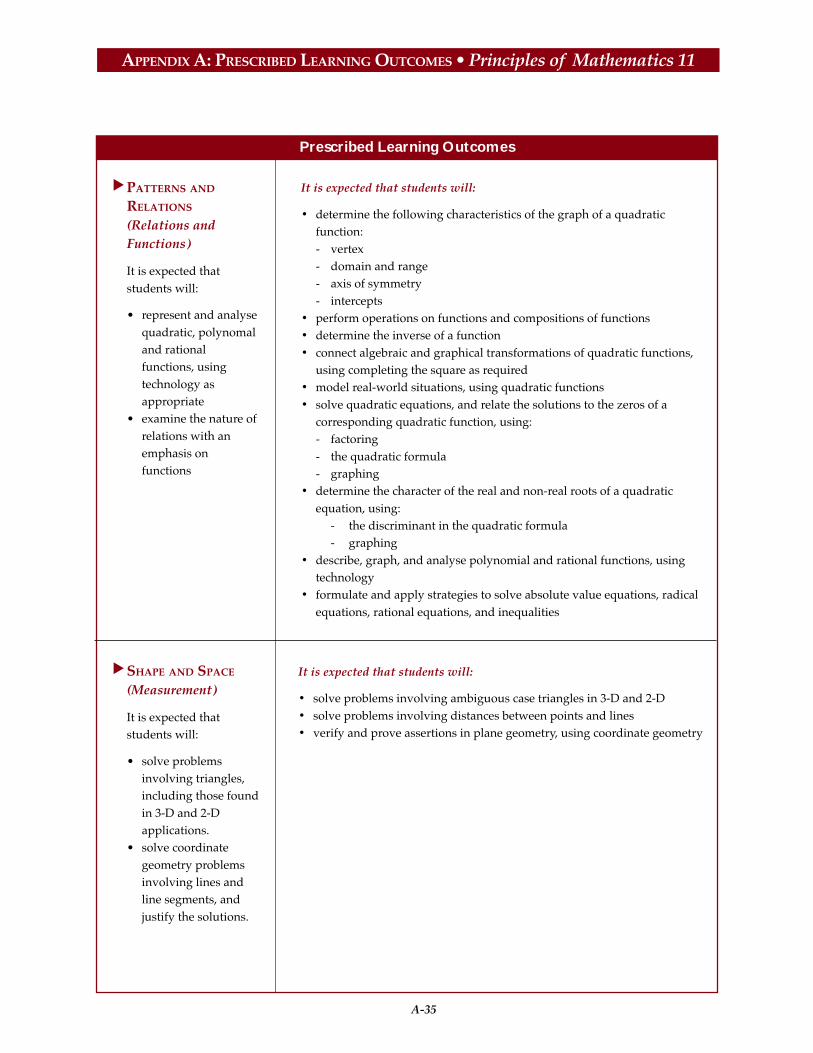
A-35
APPENDIX A: PRESCRIBED LEARNING OUTCOMES • Principles of Mathematics 11
Prescribed Learning Outcomes
PATTERNS AND
RELATIONS
(Relations andFunctions)
It is expected thatstudents will:
• represent and analysequadratic, polynomaland rationalfunctions, usingtechnology asappropriate
• examine the nature ofrelations with anemphasis onfunctions
It is expected that students will:
• determine the following characteristics of the graph of a quadraticfunction:- vertex- domain and range- axis of symmetry- intercepts
• perform operations on functions and compositions of functions• determine the inverse of a function• connect algebraic and graphical transformations of quadratic functions,
using completing the square as required• model real-world situations, using quadratic functions• solve quadratic equations, and relate the solutions to the zeros of a
corresponding quadratic function, using:- factoring- the quadratic formula- graphing
• determine the character of the real and non-real roots of a quadraticequation, using:
- the discriminant in the quadratic formula- graphing
• describe, graph, and analyse polynomial and rational functions, usingtechnology
• formulate and apply strategies to solve absolute value equations, radicalequations, rational equations, and inequalities
SHAPE AND SPACE
(Measurement)
It is expected thatstudents will:
• solve problemsinvolving triangles,including those foundin 3-D and 2-Dapplications.
• solve coordinategeometry problemsinvolving lines andline segments, andjustify the solutions.
It is expected that students will:
• solve problems involving ambiguous case triangles in 3-D and 2-D• solve problems involving distances between points and lines• verify and prove assertions in plane geometry, using coordinate geometry

A-36
APPENDIX A: PRESCRIBED LEARNING OUTCOMES • Principles of Mathematics 11
Prescribed Learning Outcomes
SHAPE AND SPACE
(3-D Objects and 2-DShapes)
It is expected thatstudents will developand apply the geometricproperties of circles andpolygons to solveproblems.
It is expected that students will:
• use technology with dynamic geometry software to confirm and applythe following properties:- the perpendicular from the center of a circle to a chord bisects the
chord- the measure of the central angle is equal to twice the measure of the
inscribed angle subtended by the same arc- the inscribed angles subtended by the same arc are congruent- the angle inscribed in a semicircle is a right angle- the opposite angles of a cyclic quadrilateral are supplementary- a tangent to a circle is perpendicular to the radius at the point of
tangency- the tangent segments to a circle, from any external point, are
congruent- the angle between a tangent and a chord is equal to the inscribed
angle on the opposite side of the chord- the sum of the interior angles of an n-sided polygon is 180(n-2)
• prove the following general properties, using established concepts andtheorems:- the perpendicular bisector of a chord contains the center of the circle- the measure of the central angle is equal to twice the measure of the
inscribed angle subtended by the same arc (for the case when thecenter of the circle is in the interior of the inscribed angle)
- the inscribed angles subtended by the same arc are congruent- the angle inscribed in a semicircle is a right angle- the opposite angles of a cyclic quadrilateral are supplementary- a tangent to a circle is perpendicular to the radius at the point of
tangency- the tangent segments to a circle from any external point are
congruent- the angle between a tangent and a chord is equal to the inscribed
angle on the opposite side of the chord- the sum of the interior angles of an n-sided polygon is 180(n-2)
• solve problems, using a variety of circle properties, and justify thesolution strategy used

A-37
APPENDIX A: PRESCRIBED LEARNING OUTCOMES • Principles of Mathematics 12
Prescribed Learning Outcomes
A: PROBLEM SOLVING
It is expected thatstudents will use avariety of methods tosolve real-life, practical,technical, and theoreticalproblems
It is expected that students will:
A1. solve problems that involve a specific content area such as, geometry,algebra, trigonometry, statistics, probability, etc.
A2. solve problems that involve more than one content areaA3. solve problems that involve mathematics within other disciplinesA4. analyse problems and identify the significant elementsA5. develop specific skills in selecting and using an appropriate problem-
solving strategy or combination of strategies chosen from, but notrestricted to, the following:
- guess and check- look for a pattern- make a systematic list- make and use a drawing or model- eliminate possibilities- work backward- simplify the original problem- develop alternative original approaches- analyse keywords
A6. demonstrate the ability to work individually and co-operatively tosolve problems
A7. determine that their solutions are correct and reasonableA8. clearly communicate a solution to a problem and the process used to
solve itA9. use appropriate technology to assist in problem solving
B: PATTERNS AND
RELATIONS
(Patterns)
It is expected thatstudents will generateand analyse exponentialpatterns.
It is expected that students will:
B1. derive and apply expressions to represent general terms and sumsfor geometric growth and to solve problems
B2. connect geometric sequences to exponential functions over thenatural numbers
B3. estimate values of expressions for infinite geometric processes

A-38
APPENDIX A: PRESCRIBED LEARNING OUTCOMES • Principles of Mathematics 12
Prescribed Learning Outcomes
C: PATTERNS AND
RELATIONS
(Variables andEquations)
It is expected thatstudents will solveexponential, logarithmicand trigonometricequations and identities.
It is expected that students will:
C1. solve exponential equations having bases that are powers of oneanother
C2. solve and verify exponential and logarithmic equations andidentities
C3. distinguish between degree and radian measure, and solve problemsusing both
C4. determine the exact and the approximate values of trigonometricratios for any multiples of 0˚, 30˚, 45˚, 60˚ and 90˚ and 0,
π π π π6 4 3 2
, , ,
C5. solve first and second degree trigonometric equations over a domainof length 2π:- algebraically- graphically
C6. determine the general solutions to trigonometric equations wherethe domain is the set of real numbers
C7. analyse trigonometric identities:- graphically- algebraically for general cases
C8. use sum, difference,and double angle identities for sine and cosineto verify and simplify trigonometric expressions
D: PATTERNS AND
RELATIONS (Relationsand Functions)
It is expected thatstudents will representand analyse exponentialand logarithmicfunctions, usingtechnology asappropriate.
It is expected that students will:
D1. model, graph, and apply exponential functions to solve problemsD2. change functions from exponential form to logarithmic form and vice
versaD3. model, graph, and apply logarithmic functions to solve problemsD4. explain the relationship between the laws of logarithms and the laws
of exponentsD5. describe the three primary trigonometric functions as circular
functions with reference to the unit circle and an angle in standardposition
D6. draw (using technology), sketch, and analyse the graphs of sine,cosine, and tangent functions, for:
- amplitude, if defined- period- domain and range- asymptotes, if any- behavior under transformations
D7. use trigonometric functions to model and solve problems

A-39
APPENDIX A: PRESCRIBED LEARNING OUTCOMES • Principles of Mathematics 12
Prescribed Learning Outcomes
F: SHAPE AND SPACE
(Transformations)
It is expected thatstudents will perform,analyse and createtransformations offunctions and relationsthat are described byequations or graphs
E: SHAPE AND SPACE
(3-D Objects and 2-DShapes)
It is expected thatstudents will classifyconic sections, usingtheir shapes andequations.
It is expected that students will:
E1 classify conic sections according to shapeE2. classify conic sections according to a given equation in general or
standard (completed square) form (vertical or horizontal axis ofsymmetry only)
E3. convert a given equation of a conic section from general to standard formand vice versa
It is expected that students will:
F1. describe how various translations of functions affect graphs and theirrelated equations:- y f x h= −( )
- y k f x− = ( )F2. describe how various stretches of functions (compressions and
expansions) affect graphs and their related equations:- y af x= ( )- y f kx= ( )
F3. describe how reflections of functions in both axes and in the line y = xaffect graphs and their related equations:- y f x= −( )- y f x= − ( )
- y f x= −1( )F4. using the graph and/or the equation of f x( ) , describe and sketch
1f x( )
F5. using the graph and/or the equation of f x( ) , describe and sketch f x( )
F6. describe and perform single transformations and combinations oftransformations on functions and relations
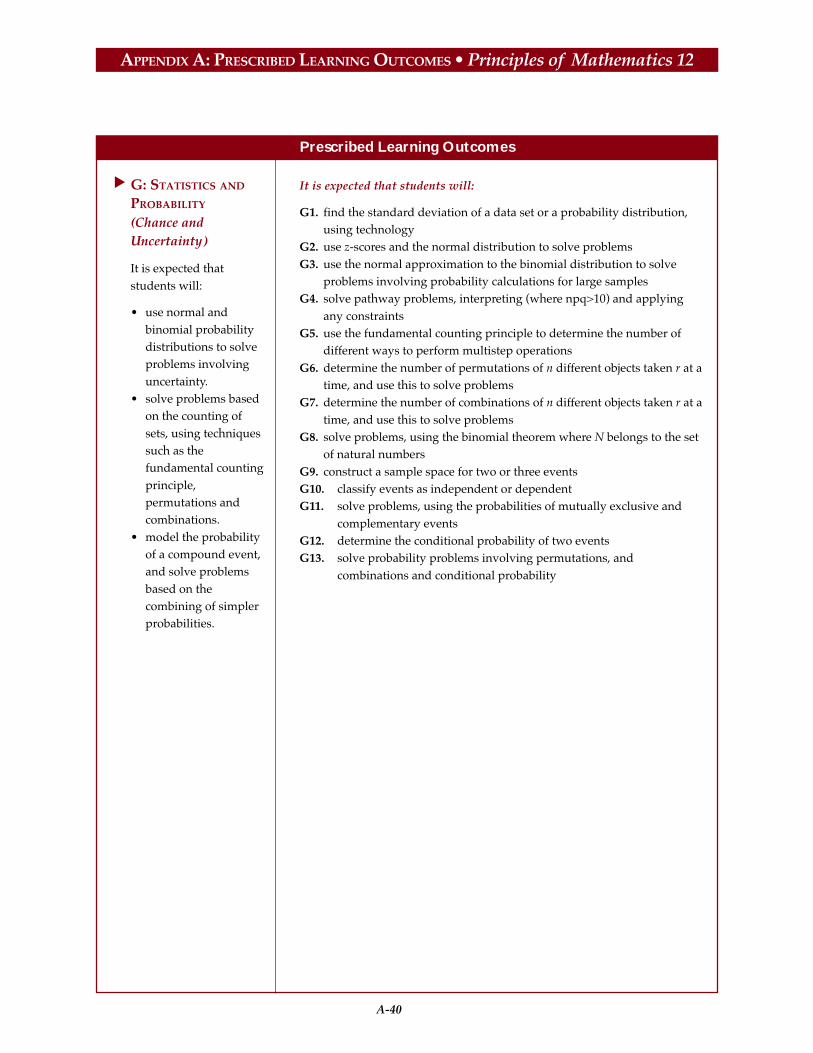
A-40
APPENDIX A: PRESCRIBED LEARNING OUTCOMES • Principles of Mathematics 12
Prescribed Learning Outcomes
G: STATISTICS AND
PROBABILITY
(Chance andUncertainty)
It is expected thatstudents will:
• use normal andbinomial probabilitydistributions to solveproblems involvinguncertainty.
• solve problems basedon the counting ofsets, using techniquessuch as thefundamental countingprinciple,permutations andcombinations.
• model the probabilityof a compound event,and solve problemsbased on thecombining of simplerprobabilities.
It is expected that students will:
G1. find the standard deviation of a data set or a probability distribution,using technology
G2. use z-scores and the normal distribution to solve problemsG3. use the normal approximation to the binomial distribution to solve
problems involving probability calculations for large samplesG4. solve pathway problems, interpreting (where npq>10) and applying
any constraintsG5. use the fundamental counting principle to determine the number of
different ways to perform multistep operationsG6. determine the number of permutations of n different objects taken r at a
time, and use this to solve problemsG7. determine the number of combinations of n different objects taken r at a
time, and use this to solve problemsG8. solve problems, using the binomial theorem where N belongs to the set
of natural numbersG9. construct a sample space for two or three eventsG10. classify events as independent or dependentG11. solve problems, using the probabilities of mutually exclusive and
complementary eventsG12. determine the conditional probability of two eventsG13. solve probability problems involving permutations, and
combinations and conditional probability
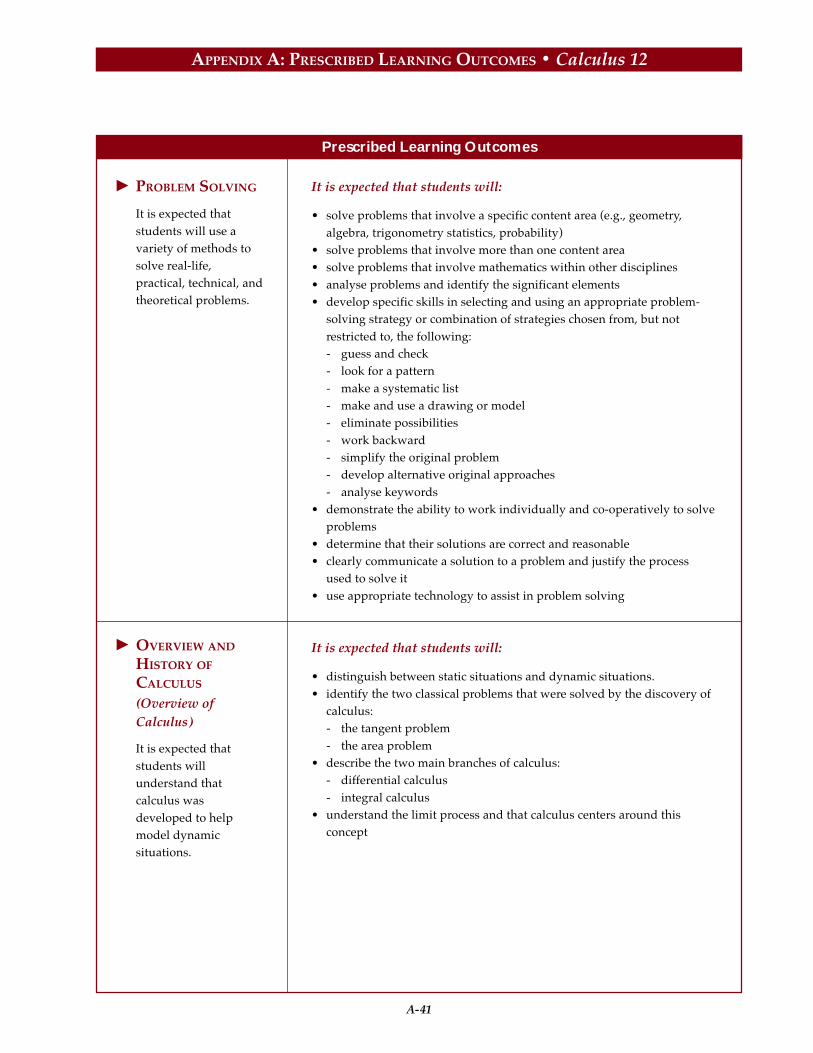
A-41
APPENDIX A: PRESCRIBED LEARNING OUTCOMES • Calculus 12
Prescribed Learning Outcomes
PROBLEM SOLVING
It is expected thatstudents will use avariety of methods tosolve real-life,practical, technical, andtheoretical problems.
It is expected that students will:
• solve problems that involve a specific content area (e.g., geometry,algebra, trigonometry statistics, probability)
• solve problems that involve more than one content area• solve problems that involve mathematics within other disciplines• analyse problems and identify the significant elements• develop specific skills in selecting and using an appropriate problem-
solving strategy or combination of strategies chosen from, but notrestricted to, the following:- guess and check- look for a pattern- make a systematic list- make and use a drawing or model- eliminate possibilities- work backward- simplify the original problem- develop alternative original approaches- analyse keywords
• demonstrate the ability to work individually and co-operatively to solveproblems
• determine that their solutions are correct and reasonable• clearly communicate a solution to a problem and justify the process
used to solve it• use appropriate technology to assist in problem solving
OVERVIEW AND
HISTORY OF
CALCULUS
(Overview ofCalculus)
It is expected thatstudents willunderstand thatcalculus wasdeveloped to helpmodel dynamicsituations.
It is expected that students will:
• distinguish between static situations and dynamic situations.• identify the two classical problems that were solved by the discovery of
calculus:- the tangent problem- the area problem
• describe the two main branches of calculus:- differential calculus- integral calculus
• understand the limit process and that calculus centers around thisconcept
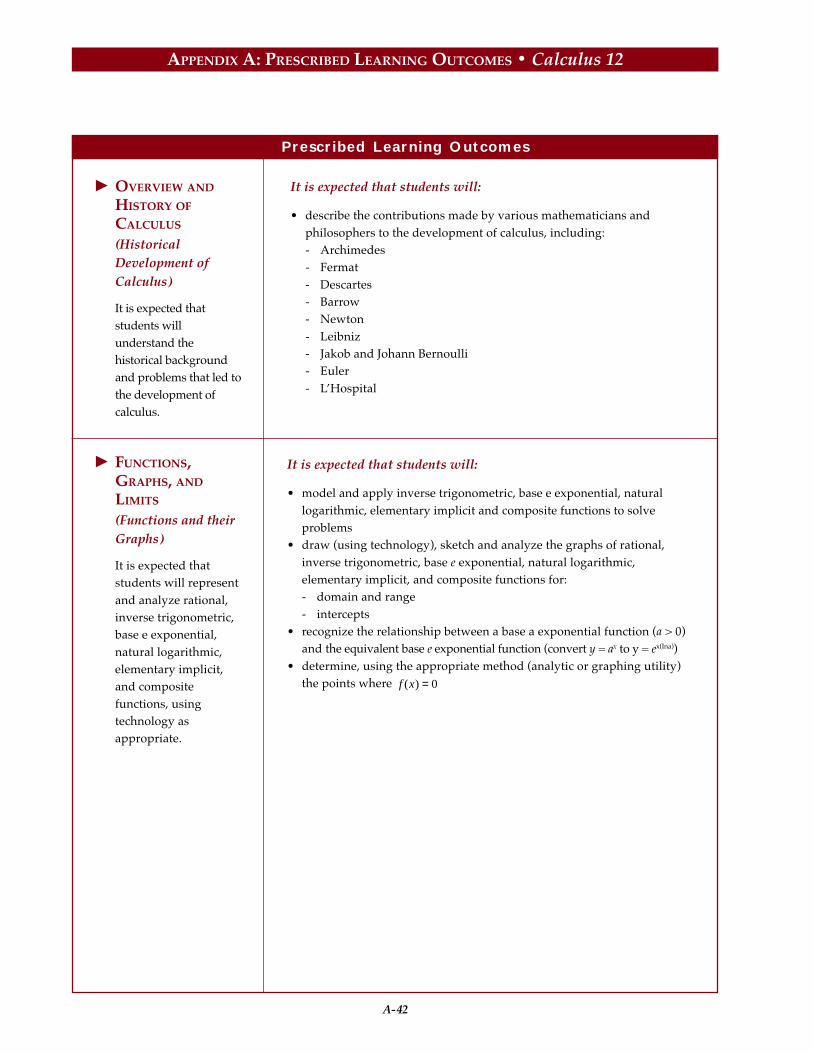
A-42
APPENDIX A: PRESCRIBED LEARNING OUTCOMES • Calculus 12
Prescribed Learning Outcomes
OVERVIEW AND
HISTORY OF
CALCULUS
(HistoricalDevelopment ofCalculus)
It is expected thatstudents willunderstand thehistorical backgroundand problems that led tothe development ofcalculus.
It is expected that students will:
• describe the contributions made by various mathematicians andphilosophers to the development of calculus, including:- Archimedes- Fermat- Descartes- Barrow- Newton- Leibniz- Jakob and Johann Bernoulli- Euler- L’Hospital
FUNCTIONS,GRAPHS, AND
LIMITS
(Functions and theirGraphs)
It is expected thatstudents will representand analyze rational,inverse trigonometric,base e exponential,natural logarithmic,elementary implicit,and compositefunctions, usingtechnology asappropriate.
It is expected that students will:
• model and apply inverse trigonometric, base e exponential, naturallogarithmic, elementary implicit and composite functions to solveproblems
• draw (using technology), sketch and analyze the graphs of rational,inverse trigonometric, base e exponential, natural logarithmic,elementary implicit, and composite functions for:- domain and range- intercepts
• recognize the relationship between a base a exponential function (a > 0)and the equivalent base e exponential function (convert y = ax to y = ex(Ina))
• determine, using the appropriate method (analytic or graphing utility)the points where f x( ) = 0

A-43
APPENDIX A: PRESCRIBED LEARNING OUTCOMES • Calculus 12
Prescribed Learning Outcomes
FUNCTIONS,GRAPHS, AND
LIMITS
(Limits)
It is expected thatstudents willunderstand the conceptof a limit of a function,notation used, and beable to evaluate thelimit of a function.
It is expected that students will:
• demonstrate an understanding of the concept of limit and notation usedin expressing the limit of a function as x approaches a: lim ( )
x af x
→
• evaluate the limit of a function- analytically- graphically- numerically
• distinguish between the limit of a function f x( ) as x approaches a andthe value of the function at x = a
• demonstrate an understanding of the concept of one-sided limits andevaluate one-sided limits
• determine limits that result in infinity (infinite limits)• evaluate limits of functions as x approaches infinity (limits at infinity)• determine vertical and horizontal asymptotes of a function, using limits• determine whether a function is continuous at x = a
THE DERIVATIVE
(Concept andInterpretations)
It is expected thatstudents willunderstand the conceptof a derivative andevaluate derivatives ofa function using thedefinition ofderivative.
It is expected that students will:
• describe geometrically a secant line and a tangent line for the graph of afunction at x = a.
• define and evaluate the derivative at x = a as: lim( ) ( )
h
f a h f a
h→
+ −0
and
lim( ) ( )
x a
f x f a
x a→
−−
• define and calculate the derivative of a function using:
f xf x h f x
hh' ( ) lim
( ) ( )= + −→0
or f xf x x f x
xx' ( ) lim
( ) ( )= + −→∆
∆∆0
or
f xy
xx' ( ) lim=
→∆
∆∆0
• use alternate notation interchangeably to express derivatives (i.e.,
f xdy
dxy' ( ), , ' , etc.)
• compute derivatives using the definition of derivative• distinguish between continuity and differentiability of a function at a
point• determine when a function is non-differentiable, and explain why• determine the slope of a tangent line to a curve at a given point• determine the equation of the tangent line to a curve at a given point• for a displacement function s s t= ( ) , calculate the average velocity over a
given time interval and the instantaneous velocity at a given time• distinguish between average and instantaneous rate of change
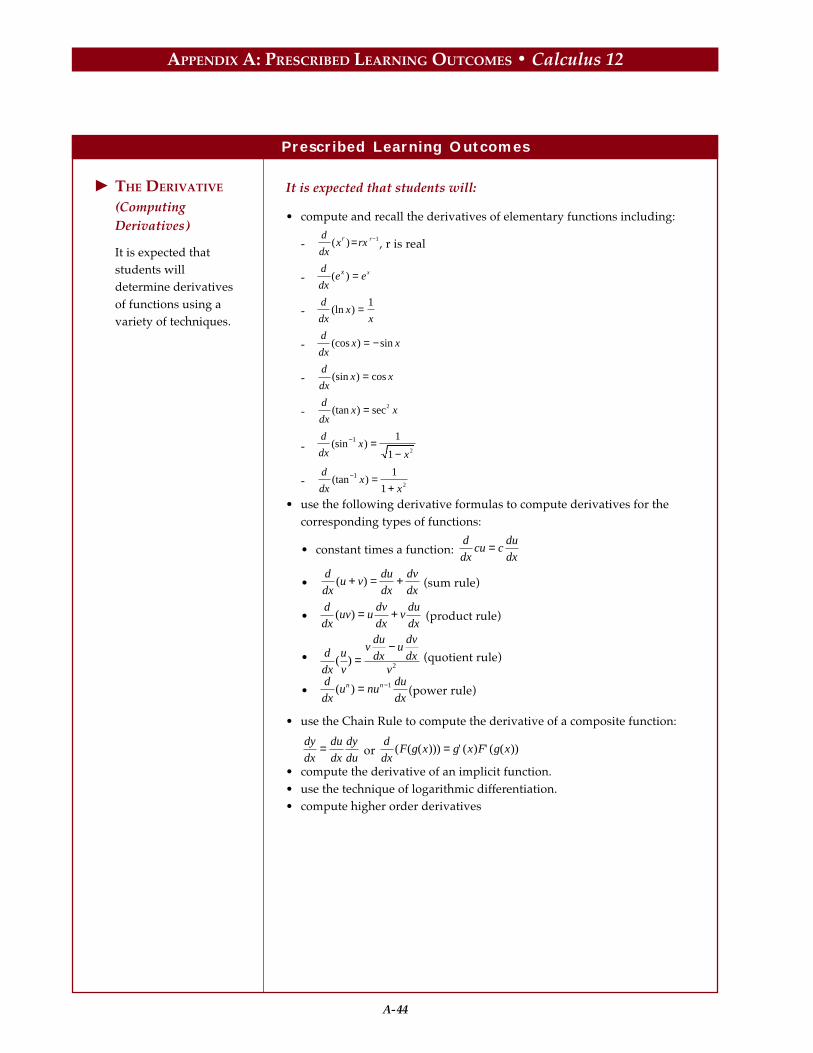
A-44
APPENDIX A: PRESCRIBED LEARNING OUTCOMES • Calculus 12
Prescribed Learning Outcomes
THE DERIVATIVE
(ComputingDerivatives)
It is expected thatstudents willdetermine derivativesof functions using avariety of techniques.
It is expected that students will:
• compute and recall the derivatives of elementary functions including:
-d
dxx rxr r( )= −1 , r is real
-d
dxe ex x( ) =
-d
dxx
x(ln ) =
1
-d
dxx x(cos ) sin= −
-d
dxx x(sin ) cos=
-d
dxx x(tan ) sec= 2
-d
dxx
x(sin )− =
−1 1
1 2
-d
dxx
x(tan )− =
+1 1
1 2
• use the following derivative formulas to compute derivatives for thecorresponding types of functions:
• constant times a function: d
dxcu c
du
dx=
• d
dxu v
du
dx
dv
dx( )+ = + (sum rule)
• d
dxuv u
dv
dxv
du
dx( ) = + (product rule)
• d
dx
u
v
vdu
dxu
dv
dxv
( ) =−
2 (quotient rule)
• d
dxu nu
du
dxn n( ) = −1 (power rule)
• use the Chain Rule to compute the derivative of a composite function:
dy
dx
du
dx
dy
du= or
d
dxF g x g x F g x( ( ( ))) ' ( ) ' ( ( ))=
• compute the derivative of an implicit function.• use the technique of logarithmic differentiation.• compute higher order derivatives

A-45
APPENDIX A: PRESCRIBED LEARNING OUTCOMES • Calculus 12
Prescribed Learning Outcomes
APPLICATIONS OF
DERIVATIVES
(Applied Problems)
It is expected thatstudents will solveapplied problems froma variety of fieldsincluding the Physicaland BiologicalSciences, Economics,and Business.
It is expected that students will:
• solve problems involving displacement, velocity, acceleration• solve related rates problems• solve optimization problems (applied maximum/minimum problems)
APPLICATIONS OF
DERIVATIVES
(Derivatives and theGraph of theFunction)
It is expected thatstudents will use thefirst and secondderivatives to describethe characteristic of thegraph of a function.
It is expected that students will:
• given the graph of y f x= ( ) :- graph y f x= ′( ) and y f x= ′′ ( )
- relate the sign of the derivative on an interval to whether the functionis increasing or decreasing over that interval.
- relate the sign of the second derivative to the concavity of a function.• determine the critical numbers and inflection points of a function.• determine the maximum and minimum values of a function and use the
first and/or second derivative test(s) to justify their solutions• use Newton’s iterative formula (with technology) to find the solution of
given equations, f x( ) = 0 .• use the tangent line approximation to estimate values of a function near
a point and analyze the approximation using the second derivative.

A-46
APPENDIX A: PRESCRIBED LEARNING OUTCOMES • Calculus 12
Prescribed Learning Outcomes
ANTIDIFFERENTIATION
(Recovering Functionsfrom their Derivatives)
It is expected thatstudents will recognizeantidifferentiation(indefinite integral) asthe reverse of thedifferentiation process.
It is expected that students will:
• explain the meaning of the phrase “F(x) is an antiderivative (orindefinite integral) of f(x).”
• use antiderivative notation appropriately f x dx( )∫ (i.e., for theantiderivative of f x( ) ).
• compute the antiderivatives of linear combinations of functions whoseindividual antiderivatives are known including:
- k dx kx C = +∫- x dx
x
rCr
r
=+
++
∫1
1 if r ≠ −1
-dx
xx C= +∫ ln
- e dx e Cx x= +∫- sin cosx dx x C = − +∫- cos sinx dx x C = +∫- sec tan2 x dx x C = +∫-
dx
xx C
1 2
1
−= +−∫ sin
-dx
xx C
1 21
+= +−∫ tan
• compute f ax b dx( )+∫ if f u du( ) ∫ is known.• create integration formulas from the known differentiation formulas• solve initial value problems using the concept that if F x G x' ( ) ' ( )= on an
interval, then F x( ) and G x( ) differ by a constant on that interval.
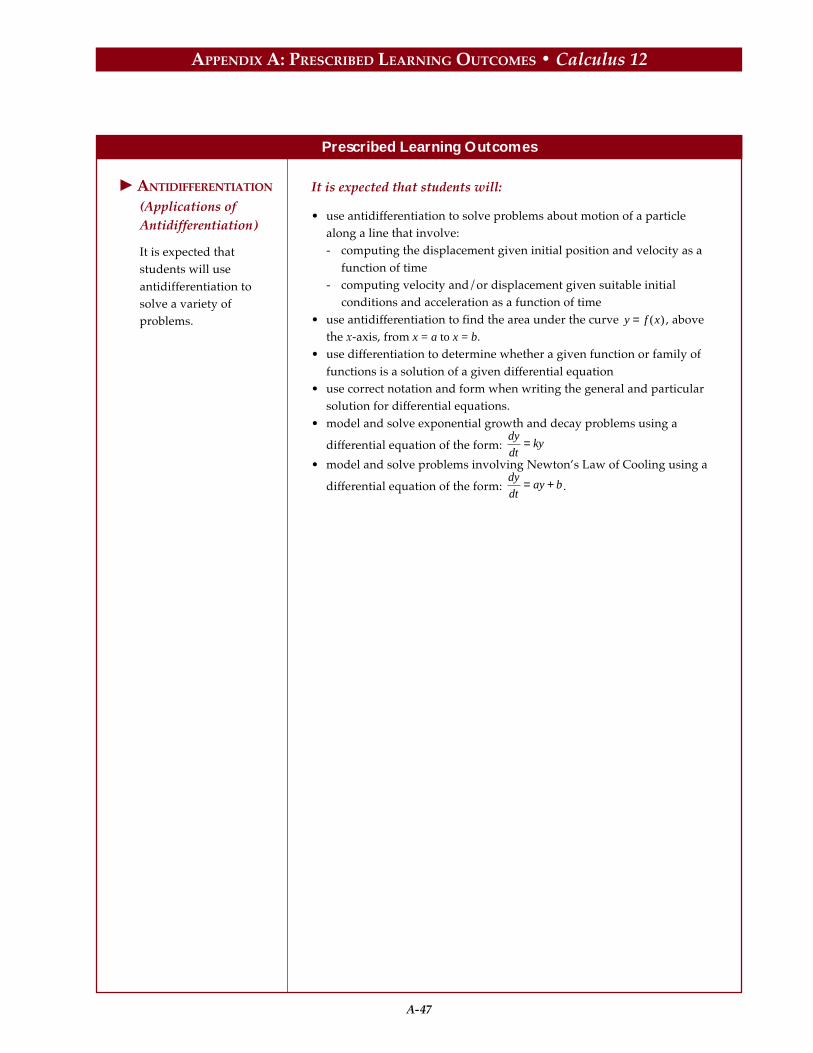
A-47
APPENDIX A: PRESCRIBED LEARNING OUTCOMES • Calculus 12
Prescribed Learning Outcomes
ANTIDIFFERENTIATION
(Applications ofAntidifferentiation)
It is expected thatstudents will useantidifferentiation tosolve a variety ofproblems.
It is expected that students will:
• use antidifferentiation to solve problems about motion of a particlealong a line that involve:- computing the displacement given initial position and velocity as a
function of time- computing velocity and/or displacement given suitable initial
conditions and acceleration as a function of time• use antidifferentiation to find the area under the curve y f x= ( ) , above
the x-axis, from x = a to x = b.• use differentiation to determine whether a given function or family of
functions is a solution of a given differential equation• use correct notation and form when writing the general and particular
solution for differential equations.• model and solve exponential growth and decay problems using a
differential equation of the form: dy
dtky=
• model and solve problems involving Newton’s Law of Cooling using a
differential equation of the form: dy
dtay b= + .


Learning Resources
APPENDIX B

APPENDIX B: LEARNING RESOURCES • Mathematics 10 to 12
B-2
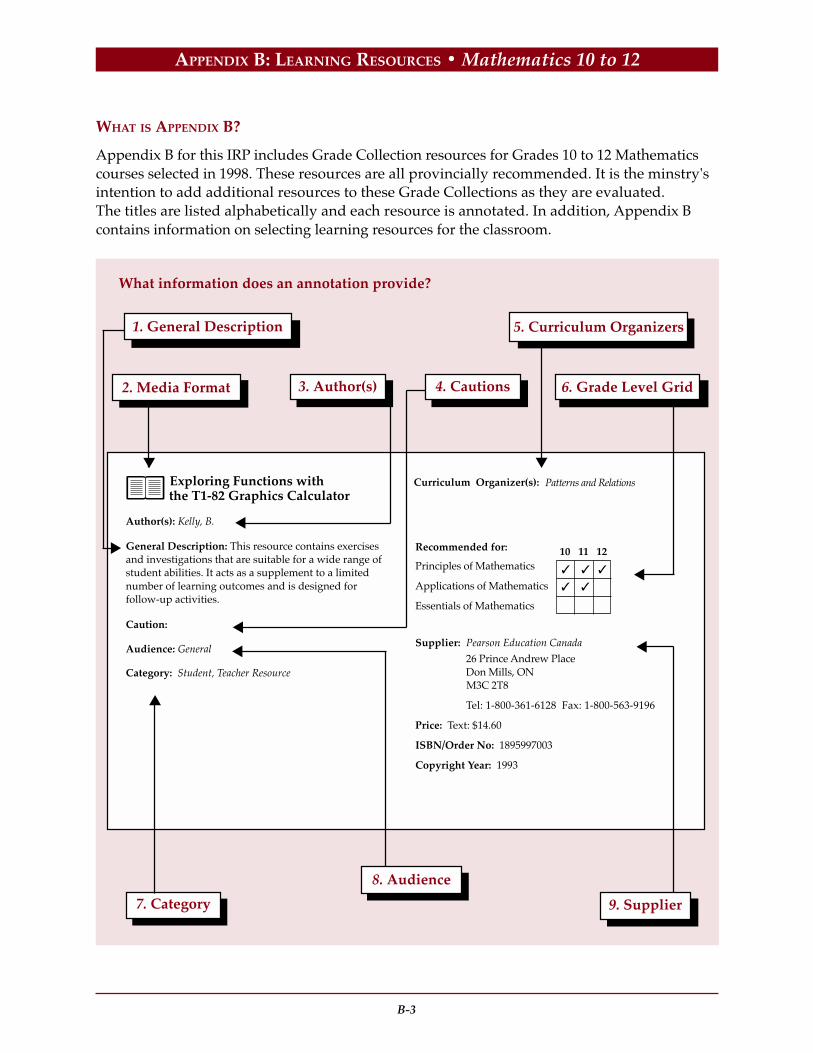
B-3
APPENDIX B: LEARNING RESOURCES • Mathematics 10 to 12
Supplier: Pearson Education Canada
26 Prince Andrew PlaceDon Mills, ON
M3C 2T8
Tel: 1-800-361-6128 Fax: 1-800-563-9196
Price: Text: $14.60
ISBN/Order No: 1895997003
Copyright Year: 1993
9. Supplier
What information does an annotation provide?
WHAT IS APPENDIX B?
Appendix B for this IRP includes Grade Collection resources for Grades 10 to 12 Mathematicscourses selected in 1998. These resources are all provincially recommended. It is the minstry'sintention to add additional resources to these Grade Collections as they are evaluated.The titles are listed alphabetically and each resource is annotated. In addition, Appendix Bcontains information on selecting learning resources for the classroom.
Curriculum Organizer(s): Patterns and Relations Exploring Functions with the T1-82 Graphics Calculator
Author(s): Kelly, B.
General Description: This resource contains exercisesand investigations that are suitable for a wide range ofstudent abilities. It acts as a supplement to a limitednumber of learning outcomes and is designed forfollow-up activities.
Caution:
Audience: General
Category: Student, Teacher Resource
8. Audience
7. Category
3. Author(s)
1. General Description
2. Media Format
5. Curriculum Organizers
4. Cautions
6. Grade Level Grid
Recommended for:
Principles of Mathematics
Applications of Mathematics
Essentials of Mathematics
10 11 12

APPENDIX B: LEARNING RESOURCES • Mathematics 10 to 12
B-4
3. Author(s): Author or editor information isprovided where it might be of use to theteacher.
4. Cautions: This category is used to alertteachers about potentially sensitive issues.
5. Curriculum Organizers: This categoryhelps teachers make links between theresource and the curriculum.
6. Grade Level Grid: This category indicatesthe suitable age range for the resource.
7. Category: This section indicates whether itis a student and teacher resource, teacherresource, or professional reference.
8. Audience: This category indicates thesuitability of the resource for differenttypes of students. Possible studentaudiences include the following:• general• English as a second language (ESL)• Students who are:
- gifted- blind or have visual impairments- deaf or hard of hearing
• Students with:- severe behavioural disorders- dependent handicaps- physical disabilities- autism- learning disabilities (LD)- mild intellectual disabilities (ID-mild)- moderate to severe/profound disabilities (ID-moderate to severe/profound)
9. Supplier: The name and address of thesupplier are included in this category.Prices shown here are approximate andsubject to change. Prices should be verifiedwith the supplier.
1. General Description: This section provides an overview of the resource.
2. Media Format: This part is represented by anicon next to the title. Possible icons include:
Audio Cassette
CD-ROM
Film
Games/Manipulatives
Laserdisc/Videodisc
Multimedia
Music CD
Print Materials
Record
Slides
Software
Video

B-5
APPENDIX B: LEARNING RESOURCES • Mathematics 10 to 12
What about the videos?
The ministry attempts to obtain rights formost provincially recommended videos.Negotiations for the most recentlyrecommended videos may not be complete.For these titles, the original distributor islisted in this document, instead of BritishColumbia Learning Connection Inc. Rightsfor new listings take effect the yearimplementation begins. Please check withBritish Columbia Learning Connection Inc.before ordering new videos.
Resources that are not on the provinciallyrecommended list must be evaluatedthrough a local, board-approved process.
CRITERIA FOR SELECTION
There are a number of factors to considerwhen selecting learning resources.
Content
The foremost consideration for selectionis the curriculum to be taught. Prospectiveresources must adequately support theparticular learning outcomes that the teacherwants to address. Teachers will determinewhether a resource will effectively supportany given learning outcomes within acurriculum organizer. This can only be doneby examining descriptive informationregarding that resource; acquiring additionalinformation about the material from thesupplier, published reviews, or colleagues;and by examining the resource first-hand.
Instructional Design
When selecting learning resources, teachersmust keep in mind the individual learningstyles and abilities of their students, aswell as anticipate the students they mayhave in the future. Resources have beenrecommended to support a variety ofspecial audiences, including gifted, learningdisabled, mildly intellectually disabled, andESL students. The suitability of a resourcefor any of these audiences has been noted inthe resource annotation. The instructionaldesign of a resource includes theorganization and presentation techniques;the methods used to introduce, develop, andsummarize concepts; and the vocabularylevel. The suitability of all of these shouldbe considered for the intended audience.
SELECTING LEARNING RESOURCES
FOR THE CLASSROOM
Selecting a learning resource for Grades10 to 12 Mathematics means choosing locallyappropriate materials from the GradeCollection or other lists of evaluatedresources. The process of selection involvesmany of the same considerations as theprocess of evaluation, though not to the samelevel of detail. Content, instructional design,technical design, and social considerationsmay be included in the decision-makingprocess, along with a number of othercriteria.
The selection of learning resources should bean ongoing process to ensure a constant flowof new materials into the classroom. It is mosteffective as an exercise in group decisionmaking, co-ordinated at the school, district,and ministry levels. To function efficientlyand realize the maximum benefit from finiteresources, the process should operate inconjunction with an overall district and schoollearning resource implementation plan.
Teachers may choose to use provinciallyrecommended resources to support provincialor locally developed curricula; chooseresources that are not on the ministry's list;or choose to develop their own resources.

APPENDIX B: LEARNING RESOURCES • Mathematics 10 to 12
B-6
Teachers should also consider their ownteaching styles and select resources that willcomplement them. Lists of provinciallyrecommended resources contain materialsthat range from prescriptive or self-containedresources to open-ended resources thatrequire considerable teacher preparation.There are provincially recommendedmaterials for teachers with varying levels ofexperience with a particular subject, as wellas those that strongly support particularteaching styles.
Technology Considerations
Teachers are encouraged to embrace a varietyof educational technologies in theirclassrooms. To do so, they will needto ensure the availability of the necessaryequipment and familiarize themselveswith its operation. If the equipment is notcurrently available, then the need mustbe incorporated into the school or districttechnology plan.
Social Considerations
All resources on the ministry's provinciallyrecommended lists have been thoroughlyscreened for social concerns from a provincialperspective. However, teachers must considerthe appropriateness of any resource from theperspective of the local community.
Media
When selecting resources, teachers shouldconsider the advantages of various media.Some topics may be best taught using aspecific medium. For example, video maybe the most appropriate medium whenteaching a particular, observable skill, since itprovides a visual model that can be playedover and over or viewed in slow motion fordetailed analysis. Video can also bring
otherwise unavailable experiences into theclassroom and reveal “unseen worlds” tostudents. Software may be particularlyuseful when students are expected todevelop critical-thinking skills throughthe manipulation of a simulation, or wheresafety or repetition is a factor. Print resourcesor CD-ROM can best be used to provideextensive background information on a giventopic. Once again, teachers must consider theneeds of their individual students, some ofwhom may learn better from the use of onemedium than another.
Funding
As part of the selection process, teachersshould determine how much money isavailable to spend on learning resources.This requires an awareness of school anddistrict policies, and procedures for learningresource funding. Teachers will need toknow how funding is allocated in theirdistrict and how much is available for theirneeds. Learning resource selection should beviewed as an ongoing process that requires adetermination of needs, as well as long-termplanning to co-ordinate individual goals andlocal priorities.
Existing Materials
Prior to selecting and purchasing newlearning resources, an inventory of thoseresources that are already available shouldbe established through consultation withthe school and district resource centres. Insome districts, this can be facilitated throughthe use of district and school resourcemanagement and tracking systems. Suchsystems usually involve a database to helpkeep track of a multitude of titles. If such asystem is available, then teachers can checkthe availability of a particular resource via acomputer.

B-7
APPENDIX B: LEARNING RESOURCES • Mathematics 10 to 12
SELECTION TOOLS
The Ministry of Education has developed avariety of tools to assist teachers with theselection of learning resources.
These include:
• Integrated Resource Packages (IRPs)that contain curriculum information,teaching and assessment strategies, andprovincially recommended learningresources, including Grade Collections
• resource databases on disks or on-line• sets of the most recently recommended
learning resources (provided each year toa number of host districts throughout theprovince to allow teachers to examine thematerials first-hand at regional displays)
• sample sets of provincially recommendedresources (available on loan to districtson request)
A MODEL SELECTION PROCESS
The following series of steps is one way aschool resource committee might go aboutselecting learning resources:
1. Identify a resource co-ordinator (forexample, a teacher-librarian).
2. Establish a learning resources committeemade up of department heads or leadteachers.
3. Develop a school vision and approachto resource-based learning.
4. Identify existing learning resourceand library materials, personnel, andinfrastructure.
5. Identify the strengths and weaknessesof existing systems.
6. Examine the district Learning ResourcesImplementation Plan.
7. Identify resource priorities.
8. Apply criteria such as those found inEvaluating, Selecting, and ManagingLearning Resources: A Guide to shortlistpotential resources.
9. Examine shortlisted resources first-handat a regional display or at a publishers’display, or borrow a set by contactingeither a host district or the CurriculumBranch.
10. Make recommendations for purchase.
FURTHER INFORMATION
For further information on evaluation andselection processes, catalogues, CD-ROMcatalogues, annotation sets, or resourcedatabases, please contact the CurriculumBranch of the Ministry of Education.

APPENDIX B: LEARNING RESOURCES • Mathematics 10 to 12
B-8
INDUSTRY STANDARD SOFTWARE
It is expected that students in Grades 10 to 12Mathematics will have access to grade-levelappropriate productivity tools includingspreadsheets, database packages, wordprocessors, drawing and painting tools, andso on. Use of industry standard software isencouraged.
Reviews of appropriate software areregularly published in a variety of computerand trade magazines. Selection of aparticular application should consider:• existing hardware and upgrade path• cross-platform capability• instructor training requirements• time spent on student skill development
versus curricular intent• cross-curriculum applicability• general flexibility and utility
Software for Grades 10 to 12 Mathematics
Software that supports Grades 10 to 12 Mathematics includes but is not limited to:
Title
Excel
Lotus 123
Supercalc
Function/Purpose
Spreadsheet
Spreadsheet
Spreadsheet
Inclusion in this list does not constitute recommended status or endorsement of the product.

B-9
APPENDIX B: LEARNING RESOURCES • Mathematics 10 to 12
Learning ResourcesGrade Collections
APPENDIX B

APPENDIX B: LEARNING RESOURCES • Mathematics 10 to 12
B-10
B-11
APPENDIX B: LEARNING RESOURCES • Mathematics 10 to 12
MATHEMATICS 10 - 12 GRADE COLLECTIONS
INTRODUCTION
The majority of the learningresources in these GradeCollections have beenevaluated through theWestern Canadian ProtocolLearning Resource EvaluationProcess and subsequently have been givenProvincially Recommended status by theMinistry of Education.
Grade Collections are not prescriptive; theyare intended to provide assistance andadvice only. Teachers are encouraged to useexisting resources that match the learningoutcomes and to select additional resourcesto meet their specific classroom needs. It isrecommended that teachers use theMathematics 10 - 12 IRP when makingresource decisions.
Resources that are identified through theWestern Canadian Protocol Evergreeningprocess as having strong curriculum matchwill be added to the Collections as theybecome available.
Categories of Resources
Learning resources selected for the GradeCollection have been categorized as eithercomprehensive , or additional.
• Comprehensive resources tend to provide abroad coverage of the learning outcomesfor most curriculum organizers.
• Additional resources are more topic specificand support individual curriculumorganizers or clusters of outcomes. Theyare recommended as valuable support orextension for specific topics.
In many cases, Grade Collections providemore than one resource to support specificoutcomes, enabling teachers to selectresources that best match different teachingand learning styles.
Other Recommended Resources
The Western Canadian Protocol LearningResource Evaluation Process has alsoidentified numerous teacher resources andprofessional references. These are generallycross-grade planning resources that includeideas for a variety of activities and exerciseswhich may complement the comprehensiveresources. These resources, while not part ofthe Grade Collections, have ProvinciallyRecommended status. An alphabetical listindicating suggested course is included inthis package, along with an annotatedbibliography for ordering convenience.
Appendix B includes annotations for otherRecommended resources not in the GradeCollections. While these resources meet onlya limited number of outcomes, teachers areencouraged to consider them for differentaudience needs, teaching and learning styles,theme development, in-depth research, andso on.
Grade Collection Information
The following pages begin with an overviewof the comprehensive resources for thiscurriculum, then present Grade Collectioncharts for each course. These charts list bothcomprehensive and additional resources foreach curriculum organizer for the course.Each chart is followed by an annotatedbibliography. There is an alphabetical list ofthe teacher resources, indicating course. Thislist is followed by an annotated bibliography.Please confirm with suppliers for completeand up-to-date price information. There isalso a chart that shows the alphabetical list of

APPENDIX B: LEARNING RESOURCES • Mathematics 10 to 12
B-12
Grade Collection titles for each course and ablank template that can be used by teachersto record their individual choices.
Overview of Comprehensive Resources forMathematics 10 - 12
• Applied Mathematics, Western Canadian Edition(Applications of Mathematics 10,Applications of Mathematics 11,Applications of Mathematics 12)
Problem solving through extensive projectwork is the central focus of this program.Each developmental unit emphasizes atleast one significant project. Connectionsare made to other curricular areas, andreal-life contexts and applications. Theuse of technology, and the use anddevelopment of natural and mathematicallanguage are emphasized. Componentsinclude student project book and sourcebook, a teachers’ resource book, andoptional technology components. Thisresource requires the use of computerspreadsheets and graphing calculators, aswell as some science laboratory equipmentgenerally found in schools.
• The Learning Equation(Principles of Mathematics 10)
Interactive CD-ROMs present lessons inthe consistent format of introduction,tutorial example, summary of concepts,practice problems, extra practice, and aself-check. Students are able to monitortheir own progress through the variouscomponents of each lesson. Print supportconsists of a Student Refresher and aTeacher’s Manual.
• Mathematics, Western Canadian Edition(Principles of Mathematics 10, Principlesof Mathematics 11, Principles ofMathematics 12)
Program closely maps the content of theIRP. Concepts and skills are presented inproblem-solving contexts and open-endedquestions are designed to help studentsexpress their ideas about mathematicsorally and in writing. The mathematicalprocesses are highlighted through the useof icons in examples, explanations, andactivities. Components include a studenttext, teacher’s resource book, and anoptional template and data kit andindependent study guide. Requires theuse of manipulatives.
• MATHPOWER, Western Edition(Principles of Mathematics 10, Principlesof Mathematics 11, Principles ofMathematics 12)
Program presents concepts and skills in aproblem-solving context. It closely mapsthe content and philosophy of the IRP.The framework’s mathematical processesare woven throughout the resource.Components include a student text,teacher’s guide and blackline masters.Requires the use of manipulatives, andintegrates the use of appropriatetechnology. Components include anoptional computer databank andcomputerized assessment bank. Theintroductory pages of the student resource,which outline the mathematical processesand the NCTM Standards, are an essentialpart of the resource.
B-13
APPENDIX B: LEARNING RESOURCES • Mathematics 10 to 12
Grade Collections
APPENDIX B

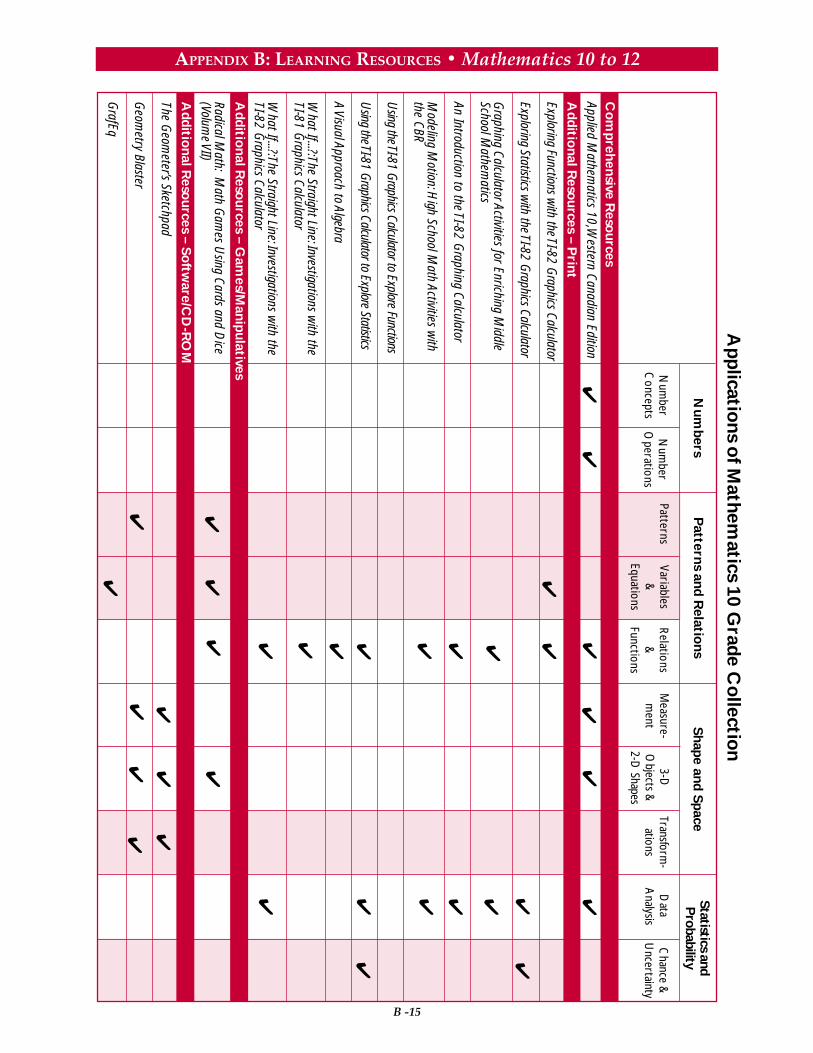
B -15
APPENDIX B: LEARNING RESOURCES • Mathematics 10 to 12
Co
mprehensive R
esources
Applicatio
ns of M
athematics 10 G
rade Co
llection
Num
bersP
atterns and Relatio
nsS
hape and Space
Statistics andP
robability
Num
berC
onceptsN
umber
Operations
PatternsVariables
&Equations
Relations
&Functions
Measure-m
ent3-D
Objects &
2-D Shapes
Transform-
ationsD
ata A
nalysisC
hance &U
ncertainty
Applied Mathem
atics 10, Western Canadian Edition
Exploring Functions with the TI-82 G
raphics Calculator
Exploring Statistics with the TI-82 G
raphics Calculator
Graphing Calculator Activities for Enriching M
iddleSchool M
athematics
An Introduction to the TI-82 Graphing Calculator
Modeling M
otion: High School M
ath Activities with
the CBR
Using the TI-81 Graphics Calculator to Explor e Functions
Using the TI-81 Graphics Calculator to Explor e Statistics
A Visual Approach to Algebra
What If...?:The Straight Line: Investigations w
ith theTI-81 G
raphics Calculator
What If...?:The Straight Line: Investigations w
ith theTI-82 G
raphics Calculator
Radical Math: M
ath Gam
es Using Cards and D
ice(Volum
e VII)
The Geom
eter’s Sketchpad
Geom
etry Blaster
GrafEq
Additio
nal Reso
urces – Print
Additio
nal Reso
urces – So
ftware/C
D-R
OM
Additio
nal Reso
urces – Gam
es/Manipulatives


Applications of Mathematics Grade 10 Collection
Student, Teacher ResourceCategory:
General Description: Inquiry-approach resource consists of aSource Book, a Project Book, and a Teacher's Resource Book. TheSource Book includes hands-on activities, research projects, tutorials,and review exercises. Applications and problem-solving questionsuse real-life examples. The Project Book comprises 20 additionalopen-ended projects that provide opportunities to applymathematics in a new context.
Audience: General
Author(s): Alexander, R. ... (et al.)
NumbersPatterns and RelationsShape and SpaceStatistics and Probability
Curriculum Organizer(s):Applied Mathematics 10, Western CanadianEdition
Supplier:
ISBN/Order No:
Price:
Project Book: 0-201-39585-1Source Book: 0-201-39586-XTeacher's Resource Book: 0-201-39587-6
Project Book and Source Book: $62.95Teacher's Resource Book: $149.95
26 Prince Andrew PlaceDon Mills, ONM3C 2T8
Tel: 1-800-361-6128 Fax: 1-800-563-9196
Pearson Education Canada
Principle of MathematicsApplications of MathematicsEssentials of Mathematics
10 11 12Recommended for:
Copyright Year: 1999
Student, Teacher ResourceCategory:
General Description: This resource contains exercises andinvestigations that are suitable for a wide range of student abilities.It acts as a supplement to a limited number of learning outcomes andis designed for follow-up activities.
Audience: General
Author(s): Kelly, B.
Patterns and RelationsCurriculum Organizer(s):Exploring Functions with the TI-82 GraphicsCalculator
Supplier:
ISBN/Order No:
Price:
1895997003
$14.60
26 Prince Andrew PlaceDon Mills, ONM3C 2T8
Tel: 1-800-361-6128 Fax: 1-800-563-9196
Pearson Education Canada
Principle of MathematicsApplications of MathematicsEssentials of Mathematics
10 11 12Recommended for:
Copyright Year: 1993
B-17
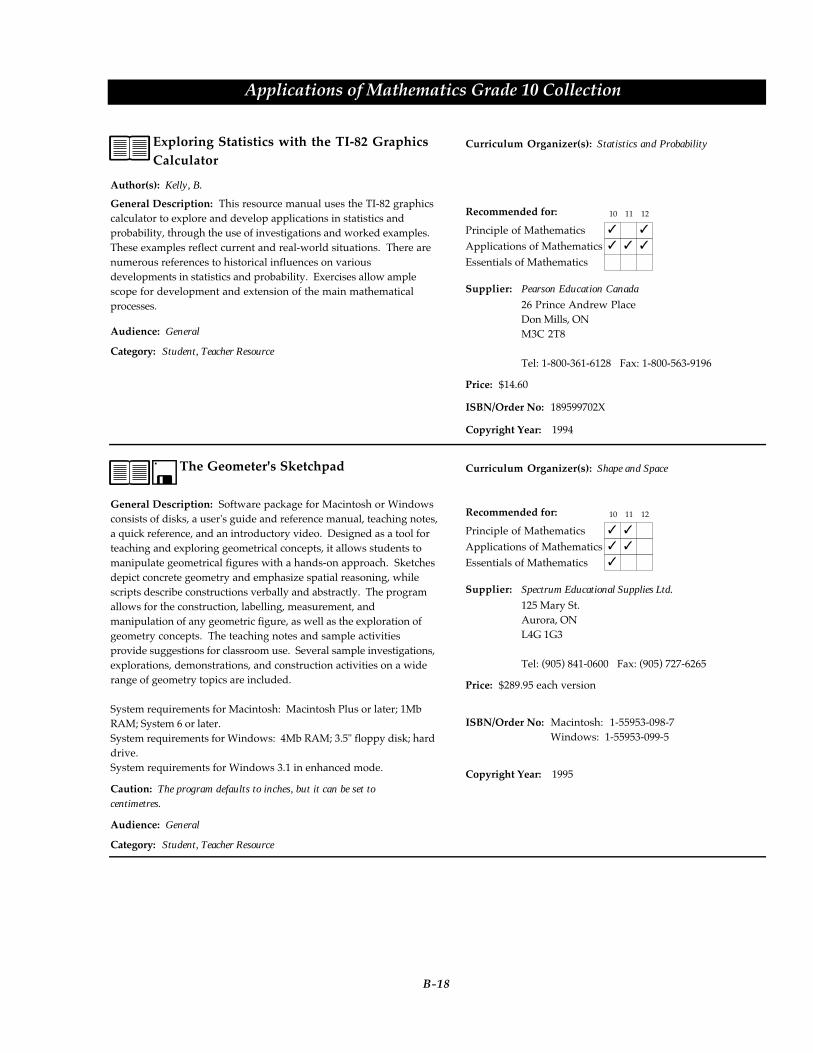
Applications of Mathematics Grade 10 Collection
Student, Teacher ResourceCategory:
General Description: This resource manual uses the TI-82 graphicscalculator to explore and develop applications in statistics andprobability, through the use of investigations and worked examples.These examples reflect current and real-world situations. There arenumerous references to historical influences on variousdevelopments in statistics and probability. Exercises allow amplescope for development and extension of the main mathematicalprocesses.
Audience: General
Author(s): Kelly, B.
Statistics and ProbabilityCurriculum Organizer(s):Exploring Statistics with the TI-82 GraphicsCalculator
Supplier:
ISBN/Order No:
Price:
189599702X
$14.60
26 Prince Andrew PlaceDon Mills, ONM3C 2T8
Tel: 1-800-361-6128 Fax: 1-800-563-9196
Pearson Education Canada
Principle of MathematicsApplications of MathematicsEssentials of Mathematics
10 11 12Recommended for:
Copyright Year: 1994
Student, Teacher ResourceCategory:
General Description: Software package for Macintosh or Windowsconsists of disks, a user's guide and reference manual, teaching notes,a quick reference, and an introductory video. Designed as a tool forteaching and exploring geometrical concepts, it allows students tomanipulate geometrical figures with a hands-on approach. Sketchesdepict concrete geometry and emphasize spatial reasoning, whilescripts describe constructions verbally and abstractly. The programallows for the construction, labelling, measurement, andmanipulation of any geometric figure, as well as the exploration ofgeometry concepts. The teaching notes and sample activitiesprovide suggestions for classroom use. Several sample investigations,explorations, demonstrations, and construction activities on a widerange of geometry topics are included.
System requirements for Macintosh: Macintosh Plus or later; 1MbRAM; System 6 or later.System requirements for Windows: 4Mb RAM; 3.5" floppy disk; harddrive.System requirements for Windows 3.1 in enhanced mode.
Caution: The program defaults to inches, but it can be set tocentimetres.
Audience: General
Shape and SpaceCurriculum Organizer(s):The Geometer's Sketchpad
Supplier:
ISBN/Order No:
Price:
Macintosh: 1-55953-098-7Windows: 1-55953-099-5
$289.95 each version
125 Mary St.Aurora, ONL4G 1G3
Tel: (905) 841-0600 Fax: (905) 727-6265
Spectrum Educational Supplies Ltd.
Principle of MathematicsApplications of MathematicsEssentials of Mathematics
10 11 12Recommended for:
Copyright Year: 1995
B-18

Applications of Mathematics Grade 10 Collection
Student, Teacher ResourceCategory:
General Description: Interactive CD-ROM package for Macintoshor Windows includes lessons, activities, and games to teach andreinforce geometric concepts. It uses a three-level approach,allowing a student to progress at a beginning, an intermediate, or amastery level. The lessons, designed for individual student use, arein three sections: teach, practise, and apply. They explore the maintopics of points and lines, triangles, polygons and quadrilaterals,similarity, circles, perimeter and area, solids in 3D, coordinategeometry, transformational geometry and logical reasoning and proof.Requires decision making and creative thinking by students.
System requirements for Macintosh: System 7.0 or later, 8Mb RAM.System requirements for Windows 3.1: 386/33 MHz, 8Mb RAM,Pentium processor recommended, 256 super VGA or better colourmonitor, sound and graphics cards, CD-ROM drive, and mouse.Printer recommended.System requirements for Windows 95: 486/50 MHz, 8Mb RAM,Pentium processor recommended, 256 super VGA or better colourmonitor, sound and graphics cards, CD-ROM drive, and mouse.Printer is recommended.
Audience: General
Shape and SpacePatterns and Relations
Curriculum Organizer(s):Geometry Blaster
Supplier:
ISBN/Order No:
Price:
0784910634
$79.95
19840 Pioneer AvenueP.O. Box 2961Torrance, CA90503
Tel: 1-800- 545-7677 Fax: (310) 793-0601
Davidson & Associates, Inc.
Principle of MathematicsApplications of MathematicsEssentials of Mathematics
10 11 12Recommended for:
Copyright Year: 1996
Student, Teacher ResourceCategory:
General Description: Relation plotting tool enables students tograph functions from implicit and explicit definitions, and fromrelations as well as inequalities. There is the ability to save and printgraphs, and to integrate these graphs into other documents.Includes a manual.
System requirements for Macintosh: System 6.5 or higher (System 7or higher recommended), 2 Mb RAM (4 Mb recommended).System requirements for Windows: Windows 3.1 with win32's,Windows 95, Windows 98, or Windows NT 4; 8Mb RAM.
Audience: General
Patterns and RelationsCurriculum Organizer(s):GrafEq (Macintosh/Windows Version 2.09)
Supplier:
ISBN/Order No:
Price:
(not available)
Single User: $94.50Site Licence (up to 30): $300.00
4446 Lazelle AvenueTerrace, BCV8G 1R8
Tel: (250) 638-8606 Fax: (250) 638-8606
Pedagoguery Software
Principle of MathematicsApplications of MathematicsEssentials of Mathematics
10 11 12Recommended for:
Copyright Year: 1998
B-19

Applications of Mathematics Grade 10 Collection
Student, Teacher ResourceCategory:
General Description: Twelve activities for using the TI-80, -82 and-83 graphing calculators require students to gather and organize dataand explain their understanding of processes. Instructions for theuse of the calculator accompany every step.
Audience: General
Author(s): Browning, C.A.; Channell, D.E.
Patterns and RelationsStatistics and Probability
Curriculum Organizer(s):Graphing Calculator Activities for EnrichingMiddle School Mathematics
Supplier:
ISBN/Order No:
Price:
1886309159
$24.48
26 Prince Andrew PlaceDon Mills, ONM3C 2T8
Tel: 1-800-361-6128 Fax: 1-800-563-9196
Pearson Education Canada
Principle of MathematicsApplications of MathematicsEssentials of Mathematics
10 11 12Recommended for:
Copyright Year: 1997
Student, Teacher ResourceCategory:
General Description: User-friendly software for Macintosh orWindows graphs different forms of linear, quadratic, polynomial, andtrigonometric relations. A second program provides a graph andrequires the student to enter the equation. There are also two gamesthat act as motivational tools. Five graphs can be displayedsimultaneously. The accompanying teacher's guide provides ideasand worksheets.
System requirements for Macintosh: System 6.0.5 or higher (System 7recommended), 1 Mb RAM.System requirements for Windows 3.1: Windows 3.1, 486/25 MHz orbetter, 2 Mb RAM; 256 colour monitor.System requirements for Windows 95: 486DX/50 MHz or higher(Pentium recommended), 4 Mb RAM, 256 colour monitor.
Audience: General
Patterns and RelationsShape and Space
Curriculum Organizer(s):Green Globs & Graphing Equations
Supplier:
ISBN/Order No:
Price:
(not available)
$129.95 each version
164 Commander BoulevardScarborough, ONM1S 3C7
Tel: 1-800-667-1115 Fax: (416) 293-9009
Gage Educational Publishing Co. (Scarborough)
Principle of MathematicsApplications of MathematicsEssentials of Mathematics
10 11 12Recommended for:
Copyright Year: 1996
B-20
Applications of Mathematics Grade 10 Collection
Student, Teacher ResourceCategory:
General Description: Reproducible blackline masters give clearexamples and steps for using the TI-82 graphing calculator in avariety of ways. Can also be used with the TI-83 graphing calculator.
Audience: General
Author(s): Govatos, M.
Patterns and RelationsStatistics and Probability
Curriculum Organizer(s):An Introduction to the TI-82 Graphing Calculator
Supplier:
ISBN/Order No:
Price:
0768200067
$18.95
23740 Howthorne BoulevardTorrance, CA90505
Tel: 1-800-421-5533 Fax: (310) 375-5090
Frank Schaffer Publications Inc.
Principle of MathematicsApplications of MathematicsEssentials of Mathematics
10 11 12Recommended for:
Copyright Year: 1998
Student, Teacher ResourceCategory:
General Description: This resource includes investigation activitiesthat use the calculator-based ranger (CBR) to obtain data fromphysical phenomena. Using a TI-82 or TI-83 graphing calculator,students obtain a mathematical equation to describe the physicalevent(s). Topics include arithmetic and geometric growth, systemsof linear equations in two variables, quadratic functions, andexponential functions. The resource provides practice data to enablestudents to complete the investigations without a CBR, if necessary.
Audience: General
Author(s): Antinone, L.; Gough, S.
Patterns and RelationsStatistics and Probability
Curriculum Organizer(s):Modeling Motion: High School Math Activitieswith the CBR
Supplier:
ISBN/Order No:
Price:
1886309140
$16.83
26 Prince Andrew PlaceDon Mills, ONM3C 2T8
Tel: 1-800-361-6128 Fax: 1-800-563-9196
Pearson Education Canada
Principle of MathematicsApplications of MathematicsEssentials of Mathematics
10 11 12Recommended for:
Copyright Year: 1997
B-21
Applications of Mathematics Grade 10 Collection
Student, Teacher ResourceCategory:
General Description: This resource offers some unique activitiesthat encourage the processes of communication, estimation andmental mathematics, problem solving, reasoning, and visualization.Many of the activities can be used to help students achieve fluencyin such topics as polynomial manipulations and the use of equivalentforms of expressions containing radicals.
Audience: General
Author(s): Currah; Felling; Lachance
Patterns and RelationsShape and Space
Curriculum Organizer(s):Radical Math: Math Games Using Cards andDice (Volume VII)
Supplier:
ISBN/Order No:
Price:
0968161308
$36.00
3930-78 AvenueEdmonton, ABT6B 2W4
Tel: (780) 440-6284 Fax: (780) 440-1619
Box Cars & One-Eyed Jacks
Principle of MathematicsApplications of MathematicsEssentials of Mathematics
10 11 12Recommended for:
Copyright Year: 1996
Student, Teacher ResourceCategory:
General Description: This resource manual includes exercises andinvestigations using the TI-81 graphics calculator and is suitable for awide range of student abilities. It provides a supplement to a limitednumber of learning outcomes and is designed for follow-up activities.
Audience: General
Author(s): Kelly, B.
Patterns and RelationsCurriculum Organizer(s):Using the TI-81 Graphics Calculator to ExploreFunctions
Supplier:
ISBN/Order No:
Price:
0969524404
$8.95
26 Prince Andrew PlaceDon Mills, ONM3C 2T8
Tel: 1-800-361-6128 Fax: 1-800-563-9196
Pearson Education Canada
Principle of MathematicsApplications of MathematicsEssentials of Mathematics
10 11 12Recommended for:
Copyright Year: 1991
B-22

Applications of Mathematics Grade 10 Collection
Student, Teacher ResourceCategory:
General Description: This resource manual uses the TI-81 graphicscalculator to explore and develop applications in statistics andprobability, through the use of investigations and worked examples.These examples reflect current and real-world situations. There arenumerous references to historical influences on variousdevelopments in statistics and probability. Student exercises, most ofwhich are not calculator specific, allow ample scope fordevelopment and extension of the main mathematical processes.
Audience: General
Author(s): Kelly, B.
Statistics and ProbabilityCurriculum Organizer(s):Using the TI-81 Graphics Calculator to ExploreStatistics
Supplier:
ISBN/Order No:
Price:
0969524412
$8.95
26 Prince Andrew PlaceDon Mills, ONM3C 2T8
Tel: 1-800-361-6128 Fax: 1-800-563-9196
Pearson Education Canada
Principle of MathematicsApplications of MathematicsEssentials of Mathematics
10 11 12Recommended for:
Copyright Year: 1992
Student, Teacher ResourceCategory:
General Description: Supplementary activity book uses aninvestigative approach to introduce concepts related to therelationships among graphing, scale, data, and algebra. Studentactivity worksheets, accompanied by teacher notes, can be used asintroductory or extension material. Includes the use of a graphingcalculator for some activities. Imperial measurement is used inproblem solving situations.
Audience: General
Author(s): Van Dyke, F.
Patterns and RelationsCurriculum Organizer(s):A Visual Approach to Algebra
Supplier:
ISBN/Order No:
Price:
1572324414
$20.92
26 Prince Andrew PlaceDon Mills, ONM3C 2T8
Tel: 1-800-361-6128 Fax: 1-800-563-9196
Pearson Education Canada
Principle of MathematicsApplications of MathematicsEssentials of Mathematics
10 11 12Recommended for:
Copyright Year: 1998
B-23
Applications of Mathematics Grade 10 Collection
Student, Teacher ResourceCategory:
General Description: This resource explores the straight line,dependent upon using the TI-81 graphics calculator. It showsstudents how to plot linear equations, how to make changes to thevariable, and uses the question "what if ...?" to pose multipleproblems within a single context. Students are encouraged tocompare their answers and to predict outcomes.
Audience: General
Author(s): Alexander, B.
Patterns and RelationsCurriculum Organizer(s):What If ...?: The Straight Line: Investigationswith the TI-81 Graphics Calculator
Supplier:
ISBN/Order No:
Price:
0969698100
$12.30
26 Prince Andrew PlaceDon Mills, ONM3C 2T8
Tel: 1-800-361-6128 Fax: 1-800-563-9196
Pearson Education Canada
Principle of MathematicsApplications of MathematicsEssentials of Mathematics
10 11 12Recommended for:
Copyright Year: 1993
Student, Teacher ResourceCategory:
General Description: This resource explores the straight line,dependent upon using the TI-82 graphics calculator. It showsstudents how to plot linear equations, how to make changes to thevariable, and uses the question "what if ...?" to pose multipleproblems within a single context. Students are encouraged tocompare their answers and to predict outcomes. This resource alsointroduces the concept of the line of best fit.
Audience: General
Author(s): Alexander, B.
Patterns and RelationsStatistics and Probability
Curriculum Organizer(s):What If ...?: The Straight Line: Investigationswith the TI-82 Graphics Calculator
Supplier:
ISBN/Order No:
Price:
0969698135
$12.30
26 Prince Andrew PlaceDon Mills, ONM3C 2T8
Tel: 1-800-361-6128 Fax: 1-800-563-9196
Pearson Education Canada
Principle of MathematicsApplications of MathematicsEssentials of Mathematics
10 11 12Recommended for:
Copyright Year: 1994
B-24

B -25
APPENDIX B: LEARNING RESOURCES • Mathematics 10 to 12
Co
mprehensive R
esources
Applicatio
ns of M
athematics 11 G
rade Co
llection
Num
bersP
atterns and Relatio
nsS
hape and Space
Statistics andP
robability
Num
berC
onceptsN
umber
Operations
PatternsVariables
&Equations
Relations
&Functions
Measure-m
ent3-D
Objects &
2-D Shapes
Transform-
ationsD
ata A
nalysisC
hance &U
ncertainty
Additio
nal Reso
urces – Print
Additio
nal Reso
urces – So
ftware/C
D-R
OM
Applied M
athematics 11, W
estern Canadian Edition
Explore Quadratic Functions w
ith the TI-83 or TI-82
Exploring Functions with the TI-82 G
raphics Calculator
Exploring Statistics with the TI-82 G
raphics Calculator
An Introduction to the TI-82 Graphing Calculator
Modeling M
otion: High School M
ath Activities with
the CBR
Using the TI-81 Graphics Calculator to Explor e Functions
Using the TI-81 Graphics Calculator to Explore Statistics
What If...?:The Straight Line: Investigations w
ith theTI-81 G
raphics Calculator
What If...?:The Straight Line: Investigations w
ith theTI-82 G
raphics Calculator
The Geom
eter’s Sketchpad
Geom
etry Blaster
GrafEq


Applications of Mathematics Grade 11 Collection
Student, Teacher ResourceCategory:
General Description: Inquiry-approach resource consists of aSource Book, a Project Book, and a Teacher's Resource Book. TheSource Book includes hands-on activities, research projects, tutorials,and review exercises. Applications and problem-solving questionsuse real-life examples. The Project Book comprises 24 additionalopen-ended projects that provide opportunities to applymathematics in a new context.
Audience: General
Author(s): Alexander, R. ... (et al.)
NumbersPatterns and RelationsShape and SpaceStatistics and Probability
Curriculum Organizer(s):Applied Mathematics 11, Western CanadianEdition
Supplier:
ISBN/Order No:
Price:
Source Book and Project Book: 0-201-39590-8Teacher's Resource Book: 0-201-39593-2
Source Book and Project Book: $65.95Teacher's Resource Book: $159.95
26 Prince Andrew PlaceDon Mills, ONM3C 2T8
Tel: 1-800-361-6128 Fax: 1-800-563-9196
Pearson Education Canada
Principle of MathematicsApplications of MathematicsEssentials of Mathematics
10 11 12Recommended for:
Copyright Year: 2000
Student, Teacher ResourceCategory:
General Description: Manual can be used for applying graphingcalculator technology to the exploration of quadratic functions andequations. It contains concise and precise instructions on relevantkeying sequences. There are many "window" diagrams showinginput and output screens. Problems posed relate to real-worldsituations and provide ample opportunities for discussion,exploration, and extension of a variety of situations beyond theroutine. The resource uses keying sequences that are specific to theTI-83 and TI-82 models of calculator.
Audience: General
Author(s): Alexander, B.
Patterns and RelationsCurriculum Organizer(s):Explore Quadratic Functions with the TI-83 orTI-82
Supplier:
ISBN/Order No:
Price:
0969698143
$17.95
26 Prince Andrew PlaceDon Mills, ONM3C 2T8
Tel: 1-800-361-6128 Fax: 1-800-563-9196
Pearson Education Canada
Principle of MathematicsApplications of MathematicsEssentials of Mathematics
10 11 12Recommended for:
Copyright Year: 1997
B-27

Applications of Mathematics Grade 11 Collection
Student, Teacher ResourceCategory:
General Description: This resource contains exercises andinvestigations that are suitable for a wide range of student abilities.It acts as a supplement to a limited number of learning outcomes andis designed for follow-up activities.
Audience: General
Author(s): Kelly, B.
Patterns and RelationsCurriculum Organizer(s):Exploring Functions with the TI-82 GraphicsCalculator
Supplier:
ISBN/Order No:
Price:
1895997003
$14.60
26 Prince Andrew PlaceDon Mills, ONM3C 2T8
Tel: 1-800-361-6128 Fax: 1-800-563-9196
Pearson Education Canada
Principle of MathematicsApplications of MathematicsEssentials of Mathematics
10 11 12Recommended for:
Copyright Year: 1993
Student, Teacher ResourceCategory:
General Description: This resource manual uses the TI-82 graphicscalculator to explore and develop applications in statistics andprobability, through the use of investigations and worked examples.These examples reflect current and real-world situations. There arenumerous references to historical influences on variousdevelopments in statistics and probability. Exercises allow amplescope for development and extension of the main mathematicalprocesses.
Audience: General
Author(s): Kelly, B.
Statistics and ProbabilityCurriculum Organizer(s):Exploring Statistics with the TI-82 GraphicsCalculator
Supplier:
ISBN/Order No:
Price:
189599702X
$14.60
26 Prince Andrew PlaceDon Mills, ONM3C 2T8
Tel: 1-800-361-6128 Fax: 1-800-563-9196
Pearson Education Canada
Principle of MathematicsApplications of MathematicsEssentials of Mathematics
10 11 12Recommended for:
Copyright Year: 1994
B-28

Applications of Mathematics Grade 11 Collection
Student, Teacher ResourceCategory:
General Description: This software package for Macintosh orWindows consists of disks, a user's guide and reference manual,teaching notes, a quick reference, and an introductory video. It isdesigned as a tool for teaching and exploring geometrical conceptsand allows students to manipulate geometrical figures with ahands-on approach. The sketchpad models geometry in two linkedviews. Sketches depict concrete geometry and emphasize spatialreasoning, while scripts describe constructions verbally andabstractly. The teaching notes and sample activities providesuggestions for classroom use. Several sample investigations,explorations, demonstrations, and construction activities on a widerange of geometry topics are included. The instructional videosupports both Macintosh and Windows.
System requirements for Macintosh: Macintosh Plus or later; 1MbRAM; System 6 or later.System requirements for Windows: 4Mb RAM; 3.5" floppy disk; harddrive.System requirements for Windows 3.1 in enhanced mode.
Caution: The program defaults to inches, but it can be set tocentimetres.
Audience: General
Shape and SpaceCurriculum Organizer(s):The Geometer's Sketchpad
Supplier:
ISBN/Order No:
Price:
Macintosh: 1-55953-098-7Windows: 1-55953-099-5
Each version: $289.95
125 Mary St.Aurora, ONL4G 1G3
Tel: (905) 841-0600 Fax: (905) 727-6265
Spectrum Educational Supplies Ltd.
Principle of MathematicsApplications of MathematicsEssentials of Mathematics
10 11 12Recommended for:
Copyright Year: 1995
Student, Teacher ResourceCategory:
General Description: Interactive CD-ROM package for Macintoshor Windows includes lessons, activities, and games to teach andreinforce geometric concepts. It uses a three-level approach,allowing a student to progress at a beginning, an intermediate, or amastery level. The lessons, designed for individual student use, arein three sections: teacher, practise, and apply. They explore themain topics of points and lines, triangles, polygons and quadrilaterals,similarity, circles, perimeter and area, solids in 3D, coordinategeometry, transformational geometry and logical reasoning and proof.The program is interactive and requires decision making and creativethinking by students.
System Requirements:Macintosh: System 7.0 or later, 8Mb RAM.Windows 3.1: 386/33 MHz, 8Mb RAM, Pentium processorrecommended, 256 super VGA or better colour monitor, sound andgraphics cards, CD drive, and mouse. Printer recommended.Windows 95: 486/50 MHz, 8Mb RAM, Pentium processorrecommended, 256 super VGA or better colour monitor, sound andgraphics cards, CD drive, and mouse. Printer is recommended.
Audience: General
Shape and SpacePatterns and Relations
Curriculum Organizer(s):Geometry Blaster
Supplier:
ISBN/Order No:
Price:
0784910634
$79.95
19840 Pioneer AvenueP.O. Box 2961Torrance, CA90503
Tel: 1-800- 545-7677 Fax: (310) 793-0601
Davidson & Associates, Inc.
Principle of MathematicsApplications of MathematicsEssentials of Mathematics
10 11 12Recommended for:
Copyright Year: 1996
B-29
Applications of Mathematics Grade 11 Collection
Student, Teacher ResourceCategory:
General Description: Relation plotting tool enables students tograph functions from implicit and explicit definitions, and fromrelations as well as inequalities. There is the ability to save and printgraphs, and to integrate these graphs into other documents.Includes a manual.
System requirements for Macintosh: System 6.5 or higher (System 7or higher recommended), 2 Mb RAM (4 Mb recommended).System requirements for Windows: Windows 3.1 with win32's,Windows 95, Windows 98, or Windows NT 4; 8Mb RAM.
Audience: General
Patterns and RelationsCurriculum Organizer(s):GrafEq (Macintosh/Windows Version 2.09)
Supplier:
ISBN/Order No:
Price:
(not available)
Single User: $94.50Site Licence (up to 30): $300.00
4446 Lazelle AvenueTerrace, BCV8G 1R8
Tel: (250) 638-8606 Fax: (250) 638-8606
Pedagoguery Software
Principle of MathematicsApplications of MathematicsEssentials of Mathematics
10 11 12Recommended for:
Copyright Year: 1998
Student, Teacher ResourceCategory:
General Description: Reproducible blackline masters give clearexamples and steps for using the TI-82 graphing calculator in avariety of ways. Can also be used with the TI-83 graphing calculator.
Audience: General
Author(s): Govatos, M.
Patterns and RelationsStatistics and Probability
Curriculum Organizer(s):An Introduction to the TI-82 Graphing Calculator
Supplier:
ISBN/Order No:
Price:
0768200067
$18.95
23740 Howthorne BoulevardTorrance, CA90505
Tel: 1-800-421-5533 Fax: (310) 375-5090
Frank Schaffer Publications Inc.
Principle of MathematicsApplications of MathematicsEssentials of Mathematics
10 11 12Recommended for:
Copyright Year: 1998
B-30
Applications of Mathematics Grade 11 Collection
Student, Teacher ResourceCategory:
General Description: This resource includes investigation activitiesthat use the calculator-based ranger (CBR) to obtain data fromphysical phenomena. Using a TI-82 or TI-83 graphing calculator,students obtain a mathematical equation to describe the physicalevent(s). Topics include arithmetic and geometric growth, systemsof linear equations in two variables, quadratic functions, andexponential functions. The resource provides practice data to enablestudents to complete the investigations without a CBR, if necessary.
Audience: General
Author(s): Antinone, L; Gough, S.
Patterns and RelationsStatistics and Probability
Curriculum Organizer(s):Modeling Motion: High School Math Activitieswith the CBR
Supplier:
ISBN/Order No:
Price:
1886309140
$16.93
26 Prince Andrew PlaceDon Mills, ONM3C 2T8
Tel: 1-800-361-6128 Fax: 1-800-563-9196
Pearson Education Canada
Principle of MathematicsApplications of MathematicsEssentials of Mathematics
10 11 12Recommended for:
Copyright Year: 1997
Student, Teacher ResourceCategory:
General Description: This resource manual includes exercises andinvestigations using the TI-81 graphics calculator and is suitable for awide range of student abilities. It provides a supplement to a limitednumber of learning outcomes and is designed for follow-up activities.
Audience: General
Author(s): Kelly, B.
Patterns and RelationsCurriculum Organizer(s):Using the TI-81 Graphics Calculator to ExploreFunctions
Supplier:
ISBN/Order No:
Price:
0969524404
$8.95
26 Prince Andrew PlaceDon Mills, ONM3C 2T8
Tel: 1-800-361-6128 Fax: 1-800-563-9196
Pearson Education Canada
Principle of MathematicsApplications of MathematicsEssentials of Mathematics
10 11 12Recommended for:
Copyright Year: 1991
B-31

Applications of Mathematics Grade 11 Collection
Student, Teacher ResourceCategory:
General Description: This resource manual uses the TI-81 graphicscalculator to explore and develop applications in statistics andprobability, through the use of investigations and worked examples.These examples reflect current and real-world situations. There arenumerous references to historical influences on variousdevelopments in statistics and probability. Student exercises, most ofwhich are not calculator specific, allow ample scope fordevelopment and extension of the main mathematical processes.
Audience: General
Author(s): Kelly, B.
Statistics and ProbabilityCurriculum Organizer(s):Using the TI-81 Graphics Calculator to ExploreStatistics
Supplier:
ISBN/Order No:
Price:
0969524412
$8.95
26 Prince Andrew PlaceDon Mills, ONM3C 2T8
Tel: 1-800-361-6128 Fax: 1-800-563-9196
Pearson Education Canada
Principle of MathematicsApplications of MathematicsEssentials of Mathematics
10 11 12Recommended for:
Copyright Year: 1992
Student, Teacher ResourceCategory:
General Description: This resource explores the straight line,dependent upon using the TI-81 graphics calculator. It showsstudents how to plot linear equations, how to make changes to thevariable, and uses the question "what if ...?" to pose multipleproblems within a single context. Students are encouraged tocompare their answers and to predict outcomes.
Audience: General
Author(s): Alexander, B.
Patterns and RelationsCurriculum Organizer(s):What If ...?: The Straight Line: Investigationswith the TI-81 Graphics Calculator
Supplier:
ISBN/Order No:
Price:
0969698100
$12.30
26 Prince Andrew PlaceDon Mills, ONM3C 2T8
Tel: 1-800-361-6128 Fax: 1-800-563-9196
Pearson Education Canada
Principle of MathematicsApplications of MathematicsEssentials of Mathematics
10 11 12Recommended for:
Copyright Year: 1993
B-32
Applications of Mathematics Grade 11 Collection
Student, Teacher ResourceCategory:
General Description: This resource explores the straight line,dependent upon using the TI-82 graphics calculator. It showsstudents how to plot linear equations, how to make changes to thevariable, and uses the question "what if ...?" to pose multipleproblems within a single context. Students are encouraged tocompare their answers and to predict outcomes. This resource alsointroduces the concept of the line of best fit.
Audience: General
Author(s): Alexander, B.
Patterns and RelationsStatistics and Probability
Curriculum Organizer(s):What If ...?: The Straight Line: Investigationswith the TI-82 Graphics Calculator
Supplier:
ISBN/Order No:
Price:
0969698135
$12.30
26 Prince Andrew PlaceDon Mills, ONM3C 2T8
Tel: 1-800-361-6128 Fax: 1-800-563-9196
Pearson Education Canada
Principle of MathematicsApplications of MathematicsEssentials of Mathematics
10 11 12Recommended for:
Copyright Year: 1994
B-33

B -35
APPENDIX B: LEARNING RESOURCES • Mathematics 10 to 12
Co
mprehensive R
esources
Applicatio
ns of M
athematics 12 G
rade Co
llection
Num
bersP
atterns and Relatio
nsS
hape and Space
Statistics andP
robability
Num
berC
onceptsN
umber
Operations
PatternsVariables
&Equations
Relations
&Functions
Measure-m
ent3-D
Objects &
2-D Shapes
Transform-
ationsD
ata A
nalysisC
hance &U
ncertainty
Additio
nal Reso
urces – Print
Additio
nal Reso
urces – So
ftware/C
D-R
OM
Applied Mathem
atics 12, Western Canadian Edition
(Available June 2001)
Exploring Advanced Algebra with the TI-83
Exploring Statistics with the TI-82 G
raphics Calculator
Using the TI-81 G
raphics Calculator to ExploreStatistics
GrafEq
Secondary Math Lab Toolkit


Applications of Mathematics Grade 12 Collection
Student, Teacher ResourceCategory:
General Description: Resource contains exercises andinvestigations that supplement the following topics: sequences,fractals, combinatorics, probability, linear systems, matrices, andlinear programming. The keying sequences are specific to TI-83model of calculator.
Audience: General
Patterns and RelationsStatistics and Probability
Curriculum Organizer(s):Exploring Advanced Algebra with the TI-83
Supplier:
ISBN/Order No:
Price:
1895997100
$15.71
26 Prince Andrew PlaceDon Mills, ONM3C 2T8
Tel: 1-800-361-6128 Fax: 1-800-563-9196
Pearson Education Canada
Principle of MathematicsApplications of MathematicsEssentials of Mathematics
10 11 12Recommended for:
Copyright Year: 1998
Student, Teacher ResourceCategory:
General Description: This resource manual uses the TI-82 graphicscalculator to explore and develop applications in statistics andprobability, through the use of investigations and worked examples.These examples reflect current and real-world situations. There arenumerous references to historical influences on variousdevelopments in statistics and probability. Exercises allow amplescope for development and extension of the main mathematicalprocesses.
Audience: General
Author(s): Kelly, B.
Statistics and ProbabilityCurriculum Organizer(s):Exploring Statistics with the TI-82 GraphicsCalculator
Supplier:
ISBN/Order No:
Price:
189599702X
$14.60
26 Prince Andrew PlaceDon Mills, ONM3C 2T8
Tel: 1-800-361-6128 Fax: 1-800-563-9196
Pearson Education Canada
Principle of MathematicsApplications of MathematicsEssentials of Mathematics
10 11 12Recommended for:
Copyright Year: 1994
B-37

Applications of Mathematics Grade 12 Collection
Student, Teacher ResourceCategory:
General Description: Relation plotting tool enables students tograph functions from implicit and explicit definitions, and fromrelations as well as inequalities. There is the ability to save and printgraphs, and to integrate these graphs into other documents.Includes a manual.
System requirements for Macintosh: System 6.5 or higher (System 7or higher recommended), 2 Mb RAM (4 Mb recommended).System requirements for Windows: Windows 3.1 with win32's,Windows 95, Windows 98, or Windows NT 4; 8Mb RAM.
Audience: General
Patterns and RelationsCurriculum Organizer(s):GrafEq (Macintosh/Windows Version 2.09)
Supplier:
ISBN/Order No:
Price:
(not available)
Single User: $94.50Site Licence (up to 30): $300.00
4446 Lazelle AvenueTerrace, BCV8G 1R8
Tel: (250) 638-8606 Fax: (250) 638-8606
Pedagoguery Software
Principle of MathematicsApplications of MathematicsEssentials of Mathematics
10 11 12Recommended for:
Copyright Year: 1998
Student, Teacher ResourceCategory:
General Description: Reproducible blackline masters give clearexamples and steps for using the TI-82 graphing calculator in avariety of ways. Can also be used with the TI-83 graphing calculator.
Audience: General
Author(s): Govatos, M.
Patterns and RelationsCurriculum Organizer(s):An Introduction to the TI-82 Graphing Calculator
Supplier:
ISBN/Order No:
Price:
0768200067
$18.95
23740 Howthorne BoulevardTorrance, CA90505
Tel: 1-800-421-5533 Fax: (310) 375-5090
Frank Schaffer Publications Inc.
Principle of MathematicsApplications of MathematicsEssentials of Mathematics
10 11 12Recommended for:
Copyright Year: 1998
B-38

Applications of Mathematics Grade 12 Collection
Student, Teacher ResourceCategory:
General Description: Software package for Macintosh or Windowsconsists of a CD-ROM and a user's guide. The toolkit containsgraphical tools for algebra, geometry, data analysis, and probability. Atext editor, function editor, spreadsheet editor, and matrix editor arelinked. The graphs are clear and may be transformed in a variety ofways. Probability models use dice and spinners. Includes a visualrepresentation of algebra tiles.
System requirements for Macintosh: Macintosh LC II or later, 6MbRAM and System 7.0 or higher. PowerMac system with 8Mb RAMand System 7.5 or higher recommended.System requirements for Windows 3.1: Windows 3.1 in enhancedmode, 486/33 MHz, 12Mb RAM, hard drive.System requirements Windows 95: 486/50 MHz, 12Mb RAM, harddrive. Pentium processor with 16Mb RAM recommended.
Audience: General
Author(s): Bedoya, J.Z. ... (et al.)
NumberPatterns and RelationsShape and SpaceStatistics and Probability
Curriculum Organizer(s):Secondary Math Lab Toolkit
Supplier:
ISBN/Order No:
Price:
Macintosh: 0134330439Windows: 0134330447
Each version $124.95
26 Prince Andrew PlaceDon Mills, ONM3C 2T8
Tel: 1-800-361-6128 Fax: 1-800-563-9196
Pearson Education Canada
Principle of MathematicsApplications of MathematicsEssentials of Mathematics
10 11 12Recommended for:
Copyright Year: 1998
Student, Teacher ResourceCategory:
General Description: This resource manual uses the TI-81 graphicscalculator to explore and develop applications in statistics andprobability, through the use of investigations and worked examples.These examples reflect current and real-world situations. There arenumerous references to historical influences on variousdevelopments in statistics and probability. Student exercises, most ofwhich are not calculator specific, allow ample scope fordevelopment and extension of the main mathematical processes.
Audience: General
Author(s): Kelly, B.
Statistics and ProbabilityCurriculum Organizer(s):Using the TI-81 Graphics Calculator to ExploreStatistics
Supplier:
ISBN/Order No:
Price:
0969524412
$8.95
26 Prince Andrew PlaceDon Mills, ONM3C 2T8
Tel: 1-800-361-6128 Fax: 1-800-563-9196
Pearson Education Canada
Principle of MathematicsApplications of MathematicsEssentials of Mathematics
10 11 12Recommended for:
Copyright Year: 1992
B-39
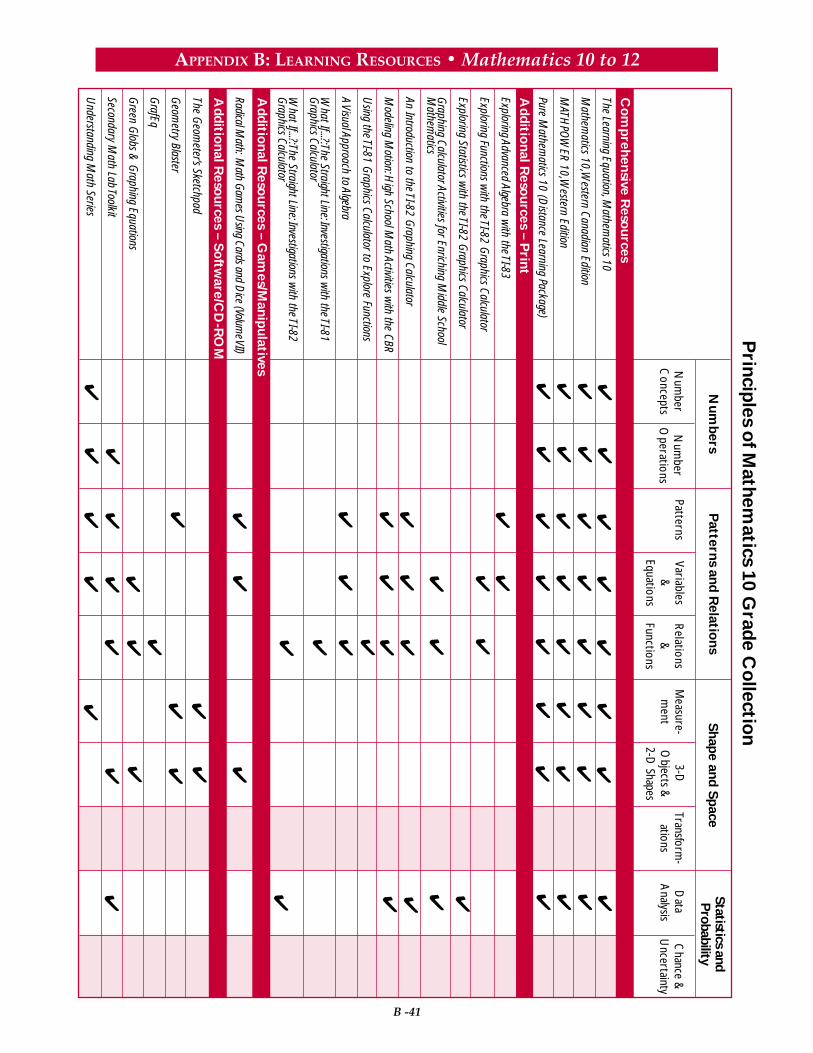
B -41
APPENDIX B: LEARNING RESOURCES • Mathematics 10 to 12
The Learning Equation, Mathem
atics 10
Mathem
atics 10, Western Canadian Edition
MATH
POW
ER 10, Western Edition
Pure Mathem
atics 10 (Distance Learning P ackage)
Exploring Advanced Algebra with the TI-83
Exploring Functions with the TI-82 G
raphics Calculator
Exploring Statistics with the TI-82 G
raphics Calculator
Graphing Calculator Activities for Enriching M
iddle SchoolM
athematics
An Introduction to the TI-82 Graphing Calculator
Modeling M
otion: High School M
ath Activities with the CBR
Using the TI-81 G
raphics Calculator to Explor e Functions
A Visual Approach to Algebra
What If...?:The Straight Line: Investigations w
ith the TI-81G
raphics Calculator
What If...?:The Straight Line: Investigations w
ith the TI-82G
raphics Calculator
Radical Math: M
ath Games U
sing Cards and Dice (Volum
e VII)
The Geom
eter’s Sketchpad
Geom
etry Blaster
GrafEq
Green G
lobs & G
raphing Equations
Secondary Math Lab Toolkit
Understanding M
ath Series
Co
mprehensive R
esources
Principles o
f Mathem
atics 10 Grade C
ollectio
n
Num
bersP
atterns and Relatio
nsS
hape and Space
Statistics andP
robability
Num
berC
onceptsN
umber
Operations
PatternsVariables
&Equations
Relations
&Functions
Measure-m
ent3-D
Objects &
2-D Shapes
Transform-
ationsD
ata A
nalysisC
hance &U
ncertainty
Additio
nal Reso
urces – Print
Additio
nal Reso
urces – So
ftware/C
D-R
OM
Additio
nal Reso
urces – Gam
es/Manipulatives


Principles of Mathematics Grade 10 Collection
Student, Teacher ResourceCategory:
General Description: Resource contains exercises and investigations thatsupplement the following topics: sequences, fractals, combinatorics,probability, linear systems, matrices, and linear programming. The keyingsequences are specific to TI-83 model of calculator.
Audience: General
Author(s): Kelly, B.
Patterns and RelationsStatistics and Probability
Curriculum Organizer(s):Exploring Advanced Algebra with theTI-83
Supplier:
ISBN/Order No:
Price:
1895997100
$15.71
26 Prince Andrew PlaceDon Mills, ONM3C 2T8
Tel: 1-800-361-6128 Fax: 1-800-563-9196
Pearson Education Canada
Principle of MathematicsApplications of MathematicsEssentials of Mathematics
10 11 12Recommended for:
Copyright Year: 1998
Student, Teacher ResourceCategory:
General Description: This resource contains exercises and investigationsthat are suitable for a wide range of student abilities. It acts as asupplement to a limited number of learning outcomes and is designed forfollow-up activities.
Audience: General
Author(s): Kelly, B.
Patterns and RelationsCurriculum Organizer(s):Exploring Functions with the TI-82Graphics Calculator
Supplier:
ISBN/Order No:
Price:
1895997003
$14.60
26 Prince Andrew PlaceDon Mills, ONM3C 2T8
Tel: 1-800-361-6128 Fax: 1-800-563-9196
Pearson Education Canada
Principle of MathematicsApplications of MathematicsEssentials of Mathematics
10 11 12Recommended for:
Copyright Year: 1993
B-43
Principles of Mathematics Grade 10 Collection
Student, Teacher ResourceCategory:
General Description: This resource manual uses the TI-82 graphicscalculator to explore and develop applications in statistics and probability,through the use of investigations and worked examples. These examplesreflect current and real-world situations. There are numerous referencesto historical influences on various developments in statistics andprobability. Exercises allow ample scope for development and extension ofthe main mathematical processes.
Audience: General
Author(s): Kelly, B.
Statistics and ProbabilityCurriculum Organizer(s):Exploring Statistics with the TI-82Graphics Calculator
Supplier:
ISBN/Order No:
Price:
189599702X
$14.60
26 Prince Andrew PlaceDon Mills, ONM3C 2T8
Tel: 1-800-361-6128 Fax: 1-800-563-9196
Pearson Education Canada
Principle of MathematicsApplications of MathematicsEssentials of Mathematics
10 11 12Recommended for:
Copyright Year: 1994
Student, Teacher ResourceCategory:
General Description: Software package for Macintosh or Windowsconsists of disks, a user's guide and reference manual, teaching notes, aquick reference, and an introductory video. Designed as a tool forteaching and exploring geometrical concepts it allows students tomanipulate geometrical figures with a hands-on approach. Sketchesdepict concrete geometry and emphasize spatial reasoning, while scriptsdescribe constructions verbally and abstractly. The program allows for theconstruction, labelling, measurement, and manipulation of any geometricfigure, as well as the exploration of geometry concepts. The teachingnotes and sample activities provide suggestions for classroom use. Severalsample investigations, explorations, demonstrations, and constructionactivities on a wide range of geometry topics are included.
System requirements for Macintosh: Macintosh Plus or later; 1Mb RAM;System 6 or later.System requirements for Windows: 4Mb RAM; 3.5" floppy disk; harddrive.System requirements for Windows 3.1 in enhanced mode.
Caution: The program defaults to inches, but it can be set tocentimetres.
Audience: General
Shape and SpaceCurriculum Organizer(s):The Geometer's Sketchpad
Supplier:
ISBN/Order No:
Price:
Macintosh version: 1-55953-098-7Windows version: 1-55953-099-5
$289.95 each version
125 Mary St.Aurora, ONL4G 1G3
Tel: (905) 841-0600 Fax: (905) 727-6265
Spectrum Educational Supplies Ltd.
Principle of MathematicsApplications of MathematicsEssentials of Mathematics
10 11 12Recommended for:
Copyright Year: 1995
B-44

Principles of Mathematics Grade 10 Collection
Student, Teacher ResourceCategory:
General Description: Interactive CD-ROM package for Macintosh orWindows includes lessons, activities, and games to teach and reinforcegeometric concepts. It uses a three-level approach, allowing a student toprogress at a beginning, an intermediate, or a mastery level. The lessons,designed for individual student use, are in three sections: teach, practise,and apply. They explore the main topics of points and lines, triangles,polygons and quadrilaterals, similarity, circles, perimeter and area, solids in3D, coordinate geometry, transformational geometry and logical reasoningand proof. Requires decision making and creative thinking by students.
System requirements for Macintosh: System 7.0 or later, 8Mb RAM.System requirements forWindows 3.1: 386/33 MHz, 8Mb RAM, Pentiumprocessor recommended, 256 super VGA or better colour monitor, soundand graphics cards, CD-ROM drive, and mouse. Printer recommended.System requirements for Windows 95: 486/50 MHz, 8Mb RAM, Pentiumprocessor recommended, 256 super VGA or better colour monitor, soundand graphics cards, CD-ROM drive, and mouse. Printer is recommended.
Audience: General
Patterns and RelationsShape and Space
Curriculum Organizer(s):Geometry Blaster
Supplier:
ISBN/Order No:
Price:
0784910634
$79.95
19840 Pioneer AvenueP.O. Box 2961Torrance, CA90503
Tel: 1-800- 545-7677 Fax: (310) 793-0601
Davidson & Associates, Inc.
Principle of MathematicsApplications of MathematicsEssentials of Mathematics
10 11 12Recommended for:
Copyright Year: 1996
Student, Teacher ResourceCategory:
General Description: Relation plotting tool enables students to graphfunctions from implicit and explicit definitions, and from relations as wellas inequalities. There is the ability to save and print graphs, and tointegrate these graphs into other documents. Includes a manual.
System requirements for Macintosh: System 6.5 or higher (System 7 orhigher recommended), 2 Mb RAM (4 Mb recommended).System requirements for Windows: Windows 3.1 with win32's, Windows95, Windows 98, or Windows NT 4; 8Mb RAM.
Audience: General
Patterns and RelationsCurriculum Organizer(s):GrafEq (Macintosh/Windows Version2.09)
Supplier:
ISBN/Order No:
Price:
(not available)
Single User: $94.50Site Licence (up to 30): $300.00
4446 Lazelle AvenueTerrace, BCV8G 1R8
Tel: (250) 638-8606 Fax: (250) 638-8606
Pedagoguery Software
Principle of MathematicsApplications of MathematicsEssentials of Mathematics
10 11 12Recommended for:
Copyright Year: 1998
B-45

Principles of Mathematics Grade 10 Collection
Student, Teacher ResourceCategory:
General Description: Twelve activities for using the TI-80, -82 and -83graphing calculators require students to gather and organize data andexplain their understanding of processes. Instructions for the use of thecalculator accompany every step.
Audience: General
Author(s): Browning, C.A.; Channell, D.E.
Patterns and RelationsStatistics and Probability
Curriculum Organizer(s):Graphing Calculator Activities forEnriching Middle School Mathematics
Supplier:
ISBN/Order No:
Price:
1886309159
$24.48
26 Prince Andrew PlaceDon Mills, ONM3C 2T8
Tel: 1-800-361-6128 Fax: 1-800-563-9196
Pearson Education Canada
Principle of MathematicsApplications of MathematicsEssentials of Mathematics
10 11 12Recommended for:
Copyright Year: 1997
Student, Teacher ResourceCategory:
General Description: User-friendly software for Macintosh or Windowsgraphs different forms of linear, quadratic, polynomial, and trigonometricrelations. A second program provides a graph and requires the student toenter the equation. There are also two games that act as motivationaltools. Five graphs can be displayed simultaneously. The accompanyingteacher's guide provides ideas and worksheets.
System requirements for Macintosh: System 6.0.5 or higher (System 7recommended), 1 Mb RAM.System requirements for Windows 3.1: Windows 3.1, 486/25 MHz orbetter, 2 Mb RAM; 256 colour monitor.System requirements for Windows 95: 486DX/50 MHz or higher (Pentiumrecommended), 4 Mb RAM, 256 colour monitor.
Audience: General
Patterns and RelationsShape and Space
Curriculum Organizer(s):Green Globs & Graphing Equations
Supplier:
ISBN/Order No:
Price:
(not available)
$129.95 each version
164 Commander BoulevardScarborough, ONM1S 3C7
Tel: 1-800-667-1115 Fax: (416) 293-9009
Gage Educational Publishing Co. (Scarborough)
Principle of MathematicsApplications of MathematicsEssentials of Mathematics
10 11 12Recommended for:
Copyright Year: 1997
B-46
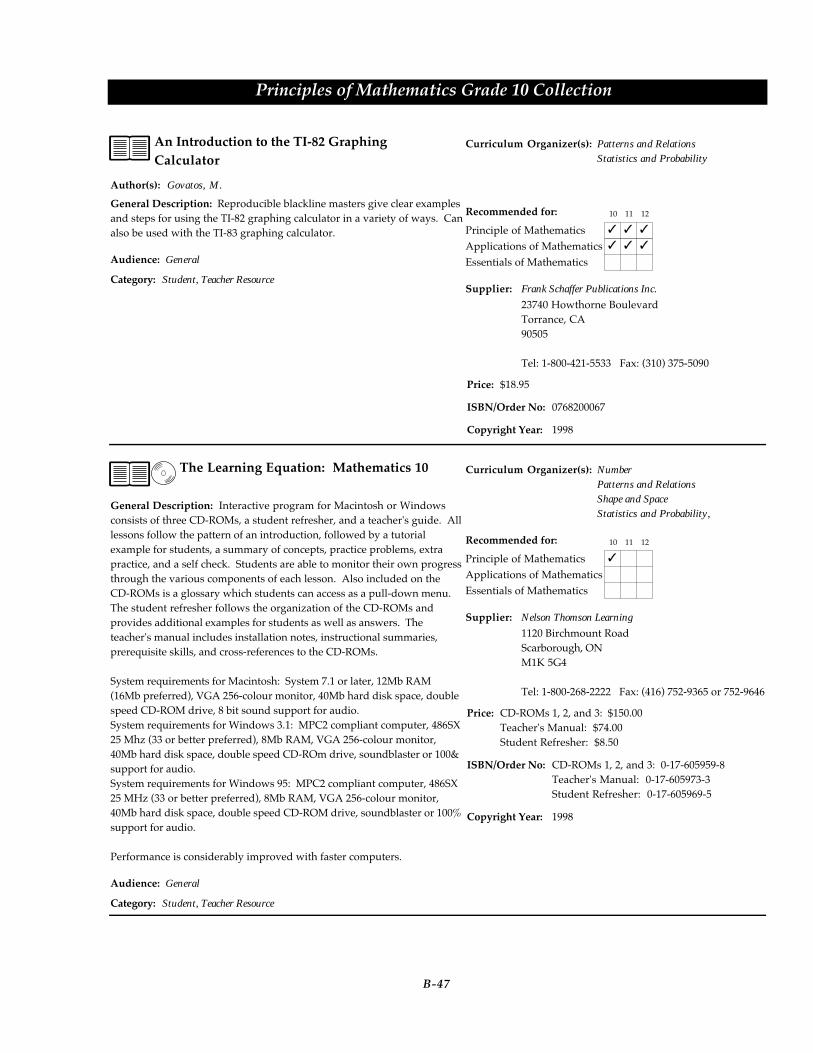
Principles of Mathematics Grade 10 Collection
Student, Teacher ResourceCategory:
General Description: Reproducible blackline masters give clear examplesand steps for using the TI-82 graphing calculator in a variety of ways. Canalso be used with the TI-83 graphing calculator.
Audience: General
Author(s): Govatos, M.
Patterns and RelationsStatistics and Probability
Curriculum Organizer(s):An Introduction to the TI-82 GraphingCalculator
Supplier:
ISBN/Order No:
Price:
0768200067
$18.95
23740 Howthorne BoulevardTorrance, CA90505
Tel: 1-800-421-5533 Fax: (310) 375-5090
Frank Schaffer Publications Inc.
Principle of MathematicsApplications of MathematicsEssentials of Mathematics
10 11 12Recommended for:
Copyright Year: 1998
Student, Teacher ResourceCategory:
General Description: Interactive program for Macintosh or Windowsconsists of three CD-ROMs, a student refresher, and a teacher's guide. Alllessons follow the pattern of an introduction, followed by a tutorialexample for students, a summary of concepts, practice problems, extrapractice, and a self check. Students are able to monitor their own progressthrough the various components of each lesson. Also included on theCD-ROMs is a glossary which students can access as a pull-down menu.The student refresher follows the organization of the CD-ROMs andprovides additional examples for students as well as answers. Theteacher's manual includes installation notes, instructional summaries,prerequisite skills, and cross-references to the CD-ROMs.
System requirements for Macintosh: System 7.1 or later, 12Mb RAM(16Mb preferred), VGA 256-colour monitor, 40Mb hard disk space, doublespeed CD-ROM drive, 8 bit sound support for audio.System requirements for Windows 3.1: MPC2 compliant computer, 486SX25 Mhz (33 or better preferred), 8Mb RAM, VGA 256-colour monitor,40Mb hard disk space, double speed CD-ROm drive, soundblaster or 100&support for audio.System requirements for Windows 95: MPC2 compliant computer, 486SX25 MHz (33 or better preferred), 8Mb RAM, VGA 256-colour monitor,40Mb hard disk space, double speed CD-ROM drive, soundblaster or 100%support for audio.
Performance is considerably improved with faster computers.
Audience: General
NumberPatterns and RelationsShape and SpaceStatistics and Probability,
Curriculum Organizer(s):The Learning Equation: Mathematics 10
Supplier:
ISBN/Order No:
Price:
CD-ROMs 1, 2, and 3: 0-17-605959-8Teacher's Manual: 0-17-605973-3Student Refresher: 0-17-605969-5
CD-ROMs 1, 2, and 3: $150.00Teacher's Manual: $74.00Student Refresher: $8.50
1120 Birchmount RoadScarborough, ONM1K 5G4
Tel: 1-800-268-2222 Fax: (416) 752-9365 or 752-9646
Nelson Thomson Learning
Principle of MathematicsApplications of MathematicsEssentials of Mathematics
10 11 12Recommended for:
Copyright Year: 1998
B-47
Principles of Mathematics Grade 10 Collection
Student, Teacher ResourceCategory:
General Description: This resource package closely maps the content ofthe Common Curriculum Framework. A student text, teacher's resourcebook, an optional template and data kit, an optional exercise database, anoptional exercise and problem bank, and an optional independent studyguide use a problem-solving approach. Open-ended questions aredesigned to help students express their ideas about mathematics orallyand in writing. Group work, manipulatives, and technology are utilizedwhere appropriate. Student text uses an inquiry approach andincorporates graphing calculators and software use. The teacher'sresource book includes comprehensive teaching notes, blackline masters,additional exercises, a graphing handbook with reproducible graphingcalculator activities, and a CD-ROM with solutions. The optionaltemplates and data kit includes four databases, spreadsheet templates,and a teacher's guide with tutorials and additional technology activities.The exercise database provides 2400 electronic multiple choice questions.The independent study guide provides supplementary explanations,examples, and self-tests. The exercise and problem bank was reviewed fortechnical considerations only. Manipulatives, such as algebra tiles andsuitable software, necessary for using the resource effectively, are notsupplied with the resource. References are made in both the student andteacher materials to specific Internet web sites which have not beenevaluated.
System requirements for software components:
Macintosh: 68020 or greater processor, Mac OS 7.0 or later, 7 MB RAMminimum, 5 MB hard drive space plus 7 MB temporary drive spaceavailable during installation, 256 colour 13-inch monitor, 2X CD drive orbetter.Windows 3.1: 386DX/33 MHz minimum, 4 MB RAM minimum, 5 MBhard drive space plus 7 MB temporary drive space available duringinstallation, 256 colour 13-inch monitor, 2X CD drive or better.Windows 95: 486DX/50 MHz (Pentium recommended), 4 MB RAMminimum, 5 MB hard drive space plus 7 MB temporary drive spaceavailable during installation, 256 colour 13-inch monitor, 2X CD drive orbetter.
Audience: General
Author(s): Alexander, R.; ... (et al.)
NumberPatterns and RelationsShape and SpaceStatistics and Probability
Curriculum Organizer(s):Mathematics 10, Western CanadianEdition
Supplier:
ISBN/Order No:
Price:
Student Text: 0201346192Teacher's Res Bk/CD-ROM: 0201346214
Student Text: $49.95Teacher's Res Bk/CD-ROM: $119.95
26 Prince Andrew PlaceDon Mills, ONM3C 2T8
Tel: 1-800-361-6128 Fax: 1-800-563-9196
Pearson Education Canada
Principle of MathematicsApplications of MathematicsEssentials of Mathematics
10 11 12Recommended for:
Copyright Year: 1998
B-48

Principles of Mathematics Grade 10 Collection
Student, Teacher ResourceCategory:
General Description: This resource package, consisting of a student text,teacher's resource, and an optional computer data bank, computerizedassessment bank, set of blackline masters, and solutions manual, closelymaps the content and philosophy of the Common CurriculumFramework. The Framework's mathematical processes are woventhroughout the resource. Mathematical concepts relate to real-worldsituations. Concepts and skills are presented in problem-solving contexts,and questions are designed to help students express their ideas aboutmathematics orally and in writing. Group work, manipulatives, andtechnology are utilized where appropriate. Student text uses an inquiryapproach and incorporates graphing calculators and software use. Theteacher's resource contains extensive teaching notes. The computerdatabank comprises five databases together with a teacher's resource. AWindows Test Bank provides about 50 questions per chapter, but does notinclude a tracking system. The blackline masters supplement the studenttext and the teacher's resource. The solutions manual gives step-by-stepsolutions to every question from the student text. Manipulatives, such asalgebra tiles and suitable software, are necessary for using the resourceeffectively; these are not supplied with the resource. References aremade in both the student and teacher materials to specific Internetwebsites which have not been evaluated.
System requirements for Windows 95: 486DX/66 MHz, Pentium processorrecommended, 8Mb RAM, mouse, either Claris Works or Microsoft Works.System requirements for Windows 3.1: 486DX/66 MHz, Pentiumprocessor recommended, 5Mb RAM (8Mb recommended), MicrosoftWorks. Windows 95 recommended. For those using the 486DX chip, amath coprocessor is required to use the computerized assessment bank.The bank can be operated with all Pentium chips.
Audience: General
Author(s): Angel, P.; ... (et al.)
NumberPatterns and RelationsShape and SpaceStatistics and Probability
Curriculum Organizer(s):MATHPOWER 10, Western Edition
Supplier:
ISBN/Order No:
Price:
Student Text: 0075525968Teacher's Resource: 0075525976
Student Text: $51.38Teacher's Resource: $115.50
300 Water StreetWhitby, ONL1N 9B6
Tel: 1-800-565-5758 (orders only) Fax:1-800-463-5885
McGraw-Hill Ryerson Ltd. (Ontario)
Principle of MathematicsApplications of MathematicsEssentials of Mathematics
10 11 12Recommended for:
Copyright Year: 1998
B-49

Principles of Mathematics Grade 10 Collection
Student, Teacher ResourceCategory:
General Description: This resource includes investigation activities thatuse the calculator-based ranger (CBR) to obtain data from physicalphenomena. Using a TI-82 or TI-83 graphing calculator, students obtain amathematical equation to describe the physical event(s). Topics includearithmetic and geometric growth, systems of linear equations in twovariables, quadratic functions, and exponential functions. The resourceprovides practice data to enable students to complete the investigationswithout a CBR, if necessary.
Audience: General
Author(s): Antinone, L.; Gough, S.
Patterns and RelationsStatistics and Probability
Curriculum Organizer(s):Modeling Motion: High School MathActivities with the CBR
Supplier:
ISBN/Order No:
Price:
1886309140
$16.83
26 Prince Andrew PlaceDon Mills, ONM3C 2T8
Tel: 1-800-361-6128 Fax: 1-800-563-9196
Pearson Education Canada
Principle of MathematicsApplications of MathematicsEssentials of Mathematics
10 11 12Recommended for:
Copyright Year: 1997
Student, Teacher ResourceCategory:
General Description: This resource, designed for distance education,includes five modules with assignements, as well as a learning facilitator'smanual. The materials are designed to be used in conjunction with theMATHPOWER 10 text. Manipulatives must be purchased separately.
Audience: General
NumberPatterns and RelationsShape and SpaceStatistics and Probability
Curriculum Organizer(s):Pure Mathematics 10 (Distance LearningPackage)
Supplier:
ISBN/Order No:
Price:
(not available)
Modules: $18.60 eachAssignment Booklets: $10.00Learning Facilitator's Manual: $60.00
12360-142 StreetEdmonton, ABT5L 4X9
Tel: (780) 427-5775 Fax: (780) 422-9750
Learning Resources Distributing Centre
Principle of MathematicsApplications of MathematicsEssentials of Mathematics
10 11 12Recommended for:
Copyright Year: 1999
B-50

Principles of Mathematics Grade 10 Collection
Student, Teacher ResourceCategory:
General Description: This resource offers some unique activities thatencourage the processes of communication, estimation and mentalmathematics, problem solving, reasoning, and visualization. Many of theactivities can be used to help students achieve fluency in such topics aspolynomial manipulations and the use of equivalent forms of expressionscontaining radicals. Includes ten special dice.
Audience: General
Author(s): Currah, J.; Felling, J.; Lachance, N.
Patterns and RelationsShape and Space
Curriculum Organizer(s):Radical Math: Math Games UsingCards and Dice (Volume VII)
Supplier:
ISBN/Order No:
Price:
0075525992
$36.00
3930-78 AvenueEdmonton, ABT6B 2W4
Tel: (780) 440-6284 Fax: (780) 440-1619
Box Cars & One-Eyed Jacks
Principle of MathematicsApplications of MathematicsEssentials of Mathematics
10 11 12Recommended for:
Copyright Year: 1996
Student, Teacher ResourceCategory:
General Description: Software package for Macintosh or Windowsconsists of a CD-ROM and a user's guide. The toolkit contains graphicaltools for algebra, geometry, data analysis, and probability. A text editor,function editor, spreadsheet editor, and matrix editor are linked. Thegraphs are clear and may be transformed in a variety of ways. Probabilitymodels use dice and spinners. Includes a visual representation of algebratiles.
System requirements for Macintosh: Macintosh LC II or later, 6Mb RAMand System 7.0 or higher. PowerMac system with 8Mb RAM and System7.5 or higher recommended.System requirements for Windows 3.1: Windows 3.1 in enhanced mode,486/33 MHz, 12Mb RAM, hard drive.System requirements for Windows 95: 486/50 MHz, 12Mb RAM, harddrive. Pentium processor with 16Mb RAM recommended.
Audience: General
Author(s): Bedoya, J.Z.; ... (et al.)
NumberPatterns and RelationsShape and SpaceStatistics and Probability
Curriculum Organizer(s):Secondary Math Lab Toolkit
Supplier:
ISBN/Order No:
Price:
Macintosh version: 0134330439Windows version: 0134330447
$124.95 each version
26 Prince Andrew PlaceDon Mills, ONM3C 2T8
Tel: 1-800-361-6128 Fax: 1-800-563-9196
Pearson Education Canada
Principle of MathematicsApplications of MathematicsEssentials of Mathematics
10 11 12Recommended for:
Copyright Year: 1998
B-51

Principles of Mathematics Grade 10 Collection
Student, Teacher ResourceCategory:
General Description: CD-ROM series for Macintosh or Windows assistsstudents in developing an understanding of mathematics concepts basedon a solid foundation of concrete activities. Topics include fractions,integers, exponents, algebra, equations, coordinate geometry and graphing,and percent. For each topic the program contains concept sections withexplanation, example sections, practice sections, and cumulative checks.The user is in control through pull-down menus and proceed and go-backbuttons. Each program includes a teacher manual.
System requirements for Macintosh: 68020 or faster processor, includingPower Macintosh, Macintosh 7.5.1 or later, 40 Mb hard drive space orCD-ROM drive.System requirements for Windows: Windows 3.1, Windows 95, WindowsNT3.51 or 4.0; 486DX2-66 (Pentium recommended); 640x480 with 256colour display (or higher); 40 Mb hard drive space or CD-ROM drive.
Audience: GeneralLD - can be used for remediation
NumberPatterns and RelationsShape and Space
Curriculum Organizer(s):Understanding Math Series
Supplier:
ISBN/Order No:
Price:
(not available)
$79.95 each
164 Commander BoulevardScarborough, ONM1S 3C7
Tel: 1-800-667-1115 Fax: (416) 293-9009
Gage Educational Publishing Co. (Scarborough)
Principle of MathematicsApplications of MathematicsEssentials of Mathematics
10 11 12Recommended for:
Copyright Year: 1996
Student, Teacher ResourceCategory:
General Description: This resource manual includes exercises andinvestigations using the TI-81 graphics calculator and is suitable for a widerange of student abilities. It provides a supplement to a limited number oflearning outcomes and is designed for follow-up activities.
Audience: General
Author(s): Kelly, B.
Patterns and RelationsCurriculum Organizer(s):Using the TI-81 Graphics Calculator toExplore Functions
Supplier:
ISBN/Order No:
Price:
0969524404
$8.95
26 Prince Andrew PlaceDon Mills, ONM3C 2T8
Tel: 1-800-361-6128 Fax: 1-800-563-9196
Pearson Education Canada
Principle of MathematicsApplications of MathematicsEssentials of Mathematics
10 11 12Recommended for:
Copyright Year: 1991
B-52

Principles of Mathematics Grade 10 Collection
Student, Teacher ResourceCategory:
General Description: Supplementary activity book uses an investigativeapproach to introduce concepts related to the relationships amonggraphing, scale, data, and algebra. Student activity worksheets,accompanied by teacher notes, can be used as introductory or extensionmaterial. Includes the use of a graphing calculator for some activities.Imperial measurement is used in problem solving situations.
Audience: General
Author(s): Van Dyke, F.
Patterns and RelationsCurriculum Organizer(s):A Visual Approach to Algebra
Supplier:
ISBN/Order No:
Price:
1572324414
$20.92
26 Prince Andrew PlaceDon Mills, ONM3C 2T8
Tel: 1-800-361-6128 Fax: 1-800-563-9196
Pearson Education Canada
Principle of MathematicsApplications of MathematicsEssentials of Mathematics
10 11 12Recommended for:
Copyright Year: 1998
Student, Teacher ResourceCategory:
General Description: This resource explores the straight line, dependentupon using the TI-81 graphics calculator. It shows students how to plotlinear equations, how to make changes to the variable, and uses thequestion "what if ...?" to pose multiple problems within a single context.Students are encouraged to compare their answers and to predictoutcomes.
Audience: General
Author(s): Alexander, B.
Patterns and RelationsCurriculum Organizer(s):What If ...?: The Straight Line:Investigations with the TI-81 GraphicsCalculator
Supplier:
ISBN/Order No:
Price:
0969698100
$12.30
26 Prince Andrew PlaceDon Mills, ONM3C 2T8
Tel: 1-800-361-6128 Fax: 1-800-563-9196
Pearson Education Canada
Principle of MathematicsApplications of MathematicsEssentials of Mathematics
10 11 12Recommended for:
Copyright Year: 1993
B-53

Principles of Mathematics Grade 10 Collection
Student, Teacher ResourceCategory:
General Description: This resource explores the straight line, dependentupon using the TI-82 graphics calculator. It shows students how to plotlinear equations, how to make changes to the variable, and uses thequestion "what if ...?" to pose multiple problems within a single context.Students are encouraged to compare their answers and to predictoutcomes. This resource also introduces the concept of the line of best fit.
Audience: General
Author(s): Alexander, B.
Patterns and RelationsStatistics and Probability
Curriculum Organizer(s):What If ...?: The Straight Line:Investigations with the TI-82 GraphicsCalculator
Supplier:
ISBN/Order No:
Price:
0969698135
$12.30
26 Prince Andrew PlaceDon Mills, ONM3C 2T8
Tel: 1-800-361-6128 Fax: 1-800-563-9196
Pearson Education Canada
Principle of MathematicsApplications of MathematicsEssentials of Mathematics
10 11 12Recommended for:
Copyright Year: 1994
B-54

B-55
APPENDIX B: LEARNING RESOURCES • Mathematics 10 to 12
Co
mprehensive R
esources
Principles o
f Mathem
atics 11 Grade C
ollectio
n
Num
bersP
atterns and Relatio
nsS
hape and Space
Statistics andP
robability
Num
berC
onceptsN
umber
Operations
PatternsVariables
&Equations
Relations
&Functions
Measure-m
ent3-D
Objects &
2-D Shapes
Transform-
ationsD
ata A
nalysisC
hance &U
ncertainty
Additio
nal Reso
urces – So
ftware/C
D-R
OM
Mathem
atics 11, Western Canadian Edition
MATH
POW
ER 11, Western Edition
Explore Quadratic Functions w
ith the TI-83 or TI-82
Exploring Functions with the TI-82 G
raphics Calculator
An Introduction to the TI-82 Graphing Calculator
Modeling M
otion: High School M
ath Activities with
the CBR
Using the TI-81 G
raphics Calculator to ExploreFunctions
What If...?:The Straight Line: Investigations w
ith theTI-81 G
raphics Calculator
The Geom
eter’s Sketchpad
Geom
etry Blaster
GrafEq
Green G
lobs & G
raphing Equations
Secondary Math Lab Toolkit
ZAP-A-G
RAPH
Additio
nal Reso
urces – Print


Principles of Mathematics Grade 11 Collection
Student, Teacher ResourceCategory:
General Description: Manual can be used for applying graphingcalculator technology to the exploration of quadratic functions andequations. It contains concise and precise instructions on relevant keyingsequences. There are many "window" diagrams showing input andoutput screens. Problems posed relate to real-world situations andprovide ample opportunities for discussion, exploration, and extension of avariety of situations beyond the routine. The resource uses keyingsequences that are specific to the TI-83 and TI-82 models of calculator.
Audience: General
Author(s): Alexander, B.
Patterns and RelationsCurriculum Organizer(s):Explore Quadratic Functions with theTI-83 or TI-82
Supplier:
ISBN/Order No:
Price:
0969698143
$17.95
26 Prince Andrew PlaceDon Mills, ONM3C 2T8
Tel: 1-800-361-6128 Fax: 1-800-563-9196
Pearson Education Canada
Principle of MathematicsApplications of MathematicsEssentials of Mathematics
10 11 12Recommended for:
Copyright Year: 1997
Student, Teacher ResourceCategory:
General Description: This resource contains exercises and investigationsthat are suitable for a wide range of student abilities. It acts as asupplement to a limited number of learning outcomes and is designed forfollow-up activities.
Audience: General
Author(s): Kelly, B.
Patterns and RelationsCurriculum Organizer(s):Exploring Functions with the TI-82Graphics Calculator
Supplier:
ISBN/Order No:
Price:
1895997003
$14.60
26 Prince Andrew PlaceDon Mills, ONM3C 2T8
Tel: 1-800-361-6128 Fax: 1-800-563-9196
Pearson Education Canada
Principle of MathematicsApplications of MathematicsEssentials of Mathematics
10 11 12Recommended for:
Copyright Year: 1993
B-57
Principles of Mathematics Grade 11 Collection
Student, Teacher ResourceCategory:
General Description: This software package for Macintosh or Windowsconsists of disks, a user's guide and reference manual, teaching notes, aquick reference, and an introductory video. It is designed as a tool forteaching and exploring geometrical concepts and allows students tomanipulate geometrical figures with a hands-on approach. Thesketchpad models geometry in two linked views. Sketches depictconcrete geometry and emphasize spatial reasoning, while scripts describeconstructions verbally and abstractly. The teaching notes and sampleactivities provide suggestions for classroom use. Several sampleinvestigations, explorations, demonstrations, and construction activities ona wide range of geometry topics are included. The instructional videosupports both Macintosh and Windows.
System requirements for Macintosh: Macintosh Plus or later; 1Mb RAM;System 6 or later.System requirements for Windows: 4Mb RAM; 3.5" floppy disk; harddrive. Windows 3.1 in enhanced mode.
Caution: The program defaults to inches, but it can be set tocentimetres.
Audience: General
Shape and SpaceCurriculum Organizer(s):The Geometer's Sketchpad
Supplier:
ISBN/Order No:
Price:
Macintosh version: 1-55953-098-7Windows version: 1-55953-099-5
$289.95 each version
125 Mary St.Aurora, ONL4G 1G3
Tel: (905) 841-0600 Fax: (905) 727-6265
Spectrum Educational Supplies Ltd.
Principle of MathematicsApplications of MathematicsEssentials of Mathematics
10 11 12Recommended for:
Copyright Year: 1995
Student, Teacher ResourceCategory:
General Description: Interactive CD-ROM package for Macintosh orWindows includes lessons, activities, and games to teach and reinforcegeometric concepts. It uses a three-level approach, allowing a student toprogress at a beginning, an intermediate, or a mastery level. The lessons,designed for individual student use, are in three sections: teach, practise,and apply. They explore the main topics of points and lines, triangles,polygons and quadrilaterals, similarity, circles, perimeter and area, solids in3D, coordinate geometry, transformational geometry and logical reasoningand proof. The program is interactive and requires decision making andcreative thinking by students.
System requirements for Macintosh: System 7.0 or later, 8Mb RAM.System requirements for Windows 3.1: 386/33 MHz, 8Mb RAM, Pentiumprocessor recommended, 256 super VGA or better colour monitor, soundand graphics cards, CD drive, and mouse. Printer recommended.System requirements for Windows 95: 486/50 MHz, 8Mb RAM, Pentiumprocessor recommended, 256 super VGA or better colour monitor, soundand graphics cards, CD drive, and mouse. Printer is recommended.
Audience: General
Shape and SpacePatterns and Relations
Curriculum Organizer(s):Geometry Blaster
Supplier:
ISBN/Order No:
Price:
0784910634
$79.95
19840 Pioneer AvenueP.O. Box 2961Torrance, CA90503
Tel: 1-800- 545-7677 Fax: (310) 793-0601
Davidson & Associates, Inc.
Principle of MathematicsApplications of MathematicsEssentials of Mathematics
10 11 12Recommended for:
Copyright Year: 1996
B-58

Principles of Mathematics Grade 11 Collection
Student, Teacher ResourceCategory:
General Description: Relation plotting tool enables students to graphfunctions from implicit and explicit definitions, and from relations as wellas inequalities. There is the ability to save and print graphs, and tointegrate these graphs into other documents. Includes a manual.
System requirements for Macintosh: System 6.5 or higher (System 7 orhigher recommended), 2 Mb RAM (4 Mb recommended).System requirements for Windows: Windows 3.1 with win32's, Windows95, Windows 98, or Windows NT 4; 8Mb RAM.
Audience: General
Patterns and RelationsCurriculum Organizer(s):GrafEq (Macintosh/Windows Version2.09)
Supplier:
ISBN/Order No:
Price:
(not available)
Single User: $94.50Site Licence (up to 30): $300.00
4446 Lazelle AvenueTerrace, BCV8G 1R8
Tel: (250) 638-8606 Fax: (250) 638-8606
Pedagoguery Software
Principle of MathematicsApplications of MathematicsEssentials of Mathematics
10 11 12Recommended for:
Copyright Year: 1998
Student, Teacher ResourceCategory:
General Description: User-friendly software for Macintosh or Windowsgraphs different forms of linear, quadratic, polynomial, and trigonometricrelations. A second program provides a graph and requires the student toenter the equation. There are also two games that act as motivationaltools. Five graphs can be displayed simultaneously. The accompanyingteacher's guide provides ideas and worksheets.
System requirements for Macintosh: System 6.0.5 or higher (System 7recommended), 1 Mb RAM.System requirements for Windows 3.1: Windows 3.1, 486/25 MHz orbetter, 2 Mb RAM; 256 colour monitor.System requirements for Windows 95: 486DX/50 MHz or higher (Pentiumrecommended), 4 Mb RAM, 256 colour monitor.
Audience: General
Patterns and RelationsShape and Space
Curriculum Organizer(s):Green Globs & Graphing Equations
Supplier:
ISBN/Order No:
Price:
(not available)
$129.95 each version
164 Commander BoulevardScarborough, ONM1S 3C7
Tel: 1-800-667-1115 Fax: (416) 293-9009
Gage Educational Publishing Co. (Scarborough)
Principle of MathematicsApplications of MathematicsEssentials of Mathematics
10 11 12Recommended for:
Copyright Year: 1997
B-59
Principles of Mathematics Grade 11 Collection
Student, Teacher ResourceCategory:
General Description: Reproducible blackline masters give clear examplesand steps for using the TI-82 graphing calculator in a variety of ways. Canalso be used with the TI-83 graphing calculator.
Audience: General
Author(s): Govatos, M.
Patterns and RelationsStatistics and Probability
Curriculum Organizer(s):An Introduction to the TI-82 GraphingCalculator
Supplier:
ISBN/Order No:
Price:
0768200067
$18.95
23740 Howthorne BoulevardTorrance, CA90505
Tel: 1-800-421-5533 Fax: (310) 375-5090
Frank Schaffer Publications Inc.
Principle of MathematicsApplications of MathematicsEssentials of Mathematics
10 11 12Recommended for:
Copyright Year: 1998
B-60

Principles of Mathematics Grade 11 Collection
Student, Teacher ResourceCategory:
General Description: Resource package, consisting of a student text, ateacher's resource book, an optional independent study guide, and anoptional Template and Data Kit, closely maps the curriculum and uses aproblem-solving approach. The student text uses an inquiry approachand incorporates graphing calculators and software use. The independentstudy guide provides supplementary explanations, examples, andself-tests. The teacher's resource book includes comprehensive teachingnotes, blackline masters, additional exercises, a graphing handbook withreproducible graphing calculator activities, and a CD-ROM with solutions.The optional template and data kit includes five databases, spreadsheettemplates, and a teacher's guide with tutorials and additional technologyactivities. Manipulatives, such as algebra tiles and suitable software,necessary for using the resource effectively, are not supplied with theresource. References are made in both the student and teacher materialsto specific Internet websites which have not been evaluated.
System requirements for Teacher's Resource Book CD-ROM:
Macintosh: 68020 or greater processor, Mac OS 7.0 or later, 7 Mb RAMminimum, 5 Mb hard drive space plus 7 Mb temporary drive spaceavailable during installation, 256 colour 13-inch monitor, 2X CD drive orbetter.Windows 3.1: 386DX/33 MHz minimum, 4 Mb RAM minimum, 5 Mbhard drive space plus 7 Mb temporary drive space available duringinstallation, 256 colour 13-inch monitor, 2X CD drive or better.Windows 95: 486DX/50 MHz (Pentium recommended), 4 Mb RAMminimum, 5 Mb hard drive space plus 7 Mb temporary drive spaceavailable during installation, 256 colour 13-inch monitor, 2X CD drive orbetter.
System requirements for Template and Data Kit:
Macintosh: System 6.0.5 or higher, 4 Mb RAM, mouse, ClarisWorks.Windows 3.1: 386DX/33 MHz minimum, 4 Mb RAM (8 Mbrecommended), either Microsoft Works or ClarisWorks. Windows 95recommended.Windows 95: 486/50 MHz (Pentium recommended), 8 Mb RAM (16 Mbrecommended), mouse, either ClarisWorks, Microsoft Works or MicrosoftExcel/Acces.
Audience: General
Author(s): Alexander, R. et al.
NumberPatterns and RelationShape and SpaceStatistics and Probability
Curriculum Organizer(s):Mathematics 11, Western CanadianEdition
Supplier:
ISBN/Order No:
Price:
Student Text: 0201346249Teacher's Resource Book: 0201346265Independent Study Guide: 0201346257Template and Data Kit: 0201395495
Student Text: $51.95Teacher's Resource Book: $121.64Independent Study Guide: $5.67Template and Data Kit: $131.15
26 Prince Andrew PlaceDon Mills, ONM3C 2T8
Tel: 1-800-361-6128 Fax: 1-800-563-9196
Pearson Education Canada
Principle of MathematicsApplications of MathematicsEssentials of Mathematics
10 11 12Recommended for:
Copyright Year: 1998
B-61

Principles of Mathematics Grade 11 Collection
Student, Teacher ResourceCategory:
General Description: Resource closely maps the content and philosophyof the curriculum. The Framework's Mathematical processes are woventhroughout. Mathematical concepts relate to real-world situations.Concepts and skills are presented in problem-solving contexts, andquestions are designed to help students express their ideas aboutmathematics orally and in writing. Utilizes groupwork, manipulatives,and technology where appropriate. The student text uses an inquiryapproach and includes practice exercises. The Teacher's Resource manualcontains prerequisite skills, outcomes, suggestions for lessons and activities,answers to textbook questions, and instructions on the use of the TI-83graphing calculator. Optional components include Blackline masters(which may be used regardless of the text being used by the class), acomputer testbank, and a Solutions manual. Manipulatives must bepurchased separately. References are made to specific Internet websiteswhich have not been evaluated.
System requirements for Windows: Windows 95 minimum, 486 processoror later, 8 Mb RAM, 4X CD-ROM drive, ClarisWorks 4.0 for Windows orhigher. For use on ClarisWorks 4.0 (Windows 950; Microsoft Works 4.0(Windows 95); ClarisWorks 5.0 (Macintosh OS 7.0); Microsoft Access 97(Windows 95).
Caution: The teacher's Resource Manual contains few solutions to Clevel questions in the student text.Teachers may find that the time required to become familiar with theData Bank software makes it difficult to supplement.
Audience: General
Author(s): Knill, G. ... (et al.)
NumberPatterns and RelationsShape and Space
Curriculum Organizer(s):MATHPOWER 11, Western Edition
Supplier:
ISBN/Order No:
Price:
Student Text: 0075525984Teacher's Edition: 0075525992
Student Text: $51.95Teacher's Edition: $54.57
300 Water StreetWhitby, ONL1N 9B6
Tel: 1-800-565-5758 (orders only) Fax:1-800-463-5885
McGraw-Hill Ryerson Ltd. (Ontario)
Principle of MathematicsApplications of MathematicsEssentials of Mathematics
10 11 12Recommended for:
Copyright Year: 1999
Student, Teacher ResourceCategory:
General Description: This resource includes investigation activities thatuse the calculator-based ranger (CBR) to obtain data from physicalphenomena. Using a TI-82 or TI-83 graphing calculator, students obtain amathematical equation to describe the physical event(s). Topics includearithmetic and geometric growth, systems of linear equations in twovariables, quadratic functions, and exponential functions. The resourceprovides practice data to enable students to complete the investigationswithout a CBR, if necessary.
Audience: General
Author(s): Antinone, L.; Gough, S.
Patterns and RelationsStatistics and Probability
Curriculum Organizer(s):Modeling Motion: High School MathActivities with the CBR
Supplier:
ISBN/Order No:
Price:
1886309140
$16.83
26 Prince Andrew PlaceDon Mills, ONM3C 2T8
Tel: 1-800-361-6128 Fax: 1-800-563-9196
Pearson Education Canada
Principle of MathematicsApplications of MathematicsEssentials of Mathematics
10 11 12Recommended for:
Copyright Year: 1997
B-62

Principles of Mathematics Grade 11 Collection
Student, Teacher ResourceCategory:
General Description: This resource, designed for distance education,includes six modules with assignements, as well as a learning facilitator'smanual. The materials are designed to be used in conjunction with theMATHPOWER 11 text. Manipulatives must be purchased separately.
Audience: General
NumberPatterns and RelationsShape and Space
Curriculum Organizer(s):Pure Mathematics 20 (Distance LearningPackage)
Supplier:
ISBN/Order No:
Price:
(not available)
Modules: $16.10Assignment Booklets: $12.00Learning Facilitator's Manual: $60.00
12360-142 StreetEdmonton, ABT5L 4X9
Tel: (780) 427-5775 Fax: (780) 422-9750
Learning Resources Distributing Centre
Principle of MathematicsApplications of MathematicsEssentials of Mathematics
10 11 12Recommended for:
Copyright Year: 1999
Student, Teacher ResourceCategory:
General Description: Software package for Macintosh or Windowsconsists of a CD-ROM and a user's guide. The toolkit contains graphicaltools for algebra, geometry, data analysis, and probability. A text editor,function editor, spreadsheet editor, and matrix editor are linked. Thegraphs are clear and may be transformed in a variety of ways. Probabilitymodels use dice and spinners. Includes a visual representation of algebratiles.
System requirements for Macintosh: Macintosh LC II or later, 6Mb RAMand System 7.0 or higher. PowerMac system with 8Mb RAM and System7.5 or higher recommended.System requirements for Windows 3.1: Windows 3.1 in enhanced mode,486/33 MHz, 12Mb RAM, hard drive.System requirements for Windows 95: 486/50 MHz, 12Mb RAM, harddrive. Pentium processor with 16Mb RAM recommended.
Audience: General
Author(s): Bedoya, J.Z. ... (et al.)
NumberPatterns and RelationsShape and Space
Curriculum Organizer(s):Secondary Math Lab Toolkit
Supplier:
ISBN/Order No:
Price:
Macintosh version: 0134330439Windows version: 0134330447
$124.95 each version
26 Prince Andrew PlaceDon Mills, ONM3C 2T8
Tel: 1-800-361-6128 Fax: 1-800-563-9196
Pearson Education Canada
Principle of MathematicsApplications of MathematicsEssentials of Mathematics
10 11 12Recommended for:
Copyright Year: 1998
B-63
Principles of Mathematics Grade 11 Collection
Student, Teacher ResourceCategory:
General Description: This resource manual includes exercises andinvestigations using the TI-81 graphics calculator and is suitable for a widerange of student abilities. It provides a supplement to a limited number oflearning outcomes and is designed for follow-up activities.
Audience: General
Author(s): Kelly, B.
Patterns and RelationsCurriculum Organizer(s):Using the TI-81 Graphics Calculator toExplore Functions
Supplier:
ISBN/Order No:
Price:
0969524404
$8.95
26 Prince Andrew PlaceDon Mills, ONM3C 2T8
Tel: 1-800-361-6128 Fax: 1-800-563-9196
Pearson Education Canada
Principle of MathematicsApplications of MathematicsEssentials of Mathematics
10 11 12Recommended for:
Copyright Year: 1991
Student, Teacher ResourceCategory:
General Description: This resource explores the straight line, dependentupon using the TI-81 graphics calculator. It shows students how to plotlinear equations, how to make changes to the variable, and uses thequestion "what if ...?" to pose multiple problems within a single context.Students are encouraged to compare their answers and to predictoutcomes.
Audience: General
Author(s): Alexander, B.
Patterns and RelationsCurriculum Organizer(s):What If ...?: The Straight Line:Investigations with the TI-81 GraphicsCalculator
Supplier:
ISBN/Order No:
Price:
0969698100
$12.30
26 Prince Andrew PlaceDon Mills, ONM3C 2T8
Tel: 1-800-361-6128 Fax: 1-800-563-9196
Pearson Education Canada
Principle of MathematicsApplications of MathematicsEssentials of Mathematics
10 11 12Recommended for:
Copyright Year: 1993
B-64
Principles of Mathematics Grade 11 Collection
Student, Teacher ResourceCategory:
General Description: Graphing program for Macintosh or Windows canbe used to support learning and reviewing graphs of relations andfunctions. It uses transformations, derived functions, and composition offunctions. Relations can be input without recasting into function form.Manual included.
System requirements for Macintosh: System 6.0 or higher, 1 Mb RAM.System requirements for Windows: Windows 3.1, 3.11 or Windows 95, 1Mb RAM.
Audience: General
Shape and SpaceCurriculum Organizer(s):ZAP-A-GRAPH
Supplier:
ISBN/Order No:
Price:
(not available)
$79.00
RR #1Fitzroy Harbor, ONK0A 1X0
Tel: (613) 623-8686 Fax: (613) 623-8686
Brain Waves Software Inc.
Principle of MathematicsApplications of MathematicsEssentials of Mathematics
10 11 12Recommended for:
Copyright Year: 1996
B-65

B-67
APPENDIX B: LEARNING RESOURCES • Mathematics 10 to 12
Co
mprehensive R
esources
Principles o
f Mathem
atics 12 Grade C
ollectio
n
Num
bersP
atterns and Relatio
nsS
hape and Space
Statistics andP
robability
Num
berC
onceptsN
umber
Operations
PatternsVariables
&Equations
Relations
&Functions
Measure-m
ent3-D
Objects &
2-D Shapes
Transform-
ationsD
ata A
nalysisC
hance &U
ncertainty
Additio
nal Reso
urces – So
ftware/C
D-R
OM
Additio
nal Reso
urces – Print
Mathem
atics 12, Western Canadian Edition
MATH
POW
ER 12, Western Edition
Exploring Advance Algebra with the TI-83
Exploring Functions with the TI-82 G
raphics Calculator
Exploring Statistics with the TI-82 G
raphics Calculator
An Introduction to the TI-82 Graphing Calculator
Modeling M
otion: High School M
ath Activities with
the CBR
Using the TI-81 G
raphics Calculator to ExploreFunctions
String Invision Conics Model
GrafEq
Secondary Math Lab Toolkit
ZAP-A-G
RAPH
Additio
nal Reso
urces – Gam
es/Manipulatives


Principles of Mathematics Grade 12 Collection
Student, Teacher ResourceCategory:
General Description: Resource contains exercises and investigations thatsupplement the following topics: sequences, fractals, combinatorics,probability, linear systems, matrices, and linear programming. The keyingsequences are specific to TI-83 model of calculator.
Audience: General
Author(s): Kelly, B.
Patterns and RelationsStatistics and Probability
Curriculum Organizer(s):Exploring Advanced Algebra with theTI-83
Supplier:
ISBN/Order No:
Price:
1895997100
$15.71
26 Prince Andrew PlaceDon Mills, ONM3C 2T8
Tel: 1-800-361-6128 Fax: 1-800-563-9196
Pearson Education Canada
Principle of MathematicsApplications of MathematicsEssentials of Mathematics
10 11 12Recommended for:
Copyright Year: 1998
Student, Teacher ResourceCategory:
General Description: This resource contains exercises and investigationsthat are suitable for a wide range of student abilities. It acts as asupplement to a limited number of learning outcomes and is designed forfollow-up activities.
Audience: General
Author(s): Kelly, B.
Patterns and RelationsCurriculum Organizer(s):Exploring Functions with the TI-82Graphics Calculator
Supplier:
ISBN/Order No:
Price:
1895997003
$14.60
26 Prince Andrew PlaceDon Mills, ONM3C 2T8
Tel: 1-800-361-6128 Fax: 1-800-563-9196
Pearson Education Canada
Principle of MathematicsApplications of MathematicsEssentials of Mathematics
10 11 12Recommended for:
Copyright Year: 1993
B-69
Principles of Mathematics Grade 12 Collection
Student, Teacher ResourceCategory:
General Description: This resource manual uses the TI-82 graphicscalculator to explore and develop applications in statistics and probability,through the use of investigations and worked examples. These examplesreflect current and real-world situations. There are numerous referencesto historical influences on various developments in statistics andprobability. Exercises allow ample scope for development and extension ofthe main mathematical processes.
Audience: General
Author(s): Kelly, B.
Statistics and ProbabilityCurriculum Organizer(s):Exploring Statistics with the TI-82Graphics Calculator
Supplier:
ISBN/Order No:
Price:
189599702X
$14.60
26 Prince Andrew PlaceDon Mills, ONM3C 2T8
Tel: 1-800-361-6128 Fax: 1-800-563-9196
Pearson Education Canada
Principle of MathematicsApplications of MathematicsEssentials of Mathematics
10 11 12Recommended for:
Copyright Year: 1994
Student, Teacher ResourceCategory:
General Description: Relation plotting tool enables students to graphfunctions from implicit and explicit definitions, and from relations as wellas inequalities. There is the ability to save and print graphs, and tointegrate these graphs into other documents. Includes a manual.
System requirements for Macintosh: System 6.5 or higher (System 7 orhigher recommended), 2 Mb RAM (4 Mb recommended).System requirements for Windows: Windows 3.1 with win32's, Windows95, Windows 98, or Windows NT 4; 8Mb RAM.
Audience: General
Patterns and RelationsCurriculum Organizer(s):GrafEq (Macintosh/Windows Version2.09)
Supplier:
ISBN/Order No:
Price:
(not available)
Single User: $94.50Site Licence (up to 30): $300.00
4446 Lazelle AvenueTerrace, BCV8G 1R8
Tel: (250) 638-8606 Fax: (250) 638-8606
Pedagoguery Software
Principle of MathematicsApplications of MathematicsEssentials of Mathematics
10 11 12Recommended for:
Copyright Year: 1998
B-70

Principles of Mathematics Grade 12 Collection
Student, Teacher ResourceCategory:
General Description: User-friendly software for Macintosh or Windowsgraphs different forms of linear, quadratic, polynomial, and trigonometricrelations. A second program provides a graph and requires the student toenter the equation. There are also two games that act as motivationaltools. Five graphs can be displayed simultaneously. The accompanyingteacher's guide provides ideas and worksheets.
System requirements for Macintosh: System 6.0.5 or higher (System 7recommended), 1 Mb RAM.System requirements for Windows 3.1: Windows 3.1, 486/25 MHz orbetter, 2 Mb RAM; 256 colour monitor.System requirements for Windows 95: 486DX/50 MHz or higher (Pentiumrecommended), 4 Mb RAM, 256 colour monitor.
Audience: General
Patterns and RelationsShape and Space
Curriculum Organizer(s):Green Globs & Graphing Equations
Supplier:
ISBN/Order No:
Price:
(not available)
$129.95 each version
164 Commander BoulevardScarborough, ONM1S 3C7
Tel: 1-800-667-1115 Fax: (416) 293-9009
Gage Educational Publishing Co. (Scarborough)
Principle of MathematicsApplications of MathematicsEssentials of Mathematics
10 11 12Recommended for:
Copyright Year: 1997
Student, Teacher ResourceCategory:
General Description: Reproducible blackline masters give clear examplesand steps for using the TI-82 graphing calculator in a variety of ways. Canalso be used with the TI-83 graphing calculator.
Audience: General
Patterns and RelationsCurriculum Organizer(s):An Introduction to the TI-82 GraphingCalculator
Supplier:
ISBN/Order No:
Price:
0768200067
$18.95
23740 Howthorne BoulevardTorrance, CA90505
Tel: 1-800-421-5533 Fax: (310) 375-5090
Frank Schaffer Publications Inc.
Principle of MathematicsApplications of MathematicsEssentials of Mathematics
10 11 12Recommended for:
Copyright Year: 1998
B-71

Principles of Mathematics Grade 12 Collection
Student, Teacher ResourceCategory:
General Description: This resource closely maps the content of thecurriculum and uses a problem solving approach. Components consist ofa student text, Teacher’s Resource Book, an optional Independent StudyGuide, and an optional Template and Data Kit. Open-ended questionsare designed to help students express their ideas about mathematics orallyand in writing. Utilizes group work, manipulatives, and technology whereappropriate. The student text uses an inquiry approach and incorporatesgraphing calculators and software use. The Teacher's Resource Bookprovides a correlation of outcomes with text pages, and each sectionsupplies supplementary examples and assessment examples which theteacher can use during lessons. The Independent Study Guide coverseach of the student text chapters and correlates directly with eachsection. The Template and Data CD-ROM includes four databases,spreadsheet templates, and a teacher's guide with tutorials, answers, andadditional technology activities. Manipulatives must be purchasedseparately. References are made to specific Internet websites which havenot been evaluated.
System requirements for Template and Data Kit:
Macintosh: System 6.0.5 or higher, 4 Mb RAM, mouse, ClarisWorks.Windows 3.1: 386DX/33 MHz minimum, 4 Mb RAM (8 Mbrecommended), either Microsoft Works or ClarisWorks. Windows 95recommended.Windows 95: 486/50 MHz (Pentium recommended), 8 Mb RAM (16 Mbrecommended), mouse, either ClarisWorks, Microsoft Works or MicrosoftExcel/Access.
Caution: Standard deviation of a sample mean for large samples is notaddressed.
Audience: General
Author(s): LeBlanc, D.
Patterns and RelationsShape and SpaceStatistics and Probability
Curriculum Organizer(s):Mathematics 12, Western CanadianEdition
Supplier:
ISBN/Order No:
Price:
Student Text: 0201346629XTeacher's Resource Book: 0201346311
Student Text: $51.75Teacher's Resource Book: $147.75
26 Prince Andrew PlaceDon Mills, ONM3C 2T8
Tel: 1-800-361-6128 Fax: 1-800-563-9196
Pearson Education Canada
Principle of MathematicsApplications of MathematicsEssentials of Mathematics
10 11 12Recommended for:
Copyright Year: 1999
B-72
Principles of Mathematics Grade 12 Collection
Student, Teacher ResourceCategory:
General Description: The resource package closely maps the contentand philosophy of the curriculum. Mathematical processes are woventhroughout the resource. A conscientious effort was made to relate themathematical concepts to real-world situations. The nine-chapterstudent text makes good use of visual presentations, and the format isconsistent throughout. Each section includes a presentation of theconcept, an explore and inquire section to develop the concept, exampleswith worked solutions and many exercises. An optional Computer DataBank has been reviewed for technical considerations only and may beused in conjunction with various sections of the text.
System requirements for Windows: Windows 95 minimum, 486 processoror higher, 8 Mb RAM, 4X CD-ROM drive, ClarisWorks 5.0 for Windows orhigher. For use on ClarisWorks 5.0 (Windows 95); Microsoft Works 4.0(Windows 95); ClarisWorks 5.0 (Macintosh OS 7.0); Microsoft Access 97(Windows 95).
Audience: General
Author(s): Angel, P.; ... (et al.)
Patterns and RelationsShape and SpaceStatistics and Probability
Curriculum Organizer(s):MATHPOWER 12, Western Edition
Supplier:
ISBN/Order No:
Price:
Student Text: 007552600XTeacher's Resource: 0075600218
Student Text: $53.95Teacher's Resource: $110.00
300 Water StreetWhitby, ONL1N 9B6
Tel: 1-800-565-5758 (orders only) Fax:1-800-463-5885
McGraw-Hill Ryerson Ltd. (Ontario)
Principle of MathematicsApplications of MathematicsEssentials of Mathematics
10 11 12Recommended for:
Copyright Year: 2000
Student, Teacher ResourceCategory:
General Description: This resource includes investigation activities thatuse the calculator-based ranger (CBR) to obtain data from physicalphenomena. Using a TI-82 or TI-83 graphing calculator, students obtain amathematical equation to describe the physical event(s). Topics includearithmetic and geometric growth, systems of linear equations in twovariables, quadratic functions, and exponential functions. The resourceprovides practice data to enable students to complete the investigationswithout a CBR, if necessary.
Audience: General
Author(s): Antinone, L.; Gough, S.
Patterns and RelationsCurriculum Organizer(s):Modeling Motion: High School MathActivities with the CBR
Supplier:
ISBN/Order No:
Price:
1886309140
$16.83
26 Prince Andrew PlaceDon Mills, ONM3C 2T8
Tel: 1-800-361-6128 Fax: 1-800-563-9196
Pearson Education Canada
Principle of MathematicsApplications of MathematicsEssentials of Mathematics
10 11 12Recommended for:
Copyright Year: 1997
B-73

Principles of Mathematics Grade 12 Collection
Student, Teacher ResourceCategory:
General Description: Software package for Macintosh or Windowsconsists of a CD-ROM and a user's guide. The toolkit contains graphicaltools for algebra, geometry, data analysis, and probability. A text editor,function editor, spreadsheet editor, and matrix editor are linked. Thegraphs are clear and may be transformed in a variety of ways. Probabilitymodels use dice and spinners. Includes a visual representation of algebratiles.
System requirements for Macintosh: Macintosh LC II or later, 6Mb RAMand System 7.0 or higher. PowerMac system with 8Mb RAM and System7.5 or higher recommended.System requirements forWindows 3.1: Windows 3.1 in enhanced mode,486/33 MHz, 12Mb RAM, hard drive.System requirements for Windows 95: 486/50 MHz, 12Mb RAM, harddrive. Pentium processor with 16Mb RAM recommended.
Audience: General
Author(s): Bedoya, J.Z. ... (et al.)
Patterns and RelationsShape and SpaceStatistics and Probability
Curriculum Organizer(s):Secondary Math Lab Toolkit
Supplier:
ISBN/Order No:
Price:
Macintosh version: 0134330439Windows version: 0134330447
$124.95 each version
26 Prince Andrew PlaceDon Mills, ONM3C 2T8
Tel: 1-800-361-6128 Fax: 1-800-563-9196
Pearson Education Canada
Principle of MathematicsApplications of MathematicsEssentials of Mathematics
10 11 12Recommended for:
Copyright Year: 1998
Student, Teacher ResourceCategory:
General Description: Resource consists of a model made of string, metal,and wood; a teacher's guide; and overhead materials. The model transfersa beam of light from the overhead projector to the visual representation ofa double-napped cone, creating a conic. It is particularly effective indemonstrating the cases involving degenerate conics, rather than as astudent exploration tool.
Audience: General
Shape and SpaceCurriculum Organizer(s):String Invision Conics Model
Supplier:
ISBN/Order No:
Price:
(not available)
$80.00
25 Windsor StreetSpruce Grove , ABT7X 1L6
Tel: (780) 962-9275
Belle Vue Software
Principle of MathematicsApplications of MathematicsEssentials of Mathematics
10 11 12Recommended for:
Copyright Year: (not available)
B-74

Principles of Mathematics Grade 12 Collection
Student, Teacher ResourceCategory:
General Description: This resource manual includes exercises andinvestigations using the TI-81 graphics calculator and is suitable for a widerange of student abilities. It provides a supplement to a limited number oflearning outcomes and is designed for follow-up activities.
Audience: General
Author(s): Kelly, B.
Patterns and RelationsCurriculum Organizer(s):Using the TI-81 Graphics Calculator toExplore Functions
Supplier:
ISBN/Order No:
Price:
0969524404
$8.95
26 Prince Andrew PlaceDon Mills, ONM3C 2T8
Tel: 1-800-361-6128 Fax: 1-800-563-9196
Pearson Education Canada
Principle of MathematicsApplications of MathematicsEssentials of Mathematics
10 11 12Recommended for:
Copyright Year: 1991
Student, Teacher ResourceCategory:
General Description: This resource manual uses the TI-81 graphicscalculator to explore and develop applications in statistics and probability,through the use of investigations and worked examples. These examplesreflect current and real-world situations. There are numerous referencesto historical influences on various developments in statistics andprobability. Student exercises, most of which are not calculator specific,allow ample scope for development and extension of the mainmathematical processes.
Audience: General
Author(s): Kelly, B.
Statistics and ProbabilityCurriculum Organizer(s):Using the TI-81 Graphics Calculator toExplore Statistics
Supplier:
ISBN/Order No:
Price:
0969524412
$8.95
26 Prince Andrew PlaceDon Mills, ONM3C 2T8
Tel: 1-800-361-6128 Fax: 1-800-563-9196
Pearson Education Canada
Principle of MathematicsApplications of MathematicsEssentials of Mathematics
10 11 12Recommended for:
Copyright Year: 1992
B-75

Principles of Mathematics Grade 12 Collection
Student, Teacher ResourceCategory:
General Description: Graphing program for Macintosh or Windows canbe used to support learning and reviewing graphs of relations andfunctions. It uses transformations, derived functions, and composition offunctions. Relations can be input without recasting into function form.Manual included.
System requirements for Macintosh: System 6.0 or higher, 1 Mb RAM.System requirements for Windows: Windows 3.1, 3.11 or Windows 95, 1Mb RAM.
Audience: General
Shape and SpaceCurriculum Organizer(s):ZAP-A-GRAPH
Supplier:
ISBN/Order No:
Price:
(not available)
$79.00
RR #1Fitzroy Harbor, ONK0A 1X0
Tel: (613) 623-8686 Fax: (613) 623-8686
Brain Waves Software Inc.
Principle of MathematicsApplications of MathematicsEssentials of Mathematics
10 11 12Recommended for:
Copyright Year: 1996
B-76
Essentials of Mathematics Grade 10 Collection
Student, Teacher ResourceCategory:
General Description: Macintosh software enables students toinvestigate and create geometrical transformations. Using drawingand modifier tools, students draw and then re-form 2-D figures intorelated 3-D figures. Includes a user's manual and cardboard 3-Dglasses.
System requirements: Macintosh Plus or later; System 6.0.3 or later; 1Mb RAM; colour monitor optional.
Audience: GeneralESL - minimal language requiredGifted - visuals allow open-ended exploration and divergent thinkingLD - visual focus
Geometry ProjectCurriculum Organizer(s):3-D Images
Supplier:
ISBN/Order No:
Price:
3194
$132.00
10333 - 170 StreetEdmonton, ABT5P 4V4
Tel: 1-888-622-4280 Fax: 1-800-929-5630
Westworld Computers Limited
Principle of MathematicsApplications of MathematicsEssentials of Mathematics
10 11 12Recommended for:
Copyright Year: 1991
Student, Teacher ResourceCategory:
General Description: Twenty-five-minute American videoemphasizes the importance of financial planning in order to achievegoals. It outlines the importance of budgeting, setting goals, andcollecting interest as opposed to paying interest. Effects ofcompound interest versus inflation in money growth are discussed.Teachers will need to develop their own pre- and post-viewingactivities.
Audience: General
Author(s): Pool; Frick
Personal BankingCurriculum Organizer(s):The ABC's of Personal Finance
Supplier:
ISBN/Order No:
Price:
MA0003
$26.00
#4-8755 Ash StreetVancouver, BCV6P 6T3
Tel: 1-800-884-2366 Fax: (604) 324-1844
B.C. Learning Connection Inc.
Principle of MathematicsApplications of MathematicsEssentials of Mathematics
10 11 12Recommended for:
Copyright Year: 1995
B-77

Essentials of Mathematics Grade 10 Collection
Student, Teacher ResourceCategory:
General Description: Set of activity cards features variousexperiments for exploring probability. Includes dice, disks, ateacher's guide, and a chart for recording and graphing results.
Audience: General
Author(s): Giles, Geoff
Probability and SamplingCurriculum Organizer(s):D.I.M.E. Probability Pack A
Supplier:
ISBN/Order No:
Price:
17262
$59.50
125 Mary St.Aurora, ONL4G 1G3
Tel: 1-800-668-0600 Fax: (905) 727-6265
Spectrum Educational Supplies Ltd.
Principle of MathematicsApplications of MathematicsEssentials of Mathematics
10 11 12Recommended for:
Copyright Year: 1988
Student, Teacher ResourceCategory:
General Description: Four sets of activity cards featureexperiments to explore probability and problem solving. Alsoincludes sets of beads, a teaching guide, and a chart for recordingand graphing results.
Audience: General
Author(s): Giles, Geoff
Probability & SamplingProblem Solving
Curriculum Organizer(s):D.I.M.E. Probability Pack B
Supplier:
ISBN/Order No:
Price:
17264
$59.50
125 Mary St.Aurora, ONL4G 1G3
Tel: (905) 841-0600 Fax: (905) 727-6265
Spectrum Educational Supplies Ltd.
Principle of MathematicsApplications of MathematicsEssentials of Mathematics
10 11 12Recommended for:
Copyright Year: 1988
B-78

Essentials of Mathematics Grade 10 Collection
Student, Teacher ResourceCategory:
General Description: Supplementary blackline activity masters arefor use with the software program The Geometer's Sketchpad, which isalso recommended. Activities employ traditional geometricconstruction techniques and modelling, and emphasize therelationships among angles, triangles, and circles. Teacher's notessection is included. Accompanying software disks, for Macintoshand Windows, provide sample sketches and scripts.
Audience: GeneralGifted - open-ended explorations
Author(s): Shaffer, David
TrigonometryCurriculum Organizer(s):Exploring Trigonometry with the Geometer'sSketchpad
Supplier:
ISBN/Order No:
Price:
1-55953-075-8/13798
$41.55
125 Mary St.Aurora, ONL4G 1G3
Tel: (905) 841-0600 Fax: (905) 727-6265
Spectrum Educational Supplies Ltd.
Principle of MathematicsApplications of MathematicsEssentials of Mathematics
10 11 12Recommended for:
Copyright Year: 1995
Student, Teacher ResourceCategory:
General Description: This resource consists of discs, a user guideand reference manual, teaching notes and sample activities, a quickreference, and an introductory video. The resource models geometryin two linked views, sketches and scripts. Sketches depict concretegeometry and emphasize spatial reasoning, while scripts describeconstructions verbally and abstractly. The program allows for theconstruction, labelling, measurement and manipulation of anygeometric figure, as well as the exploration of geometry conceptstaught in Grade 7 through Grade 9. The user guide and referencemanual provide instruction for learning to use the program. Theteaching notes and sample activities provide suggestions forclassroom use. Several sample investigations, explorations,demonstration and construction activities, on a wide range ofgeometry topics, are included.
Macintosh: minimum of a Macintosh Plus, with 1 MB RAM andSystem 6 or higher. A videocassette supplied with the Windowsversion supports both Macintosh and Windows.Windows 3.1: Windows 3.1 in enhanced mode, 386/33 MHz, 4MBRAM, hard drive. The videocassette supports both Macintosh andWindows versions.Windows 95: 486/50 MHz (Pentium recommended), 8MB RAM,hard drive. The videocassette supports both Macintosh andWindows versions.
Audience: General
TrigonometryCurriculum Organizer(s):The Geometer's Sketchpad
Supplier:
ISBN/Order No:
Price:
Macintosh Version: 1-55953-098-7Windows Version: 1-55953-099-5
$289.95 each version
125 Mary St.Aurora, ONL4G 1G3
Tel: (905) 841-0600 Fax: (905) 727-6265
Spectrum Educational Supplies Ltd.
Principle of MathematicsApplications of MathematicsEssentials of Mathematics
10 11 12Recommended for:
Copyright Year: 1995
B-79

Essentials of Mathematics Grade 10 Collection
Student, Teacher ResourceCategory:
General Description: This software for Macintosh or Windowssimulates running a hot dog stand. Students gather information,keep records, plan inventory, decide on pricing and look at sellingstrategies. There are three levels of operation. At the intermediateand advanced leves, students also deal with the unexpected eventsof running a business, such as weather, unreliable suppliers, andmachine breakdown. Students estimate, calculate, read graphs, andkeep track of their progress in a journal - incorporated as a mini-wordprocessor. In the teacher's guide there are follow-up activitiesrelating to starting and running a business.
System requirements for Macintosh: System 7.0 or later; 68040 orlater processor; Mb RAM; 31Mb hard drive space; double speedCD-ROM drive; and 640x480, 256 colour monitor.System requirements for Windows: Windows 3.1 or Windows 95,8Mb RAM, 30Mb hard drive, double speed CD-ROM drive, 640x480256 colour monitor.
Audience: General
Rate, Ratio and PorportionSpreadsheets
Curriculum Organizer(s):Hot Dog Stand: The Works
Supplier:
ISBN/Order No:
Price:
(not available)
$89.95 each version
164 Commander BoulevardScarborough, ONM1S 3C7
Tel: 1-800-667-1115 Fax: (416) 293-9009
Gage Educational Publishing Co. (Scarborough)
Principle of MathematicsApplications of MathematicsEssentials of Mathematics
10 11 12Recommended for:
Copyright Year: 1996
Student, Teacher ResourceCategory:
General Description: This package is a set of Windows softwareutilities that can share data. The tools include spreadsheet,calculation, geometry, graphs, manipulatives, fraction strips, andprobability. A colour linking feature between two or more windowsallows data to be shared and represented in a variety of formats.Includes information on installing and using the software andchapters specific to each math tool. Provides a glossary and index.
System requirements for Windows 3.1: 386/33 MHz, 4Mb of RAM,13" VGA monitor, 2Mb hard disk space, PKZIP.System requirements for Windows 95: 486/50 MHz, 8Mb of RAM,13" VGA monitor, 2Mb hard disk space, PKZIP.
Caution: The algebra tile manipulatives have limited usage (first-degreevariables only.) The spreadsheet uses radians as units for sine, cosine, andtangent calculations.
Audience: General
Geometry ProjectProbability and SamplingSpreadsheets
Curriculum Organizer(s):Math Tools
Supplier:
ISBN/Order No:
Price:
0134109783
$58.94
26 Prince Andrew PlaceDon Mills, ONM3C 2T8
Tel: 1-800-361-6128 Fax: 1-800-563-9196
Pearson Education Canada
Principle of MathematicsApplications of MathematicsEssentials of Mathematics
10 11 12Recommended for:
Copyright Year: 1995
B-80
Essentials of Mathematics Grade 10 Collection
Student, Teacher ResourceCategory:
General Description: Interactive Macintosh computer programallows students to conduct probability experiments using six models:coins; dice; marbles in a jar; spinners; random digits; and plottingrandom points in areas of a plane. Accompanying manual providesopportunities for further exploration.
System requirements: 4 MB RAM; 13" colour monitor; System 7.0 orhigher. A Windows version is available, but was not evaluated.
Audience: General
Probability and SamplingCurriculum Organizer(s):Probability Constructor
Supplier:
ISBN/Order No:
Price:
99-3108-01
$199.00
23 Hannover Drive, Unit 2St. Catherines, ONL2W 1A3
Tel: 1-800-363-2908 Fax: (905) 704-1555
Tangent Scientific Supply Inc.
Principle of MathematicsApplications of MathematicsEssentials of Mathematics
10 11 12Recommended for:
Copyright Year: 1996
Teacher ResourceCategory:
General Description: Binder describes the processes and strategiesused to solve problems, including trial and error, making a drawing orsketch, logical thinking, finding a pattern, working backward,elimination, and making a list. Explains each strategy and includesover 200 challenging activities.
Audience: GeneralGifted - opportunities for critical thinking
Author(s): Jones, G.
Probability & SamplingProblem Solving
Curriculum Organizer(s):Problem Solving: What You Do When You Don'tKnow What To Do
Supplier:
ISBN/Order No:
Price:
(not available)
$31.46
243 Saunders RoadBarrie, ONL4M 6E7
Tel: 1-800-563-1166 Fax: (705) 725-1167
Exclusive Educational Products (Ontario)
Principle of MathematicsApplications of MathematicsEssentials of Mathematics
10 11 12Recommended for:
Copyright Year: 1994
B-81

Essentials of Mathematics Grade 10 Collection
Student, Teacher ResourceCategory:
General Description: Binder of activities, projects, and assessmentitems for data analysis and probability includes extensive teachersupport in terms of suggested teaching strategies, sequencing, andscoring rubrics. Activities include both routine calculation andopen-ended projects. Some activities involve critical thinking.Provides random number tables, but other manipulatives must beprovided by the teacher.
Audience: General
Author(s): Birse ... (et al.)
Probability & SamplingCurriculum Organizer(s):Triple 'A' Mathematics Program: DataManagement & Probability
Supplier:
ISBN/Order No:
Price:
(not available)
$33.26
243 Saunders RoadBarrie, ONL4M 6E7
Tel: 1-800-563-1166 Fax: (705) 725-1167
Exclusive Educational Products (Ontario)
Principle of MathematicsApplications of MathematicsEssentials of Mathematics
10 11 12Recommended for:
Copyright Year: 1995
B-82

Essentials of Mathematics Grade 11 Collection
Student, Teacher ResourceCategory:
General Description: Twenty-five-minute American videoemphasizes the importance of financial planning in order to achievegoals. It outlines the importance of budgeting, setting goals, andcollecting interest as opposed to paying interest. Effects ofcompound interest versus inflation in money growth are discussed.Teachers will need to develop their own pre- and post-viewingactivities.
Audience: General
Author(s): Pool; Frick
Income and DebtOwning and Operating a Vehicle
Curriculum Organizer(s):The ABC's of Personal Finance
Supplier:
ISBN/Order No:
Price:
MA0003
$26.00
#4-8755 Ash StreetVancouver, BCV6P 6T3
Tel: 1-800-884-2366 Fax: (604) 324-1844
B.C. Learning Connection Inc.
Principle of MathematicsApplications of MathematicsEssentials of Mathematics
10 11 12Recommended for:
Copyright Year: 1995
Student, Teacher ResourceCategory:
General Description: Set of activity cards features variousexperiments for exploring probability. Includes dice, disks, ateacher's guide, and a chart for recording and graphing results.
Audience: General
Author(s): Giles, Geoff
Applications of ProbabilityCurriculum Organizer(s):D.I.M.E. Probability Pack A
Supplier:
ISBN/Order No:
Price:
17262
$59.50
125 Mary St.Aurora, ONL4G 1G3
Tel: 1-800-668-0600 Fax: (905) 727-6265
Spectrum Educational Supplies Ltd.
Principle of MathematicsApplications of MathematicsEssentials of Mathematics
10 11 12Recommended for:
Copyright Year: 1988
B-83

Essentials of Mathematics Grade 11 Collection
Student, Teacher ResourceCategory:
General Description: Four sets of activity cards featureexperiments to explore probability and problem solving. Alsoincludes sets of beads, a teaching guide, and a chart for recordingand graphing results.
Audience: General
Author(s): Giles, Geoff
Applications of ProbabilityCurriculum Organizer(s):D.I.M.E. Probability Pack B
Supplier:
ISBN/Order No:
Price:
17264
$59.50
125 Mary St.Aurora, ONL4G 1G3
Tel: (905) 841-0600 Fax: (905) 727-6265
Spectrum Educational Supplies Ltd.
Principle of MathematicsApplications of MathematicsEssentials of Mathematics
10 11 12Recommended for:
Copyright Year: 1988
Student, Teacher ResourceCategory:
General Description: User-friendly software for Macintosh orWindows graphs different forms of linear, quadratic, polynomial, andtrigonometric relations. A second program provides a graph andrequires the student to enter the equation. There are also two gamesthat act as motivational tools. Five graphs can be displayedsimultaneously. The accompanying teacher's guide provides ideasand worksheets.
System requirements for Macintosh: System 6.0.5 or higher (System 7recommended), 1 Mb RAM.System requirements for Windows 3.1: Windows 3.1, 486/25 MHz orbetter, 2 Mb RAM; 256 colour monitor.System requirements for Windows 95: 486DX/50 MHz or higher(Pentium recommended), 4 Mb RAM, 256 colour monitor.
Audience: General
Data Analysis and InterpretationRelations and Formulas
Curriculum Organizer(s):Green Globs & Graphing Equations
Supplier:
ISBN/Order No:
Price:
(not available)
$129.95 eah version
164 Commander BoulevardScarborough, ONM1S 3C7
Tel: 1-800-667-1115 Fax: (416) 293-9009
Gage Educational Publishing Co. (Scarborough)
Principle of MathematicsApplications of MathematicsEssentials of Mathematics
10 11 12Recommended for:
Copyright Year: 1996
B-84

Essentials of Mathematics Grade 11 Collection
Student, Teacher ResourceCategory:
General Description: This software for Macintosh or Windowssimulates running a hot dog stand. Students gather information,keep records, plan inventory, decide on pricing and look at sellingstrategies. There are three levels of operation. At the intermediateand advanced leves, students also deal with the unexpected eventsof running a business, such as weather, unreliable suppliers, andmachine breakdown. Students estimate, calculate, read graphs, andkeep track of their progress in a journal - incorporated as a mini-wordprocessor. In the teacher's guide there are follow-up activitiesrelating to starting and running a business.
System requirements for Macintosh: System 7.0 or later; 68040 orlater processor; Mb RAM; 31Mb hard drive space; double speedCD-ROM drive; and 640x480, 256 colour monitor.System requirements for Windows: Windows 3.1 or Windows 95,8Mb RAM, 30Mb hard drive, double speed CD-ROM drive, 640x480256 colour monitor.
Audience: General
Business PlanData Analysis and Interpretation
Curriculum Organizer(s):Hot Dog Stand: The Works
Supplier:
ISBN/Order No:
Price:
(not available)
$89.95 each version
164 Commander BoulevardScarborough, ONM1S 3C7
Tel: 1-800-667-1115 Fax: (416) 293-9009
Gage Educational Publishing Co. (Scarborough)
Principle of MathematicsApplications of MathematicsEssentials of Mathematics
10 11 12Recommended for:
Copyright Year: 1996
Teacher ResourceCategory:
General Description: Resource uses specific examples to explainhow to organize student projects. The book describes nine differentpresentation formats: videos, skits, photo albums, graphics portfolios,class books, games, posters, models, and business presentations.
Audience: General
Author(s): DeMeulemeester, Katie
Business PlanIncome and Debt
Curriculum Organizer(s):Math Projects: Organization, Implementation,and Assessment
Supplier:
ISBN/Order No:
Price:
0-86651-836-3
$18.15
26 Prince Andrew PlaceDon Mills, ONM3C 2T8
Tel: 1-800-361-6128 Fax: 1-800-563-9196
Pearson Education Canada
Principle of MathematicsApplications of MathematicsEssentials of Mathematics
10 11 12Recommended for:
Copyright Year: 1995
B-85

Essentials of Mathematics Grade 11 Collection
Student, Teacher ResourceCategory:
General Description: This package is a set of Windows softwareutilities that can share data. The tools include spreadsheet,calculation, geometry, graphs, manipulatives, fraction strips, andprobability. A colour linking feature between two or more windowsallows data to be shared and represented in a variety of formats.Includes information on installing and using the software andchapters specific to each math tool. Provides a glossary and index.
System requirements for Windows 3.1: 386/33 MHz, 4Mb of RAM,13" VGA monitor, 2Mb hard disk space, PKZIP.System requirements for Windows 95: 486/50 MHz, 8Mb of RAM,13" VGA monitor, 2Mb hard disk space, PKZIP.
Caution: The algebra tile manipulatives have limited usage (first-degreevariables only.) The spreadsheet uses radians as units for sine, cosine, andtangent calculations.
Audience: General
Applications of ProbabilityRelations and Formulas
Curriculum Organizer(s):Math Tools
Supplier:
ISBN/Order No:
Price:
0134109783
$58.94
26 Prince Andrew PlaceDon Mills, ONM3C 2T8
Tel: 1-800-361-6128 Fax: 1-800-563-9196
Pearson Education Canada
Principle of MathematicsApplications of MathematicsEssentials of Mathematics
10 11 12Recommended for:
Copyright Year: 1997
Student, Teacher ResourceCategory:
General Description: Student text and teacher's guide outlinehands-on activities for gathering and using data and statistics withthe aid of a scatter plot. Explores linear graphing andslope/intercept.
Audience: General
Author(s): Montesanto, Ralph; Zimmer, David
Relations and FormulasCurriculum Organizer(s):Models and Patterns: Experimenting WithLinear Equations
Supplier:
ISBN/Order No:
Price:
Softcover Student Book: 0-669-95475-6Hardcover Student Book: 0-669-95482-9Teacher's Guide: 0-669-95479-9
Softcover Student Book: $12.95Hardcover Student Book: $17.65Teacher's Guide: $24.95
1120 Birchmount RoadScarborough, ONM1K 5G4
Tel: 1-800-268-2222 Fax: (416) 752-9365 or 752-9646
Nelson Thomson Learning
Principle of MathematicsApplications of MathematicsEssentials of Mathematics
10 11 12Recommended for:
Copyright Year: 1994
B-86
Essentials of Mathematics Grade 11 Collection
Teacher ResourceCategory:
General Description: Book introduces a multicultural perspectiveto elementary and middle grade mathematics, revealing how such aperspective can enrich the learning of all students, whatever theirgender, ethnic/racial heritage, or socio-economic status. Studentslearn that mathematics was created by real people attempting tosolve real problems. The collection of open-ended activitiesaddresses a range of mathematical topics and cultural connections,and promotes problem solving and critical and creative thinking.
Audience: General
Problem SolvingCurriculum Organizer(s):The Multicultural Math Classroom: Bringing inthe World
Supplier:
ISBN/Order No:
Price:
0435083732
$36.20
325 Humber College Blvd.Toronto, ONM9W 7C3
Tel: 1-800-387-0172 (orders only) Fax: (416)798-1384
Irwin Publishing
Principle of MathematicsApplications of MathematicsEssentials of Mathematics
10 11 12Recommended for:
Copyright Year: 1996
Student, Teacher ResourceCategory:
General Description: Interactive Macintosh computer programallows students to conduct probability experiments using six models:coins; dice; marbles in a jar; spinners; random digits; and plottingrandom points in areas of a plane. Accompanying manual providesopportunities for further exploration.
System requirements: 4 MB RAM; 13" colour monitor; System 7.0 orhigher. A Windows version is available, but was not evaluated.
Audience: General
Applications of ProbabilityCurriculum Organizer(s):Probability Constructor
Supplier:
ISBN/Order No:
Price:
99-3108-01
$199.00
23 Hannover Drive, Unit 2St. Catherines, ONL2W 1A3
Tel: 1-800-363-2908 Fax: (905) 704-1555
Tangent Scientific Supply Inc.
Principle of MathematicsApplications of MathematicsEssentials of Mathematics
10 11 12Recommended for:
Copyright Year: 1994
B-87

Essentials of Mathematics Grade 11 Collection
Teacher ResourceCategory:
General Description: Binder describes the processes and strategiesused to solve problems, including trial and error, making a drawing orsketch, logical thinking, finding a pattern, working backward,elimination, and making a list. Explains each strategy and includesover 200 challenging activities.
Audience: GeneralGifted - opportunities for critical thinking
Author(s): Jones, G.
Problem SolvingCurriculum Organizer(s):Problem Solving: What You Do When You Don'tKnow What To Do
Supplier:
ISBN/Order No:
Price:
(not available)
$31.46
243 Saunders RoadBarrie, ONL4M 6E7
Tel: 1-800-563-1166 Fax: (705) 725-1167
Exclusive Educational Products (Ontario)
Principle of MathematicsApplications of MathematicsEssentials of Mathematics
10 11 12Recommended for:
Copyright Year: 1991
Student, Teacher ResourceCategory:
General Description: Macintosh software provides a set ofcomputer tools for understanding and exploring fundamentalconcepts of data analysis. Students can explore the underlyingmeaning of abstract statistical concepts and processes. Provides aneasy-to-use system for entering, manipulating, and displaying data.Includes a binder with support materials.
System requirements: Macintosh Plus or later (Classic or laterrecommended) 1Mb RAM.
Audience: General
Data Analysis and InterpretationCurriculum Organizer(s):Statistics Workshop
Supplier:
ISBN/Order No:
Price:
(not available)
$129.95
164 Commander BoulevardScarborough, ONM1S 3C7
Tel: 1-800-667-1115 Fax: (416) 293-9009
Gage Educational Publishing Co. (Scarborough)
Principle of MathematicsApplications of MathematicsEssentials of Mathematics
10 11 12Recommended for:
Copyright Year: 1991
B-88

Essentials of Mathematics Grade 11 Collection
Student, Teacher ResourceCategory:
General Description: Binder of activities, projects, and assessmentitems for data analysis and probability includes extensive teachersupport in terms of suggested teaching strategies, sequencing, andscoring rubrics. Activities include both routine calculation andopen-ended projects. Some activities involve critical thinking.Provides random number tables, but other manipulatives must beprovided by the teacher.
Audience: General
Author(s): Birse ... (et al.)
Applications of ProbabilityData Analysis and Interpretation
Curriculum Organizer(s):Triple 'A' Mathematics Program: DataManagement & Probability
Supplier:
ISBN/Order No:
Price:
(not available)
$33.26
243 Saunders RoadBarrie, ONL4M 6E7
Tel: 1-800-563-1166 Fax: (705) 725-1167
Exclusive Educational Products (Ontario)
Principle of MathematicsApplications of MathematicsEssentials of Mathematics
10 11 12Recommended for:
Copyright Year: 1995
Student, Teacher ResourceCategory:
General Description: This resource explores the straight line,dependent upon using the TI-81 graphics calculator. It showsstudents how to plot linear equations, how to make changes to thevariable, and uses the question "what if ...?" to pose multipleproblems within a single context. Students are encouraged tocompare their answers and to predict outcomes.
Audience: General
Author(s): Alexander, B.
Relations and FormulasCurriculum Organizer(s):What If ...?: The Straight Line: Investigationswith the TI-81 Graphics Calculator
Supplier:
ISBN/Order No:
Price:
0969698100
$12.30
26 Prince Andrew PlaceDon Mills, ONM3C 2T8
Tel: 1-800-361-6128 Fax: 1-800-563-9196
Pearson Education Canada
Principle of MathematicsApplications of MathematicsEssentials of Mathematics
10 11 12Recommended for:
Copyright Year: 1993
B-89

Essentials of Mathematics Grade 11 Collection
Student, Teacher ResourceCategory:
General Description: This resource explores the straight line,dependent upon using the TI-82 graphics calculator. It showsstudents how to plot linear equations, how to make changes to thevariable, and uses the question "what if ...?" to pose multipleproblems within a single context. Students are encouraged tocompare their answers and to predict outcomes. This resource alsointroduces the concept of the line of best fit.
Audience: General
Author(s): Alexander, B.
Relations and FormulasCurriculum Organizer(s):What If ...?: The Straight Line: Investigationswith the TI-82 Graphics Calculator
Supplier:
ISBN/Order No:
Price:
0969698135
$12.30
26 Prince Andrew PlaceDon Mills, ONM3C 2T8
Tel: 1-800-361-6128 Fax: 1-800-563-9196
Pearson Education Canada
Principle of MathematicsApplications of MathematicsEssentials of Mathematics
10 11 12Recommended for:
Copyright Year: 1993
B-90
Essentials of Mathematics Grade 12 Collection
Student, Teacher ResourceCategory:
General Description: Twenty-five-minute American videoemphasizes the importance of financial planning in order to achievegoals. It outlines the importance of budgeting, setting goals, andcollecting interest as opposed to paying interest. Effects ofcompound interest versus inflation in money growth are discussed.Teachers will need to develop their own pre- and post-viewingactivities.
Audience: General
Author(s): Pool; Frick
Life/Career ProjectPersonal Finance
Curriculum Organizer(s):The ABC's of Personal Finance
Supplier:
ISBN/Order No:
Price:
MA0003
$26.00
#4-8755 Ash StreetVancouver, BCV6P 6T3
Tel: 1-800-884-2366 Fax: (604) 324-1844
B.C. Learning Connection Inc.
Principle of MathematicsApplications of MathematicsEssentials of Mathematics
10 11 12Recommended for:
Copyright Year: 1995
Student, Teacher ResourceCategory:
General Description: User-friendly software for Macintosh orWindows graphs different forms of linear, quadratic, polynomial, andtrigonometric relations. A second program provides a graph andrequires the student to enter the equation. There are also two gamesthat act as motivational tools. Five graphs can be displayedsimultaneously. The accompanying teacher's guide provides ideasand worksheets.
System requirements for Macintosh: System 6.0.5 or higher (System 7recommended), 1 Mb RAM.System requirements for Windows 3.1: Windows 3.1, 486/25 MHz orbetter, 2 Mb RAM; 256 colour monitor.System requirements for Windows 95: 486DX/50 MHz or higher(Pentium recommended), 4 Mb RAM, 256 colour monitor.
Audience: General
Variation and FormulasCurriculum Organizer(s):Green Globs & Graphing Equations
Supplier:
ISBN/Order No:
Price:
(not available)
$129.95 each version
164 Commander BoulevardScarborough, ONM1S 3C7
Tel: 1-800-667-1115 Fax: (416) 293-9009
Gage Educational Publishing Co. (Scarborough)
Principle of MathematicsApplications of MathematicsEssentials of Mathematics
10 11 12Recommended for:
Copyright Year: 1996
B-91

Essentials of Mathematics Grade 12 Collection
Teacher ResourceCategory:
General Description: Resource uses specific examples to explainhow to organize student projects. The book describes nine differentpresentation formats: videos, skits, photo albums, graphics portfolios,class books, games, posters, models, and business presentations.
Audience: General
Author(s): DeMeulemeester, Katie
Design and MeasurementsLife/Career Projects
Curriculum Organizer(s):Math Projects: Organization, Implementation,and Assessment
Supplier:
ISBN/Order No:
Price:
0-86651-836-3
$18.15
26 Prince Andrew PlaceDon Mills, ONM3C 2T8
Tel: 1-800-361-6128 Fax: 1-800-563-9196
Pearson Education Canada
Principle of MathematicsApplications of MathematicsEssentials of Mathematics
10 11 12Recommended for:
Copyright Year: 1995
Student, Teacher ResourceCategory:
General Description: This package is a set of Windows softwareutilities that can share data. The tools include spreadsheet,calculation, geometry, graphs, manipulatives, fraction strips, andprobability. A colour linking feature between two or more windowsallows data to be shared and represented in a variety of formats.Includes information on installing and using the software andchapters specific to each math tool. Provides a glossary and index.
System requirements for Windows 3.1: 386/33 MHz, 4Mb of RAM,13" VGA monitor, 2Mb hard disk space, PKZIP.System requirements for Windows 95: 486/50 MHz, 8Mb of RAM,13" VGA monitor, 2Mb hard disk space, PKZIP.
Caution: The algebra tile manipulatives have limited usage (first-degreevariables only.) The spreadsheet uses radians as units for sine, cosine, andtangent calculations.
Audience: General
Design and MeasurementsInvestmentsLife/Career ProjectPersonal Finance
Curriculum Organizer(s):Math Tools
Supplier:
ISBN/Order No:
Price:
0134109783
$58.94
26 Prince Andrew PlaceDon Mills, ONM3C 2T8
Tel: 1-800-361-6128 Fax: 1-800-563-9196
Pearson Education Canada
Principle of MathematicsApplications of MathematicsEssentials of Mathematics
10 11 12Recommended for:
Copyright Year: 1997
B-92

Essentials of Mathematics Grade 12 Collection
Teacher ResourceCategory:
General Description: Binder describes the processes and strategiesused to solve problems, including trial and error, making a drawing orsketch, logical thinking, finding a pattern, working backward,elimination, and making a list. Explains each strategy and includesover 200 challenging activities.
Audience: GeneralGifted - opportunities for critical thinking
Author(s): Jones, G.
Problem SolvingCurriculum Organizer(s):Problem Solving: What You Do When You Don'tKnow What To Do
Supplier:
ISBN/Order No:
Price:
(not available)
$31.46
243 Saunders RoadBarrie, ONL4M 6E7
Tel: 1-800-563-1166 Fax: (705) 725-1167
Exclusive Educational Products (Ontario)
Principle of MathematicsApplications of MathematicsEssentials of Mathematics
10 11 12Recommended for:
Copyright Year: 1991
Student, Teacher ResourceCategory:
General Description: This resource explores the straight line,dependent upon using the TI-81 graphics calculator. It showsstudents how to plot linear equations, how to make changes to thevariable, and uses the question "what if ...?" to pose multipleproblems within a single context. Students are encouraged tocompare their answers and to predict outcomes.
Audience: General
Author(s): Alexander, B.
Variation and FormulasCurriculum Organizer(s):What If ...?: The Straight Line: Investigationswith the TI-81 Graphics Calculator
Supplier:
ISBN/Order No:
Price:
0969698100
$12.30
26 Prince Andrew PlaceDon Mills, ONM3C 2T8
Tel: 1-800-361-6128 Fax: 1-800-563-9196
Pearson Education Canada
Principle of MathematicsApplications of MathematicsEssentials of Mathematics
10 11 12Recommended for:
Copyright Year: 1993
B-93

Essentials of Mathematics Grade 12 Collection
Student, Teacher ResourceCategory:
General Description: This resource explores the straight line,dependent upon using the TI-82 graphics calculator. It showsstudents how to plot linear equations, how to make changes to thevariable, and uses the question "what if ...?" to pose multipleproblems within a single context. Students are encouraged tocompare their answers and to predict outcomes. This resource alsointroduces the concept of the line of best fit.
Audience: General
Author(s): Alexander, B.
Variation and FormulasCurriculum Organizer(s):What If ...?: The Straight Line: Investigationswith the TI-82 Graphics Calculator
Supplier:
ISBN/Order No:
Price:
0969698135
$12.30
26 Prince Andrew PlaceDon Mills, ONM3C 2T8
Tel: 1-800-361-6128 Fax: 1-800-563-9196
Pearson Education Canada
Principle of MathematicsApplications of MathematicsEssentials of Mathematics
10 11 12Recommended for:
Copyright Year: 1994
B-94

Calculus Grade 12 Collection
Student, Teacher ResourceCategory:
General Description: Comprehensive resource package consistingof a student text and a student resource manual with sample testscovers all aspects of the Calculus 12 curriculum, with the exceptionof quadratic approximations. Text includes chapter and sectionoverviews, section and chapter exercieses, answer key, andappendices. Student resource manual provides detailed solutions toodd-numbered exercises, and sample tests. A test bank, StudentResource and Survival CD, and an electronic version of the teacher'smanual are optional resources.
Caution: Software is not well implemented and does not addsignificantly to text. U.S. bias - little to no Canadian content.Exploration style questions weak. Little to no group work or exercisesexercising student creativity.
Audience: General
Author(s): Anton, Howard
AntidifferentiationApplications of DerivativesThe DerivativeFunctions, Graphs and LimitsOverview and History of Calculus
Curriculum Organizer(s):Calculus: A New Horizon, Sixth Edition
Supplier:
ISBN/Order No:
Price:
Textbook: 0-471-15307-9Student Resource Manual: 0-471-246239
Textbook: $62.80Student Resource Manual: $30.80
22 Worcester RoadEtobicoke, ONM9W 1L1
Tel: 1-800-567-4797 Fax: 1-800-565-6802
John Wiley & Sons Canada Ltd.
Copyright Year: 1999
Student, Teacher ResourceCategory:
General Description: This resource covers all topics in Calculus 12with the exception of quadratic approximations of curves. Theresource is well laid out and makes good use of technology to aidstudent learning. This resource makes a good attempt to allow foralternate teaching and learning styles through group work andjournal writing assignments. Features include a balanced approach;applications to real-world problems; explorations that provide guidedinvestigations; and exercise sets of various kinds. Selected answersand solutions are provided.
Audience: General
Author(s): Finney ... (et al.)
AntidifferentiationApplications of DerivativesThe DerivativeFunctions, Graphs and LimitsOverview and History of Calculus
Curriculum Organizer(s):Calculus: Graphical, Numerical, Algebraic
Supplier:
ISBN/Order No:
Price:
0-201-32445-8
$99.25
26 Prince Andrew PlaceDon Mills, ONM3C 2T8
Tel: 1-800-361-6128 Fax: 1-800-563-9196
Pearson Education Canada
Copyright Year: 1999
B-95

Calculus Grade 12 Collection
Student, Teacher ResourceCategory:
General Description: Well-laid out, visually appealing resource thatintegrates the historical development of calculus, comprises ninechapters, appendices, solutions, and an index. The text encourageslecture or discovery approaches, pencil and paper skills ortechnology, and supports a variety of presentation styles. Conceptsare clearly introduced and developed. Includes exercise sets,real-world explorations, and problems. An Interactive CalculusCD-ROM is available to support the text.
System Requirements for Windows: Windows '95; CD-ROM drive;8Mb RAM ; 1Mb VRAM.
Caution: Chapter motivators do include significant reference tocommercial products. Teaching strategies are not laid out. Few referencesto First Nations people.
Audience: General
Author(s): Larson; Hostetler; Edwards
Applications of DerivativesThe DerivativeFunctions, Graphs and LimitsOverview and History of Calculus
Curriculum Organizer(s):Calculus of a Single Variable EarlyTranscendental Functions, Second Edition
Supplier:
ISBN/Order No:
Price:
0-395-93321-8
$105.00
1120 Birchmount RoadScarborough, ONM1K 5G4
Tel: 1-800-268-2222 Fax: (416) 752-9365 or 752-9646
Nelson Thomson Learning
Copyright Year: 1999
Student, Teacher ResourceCategory:
General Description: Resource package consisting of a student text,instructor's resource guide, two-volume solutions guide, and optionalInteractive Calculus CD-ROM integrates technology and real-worldproblems in a ten chapter format. The readable text providesmotivational problems and explanations, and well-written examplestake a variety of solution approaches, follow clearly definedstrategies, and build in checking for reasonability of the solution.Exercises vary in level of difficulty and incorporate writing andthinking activities. The instructor's resource guide provides teachingstrategies, tests and answer keys, and the complete solutions guidescontain detailed exercise solutions. An optional Interactive CalculusCD-ROM provides an electronic version of the text.
Caution: The CD-ROM package does not cover the whole curriculumand is only an electronic version of the text.
Audience: General
Author(s): Larson; Hostetler; Edwards
AntidifferentiationApplications of DerivativesThe DerivativeFunctions, Graphs and LimitsOverview and History of Calculus
Curriculum Organizer(s):Calculus of a Single Variable, Sixth Edition
Supplier:
ISBN/Order No:
Price:
Textbook: 0-395-88578-7Solutions Guide Volume 1: 0-395-88769-0Solutions Guide Volume 2: 0-395-88770-4Instructor's Resource Guide: 0-395-88766-6
Textbook: $72.50Solutions Guide Volume 1: $27.00Solutions Guide Volume 2: $27.00Instructor's Resource Guide: $15.50
1120 Birchmount RoadScarborough, ONM1K 5G4
Tel: 1-800-268-2222 Fax: (416) 752-9365 or 752-9646
Nelson Thomson Learning
Copyright Year: 1998
B-96

Calculus Grade 12 Collection
Student, Teacher ResourceCategory:
General Description: Comprehensive resource package consistingof a student text with demo CD-ROM learning tool, studentsolutions manual, and a study guide focuses on conceptualunderstanding of problems with an application to real-worldsituations. Text includes explanations and examples of theconceptual ideas, projects, graded exercises, answer key, and a demoCD-ROM that presents an interactive challenge to students. Thestudent solutions manual presents problem solving strategies, andcompletely worked-out solutions. The study guide offers additionalexplanations and worked-out examples.
System Requirements for Windows: Windows '95; CD-ROM drive;8Mb RAM ; 1Mb VRAM.
Audience: General
Author(s): Stewart, James
AntidifferentiationApplications of DerivativesThe DerivativeFunctions, Graphs and LimitsOverview and History of Calculus
Curriculum Organizer(s):Single Variable Calculus Early Transcendentals,Fourth Edition
Supplier:
ISBN/Order No:
Price:
Textbook: 0-534-35563-3Study Guide: 0-534-36820-4Student Solutions Manaul: 0-534-36301-6
Textbook: $68.00Study Guide: $29.00Student Solutions Manual: $32.00
1120 Birchmount RoadScarborough, ONM1K 5G4
Tel: 1-800-268-2222 Fax: (416) 752-9365 or 752-9646
Nelson Thomson Learning
Copyright Year: 1999
B-97

Cross-Curricular Interests
APPENDIX C

APPENDIX C: CROSS-CURRICULAR INTERESTS
C-2

C-3
APPENDIX C: CROSS-CURRICULAR INTERESTS
The three principles of learning statedin the introduction of this IntegratedResource Package (IRP) support
the foundation of The Kindergarten to Grade12 Education Plan. They have guided allaspects of the development of this document,including the curriculum outcomes,instructional strategies, assessment strategies,and learning resource evaluations.
In addition to these three principles, theMinistry of Education wants to ensure thateducation in British Columbia is relevant,equitable, and accessible to all learners. Inorder to meet the needs of all learners, thedevelopment of each component of thisdocument has been guided by a series ofcross-curricular reviews. This appendixoutlines the key aspects of each of thesereviews. The information here is intended toguide the users of this document as theyengage in school and classroom organizationand instructional planning and practice.
The areas of cross-curricular interest are:
• Applied Focus in Curriculum• Career Development• English as a Second Language (ESL)• Environment and Sustainability• Aboriginal Studies• Gender Equity• Information Technology• Media Education• Multiculturalism and Anti-Racism• Science-Technology-Society• Special Needs
APPLIED FOCUS IN CURRICULUM
An applied focus combines the followingcomponents in curriculum development,consistent with the nature of each subjectarea:
Learning Outcomes—expressed asobservable, measurable, and reportableabilities or skills
Employability Skills—inclusion ofoutcomes or strategies that promote skillsthat will enable students to be successfulin the workplace (e.g., literacy, numeracy,critical and creative thinking, problemsolving, technology, and informationmanagement)
Contextual Learning—an emphasis onlearning by doing; the use of abstract ideasand concepts, including theories, laws,principles, formulae, rules, or proofs in apractical context (e.g., home, workplace,community)
Interpersonal Skills—inclusion of strategiesthat promote co-operative activities andteamwork
Career Development—inclusion ofappropriate connections to careers,occupations, entrepreneurship, or theworkplace
An applied focus in all subjects and coursespromotes the use of practical applications todemonstrate theoretical knowledge. Usingreal-world and workplace problems andsituations as a context for the applicationof theory makes school more relevant tostudents’ needs and goals. An applied focusstrengthens the link between what studentsneed to know to function effectively in theworkplace or in postsecondary educationand what they learn in Kindergartenthrough Grade 12.
Some examples of an applied focus indifferent subjects are:
English Language Arts—increasingemphasis on language used in everydaysituations and in the workplace, such as forjob interviews, memo and letter writing, wordprocessing, and technical communications(including the ability to interpret technicalreports, manuals, tables, charts, andgraphics)

APPENDIX C: CROSS-CURRICULAR INTERESTS
C-4
Mathematics—more emphasis on skillsneeded in the workplace, includingknowledge of probability and statistics, logic,measurement theory, and problem solving
Science—more practical applications andhands-on experience of science, such asreducing energy waste in school or at home,caring for a plant or animal in the classroom,and using computers to produce tables andgraphs and for spreadsheets
Business Education—more emphasis onreal-world applications such as preparingrésumés and personal portfolios, participatingin groups to solve business communicationproblems, using computer software to keeprecords, and using technology to create andprint marketing material
Visual Arts—applying visual arts skillsto real-world design, problem solving, andcommunications; exploring careerapplications of visual arts skills;experimenting with a variety of newtechnologies to create images; and a newemphasis on creating and understandingimages of social significance to the community
This summary is derived fromThe Kindergarten toGrade 12 Education Plan (September 1994), and curriculumdocuments from British Columbia and other jurisdictions.
CAREER DEVELOPMENT
Career development is an ongoing processthrough which learners integrate theirpersonal, family, school, work, andcommunity experiences to facilitatecareer and lifestyle choices.
Students develop:
• an open attitude toward a variety ofoccupations and types of work
• an understanding of the relationshipbetween work and leisure, work and thefamily, and work and one’s interests andabilities
• an understanding of the role of technologyin the workplace and in daily life
• an understanding of the relationshipbetween work and learning
• an understanding of the changes takingplace in the economy, society, and the jobmarket
• an ability to construct learning plans andreflect on the importance of lifelong learning
• an ability to prepare for multiple rolesthroughout life
The main emphases of career developmentare career awareness, career exploration,career preparation, career planning, andcareer work experience.
In the Primary Years
Career awareness promotes an open attitudetoward a variety of career roles and types ofwork. Topics include:
• the role of work and leisure• relationships among work, the family,
one’s personal interests, and one’s abilities
A variety of careers can be highlightedthrough the use of in-class learning activitiesthat focus on the students themselves andon a range of role models, including non-traditional role models.
In Grades 4 to 8
The emphasis on self-awareness and careerawareness is continued. Topics include:
• interests, aptitudes, and possible futuregoals
• technology in the workplace and in ourdaily lives
• social, family, and economic changes• future education options• career clusters (careers that are related to
one another)• lifestyles• external influences on decision making

C-5
APPENDIX C: CROSS-CURRICULAR INTERESTS
Games, role-playing, drama, and appropriatecommunity volunteer experience can be usedto help students actively explore the world ofwork. Field experiences in which studentsobserve and interview workers in theiroccupational environments may alsobe appropriate. These learning activities willfacilitate the development of interpersonalcommunications and group problem-solvingskills needed in the workplace and in otherlife situations.
In Grades 9 and 10
The emphasis is on providing studentswith opportunities to prepare for and makeappropriate and realistic decisions. Indeveloping their student learning plans, theywill relate self-awareness to their goals andaspirations. They will also learn many basicskills and attitudes that are required for aneffective transition into adulthood. This willassist in preparing them to be responsibleand self-directed throughout their lives.Topics include:
• entrepreneurial education• employability skills (e.g., how to find and
keep a job)• the importance of lifelong education and
career planning• involvement in the community• the many different roles that an individual
can play throughout life• the dynamics of the working world (e.g.,
unions, unemployment, supply anddemand, Pacific Rim, free trade)
The examination of personal interests andskills through a variety of career explorationopportunities (e.g., job shadowing) isemphasized at this level. Group discussionand individual consultation can be used tohelp students examine and confirm theirpersonal values and beliefs.
In Grades 11 and 12
Career development in these grades isfocussed more specifically on issues relatedto the world of work. These include:
• dynamics of the changing work force andchanging influences on the job market(e.g., developing technology and economictrends)
• job-keeping and advancement skills(interpersonal skills needed in theworkplace, employment standards)
• occupational health issues and accessinghealth support services
• funding for further education• alternative learning strategies and
environments for different life stages• mandatory work experience (minimum
30 hours)
Work Experience
Work experience provides students withopportunities to participate in a variety ofworkplace situations to help prepare themfor the transition to a work environment.Work experience also provides students withopportunities to:
• connect what they learn in school with theskills and knowledge needed in theworkplace and society in general
• experience both theoretical and appliedlearning, which is part of a broad liberaleducation
• explore career directions identified in theirStudent Learning Plans
Descriptions of career development are drawnfrom the ministry's Career Developer’s Handbook,Guidelines for the Kindergarten to Grade 12 EducationPlan, Implementation Resource, Part 1, and the Career andPersonal Planning 8 to 12 IRP (1997).
APPENDIX C: CROSS-CURRICULAR INTERESTS
C-6
ENGLISH AS A SECOND LANGUAGE (ESL)
ESL assistance is provided to students whoseuse of English is sufficiently different fromstandard English to prevent them fromreaching their potential. Many studentslearning English speak it quite fluently andseem to be proficient. School, however,demands a more sophisticated version ofEnglish, both in reading and writing. Thuseven fluent speakers might require ESL toprovide them with an appropriate languageexperience that is unavailable outside theclassroom. ESL is a transitional service ratherthan a subject. Students are in the process oflearning the language of instruction and, inmany cases, the content matter of subjectsappropriate to their grade level. Thus ESLdoes not have a specific curriculum. Theprovincial curriculum is the basis of much ofthe instruction and is used to teach Englishas well as individual subject areas. It is themethodology, the focus, and the level ofengagement with the curriculum thatdifferentiates ESL services from otherschool activities.
Students in ESL
Nearly 10% of the British Columbia schoolpopulation is designated as ESL students.These students come from a diversity ofbackgrounds. Most are recent immigrants toBritish Columbia. Some are Canadian-bornbut have not had the opportunity to learnEnglish before entering the primary grades.The majority of ESL students have a well-developed language system and have hadsimilar schooling to that of British Columbia-educated students. A small number, becauseof previous experiences, are in need of basicsupport such as literacy training, academicupgrading, and trauma counselling.
Teachers may have ESL students at any levelin their classes. Many ESL students areplaced in subject-area classes primarily forthe purpose of contact with English-speakingpeers and experience with the subject andlanguage. Other ESL students are whollyintegrated into subject areas. A successfulintegration takes place when the student hasreached a level of English proficiency andbackground knowledge in a subject to besuccessful with a minimum of extra support.
Optimum Learning Environment
The guiding principle for ESL support is theprovision of a learning environment wherethe language and concepts can beunderstood by students.
Good practices to enhance learning include:
• using real objects and simple language atthe beginning level
• taking into consideration other culturalbackgrounds and learning styles at anylevel
• providing adapted (language-reduced)learning materials
• respecting a student’s “silent period”when expression does not reflect the levelof comprehension
• allowing students to practise andinternalize information before givingdetailed answers
• differentiating between form and contentin student writing
• keeping in mind the level of demandplaced on students
This summary is drawn from Supporting Learnersof English: Information for School and DistrictAdministrators, RB0032, 1993, and ESL Policy DiscussionPaper (Draft), Social Equity Branch, December 1994.

C-7
APPENDIX C: CROSS-CURRICULAR INTERESTS
ENVIRONMENT AND SUSTAINABILITY
Environmental education is defined as a wayof understanding how humans are part ofand influence the environment. It involves:
• students learning about their connections tothe natural environment through all subjects
• students having direct experiences inthe environment, both natural andhuman-built
• students making decisions about andacting for the environment
The term sustainability helps to describesocieties that “promote diversity and do notcompromise the natural world for anyspecies in the future.”
Value of Integrating Environmentand Sustainability Themes
Integrating “environment and sustainability”themes into the curriculum helps studentsdevelop a responsible attitude toward caringfor the earth. Students are provided withopportunities to identify their beliefs andopinions, reflect on a range of views, andultimately make informed and responsiblechoices.
Some guiding principles that supportthe integration of “environment andsustainability” themes in subjects fromKindergarten to Grade 12 include:
• Direct experience is the basis of learning.• Responsible action is integral to, and a
consequence of, environmental education.• Life on Earth depends on, and is part of,
complex systems.• Human decisions and actions have
environmental consequences.• Environmental awareness enables students
to develop an aesthetic appreciation of theenvironment.
• The study of the environment enablesstudents to develop an environmentalethic.
This summary is derived from Environmental Conceptsin the Classroom: A Guide for Teachers, Ministry ofEducation, 1995.
ABORIGINAL STUDIES
Aboriginal studies focus on the richnessand diversity of Aboriginal cultures andlanguages. These cultures and languages areexamined within their own unique contextsand within historical, contemporary, andfuture realities. Aboriginal studies are basedon a holistic perspective that integrates thepast, present, and future. Aboriginal peoplesare the original inhabitants of NorthAmerica and live in sophisticated,organized, and self-sufficient societies. TheFirst Nations constitute a cultural mosaic asrich and diverse as that of Western Europe,including different cultural groups (e.g.,Nisga’a, KwaKwaka’Wakw, Nlaka’pamux,Secwepemc, Skomish, Tsimshian). Each isunique and has a reason to be featured in theschool system. The First Nations of BritishColumbia constitute an important part of thehistorical and contemporary fabric of theprovince.
Value of Integrating Aboriginal Studies
• First Nations values and beliefs aredurable and relevant today.
• There is a need to validate andsubstantiate First Nations identity.
• First Nations peoples have strong, dynamic,and evolving cultures that have adapted tochanging world events and trends.
• There is a need to understand similaritiesand differences among cultures to createtolerance, acceptance, and mutual respect.
APPENDIX C: CROSS-CURRICULAR INTERESTS
C-8
• There is a need for informed, reasonablediscussion and decision making regardingFirst Nations issues, based on accurateinformation (for example, as moderntreaties are negotiated by Canada, BritishColumbia, and First Nations).
In studying First Nations, it is expected thatstudents will:
• demonstrate an understanding andappreciation for the values, customs, andtraditions of First Nations peoples
• demonstrate an understanding of andappreciation for unique First Nationscommunications systems
• demonstrate a recognition of the importanceof the relationship between First Nationspeoples and the natural world
• recognize dimensions of First Nations artas a total cultural expression
• give examples of the diversity andfunctioning of the social, economic, andpolitical systems of First Nations peoplesin traditional and contemporary contexts
• describe the evolution of human rightsand freedoms as they pertain to FirstNations peoples
Some examples of curriculum integrationinclude:
Visual Arts—comparing the artistic stylesof two or more First Nations cultures
English Language Arts—analysingportrayals and images of First Nationspeoples in various works of literature
Home Economics—identifying forms offood, clothing, and shelter in past andcontemporary First Nations cultures
Technology Education—describing thesophistication of traditional First Nationstechnologies (e.g., bentwood or kerfed boxes,weaving, fishing gear)
Physical Education—participating in anddeveloping an appreciation for First Nationsgames and dances
This summary is derived from First Nations Studies:Curriculum Assessment Framework (Primary ThroughGraduation), Aboriginal Education Branch, 1992, andB.C. First Nations Studies 12 Curriculum, AboriginalEducation Branch, 1994.
GENDER EQUITY
Gender-equitable education involves theinclusion of the experiences, perceptions,and perspectives of girls and women, as wellas boys and men, in all aspects of education.It will initially focus on girls in order toredress historical inequities. Generally, theinclusive strategies, which promote theparticipation of girls, also reach boys whoare excluded by more traditional teachingstyles and curriculum content.
Principles of Gender Equity in Education
• All students have the right to a learningenvironment that is gender equitable.
• All education programs and careerdecisions should be based on a student’sinterest and ability, regardless of gender.
• Gender equity incorporates aconsideration of social class, culture,ethnicity, religion, sexual orientation,and age.
• Gender equity requires sensitivity,determination, commitment, and vigilanceover time.
• The foundation of gender equity isco-operation and collaboration amongstudents, educators, educationorganizations, families, and membersof communities.

C-9
APPENDIX C: CROSS-CURRICULAR INTERESTS
• Watch for biases (e.g., in behaviour orlearning resources) and teach studentsstrategies to recognize and work toeliminate inequities they observe.
• Be aware of accepted gender-bias practicesin physical activity (e.g., in team sport,funding for athletes, and choices inphysical education programs).
• Do not assume that all students areheterosexual.
• Share information and build a network ofcolleagues with a strong commitment toequity.
• Model non-biased behaviour: useinclusive, parallel, or gender-sensitivelanguage; question and coach male andfemale students with the same frequency,specificity, and depth; allow quiet studentssufficient time to respond to questions.
• Have colleagues familiar with commongender biases observe your teaching anddiscuss any potential bias they mayobserve.
• Be consistent over time.
This summary is derived from the preliminary Reportof the Gender Equity Advisory Committee, received by theMinistry of Education in February 1994, and from areview of related material.
INFORMATION TECHNOLOGY
Information technology is the use of toolsand electronic devices that allow us to create,explore, transform, and express information.
Value of Integrating Information Technology
As Canada moves from an agricultural andindustrial economy to the information age,students must develop new knowledge,skills, and attitudes. The informationtechnology curriculum has been developedto be integrated into all new curricula toensure that students know how to usecomputers and gain the technologicalliteracy demanded in the workplace.
General Strategies forGender-Equitable Teaching
• Be committed to learning about andpractising equitable teaching.
• Use gender-specific terms to marketopportunities—for example, if atechnology fair has been designed toappeal to girls, mention girls clearly andspecifically. Many girls assume thatgender-neutral language in non-traditionalfields means boys.
• Modify content, teaching style, andassessment practices to make non-traditional subjects more relevant andinteresting for female and male students.
• Highlight the social aspects and usefulnessof activities, skills, and knowledge.
• Comments received from female studentssuggest that they particularly enjoyintegrative thinking; understandingcontext as well as facts; and exploringsocial, moral, and environmental impactsof decisions.
• When establishing relevance of material,consider the different interests and lifeexperiences that girls and boys may have.
• Choose a variety of instructional strategiessuch as co-operative and collaborativework in small groups, opportunities forsafe risk taking, hands-on work, andopportunities to integrate knowledge andskills (e.g., science and communication).
• Provide specific strategies, specialopportunities, and resources to encouragestudents to excel in areas of study inwhich they are typically under-represented.
• Design lessons to explore manyperspectives and to use different sourcesof information; refer to female and maleexperts.
• Manage competitiveness in the classroom,particularly in areas where male studentstypically excel.

APPENDIX C: CROSS-CURRICULAR INTERESTS
C-10
In learning about information technology,students acquire skills in informationanalysis and evaluation, word processing,database analysis, information management,graphics, and multimedia applications.Students also identify ethical and socialissues arising from the use of informationtechnology.
With information technology integrated intothe curriculum, students will be expected to:
• demonstrate basic skills in handlinginformation technology tools
• demonstrate an understanding ofinformation technology structure andconcepts
• relate information technology to personaland social issues
• define a problem and develop strategiesfor solving it
• apply search criteria to locate or sendinformation
• transfer information from external sources• evaluate information for authenticity and
relevance• arrange information in different patterns
to create new meaning• modify, revise, and transform information• apply principles of design affecting the
appearance of information• deliver a message to an audience using
information technology
The curriculum organizers are:
• Foundations—provides the basic physicalskills and intellectual and personalunderstanding required to use informationtechnology, as well as self-directedlearning skills and socially responsibleattitudes
• Process—allows students to select,organize, and modify information to solveproblems
• Presentation—provides students with anunderstanding of how to communicateideas effectively using a variety ofinformation technology tools
This information is derived from the InformationTechnology K to 12 curriculum.
MEDIA EDUCATION
Media education is a multidisciplinary andinterdisciplinary approach to the study ofmedia. Media education deals with keymedia concepts and focusses on broadissues such as the history and role of mediain different societies and the social, political,economic, and cultural issues related to themedia. Instead of addressing the concepts indepth, as one would in media studies, mediaeducation deals with most of the centralmedia concepts as they relate to a varietyof subjects.
Value of Integrating Media Education
Popular music, TV, film, radio, magazines,computer games, and information services—all supplying media messages—arepervasive in the lives of students today.Media education develops students’ abilitiesto think critically and independently aboutissues that affect them. Media educationencourages students to identify and examinethe values contained in media messages. Italso cultivates the understanding that thesemessages are produced by others to inform,persuade, and entertain for a variety ofpurposes. Media education helps studentsunderstand the distortions that may resultfrom the use of particular media practicesand techniques.
All curriculum areas provide learningopportunities for media education. It isnot taught as a separate curriculum.

C-11
APPENDIX C: CROSS-CURRICULAR INTERESTS
The key themes of media education are:
• media products (purpose, values,representation, codes, conventions,characteristics, production)
• audience interpretation and influence(interpretation, influence of media onaudience, influence of audience on media)
• media and society (control, scope)
Examples of curriculum integration include:
English Language Arts—critiquingadvertising and examining viewpoints
Visual Arts—analysing the appeal of animage by age, gender, status, and othercharacteristics of the target audience
Personal Planning—examining the influenceof the media on body concepts and healthylifestyle choices
Drama—critically viewing professional andamateur theatre productions, dramatic films,and television programs to identify purpose
Social Studies—comparing the depiction ofFirst Nations in the media over time
This summary is derived from A Cross-CurricularPlanning Guide for Media Education, prepared by theCanadian Association for Media Education for theCurriculum Branch in 1994.
MULTICULTURALISM AND ANTI-RACISM
EDUCATION
Multiculturalism Education
Multiculturalism education stresses thepromotion of understanding, respect, andacceptance of cultural diversity within oursociety.
Multiculturalism education involves:
• recognizing that everyone belongs to acultural group
• accepting and appreciating culturaldiversity as a positive feature of our society
• affirming that all ethnocultural groups areequal within our society
• understanding that multiculturalismeducation is for all students
• recognizing that similarities acrosscultures are much greater than differencesand that cultural pluralism is a positiveaspect in our society
• affirming and enhancing self-esteemthrough pride in heritage, and providingopportunities for individuals to appreciatethe cultural heritage of others
• promoting cross-cultural understanding,citizenship, and racial harmony
Anti-Racism Education
Anti-racism education promotes theelimination of racism through identifying andchanging institutional policies and practicesas well as identifying individual attitudes andbehaviours that contribute to racism.
Anti-racism education involves:
• proposing the need to reflect on one’s ownattitudes about race and anti-racism
• understanding what causes racism in orderto achieve equality
• identifying and addressing racism at boththe personal and institutional level
• acknowledging the need to take individualresponsibility for eliminating racism
• working toward removing systemicbarriers that marginalize groups of people
• providing opportunities for individuals totake action to eliminate all forms of racism,including stereotypes, prejudice, anddiscrimination
Value of Integrating Multiculturalismand Anti-Racism Education
Multiculturalism and anti-racism educationprovides learning experiences that promotestrength through diversity and social,

APPENDIX C: CROSS-CURRICULAR INTERESTS
C-12
economic, political, and cultural equity.Multiculturalism and anti-racism educationgives students learning experiences that areintended to enhance their social, emotional,aesthetic, artistic, physical, and intellectualdevelopment. It provides learners with thetools of social literacy and skills for effectivecross-cultural interaction with diversecultures. It also recognizes the importanceof collaboration between students, parents,educators, and communities working towardsocial justice in the education system.
The key goals of multiculturalism andanti-racism education are:
• to enhance understanding of and respectfor cultural diversity
• to increase creative interculturalcommunication in a pluralistic society
• to provide equal opportunities foreducational achievement by all learners,regardless of culture, national origin,religion, or social class
• to develop self-worth, respect for oneselfand others, and social responsibility
• to combat and eliminate stereotyping,prejudice, discrimination, and other formsof racism
• to include the experiences of all studentsin school curricula
Examples of curriculum integration include:
Fine Arts—identifying ways in which thefine arts portray cultural experiences
Humanities—identifying similarities anddifferences within cultural groups’ lifestyles,histories, values, and beliefs
Mathematics or Science—recognizing thatindividuals and cultural groups have usedboth diverse and common methods tocompute, to record numerical facts, andto measure
Physical Education—developing anappreciation of games and dances from diversecultural groups
This summary is derived from Multicultural and Anti-Racism Education—Planning Guide (Draft), developed bythe Social Equity Branch in 1994.
SCIENCE-TECHNOLOGY-SOCIETY
Science-Technology-Society (STS) addresses ourunderstanding of inventions and discoveries andof how science and technology affect the well-being of individuals and our global society.
The study of STS includes:
• the contributions of technology toscientific knowledge and vice versa
• the notion that science and technologyare expressions of history, culture, anda range of personal factors
• the processes of science and technology suchas experimentation, innovation, and invention
• the development of a conscious awareness ofethics, choices, and participation in scienceand technology
Value of Integrating STS
The aim of STS is to enable learners to investigate,analyse, understand, and experience thedynamic interconnection of science,technology, and human and natural systems.
The study of STS in a variety of subjects givesstudents opportunities to:
• discover knowledge and develop skills tofoster critical and responsive attitudestoward innovation
• apply tools, processes, and strategies foractively challenging emerging issues
• identify and consider the evolution ofscientific discovery, technological change,and human understanding over time, in thecontext of many societal and individualfactors

C-13
APPENDIX C: CROSS-CURRICULAR INTERESTS
• develop a conscious awareness of personalvalues, decisions, and responsible actionsabout science and technology
• explore scientific processes andtechnological solutions
• contribute to responsible and creativesolutions using science and technology
The organizing principles of STS are: Humanand Natural Systems, Inventions andDiscoveries, Tools and Processes, Society andChange. Each organizer may be developedthrough a variety of contexts, such as theeconomy, the environment, ethics, socialstructures, culture, politics, and education.Each context provides a unique perspectivefor exploring the critical relationships thatexist and the challenges we face as individualsand as a global society.
Examples of curriculum integration include:
Visual Arts—recognizing that demandsgenerated by visual artists have led to thedevelopment of new technologies andprocesses (e.g., new permanent pigments,fritted glazes, drawing instruments)
English Language Arts—analysing therecent influence of technologies on listening,speaking, and writing (e.g., CDs, voice mail,computer-generated speech)
Physical Education—studying howtechnology has affected our understandingof the relationship between activity andwell-being
This summary is derived from Science-Technology-Society—A Conceptual Framework, Curriculum Branch, 1994.
SPECIAL NEEDS
Students with special needs have disabilitiesof an intellectual, physical, sensory, emotional,or behavioural nature; or have learningdisabilities; or have exceptional gifts or talents.
All students can benefit from an inclusivelearning environment that is enriched by thediversity of the people within it. Opportunitiesfor success are enhanced when provinciallearning outcomes and resources aredeveloped with regard for a wide range ofstudent needs, learning styles, and modesof expression.
Educators can assist in creating moreinclusive learning environments byintroducing the following:
• activities that focus on developmentand mastery of foundational skills (basicliteracy)
• a range of co-operative learning activitiesand experiences in the school andcommunity, including the application ofpractical, hands-on skills in a variety ofsettings
• references to specialized learningresources, equipment, and technology
• ways to accommodate special needs (e.g.,incorporating adaptations and extensionsto content, process, product, pacing, andlearning environment; suggestingalternative methodologies or strategies;making references to special services)
• a variety of ways, other than throughpaper-and-pencil tasks, for students todemonstrate learning (e.g., dramatizingevents to demonstrate understanding ofa poem, recording observations in scienceby drawing or by composing andperforming a music piece)
• promotion of the capabilities andcontributions of children and adultswith special needs
• participation in physical activity
All students can work toward achievementof the provincial learning outcomes. Manystudents with special needs learn what allstudents are expected to learn. In some cases
APPENDIX C: CROSS-CURRICULAR INTERESTS
C-14
the student’s needs and abilities require thateducation programs be adapted or modified.A student’s program may include regularinstruction in some subjects, modifiedinstruction in others, and adaptedinstruction in still others. Adaptations andmodifications are specified in the student’sIndividual Education Plan (IEP).
Adapted Programs
An adapted program addresses the learningoutcomes of the prescribed curriculum butprovides adaptations so the student canparticipate in the program. Theseadaptations may include alternative formatsfor resources (e.g., braille, books-on-tape),instructional strategies (e.g., use ofinterpreters, visual cues, learning aids), andassessment procedures (e.g., oral exams,additional time). Adaptations may also bemade in areas such as skill sequence, pacing,methodology, materials, technology,equipment, services, and setting. Studentson adapted programs are assessed using thecurriculum standards and can receive fullcredit.
Modified Programs
A modified program has learning outcomesthat are substantially different from theprescribed curriculum and specificallyselected to meet the student’s special needs.For example, a Grade 5 student in languagearts may be working on recognizing commonsigns and using the telephone, or a secondarystudent could be mapping the key features ofthe main street between school and home. Astudent on a modified program is assessed inrelation to the goals and objectivesestablished in the student’s IEP.

APPENDIX DAssessment and Evaluation

D-2
APPENDIX D: ASSESSMENT AND EVALUATION • Introduction

D-3
APPENDIX D: ASSESSMENT AND EVALUATION • Introduction
ASSESSMENT AND EVALUATION IN GRADE 10TO 12 MATHEMATICS COURSES
The samples in this appendix illustrateprocedures teachers might use in assessingstudent understanding of content andprocesses in grade 10 to 12 mathematicscourses. The focus of the samples is ongoingassessment and evaluation as a way ofsupporting learning in the classroom.Ongoing assessment includes observation,questioning, oral and written communica-tion and peer and self-assessment. Theassessment activities in each sample focuseson an understanding of mathematicalprocesses, communication of ideas, emergingunderstanding of concepts, abilities to applyconcepts and attitudes toward learning aswell as on the end product.
Teacher-constructed tests and quizzes arerecognized as a valid means of assessingcertain aspects of student learning. Thesamples presented here represent alterna-tives that teachers might use to support andsupplement traditional tests on a particularunit of work. Some samples include assess-ment ideas teachers might want to use tolook at their students’ communication skillsor their abilities to work effectively andproductively in groups. Following thesamples is information about various assess-ment and evaluation practices, including testconstruction that teachers will find useful asa resource when developing classroom tests.
Using a variety of assessment techniquesprovides students with opportunities todemonstrate what they have learned morereadily and gives teachers a broader base ofinformation on students’ mathematicaldevelopment.
The assessment practices described in thesamples are supported by current theories ofassessment, including the EvaluationStandards outlined by the National Councilof Teachers of Mathematics:
• Methods and tasks for assessing students’learning should be aligned with thecurriculum’s goals, objectives andmathematical content.
• Decisions concerning students’ learningshould be made on the basis of aconvergence of information obtained froma variety of sources.
• Assessment methods and instrumentsshould be selected on the basis of the typeof information sought, the use to whichthe information will be put and thedevelopmental level and maturity of thestudent.
The assessment practices described in thefollowing samples include those that focuson assessment and evaluation of:
• Specific mathematics content• Problem solving processes• Students’ development of group and
communication skills• Students’ attitudes toward learning math-
ematics
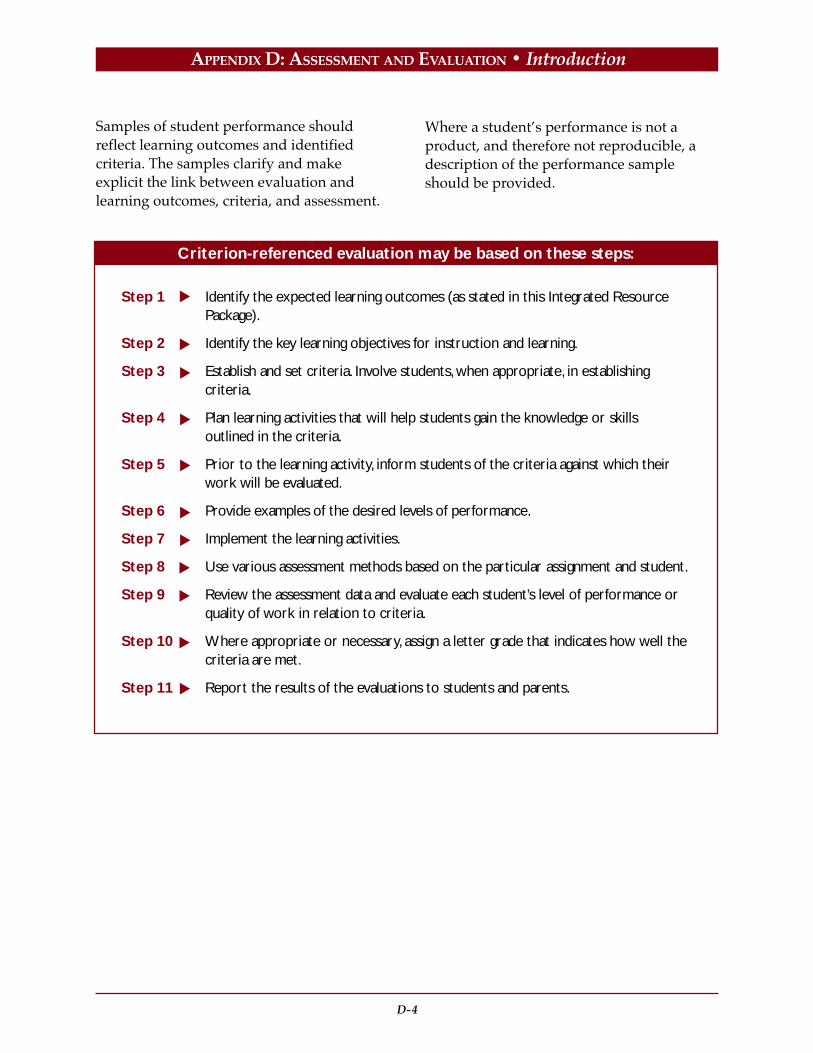
D-4
APPENDIX D: ASSESSMENT AND EVALUATION • Introduction
Criterion-referenced evaluation may be based on these steps:
Step 1 Identify the expected learning outcomes (as stated in this Integrated ResourcePackage).
Step 2 Identify the key learning objectives for instruction and learning.
Step 3 Establish and set criteria. Involve students, when appropriate, in establishingcriteria.
Step 4 Plan learning activities that will help students gain the knowledge or skillsoutlined in the criteria.
Step 5 Prior to the learning activity, inform students of the criteria against which theirwork will be evaluated.
Step 6 Provide examples of the desired levels of performance.
Step 7 Implement the learning activities.
Step 8 Use various assessment methods based on the particular assignment and student.
Step 9 Review the assessment data and evaluate each student’s level of performance orquality of work in relation to criteria.
Step 10 Where appropriate or necessary, assign a letter grade that indicates how well thecriteria are met.
Step 11 Report the results of the evaluations to students and parents.
Samples of student performance shouldreflect learning outcomes and identifiedcriteria. The samples clarify and makeexplicit the link between evaluation andlearning outcomes, criteria, and assessment.
Where a student’s performance is not aproduct, and therefore not reproducible, adescription of the performance sampleshould be provided.

D-5
APPENDIX D: ASSESSMENT AND EVALUATION • Introduction
Prescribed learning outcomes,expressed in measurable terms,provide the basis for the development
of learning activities, and assessment andevaluation strategies. After a generaldiscussion of assessment and evaluation,this appendix uses sample evaluation plansto show how activities, assessment, andevaluation might come together in aparticular mathematics program. The finalsection, Assessment Practices, provides somegeneral guidance for classroom assessmentand evaluation.
ASSESSMENT AND EVALUATION
Assessment is the systematic gathering ofinformation about what students know, areable to do, and are working toward. Assess-ment methods and tools include: observation,student self-assessments, daily practice assign-ments, quizzes, samples of student work,pencil-and paper tests, holistic rating scales,projects, oral and written reports, performancereviews, and portfolio assessments.
Students performance is evaluated from theinformation collected through assessmentactivities. Teachers use their insight,knowledge about learning, and experiencewith students, along with the specific criteriathey establish, to make judgements aboutstudent performance in relation to prescribedlearning outcomes.
Students benefit most when evaluation isprovided on a regular, ongoing basis. Whenevaluation is seen as an opportunity topromote learning rather than as a finaljudgment, it shows learners their strengthsand suggests how they can develop further.Students can use this information to redirectefforts, make plans, and establish futurelearning goals.
Evaluation may take different forms,depending on the purpose.
• Criterion-referenced evaluation should beused to evaluate student performance inclassrooms. It is referenced to criteriabased on learning outcomes described inthe provincial curriculum. The criteriareflect a student’s performance based onspecific learning activities. When a student’sprogram is substantially modified,evaluation may be referenced to individualgoals. These modifications are recorded inan Individual Education Plan (IEP).
• Norm-referenced evaluation is used forlarge-scale system assessments; it is not tobe used for a classroom assessment. Aclassroom does not provide a large enoughreference group for a norm-referencedevaluation system. Norm-referencedevaluation compares student achievementto that of other, rather that comparing howwell a student meets the criteria of aspecified set of learning outcomes.
Criterion-Referenced Evaluation
In criterion-referenced evaluation, astudent’s performance is compared to estab-lished criteria rather that to the performanceof other students. Evaluation referenced toprescribed curriculum requires that criteriaare established based on the learning outcomeslisted under the curriculum organizers forgrade 11 and 12 mathematics courses.
Criteria are the basis of evaluating studentprogress. They identify the critical aspectsof a performance of product that describe, inspecific terms, what is involved in meetingthe learning outcomes. Criteria can be usedto evaluated student performance in relationto learning outcomes. For example, weightingcriteria, using rating scales, or performancerubrics (reference sets) are three ways thatstudent performance can be evaluatedusing criteria.


APPENDIX DAssessment and Evaluation Samples

D-8
APPENDIX D: ASSESSMENT AND EVALUATION • Samples

D-9
APPENDIX D: ASSESSMENT AND EVALUATION • Samples
The samples in this section show how ateacher might link criteria to learningoutcomes. Each sample is based on
prescribed learning outcomes taken from oneor more organizers. The samples providebackground information to explain theclassroom context; suggested instruction tasksand strategies; the tools and methods used togather assessment information; and the criteriaused to evaluate student performance.
How the Samples are Organized
There are six parts to each sample:
• identification of the prescribed learningoutcomes
• unit focus• planning the unit• the unit• defining the criteria• assessing and evaluating student
performance
Prescribed Learning Outcomes
This part identifies the organizer ororganizers and the specific prescribedlearning outcomes selected for the sample.
Unit Focus
This is a summary of the key features of thesample.
Planning the Unit
This part describes how the teacher preparedfor the unit.
The Unit
This part outlines:
• instructional tasks• the opportunities that students were given
to practise learning
• the feedback and support that was offeredstudents by the teacher
• the ways in which the teacher preparedstudents for the assessment
Defining the Criteria
This part illustrates the specific criteria,which are based on the prescribed learningoutcomes, the assessment task, and variousreference sets.
Assessing and Evaluating StudentPerformance
This part includes:
• assessment tasks or activities• the support that the teacher offered
students• tools and methods used to gather the
assessment information• the way the criteria were used to evaluate
student performance
EVALUATION SAMPLES
The samples on the following pages illustratehow a teacher might apply criterion-referenced evaluation in grade 10, 11, and 12mathematics courses.
• Sample 1: Applications of Mathematics 10Data Tables(Page D-11)
• Sample 2: Applications of Mathematics 11Probability and Statistics(Page D-15)
• Sample 3: Applications of Mathematics 12Vectors(Page D-24)
• Sample 4: Essentials of Mathematics 10Wages, Salaries, and Expenses(Page D-28)
D-10
APPENDIX D: ASSESSMENT AND EVALUATION • Samples
• Sample 5: Essentials of Mathematics 11Owning and Operating a Vehicle(Page D-31)
• Sample 6: Essentials of Mathematics 12Comparative Study of Career Choices(Page D-36)
• Sample 7: Principles of Mathematics 10Radicals(Page D-41)
• Sample 8: Principles of Mathematics 11Graphing Techniques(Page D-47)
• Sample 9: Principles of Mathematics 12Logarithms(Page D-53)
• Sample 10: Calculus 12Limits(Page D-60)
D-11
APPENDIX D: ASSESSMENT AND EVALUATION • Samples
SAMPLE 1:APPLICATIONS OF MATHEMATICS 10
Topic: Data Tables
Prescribed Learning Outcomes:
Problem Solving
It is expected that students will:
• analyse problems and identify significantelements
• determine that their solutions are correctand reasonable
• clearly communicate a solution to aproblem and the process used to solve it
• use appropriate technology to assist inproblem solving
Number (Number Concepts)
It is expected that students will:
• analyze the numerical data in a table fortrends, patterns and relationships
• use words and algebraic expressions todescribe the data and theinterrelationships in a table with rows thatare related recursively
UNIT FOCUS
The overall goal of the unit was to helpstudents understand how they can use tablesto represent data and to use tables to solvereal world problems. Assessment requiredstudents to demonstrate their ability tocreate tables that represented data, andprocesses, that they used to solve problems.In as much as possible, students wereassessed in terms of their strategic approachto solving problems as well as their abilityuse strategies to resolve issues relevant totheir project work.
PLANNING THE UNIT
To develop the unit, the teacher:
• determined the overall goals of the unit• identified the related IRP outcomes to be
targeted in the unit• identified the prerequisite knowledge and
skills students needed to achieve thetargeted outcomes included in this unit,and planned for review
• looked for ways to connect students’learning with other desirable outcomes,including those associated with students’attitudes
• looked for ways to encourage students’understanding of the ways in whichpractical problems are solvedmathematically
• planned a variety of integratedinstructional and assessment activities tohelp students achieve identified outcomes
• determined criteria with which to evaluatestudents’ learning for marking andreporting purposes. Wheneverappropriate, the teacher involved thestudents in setting evaluation criteria.
• developed, with students, a rubric thatwould be used to mark the unit projectand its’ presentation. The development ofthe rubric’s criteria was done as early aspossible, and with the purpose ofpromoting students’ understanding of thework they were expected to accomplish.
THE UNIT
Recalling, Reviewing and ExtendingRelevant Concepts
• To review and evaluate students’understanding of the use of tables infinancial situations, students were given amail order catalogue and assigned the taskof spending $1000 on at least 10 differentitems. Cost was to include taxes, and the

D-12
APPENDIX D: ASSESSMENT AND EVALUATION • Samples
students were not to go over $1000 in totalspending. Students prepared a table thatlisted the items, their price, GST, PST, andtotal cost. The teacher asked students tocompare the production of such a tablewith the production of a spreadsheet.
Peer Assessment — Specific areas, such asthe calculation of percentages and the use offormulas, were highlighted as studentschecked their peers’ work on a sample basis.The teacher occasionally asked students tocomment on how errors might arise and howto correct them when they did arise.
Assessment Strategies — The teacherassessed the extent of students’ developmentof tables, providing assistance as needed.Particular attention was paid to checking thefirst few entries to ensure students were ableto calculate taxes and complete each row.
Demonstrating How to Create A Spreadsheet
• As students worked through the shoppingexercise, the teacher explained how aspreadsheet could be used to produce adynamic table.
• The teacher also pointed out that buyingselections made by the studentsrepresented a simple market survey. Theteacher then introduced to the class theopening of a store in a mall as a way ofmeeting the shopping choices as expressedby the class.
• The teacher used an example of theopening of a store to encourage thedevelopment of relevant mathematicalmodels.
• The teacher asked students to brainstormfor ideas on what steps a potentialbusiness owner could take before theywere prepared to actively open a business.These steps, with teacher input, becamethe basis of a unit project.
• The teacher had students develop a flowchart that showed the steps necessary toproduce a business plan, and ensured thesteps made practical sense.
• Students brainstormed ideas on the typesof information and decisions anentrepeneur might make to determinewhat to stock in the store, how to set upthe store, and how to estimate sales andnet and gross profit.
• The teacher developed parameters for thestore such as using the shape and size ofthe classroom to represent the store area.This helped students to determine thetheme for their store and to be realistic interms of the inventory. The teacher toldstudents to assume they had some stockstorage space in addition to the arearepresented by the classroom.
• Students developed inventory lists for thestore and estimated the wholesale cost ofitems by dividing the retail costs by 2.Students determined the number of eachitem to stock and the price that the storewould charge for each item.
• The teacher checked students’ tables foraccuracy, and frequently asked them toexplain their choices.
• Students were asked to develop tables thatshowed inventories, estimated daily sales,costs such as labour and rent, andestimated gross and net profit.
Self-Assessment — Students wereencouraged to reflect on their choices interms of stores that currently exist. Theywere asked to explain why customers wouldgo to their store rather than to thecompetition.
Teacher Review — As students developedspreadsheets that represented process in thedevelopment of the simple business plan, theteacher reviewed their work both foraccuracy and reasonableness. For example,

D-13
APPENDIX D: ASSESSMENT AND EVALUATION • Samples
the labour cost for a staff person working ina computer store could be significantlydifferent than for a person working in aclothing store. Salary rates should representexpertise and be reasonable for the type ofwork expected.
Peer, Small Group and Teacher Assessment— Students were asked at variousdevelopment stages to report their conceptsin a small group setting. Members of thegroup were asked to provide feedback to thereporter.
In as much as possible, the teacher created anatmosphere that encouraged students tobecome engaged with the development oftheir business. Peer input with regard tomarketing, advertising, and the way inwhich products could be displayed toencourage sales was encouraged as way ofreplicating market surveys.
The demonstration of students’ ability tomeet the prescribed outcomes, in individualterms, was encouraged through the students’production of a personalized business plan.While the plans were influenced by peerreview and teacher input, each student wasassessed and evaluated on their able toexplain and replicate the production of thetables/spreadsheets they produced.Evaluations by the teacher were done in sucha way that each student was heldaccountable for the meeting of outcomes,regardless of the amount of group, peer, orteacher input that led to its development.
Using Performance Activities in Instruction
• To help students understand the filling ofthe cells of a spreadsheet, the teacherallowed students to experiment withvarious simple applications ofspreadsheet. Students were encouragedbuild spreadsheets to find the final costs of
items such as snowboards, cars, CDs, etc.with a view to increasing enthusiasm.Students were asked to demonstrate theuse of their spreadsheets. Thespreadsheets calculated final costs fromprice by creating a cell that multiplied aprice cell by 1.14. As the spreadsheetsbecame more complicated the teacherasked students to test their viability andencouraged peers to assist in troubleshooting.
DEFINING THE CRITERIA
Mathematical Thinking
To what extent did students:
• demonstrate an understanding of tableinterrelationships, students were asked toexplain how each row was calculated, andwhat formula might have been used in thecontext of a spreadsheet
• Use problem solving elements to troubleshoot the develop of their tables and orspreadsheets
Unit Test
Students were given a business plan createdby the teacher. The plan had errors in theform of simple tabular mistakes, formulaeerrors, and unreasonable estimates. Theteacher paid close attention to ensure thatstudents could easily find simple errors andyet more able students might be able to offerquite sophisticated suggestions on how toimprove the plan.
The plans themselves were marked on arubric that was developed by the class nearthe beginning of the project process. Theteacher ensured the rubric representedaccurately the intended outcomes.

D-14
APPENDIX D: ASSESSMENT AND EVALUATION • Samples
Self-Assessment
Students’ assessment of the business planand related tables were based on accuracyand presentation. Students were asked toinclude a statement of predicted hourlyearnings for the owner of the store based ontheir estimates of sales and costs. Clearlymost students would either rework theirplans if the predicted hourly wage wasunreasonable or need explain why theymight abandon the business if it was deemedunworkable in its present form.

D-15
APPENDIX D: ASSESSMENT AND EVALUATION • Samples
SAMPLE 2:APPLICATIONS OF MATHEMATICS 11
Topic: Probability and Statistics
Prescribed Learning Outcomes:
Problem Solving
It is expected that the student will:
• solve problems that involve mathematicswithin other disciplines.
• use appropriate technology to assist inproblem solving
Patterns and Relations
It is expected that the student will:
• solve nonlinear equations using agraphing tool.
• design and solve linear and nonlinearsystems, in two variables, to modelproblem situations.
Statistics and Probability
It is expected that the student will:
• extract information from given graphs ofdiscrete or continuous data.
• draw and validate inferences, includinginterpolations and extrapolations, fromgraphical and tabular data.
• collect experimental data and use best fitexponential and quadratic functions, tomake predictions and to solve problems.
UNIT FOCUS
The goal in this unit is to have studentsappreciate that the world around them canoften be modeled using strict mathematicalrelationships. Although many of theserelationships can be complex, much of theinteraction that they observe between objectsaround them can be modeled simply andelegantly using mathematics well in within
their grasp. In this unit we will study themotion of projectiles and discover how anyobject thrown by hand or shot out of a gunobeys simple mathematical laws.
PLANNING THE UNIT
To develop the unit, the teacher:
• identified the prescribed learningoutcomes for the unit.
• examined the specific prerequisiteknowledge and skills needed to achievethese outcomes.
• determined which prerequisites were inplace and which should be reviewed
• planned a variety of activities to helpstudents achieve the outcomes
• looked for ways to connect students’learning to other desirable outcomes
• identified criteria to evaluate students’learning
• designed assessment that was an integralpart of the learning process
THE UNIT
Introduction
The teacher began the unit with a discussionabout how many of the phenomena weobserve in the world around us can bedescribed using mathematics. The teacherintroduced the example of projectiles and themany different objects that fit the descriptionof projectiles and discussed with studentshow the computer and graphing calculatorsmake it possible to use powerful analysistools to discover the mathematicalrelationships that describe projectile motion.
Review
• Students reviewed basics of data gathering(tables) and graphing techniques.

D-16
APPENDIX D: ASSESSMENT AND EVALUATION • Samples
• Students reviewed (or were introduced to)how to enter equations and individualdata points into a graphing calculator orgraphing software.
Demonstrating Understanding of BasicConcepts
• Students solved a short problem setinvolving simple physics problems thatcan be solved by graphing equations andanalysing the results. Analysis of some ofthe questions involved regression analysisof individual data points.
The Activities
• Students worked on a problem setinvolving basic projectile motion problemsto give them opportunities to practicemanipulating the basic formulasassociated with projectile motion.
• Introductory exercises were designed toteach students how to do a quadraticcurve fit on projectile data.
• The teacher presented a video labinvolving analysis of two projectiles: a ballrolled off a table and a thrown ball.
• Students then worked on a final problemset involving more complex projectilequestions.
• Students filled out a questionnairedesigned to reflecttheir competencies andattitudes toward the material covered inthis unit.
LAB ACTIVITY
CURVE FITTING DATA
1. The following data was collected when aball was rolled off a high shelf in aclassroom.
A. Enter the points (t, dx) in either agraphing calculator or some type ofgraphing software.
B. Use the capabilities of the technologyyou have chosen to fit a curve to thedata on the graph. For this set of datawhat is the best shape to try fitting?
C. The key descriptors for a line are itsslope and y-intercept. What do the slopeand the y-intercept stand for in thecontext of our projectile? What are theirvalues? Explain those values in thecontext of the question. (Why does theline have the value it does? etc.)
D. Now plot the data (t, dy) and do a curvefit on this data. What shape does thedata seem to take?
E. For a simple projectile problem like thisthe equation that relates the distance aprojectile travels to time is dy = – gt2
where g = 9.80 m/s2. Is the regressionconstant for your curve ~ 4.9? If so thisdata follows a classic projectile curve.
t (sec) dx (m) dy (m)
0.0 0.000 0
0.1 0.072 0.049
0.2 0.144 0.196
0.3 0.216 0.441
0.4 0.288 0.784
0.5 0.360 1.225
0.6 0.432 1.764
0.7 0.504 2.401
12

D-17
APPENDIX D: ASSESSMENT AND EVALUATION • Samples
2. Spaceman Spiff recently crash landed onthe planet Blarg. Do a curve fit on his data,recorded in the following table. Find keyinformation about the planet from youranalysis of the data.
A. What was the horizontal component ofthe initial velocity at which Spiff threwthe rock?
B. What was the vertical component of theinitial velocity?
C. What is the acceleration due to gravityon the Planet Blarg?
3. Robin Hood shot an arrow into the air. Usethe data recorded in the table to answersome key questions about the arrow’sflight.
A. Find the arrow’s maximum height.
B. Find the arrow’s range (how far ittraveled horizontally).
C. What was the arrow’s initial velocity?(Combine the horizontal and verticalcomponents of the initial velocity.)
D. At what angle was it shot? (Usetrigonometry.)
t (sec) dx (m) dy (m)
0.0 0.000 0
0.5 1.75 0.41
1.0 3.50 1.65
1.5 5.25 3.71
2.0 7.00 6.60
2.5 8.75 10.31
3.0 10.50 14.85
3.5 12.25 20.21
4.0 14.00 26.40
t (sec) dx (m) dy (m)
0.00 0.00 0.00
0.25 4.91 3.14
0.50 9.82 5.66
0.75 14.74 7.57
1.00 19.66 8.87
1.25 24.57 9.55
1.50 29.49 9.62
1.75 34.40 9.08
2.00 39.32 7.93
2.25 44.23 6.17
2.50 49.14 3.78
2.75 54.06 0.80

D-18
APPENDIX D: ASSESSMENT AND EVALUATION • Samples
LAB ACTIVITY
PROJECTILE MOTION
Purpose: To analyze how a projectilebehaves when it is:a) rolled off the end of a table; and,b) thrown upwards at an angle to the
horizontal.
We hypothesize that as gravity is the onlything affecting a projectile’s motion once it isno longer being supported/propelled, itshould not accelerate at all horizontally andit should accelerate at 9.80 m/s2 vertically. Inother words dx = vxt and dy = — gt2
Materials:
• Two videos, one of a ball rolling off a tableand one of a ball being thrown. It isnecessary to know the real size of someelement on the video so that you canfigure out the scale of the video.
• A video player with the ability to advanceone frame at a time.
• A clear sheet of acetate.
Procedure:
1. Place acetate over the television screen.2. Play the video frame by frame and mark
the center of the ball in each second frame.3. Measure the distances both horizontally
and vertically from the first mark to eachmark on the video.
4. Multiply these distances by the scale factorfor the video (the real length of someobject on the screen divided by the lengthin video).
5. Record data in the table below.
Image #
1 0.0667
2 0.1333
3 0.2000
4 0.2667
5 0.3333
6 0.4000
7 0.4667
8 0.5333
9 0.6000
10 0.6667
11 0.7333
Time (s)Horizontal
Change Image(cm)
VerticalChange
Image (cm)
HorizontalChangeReal (m)
VerticalChangeReal (m)
Data:
12

D-19
APPENDIX D: ASSESSMENT AND EVALUATION • Samples
Analysis:
1. Convert distances to velocities by findingthe change in distance in data points oneither side of a given point and dividing itby the time elapsed for that data point.(Example: v2 = (d3 - d1)/t2). Fill completedvalues in the table below.
2. Plot vx vs t on one graph and vy vs t on asecond graph.
3. What does vx vs t look like? It should befairly linear and close to horizontal, so usea linear regression to find the line of bestfit and find the slope of the regression line.What is the slope?
4. What does vy vs t look like? It should alsolook linear but have an upward slant to itso use a linear regression to find the line ofbest fit and find the slope of the regressionline. What is the slope?
5. In both cases above classical physics tellsus that the values we have found shouldbe the horizontal and vertical componentsof the ball’s acceleration. Assuminggravity is the only force acting on the ballthen the horizontal acceleration should bezero and the vertical acceleration shouldbe -9.80 m/s2. How close did you come?Do you feel that you have proved youhypothesis?
Conclusion:
Summarize the purpose of the experimentand your findings and state whether youachieved the purpose of the experiment.
Image #
1
2
3
4
5
6
7
8
9
10
AverageHorizontal
Velocity (m/s)
AverageVertical
Velocity (m/s)

D-20
APPENDIX D: ASSESSMENT AND EVALUATION • Samples
LAB ACTIVITY (ALTERNATIVE)PROJECTILE MOTION
Purpose:
To analyze how a projectile behaves when it is:a) rolled off a table; and,b) thrown upwards at an angle to the
horizontal.
We hypothesize that as gravity is the onlything affecting the projectiles motion once itleaves the table, it should not accelerate at allhorizontally and it should accelerate at 9.80m/s2 vertically.
Materials:
• Video E-1710• World in Motion software
Procedure:
1. Load the software and video E-1710.
2. Play the video frame by frame and markthe center of the ball in each frame.
3. Go to the analysis menu and choose thevx vs t, vy vs t graph.
4. Find the slope of each graph. (Use a mouseto mark the endpoints of the line. Slopewill appear in the box below the graph.)
5. Print each graph.
Analysis:
1. The slope of each velocity-time graph isacceleration.
2. Plot vx vs t on one graph and vy vs t on asecond graph.
3. What does vx vs t look like? It should befairly linear and close to horizontal so usea linear regression to find the line of bestfit and find the slope of the regression line.What is the slope?
4. What does vy vs t look like? It should alsolook linear but have an upward slant to itso use a linear regression to find the line ofbest fit and find the slope of the regressionline. What is the slope?
5. In both cases above classical physics tellsus that the values we have found shouldbe the horizontal and vertical componentsof the ball’s acceleration. Assuminggravity is the only force acting on the ballthen the horizontal acceleration should bezero and the vertical acceleration shouldbe -9.80 m/s2. How close did you come?Do you feel that you have proved youhypothesis?
Conclusion: Summarize the purpose of theexperiment and your findings and statewhether you achieved the purpose of theexperiment.
‘BASIC’ PROJECTILES
PROBLEM SET
Key Formulas
1. A ball travelling at 0.65 m/s rolls off atable 1.25 m high. How long does it take tohit the ground? (Assume no friction in allof these problems.)
2. A diver runs straight off the end of a 5.0 mdiving tower at 4.5 m/s.
A. How long does it take for her to reachthe water below?
B. How far does she travel horizontally inher flight?
3. In a crash scene for an adventure movie acar is wired to speed horizontally off a cliffat 38.0 m/s. If the car lands 75.0 m fromthe base of the cliff:
A. How long was the car in the air?
B. How high is the cliff?
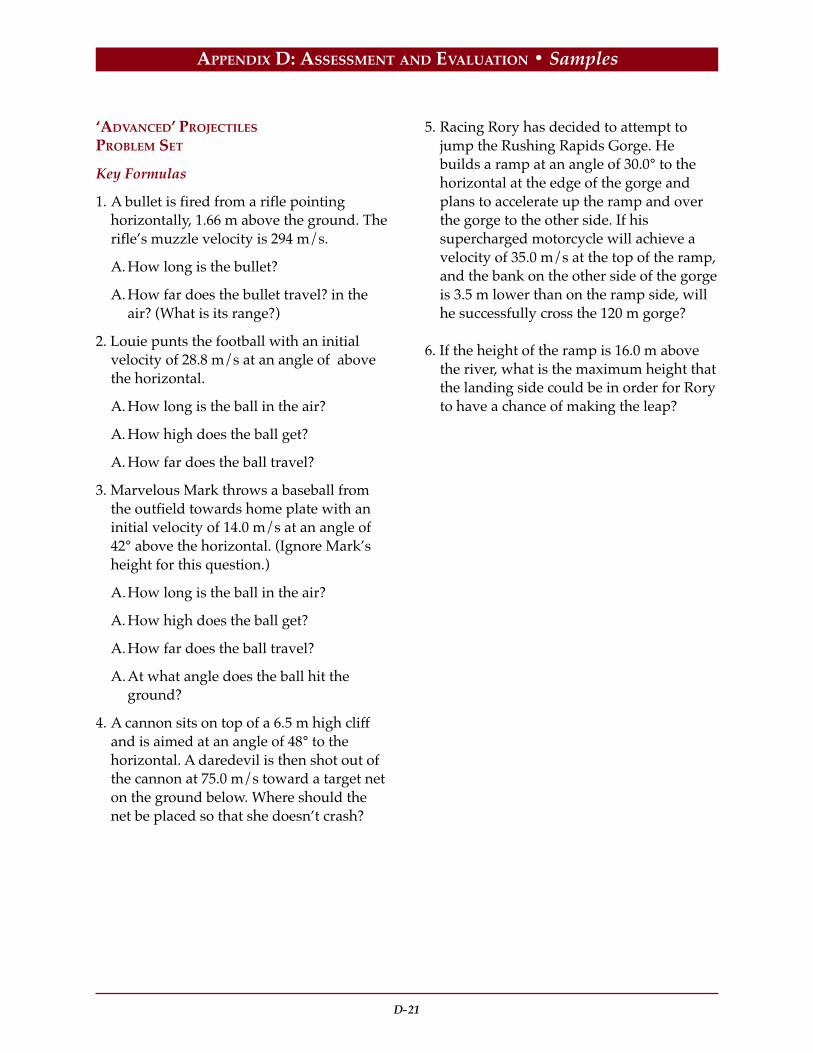
D-21
APPENDIX D: ASSESSMENT AND EVALUATION • Samples
‘ADVANCED’ PROJECTILES
PROBLEM SET
Key Formulas
1. A bullet is fired from a rifle pointinghorizontally, 1.66 m above the ground. Therifle’s muzzle velocity is 294 m/s.
A. How long is the bullet?
A. How far does the bullet travel? in theair? (What is its range?)
2. Louie punts the football with an initialvelocity of 28.8 m/s at an angle of abovethe horizontal.
A. How long is the ball in the air?
A. How high does the ball get?
A. How far does the ball travel?
3. Marvelous Mark throws a baseball fromthe outfield towards home plate with aninitial velocity of 14.0 m/s at an angle of42° above the horizontal. (Ignore Mark’sheight for this question.)
A.How long is the ball in the air?
A. How high does the ball get?
A.How far does the ball travel?
A.At what angle does the ball hit theground?
4. A cannon sits on top of a 6.5 m high cliffand is aimed at an angle of 48° to thehorizontal. A daredevil is then shot out ofthe cannon at 75.0 m/s toward a target neton the ground below. Where should thenet be placed so that she doesn’t crash?
5. Racing Rory has decided to attempt tojump the Rushing Rapids Gorge. Hebuilds a ramp at an angle of 30.0° to thehorizontal at the edge of the gorge andplans to accelerate up the ramp and overthe gorge to the other side. If hissupercharged motorcycle will achieve avelocity of 35.0 m/s at the top of the ramp,and the bank on the other side of the gorgeis 3.5 m lower than on the ramp side, willhe successfully cross the 120 m gorge?
6. If the height of the ramp is 16.0 m abovethe river, what is the maximum height thatthe landing side could be in order for Roryto have a chance of making the leap?
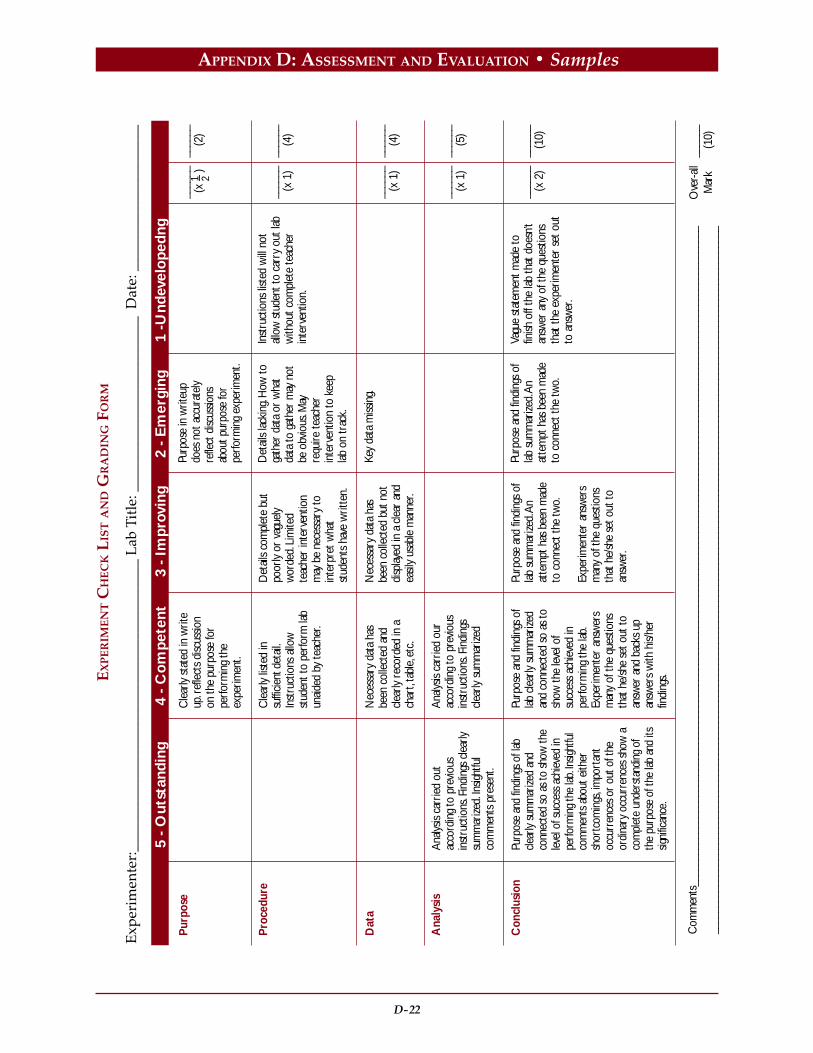
D-22
APPENDIX D: ASSESSMENT AND EVALUATION • Samples
EX
PE
RIM
EN
T C
HE
CK
LIS
T A
ND
GR
AD
ING
FO
RM
Exp
erim
ente
r:__
____
____
____
____
____
____
____
____
____
__ L
ab T
itle
: ___
____
____
____
____
____
_ D
ate:
___
____
____
____
____
_
5 -
Out
stan
ding
4
- C
om
pete
nt
3
- I
mpr
ovin
g
2
- E
mer
ging
1 -
Und
e vel
ope
dng
Pur
pose
Pro
cedu
re
Dat
a
Ana
lysi
s
Con
clus
ion
Cle
arly
stat
ed in
writ
eup
. ref
lect
s di
scus
sion
on th
e pu
rpos
e fo
rpe
rform
ing
the
expe
rimen
t.
Cle
arly
liste
d in
suffi
cient
det
ail.
Inst
ruct
ions
allo
wst
uden
t to
perfo
rm la
bun
aided
by
teac
her.
Nec
essa
ry d
ata
has
been
col
lect
ed a
ndcle
arly
reco
rded
in a
char
t, ta
ble,
etc.
Ana
lysis
carr
ied
our
acco
rdin
g to
pre
vious
inst
ruct
ions
. Fin
ding
scle
arly
sum
mar
ized
Purp
ose
and
findi
ngs
oflab
cle
arly
sum
mar
ized
and
conn
ecte
d so
as
tosh
ow th
e le
vel o
fsu
cces
s ac
hiev
ed in
perfo
rmin
g th
e lab
.Ex
perim
ente
r an
swer
sm
any
of th
e qu
estio
nsth
at h
e/sh
e se
t out
toan
swer
and
bac
ks u
pan
swer
s w
ith h
is/he
rfin
ding
s.
Purp
ose
in w
riteu
pdo
es n
ot a
ccur
atel
yre
flect
disc
ussio
nsab
out p
urpo
se fo
rpe
rform
ing
expe
rimen
t.
Det
ails
lacki
ng. H
ow to
gath
er d
ata
or w
hat
data
to g
athe
r m
ay n
otbe
obv
ious
. May
requ
ire te
ache
rin
terv
entio
n to
kee
plab
on
trac
k.
Key
data
miss
ing.
Purp
ose
and
findi
ngs
oflab
sum
mar
ized.
An
atte
mpt
has
bee
n m
ade
to c
onne
ct th
e tw
o.
____
__ (x
– )1 2
____
__ (2
)
Det
ails
com
plet
e bu
tpo
orly
or v
ague
lyw
orde
d. Li
mite
dte
ache
r in
terv
entio
nm
ay b
e ne
cess
ary
toin
terp
ret w
hat
stud
ents
hav
e w
ritte
n.
Nec
essa
ry d
ata
has
been
col
lect
ed b
ut n
otdi
splay
ed in
a c
lear
and
easil
y us
able
man
ner.
Purp
ose
and
findi
ngs
oflab
sum
mar
ized.
An
atte
mpt
has
bee
n m
ade
to c
onne
ct th
e tw
o.
Expe
rimen
ter
answ
ers
man
y of
the
ques
tions
that
he/
she
set o
ut to
answ
er.
Inst
ruct
ions
list
ed w
ill no
tall
ow s
tude
nt to
car
ry o
ut la
bw
ithou
t com
plet
e te
ache
rin
terv
entio
n.
Vagu
e st
atem
ent m
ade
tofin
ish o
ff th
e lab
that
doe
sn’t
answ
er a
ny o
f the
que
stio
nsth
at th
e ex
perim
ente
r se
t out
to a
nsw
er.
____
__ (x
1)
____
__ (4
)
____
__ (x
1)
____
__ (4
)
Ana
lysis
carr
ied
out
acco
rdin
g to
pre
vious
inst
ruct
ions
. Fin
ding
s cle
arly
sum
mar
ized.
Insig
htfu
lco
mm
ents
pre
sent
.
Purp
ose
and
findi
ngs o
f lab
clear
ly su
mm
arize
d an
dco
nnec
ted
so a
s to
show
the
level
of s
ucce
ss a
chie
ved
inpe
rform
ing
the
lab. In
sight
ful
com
men
ts a
bout
eith
ersh
ortc
omin
gs, i
mpo
rtan
toc
curr
ence
s or
out o
f the
ordi
nary
occ
urre
nces
sho
w a
com
plet
e un
ders
tand
ing
ofth
e pu
rpos
e of
the
lab a
nd it
ssig
nific
ance
.
____
__ (x
1)
____
__ (5
)
____
__ (x
2)
____
__ (1
0)
Com
men
ts__
____
____
____
____
____
____
____
____
____
____
____
____
____
____
____
____
____
____
____
____
____
____
____
____
____
____
____
____
____
____
___
____
____
____
____
____
____
____
____
____
____
____
____
____
____
____
____
____
____
____
____
____
____
____
____
____
____
____
____
____
____
____
____
____
__
Ove
r-all
Mar
k__
____
(10)

D-23
APPENDIX D: ASSESSMENT AND EVALUATION • Samples
EXPLORING SCIENCE AND MATHEMATICS USING STATISTICS AND TECHNOLOGY
Student Questionnaire
Indicate your understanding of the concepts explored in this unit as well as your comfort levelwith the statistics and technology used/introduced by circling the appropriate number on thescale for each question.
Connections
1. Mathematics is a necessary component of science.
2. Mathematics is useful in the following ways:
a) Designing an experiment
b) Finding connections and relationships in the data collected
c) Supporting conclusions drawn from the data
Technology
3. I can use graphing calculators/graphing software to findrelationships in experimental data
4. I know how to use a graphing calculator/graphing software toperform linear and quadratic regressions on experimental data.
Problem Solving
5. I can match basic nonlinear equations from physics to specificproblem involving projectiles.
6. I can model problems involving projectiles (nonlinear dataand/or nonlinear equations) using a graphing calculator orgraphing software.
Statistics and Probability
7. I can collect data according to the requirements laid out inan experiment.
8. I know how to do a ‘best-fit’ curve on experimental data.
9. I can extract needed information from a graph of nonlinear data.
10. I can draw conclusions and validate predictions from datapresented in tables or in graphs.
1 2 3 4 5
StronglyDisagree
StronglyAgree
1 2 3 4 5
1 2 3 4 5
1 2 3 4 5
1 2 3 4 5
1 2 3 4 5
1 2 3 4 5
1 2 3 4 5
1 2 3 4 5
1 2 3 4 5
1 2 3 4 5
1 2 3 4 5
1 2 3 4 5

D-24
APPENDIX D: ASSESSMENT AND EVALUATION • Samples
SAMPLE 3: APPLICATIONS OF
MATHEMATICS 12
Topic: Vectors
Prescribed Learning Outcomes:
Problem Solving
It is expected that students will:
• solve problems that involve a specificcontent area
• solve problems that involve more than onecontent area
• solve problems that involve mathematicswithin other disciplines
• analyze problems and identify thesignificant elements
• demonstrate the ability to workindividually and cooperatively to solveproblems
• determine that their solutions are correctand reasonable
• clearly communicate a solution to aproblem and the process used to solve it
• use appropriate technology to assist inproblem solving
SHAPE AND SPACE
It is expected that students will:
• use appropriate technology to describevector and scalar quantities
• assign meaning to the multiplication of avector by a scalar
• determine the magnitude and direction ofa resultant vector, using triangle orparallelogram methods
• model and solve problems in 2-D andsimple 3-D using vector diagrams andtechnology
UNIT FOCUS
The overall goal of the unit was tofamiliarize students with the use of vectoranalysis to solve physical problems.Assessment required students demonstratetheir ability to read and comprehendproblems whose components contain vectorand scalar quantities, that they couldtranslate those quantities into vectorrepresentations and that they could resolvethe key resultant components in such a waythat the solution to the problem(s) waseffectively communicated.
PLANNING THE UNIT
To develop the unit, the teacher:
• determined the overall goals of the unit• identified the related IRP outcomes to be
targeted in the unit• identified the prerequisite knowledge and
skills students needed to achieve thetargeted outcomes included in this unit,and planned for review
• looked for ways to connect students’learning with other desirable outcomes,including those associated with students’attitudes
• looked for ways to encourage students’understanding of the ways in whichpractical problems are solvedmathematically
• planned a variety of integratedinstructional and assessment activities tohelp students achieve identified outcomes
• determined criteria with which to evaluatestudents’ learning for marking andreporting purposes. Wheneverappropriate, the teacher involved thestudents in setting evaluation criteria.
• developed with students a rubric thatwould be used to mark the unit projectand its presentation. The development of

D-25
APPENDIX D: ASSESSMENT AND EVALUATION • Samples
the rubric’s criteria as done as early aspossible and with the purpose ofpromoting the students understanding ofthe work that they were expected toaccomplish.
THE UNIT
The purpose of the unit is to providestudents with opportunities to use andassign meaning to vector and scalarquantities relating to real-world situations;use vector analysis to determine resultantvectors in situations involving both 2 and 3dimensions; and use resultant vectors assolutions to practical problems.
To set the scene and review use of triangletrigonometry and parallel line rules, theteacher asked students to consider thedevelopment of a flight or watercraftsimulator program that used velocities asintegral parts of the game parameters.Examples might include a game that wouldhelp pilots or sailors estimate the effect ofwind and/or current on the path of a planeor ship. The teacher pointed out the need touse formulas that would eventually appearin the computer program. Students notedthat while they would not actually create thegame program in this class, computingscience students might wish to develop theirwork further.
Peer Assessment — Students wereencouraged to visually check the vectoranalysis of other’s work with a view toconfirming both the vector representations ofthe problem and the solutions. In as much aspossible, students were asked to confirmmagnitude and directional appropriatenessusing head to tail and parallelogramrationale. In simple terms, students wereencouraged to check that their peer’ sdrawings correctly represented the situationsthey were resolving.
Assessment Strategies — The teacherassessed the student’s development oflabeling and describing vector and scalarquantities. The teacher viewed the student’sdrawings and gave feedback on theappropriateness of their representations.
Developing Vector Analysis Skills
• The teacher had students “walk” their waythrough vector directions in such a waythat they gained an understanding of whatthe term’s magnitude and direction meantin a physical location sense.
• As students considered the effects of windand current on the velocity of a boat, theteacher encouraged students to express thecomponents as vectors.
• The teacher carefully made the point that avector can be moved in a drawing as longas its magnitude and direction did notchange. Students were shown that movingvectors allowed them to use simpletrigonometry to find resultant vectors
• Students brainstormed possible navigationscenarios that required simple vectoranalysis.
• Small groups of students were assignedthe task of writing descriptions ofproblems that required vector analysis tosolve and would be part of thedevelopment of the game introducedearlier in unit. The groups then providedsolutions to their problems. Groups thenchecked each other’s problem sets andsolutions.
• The teacher then selected problems thatexemplified well constructed vectoranalysis situations and had students showthey understood the fundamentals ofvectors and their analysis by completingthe questions. In as much as possible, theteacher pointed out alternative ways offinding solutions (e.g., scale diagrams ortriangle solvers) to vector problems and

D-26
APPENDIX D: ASSESSMENT AND EVALUATION • Samples
then discussed the strengths andweaknesses of various strategies.
• Students applied their knowledge ofvectors to navigational problems todevelop formulas that might appear in theprogramming of a flight simulator orinstructional interactive program. Theteacher modeled simple examples such asfinding the location of an aircraft flyinghorizontally on a heading of 285° that isbeing pushed by a wind from 195° asmeasured clockwise from north.Parameters such as an indicated speed of300 km/h, wind airspeed given as 90 km/h (constant) and an elapsed time of 1 hourand 15 minutes were used to show thestudents the affect of the wind on theplanes final location.
• Simple 3-D constructs were established byhaving students resolve situations such asa aircraft flying at 80 m/s due north andclimbing at an angle of 20° to thehorizontal. Students were asked toconsider the effect of a horizontal windblowing from west to east at a speed of 30m/s on the aircraft’s track as expressed asa vector.
Teacher Review — As the students grew intheir understanding of using vectors to solvenavigational problems, the teacher pointedout other uses of vector analysis includingforces as expressed in newton’s specificallyas applied to structural designs such astrusses. In as much as possible students wereasked to apply their learning to newsituations.
Peer, Small Group and Teacher Assessment— Students were asked at variousdevelopmental stages to report theirconcepts in a small group setting. Membersof the group were asked to provide feedbackto the reporter.
The teacher created an environment thatencouraged students to participate fully inthe development of sample simulations andscenarios for the flight simulator model.The demonstration of student’s ability tomeet the prescribed outcomes, in individualterms, was encouraged by reporting on eachstudent’s ability to construct vector diagramsand use appropriate strategies to resolvethem. Students were also required toeffectively communicate the meaning of theresultant vectors imbedded in the solutionsto most if not all analyses that were requiredof them.
Using Performance Activities in Instruction
To help students understand various ways ofresolving vector problems using technologysuch as triangle solvers, each student wasasked to report on the pro and cons of usingvarious strategies and tools.
DEFINING THE CRITERIA
Mathematical Thinking
To what extent did students• Demonstrate an understanding vector
representations of quantities• Use vector analysis to solve problems• Use technology to solve problems• Use appropriate terminology in to describe
problems and solutions

D-27
APPENDIX D: ASSESSMENT AND EVALUATION • Samples
CASE STUDY FOR APPLICATIONS OF MATH 12
The following questions are based on thepredicted effects of wind on a small planeheading due north at 150 mph. The planesaltitude is 8000 feet.
1. A. Draw a scale “head to tail” vectorrepresentation of the effect of a 60 mphwind from the west on the plane above.Indicate scale of drawing and showresultant vector.
B. Find the effective ground velocity of theplane as exactly as possible.
2. Assume the plane slows to 120 mph anddescends to 5000 feet at the request of airtraffic control. The plane then turns tohead due east and maintains a steadyspeed.A.Draw a side view vector diagram that
would show the effect of the planeflying through a down draft where theair is dropping at 30 mph. Find thevalue of the resultant vector. How manydegrees from level flight is the planesprojected path?
3. Assume the plane is redirected to headdue south. It is now flying at 5000 feet at120 mph. The plane then enters turbulentair. The air mass the plane is travellingthrough is moving up at 30 mph and ismoving west at 60 mph.A.Find the resultant vector that represents
the turbulent air.B. Show the vector that shows the planes
resultant velocity whilst passingthrough the turbulent air. Indicatemagnitude.
UNIT TEST
Students were given a carefully constructedtest that initially required them to show anunderstanding of vector representations,terminology and the solution of simpleresultant forms. Students were then requiredto show how formulas could be developed tofind resultant vectors for relatively simple2-D and 3-D situations. In as much aspossible the initial modeling of the situationswas related to the work the students haddone on the navigation simulations while thefinal modeling required students to analyzenew situations such as those involving forceson bridge components, for example.
SELF ASSESSMENT
Students’ assessment of the simulator projectwas based on understandings of how to findand apply resultant vector solutions.Students commented on their ability the wayin which they used technology to solvevector problems.

D-28
APPENDIX D: ASSESSMENT AND EVALUATION • Samples
SAMPLE 4:ESSENTIALS OF MATHEMATICS 10
Topic: Wages, Salaries, and Expenses
Prescribed Learning Outcomes:
Problem Solving
It is expected that students will:
• solve problems that involve a specificcontent area
• solve problems that involve more than onecontent area
• solve problems that involve mathematicswithin other disciplines
• analyze problems and identify thesignificant elements
• demonstrate the ability to workindividually and cooperatively to solveproblems
• determine that their solutions are correctand reasonable
• clearly communicate a solution to aproblem and the process used to solve it
• use appropriate technology to assist inproblem solving
Wages, Salaries and Expenses
It is expected that students will:
• calculate hours worked and gross pay• calculate net income using deduction
tables with different pay periods• calculate changes in income• develop a budget that matches predicted
income
UNIT FOCUS
The overall goal of the unit was tofamiliarize students with the use of budgetsto more effectively manage income.Assessment required students todemonstrate their ability to read and
comprehend problems whose componentscontained income calculations, deductionestimation, changes in income, and budgetcreation.
PLANNING THE UNIT
To develop the unit, the teacher:
• determined the overall goals of the unit• identified the related IRP outcomes to be
targeted in the unit• identified the prerequisite knowledge and
skills students needed to achieve thetargeted outcomes included in this unit,and planned for review
• looked for ways to connect students’learning with other desirable outcomes,including those associated with students’attitudes
• looked for ways to encourage students’understanding of the ways in whichpractical problems are solvedmathematically
• planned a variety of integratedinstructional and assessment activities tohelp students achieve identified outcomes
• determined criteria with which to evaluatestudents’ learning for marking andreporting purposes. Wheneverappropriate, the teacher involved thestudents in setting evaluation criteria.
• developed with students a rubric thatwould be used to mark the unit projectand its presentation. The development ofthe rubric’s criteria as done as early aspossible and with the purpose ofpromoting the students understanding ofthe work that they were expected toaccomplish.

D-29
APPENDIX D: ASSESSMENT AND EVALUATION • Samples
THE UNIT
Recalling, Reviewing and ExtendingRelevant Concepts
• To review and evaluate students’understanding of calculations of hoursworked, the teacher presented a 24-hourclock scenario and had students fill outtime cards indicating the times theyarrived and left work. The teacher thenhad students calculate the hours workedper shift. The teacher gradually introducedtime sheets involving split shifts andovertime to the students. The teacher thenadded the concept of calculating gross payusing a calculator.
Peer Assessment — Students wereencouraged to check a partner’s calculationsof both time spent at work and calculationsof gross pay.
Assessment Strategies — the teacherassessed the student’s development ofcompleting time sheets and finding grosspay. The teacher viewed the student’s workand gave feedback on the appropriateness oftheir representations.
Creating a Budget
• The teacher had students research jobsthat they might expect to have uponcompletion of high school. Studentsfound the hourly pay associated withone particular job of their choice. As thestudents considered the jobopportunities available to them, theteacher encouraged students to considerthe type of lifestyle they would expectto have given their career choice.
• The teacher then had students assume atypical week and asked them tocalculate their gross income for thatweek. Using deduction tables provided
by the teacher, the student thencalculated take home pay.
• The students were asked to considertypical weekly expenses. Using budgettables provided to them, the studentsestimated expenses such as rent,utilities, food, telephone, andtransportation costs. The total estimatedweekly expenses were calculated andchecked with a partner.
• With the teacher’s guidance, thestudents then reconciled their calculatedtake home pay with their estimatedexpenses and produced an acceptablebudget.
• The teacher asked students to create anew budget based on a 10% increase inincome that resulted from a studenttaking extra training or education.
Teacher Review — As student understandingof ways in which income could be managedgrew, initiating retirement or educationsavings plans was discussed. In as much aspossible students were asked to apply theirlearning to new a variety of practicalfinancial problems.
Peer, Small Group, and Teacher Assessment— Students were asked at variousdevelopmental stages to report theirconcepts in a small group setting. Membersof the group were asked to provide feedbackto the reporter.
The teacher created an environment thatencouraged students to participate fully inthe development of individual budgets, goalsetting and planning.
The demonstration of student’s abilities tomeet the prescribed learning outcomes wasencouraged by reporting on the student’sindividual ability to use appropriatestrategies to estimate and produce realisticand workable budgets. Students were also

D-30
APPENDIX D: ASSESSMENT AND EVALUATION • Samples
required to effectively communicate howthey arrived at their estimates and what theirgoals were as well as how their goalsaffected their budgets.
Using Performance Activities in Instruction
To help students understand various ways ofcreating viable budgets, students were askedto experiment with making changes to abudget and seeing what effect that had onthe complete picture. For example, studentswere asked to find the effect of buying a caron their ability to save. Other students wereasked to find the effect of working overtimeon their budgets. Students were asked tocomment on the effect of a windfall such as acash gift or income tax refund on theirbudget. Some students were able to usespreadsheets to more effectively managetheir data and consider changes.
DEFINING THE CRITERIA
Mathematical Thinking
To what extend do students:
• demonstrate an ability to fill in time sheetsand find gross pay.
• use deduction tables to find net pay• calculate the net effect of pay rate changes• create rationalized budgets
Unit Test
Students were given a carefully constructedtest that initially required them to show anunderstanding of time sheets, and how tofind net and gross pay. Students were thenrequired to show how a time sheet could beused to estimate average weekly take homepay, given access to deduction tables.Students were given a list of expenses for anindividual whose time sheet was provided.Students were then assessed on their ability
to create a workable budget for thatindividual.
Self Assessment
Students’ assessment of their understandingof the budgeting process included a writtenexplanation of how they would go aboutcreating a budget, given an hourly pay rateand access to typical housing costs and otherexpenses.

D-31
APPENDIX D: ASSESSMENT AND EVALUATION • Samples
SAMPLE 5:ESSENTIALS OF MATHEMATICS 11
Topic: Owning and Operating a Vehicle
Prescribed Learning Outcomes:
Problem Solving
It is expected that students will:
• analyse problems and identify thesignificant elements
• develop specific skills in selecting andusing an appropriate problem-solvingstrategy or combination of strategieschosen from, but not restricted to, thefollowing:- guess and check- look for a pattern- make a systematic list- make and use a drawing or model- eliminate possibilities- work backward- simplify the original problem- develop alternative original approaches- analyse keywords
• determine that their solutions are correctand reasonable
• clearly communicate a solution to aproblem and the process used to solve it
• use appropriate technology to assist inproblem solving
Owning and Operating a Vehicle
It is expected that students will:
• solve problems involving the acquisitionand operation of a vehicle including- renting- leasing- buying- licensing- insuring- operating (e.g., fuel and oil)- maintaining (e.g., reparis, tune-ups)
In addition to these outcomes, the teacherassessed students’ attitudes, group work,and communication skills.
UNIT FOCUS
The teacher’s overall goal for this unit was tohelp students develop mathematical tools tocalculate and analyse the costs associatedwith acquiring and operating a vehicle. Tointroduce and reinforce new concepts, theteacher provided concrete examples andguided practice, and prompted discussionsof real-world applications. The teacherdesigned activities to assess students’application of concepts, mathematicalthinking, and problem-solving andcommunication skills.
PLANNING THE UNIT
To develop the unit, the teacher:
• identified the prescribed learningoutcomes for this unit
• examined the specific prerequisiteknowledge and skills needed to achievethese outcomes
• determined which prerequisites werealready in place and which should bereviewed
• looked for ways to connect students’learning to other desirable learningoutcomes, including those associated withproblem solving, communication skills,and attitudes
• identified criteria to evaluate students’learning
• designated assessment that was anintegral part of the instructional process
D-32
APPENDIX D: ASSESSMENT AND EVALUATION • Samples
THE UNIT
Leasing and Buying Vehicles
• Students were given advertisements takenfrom newspapers and magazines thatdisplayed the costs of leasing vehicles.Working as a class, students identifiedmonthly costs, fixed costs (e.g., down-payments, security payments, levies,taxes) and special costs ( e.g., mileagecosts)
• The teacher presented students withdifferent scenarios for leasing vehicles(e.g., length of leases, driving over theallowable mileage limit, paying differentdown-payments) and asked the class tocalculate the costs of leasing in eachscenario.
• The class then found advertisements forvehicles that could be appealing toyounger consumers. The teacher askedstudents to:- present the cost of leasing the vehicle
for a set amount of time- find a cost of leasing that could be used
to compare to other forms oftransportation
- determine how much of a personalbudget leasing a vehicle wouldconsume
• The teacher used the same process todevelop students’ understanding ofpurchasing a vehicle. The teacher andstudents investigated how the purchaseprice of a vehicle is not actually theamount of money paid for a vehicle,unless it was paid for in cash.
• Students worked with spreadsheets andprogrammable calculator lists to discoverthat monthly payments consisted offinance charges and reductions to theprinciple amount of the loan. To help thestudents’ understanding, the teacherassigned students to use spreadsheet
templates to calculate the interest paid inpaying off a loan.
• When students had more of anunderstanding of the nature of loans, theteacher guided them to discover how thelength of loan, the size of the monthlypayments and the interest rates affectedthe total paid on a loan
• A loan manager from a credit institutionwas invited in to discuss the advantagesand disadvantages of leasing andpurchasing, and then worked together tocompile pertinent points.
• Teacher guided students in a discussion ona costs and benefits of extended warranty.
Licensing and Insuring
• The teacher, using pamphlets supplied byan insurance broker, worked with studentsto help them:- learn basic insurance terminology (e.g.,
basic coverage, liability, third-party, no-fault, comprehensive, safe driverdiscount)
- calculate basic and optional insurancecosts
• When students had a firm understandingof insurance costs, the teacher guidedthem to discover how different vehicleshad different insurance requirements andcosts. The teacher had students researchwhy some vehicles had higher insuranceand license costs, and how these costscould affect purchasing decisions.
• Students worked with the teacher tocalculate safe-driving discounts, and thenworked independently on a number ofapplication problems based on years ofsafe driving.

D-33
APPENDIX D: ASSESSMENT AND EVALUATION • Samples
Operating and Maintaining
• Students were given examples of real-lifescenarios of operating a vehicle (e.g.,24,000 km of driving in one year). Workingas a class, students estimated the costs ofoperating a vehicle (e.g., gas and oil), andconverted the cost to cost per kilometre.
• Using supplied material on maintenanceintervals, the class worked to develop achart of the costs of operating the vehiclebased on:- tire life and replacement costs- tune-ups and oil changes- insurance and license costs
Applying Concepts in OtherCurriculum Areas
• The teacher demonstrated to the class howpersonal loans and mortgages werecalculated and applied in similar fashionto automobile purchase loans. Thestudents then used spreadsheet templatesto calculate various mortgages.
DEFINING THE CRITERIA
Mathematical Thinking
To what extend do students:
• demonstrate an understanding in thedifference of monthly costs and fixed costsin a lease
• demonstrate facility in solving loans (e.g.,time, total paid, interest costs) usingtemplates or appropriate technology
• demonstrate facility in solving applicationproblems involving insurancerequirements and safe-driver discounts
• demonstrate facility in estimatingoperating costs per year or per kilometre
Attitudes
To what extend do students:
• approach problem situations withconfidence
• show a willingness to persevere insolving difficult problems
• show flexibility in using availableresources (e.g., calculators, Internet,outside expertise, help from otherstudents or the teacher )
• contribute to class discussions andproblem solving sessions
Group Skills
To what extent do students:
• communicate ideas clearly and efficiently• work with other students in whole-class
and small-group discussions to build onideas and reinforce understanding
• present logical arguments to supporttheir conclusions
• listen to the ideas of other students andrespond appropriately
ASSESSING AND EVALUATING PERFORMANCE
Observing and Questioning
The teacher assessed students’understanding, attitudes, and group skillsinformally throughout the unit.
The teacher:• observed students as they participated in
class and small-group activities, takingnote of behaviour that indicated whetherthey were achieving the criteriaestablished for the unit
• asked questions to assess students’understanding of the central concepts
• moved through the class, observingstudents’ work, encouraging their efforts,and listening to comments as theyworked in small groups. (The teacher

D-34
APPENDIX D: ASSESSMENT AND EVALUATION • Samples
knew students were involved in the unitwhen they made comments such as“Maybe we should try ...” or “I wonderwhat would happen if ...”)
Journal Entries
The teacher had students paste in theirmathematical workbooks examples ofleasing and purchasing vehicles. Studentsused these examples to create problems forother students within small groups to solve.(Each group had to be able to solve thechallenges it designed.) The teacherreviewed the work created by each groupand evaluated the complexity andappropriateness of the problems as anindication of students’ understanding of theconcepts included in the unit.
Lease or Purchase Project
Students chose a vehicle from anadvertisement that featured a lease andpurchase plan. The students calculated thetotal cost of leasing and buying including allhidden costs and taxes. Students worked ondeciding whether leasing or purchasing waspreferable, and were encouraged to expresstheir answers in cents per kilometre.
A loan manager from a credit institution wasinvited to the class to show students how tocomplete a loan application, as well asdiscuss the implications of leasing, buyingnew and buying used.
Students and the teacher perused thefinished projects, and worked together tofind discrepancies in the projects. Studentswere assigned points on a scale of 1 to 5 foreach of the following criteria:
1 2 3 4 5
1 2 3 4 5
1 2 3 4 5
Criteria
• extent to which calculations are correct and include all costs
• extent to which data is meaningfully displayed
• extent of students’ contributions to discussions regarding reasons fordiscrepancies
Rating
Lease or Purchase Project
Key: 5 Excellent4-Good3-Average2-Needs improvement1-Needs complete review

D-35
APPENDIX D: ASSESSMENT AND EVALUATION • Samples
Summary Sheets
Prior to instruction, the teacher gavestudents summary sheets designed toprovide a reference and study guide forfuture use. Students could use one sheet forcomparing the costs of mandatory andoptional insurance and licensing costsincluding:• mandatory basic coverage• third-party coverage• collision• comprehensive• safe driving discount• other features of coverage (e.g., loss of
vehicle costs, medical)
Another summary sheet could contain costsof leasing and purchasing including:• down payment• damage and security costs• battery and tire levies• transportation and dealer preparation
costs• options• provincial and federal taxes• tune-ups and maintenance costs• extended warranty
The teacher assigned marks on the summarysheets based on the clarity, thoroughnessand accuracy of students’ responses. Writtenfeedback was provided, and students weregiven the opportunity to make correctionsand resubmit their sheets for improvedgrades.
Solving Problems
The teacher used a performance scale toevaluate students’ abilities to solve problemsand present their conclusions.

D-36
APPENDIX D: ASSESSMENT AND EVALUATION • Samples
SAMPLE 6:ESSENTIALS OF MATHEMATICS 12
Topic: Comparative Study of Career Choices
Prescribed Learning Outcomes:
Problem Solving
It is expected that students will:
• solve problems that involve more than onecontent area
• analyse problems and identify thesignificant elements
• demonstrate the ability to workindividually and cooperatively to solveproblems
• clearly communicate a solution to aproblem and the process used to solve it
• use appropriate technology to assist inproblem solving
Life/Career Project
It is expected that students will:
• determine what factors are important inanalysing careers
• describe two specific career opportunities• identify mathematical educational
requirements for two careers• compare two careers in terms of
characteristics such as salary, hours ofwork, training cost and time, cost of living,and benefits
UNIT FOCUS
The overall goal of the unit was to givestudents the tools necessary for comparingcareer choices. Students needed todemonstrate their ability to research, compile,interpret, and present career factors. Theteacher assessed students with respect to theirdescriptions, calculations, budget forms, andan assortment of other documents supportingthe career choices and the life style it entails.
PLANNING THE UNIT
To plan the unit, the teacher:
• identified the prescribed learningoutcomes for instruction and assessmentfor the unit and the prerequisiteknowledge and skills needed to achievethese outcomes
• determined which of these prerequisites toreview
• planned a variety of activities to helpstudents achieve the learning outcomes,including those associated with group-work skills, communication skills, andattitude
• identified criteria to use in evaluatingstudents’ learning
• designed assessment that was an integralpart of the instructional process
THE UNIT
Introduction
• The unit began with a discussion onselecting a career, the motivations behindit, the reasons for the selection, and theintended goals to be reached with thatcareer choice
• People employed in various fields (e.g.,trades, industry, business, research) wereinvited to give a brief synopsis on whattheir job entails, why they chose thatparticular field, and how they went aboutgetting the job.
• Individually, students were asked to list asmany career factors affecting careerchoices as they could. The class then cametogether and compiled all of these factorsinto one complete list.
• To reinforce the importance of consideringall career factors when selecting a career,students were asked to interview animportant adult in their life on her or hiscareer choices.

D-37
APPENDIX D: ASSESSMENT AND EVALUATION • Samples
Review of Relevant Concepts
• The teacher provided the class with anumber of case studies involving budgetinformation. Students worked in smallgroups to review their skills in presentingthe data using spreadsheets, graphs, anddiagrams. The groups had to providereasons for choosing a particular style ofpresentation.
• The teacher provided specific problemsand the students practiced calculationsinvolving wages/salary and expenses.
• The teacher reviewed how to do abudgetary analysis.
Performing Research and Presentingthe Results
• Students were given access to the libraryand the outside world via the internet. Theteacher demonstrated necessary researchskills and how to summarize data collected.Students selected two careers they wereinterested in and researched these careerswith respect to the list of career factors theclass had established. The students kept alog of their research which included adetailed description of the item and thesource. Students were encouraged to recordany additional factors that might influencetheir career choices.
• For further research, students wereassigned to interview a person currentlyholding one of their career choices eitherin person, by phone, by mail, or by e-mail.The teacher discussed with the class howsuch contact could be made and whatattitude and behaviour is necessary toachieve results.
• Once the research had been completed, thestudents were asked to organize their resultsand to present them meaningfully. Studentswere partnered up to use their partner as asounding board for their presentation.
Analyzing the Research
• the teacher guided the students incomparing their two researched careerchoices. The teacher emphasized that it isimportant to provide reasons for decisionsmade.
DEFINING THE CRITERIA
Mathematical Thinking
To what extent do students:
• demonstrate an understanding of how toprepare a budget analysis
• prepare a budget analysis• use spreadsheets, graphs and diagrams to
present information• describe the financial factors involved in
selecting a career• compare two careers with respect to salary,
hours of work, training cost and time, costof living, and benefits
• apply their mathematical knowledgewhile comparing two careers
• use appropriate mathematical terminologyand notation
Attitudes
To what extent do students:
• approach problem situations withconfidence
• show flexibility in using availableresources (e.g., calculators , spreadsheets,help from other students or the teacher)
• show interest, participate in activities, andvolunteer responses
• make connections between real-lifesituations and mathematics.

D-38
APPENDIX D: ASSESSMENT AND EVALUATION • Samples
Group Skills
To what extent do students:
• work with other students in whole-classdiscussions and small groups, to build onideas and understanding
• initiate, develop, and maintain interactionswithin the group.
Communication Skills
To what extent do students:
• communicate ideas clearly andunderstandably
• listen to and make use of the ideas of otherstudents
• present logical arguments to support theirconclusions
ASSESSING AND EVALUATING STUDENT PER-FORMANCE
Observing and Questioning
The teacher observed as studentsparticipated in whole-class discussions,small-group activities, and individualresearch, taking note of behaviours thatindicated students were or were notachieving the criteria established for the unit.Students’ understanding, attitudes, andgroup and communication skills wereevaluated informally throughout the unit.The teacher reviewed students’ work to notethe extent to which they showed progress inresearching two careers and in compilinginformation on established career factors.
Individual Project
Each student completed a research project oncomparing two careers of their interest. Theproject required student to:
• provide a job description for each career• identify the mathematical educational
requirements needed for each career
• list the overall educational requirementsand associated costs for each career
• perform a budgetary analysis• describe their findings on income, salary,
and health factors associated with eachcareer
• perform a lifestyle analysis• compare the two careers objectively using
their findings and provide reasons fortheir conclusion
• use and cite a variety of appropriateinformation sources
• complete a written report, and presenttheir findings to the class
The report was evaluated using thefollowing assessment checklist, and thepresentation was evaluated using thefollowing holistic scale. Students receivedcopies of the checklist and scale beforemarking the project and used them asguidelines in developing their presentationsand written reports. At the end of the projectthey used the guidelines to self-assess theirwork. The teacher held conferences todiscuss discrepancies between students’ andteacher’s ratings. Students were givensuggestions for improvements. Studentswho received scores of less that 50 points ontheir written reports were given theopportunity to redo them. The final score forthe written report was the higher of the twoscores.

D-39
APPENDIX D: ASSESSMENT AND EVALUATION • Samples
ASSESSMENT CHECKLIST: CAREER PROJECT
Student Name: Points: /100
10 Job Description• duties• dress code• employment opportunities• other:
Requirements15 • education
- requirements- mathematics needed- costs- other:
15 • budgetary analysis- food- shelter- clothing- transportation- other:
5 • income- job(s) held- salary/wages- other:
Selected Careers (for each career)10 • salary
- wages / starting salary- increments- benefits- other:
10 • health issues- stress- insurance- ergonomics- risk factors- other:
POINTS
20 • life style- food- clothing- shelter- transportation- recreation- family size- investments- retirement planning- charitable political contributions- budgetary analysis- other
15 Comparison between the two careers• education• salary• health• life style• other:

D-40
APPENDIX D: ASSESSMENT AND EVALUATION • Samples
Journal Entries
During the project, students kept a log oftheir research, findings, and the approachthey took. Students had to do on-goingreflections on their position towards the twocareers they chose. The teacher reviewedtheir journal entries and evaluated thequality of their responses. The teacher alsoused the journal to offer further guidance orpointers to the students’ projects.
Information is presented clearly, logically and understandably. Examples ordemonstrations were used appropriately to illustrate explanations. Findingsare well organized and effectively displayed. Explanations indicate a clearunderstanding of the topic and the use of information to perform acomparative study. References are appropriate for the topic and indicatethat the student understands where to look for information.
The presentation indicates that the student has a basic understanding of thetopic and of using information to perform a comparative study. Informationis understandable. Findings are organized and displayed acceptably.References are appropriate for the topic.
The presentation indicates a limited understanding of either the topic or theuse of information to perform a comparative study, or both. Thepresentation may be illogical or difficult to follow. Findings may beorganized poorly or ineffectively. References may indicate that the studentis not clear on finding the best sources of information.
The presentation indicates a lack of understanding of either the topic or theuse of information to perform a comparative study. The presentation is illogicaland difficult to follow. Findings are poorly organized and ineffectivelypresented. References may be lacking or inappropriate for the topic.
Career Project Presentation Rating Scale
4 - Outstanding
3 - Adequate
2 - NeedsImprovement
1 - Inadequate
D-41
APPENDIX D: ASSESSMENT AND EVALUATION • Samples
SAMPLE 7:PRINCIPLES OF MATHEMATICS 10
Topic: Radicals
Prescribed Learning Outcomes:
Problem Solving
It is expected that the student will:
• analyse problems and identify thesignificant elements
• demonstrate the ability to workindividually and co-operatively to solveproblems
• determine that their solutions are correctand reasonable
• clearly explain the solution to a problemand justify the processes used to solve it
Number (Number Concepts)
It is expected that students will:
• classify numbers as natural, whole,integer, rational or irrational, and showthat these number sets are nested withinthe real number system.
Number (Number Operations)
It is expected that students will:
• communicate a set of instructions used tosolve an arithmetic problem.
• perform arithmetic operations onirrational numbers, using appropriatedecimal approximations.
• perform operations on irrational numbersof monomial and binomial form, usingexact values.
Unit Focus
The teacher provided students with concreteexamples to help them realize that the studyof radicals can help them extend theirunderstanding of irrational numbers. The
teacher provided small-group instructionand guided practice to help students gain theskills necessary to do the work in the unit. Inorder to demonstrate their abilities to solveproblems involving radicals,and use technology in solving problems,students participated in team competitionsand special projects.
PLANNING THE UNIT
To develop the unit, the teacher:
• identified the prescribed learningoutcomes for this unit
• examined the specific prerequisiteknowledge and skills needed to achievethese outcomes
• determined which prerequisites werealready in place and which should bereviewed
• planned a variety of activities to help thestudents achieve the outcomes
• looked for ways to connect students’learning to other desirable learningoutcomes, including those associated withattitudes, work groups, andcommunication skills
• identified criteria to use to evaluatestudents’ learning
• designed assessment that was an integralpart of the instructional process
THE UNIT
Review of Squares and Square Roots
• The teacher used numerical examples toensure that all students had a firmunderstanding of squares and square roots
(e.g., 25 5 5 252= ± =, ).• Students responded to questions like the
following:- What is the square root of ________?- What is the square of _______?- What is_______ squared?
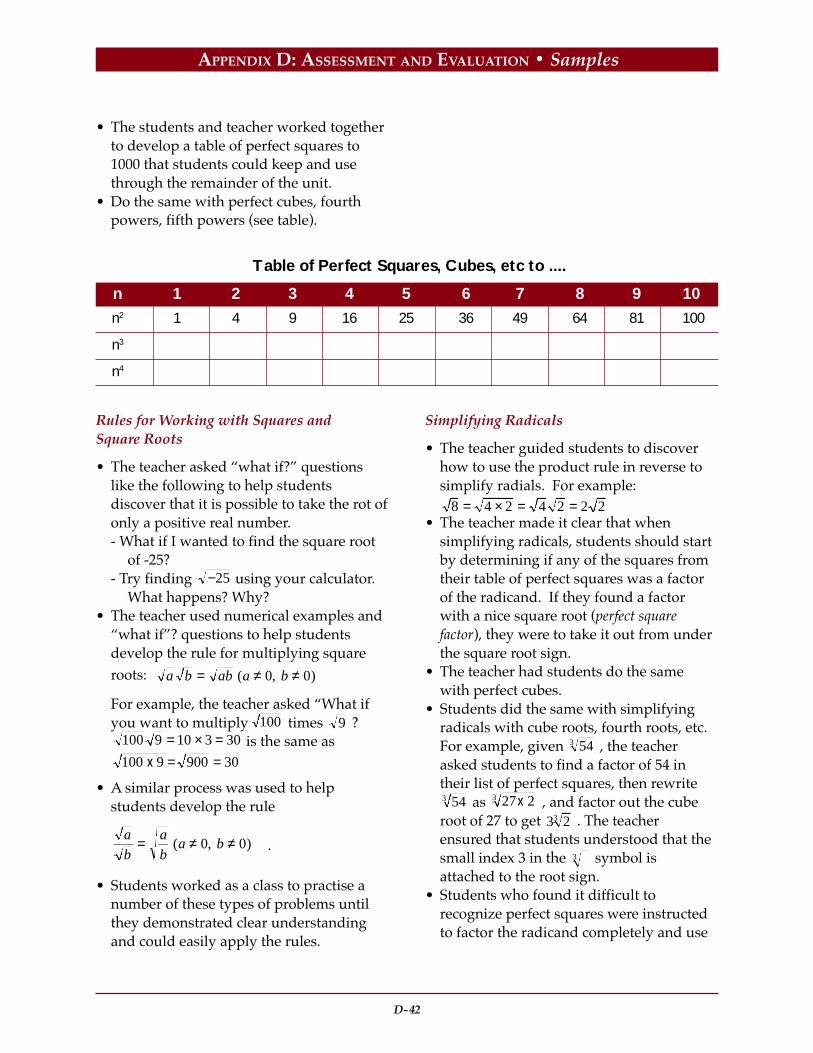
D-42
APPENDIX D: ASSESSMENT AND EVALUATION • Samples
• The students and teacher worked togetherto develop a table of perfect squares to1000 that students could keep and usethrough the remainder of the unit.
• Do the same with perfect cubes, fourthpowers, fifth powers (see table).
Rules for Working with Squares andSquare Roots
• The teacher asked “what if?” questionslike the following to help studentsdiscover that it is possible to take the rot ofonly a positive real number.- What if I wanted to find the square root
of -25?- Try finding −25 using your calculator.
What happens? Why?• The teacher used numerical examples and
“what if”? questions to help studentsdevelop the rule for multiplying squareroots: a b ab a b= ≠ ≠ ( , )0 0
For example, the teacher asked “What ifyou want to multiply 100 times 9 ?
100 9 10 3 30= × = is the same as100 9 900 30x = =
• A similar process was used to helpstudents develop the rule
a
b
a
ba b= ≠ ≠ ( , )0 0 .
• Students worked as a class to practise anumber of these types of problems untilthey demonstrated clear understandingand could easily apply the rules.
n 1 2 3 4 5 6 7 8 9 10
n2 1 4 9 16 25 36 49 64 81 100
n3
n4
Table of Perfect Squares, Cubes, etc to ....
Simplifying Radicals
• The teacher guided students to discoverhow to use the product rule in reverse tosimplify radials. For example:
8 4 2 4 2 2 2= × = =• The teacher made it clear that when
simplifying radicals, students should startby determining if any of the squares fromtheir table of perfect squares was a factorof the radicand. If they found a factorwith a nice square root (perfect squarefactor), they were to take it out from underthe square root sign.
• The teacher had students do the samewith perfect cubes.
• Students did the same with simplifyingradicals with cube roots, fourth roots, etc.For example, given 543 , the teacherasked students to find a factor of 54 intheir list of perfect squares, then rewrite
543 as 27 23 x , and factor out the cuberoot of 27 to get 3 23 . The teacherensured that students understood that thesmall index 3 in the 3 symbol isattached to the root sign.
• Students who found it difficult torecognize perfect squares were instructedto factor the radicand completely and use

D-43
APPENDIX D: ASSESSMENT AND EVALUATION • Samples
this prime factorization to rewrite theexpression in its simplest radical form.For example: 150 2 3 5 5 5 6= × × × =
• Students used their calculators to converttheir final answers to decimal form.
• Students practised simplifying radicals,compared their answers with those of theirpeers, and resolved any differences.
Multiplying, Dividing, Adding, andSubtracting Radicals
• At this point, students were ready to moveon to multiplying radicals. To helpstudents understand that they shouldwork first with coefficients and then withradicals, the teacher guided them as theyworked through increasingly complexexamples. For example:5 3 7 2 5 7 3 2 35 6× = × =( )( )
• The class discovered how simplifyingradicals before multiplying made theirwork easier.
18 12 216× = is difficult to simplify.3 2 2 3 6 6× = is much easier.
• Individually, students solved problems topractise multiplying radicals. They wereencouraged to compare their answers withthose of their peers and resolve anydifferences.
• From multiplication, the class moved todivision and rationalizing denominators.The teacher used numerical examples ofincreasing complexity. The more complexexamples illustrated the advantage ofsimplifying radicals before dividing.
• Students were told that rationalizingdenominators involves both removingradicals from denominators and removingdenominators from within radicals.
• Together, the class worked through anexample of a problem that requiredremoving a radical from the denominator.
For example: 16
66
66
× =
or27 1418 6
3 72 3
33
3 216
212
= × = =
• Students worked in small groups to solvecomplex problems requiring themultiplication or division of radicals, or acombination of both operations. Theydisplayed their answers in both simplestradical and decimal form.
• In a discussion about adding andsubtracting radicals, the teacher askedquestions that prompted students to recallthe algebraic rules for adding andsubtracting like and unlike terms and toapply these rules to problems involvingradicals. The class worked with theteacher through several examples ofincreasing difficulty and discussed theadvantages of simplifying the radicalbefore performing operations.
• Students practised adding and subtractingradicals by working independently onproblems prepared by the teachers. Theydisplayed their answers both in simplestradical and decimal forms.
• Students worked in small groups to solveapplication problems involving all theskills they learned in this unit.
• Throughout the unit the teacher usednumerical examples such as 2 2 2= toencourage students to recognizeimmediately that x x x= without havingto work through the problem each time.
• As an alternative approach, the teacherdrew on students’ proficiency with basicalgebra skills to develop the rules forworking with radicals. The teacherprovided opportunities that helpedstudents realize that the rules for dealingwith radicals are parallel to those theyused in algebra.
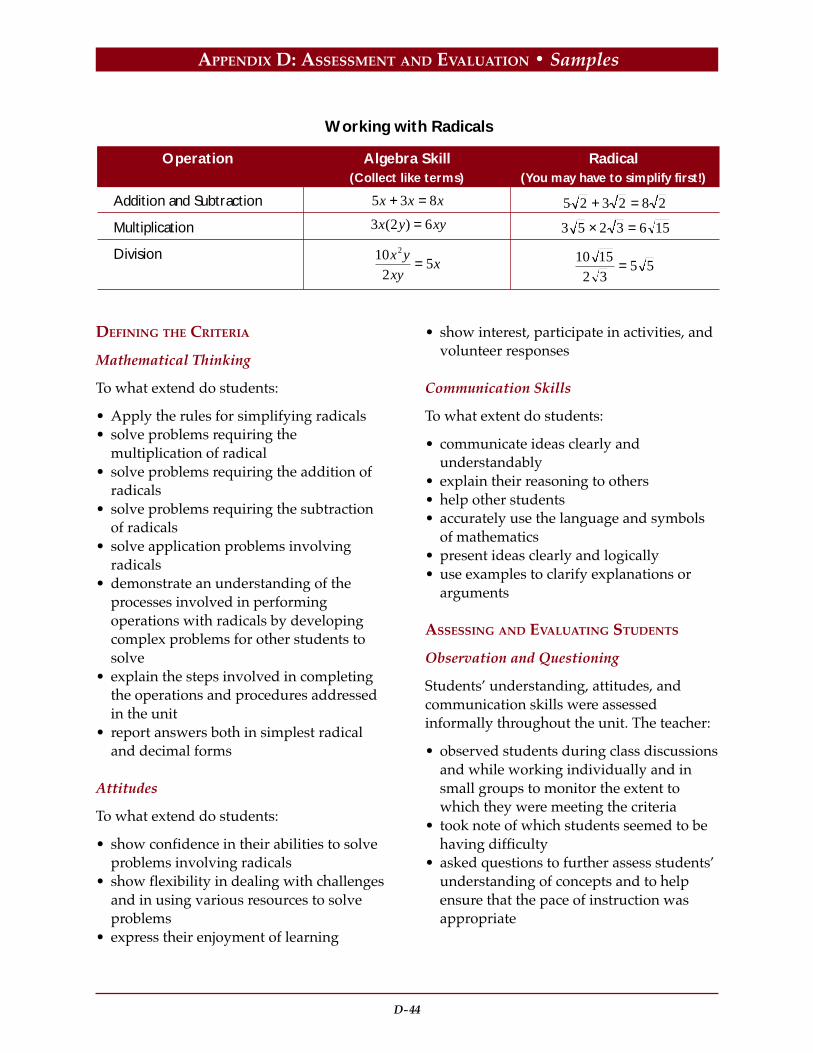
D-44
APPENDIX D: ASSESSMENT AND EVALUATION • Samples
DEFINING THE CRITERIA
Mathematical Thinking
To what extend do students:
• Apply the rules for simplifying radicals• solve problems requiring the
multiplication of radical• solve problems requiring the addition of
radicals• solve problems requiring the subtraction
of radicals• solve application problems involving
radicals• demonstrate an understanding of the
processes involved in performingoperations with radicals by developingcomplex problems for other students tosolve
• explain the steps involved in completingthe operations and procedures addressedin the unit
• report answers both in simplest radicaland decimal forms
Attitudes
To what extend do students:
• show confidence in their abilities to solveproblems involving radicals
• show flexibility in dealing with challengesand in using various resources to solveproblems
• express their enjoyment of learning
Operation Algebra Skill Radical(Collect like terms) (You may have to simplify first!)
Working with Radicals
5 3 8x x x+ =
3 2 6x y xy( ) =
102
52x y
xyx=
5 2 3 2 8 2+ =
3 5 2 3 6 15× =
10 152 3
5 5=
Addition and Subtraction
Multiplication
Division
• show interest, participate in activities, andvolunteer responses
Communication Skills
To what extent do students:
• communicate ideas clearly andunderstandably
• explain their reasoning to others• help other students• accurately use the language and symbols
of mathematics• present ideas clearly and logically• use examples to clarify explanations or
arguments
ASSESSING AND EVALUATING STUDENTS
Observation and Questioning
Students’ understanding, attitudes, andcommunication skills were assessedinformally throughout the unit. The teacher:
• observed students during class discussionsand while working individually and insmall groups to monitor the extent towhich they were meeting the criteria
• took note of which students seemed to behaving difficulty
• asked questions to further assess students’understanding of concepts and to helpensure that the pace of instruction wasappropriate

D-45
APPENDIX D: ASSESSMENT AND EVALUATION • Samples
• observed students at work for evidence ofunderstanding of concepts
• evaluated the quality of questions theyasked and listened to their discussion insmall groups
• moved through the classroom as thestudents worked independently and ingroups to review their work and provideindividual assistance as needed.
Team Competition
Students worked in teams to develop andsolve a specified number of problems. Teamstook turns writing one of their problems on theboard. Students in the other groups weregiven three minutes to solve it. (Time limitsmay need adjusting.) Each group that correctlysolved the problem in the specified timereceived one point. If none of the teams solvedthe problem, the team that developed theproblem received one point. If none of theteams solved the problem, the team thatdeveloped the problem received one point.Any team that created a problem that was notsolvable using the information learned in thisunit or that incorrectly solved the problem, lostone point. Play rotated between the groupsuntil all of the problems had been presented.Each group received a mark for the activity;the mark was then assigned to each student inthe group. Marks were based on the number ofpoints the group accrued plus the teacher’s 1-5rating of the complexity of the problemsdeveloped by the group.
Project
To assess individual student’s understandingof the concepts covered in the unit, theteacher directed them to prepare detailed,step-by-step directions on how to completethe operations they had discussed. Studentschose two topics from each of the followingcategories:
• Category 1:- simplifying radicals- removing radicals from the denominator- converting answers from simplest radical
to decimal form
• Category 2:- adding radicals- subtracting radicals- multiplying radicals- dividing radicals and solving
combination problems
Students prepared detailed instructions forcompleting the operations they chose.Students were asked to think of the teacheras a new students who did not know how todo the operations or procedures they weredescribing. Students were told to usewhatever resources were available inpreparing their instructions and to build inexamples when-ever possible. The teacherrated students’ instructions on the followingscale.
• Students received copies of the rating scalewhen they started the assignment. At theend of the project they used the scale forself-assessments. Students compared theirratings with those of the teacher during abrief conference. Finally the teachercompiled instructions for each topic andgave them to students for future reference.

D-46
APPENDIX D: ASSESSMENT AND EVALUATION • Samples
Key 5 Excellent4-Good3-Average2-Needs improvement1-Not Acceptable
Attitude Scale
Students completed the following ratingscale. Students then summarized the classresults and discussed their meaning.
Please complete the following rating scale tosummarize your feelings about the activitiesyou participated in and the things youlearned in this unit. Circle the number thatbest describes your feelings.
Key 5 - Strongly Agree4 - Agree3 - No Opinion2 - Disagree1 - Strongly Disagree
Statement
• I like working with square roots.
• I enjoy working with radicals.
• Working with radicals is easy.
• I feel comfortable putting radicals in their simplest form.
• I find it easier to add and subtract radicals than to multiply and divide them.
• I learned enough from this unit to feel comfortable working with radicals.
• I enjoyed the activities included in this unit
Rating
Attitude Scale
5 4 3 2 1
5 4 3 2 1
5 4 3 2 1
5 4 3 2 1
5 4 3 2 1
5 4 3 2 1
5 4 3 2 1
Criteria
• explanations are clear and easy to understand
• ideas are logically sequenced
• the project demonstrates a good understanding of the topic
• examples support and clarify the explanation
• language and symbols of mathematics are used correctly
Rating
Project Scale
5 4 3 2 1
5 4 3 2 1
5 4 3 2 1
5 4 3 2 1
5 4 3 2 1
D-47
APPENDIX D: ASSESSMENT AND EVALUATION • Samples
SAMPLE 8:PRINCIPLES OF MATHEMATICS 11
Topic: Graphing Techniques
Prescribed Learning Outcomes:
Problem Solving
It is expected that the student will:
• demonstrate the ability to workindividually and co-operatively to solveproblems
• develop specific skills in selecting andusing an appropriate problem-solvingstrategy or combination of strategies
• use appropriate technology to assist inproblem solving
Patterns and Relations (Relationsand Functions)
It is expected that students will:
• connect algebraic and graphicaltransformations of quadratic functions,using completing the square as required.
• describe, graph and analyze polynomialand rational functions, using technology
In addition to these outcomes, the teacherassessed students’ attitudes and group skills.
UNIT FOCUS
The teacher emphasized the relationshipsbetween algebraic and graphicalrepresentations of functions to help studentsgain insight into the interconnectedness ofvarious branches of mathematics. Studentswere given opportunity to study patternsand develop the graphing skills they neededto visually represent the abstractrelationships described by equations.Students were given opportunities todemonstrate higher-order thinking skills asthey determined the complex equations
represented by graphs and learned to usegraphing calculators.
PLANNING THE UNIT
To plan the unit, the teacher:
• identified the prescribed learningoutcomes for this unit
• examined the prerequisite knowledge andskills needed to achieve these outcomesinterpret function notation
• determined which prerequisites werealready in place and which should bereviewed
• planned a variety of activities to helpstudents achieve the learning outcomesand to connect their learning to otherdesirable outcomes (e.g., group skills,attitudes)
• identified criteria to use to evaluatestudents’ learning
• designed assessment that was an integralpart of the instructional process
THE UNIT
Demonstrating Understanding of BasicFunctions and Their Graphs
• Together, students and teacher createdgraphs of all seven basic functions.
• Games were used to reinforce students’understanding of the basic functions(square route, rational, quadratic, linear,polynomial) and their associated graphs.In this manner, students received drill andpractice until the teacher judged that theassociations were automatic, and that allstudents were familiar with the basicfunctions and could graph them quickly.
Changing the Basic Equations
• In order to develop transformations to thebasic equations that would result invertical translations, the teacher worked

D-48
APPENDIX D: ASSESSMENT AND EVALUATION • Samples
with the class to sketch graphs of formulaesuch as:y = x2 + 1, y = x2 - 2comparing them with the basic graph ofy = x2
The teachers used these comparisons towork with students to develop the rule.
• A similar process was used to developstudents’ understanding of, first,horizontal translations, then reflections,and finally dilations (expansions andcompressions).
• To further develop students’understanding of transformations, theteacher asked “what if?” questions. (e.g.,What if y = x became y = - x ?) Theteacher asked increasingly complexquestions to challenge students’understanding.
• Once all the transformations wereidentified, the teacher introducedcombinations of them to the discussion,further increasing the complexity.
Reinforcing and DemonstratingUnderstanding
• Students worked in small groups todetermine the equations and tables ofvalues that would result from variousgraphs, showing translations, reflectionsand dilations. Students used a graphingcalculator to check their results.
• The teacher set up a team competitionwhere groups of students developedequations for another group to graph.These graphs were then exchanged with asecond groups, whose task was todetermine which equations were used. Asa variation, groups exchanged a graphingcalculator that displayed a graph, andchallenged other groups to replicate thegraph or determine the equations used.
DEFINING THE CRITERIA
Mathematical Thinking
To what extend do students:
• use their knowledge of the basic functionsand the rules for transformations to drawthe graphs associated with complex formsof the basic functions. For example:y = -2(x -1)2 + 3
• predict changes that occur in a graphgiven variations to the equations for thebasic functions
• demonstrate the higher-level thinkingnecessary to reverse the activity (develop acomplex equation when given its graph)
• use appropriate mathematical terminologyand notation
• demonstrate the ability to input functionsinto a graphing calculator
• compare graphs by explaining similaritiesand differences with respect to theirdefining equations
• explain properties of graphs based on themathematical properties of the equation(e.g., can not be negative, thereforegraph has restrictions)
• matching a relation or real data to anappropriate function or graph.
• demonstrate a willingness to explore,experiment, and use alternative strategiesto make predictions and test hypotheses
• show a willingness to persevere in solvingdifficult problems
• show flexibility in the use of availableresources (e.g., calculators, sketches,graphs, help from other students or theteacher)
Group Skills
To what extent do students:
• communicate ideas clearly andunderstandably

D-49
APPENDIX D: ASSESSMENT AND EVALUATION • Samples
• work with other students in whole-classand small-group discussions, to build onideas and reinforce understanding
• present logical arguments to support theirconclusions
• listen to the ideas of other students
ASSESSING AND EVALUATING PERFORMANCE
Observing and Questioning
The teacher assessed students’understanding, attitudes, and group skillsinformally throughout the unit by:
• observing students as they participatedin class and small-group activities, takingnote of behaviors that indicated whetherthey were achieving the criteriaestablished for the unit
• asking questions to assess students’understanding of the concepts being taught
• moving through the class, observingstudents’ work, encouraging their efforts,and listening to comments as they workedin small groups (the teacher knew studentswere involved in the unit when they madecomments like: “Let’s see what happensif...”; “Maybe we should try...”; “I wonderwhat would happen if...”).
Students completed a summary sheetdesigned to help them pull together andorganize their learning in this unit. Studentsused available resources (e.g., notes,textbooks, in peer and teacher consultations)to complete this assignment. The teachercollected and reviewed the summary sheets,had students make corrections, and advisedthem to keep the sheets for future reference.
The teacher used the rating scale on the nextpage to evaluate the summary sheets.
Key: 4-Exceptional.3-Acceptable.2-Needs improvement.1-Little understanding shown.
Criteria
• draws the basic graph associated with each form of the basic equation
• uses a knowledge of the basic functions and the rules for transformationsto draw the graphs associated with complex forms of the basic functions
• identifies and plots key points or lines on the graphs
• identifies each type of transformation that occurs as a result of identifiedchanges to the basic equations
Rating
Summary Sheet
1 2 3 4
1 2 3 4
1 2 3 4
1 2 3 4
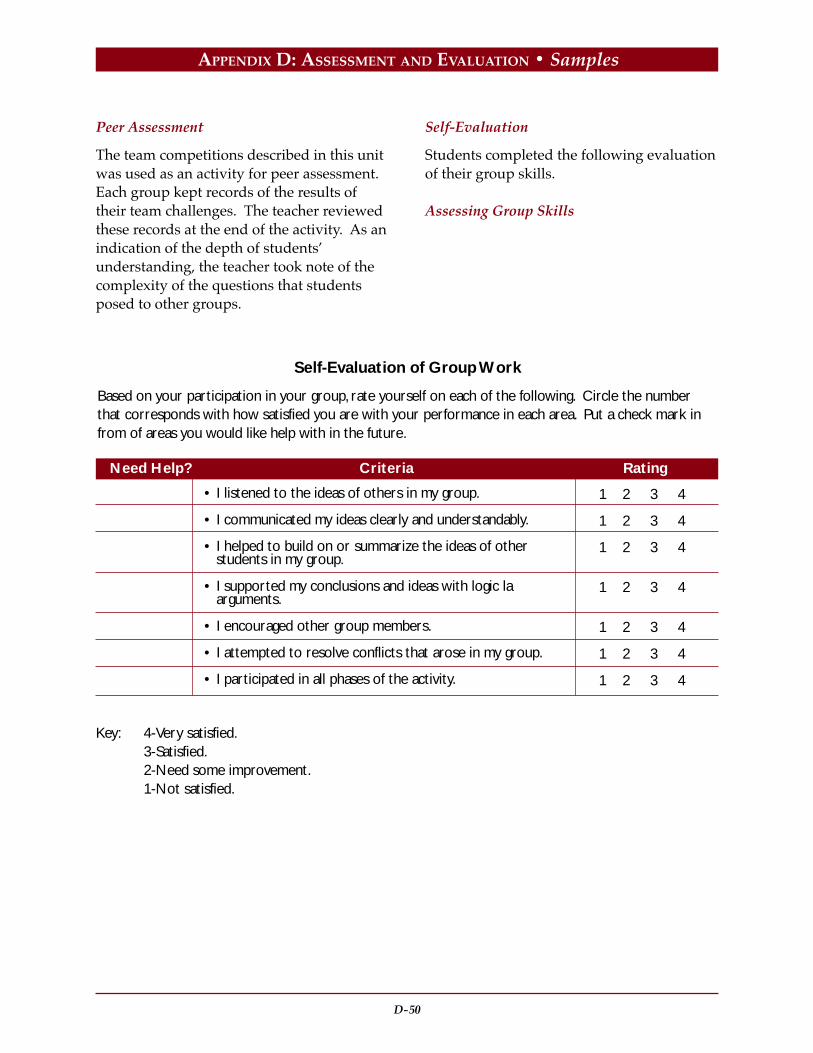
D-50
APPENDIX D: ASSESSMENT AND EVALUATION • Samples
Peer Assessment
The team competitions described in this unitwas used as an activity for peer assessment.Each group kept records of the results oftheir team challenges. The teacher reviewedthese records at the end of the activity. As anindication of the depth of students’understanding, the teacher took note of thecomplexity of the questions that studentsposed to other groups.
Self-Evaluation
Students completed the following evaluationof their group skills.
Assessing Group Skills
Key: 4-Very satisfied.3-Satisfied.2-Need some improvement.1-Not satisfied.
Criteria
• I listened to the ideas of others in my group.
• I communicated my ideas clearly and understandably.
• I helped to build on or summarize the ideas of otherstudents in my group.
• I supported my conclusions and ideas with logic laarguments.
• I encouraged other group members.
• I attempted to resolve conflicts that arose in my group.
• I participated in all phases of the activity.
Rating
Self-Evaluation of Group Work
Based on your participation in your group, rate yourself on each of the following. Circle the numberthat corresponds with how satisfied you are with your performance in each area. Put a check mark infrom of areas you would like help with in the future.
1 2 3 4
1 2 3 4
1 2 3 4
1 2 3 4
1 2 3 4
1 2 3 4
1 2 3 4
Need Help?
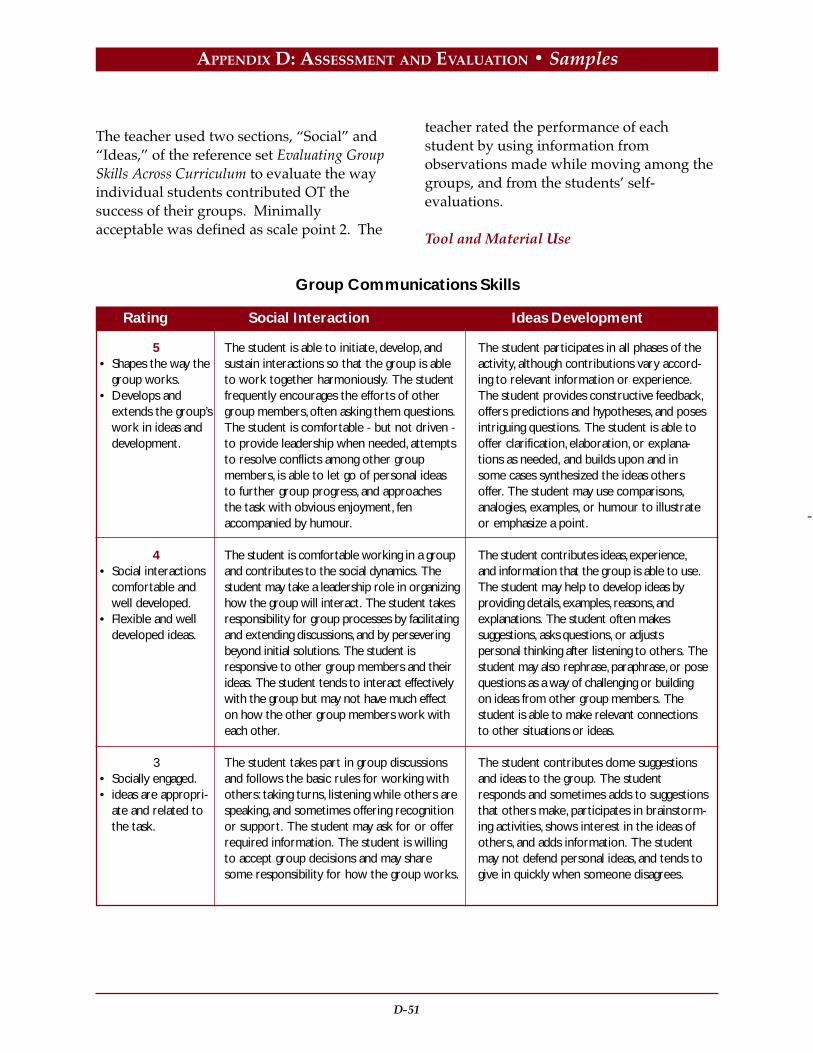
D-51
APPENDIX D: ASSESSMENT AND EVALUATION • Samples
The teacher used two sections, “Social” and“Ideas,” of the reference set Evaluating GroupSkills Across Curriculum to evaluate the wayindividual students contributed OT thesuccess of their groups. Minimallyacceptable was defined as scale point 2. The
teacher rated the performance of eachstudent by using information fromobservations made while moving among thegroups, and from the students’ self-evaluations.
Tool and Material Use
The student is able to initiate, develop, andsustain interactions so that the group is ableto work together harmoniously. The studentfrequently encourages the efforts of othergroup members, often asking them questions.The student is comfortable - but not driven -to provide leadership when needed, attemptsto resolve conflicts among other groupmembers, is able to let go of personal ideasto further group progress, and approachesthe task with obvious enjoyment, fenaccompanied by humour.
The student is comfortable working in a groupand contributes to the social dynamics. Thestudent may take a leadership role in organizinghow the group will interact. The student takesresponsibility for group processes by facilitatingand extending discussions, and by perseveringbeyond initial solutions. The student isresponsive to other group members and theirideas. The student tends to interact effectivelywith the group but may not have much effecton how the other group members work witheach other.
The student takes part in group discussionsand follows the basic rules for working withothers: taking turns, listening while others arespeaking, and sometimes offering recognitionor support. The student may ask for or offerrequired information. The student is willingto accept group decisions and may sharesome responsibility for how the group works.
Group Communications Skills
Rating Social Interaction Ideas Development
5• Shapes the way the
group works.• Develops and
extends the group’swork in ideas anddevelopment.
4• Social interactions
comfortable andwell developed.
• Flexible and welldeveloped ideas.
3• Socially engaged.• ideas are appropri-
ate and related tothe task.
The student participates in all phases of theactivity, although contributions vary accord-ing to relevant information or experience.The student provides constructive feedback,offers predictions and hypotheses, and posesintriguing questions. The student is able tooffer clarification, elaboration, or explana-tions as needed, and builds upon and insome cases synthesized the ideas othersoffer. The student may use comparisons,analogies, examples, or humour to illustrateor emphasize a point.
The student contributes ideas, experience,and information that the group is able to use.The student may help to develop ideas byproviding details, examples, reasons, andexplanations. The student often makessuggestions, asks questions, or adjustspersonal thinking after listening to others. Thestudent may also rephrase, paraphrase, or posequestions as a way of challenging or buildingon ideas from other group members. Thestudent is able to make relevant connectionsto other situations or ideas.
The student contributes dome suggestionsand ideas to the group. The studentresponds and sometimes adds to suggestionsthat others make, participates in brainstorm-ing activities, shows interest in the ideas ofothers, and adds information. The studentmay not defend personal ideas, and tends togive in quickly when someone disagrees.
-

D-52
APPENDIX D: ASSESSMENT AND EVALUATION • Samples
The students’ performances with respect tothe safe and proper use of tools andmaterials was evaluated using the followingperformance scale:
OutstandingThe student makes exceptionally thoughtfulchoices of materials, uses tools withproficiency, is especially conscientious aboutthe safety of self and others, and assists inthe organization and maintenance of a safe,orderly work environment.
CompetentThe student chooses appropriate materialsand tools, uses tools correctly, uses theproper safety equipment and procedures,and exhibits personal preparedness withrespect to clothes, shoes, hair, jewelry,sleeves, and so forth.
The student may begin to show someawareness of the responsibilities of contribut-ing to a group, may sometimes recognize andrespond to the needs and ideas of others,and may show appreciation or support. Atother times the student may have difficultytaking turns or accepting suggestions fromother students. The student may remainuncommitted, focusing on personal needsrather than the group’s task.
The student may not understand howpersonal behaviour affects others, and may bedisruptive, aggressive, uninvolved, or easilyfrustrated.
Rating Social Interaction Ideas Development
2• Inconsistent social
interaction.• Ideas often
disconnected.
1• Largely unaware of
others’ needs• Limited contribu-
tion of ideas.
The student contributes ideas that addressthe task, but these may be unconnected tothe ideas of others. The student may offerseveral suggestions but appears unable toelaborate, explain, or clarify ideas. Thestudent often related the activity to personalexperiences by telling stories. The studentmay think out loud, judge others’ ideasquickly, or drift off-task easily.
The student may remain silent throughoutthe activity, contribute one idea repeatedly,or recount personal experiences unrelatedto the group task. The student may notacknowledge or add to the contributions ofother group members, but may respond todirect questions or other prompts fromadults.
UnacceptableThe student may be able to identify commontools but is unsure what tools to use forparticular tasks and materials. Materialschoices may be inappropriate. The studentmay not use proper safety measures or mayneed excessive supervision in order to do so.The student may be unaware of howpersonal actions affect the safety of others.
D-53
APPENDIX D: ASSESSMENT AND EVALUATION • Samples
SAMPLE 9:PRINCIPLES OF MATHEMATICS 12
Topic: Logarithms
Prescribed Learning Outcomes:
Problem Solving
It is expected that the student will:
• analyse a problem and identify thesignificant elements
• develop specific skills in selecting andusing an appropriate problem-solvingstrategy or combination of strategieschosen from, but not restricted to, thefollowing:- guess and check- look for a pattern- make a systematic list- make and use a drawing or model- eliminate possibilities- work backward- simplify the original problem- develop alternative original; approaches- analyse key words
• demonstrate the ability to workindividually and co-operatively to solveproblems
• determine that the solutions are correctand reasonable, and clearly communicatethe process used to solve the problem
• use appropriate technology to assist inproblem solving
Patterns and Relations (Relations andfunctions)
It is expected that students will:
• model, graph, and apply exponentialfunctions to solve problems
• change functions from exponential form tologarithmic form and vice versa
• model, graph, and apply logarithmicfunctions to solve problems
• explain the relationship between the lawsof logarithms and the laws of exponents
In addition to these outcomes, the teacherassessed students’ attitudes, and group andcommunication skills.
UNIT FOCUS
Real-life problems in such divers situationsas investment analysis, population growth,and radioactive decay cannot easily besolved using basic algebra. This unit focuseson building students’ understanding of theinverse relationship between exponentialand logarithmic functions so they can findsolutions to such problems. The teacherprovided opportunities for students to workindividually and in small groups todemonstrate their abilities to solveapplication problems and their knowledgeabout why logarithms are important andhow they can be used.
PLANNING THE UNIT
To plan the unit, the teacher:
• identified the prescribed learningoutcomes for instruction and assessmentfor the unit and the prerequisiteknowledge and skills needed to achievethese outcomes.
• determined which of these prerequisiteswere already in place and which to review
• looked for ways to connect students’learning to other desirable learningoutcomes, including those associated withgroup-work skills, communication skills,and attitudes
• identified the criteria to use to evaluatestudents’ success in the unit
• designed assessment to be an integral partof the instructional process

D-54
APPENDIX D: ASSESSMENT AND EVALUATION • Samples
• began the unit by reviewing exponentlaws and operations with exponents withthe students
THE UNIT
Understanding Base 10 Logarithms
• The unit began with a review of exponentlaws and operations with exponents.
• The teacher worked with the students todevelop the definition of base 10 logs.Using numeric examples to establishstudents’ understanding, the teacherguided them to discover the pattern:1000 = 10?, 100 = 10?, 10 = 10?, 1 = 10?
The teacher related students’ discovery andunderstanding of the pattern to the formaldefinition of base 10 logs, and explained thatlog was really just another name forexponent.
• To move students toward working withbase 10 logs of numbers that are notintegral powers of 10, the teacher askedstudents to estimate, based on theirknowledge of base 10 logs, what power 10would be raised to in order to get the logof a number such as 65. The teachers askedquestions to prompt their thinking (e.g.,What is it between? Is it closer to 1 or 2?).
• Students were asked to find a button ontheir calculator that would help them findthe log of 65. Together, the students andteacher worked through a number ofexamples, first estimating what the logmight be, then using their calculators tofind the actual log.
• To develop the restriction to the definition:
log x is defined only if x > 0 (the log ofzero and negative numbers is undefined)
students were challenged to guess the logsof one and zero and then find them ontheir calculators. The teacher askedquestions like:- Why does zero give you an error
message on your calculators?- Can 10 raised to some power give you a
negative number? Why not?- Can you find the log of a negative
number?• The teacher used similar strategies to
develop other rules associated withlogarithms, such as:log 10x = x and 10log x = x
Students were given practice movingbetween exponential and logarithmic formsusing their calculators before proceeding tothe next part of the unit.
Performing Operations with Logarithms
• The class discussed why it is important tobe able to establish the same base fornumbers. (Logs allow us to establish asimilar base for numbers and to work withthem more easily as a result.) the teacherasked specific questions that made use ofexponent properties. This remindedstudents about their experience workingwith exponential expressions in algebraand of the exponent laws for multiplyingand dividing expressions with the samebase. The teacher prompted students tomake a connection between theirexperiences with algebra and what theywere learning about logs.
• The teacher used simple concreteexamples, such as:1000 x 100 = 103 x 102 = 105
as students began to experiment with therules for multiplying logarithms studentsworked with increasingly complexexamples, such as:(750)(83) = log a + log b

D-55
APPENDIX D: ASSESSMENT AND EVALUATION • Samples
until they were ready to develop theformula:log(ab) = log a + log b
• The teacher used a similar method fordivision of logarithms - drawing onstudents’ experiences working withexponents to help them develop thatformula.
• A similar method was also used todevelop the rule:log an = n log a
• To establish a historical perspective, theteacher showed students how log tableswere used to help perform complicatednumerical operations. Demonstratingwith a slide rule showed how theory wasapplied before the advent of calculators.
• Students practiced applying what theyhad learned about logarithms, and theteacher emphasized the connectionsbetween logs and exponents. Studentswere encouraged to assess their own workby using calculators to verify answers.
• The teacher assigned a worksheet to helpstudents reinforce their learning. Studentswere encouraged to exchange answers andresolve any differences. The teachermoved among the students as theyworked, evaluating their understandingand providing assistance as necessary.
• The teacher provided examples to helpstudents solve equations with commonbases and to reinforce the need for acommon base, such as:23x = 27 moving to 23x = 8-x+4
• Students were then assigned the problem5x = 7 (at this point, students shouldrecognize why having a common base isimportant). The teacher and studentsworked together to see how to solve thisproblem. They used these and similarexamples to develop the process of takinglogs of both sides of an equation togenerate solutions. Students
demonstrated their understanding bysolving additional complex equationsusing their calculators.
Demonstrating Change of Base
• The class moved from base 10 to otherbases. The teacher used concrete numericexamples to help students see theconnections and relationships betweenexponents and logarithmic forms. Forexample:log525 = 2 is the same as 52 = 25log381 = 4 is the same as 34 = 81
• By increasing the complexity of theexamples, the teacher helped studentsgeneralize to:logba = n ∫ ≈bn = aThe teacher stressed the that base and theargument of the function (b & a) must begreater than zero, and b ≠ 1.
• Students confirmed their understandingby working through examples thatrequired them to move back and forthbetween exponential and logarithmicforms.
• The teacher conducted a brief discussionand provided examples to help studentsdiscover that the rules for base 10 apply toother bases.
• The teacher challenged students to find alog they could do on their calculators (e.g.,log1017 and then find a log they could notdo on their calculators (e.g., log517).Students learned to use the change of baseformulalog
log
logb aa
b=
to solve the second type of problem.Students demonstrated theirunderstanding of these ideas by workingindividually on a number of preparedproblems.
D-56
APPENDIX D: ASSESSMENT AND EVALUATION • Samples
• The teacher worked with the class todevelop the graphs of exponentialfunctions. Using graphing techniquesand the students’ knowledge of inverses,the class developed a number of graphsof exponential and logarithmic functions.Here are some examples:y
y x
x= −
= − +
+3 2
1 3
1
12
log ( )
Applying Knowledge of Logarithms
To encourage students to apply theirknowledge of logarithms to real-lifesituations, the teacher asked them tobrainstorm subjects which interested them(e.g., money, earthquakes). The teacherdemonstrated how to use logs andexponents to solve problems related to theirinterests. Students worked in small groupsto solve a number of application problemsand then challenged each other withproblems.
DEFINING THE CRITERIA
Mathematical Thinking
to what extend do students:
• demonstrate an understanding of thedefinition of base 10 logs
• explain the for working with logarithms• describe why logarithms are important
and how they can be used• describe the relationship between
exponents and logarithms• apply the rules for multiplying and
dividing logs to solve simple andcomplex problems
• use the rules for logarithms to solveproblems involving exponential andlogarithmic expressions
• find the logs of numbers with bases otherthan 10
• use appropriate mathematical terminologyand notation
• use their calculators to solve problemsinvolving logarithms
• apply their knowledge of logarithms toreal-life problems
Attitudes
To what extent do students:
• approach problem situations withconfidence
• show a willingness to persevere in solvingdifficult problems
• show flexibility in using availableresources (e.g., calculators, textbooks, helpfrom other students or the teacher)
Group Skills
To what extent do students:
• work with other students in whole-classdiscussions and small groups, to build onideas and understanding
• initiate, develop, and maintain interactionswithin the group
• help other students developunderstanding
Communication Skills
To what extend do students:
• communicate ideas clearly andunderstandably
• listen to and make use of the ideas of otherstudents
ASSESSING AND EVALUATING STUDENT
PERFORMANCE
Observation and Questioning
Students’ understanding, attitudes, andgroup and communication skills wereevaluated informally throughout the unit.

D-57
APPENDIX D: ASSESSMENT AND EVALUATION • Samples
The pace of the unit was determined in partby the speed with which students seemed tograsp the concepts.
The teacher:
• observed students as they participated inwhole-class and small-group activitieslooking for evidence that they understoodthe concepts, built on ideas of others,initiated, developed, and maintainedinteractions within the group, and assistedothers in developing understanding
• reviewed students’ work to note the extentto which they met the criteria formathematical thinking
• made note of behaviours that studentswere or were not achieving the criteriaestablished for the unit (e.g., using
• calculators to solve problems involvinglogarithms)
• used questions to assess students’understanding of central concepts, thelevel of confidence they displayed whenproblem solving, and their willingness topersevere when solving difficult problems
• checked students’ work to note the extentto which they used appropriatemathematical terminology and notationand applied their knowledge of logarithmsto real-life problems
Individual Projects
Each student completed a research project onan issue or current event of personal interest.The project required students to:• use what they learned about exponents
and logarithms• describe the topic and why it was of
interest• describe how the use of exponents and
logarithms related to their topic• look for data and display their findings in
a meaningful way
• explain what their finding meant, whythey were relevant, and why they wereorganized as they were
• use and cite a variety of appropriateinformation sources
• complete a written report, and presenttheir findings to the class
Presentations and reports were evaluatedseparately using the following holistic scale.Students received copies of the scale beforestarting the project and used it to rate theirpresentations and written reports. Theteacher held conferences to discussdiscrepancies between students’ andteacher’s ratings. Students were givensuggestions for improvements. Studentswho received scores of one or two on theirwritten reports were given the opportunityto redo them. The final score for the writtenreport was the higher of the two scores.Project Rating Scale
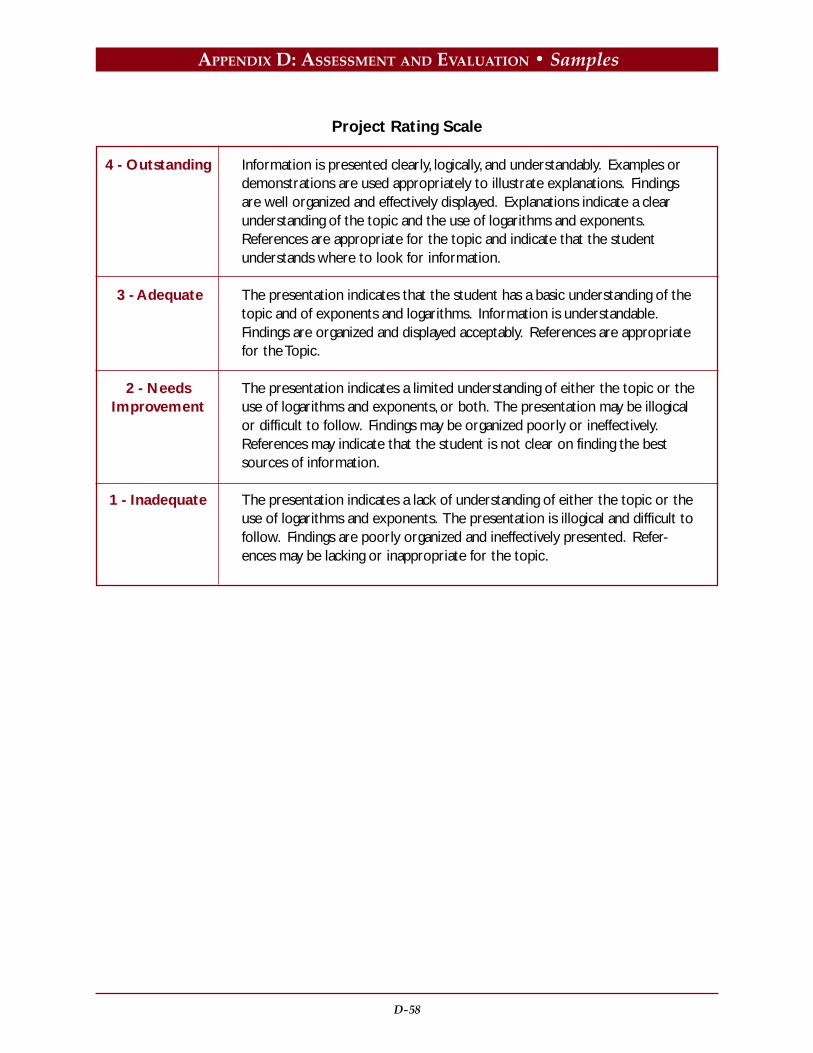
D-58
APPENDIX D: ASSESSMENT AND EVALUATION • Samples
Information is presented clearly, logically, and understandably. Examples ordemonstrations are used appropriately to illustrate explanations. Findingsare well organized and effectively displayed. Explanations indicate a clearunderstanding of the topic and the use of logarithms and exponents.References are appropriate for the topic and indicate that the studentunderstands where to look for information.
The presentation indicates that the student has a basic understanding of thetopic and of exponents and logarithms. Information is understandable.Findings are organized and displayed acceptably. References are appropriatefor the Topic.
The presentation indicates a limited understanding of either the topic or theuse of logarithms and exponents, or both. The presentation may be illogicalor difficult to follow. Findings may be organized poorly or ineffectively.References may indicate that the student is not clear on finding the bestsources of information.
The presentation indicates a lack of understanding of either the topic or theuse of logarithms and exponents. The presentation is illogical and difficult tofollow. Findings are poorly organized and ineffectively presented. Refer-ences may be lacking or inappropriate for the topic.
Project Rating Scale
4 - Outstanding
3 - Adequate
2 - NeedsImprovement
1 - Inadequate

D-59
APPENDIX D: ASSESSMENT AND EVALUATION • Samples
Problem-Solving Observation Sheet
As students worked individually and insmall groups to solve problems relating tologarithms, the teacher moved through theclass observing and asking questions toprobe for understanding. “The Problem-Solving Class Observation Sheet” includedin the publication Evaluating Problem SolvingAcross Curriculum was used to evaluatestudents’ problem-solving skills. The teacherused only those parts of the checklist thatwere appropriate to the classroom activities.Students received a summary of theinformation compiled on the sheet to givethem feedback concerning their problem-solving skills and techniques.
Take-Home Test
Students were given a take-home test thatcontained similar problems to those studiedduring the unit. As part of the test, studentswere required to explain the rules they hadlearned for working with logarithms and usethe rules to solve numeric examples thatillustrated their explanations.
The last page of the test included a self-evaluation sheet that asked the followingquestions:
• What things in this unit did your findeasy?
• What things did you find difficult?• Are there any areas in the unit that you
need more help with? If so, what are they?• Would you be interested in after-school
peer tutoring for help in these areas?• Would you be willing to tutor another
student after school in the areas you feelmost comfortable with?
The teacher used the results of the take-hometest and students’ responses to the self-evaluation to pair students for after-schoolpeer tutoring. Students were required tocorrect errors on their take-home tests andresubmit them for a second evaluations.

D-60
APPENDIX D: ASSESSMENT AND EVALUATION • Samples
SAMPLE 10: CALCULUS 12
Topic: Limits
Prescribed Learning Outcomes:
Problem Solving
It is expected that students will:
• analyse a problem and identify thesignificant elements
• demonstrate the ability to workindividually and co-operatively to solveproblems
• determine that their solutions are correctand reasonable
• clearly communicate a solution to problemand justify the process used to solve it
• use appropriate technology to assist inproblem solving
Functions, Graphs and Limits (Limits)
It is expected that students will:
• demonstrate an understanding of theconcept of limit and notation used inexpressing the limit of a function f x( ) as x
approaches a: x a
f x→
lim ( )
• evaluate the limit of a function:- analytically- graphically- numerically
• distinguish between the limit of a functionas x approaches a and the value of thefunction at x = a
• demonstrate an understanding of theconcept of one-sided limits and evaluateone-sided limits
• determine limits that result in infinity(infinite limits)
• evaluate limits of functions as xapproaches infinity (limits at infinity)
• determine vertical and horizontalasymptotes of a function, using limits
• determine whether a function iscontinuous at x = a
In addition to these outcomes, the teacherassessed outcomes related to the historicaldevelopment of calculus, students’ attitudes,and group and communication skills.
UNIT FOCUS
The concept of a limit plays a central role instudents future understanding of theimportance and usefulness calculus. It is thisunderstanding that enables students toeffectively interpret the results of a variety ofproblem solutions using calculus.
PLANNING THE UNIT
To plan the unit, the teacher:
• identified the prescribed learningoutcomes for instruction and assessmentfor the unit and the prerequisiteknowledge and skills needed to achievethese outcomes.
• determined which of these prerequisiteswere already in place and which to review
• looked for ways to connect students’learning to other desirable learningoutcomes, including those associated withgroup-work skills, communication skills,and attitudes
• identified the criteria to use to evaluatestudents’ success in the unit
• designed assessment to be an integral partof the instructional process
• began the unit by reviewing anddiscussing with students characteristics offunctions that they were familiar with(exponential, logarithmic, sinusoidal, etc.)

D-61
APPENDIX D: ASSESSMENT AND EVALUATION • Samples
THE UNIT
Introducing the Concept of Limit
• The unit began with a review of thecharacteristics of familiar functions andtheir graphs.
• The teacher worked with the students todevelop the concept of limit using anoverhead graphing utility to demonstrategraphically the relationship between avariety of functions and the limits of thefunction at a number of different points.
• Students used graphing calculators toperform “what if” investigations to helpthem determine graphically the effect onthe limits of different types of functions ifthe characteristic equation of the functionwere altered.
One-sided Limits
• Students were encouraged to explore theconcept of one-sided limits by comparingfunctions with one-sided limits to thosethat had different left-hand and right-handlimits.
Infinite Limits and Limits at Infinity
• The teacher provided examples illustratinghow to calculate limits of functions thatresult in infinity and limits of functions asx approaches infinity.
• Guided practice reinforced students’understanding of the difference betweeninfinite limits and limits at infinity.
Asymptotes of a Function
• The teacher then guided class discussionfrom infinite limits and limits at infinity tovertical and horizontal asymptotes of afunction
• Students were given practice determiningthe vertical and horizontal asymptotes ofdifferent functions, using limits.
Continuous Functions
• The teacher began by demonstrating that acontinuous function is one which can begraphed over each interval of its domainwith one continuous motion of the pen.
• This concept was expanded to the use of agraphing calculator where graphs offunctions that were not continuous at x = ahad “holes” were no pixels wererepresented.
• Students were then asked to use limits todescribe this phenomenon. The teacherreinforced that a function is continuous at
a point x = a if lim
( ) ( )x a
f x f a→
=
Applying Knowledge of Limits
To encourage students to apply theirknowledge of limits to solve some of thehistorical problems that the teacher hadintroduced at the beginning of the unit (i.e.,tangent line problem and the area problem).Students worked in small groups to developpossible solutions to the problems.
DEFINING THE CRITERIA
Mathematical Thinking
to what extend do students:
• demonstrate an understanding of theconcept of limit
• can evaluate the limit of a function in avariety of ways and show the connectionbetween the methods (analytical,graphical, numerical)
• describe why limits are important andhow they can be used
• describe the difference between infinitelimits and limits at infinity

D-62
APPENDIX D: ASSESSMENT AND EVALUATION • Samples
• use limits to determine asymptotes of afunction and to determine whether thefunction is continuous at a given point.
Attitudes
To what extent do students:
• approach problem situations withconfidence
• show a willingness to persevere in solvingdifficult problems
• show flexibility in using available resources(e.g., graphing calculators, textbooks, helpfrom other students or the teacher)
Group Skills
To what extent do students:
• work with other students in whole-classdiscussions and small groups, to build onideas and understanding
• initiate, develop, and maintain interactionswithin the group
• help other students developunderstanding
Communication Skills
To what extend do students:
• communicate ideas clearly andunderstandably
• listen to and make use of the ideas of otherstudents
ASSESSING AND EVALUATING STUDENT
PERFORMANCE
Observation and Questioning
Students’ understanding, attitudes, andgroup and communication skills wereevaluated informally throughout the unit.The pace of the unit was determined in partby the speed with which students seemed tograsp the concepts.
The teacher:
• observed students as they participated inwhole-class and small-group activitieslooking for evidence that they understoodthe concepts, built on ideas of others,initiated, developed, and maintainedinteractions within the group, and assistedothers in developing understanding
• reviewed students’ work to note the extentto which they met the criteria formathematical thinking
• made note of behaviours that studentswere or were not achieving the criteriaestablished for the unit (e.g., usinggraphing calculators to determine limitswhen appropriate)
• used questions to assess students’understanding of central concepts, thelevel of confidence they displayed whenproblem solving, and their willingness topersevere when solving difficult problems
• checked students’ work to note the extentto which they used appropriate limitterminology and notation.
Individual Projects
Each student completed a research project onan topic or mathematician of personalinterest. The project required students to:• use what they learned about limits• describe the topic and why it was of
interest• describe how the use of limits related to
their topic• explain what their finding meant, why
they were relevant, and why they wereorganized as they were
• use and cite a variety of appropriateinformation sources
• complete a written report, and presenttheir findings to the class

D-63
APPENDIX D: ASSESSMENT AND EVALUATION • Samples
Presentations and reports were evaluatedseparately using the following holistic scale.Students received copies of the scale beforestarting the project and used it to rate theirpresentations and written reports. Theteacher held conferences to discussdiscrepancies between students’ and
teacher’s ratings. Students were givensuggestions for improvements. Studentswho received scores of one or two on theirwritten reports were given the opportunityto redo them. The final score for the writtenreport was the higher of the two scores.
Information is presented clearly, logically, and understandably. Examples ordemonstrations are used appropriately to illustrate explanations. Findings arewell organized and effectively displayed. Explanations indicate a clear under-standing of the topic and the use of limits in a variety of contexts (e.g., todetermine asymptotes of a function). References are appropriate for the topicand indicate that the student understands where to look for information.
The presentation indicates that the student has a basic understanding of thetopic and of limits. Information is understandable. Findings are organizedand displayed acceptably. References are appropriate for the Topic.
The presentation indicates a limited understanding of either the topic or theuse of limits, or both. The presentation may be illogical or difficult to follow.Findings may be organized poorly or ineffectively. References may indicatethat the student is not clear on finding the best sources of information.
The presentation indicates a lack of understanding of either the topic or theuse of limits. The presentation is illogical and difficult to follow. Findings arepoorly organized and ineffectively presented. References may be lacking orinappropriate for the topic.
Project Rating Scale
4 - Outstanding
3 - Adequate
2 - NeedsImprovement
1 - Inadequate
D-64
APPENDIX D: ASSESSMENT AND EVALUATION • Samples
Test/Team Competition
To evaluate students’ understanding of theconcepts developed in this unit, the teacherdesigned a team competition based oncompleting a set of items on a study sheet.Students worked in groups of four and usedall available resources to answer each of theitems. The groups were given opportunitiesto drill each other. When all members of thegroup felt comfortable with the information,they were asked to take a test individuallythat contained items similar to those on thestudy sheet. The teacher collected the tests,scored them, and gave each student a grade.Groups worked together to correct their testsand returned their corrections for additionalpoints. The winning group had the highestaverage individual test scores and thehighest average scores on their corrections.
Take-Home Test
Students were given a take-home test thatcontained similar problems to those studiedduring the unit. As part of the test, studentswere required to explain the rules they hadlearned for working with limits and use therules to solve examples that illustrated theirexplanations.
The last page of the test included a self-evaluation sheet that asked the followingquestions:
• What things in this unit did your findeasy?
• What things did you find difficult?• Are there any areas in the unit that you
need more help with? If so, what are they?• Would you be interested in after-school
peer tutoring for help in these areas?• Would you be willing to tutor another
student after school in the areas you feelmost comfortable with?
The teacher used the results of the take-hometest and students’ responses to the self-evaluation to pair students for after-schoolpeer tutoring. Students were required tocorrect errors on their take-home tests andresubmit them for a second evaluations.
D-65
APPENDIX DAssessment Practices

D-66

D-67
Teachers should base their assessmentand evaluation of student performance on a wide variety of methods
and tools, including observation, studentself-assessments, daily practice assignments,quizzes, work samples, pencil-and-papertests, holistic rating scales, projects, oral andwritten reports, performance reviews, andportfolio assessments. Using a variety ofassessment methods can help teachers tocompile comprehensive profiles of studentlearning. The Assessment Handbook Series—Performance Assessment, Portfolio Assessment,Student Self-Assessment, Student-CentredConferences, and various reference sets—provide useful, detailed information about arange of appropriate assessment practices.The rest of this appendix provides guidancein creating classroom tests.
CONSTRUCTING CLASSROOM TESTS
There are two types of evaluations that takeplace in a classroom, each with its owndistinct purpose.
• Formative evaluations are ongoing assess-ments used to guide learning rather thandraw final conclusions.
• Summative evaluations refer to evaluativeprocedures (e.g., tests, reports, projects)usually conducted at the end of majorunits, to assess performance against prede-termined criteria. These normally repre-sent a substantial portion of final grades.The classroom tests described in thissection fall under the category ofsummative evaluations.
All tests should be developed using theprinciples of criterion-referenced evaluation.In criterion-referenced evaluation, studentachievement is interpreted in relation topreviously defined levels of achievement,rather than relative to the achievement of
APPENDIX D: ASSESSMENT AND EVALUATION • Assessment Practices
other students. Questions on a criterion-referenced test should be representativeof a clearly defined domain of prescribedlearning outcomes. In this way, scores moreaccurately represent the student’s presentstatus with respect to those outcomes.
A test should measure what it intends tomeasure. For example, if a test requires areading level far above the abilities of manyof the students taking the test, test resultswould measure differences in reading levelsrather than differences in subject knowledge.
STEPS IN CLASSROOM TEST CONSTRUCTION
The following suggests the key points toconsider when developing classroom tests.

D-68
APPENDIX D: ASSESSMENT AND EVALUATION • Assessment Practices
Steps in ClassroomTest Construction Points for Consideration
Plan the Test • Begin the planning process well in advance.• Identify the prescribed learning outcomes to be tested. Learning
outcomes provide a framework for the development of criteria.• Create a table of specifications that covers the learning outcomes
and cognitive levels (knowledge, understanding, higher mentalprocesses).
• Balance the table of specifications to reflect the topics and cogni-tive levels in the curriculum.
Write Test Items • Word questions clearly. (e.g., Use “determine a value for x”rather than “find x.”)
• Define the answer format so students understand the form theiranswers must take.
• Don’t repeat questions on one outcome.• When possible, design questions that connect various topics
within the curriculum area and between various curricula.• Create questions that require various forms of answers (e.g.,
explaining, comparing, illustrating, graphing, calculating, solving,justifying).
• Categorize every question according to the criteria.• Don’t phrase distractors in multiple-choice questions so that they
point to the answer.• Review questions for appropriate vocabulary and targetted
reading levels.• Ask a colleague to answer the questions to identify possible
marking problems and time requirements, and to provide feed-back.
Format the Test • Use easier questions at the beginning of the test to establishstudents’ confidence.
• Group similar items.• Organize items on the page so they are easy to read and provide
adequate space for responses.• Develop test instructions that are clear and unambiguous.

D-69
APPENDIX D: ASSESSMENT AND EVALUATION • Assessment Practices
Develop a Scoring Key • Mark for processes as well as correct answers.• Allow for possible alternative solutions or different forms of
answers (e.g., format, notation, detail).• Consider a range of scoring methods (e.g., holistic, analytic).
Prepare Students • Establish test criteria with students.• Help students brainstorm topics that are likely to be covered.• Discuss how to approach the test (budget time and the weight
given test results in the final grade).• Give students sufficient time to prepare for the test.• Review terminology used on the test (e.g., evaluate, simplify).
Administer the Test • Allow time for all, or nearly all, students to finish.• Ensure a test location free of distractions.• Ensure all necessary supplies are available.
Score the Tests • Test the effectiveness of the key on a few sample tests. Adjustthe key as necessary. Note exemplar papers.
• Mark tests at one sitting (or one question at one sitting) toensure consistency.
• Return marked tests promptly, and review them with the stu-dents to help them improve their understanding of the conceptsinvolved.
Table of Specifications A unit test in mathematics must measure the skills or conceptstaught in the unit. A table of specifications can help the teacher planthe amount of emphasis to give each skill or concept.
A table of specifications is a chart showing the content categoriesand cognitive levels to be tested. The percentage weighting of testitems within any row or column is determined by the amount oftime devoted to the content categories and their degree of difficulty.

D-70
APPENDIX D: ASSESSMENT AND EVALUATION • Assessment Practices
Table of Specifications
Unit # Variables and Equations Principles of Mathematics 11
Content Knowledge• recall• conventions• classification• notation
Percentageof Total
Higher MentalProcesses• analysis• synthesis• evaluation
Understanding• application of
theories, ideas,principles, ormethods to a newsituation
Problem Solving 2 questions 4 questions 24%
Algebraic Skills 5 questions 2 questions 40%3 questions
Use of Technology 2 questions
MathematicalReasoning
% of Total 20% 36% 44% 100%
2 questions 16%
5 questions 20%

APPENDIX EAcknowledgments

APPENDIX E: ACKNOWLEDGMENTS
E-2

E-3
APPENDIX E: ACKNOWLEDGMENTS
Many people contributed their expertise to this document. The project coordinator was BruceMcAskill of the Curriculum Branch, working with ministry personnel and our partners ineducation. We would like to thank all who participated in this process.
MATHEMATICS OVERVIEW TEAM
Cathy BockBC Confederation of Parent Advisory Councils
Jack BradshawColleges and Institutes
Russell BreakeyBC Association of Learning Materials andEducational Representatives
Cary ChienBC Teachers’ Federation
Chris EvansBC School Trustees’ Association
Barry IrvineBusiness Council of British Columbia
David LeemingUniversities
David LidstoneColleges and Institutes
Leslie MolnarColleges and Institutes
Ron MuzzilloBC School Superintendents’ Association
David PaulBC Principals’ and Vice-Principals’Association
Garry PhillipsBC Teachers’ Federation
WESTERN CANADIAN PROTOCOL:LEARNING OUTCOMES WRITING TEAM (BC COMPONENT)
Cary ChienSchool District No. 39 (Vancouver)
Keith ChongSchool District No. 37 (Delta)
Delee CowanSchool District No. 23 (Central Okanagan)
Ivan JohnsonSchool District No. 41 (Burnaby)
Richard MacDonaldSchool District No. 36 (Surrey)
Dhavinder TiwariSchool District No. 68 (Nanaimo-Ladysmith)

APPENDIX E: ACKNOWLEDGMENTS
E-4
INTEGRATED RESOURCE WRITING TEAM
Lorraine BaronSchool District No. 23 (Central Okanagan)
Bob BoykoSchool District No. 68 (Nanaimo-Ladysmith)
Delee CowanSchool District No. 23 (Central Okanagan)
Robin DeleurmeSchool District No. 91 (Nechako-Lakes)
Veronica DeLormeSchool District No. 52 (Prince Rupert)
Tim HuttemanSchool District No. 82 (Coast Mountains)
Weily LinSchool District No. 45 (West Vancouver)
Petra MenzSchool District No. 38 (Richmond)
John PeregrymSelkirk College
Rick WunderlichSchool District No. 83 (North-OkanaganShuswap)
APPENDIX FGlossary

APPENDIX F: GLOSSARY
F-2
l

F-3
APPENDIX F: GLOSSARY
ABOUT APPENDIX F
This appendix provides an illustrated glossary of terms used in this Integrated Resource Package.
The terms and definitions are intended to be used by readers unfamiliar with mathematicalterminology. For a more complete definition of each term, refer to a mathematical dictionarysuch as the Nelson Canadian School Mathematics Dictionary (ISBN 17-604800-6).
absolute value of a numberHow far the number is from 0. Example: the absolute values of -4.2and of 4.2 are each 4.2
absolute value functionThe function f defined by f(x)=|x|, where |x| denotes the absolutevalue of x.
accuracyA measure of how far an estimate is from the true value.
acute angleAn angle whose measure is between 0° and 90°.
algorithmA mechanical method for solving a certain type of problem, often amethod in which one kind of step is repeated a number of times.
alternate interior anglesIn the diagram to the left, the angles labelled a and c are alternateinterior angles, as are the angles b and d.
/_ a=/_ c/_ b=/_ d
a b
d c
y
x
f(x)=|x|
A

APPENDIX F: GLOSSARY
F-4
altitude of a triangleA line segment PH, where P is a vertex of the triangle, H lies on the linethrough the other two vertices, and PH is perpendicular to that line.
ambiguous caseTwo sides of a triangle and the angle opposite one of them arespecified, and we want to calculate the remaining angles or side.There may be no solution, exactly one, or exactly two.
amplitude (of a periodic curve)The maximum displacement from a reference level in either apositive or negative direction. That reference level is often chosenhalfway between the biggest and smallest values taken on by the curve.
analytic geometry (coordinate geometry)An approach to geometry in which position is indicated by usingcoordinates, lines, curves, and other objects are represented byequations, and algebraic techniques are used to solve geometricproblems.
angle bisectorA line that divides an angle into two equal parts.
antiderivativeIf f(x) is the derivative of F(x), then F(x) is an antiderivative of f(x).Indefinite integral means the same thing.
antidifferentiationThe process of finding antiderivatives.
arcA connected segment of a circle or curve.
arc sine (of x)The angle (in radians) between -π/2 and π/2 whose sine is x.Notation: sin-1 x or arcsin x.
Given a, b, and /_ AFind length c
Solution(s) c=AB c=AB'
a
a
A
A
B
B'
Cb
b
c
c
P
H
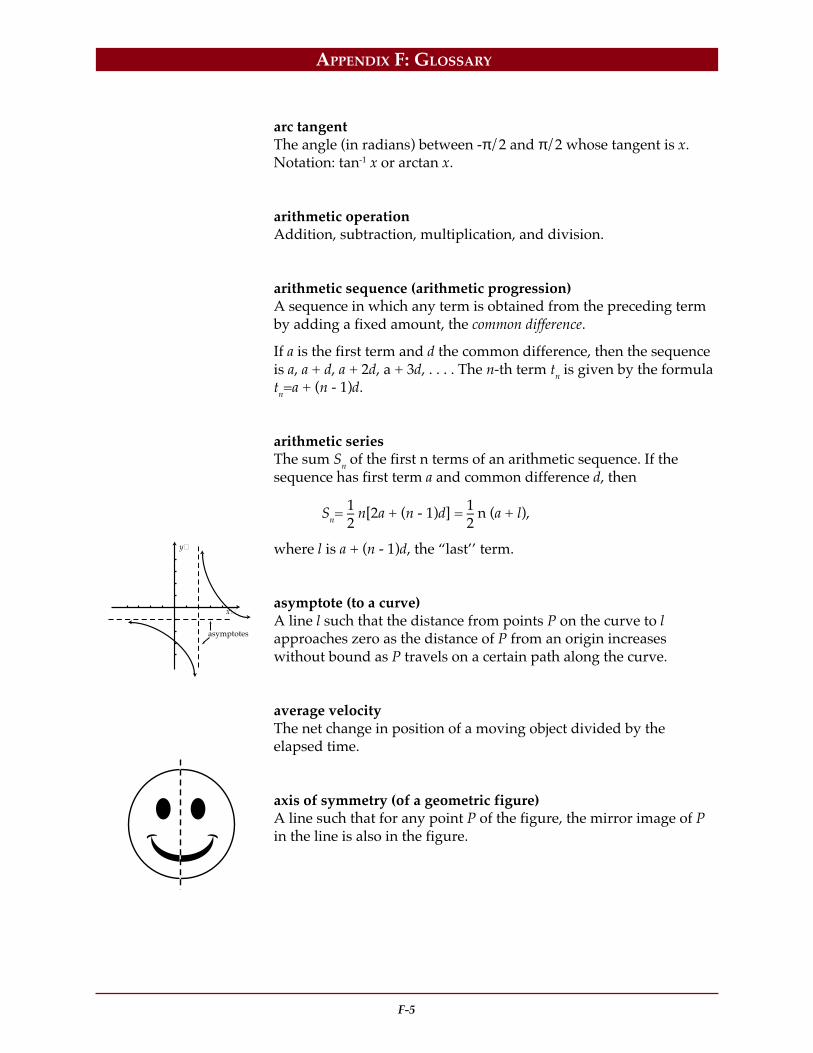
F-5
APPENDIX F: GLOSSARY
arc tangentThe angle (in radians) between -π/2 and π/2 whose tangent is x.Notation: tan-1 x or arctan x.
arithmetic operationAddition, subtraction, multiplication, and division.
arithmetic sequence (arithmetic progression)A sequence in which any term is obtained from the preceding termby adding a fixed amount, the common difference.
If a is the first term and d the common difference, then the sequenceis a, a + d, a + 2d, a + 3d, . . . . The n-th term tn is given by the formulatn=a + (n - 1)d.
arithmetic seriesThe sum Sn of the first n terms of an arithmetic sequence. If thesequence has first term a and common difference d, then
Sn= – n[2a + (n - 1)d] = – n (a + l),
where l is a + (n - 1)d, the “last’’ term.
asymptote (to a curve)A line l such that the distance from points P on the curve to lapproaches zero as the distance of P from an origin increaseswithout bound as P travels on a certain path along the curve.
average velocityThe net change in position of a moving object divided by theelapsed time.
axis of symmetry (of a geometric figure)A line such that for any point P of the figure, the mirror image of Pin the line is also in the figure.
y
x
asymptotes
12
12

APPENDIX F: GLOSSARY
F-6
Bbar graphA graph using parallel bars (vertical or horizontal) which areproportional in length to the data they represent.
baseIn the expression st, the number or expression s is called the base,and t is the exponent. In the expression loga u, the base is a.
binomialThe sum of two monomials.
binomial distributionThe probabilities associated with the number of “successes’’ whenan experiment is repeated independently a fixed number of times.For example, the number of times a “six’’ is obtained when a fair dieis tossed 100 times has a binomial distribution.
Binomial TheoremA rule for expanding expressions of the form (x+y)n.
bisectto divide into two equal parts.
broken-line graphA graph using line segments to join the plotted points torepresent data.
CCartesian (rectangular) coordinate systemA coordinate system in which the position of a point is specified byusing its signed distances from two perpendicular reference lines(axes).

F-7
APPENDIX F: GLOSSARY
central angleAn angle determined by two radii of a given circle; equivalently, anangle whose vertex is at the center of the circle.
chain ruleA rule for differentiating composite functions.
If h(x) = f(g(x)) then h’(x) = f’(g(x))g’(x).
chordThe line segment that joins two points on a curve, usually a circle.
circumferenceThe boundary of a closed curve, such as a circle; also, the measure(length) of that boundary. Please see perimeter.
circumscribedThe polygon P is circumscribed about the circle C if P is inside C andthe edges of P are tangent to C. The circle C is circumscribed about thepolygon Q if Q is inside C and the vertices of Q are on the boundaryof C. The notion can be extended to other figures, and to threedimensions.
clusterA collection of closely grouped data points.
coefficientA numerical or constant multiplier in an algebraic expression. Thecoefficient of x2 in 4x2 - 2axy is 4, and the coefficient of xy is -2a.
collinearLying on the same line.
combinationA set of objects chosen from another set, with no attention paid tothe order in which the objects are listed (see also permutation). Thenumber of possible combinations of r objects selected from a set of ndistinct objects is nCr, pronounced “n choose r.’’
Cluster
APPENDIX F: GLOSSARY
F-8
common factor (CF)A number that is a factor of two or more numbers. For example, 3 is acommon factor of 6 and 12. Common divisor means the same thing.The term is also used with polynomials. For example, x - 1 is a com-mon factor of x2 - x and x2 - 2x + 1.
common fractionA number written as – , where the numerator a and the denominatorb are integers, and b is not zero. Examples:
–; ——; —.
compassAn instrument for drawing circles or arcs of circles.
complementary anglesTwo angles that add up to a right angle.
completing the squareRewriting the quadratic polynomial ax2 + bx + c in the forma(x - p)2 + q, perhaps to solve the equation ax2 + bx + c = 0.
complex fractionA fraction in which the numerator or the denominator, or both,contain fractions.
composite functionA function h(x) obtained from two functions f and g by using the ruleh(x) = f(g(x)) (first do g to x, then do f to the result).
composite numberAn integer greater than 1 that is not prime, such as 9 or 14.
compound interestThe interest that accumulates over a given period when eachsuccessive interest payment is added to the principal in order tocalculate the next interest payment.
45
-136
31
ab

F-9
APPENDIX F: GLOSSARY
concave down (or downward)The function f(x) is concave down on an interval if the graph ofy = f(x) lies below its tangent lines on that interval.
concave up (or upward)The function f(x) is concave up on an interval if the graph of y = f(x)lies above its tangent lines on that interval.
conditional probabilityThe probability of an event given that another event has occurred.The (conditional) probability that someone earns more than $200,000a year, given that the person plays in the NHL, is different from theprobability that a randomly chosen person earns more than$200,000.
cone (right circular)The three-dimensional object generated by rotating a right triangleabout one of its legs.
confidence interval(s)An interval that is believed, with a preassigned degree of confidence, toinclude the particular value of some parameter being estimated.
congruentHaving identical shape and size.
conic sectionA curve formed by intersecting a plane and the surface of a doublecone. Apart from degenerate cases, the conic sections are the el-lipses, the parabola, and the hyperbolas.
conjectureA mathematical assertion that is believed, at least by some, to betrue, but has not been proved.
constantA fixed quantity or numerical value.
f (x)
xConcave
Down
ConcaveUp

APPENDIX F: GLOSSARY
F-10
continuous dataData that can, in principle, take on any real value in some interval.For example, the “exact’’ height of a randomly chosen individual,or the exact length of life of a U-235 atom can be modelled by acontinuous distribution.
continuous functionInformally, a function f(x) is continuous at a if f(x) does not make asharp jump at a. More formally, f(x) is continuous at a if f(x)approaches f(a) as x approaches a.
contrapositiveThe contrapositive of “Whenever A is true, B must be true.’’ is“Whenever B is false, then A must be false.’’ Any assertion islogically equivalent to its contrapositive, so one strategy for provingan assertion is to prove its contrapositive.
converse (of a theorem)The assertion obtained by interchanging the premise and theconclusion. If the theorem is “Whenever A happens, B musthappen,’’ then its converse is “Whenever B happens, A musthappen.’’ The converse of a theorem need not be true.
coordinate geometryPlease see analytic geometry.
coordinatesNumbers that uniquely identify the position of a point relative to acoordinate system.
correlation coefficientA number (between -1 and 1) that measures the degree to which acollection of data points lies on a line.
corresponding angles and corresponding sidesAngles or sides that have the same relative position in geometricfigures.
A
B C
D
E F

F-11
APPENDIX F: GLOSSARY
cosecant (of x)This is ——. Notation: csc x.
cosine law (law of cosines)A formula used for solving triangles in plane geometry.
cosine (function)See primary trigonomic functions.
cotangent (of x)This is ——. Notation: cot x.
coterminal anglesAngles that are rotations between the same two lines, termed theinitial and terminal arms. For example:
20°, 340°, 380° are coterminal angles
critical number (of a function)A number where the function is defined, and where the derivative ofthe function is equal to 0 or doesn’t exist.
cyclic (inscribed) quadrilateralA quadrilateral whose vertices all lie on a circle.
Ddecimal fractionIn principle, a fraction a/b where a is an integer and b is a power of10. For example, 1/4=25/100, so 1/4 can be expressed as a decimalfraction, usually written as 0.25.
decreasing functionThe function f(x) is decreasing on an interval if for any numbers sand t in that interval, if t is greater than s then f(t) is less than f(s).
c2 a2 b2 2ab cos C
1sin x
1tan x

APPENDIX F: GLOSSARY
F-12
deductive reasoningA process by which a conclusion is reached from certainassumptions by the use of logic alone.
degreeThe highest power or sum of powers that occurs in any term of agiven polynomial or polynomial equation. For example, 6x + 17 hasdegree 1, and 2 + x3 + 7x has degree 3, as does 2 + 6x + 7y + xy2.
diagonalA line segment that joins two non-adjacent vertices in a polygon orpolyhedron.
diameterA line segment that joins two points on a circle or sphere and passesthrough the center. All diameters of a circle or sphere have the samelength. That common length is called the diameter.
difference of squaresAn expression of the form A2 - B2, where A and B are numbers,polynomials, or perhaps other mathematical expressions. We canfactor A2 - B2 as (A + B)(A - B).
differentiableA function is differentiable at x = a if under extremely highmagnification, the graph of the function looks almost like a straightline near a. Most familiar functions are differentiable everywherethat they are defined.
differential equationAn equation that involves only two variable quantities, say x and y,and the first derivative, or higher derivatives, of y with respect to x.
Example: 3y2 –— = ex.
differentiate; differentiationTo find the derivative; the process of finding derivatives.
dydx
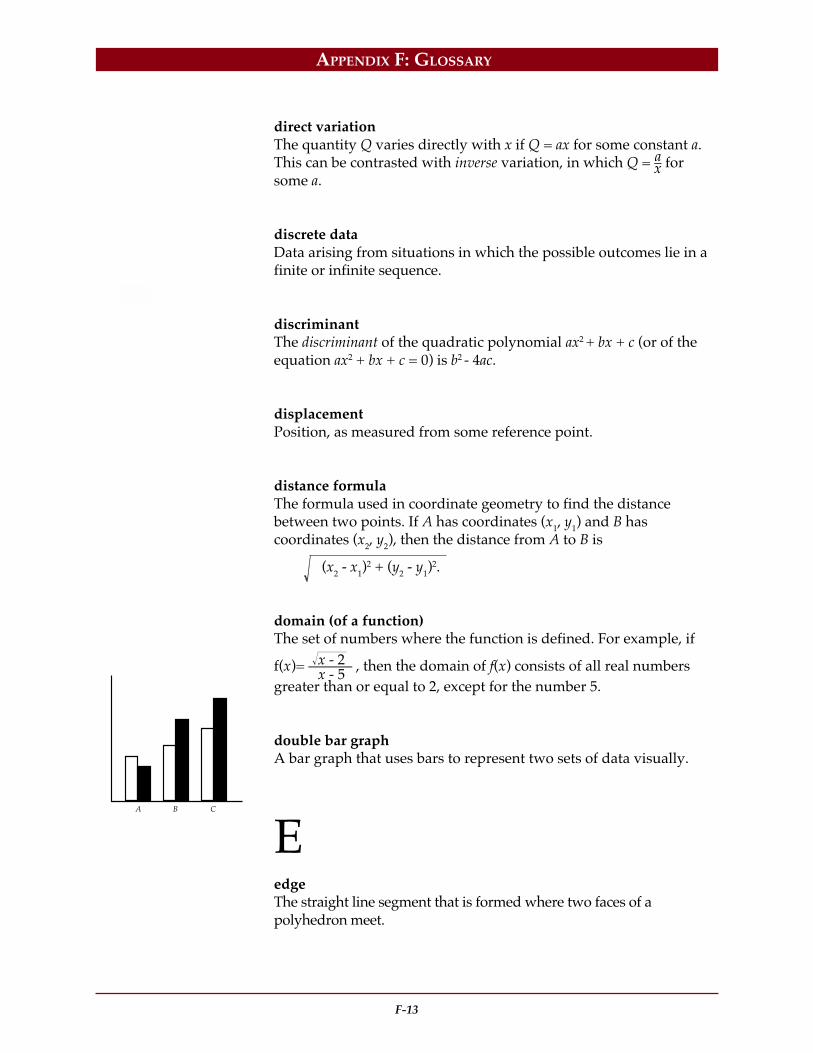
F-13
APPENDIX F: GLOSSARY
direct variationThe quantity Q varies directly with x if Q = ax for some constant a.This can be contrasted with inverse variation, in which Q = – forsome a.
discrete dataData arising from situations in which the possible outcomes lie in afinite or infinite sequence.
discriminantThe discriminant of the quadratic polynomial ax2 + bx + c (or of theequation ax2 + bx + c = 0) is b2 - 4ac.
displacementPosition, as measured from some reference point.
distance formulaThe formula used in coordinate geometry to find the distancebetween two points. If A has coordinates (x1, y1) and B hascoordinates (x2, y2), then the distance from A to B is
(x2 - x1)2 + (y2 - y1)
2.
domain (of a function)The set of numbers where the function is defined. For example, if
f(x)= ——— , then the domain of f(x) consists of all real numbersgreater than or equal to 2, except for the number 5.
double bar graphA bar graph that uses bars to represent two sets of data visually.
EedgeThe straight line segment that is formed where two faces of apolyhedron meet.
ax
x - 2x - 5
A B C

APPENDIX F: GLOSSARY
F-14
ellipseA closed curve obtained by intersecting the surface of a cone with aplane. Please see conic section.
equationA statement that two mathematical expressions are equal, such as:
3x y 7
equidistantHaving equal distances from some specified object, point, or line.
estimatev. To approximate a quantity, perhaps only roughly.n. The result of estimating. Also, an approximation, based onsampling, to some number associated with a population, such as theaverage age.
Euclidean geometryGeometry based on the definitions and axioms set out in Euclid’sElements.
eventA subset of the sample space of all possible outcomes of an experiment.
experimental probabilityAn estimate of the probability of an event obtained by repeating anexperiment many times. If the event occurred in k of the nexperiments, it has experimental probability k/n.
exponentThe number that indicates the power to which the base is raised.For example:
34: exponent is 4
exponential decayA quantity undergoes exponential decay if its rate of decrease at anytime is proportional to its size at the time. Exponential decay modelswell the decay of radioactive substances.

F-15
APPENDIX F: GLOSSARY
exponential functionAn exponential function is a function of the form f(x) = ax, wherea > 0 and the variable x occurs as the exponent. The exponentialfunction is the function f(x)=ex, where e is a mathematical constantroughly equal to 2.7182818284.
exponential growthA quantity undergoes exponential growth if its rate of increase at anytime is proportional to its size at the time. Exponential growth modelswell the growth of a population of bacteria under ideal conditions.
exterior angles on the same side of the transversalA transversal of two parallel lines forms two supplementary exteriorangles.
extraneous rootA spurious root obtained by manipulating an equation. For example,if we square both sides of 1 - x = x - 1 and simplify, we obtain(x - 1)(x - 2)=0, that is, x = 1 or x = 2. Since 2 is not a root of the originalequation, it is sometimes called an extraneous root.
extrapolateEstimate the value of a function at a point from values at places onone side of the point only.
extreme valuesThe highest and lowest numbers in a set.
FfaceOne of the plane surfaces of a polyhedron.
y
x
f(x)=ax
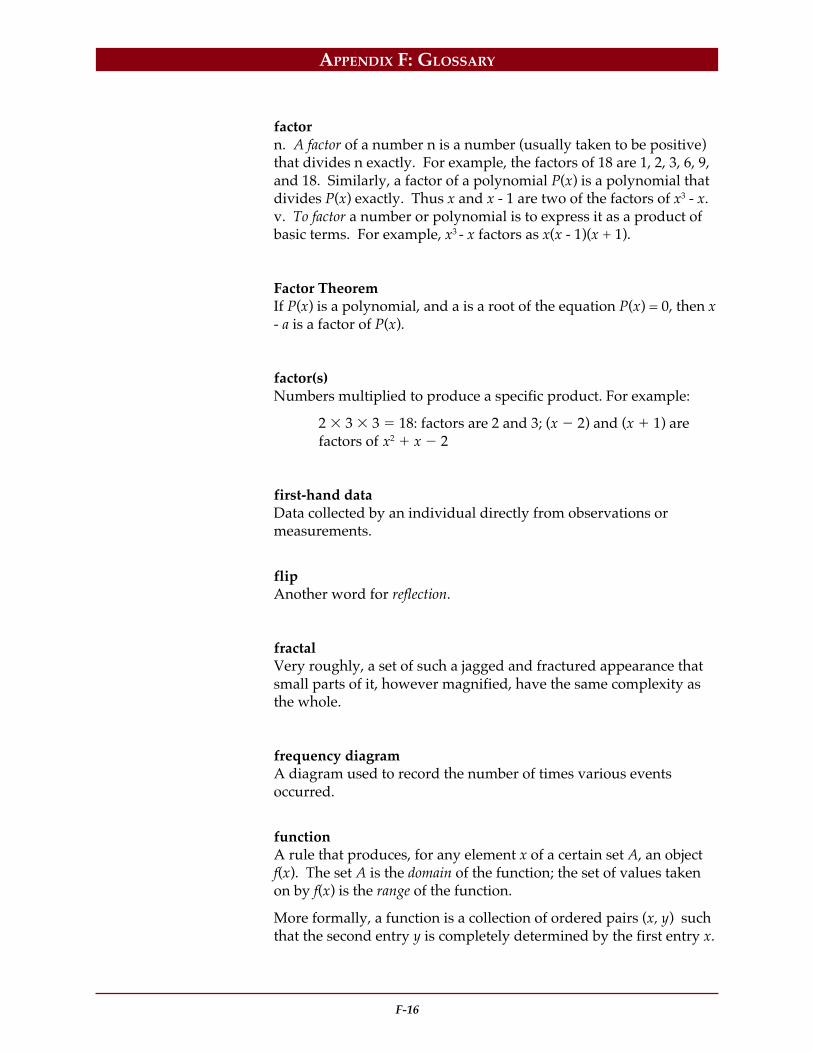
APPENDIX F: GLOSSARY
F-16
factorn. A factor of a number n is a number (usually taken to be positive)that divides n exactly. For example, the factors of 18 are 1, 2, 3, 6, 9,and 18. Similarly, a factor of a polynomial P(x) is a polynomial thatdivides P(x) exactly. Thus x and x - 1 are two of the factors of x3 - x.v. To factor a number or polynomial is to express it as a product ofbasic terms. For example, x3 - x factors as x(x - 1)(x + 1).
Factor TheoremIf P(x) is a polynomial, and a is a root of the equation P(x) = 0, then x- a is a factor of P(x).
factor(s)Numbers multiplied to produce a specific product. For example:
2 3 3 18: factors are 2 and 3; (x 2) and (x 1) arefactors of x2 x 2
first-hand dataData collected by an individual directly from observations ormeasurements.
flipAnother word for reflection.
fractalVery roughly, a set of such a jagged and fractured appearance thatsmall parts of it, however magnified, have the same complexity asthe whole.
frequency diagramA diagram used to record the number of times various eventsoccurred.
functionA rule that produces, for any element x of a certain set A, an objectf(x). The set A is the domain of the function; the set of values takenon by f(x) is the range of the function.
More formally, a function is a collection of ordered pairs (x, y) suchthat the second entry y is completely determined by the first entry x.

F-17
APPENDIX F: GLOSSARY
function notationIf a quantity y is completely determined by a quantity x, then y iscalled a function of x. For example, the area of a circle of generalradius x might be denoted by A(x) ( pronounced “A of x.) In thiscase, A(x) = π x2.
fundamental counting principleIf an event can happen in x different ways, and for each of theseways a second event can happen in y different ways, then the twoevents can happen in x y different ways.
Ggeneral polynomial equationAn equation of the form
a0xn a1x
n-1 a2xn-2 . . . an-1x an 0.
general term (of a sequence)If n is unspecified, an is called the general term of the sequence a1, a2,a3, . . . Sometimes there is an explicit formula for an in terms of n.
geometric sequence (progression)A sequence in which each term except the first is a fixed multiple ofthe preceding term. If the first term is a, and each term is r times theprevious one, (r is the common ratio) then the general term tn is givenby tn = arn-1.
geometric seriesThe sum Sn of the first n terms of a geometric sequence. If a is thefirst term, r the common ratio, where r ≠ 1, then
See also infinite geometric series.
greatest common factor (GCF)The largest positive integer that divides two or more given numbers.For example, the GCF of 12 and 18 is 6. The GCF is also called thegreatest common divisor (GCD).
Sn a(1 rn)1 r
.

APPENDIX F: GLOSSARY
F-18
HHeron’s formulaA formula for the area of a triangle in terms of its sides. The area of atriangle with sides of length a, b, and c is equal to
s(s - a)(s - b)(s - c), where s = ————.
higher derivativesThe derivative of the derivative of f(x), the derivative of the deriva-tive of the derivative of f(x), and so on.
histogramA bar graph showing the frequency in each class using class intervalsof the same length.
hyperbolaA curve with two branches where a plane and a circular conicalsurface meet. Please see conic section.
hypotenuseThe side opposite the right angle in a right triangle.
hypothesisA statement or condition from which consequences are derived.
a + b + c2
y
x
y
x
__ __x2 y2
a2 b2
-
= -1
a2 b2x2 y2__ __- = 1
-

F-19
APPENDIX F: GLOSSARY
IidentityA statement that two mathematical expressions are equal for allvalues of their variables.
if-then propositionA mathematical statement that asserts that if certain conditions hold,then certain other conditions hold.
Imperial measureThe system of units (foot, pound, and so on) for measuring length,mass, and so on that was once the legal standard in Great Britain.
implicit functionA function y of x defined by a formula of shape H(x, y) = 0. Forexample, y3 - x 2 + 1 = 0 defines y implicitly as a function of x. In thiscase, y is given explicitly by y = (x2 - 1)1/3. But often (example:H(x, y) = y7 + (x2 + 1)y - 1), it is not possible to give an explicitformula for y.
improper fractionA proper fraction is a fraction whose numerator is less in absolutevalue than its denominator. An improper fraction is a fraction thatis not a proper fraction.
increasing functionThe function f(x) is increasing on an interval if for any numbers sand t in that interval, if t is greater than s then f(t) is greater than f(s).
indefinite integralAnother word for antiderivative.
independent eventsTwo events are independent if whether or not one of them occurs hasno effect on the probability that the other occurs.

APPENDIX F: GLOSSARY
F-20
inductive reasoningA form of reasoning in which the truth of an assertion in someparticular cases is used to leap to the (tentative) conclusion that theassertion is true in general.
inequalityA mathematical statement that one quantity is greater than or lessthan the other. The statement s > t means that s is greater than t,while s < t means that s is less than t.
infinite geometric seriesThe “sum’’ a + ar + ar2 + . . . + arn-1 + . . . of all of the terms of ageometric sequence. If |r|< 1, then this sum is equal to —– .
inflection pointA point on a curve that separates a part of the curve that is concaveup from one that is concave down.
initial value problemA function is described by specifying a differential equation that itsatisfies, together with the value of the function at some “initial’’point; the problem is to find the function.
inscribed angleThe angle PQR, where P, Q, and R are three points on a curve, inmost cases a circle.
instantaneous velocity (at a particular time)The exact rate at which the position is changing at that time.
integerOne of 0, 1, -1, 2, -2, 3, -3, 4, -4, and so on.
interior angles on the same side of the transversalThe transversal of two parallel lines forms interior supplementaryangles.
a1 - r
f(x)
x
inflection point
P
Q
R

F-21
APPENDIX F: GLOSSARY
integrationIn part, the process of finding antiderivatives.
interpolateEstimate the value of a function at a point from values of thefunction at places on both sides of the point.
intersectionThe point or points where two curves meet.
intervalThe set of all real numbers between two given numbers, which may ormay not be included. The set of all real numbers from a given point on,or up to a given point, is also an interval, as is the set of all real numbers.
inverse (of a function)The function g(x) is the inverse of the function f(x) if f(g(x)) = x andg(f(x)) = x for all x, or more informally if each function “undoes’’what the other did.
inverse operationsOperations that counteract each other. For example, addition andsubtraction are inverse operations.
inverse trigonometric functionsInverses of the six basic trigonometric functions. For the two mostcommonly used, please see arc sine and arc tan.
irrational numberA number that cannot be expressed as a quotient of two integers.For example, 2 , π, and e are irrational numbers.
irregularLacking in symmetry or pattern.
isosceles triangleA triangle that has two or more equal sides. Occasionally defined asa triangle that has exactly two equal sides.
Estimate
Known

APPENDIX F: GLOSSARY
F-22
Lleast squaresA criterion used to find the line of best fit, namely that the sum ofthe squares of the differences between “predicted values’’ and actualvalues should be as small as possible.
limitThe limit of f (x) as x approaches a (notation: lim f (x)) is thenumber that f (x) tends to as x moves closer and closer to a. Theremay not be such a number. For example, if x is measured in radians,lim ——— = 1, but lim sin (—) does not exist.
line of best fitFor a collection of points in the plane obtained from an experiment,a line that comes in some sense closest to the points. Please see leastsquares.
linear functionA function f given by a formula of the type f(x) = ax + b, where a andb are specific numbers.
linear programmingFinding the largest or smallest value taken on by a given functiona1 x1+ a2 x2+. . . + anxn (the objective function) given that x1, x2, . . ., xn
satisfy certain linear constraints. The constraints are inequalities ofthe form b1 x1 +b2 x2 + . . . +bn ≥ c. Many applied problems, such asdesigning the cheapest animal feed that meets given nutritionalgoals, can be formulated as linear programming problems.
local maximumThe function f(x) is said to reach a local maximum at x = a if there isa neighborhood of a such that f(x) ≤ f(a) for any x in theneighborhood; informally, (a, f(a)) is at the top of a hill.
local minimumThe function f(x) is said to reach a local minimum at x = a if there is aneighborhood of a such that f(x) ≥ f(a) for any x in the neighborhood;informally, (a, f(a)) is at the bottom of a valley.
x → a
x → 0
sin xx
1xx → 0
f(x)
x
Local Max.
Local Min.

F-23
APPENDIX F: GLOSSARY
logarithmic differentiationThe process of differentiating a product/quotient of functions byfinding the logarithm and then differentiating. For example, lety = (1 + x)2/(1 + 3x). Then
ln y = 2ln(1 + x) - ln(1 + 3x) and — —– = —— - ——–.
logarithmic functionLet a be positive and not equal to 1. The logarithm of x to the base ais the number u such that au = x, and is denoted by loga x. Anyfunction of the form f(x) = loga x is called a logarithmic function.
lowest common multiple (LCM)The smallest positive integer that is a multiple of two or more givenpositive integers. For example, the LCM of 3, 4, and 6 is 12. TheLCM is often called the least common multiple.
MmatrixA rectangular array of numbers. For example:
maximum point (or value)The greatest value of a function.
mean (of a sequence of numerical data)A measure of the average value, obtained by adding up the terms ofthe sequence and dividing by the number of items.
median (of a sequence of numerical data)The “middle value’’ when the data are arranged in order of size. Ifthere is an even number of data, then the average of the two middlevalues. For example, the median of 5, 3, 7.4, 5, 8, is 5, while themedian of 5, 7.4, 5, 8 is 6.2.
1y
dydx
21 + x
31 + 3x
y
x
f(x)=logax
3 42 5
2 2 matrix 3 1 matrix
172

APPENDIX F: GLOSSARY
F-24
median (of a triangle)The line segment that joins a vertex of the triangle to the midpoint ofthe opposite side.
minimum point (or value)The lowest value of a function.
mixed numberA number that is expressed as the sum of a whole number and afraction. For example:
2 5
modeThe value that occurs most often in a sequence of data.
monomialAn algebraic expression that is a product of variables and constants.Examples: 6x2, 1, (—) x2y,
multiple (of an integer)The result obtained when the given integer is multiplied by someinteger. Equivalently, an integer that has the given integer as afactor. (Often negative integers are not allowed.)
Nnatural logarithmLogarithm to the base e, where e is a fundamental mathematicalconstant roughly equal to 2.7182818284. The natural logarithm of xis usually written ln x.
natural number (counting number)One if the numbers 1, 2, 3, 4, . . . Positive integer means the samething.
34
3
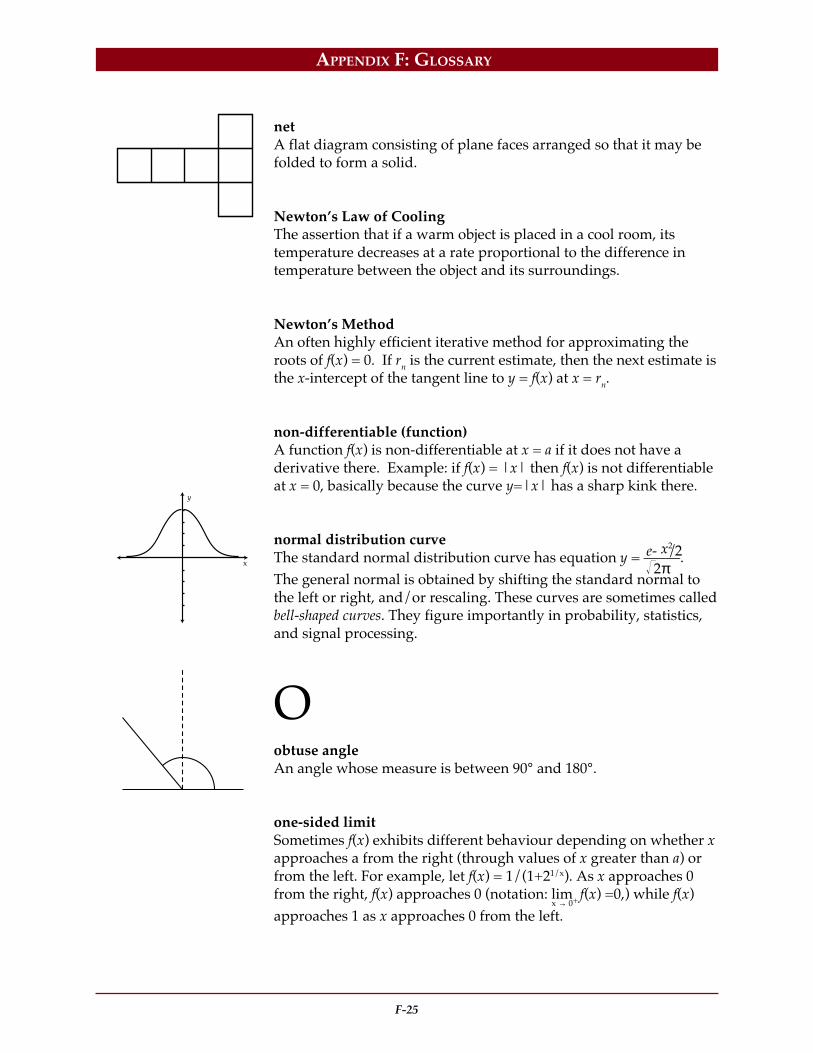
F-25
APPENDIX F: GLOSSARY
netA flat diagram consisting of plane faces arranged so that it may befolded to form a solid.
Newton’s Law of CoolingThe assertion that if a warm object is placed in a cool room, itstemperature decreases at a rate proportional to the difference intemperature between the object and its surroundings.
Newton’s MethodAn often highly efficient iterative method for approximating theroots of f(x) = 0. If rn is the current estimate, then the next estimate isthe x-intercept of the tangent line to y = f(x) at x = rn.
non-differentiable (function)A function f(x) is non-differentiable at x = a if it does not have aderivative there. Example: if f(x) = |x| then f(x) is not differentiableat x = 0, basically because the curve y=|x| has a sharp kink there.
normal distribution curveThe standard normal distribution curve has equation y = —–—.The general normal is obtained by shifting the standard normal tothe left or right, and/or rescaling. These curves are sometimes calledbell-shaped curves. They figure importantly in probability, statistics,and signal processing.
Oobtuse angleAn angle whose measure is between 90° and 180°.
one-sided limitSometimes f(x) exhibits different behaviour depending on whether xapproaches a from the right (through values of x greater than a) orfrom the left. For example, let f(x) = 1/(1+21/x). As x approaches 0from the right, f(x) approaches 0 (notation: lim f(x) =0,) while f(x)approaches 1 as x approaches 0 from the left.
e- /2 2π
x → 0+
y
x
x2

APPENDIX F: GLOSSARY
F-26
optimization problemA problem, often of an applied nature, in which we need to find thelargest or smallest possible value of a quantity; also called a max/minproblem.
ordered pairA sequence of length 2. Ordered pairs (x, y) of real numbers are usedto indicate the x and y coordinates of a point in the plane.
ordinal numberA number designating the place occupied by an item in an orderedsequence (e.g., first, second, and third).
originThe point in a coordinate system at the intersection of the axes.
PparabolaThe intersection of a conical surface and a plane parallel to a line onthe surface.
parallel linesTwo lines in the plane are parallel if they do not meet. Inthree-dimensional space, two lines are parallel if they do not meetand there is a plane that contains them both. Alternately, in the planeor in space, two lines are parallel if they stay a constant distanceapart.
parallelogramA quadrilateral such that pairs of opposite sides are parallel.
percentageIn a problem such as “Find 15% of 400.’’ the number 400 is some-times called the base, 15% or 0.15 is called the rate, and the answer 60is sometimes called the percentage.
y
x
parabola

F-27
APPENDIX F: GLOSSARY
percent errorThe relative error expressed in parts per hundred. Let A be anestimate of a quantity whose true value is T. Then A - T is the error,and (A - T)/T is the relative error.
percentileThe k-th percentile of a sequence of numerical data is the number xsuch that k percent of the data points are less than or equal to x. (Oftenx is not precisely determined, particularly if the data set is not large.)
perimeterThe length of the boundary of a closed figure.
periodThe interval taken to make one complete oscillation or cycle.
permutationAn ordered arrangement of objects. The number of ways of produc-ing a permutation of r (distinct) objects from a collection of n objectsis nPr, where nPr = n(n - 1)(n - 2) . . . (n - r+1).
perpendicular bisectorA line that intersects a line segment at a right angle and divides theline segment into two equal parts.
perpendicular lineTwo lines that intersect at a right angle.
phase shiftA horizontal translation of a periodic function. For example, thefunction cos 2(x-π/3) is cos 2x with a phase shift of π/3.
pictographA graph that uses pictures or symbols to represent similar data.

APPENDIX F: GLOSSARY
F-28
plane of symmetryA 2-D flat surface that cuts through a 3-D object, forming two partswhich are mirror images.
polygonA closed curve formed by line segments that do not intersect otherthan at the vertices.
polygonal regionA part of a plane that has a polygon as boundary.
polyhedronA solid bounded by plane polygonal regions.
polynomialA mathematical expression that is a sum of monomials. Examples:
4x3 - 3x - —; π x2 + 2πxy; xyz.
populationThe items, actual or theoretical, from which a sample is drawn.
powerA power of q is any term of the form qk. Often but not always, k istaken to be a positive integer.
precisionA measure of the estimated degree of repeatability of a measurement,often described by a phrase such as “correct to two decimal places.’’
12

F-29
APPENDIX F: GLOSSARY
primary trigonometric functionssine A a/c opp/hypcosine A b/c adj/hyptangent A a/b opp/adjFunctions of angles defined, for an acute angle, as ratios of sidesin a right triangle.
primeA positive integer that is divisible by exactly two positive integers,namely 1 and itself. The first few primes are 2, 3, 5, 7, 11, 13.
prime factorization (of a positive integer)The given integer expressed as a product of primes. For example, 2 5 3 2 is a prime factorization of 60. Usually the primes arelisted in increasing order. The standard prime factorization of 60 is22 3 5.
prismA solid with two parallel and congruent bases in the shape ofpolygons; the other faces are parallelograms.
probability (of an event)A number between 0 and 1 that measures the likelihood that theevent will occur. The probability of the event A is often denoted byPr(A).
productThe product of two or more objects (numbers, functions, etc.) is theresult of multiplying these objects together.
product ruleThe rule for finding the derivative of a product of two functions.
If p(x) = f(x)g(x) then p’(x) = f(x)g’(x) + g(x)f’(x).
pyramidA polyhedron one of whose faces is an arbitrary polygon (called thebase) and whose remaining faces are triangles with a common vertexcalled the apex).
Sine A = __
a
A
B
Cb
c
ac

APPENDIX F: GLOSSARY
F-30
Pythagorean theoremIn a right-angled triangle, the sum of the squares of the lengths ofthe sides containing the right angle is equal to the square of thehypotenuse (a2 b2 c2).
QquadrantOne of the four regions that the plane is divided into by two perpen-dicular lines. When these lines are the usual coordinate axes, thequadrants are called the first quadrant, the second quadrant, and soon as in the diagram.
quadratic formulaA formula used to determine the roots of a quadratic equation.
quadratic functionA function of the form f(x) = ax2+ bx + c, where a ≠ 0. The graph ofsuch a function is a parabola.
quadrilateralA polygon with four sides.
quartileThe 25th percentile is the first quartile, the 50th percentile is thesecond quartile (or median), and the 75th percentile is the thirdquartile. Please see percentile.
quotientThe result of dividing one object (number, function) by another.
quotient ruleThe rule for differentiating the quotient of two functions.
If q(x) = —— then q’(x) = —————————.
a
A
B
Cb
c
I
IV
II
III
x b b2 4ac2a
f(x)g(x)
g(x) f’(x) - f(x) g’(x)(g(x))2
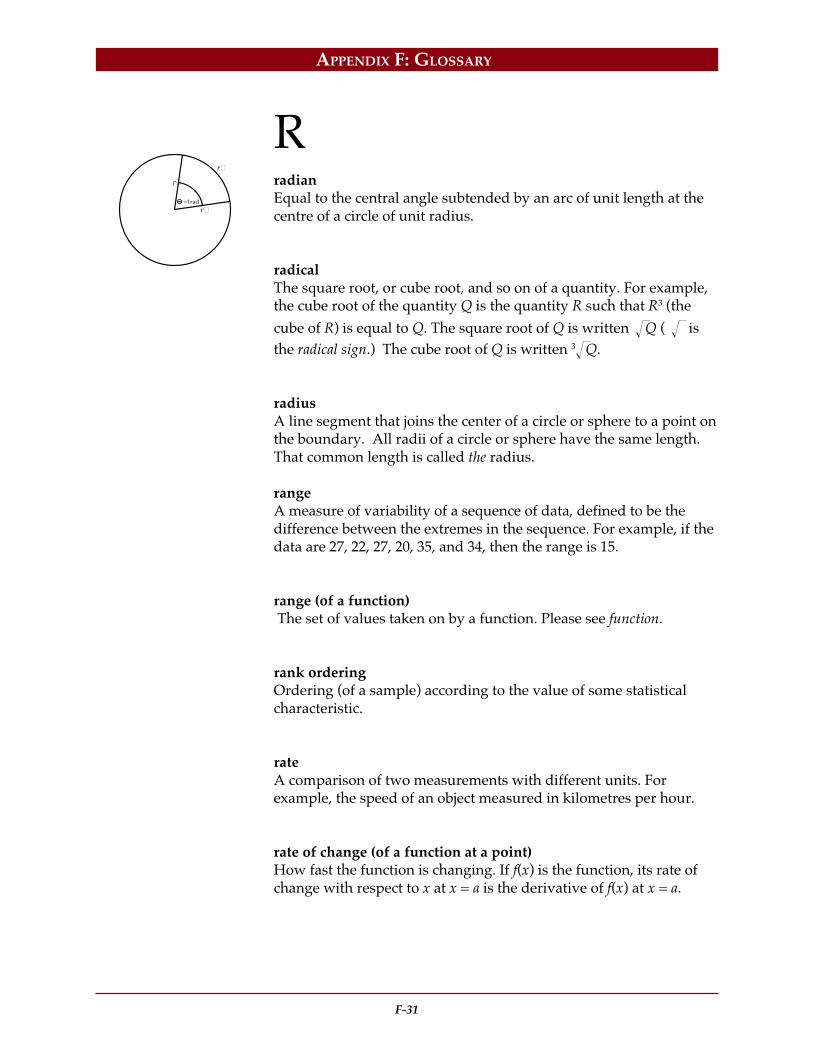
F-31
APPENDIX F: GLOSSARY
RradianEqual to the central angle subtended by an arc of unit length at thecentre of a circle of unit radius.
radicalThe square root, or cube root, and so on of a quantity. For example,the cube root of the quantity Q is the quantity R such that R3 (the
cube of R) is equal to Q. The square root of Q is written Q ( isthe radical sign.) The cube root of Q is written 3 Q.
radiusA line segment that joins the center of a circle or sphere to a point onthe boundary. All radii of a circle or sphere have the same length.That common length is called the radius.
rangeA measure of variability of a sequence of data, defined to be thedifference between the extremes in the sequence. For example, if thedata are 27, 22, 27, 20, 35, and 34, then the range is 15.
range (of a function) The set of values taken on by a function. Please see function.
rank orderingOrdering (of a sample) according to the value of some statisticalcharacteristic.
rateA comparison of two measurements with different units. Forexample, the speed of an object measured in kilometres per hour.
rate of change (of a function at a point)How fast the function is changing. If f(x) is the function, its rate ofchange with respect to x at x = a is the derivative of f(x) at x = a.
r
=1radr
r

APPENDIX F: GLOSSARY
F-32
ratioAnother word for quotient. Also, an indication of the relative size oftwo quantities. We say that P and Q are in the ratio a:b if the “size’’of A divided by the size of B is a/b.
rational expressionThe quotient of two polynomials.
rational numberA number that can be expressed as a/b, where a and b are integers.
rationalize the denominatorTransform a quotient P/Q where the denominator Q involvesradicals into an equivalent expression with the denominator free ofradicals. For example
——— = ——————— = ————.
real numberAn indicator of location on a line with respect to an origin; a quan-tity represented by an arbitrary decimal expansion.
reciprocalThe number or expression produced by dividing 1 by a givennumber or expression.
rectangular prismA prism whose bases are congruent rectangles.
recursive definition (of a sequence)A way of defining a sequence by possibly specifying some termsdirectly, and giving an algorithm by which any term can beobtained from its predecessors. For example, the Fibonaccisequence is defined recursively by the rules F0 = F1 = 1 andFn= Fn-1 + Fn-2 for n ≥ 2.
4
4 - 7
(4)(4 + 7)
(4 - 7)(4 + 7)
4(4 + 7)9
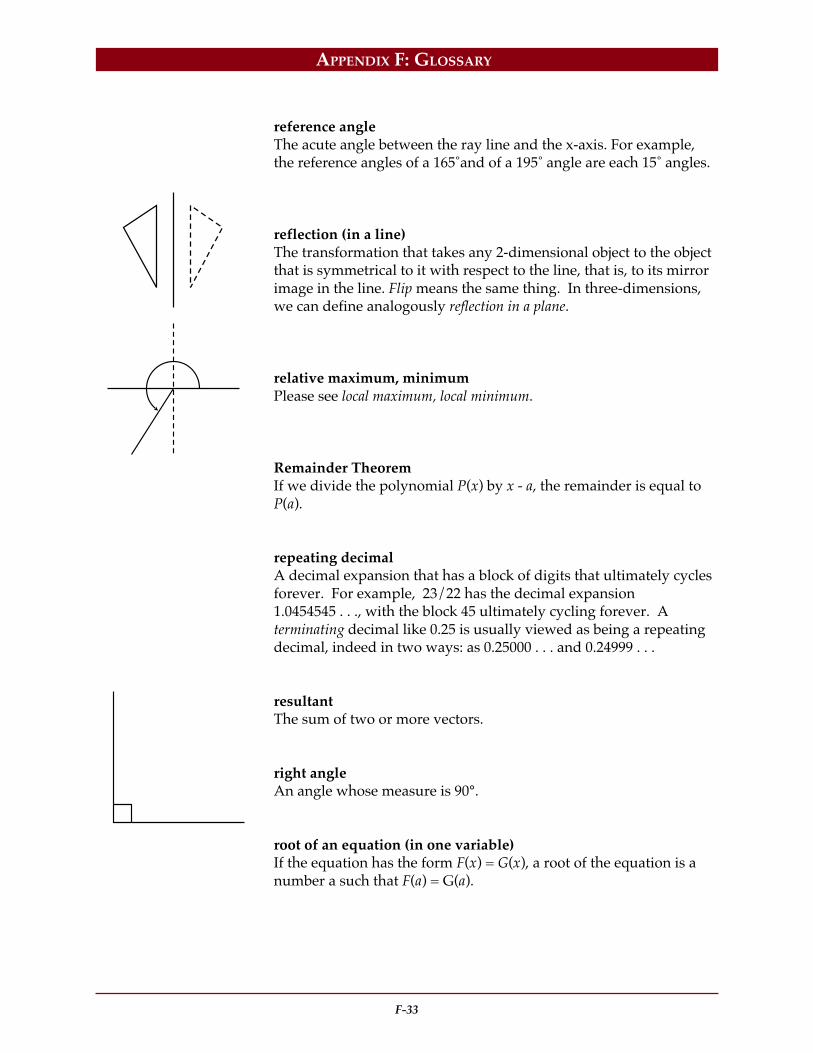
F-33
APPENDIX F: GLOSSARY
reference angleThe acute angle between the ray line and the x-axis. For example,the reference angles of a 165˚and of a 195˚ angle are each 15˚ angles.
reflection (in a line)The transformation that takes any 2-dimensional object to the objectthat is symmetrical to it with respect to the line, that is, to its mirrorimage in the line. Flip means the same thing. In three-dimensions,we can define analogously reflection in a plane.
relative maximum, minimumPlease see local maximum, local minimum.
Remainder TheoremIf we divide the polynomial P(x) by x - a, the remainder is equal toP(a).
repeating decimalA decimal expansion that has a block of digits that ultimately cyclesforever. For example, 23/22 has the decimal expansion1.0454545 . . ., with the block 45 ultimately cycling forever. Aterminating decimal like 0.25 is usually viewed as being a repeatingdecimal, indeed in two ways: as 0.25000 . . . and 0.24999 . . .
resultantThe sum of two or more vectors.
right angleAn angle whose measure is 90°.
root of an equation (in one variable)If the equation has the form F(x) = G(x), a root of the equation is anumber a such that F(a) = G(a).
APPENDIX F: GLOSSARY
F-34
rotation (in the plane)A transformation in which an object is turned through some angleabout a point. An analogous notion can be defined in three dimen-sions; there the turn is about a line.
roundingA process to follow when making an approximation to a givennumber by using fewer significant figures.
SsampleA selection from a population.
sample spaceThe set of all possible outcomes of an experiment.
scalarA number. Usually used in contexts where there are also vectorsaround, or functions. Examples of usage: “the length of a vector is ascalar;’’ “-3 sin x is a scalar multiple of sin x.’’
scatter plotIf each item in a sample yields two measurements, such as theheight x and weight y of the individual chosen, the point withcoordinates (x,y) is plotted. If this is repeated for all members of thesample, the resulting collection of points is a scatter plot.
secant (of x)
This is ——–. Notation: sec x.
secant lineA line that passes through two points on a curve.
1cos x
F-35
APPENDIX F: GLOSSARY
second derivativeThe second derivative of f(x) is the derivative of the derivative of f(x).Two common notations: f’’(x) and –––– .
second derivative testSuppose that f’(a) = 0. The second derivative test gives a way ofchecking whether at x = a the function f(x) reaches a local minimumor a local maximum.
second-hand dataData not collected directly by the researcher. For example, encyclopedia.
self-similarHaving the same general appearance under all magnifications.
semicircleA half-circle; any diameter cuts a circle into two semicircles.
sequenceA finite ordered list t1, t2, t3, . . . , tn of terms (finite sequence) or a listt1, t2, . . . , tn, . . . that goes on forever (an infinite sequence.)
seriesAny sum t1 + t2 + . . . + tn of the first n terms of a sequence. The“sum’’ t1 + t2 + . . . + tn + . . . of all the terms of an infinite sequence isan infinite series. The concept of limit is required to define the sum ofinfinitely many terms.
SI measureAbbreviation for Système International d’Unités—InternationalSystem of Units—kilogram, second, ampere, kelvin, candela, mole,radian, and so on.
side (of a polygon)Any of the line segments that make up the boundary of the polygon.
d2 fdx2
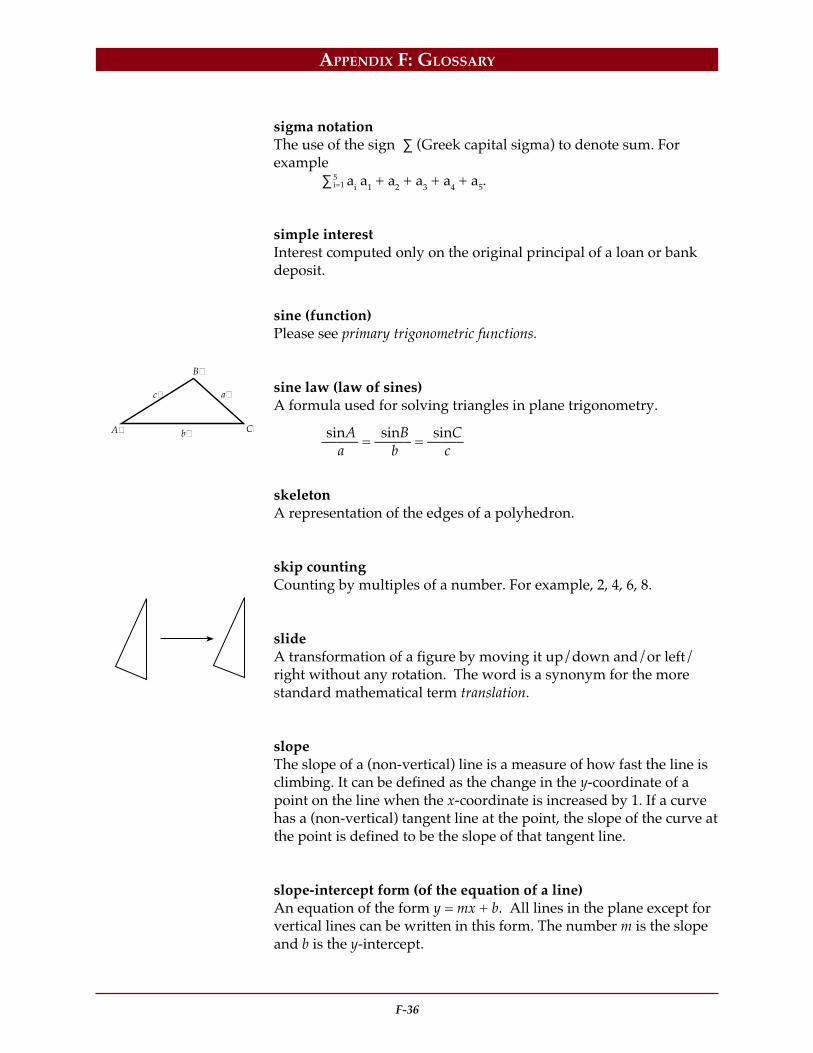
APPENDIX F: GLOSSARY
F-36
sigma notationThe use of the sign ∑ (Greek capital sigma) to denote sum. Forexample
∑ ai a1 + a2 + a3 + a4 + a5.
simple interestInterest computed only on the original principal of a loan or bankdeposit.
sine (function)Please see primary trigonometric functions.
sine law (law of sines)A formula used for solving triangles in plane trigonometry.
——– = ——– = ——–
skeletonA representation of the edges of a polyhedron.
skip countingCounting by multiples of a number. For example, 2, 4, 6, 8.
slideA transformation of a figure by moving it up/down and/or left/right without any rotation. The word is a synonym for the morestandard mathematical term translation.
slopeThe slope of a (non-vertical) line is a measure of how fast the line isclimbing. It can be defined as the change in the y-coordinate of apoint on the line when the x-coordinate is increased by 1. If a curvehas a (non-vertical) tangent line at the point, the slope of the curve atthe point is defined to be the slope of that tangent line.
slope-intercept form (of the equation of a line)An equation of the form y = mx + b. All lines in the plane except forvertical lines can be written in this form. The number m is the slopeand b is the y-intercept.
5i=1
a
A
B
Cb
c
sinAa
sinBb
sinCc

F-37
APPENDIX F: GLOSSARY
solution (of a differential equation)A function that satisfies the differential equation. For example, forany constant C, the function given by y = (x2 + C)1/3 is a solution ofthe differential equation 3y2 —– = 2x.
sphereA solid whose surface is all points equidistant from a centre point.
square rootThe square root of x is the non-negative number that whenmultiplied by itself produces x. For example 5 is the square root of25. In general the square root of x2 is |x|, the absolute value of x.
standard deviationSample standard deviation is the square root of the sample variance.Population standard deviation is the square root of the populationvariance.
standard formThe usual form of an equation. For example, the standard form ofthe equation of a circle is (x - a)2 + (y - b)2 = r2, because it revealsgeometrically important features, the center and the radius.
standard position (angle in)The initial arm of the angle is the positive horizontal axis (x-axis.)Counterclockwise rotation gives a positive angle.
step functionA function whose graph is flat except at a finite number of points,where it takes a sudden jump.
supplementary anglesTwo angles whose sum is 180°.
dydx
y
x
terminal arm
horizontal axisinitial arm
y
x

APPENDIX F: GLOSSARY
F-38
symmetrical (has symmetry)A geometrical figure is symmetrical if there is a rotation reflection,or combination of these that takes the figure to itself but movessome points. For example, a square has symmetry because it is takento itself by a rotation about its center through 90˚.
system of equationsA set of equations. A solution of the system is an assignment ofvalues to the variables such that all of the equations are (simulta-neously) satisfied. For example, x = 1, y = 2, z = -3 is a solution of thesystem x + y + z = 0, x - y - 4x = 11.
Ttangent (function)Please see primary trigonometric functions.
tangent (to a curve)A line is tangent to a curve at the point P if under very high magnifi-cation, the line is nearly indistinguishable from the curve at pointsclose to P. A tangent line to a circle can be thought of as a line thatmeets the circle at only one point.
tangent line approximationIf P is a point on a curve, then close to P the curve can be approxi-mated by the tangent line at P. In symbols, if x is close to a, then f(x)is very closely approximated by f(a) + (x - a)f’(a).
tangramA square cut into seven shapes: two large triangles, one mediumtriangle, two small triangles, one square, and one parallelogram.
termPart of an algebraic expression. For example, x3 and 5x are terms ofthe polynomial x3 + 3x2 + 5x -1.
terminating decimalA decimal expansion that (ultimately) ends. Example: 3.73.

F-39
APPENDIX F: GLOSSARY
tesselationA covering of a surface (usually the entire plane) without overlap orbare spots, by copies of a given geometric figure or of a finite num-ber of given geometric figures. The word comes from tessala, theLatin word for a small tile.
theoretical probability (of an event)A numerical measure of the likelihood that the event will occur,based on a probability model. If, as can happen with dice or coins,an experiment has only a finite number n of possible outcomes, allequally likely, and in k of these the event occurs, then the theoreticalprobability of the event is k/n.
tolerance (interval)The set of numbers that are considered acceptable as the dimensionof an item. Example: a manufacturer’s tolerance interval for theweight of a “400 gram’’ box of cereal might be from 395 grams to 420grams.
transformationA change in the position of an object, and/or a change in size, andrelated changes. Also, a change in the form of a mathematicalexpression.
translationPlease see slide.
transversalA line that intersects two or more lines at different points.
trapezoidA quadrilateral that has two parallel sides. Some definitions requirethat the remaining two sides not be parallel.
tree diagramA pictorial way of representing the outcomes of an experiment thatinvolves more than one step.
APPENDIX F: GLOSSARY
F-40
trigonometryThe branch of mathematics concerned with the properties andapplications of the trigonometric functions, in particular their use in“solving’’ triangles, in surveying, in the study of periodicphenomena, and so on.
trinomialA polynomial that has three terms. For example:
ax2 bx c
turnPlease see rotation.
UunbiasedA sampling procedure for estimating a population parameter (likethe proportion of BC teenagers who smoke) is unbiased if on aver-age it should yield the correct value. At a more informal level, apolling procedure is unbiased if proper randomization proceduresare used to select the sample, the wording of the questions is neu-tral, and so on.
unit circleA circle of radius 1.
unit vectorA vector of length 1.
VvariableA mathematical entity that can stand for any of the members of agiven set.

F-41
APPENDIX F: GLOSSARY
varianceSample variance is a measure of the variability of a sample, based onthe sum of the squared deviations of the data values about themean. Population variance is a theoretical measure of the variability ofa population.
vectorA directed line segment (arrow) used to describe a quantity that hasdirection as well as magnitude.
vertex (pl. vertices)In a polygon, a point of intersection of two sides. In a polyhedron, avertex of a face.
vertically opposite anglesOpposite (and equal) angles resulting from the intersection of twolines.
Wwhole numberOne of the counting numbers 0, 1, 2, 3, 4, and so on; a non-negativeinteger.
Xx-intercept(s)The point(s) at which a curve meets the x-axis (horizontal axis).
Yy-intercept(s)The point(s) at which a curve meets the y-axis (vertical axis).

APPENDIX F: GLOSSARY
F-42
Zz-scoreIf x is the numerical value of one observation in a sample, the z-scoreof x is (x - x )/s, where x is the sample mean and s is the samplestandard deviation. The z-score measures how far x is from themean.
zero (root) of f(x)Any number a such that f(a)=0.

APPENDIX GIllustrative Examples


APPENDIX G INTRODUCTION
T his appendix contains a series of examples designed to help teachers understand theprescribed learning outcomes for Applications of Mathematics 10 to 12, Essentials of Mathematics10 to 12, Principles of Mathematics 10 to 12, and Calculus 12.
The prescribed learning outcomes have been paired with examples that illustrate the types ofactivities an average student should be able to complete for each course.
• With the exception of the Problem Solving organizer, all prescribed learning outcomes for earliercourses are listed.
• In some cases an illustrative example may encompass more than one learning outcome; con-versely, some outcomes have more than one example.
Please note that these illustrative examples are not intended to be used for assessment of studentperformance.
Examples of multi-strand and interdiciplinary problems that most students should be able to solveare indicated with an asterisk (*).


APPENDIX G
ILLUSTRATIVE EXAMPLES
Applications of Mathematics 10


G-7
APPENDIX G: ILLUSTRATIVE EXAMPLES • Applications of Mathematics 10
Prescribed Learning Outcomes Illustrative Examples
It is expected that students will:
• solve problems that involve a specificcontent area
• solve problems that involve more thanone content area
• solve problems that involve mathematicswithin other disciplines
• analyse problems and identify thesignificant elements
• develop specific skills in selecting andusing an appropriate problem-solvingstrategy or combination of strategieschosen from, but not restricted to, thefollowing:- guess and check- look for a pattern- make a systematic list- make and use a drawing or model- eliminate possibilities- work backward- simplify the original problem- develop alternative original approaches- analyse keywords
• demonstrate the ability to work individu-ally and co-operatively to solve problems
• determine that their solutions are correctand reasonable
• clearly communicate a solution to aproblem and the process used to solve it
• interpret their solutions by describingwhat the solution means within thecontext of the original problem
• use appropriate technology to assist inproblem solving
PROBLEM SOLVING
It is expected that students will use a variety of methods to solve real-life, practical, technical, and theoretical problems.
Illustrative Examples for Problem Solving have beenindicated with an asterisk (*) throughout Appendix G.

G-8
APPENDIX G: ILLUSTRATIVE EXAMPLES • Applications of Mathematics 10
Prescribed Learning Outcomes Illustrative Examples
NUMBER (Number Concepts)
It is expected that students will analyse the numerical data in a table for trends, patterns and interrelationships.
It is expected that students will:
• use words and algebraic expressions todescribe the data and theinterrelationships in a table with rows thatare not related recursively (not calculatedfrom previous data)
c
a) What is the rate of GST?
b) What could be the rate of PST?
c) What could be the rule for calculating PST?
d) What is the total GST paid on the two items in the table?
e) What is the total PST paid on the two items in the table?
c National Hockey League (NHL)Western Conference: February 1, 1996
What happens to the NHL standings if wins are worth threepoints and ties are worth one point?
Price GST PST Total$120.00 $8.40 $12.84 $141.24$275.00 $19.25 $29.43 $323.68
W L T PointsDetroit
Colorado
Chicago
Toronto
St. Louis
Winnipeg
Vancouver
Los Angeles
Calgary
Edmonton
Anaheim
Dallas
San Jose
35
26
25
22
21
21
17
17
18
18
17
14
11
9
14
15
19
20
24
20
22
23
25
27
24
35
4
9
11
9
8
4
12
11
9
6
5
10
4
74
61
61
53
50
46
46
45
45
42
39
38
26

G-9
APPENDIX G: ILLUSTRATIVE EXAMPLES • Applications of Mathematics 10
Prescribed Learning Outcomes Illustrative Examples
NUMBER (Number Concepts)
It is expected that students will analyse the numerical data in a table for trends, patterns and interrelationships.
It is expected that students will:
• use words and algebraic expressions todescribe the data and theinterrelationships in a table with rowsthat are related recursively (calculatedfrom previous data)
c *The following table provides data on the repayment of a$100,000 farm loan. The farmer has negotiated for oneannual payment to be made each year after harvest and forthe right to make an extra payment, if the harvest is good.Use the table to answer the questions.
a) What is the period of the loan?
b) What is the amount of the annual payment?
c) How much of the annual payment at the end of Year 5went toward the opening balance? Show how todetermine the answer in two different ways.
d) Create an algebraic expression to find the answer in c).
e) If the interest rate went up to 11% in Year 10, how muchwould be owing at the end of Year 10?
f) What extra payment at the end of Year 4 would pay theloan off at the end of Year 8?
Year Opening Interest Interest Regular Extra ClosingBalance Rate (%) Charged Payment Payment Balance
1
2
3
4
5
6
7
8
9
10
$100 000.00
$ 93 097.05
$ 85 641.87
$ 77 590.27
$ 68 894.54
$ 59 503.15
$ 49 360.46
$ 38 406.34
$ 26 575.90
$ 13 799.03
8
8
8
8
8
8
8
8
8
8
$8000.00
$7447.76
$6851.35
$6207.22
$5511.56
$4760.25
$3948.84
$3072.51
$2126.07
$1103.92
$14 902.95
$14 902.95
$14 902.95
$14 902.95
$14 902.95
$14 902.95
$14 902.95
$14 902.95
$14 902.95
$14 902.95
$93 097.05
$85 641.87
$77 590.27
$68 894.54
$59 503.15
$49 360.46
$38 406.34
$26 575.90
$13 799.03
$ 0.00

G-10
APPENDIX G: ILLUSTRATIVE EXAMPLES • Applications of Mathematics 10
Prescribed Learning Outcomes Illustrative Examples
NUMBER (Number Operations)
It is expected that students will use basic arithmetic operations on real numbers to solve problems.
It is expected that students will:
• communicate a set of instructions used tosolve an arithmetic problem
c Write a set of instructions that will allow another student tofind:
a) 1 1 2 4 3
b) 9 3 4 4 3 3 5
c) the reciprocal of a square root of a number, using ascientific calculator
d) a 5% commission on a sale of $40,200
• perform arithmetic operations onirrational numbers, using appropriatedecimal approximations
c Mahal indicates that 2 1 8 has an approximate value of3.16. Use estimates to show whether Mahal’s answer isreasonable, and use a calculator to verify the accuracy ofMahal’s answer.
c Find a decimal approximation of 5 - 23
to three decimalplaces.
c Arrange the following in order of value from least to greatest:
7, 2 13, 3 6 , 4 5 , 5 2 .Use decimal approximations.
c Find the length of the base and the height of an equilateraltriangle of area 24 cm2.

G-11
APPENDIX G: ILLUSTRATIVE EXAMPLES • Applications of Mathematics 10
Prescribed Learning Outcomes Illustrative Examples
NUMBER (Number Operations)
It is expected that students will describe and apply arithmetic operations on tables to solve problems, using technology asrequired.
It is expected that students will:
• create and modify tables from bothrecursive and nonrecursive situations
c
a) Modify the table to allow for a PST of 6.5% of the pricebefore taxes.
b) In another province, where PST is charged at a differentrate, the total price is $138 What is the rate of PST for thatprovince?
c *In 1993, sales of a particular video game doubled everymonth. The game was released in May 1993 with sales of32 000 for May. Prepare a table to illustrate the 1993 monthlysales figures. How many video games were sold inDecember 1993? Identify the assumptions you made whendetermining the solution.In 1994, the demand for the video game peaked. Starting inJanuary 1994, and every month thereafter, sales were cut toone quarter of what they were in the previous month. Howmany video games were sold in April 1994? If April 1994was the last month of sales, how many video games weresold over the entire twelve months?
Price GST PST Total$120.00 $8.40 $12.84 $141.24$275.00 $19.25 $29.43 $323.68

G-12
APPENDIX G: ILLUSTRATIVE EXAMPLES • Applications of Mathematics 10
Prescribed Learning Outcomes Illustrative Examples
NUMBER (Number Operations)
It is expected that students will describe and apply arithmetic operations on tables to solve problems, using technology asrequired.
It is expected that students will:
• use and modify a spreadsheet template tomodel recursive situations
Year Opening Interest Interest Regular ClosingBalance Rate (%) Charged Payment Balance
1
2
3
4
5
6
7
8
9
10
$ 85 000.00
$ 79 132.49
$ 72 795.59
$ 65 951.73
$ 58 560.36
$ 50 577.68
$ 41 956.39
$ 32 645.39
$ 22 589.52
$ 11 729.17
8
8
8
8
8
8
8
8
8
8
$6800.00
$6330.60
$5823.65
$5276.14
$4684.83
$4046.21
$3356.51
$2611.63
$1807.16
$ 938.33
$12 667.51
$12 667.51
$12 667.51
$12 667.51
$12 667.51
$12 667.51
$12 667.51
$12 667.51
$12 667.51
$12 667.51
$ 79 132.49
$ 72 795.59
$ 65 951.73
$ 58 560.36
$ 50 577.68
$ 41 956.39
$ 32 645.39
$ 22 589.52
$11 729.17
$ 0.00
c Modify the given template for a 10-year, $85,000 farmmortgage with fixed annual payments, to allow for a changein interest rate.
a) What alternatives are open to the farmer, if the interestrate increases?
b) What alternatives are open to the farmer, if the interestrate decreases?
c Modify the template in the previous illustrative example toreflect a 25-year home mortgage with monthly paymentsthat gives the customer the option of making an annualextra payment of $1,500 at the end of any year. Interest ischarged monthly.
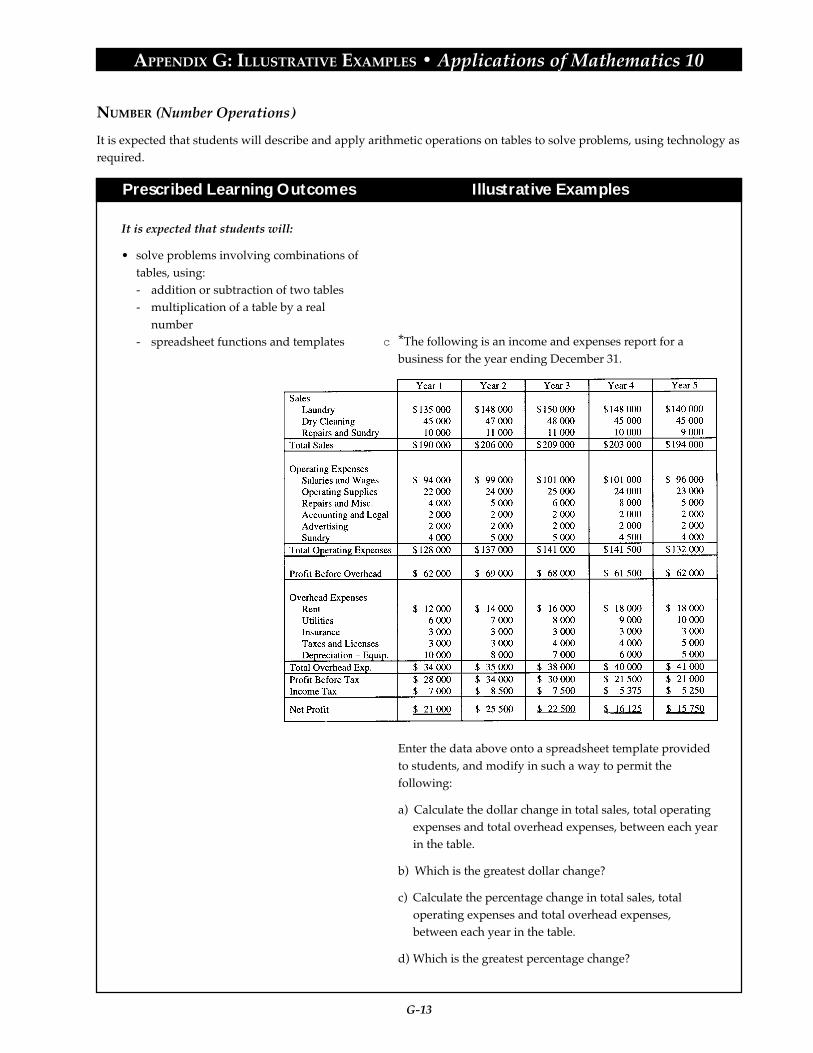
G-13
APPENDIX G: ILLUSTRATIVE EXAMPLES • Applications of Mathematics 10
Prescribed Learning Outcomes Illustrative Examples
NUMBER (Number Operations)
It is expected that students will describe and apply arithmetic operations on tables to solve problems, using technology asrequired.
It is expected that students will:
• solve problems involving combinations oftables, using:- addition or subtraction of two tables- multiplication of a table by a real
number- spreadsheet functions and templates c *The following is an income and expenses report for a
business for the year ending December 31.
Enter the data above onto a spreadsheet template providedto students, and modify in such a way to permit thefollowing:
a) Calculate the dollar change in total sales, total operatingexpenses and total overhead expenses, between each yearin the table.
b) Which is the greatest dollar change?
c) Calculate the percentage change in total sales, totaloperating expenses and total overhead expenses,between each year in the table.
d) Which is the greatest percentage change?

G-14
APPENDIX G: ILLUSTRATIVE EXAMPLES • Applications of Mathematics 10
Prescribed Learning Outcomes Illustrative Examples
NUMBER (Number Operations)
It is expected that students will describe and apply arithmetic operations on tables to solve problems, using technology asrequired.
e) Determine the percentage change for each item for eachyear.
f) Predict the figures for each type of income and expensefor Year 6, and predict the net profit for Year 6.
g) Prepare a line graph showing the annual sales, operatingexpenses and overhead expenses for the five year period.Use the graph to determine which item has the greatestrate of increase, and which item has the greatest rate ofdecrease.
h) For the five year period, use a line of best fit procedure(spreadsheet software or graphing calculator) todetermine equations of lines of best fit for total sales,total operating expenses and total overhead expenses.Use these equations to predict the values in Year 6. Fromthese values, predict the net profit in Year 6.
i) Calculate the net profit as a percentage of sales for eachof the five years. In which year did the net profitrepresent the highest proportion of sales?
j) Derive a formula relating total sales, total operatingexpenses, total overhead expenses, income tax and netprofit.

G-15
APPENDIX G: ILLUSTRATIVE EXAMPLES • Applications of Mathematics 10
Prescribed Learning Outcomes Illustrative Examples
NUMBER (Number Operations)
It is expected that students will describe and apply arithmetic operations on tables to solve problems, using technology asrequired.
c A banker needs to provide clients with information onforeign exchange. Use the foreign exchange chart provided,or a current chart from a newspaper, to answer thefollowing questions.
a) Calculate the cost in Canadian dollars of a refrigeratorthat costs $850 US.
b) Calculate the cost in US dollars of an outboard motorselling in Canada for $1,200.
c) Hans receives a cheque for 100 Swiss francs from hisuncle in Berne. How many Dutch guilders would he getfor this cheque? How many Canadian dollars?
d) Elsa is going on a holiday to Venezuela. She is told thatshe will have to pay $3.48 US for every 100 bolivars.How many bolivars will she get for $500 Canadian?
February 1, 1996
Canada dollar
US dollar
British pound
German mark
Japanese yen
Swiss franc
French franc
Dutch guilder
Italian lira
Canada US British German Japanesedollar dollar pound mark yen
— 1.3743 2.0762 0.9227 0.012850
0.7276 — 1.5107 0.6714 0.009350
0.4816 0.6619 — 0.4444 0.006189
1.0838 1.4894 2.2501 — 0.013927
77.82 106.95 161.57 71.81 —
0.8821 1.2122 1.8313 0.8139 0.011335
3.7230 5.1165 7.7297 3.4352 0.047841
1.2134 1.6676 2.5194 1.1196 0.015593
1156.07 1588.79 2400.23 1066.71 14.855491
Exchange - Cross Rates
Canada dollar
US dollar
British pound
German mark
Japanese yen
Swiss franc
French franc
Dutch guilder
Italian lira
Swiss French Dutch Italianfranc franc guilder lira
1.1337 0.2686 0.8241 0.000865
0.8249 0.1954 0.5997 0.000629
0.5460 0.1294 0.3969 0.000417
1.2287 0.2911 0.8931 0.000937
88.23 20.90 64.13 0.067315
— 0.2369 0.7269 0.000763
4.2208 — 3.0681 0.003220
1.3757 0.3259 — 0.001050
1310.64 310.52 952.72 —
Exchange - Cross Rates

G-16
APPENDIX G: ILLUSTRATIVE EXAMPLES • Applications of Mathematics 10
Prescribed Learning Outcomes Illustrative Examples
PATTERNS AND RELATIONS (Relations and Functions)
It is expected that students will examine the nature of relations with an emphasis on functions.
It is expected that students will:
• plot linear and nonlinear data, usingappropriate scales
c The mass of a beaker is recorded when the beaker containsvarying volumes of ethanol. The results of the experimentare recorded in the table below.
Measurements may be assumed correct to the nearest mLand to the nearest g.
Plot this data on a scatterplot, use appropriate scales, andanswer the following questions.
a) Assuming that this pattern continues, determine the massof the beaker and liquid when 250 mL of ethanol ispresent.
b) When a volume of 200 mL of ethanol is in the beaker,determine the mass of the ethanol alone.
c) The density of a liquid is defined as the mass of 1 mL ofthe liquid. Determine the density of the ethanol.
c Nannook’s Pizza uses the following price structure.
Plot this data on a scatterplot, use appropriate scales, anddescribe the pattern.
050
100150200
90129168207246
Mass of Beaker and Liquid (g)Volume of Ethanol (mL)
810121416
6.5010.2014.6519.9026.00
Cost ($)Diameter (inches)
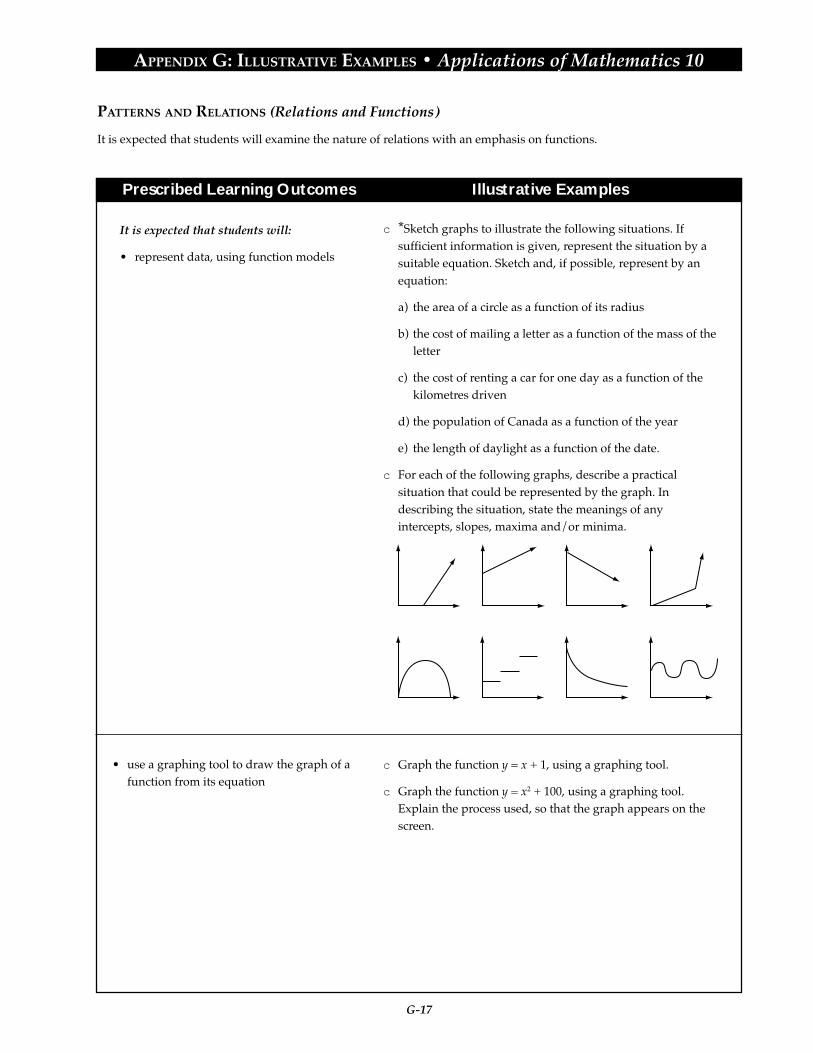
G-17
APPENDIX G: ILLUSTRATIVE EXAMPLES • Applications of Mathematics 10
Prescribed Learning Outcomes Illustrative Examples
PATTERNS AND RELATIONS (Relations and Functions)
It is expected that students will examine the nature of relations with an emphasis on functions.
It is expected that students will:
• represent data, using function models
c *Sketch graphs to illustrate the following situations. Ifsufficient information is given, represent the situation by asuitable equation. Sketch and, if possible, represent by anequation:
a) the area of a circle as a function of its radius
b) the cost of mailing a letter as a function of the mass of theletter
c) the cost of renting a car for one day as a function of thekilometres driven
d) the population of Canada as a function of the year
e) the length of daylight as a function of the date.
c For each of the following graphs, describe a practicalsituation that could be represented by the graph. Indescribing the situation, state the meanings of anyintercepts, slopes, maxima and/or minima.
c Graph the function y = x + 1, using a graphing tool.
c Graph the function y = x2 + 100, using a graphing tool.Explain the process used, so that the graph appears on thescreen.
• use a graphing tool to draw the graph of afunction from its equation
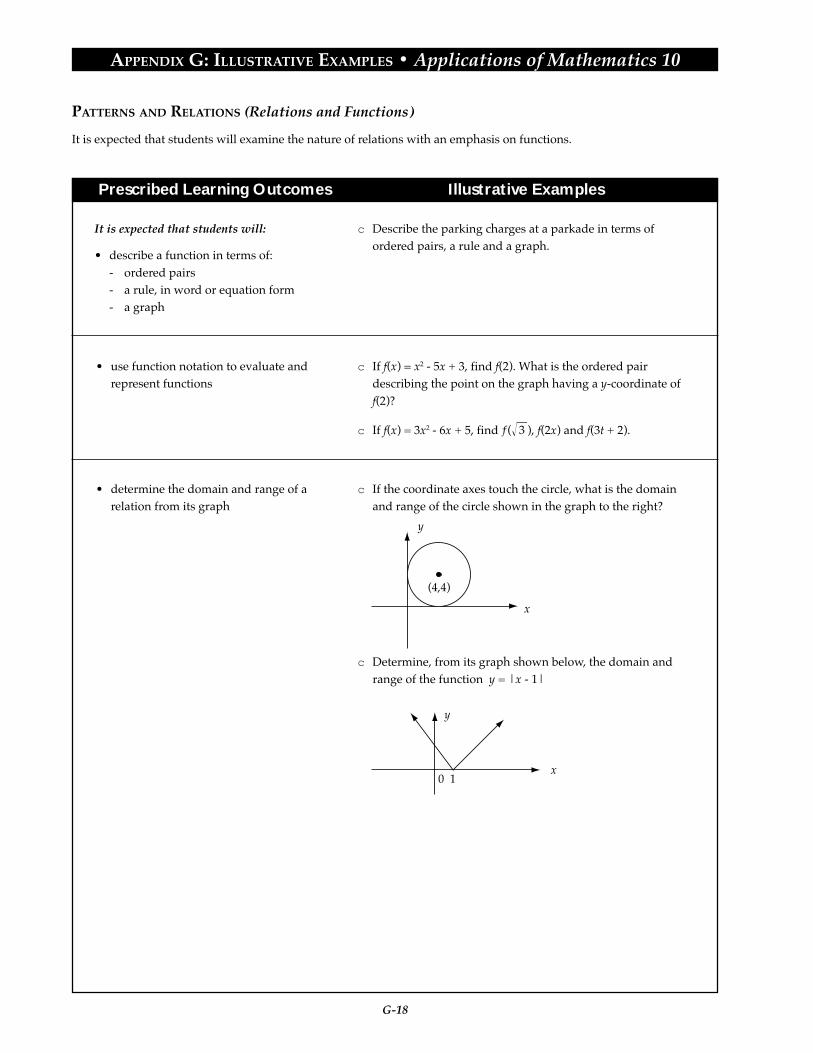
G-18
APPENDIX G: ILLUSTRATIVE EXAMPLES • Applications of Mathematics 10
Prescribed Learning Outcomes Illustrative Examples
PATTERNS AND RELATIONS (Relations and Functions)
It is expected that students will examine the nature of relations with an emphasis on functions.
It is expected that students will:
• describe a function in terms of:- ordered pairs- a rule, in word or equation form- a graph
c Describe the parking charges at a parkade in terms ofordered pairs, a rule and a graph.
• use function notation to evaluate andrepresent functions
c If f(x) = x2 - 5x + 3, find f(2). What is the ordered pairdescribing the point on the graph having a y-coordinate off(2)?
c If f(x) = 3x2 - 6x + 5, find ƒ( 3 ), f(2x) and f(3t + 2).
• determine the domain and range of arelation from its graph
c If the coordinate axes touch the circle, what is the domainand range of the circle shown in the graph to the right?
c Determine, from its graph shown below, the domain andrange of the function y = |x - 1|
(4,4)
x
y
0 1x
y

G-19
APPENDIX G: ILLUSTRATIVE EXAMPLES • Applications of Mathematics 10
Prescribed Learning Outcomes Illustrative Examples
PATTERNS AND RELATIONS (Relations and Functions)
It is expected that students will examine the nature of relations with an emphasis on functions.
c *A tanker truck drives on a weigh scale and then is filledwith crude oil. The mass M, measured in kilograms, of thetruck and the volume V, measured in barrels, of crude oilare related by the formula:
M = 14 000 + 180 V; V # 500
a) Draw the graph with V on the horizontal axis and M onthe vertical axis.
b) The tank has a maximum capacity of 500 barrels. What isthe mass of the truck when it contains 500 barrels of oil?
c) What is the mass of the empty truck? Where is this valuefound on the graph?
d) Find the slope, and give an interpretation for it.
e) Give the domain for this problem.
f) Express the range in words.
c Graph each of the following equations; and indicateintercepts, slope, domain and range.
a) y = 2x; x = (0, 1, 2, 3, 4, 5, 6)
b) y = - x; x = a real number
c) y = 3
d) x = 3
e) y = x + 5; x = a real number
f) y = mx + b; x = a real number
• determine the following characteristics ofthe graph of a linear function, given itsequation:- intercepts- slope- domain- range
1 3—
1 3—
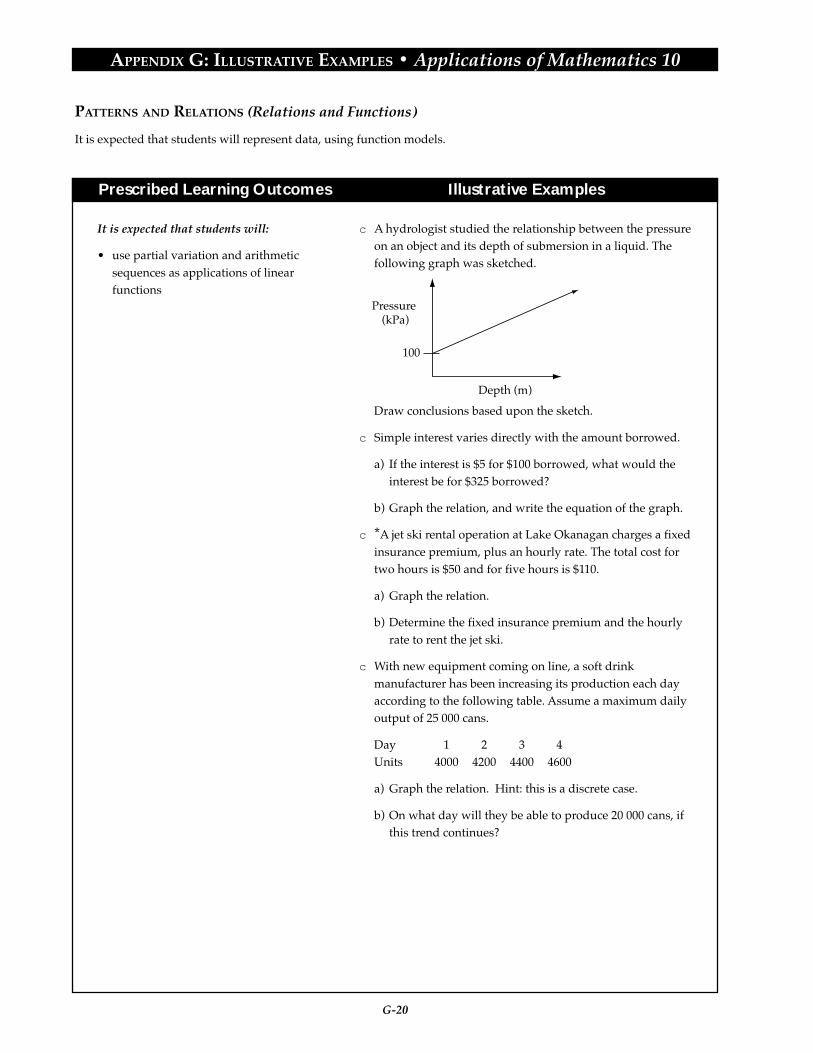
G-20
APPENDIX G: ILLUSTRATIVE EXAMPLES • Applications of Mathematics 10
Prescribed Learning Outcomes Illustrative Examples
PATTERNS AND RELATIONS (Relations and Functions)
It is expected that students will represent data, using function models.
It is expected that students will:
• use partial variation and arithmeticsequences as applications of linearfunctions
c A hydrologist studied the relationship between the pressureon an object and its depth of submersion in a liquid. Thefollowing graph was sketched.
Draw conclusions based upon the sketch.
c Simple interest varies directly with the amount borrowed.
a) If the interest is $5 for $100 borrowed, what would theinterest be for $325 borrowed?
b) Graph the relation, and write the equation of the graph.
c *A jet ski rental operation at Lake Okanagan charges a fixedinsurance premium, plus an hourly rate. The total cost fortwo hours is $50 and for five hours is $110.
a) Graph the relation.
b) Determine the fixed insurance premium and the hourlyrate to rent the jet ski.
c With new equipment coming on line, a soft drinkmanufacturer has been increasing its production each dayaccording to the following table. Assume a maximum dailyoutput of 25 000 cans.
Day 1 2 3 4Units 4000 4200 4400 4600
a) Graph the relation. Hint: this is a discrete case.
b) On what day will they be able to produce 20 000 cans, ifthis trend continues?
100
Depth (m)
Pressure (kPa)
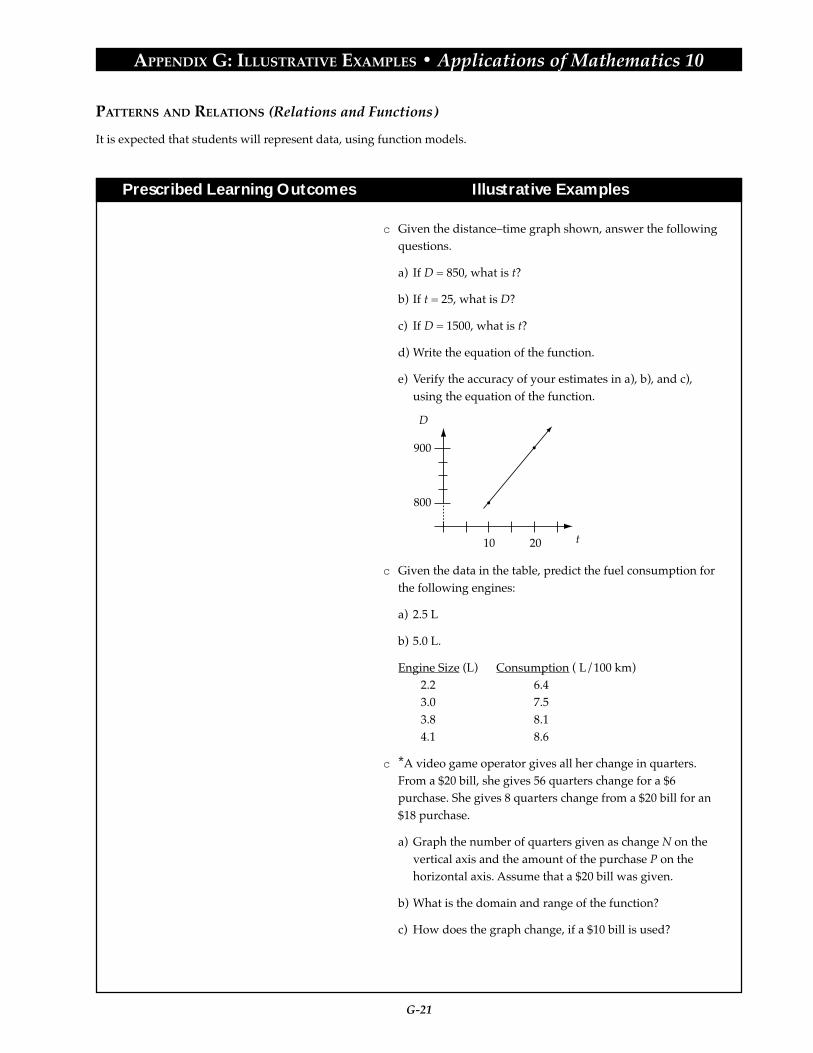
G-21
APPENDIX G: ILLUSTRATIVE EXAMPLES • Applications of Mathematics 10
Prescribed Learning Outcomes Illustrative Examples
PATTERNS AND RELATIONS (Relations and Functions)
It is expected that students will represent data, using function models.
c Given the distance–time graph shown, answer the followingquestions.
a) If D = 850, what is t?
b) If t = 25, what is D?
c) If D = 1500, what is t?
d) Write the equation of the function.
e) Verify the accuracy of your estimates in a), b), and c),using the equation of the function.
c Given the data in the table, predict the fuel consumption forthe following engines:
a) 2.5 L
b) 5.0 L.
Engine Size (L) Consumption ( L/100 km)2.2 6.43.0 7.53.8 8.14.1 8.6
c *A video game operator gives all her change in quarters.From a $20 bill, she gives 56 quarters change for a $6purchase. She gives 8 quarters change from a $20 bill for an$18 purchase.
a) Graph the number of quarters given as change N on thevertical axis and the amount of the purchase P on thehorizontal axis. Assume that a $20 bill was given.
b) What is the domain and range of the function?
c) How does the graph change, if a $10 bill is used?
800
10 20
900
D
t

G-22
APPENDIX G: ILLUSTRATIVE EXAMPLES • Applications of Mathematics 10
Prescribed Learning Outcomes Illustrative Examples
SHAPE AND SPACE (Measurement)
It is expected that students will demonstrate an understanding of scale factors, and their interrelationship with thedimensions of similar shapes and objects.
c The area of a region in a plane is 10 cm2. How many wayscan each of the dimensions of this region be multiplied toincrease the area by 20 cm2?
c A model train is built to a scale of 1:50. If the length of themodel engine is 20 cm and the area of sheet metal used tocover the outside surface of the model is 180 cm2, what isthe actual length of the engine and the actual area of thesheeting used to cover the engine? If the volume displacedby the model engine is 126 cm3, what is the volumedisplaced by the real engine, in m3?
c *It is improbable that a giant human, 6 m in height (three orfour times normal human height), could exist. Whichbiological systems are most likely to break down? Explainyour answer.
It is expected that students will:
• calculate the volume and surface area of asphere, using formulas that are provided
c Calculate the volume and surface area of a beach ball ofradius 15 cm.
c *A hot air balloon has a spherical shape and a diameter of 4m. If 30 additional cubic metres of air are pumped into theballoon, what will be the new values for the diameter,volume and surface area?
• determine the relationships among linearscale factors, areas, the surface areas andthe volumes of similar figures and objects

G-23
APPENDIX G: ILLUSTRATIVE EXAMPLES • Applications of Mathematics 10
Prescribed Learning Outcomes Illustrative Examples
SHAPE AND SPACE (Measurement)
It is expected that students will solve problems involving triangles, including those found in 2-D and 3-D applications.
It is expected that students will:
• solve problems involving two righttriangles
c *From the top of a 100 m fire tower, a fire ranger observestwo fires, one at an angle of depression of 5˚ and the other atan angle of depression of 2˚. Assuming that the fires and thetower are in a straight line, determine the distance betweenthe fires for the following:a) when the fires are on the same side of the towerb) when the fires are on opposite sides of the tower.
c The triangles ABC and BCD have right angles at B and Crespectively. Calculate the length of side CD, and state theratio of length BD to length AC.
• extend the concepts of sine and cosine forangles through to 180˚
c Find sin 130˚.
c Use a calculator to find multiple solutions for angle A, ifsin A = sin 130˚. Use trial and error to find as many solutionsas possible. Summarize the pattern found in the solutions.
c Find the value(s) for /A (0° # A # 180˚) when sin A = 1/2.
c Find the value(s) for A (0° # A # 180˚) when cos A = 1/2.
c Find the value(s) for /A (0° # A # 180˚) when cos A = –1/2.
2 cm
60˚60˚
CD
BA
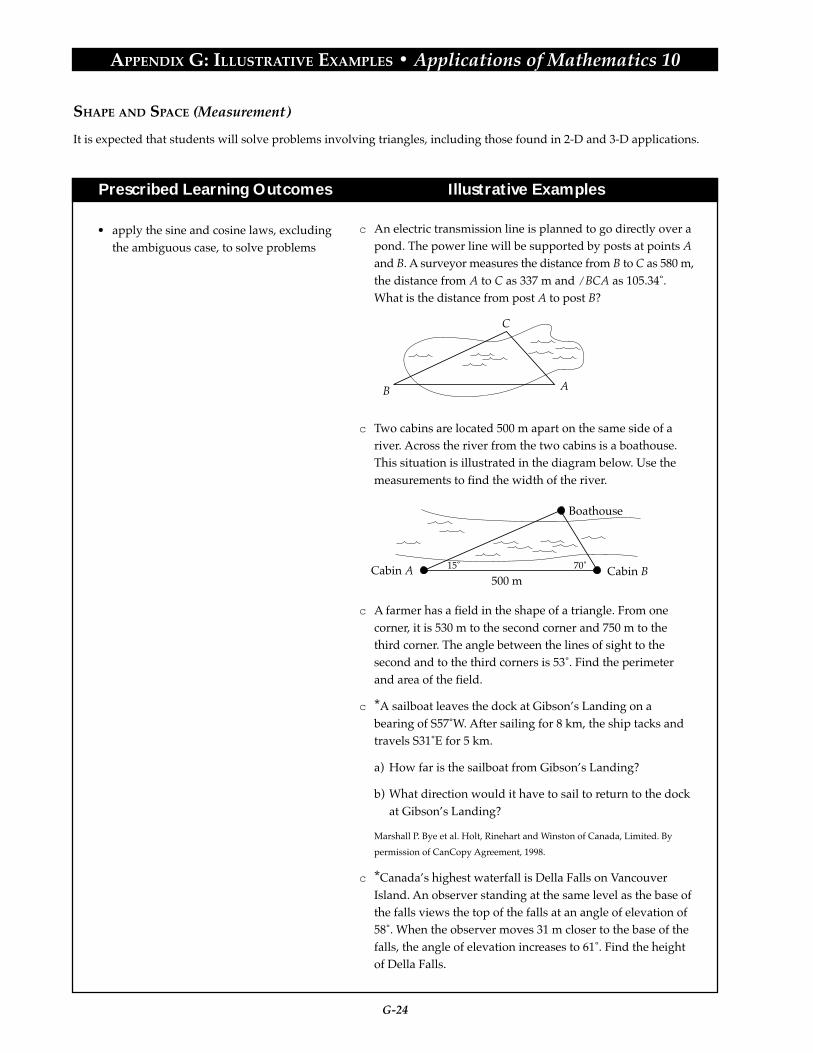
G-24
APPENDIX G: ILLUSTRATIVE EXAMPLES • Applications of Mathematics 10
Prescribed Learning Outcomes Illustrative Examples
SHAPE AND SPACE (Measurement)
It is expected that students will solve problems involving triangles, including those found in 2-D and 3-D applications.
c An electric transmission line is planned to go directly over apond. The power line will be supported by posts at points Aand B. A surveyor measures the distance from B to C as 580 m,the distance from A to C as 337 m and /BCA as 105.34˚.What is the distance from post A to post B?
c Two cabins are located 500 m apart on the same side of ariver. Across the river from the two cabins is a boathouse.This situation is illustrated in the diagram below. Use themeasurements to find the width of the river.
c A farmer has a field in the shape of a triangle. From onecorner, it is 530 m to the second corner and 750 m to thethird corner. The angle between the lines of sight to thesecond and to the third corners is 53˚. Find the perimeterand area of the field.
c *A sailboat leaves the dock at Gibson’s Landing on abearing of S57˚W. After sailing for 8 km, the ship tacks andtravels S31˚E for 5 km.
a) How far is the sailboat from Gibson’s Landing?
b) What direction would it have to sail to return to the dockat Gibson’s Landing?
Marshall P. Bye et al. Holt, Rinehart and Winston of Canada, Limited. By
permission of CanCopy Agreement, 1998.
c *Canada’s highest waterfall is Della Falls on VancouverIsland. An observer standing at the same level as the base ofthe falls views the top of the falls at an angle of elevation of58˚. When the observer moves 31 m closer to the base of thefalls, the angle of elevation increases to 61˚. Find the heightof Della Falls.
• apply the sine and cosine laws, excludingthe ambiguous case, to solve problems
C
B A
500 m15˚ 70˚Cabin A Cabin B
Boathouse

G-25
APPENDIX G: ILLUSTRATIVE EXAMPLES • Applications of Mathematics 10
Prescribed Learning Outcomes Illustrative Examples
SHAPE AND SPACE (Measurement)
It is expected that students will use measuring devices to make estimates and to perform calculations in solvingproblems.
It is expected that students will:
• select and apply appropriate instruments,units of measure (in SI and Imperialsystems) and measurement strategies tofind lengths, areas and volumes
c Find a rule that relates hectares to acres. Is there a rule ofthumb that can be used for estimates? Estimate the area of aplot of land shown in a plan, using both units ofmeasurement.
c Use a micrometer to measure the thickness of 10 sheets ofpaper. Use the results of this measurement to determine thethickness of one sheet of paper.
c Use a micrometer to measure the thickness of a human hair.
c Calculate the area of a flat rectangular surface measuring 21 mby 14 m. Give the answer in cm2, m2 and dm2.
c Estimate the volume of a water bed bladder having a depthof 300 mm, a width of 1.8 m and a length of 210 cm.
c *Given a cylindrical pipe of known length, choose appropri-ate measuring devices to find the internal and externaldiameters of the pipe. Find the volume of metal in the pipe.Explain your measurement and calculation procedures.
c Measure the internal dimensions of a rectangular container,and calculate its volume in cm3. Find its volume, in litres orin millilitres, using a calibrated cylinder.
c Use a vernier calliper to measure the inside diameter of apiece of PVC pipe.
c Measure the angle between two faces of a pyramid to thenearest degree.
c Measure the angle of a bevel to the nearest tenth of a degree,using a vernier bevel protractor.

G-26
APPENDIX G: ILLUSTRATIVE EXAMPLES • Applications of Mathematics 10
Prescribed Learning Outcomes Illustrative Examples
SHAPE AND SPACE (Measurement)
It is expected that students will use measuring devices to make estimates and to perform calculations in solvingproblems.
It is expected that students will:
• analyse the limitations of measuringinstruments and measurement strategies
c Which ruler is most precise?
a) a ruler divided into tenths of an inch
b) a ruler divided into eighths of an inch
c) a ruler divided into millimetres
c Of the four diagrams revealing shots on a target, which bestrepresents accuracy and precision?
• solve problems involving length, area,volume, time, mass and rates derivedfrom these
c *A room is 16 feet long, 12 feet wide and 8 feet high. Thewalls and ceiling are to be painted. There are two doors inthe room, each 6 feet 6 inches high and 30 inches wide.There are two windows, each 2 feet by 4 feet. Information onthe paint can states that you should allow 3.79 L for every38 m2 of smooth surface. Two coats of paint are needed.How many cans of paint are needed, if each can contains3.79 L? If a painter is able to paint 3 m2 in 10 minutes, howlong will it take to paint the room?
c A person buys a property that is irregularly shaped. Seescale drawing below.
What is the total area, in m2, of the lot?
c *A car has a highway fuel consumption of 34 miles perImperial gallon. What is this in litres per 100 kilometres?Explain the conversion strategy used.
1 cm : 10 m
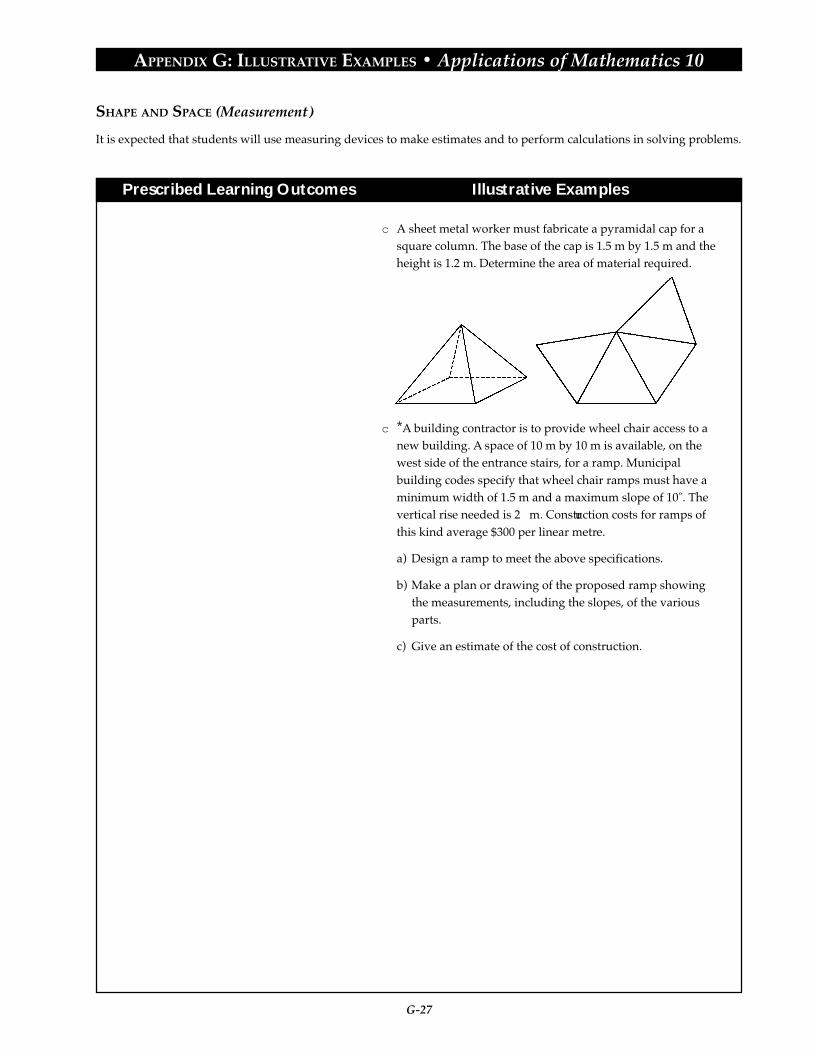
G-27
APPENDIX G: ILLUSTRATIVE EXAMPLES • Applications of Mathematics 10
Prescribed Learning Outcomes Illustrative Examples
SHAPE AND SPACE (Measurement)
It is expected that students will use measuring devices to make estimates and to perform calculations in solving problems.
c A sheet metal worker must fabricate a pyramidal cap for asquare column. The base of the cap is 1.5 m by 1.5 m and theheight is 1.2 m. Determine the area of material required.
c *A building contractor is to provide wheel chair access to anew building. A space of 10 m by 10 m is available, on thewest side of the entrance stairs, for a ramp. Municipalbuilding codes specify that wheel chair ramps must have aminimum width of 1.5 m and a maximum slope of 10˚. Thevertical rise needed is 2 m. Construction costs for ramps ofthis kind average $300 per linear metre.
a) Design a ramp to meet the above specifications.
b) Make a plan or drawing of the proposed ramp showingthe measurements, including the slopes, of the variousparts.
c) Give an estimate of the cost of construction.

G-28
APPENDIX G: ILLUSTRATIVE EXAMPLES • Applications of Mathematics 10
Prescribed Learning Outcomes Illustrative Examples
SHAPE AND SPACE (Measurement)
It is expected that students will use measuring devices to make estimates and to perform calculations in solving problems.
It is expected that students will:
• interpret drawings, and use the informa-tion to solve problems
c *The law of reflection states that when a ray of light isreflected at a surface, the angle of reflection is equal to theangle of incidence. Therefore, if light hits a mirror at an angleof incidence of 48°, the angle of reflection will also be 48°.
The following diagram of the interior of a hall of mirrorsshows a ray of light hitting mirror AB at a point 8 m from Band at an angle of incidence of 42.5˚. Using the law ofreflection, and either trigonometric relationships or scaledrawings, find the angle of reflection from mirror CD andthe distance from C at which the ray will hit mirror CD, ifmirror BC is 12 m long.
mirror
angle of reflection 48˚
angle of incidence 48˚
mirror
42.5˚
8 m
mirror
mirror
A
D
B
C
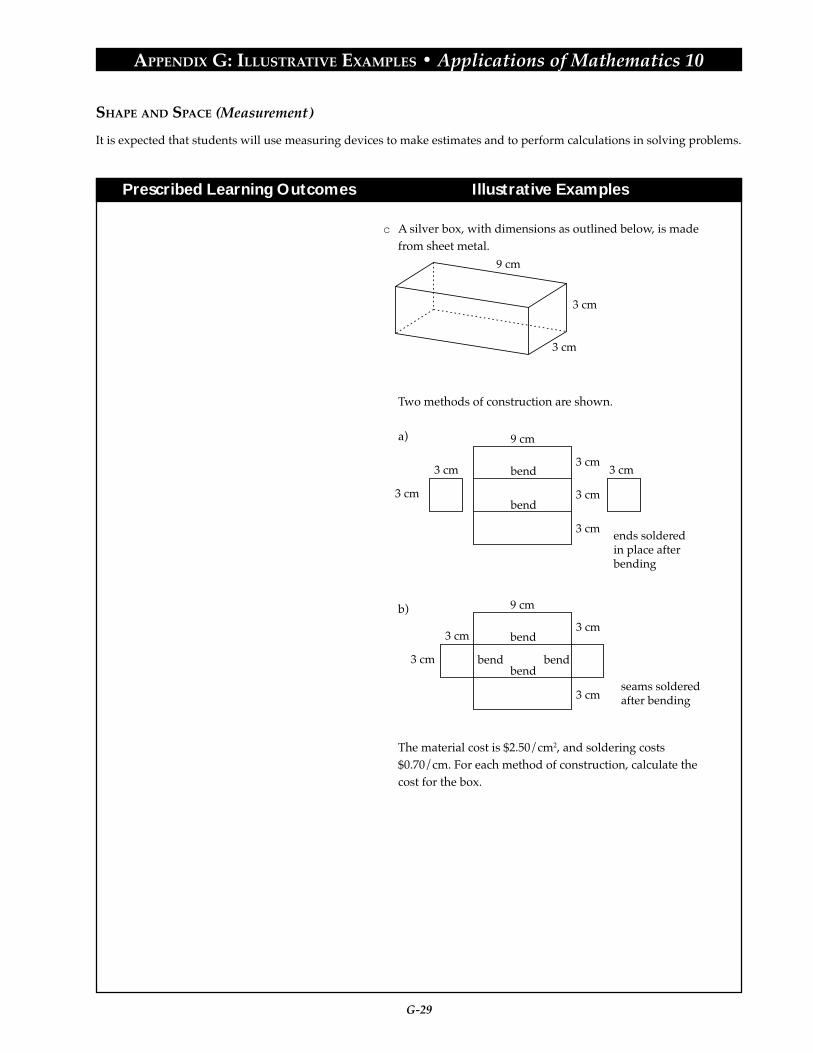
G-29
APPENDIX G: ILLUSTRATIVE EXAMPLES • Applications of Mathematics 10
Prescribed Learning Outcomes Illustrative Examples
SHAPE AND SPACE (Measurement)
It is expected that students will use measuring devices to make estimates and to perform calculations in solving problems.
c A silver box, with dimensions as outlined below, is madefrom sheet metal.
Two methods of construction are shown.
a)
b)
The material cost is $2.50/cm2, and soldering costs$0.70/cm. For each method of construction, calculate thecost for the box.
9 cm
3 cm
3 cm
9 cm
bend
bend
3 cm
3 cm
3 cm
3 cm 3 cm
ends soldered in place after bending
3 cm
9 cm
bend
bendbend bend
3 cm3 cm
3 cm
3 cm
seams soldered after bending

G-30
APPENDIX G: ILLUSTRATIVE EXAMPLES • Applications of Mathematics 10
Prescribed Learning Outcomes Illustrative Examples
SHAPE AND SPACE (3-D Objects and 2-D Shapes)
It is expected that students will solve coordinate geometry problems involving lines and line segments.
It is expected that students will:
• Solve problems involving distancesbetween points in the coordinate plane.
c Bob and Christine want to meet; see map below. Each blockhas dimensions of 120 m by 120 m. Assuming the roads areof negligible width, how far does Bob have to travel to get toChristine? Find two separate answers, one for a path alongthe roads and one for a direct path.
c Plot the points (-4, -2) and (1, 5) on the coordinate plane.Describe two different ways to calculate the distancebetween the two points.
c Generate a method of determining the distance between anytwo points in the coordinate plane without having to plotthe points. Justify your method.
c Program a calculator or computer to accept, as input, thecoordinates of two points and to give, as output, thedistance between the two points. Document the program sothat someone else can use it without assistance.
c Explain to a partner the meaning of the midpoint of the linesegment joining two points without using the wordmidpoint.
c *On a map with numerical coordinates in kilometres, thevillage of Sundown is at (6.3, 2.9), while the town of Sunupis at (4.7, 13.2). It was decided to construct a water main onthe direct line joining Sunup with Sundown. Eachcommunity was responsible for the cost of construction fromthe community to the midpoint. Find the coordinates of themidpoint and Sundown’s costs, if Sundown spent $63,475per kilometre for construction. Determine alternativemethods that could be used to solve the problem.
• solve problems involving midpoints ofline segments
B
C

G-31
APPENDIX G: ILLUSTRATIVE EXAMPLES • Applications of Mathematics 10
Prescribed Learning Outcomes Illustrative Examples
SHAPE AND SPACE (3-D Objects and 2-D Shapes)
It is expected that students will solve coordinate geometry problems involving lines and line segments.
• solve problems involving rise, run andslope of line segments
c If the slope of a line is 6 and the line passes through thepoints (2, 5) and (1, k), what is the value of k?
c If two points on a line are (4, 3) and (6, 4), find one otherpoint on the line. Use a graphing utility to demonstrate thereasonableness of your answer.
• determine the equation of a line, giveninformation that uniquely determinesthe line
c Use a graphing device to examine changes in the graph ofy = mx + b as the values of m and b are changed. Use theresults to explain why the equation y = mx + b is called theslope and y-intercept form of a linear equation.
c Write a clear explanation of the nature of the following lines:x = a, y = b, x = y.
c Manipulate the standard form of a straight line(Ax + By + C = 0) into the slope and y-intercept form of thesame line. Determine rules that connect A, B and C to theslope (m) and to the intercepts.
c Find the equation of a line passing through the points(-1, 3) and (4, 2).
c Given the graph of an oblique line, determine an equationfor the line.
c *A spring with no masses attached is 25.2 cm long. For each1-g mass attached to the spring, the spring’s length increasesby 4 mm. Graph this scenario, label the axes, and find anequation for the graph.
• solve problems using slopes of:- parallel lines- perpendicular lines
c *Graphically examine the slopes of various lines, all ofwhich are perpendicular to the line y 5 x1 2. Describe theslopes, and make a rule for finding the slope of a perpen-dicular to a given line.
c Two perpendicular lines intersect on the x-axis. Theequation of one of the lines is y = 2x - 6. Find the equation ofthe second line.
2 3—

G-32
APPENDIX G: ILLUSTRATIVE EXAMPLES • Applications of Mathematics 10
Prescribed Learning Outcomes Illustrative Examples
STATISTICS AND PROBABILITY (Data Analysis)
It is expected that students will implement and analyse sampling procedures, and draw appropriate inferences from thedata collected.
It is expected that students will:
• choose, justify and apply samplingtechniques that will result in anappropriate, unbiased sample from agiven population
c A toothpaste company advertises that three out of fourdentists prefer their product. Analyse this statement for itscompleteness and its accuracy in terms of population,sample, possible sampling technique, validity, and bias.
c A school cafeteria wants to introduce a new dessert.Describe how a survey could be conducted to decide whichof three choices should be the new dessert.
c *To predict a winner in a federal election, a magazinecompiled a list of about 200 000 names from sources such astelephone books, lists of automobile owners, clubmembership lists and its own subscription lists. Themagazine mailed a questionnaire to everybody on the list,and 4000 returned it. The 4000 responses became the sample.Discuss the potential sources of bias.
• defend or oppose inferences andgeneralizations about populations,based on data from samples
c *To determine a preference for spending $50 in either aclothing store, an electronics shop or a restaurant, customerswere surveyed one Saturday morning at the mall. Fifty-ninepercent preferred spending in a clothing store, 32% in anelectronics shop and 9% in a restaurant. Whatgeneralizations can be made from these results? Does thesample adequately represent the population to be surveyed?Design a more reliable sampling method to obtain thisinformation, and include details of the questionnaires usedand the method of selecting the sample.
c Search through various forms of media to find examples ofgeneralizations that have been made about populations,based on data from samples. Do you agree or disagree withthe generalizations? Explain why.
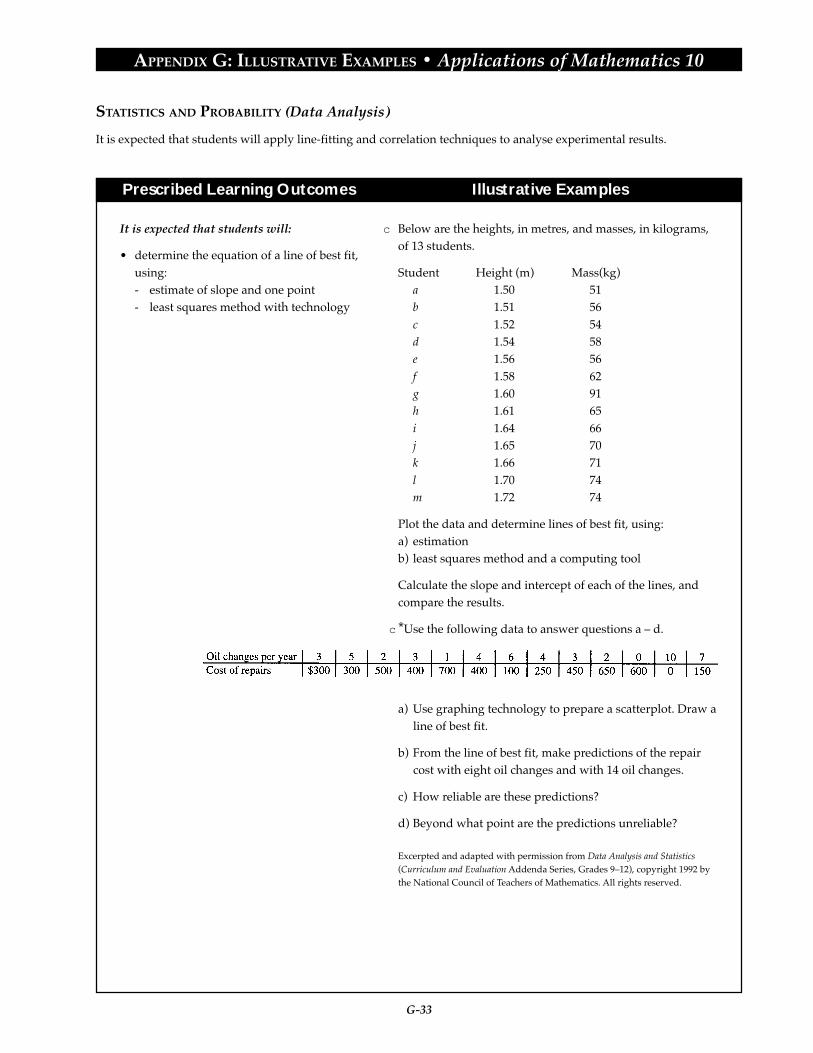
G-33
APPENDIX G: ILLUSTRATIVE EXAMPLES • Applications of Mathematics 10
Prescribed Learning Outcomes Illustrative Examples
STATISTICS AND PROBABILITY (Data Analysis)
It is expected that students will apply line-fitting and correlation techniques to analyse experimental results.
It is expected that students will:
• determine the equation of a line of best fit,using:- estimate of slope and one point- least squares method with technology
c Below are the heights, in metres, and masses, in kilograms,of 13 students.
Student Height (m) Mass(kg)a 1.50 51b 1.51 56c 1.52 54d 1.54 58e 1.56 56f 1.58 62g 1.60 91h 1.61 65i 1.64 66j 1.65 70k 1.66 71l 1.70 74m 1.72 74
Plot the data and determine lines of best fit, using:a) estimationb) least squares method and a computing tool
Calculate the slope and intercept of each of the lines, andcompare the results.
c *Use the following data to answer questions a – d.
a) Use graphing technology to prepare a scatterplot. Draw aline of best fit.
b) From the line of best fit, make predictions of the repaircost with eight oil changes and with 14 oil changes.
c) How reliable are these predictions?
d) Beyond what point are the predictions unreliable?
Excerpted and adapted with permission from Data Analysis and Statistics(Curriculum and Evaluation Addenda Series, Grades 9–12), copyright 1992 bythe National Council of Teachers of Mathematics. All rights reserved.
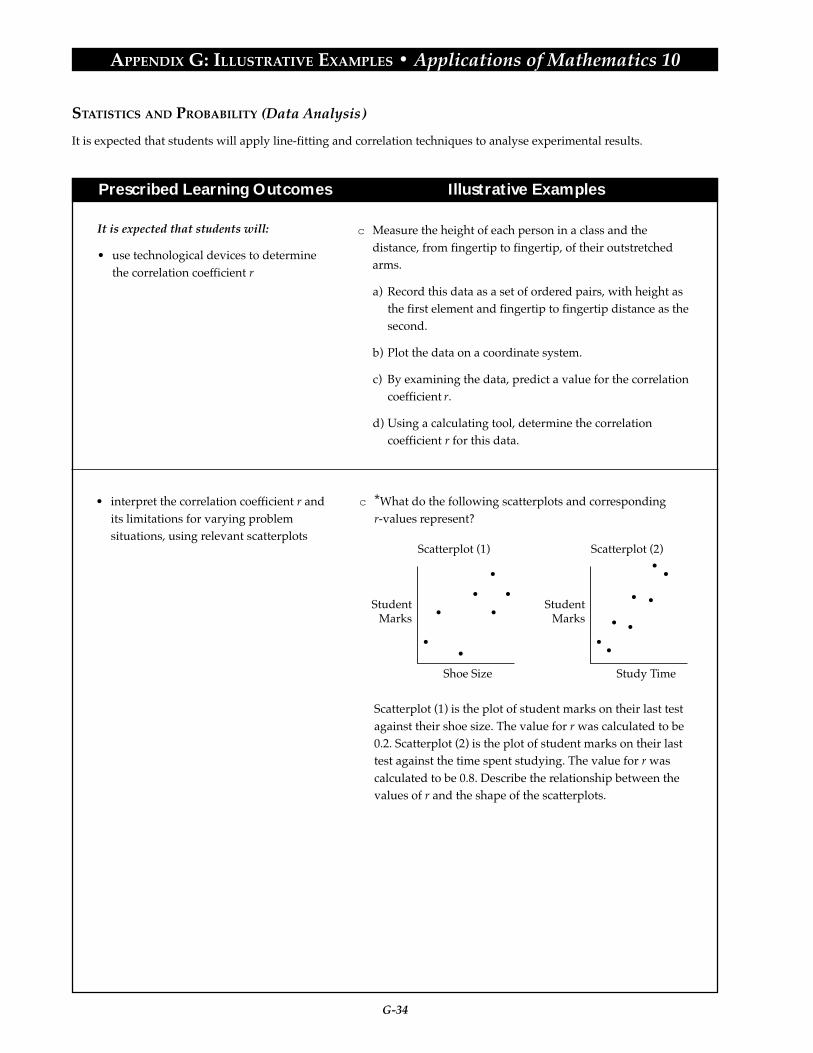
G-34
APPENDIX G: ILLUSTRATIVE EXAMPLES • Applications of Mathematics 10
Prescribed Learning Outcomes Illustrative Examples
It is expected that students will:
• use technological devices to determinethe correlation coefficient r
STATISTICS AND PROBABILITY (Data Analysis)
It is expected that students will apply line-fitting and correlation techniques to analyse experimental results.
c Measure the height of each person in a class and thedistance, from fingertip to fingertip, of their outstretchedarms.
a) Record this data as a set of ordered pairs, with height asthe first element and fingertip to fingertip distance as thesecond.
b) Plot the data on a coordinate system.
c) By examining the data, predict a value for the correlationcoefficient r.
d) Using a calculating tool, determine the correlationcoefficient r for this data.
• interpret the correlation coefficient r andits limitations for varying problemsituations, using relevant scatterplots
c *What do the following scatterplots and correspondingr-values represent?
Scatterplot (1) is the plot of student marks on their last testagainst their shoe size. The value for r was calculated to be0.2. Scatterplot (2) is the plot of student marks on their lasttest against the time spent studying. The value for r wascalculated to be 0.8. Describe the relationship between thevalues of r and the shape of the scatterplots.
Shoe Size
Scatterplot (1)
StudentMarks
Study Time
Scatterplot (2)
StudentMarks

APPENDIX G
ILLUSTRATIVE EXAMPLES
Applications of Mathematics 11


G-37
APPENDIX G: ILLUSTRATIVE EXAMPLES • Applications of Mathematics 11
Prescribed Learning Outcomes Illustrative Examples
It is expected that students will:
• solve problems that involve a specificcontent area
• solve problems that involve more thanone content area
• solve problems that involve mathematicswithin other disciplines
• analyse problems and identify thesignificant elements
• develop specific skills in selecting andusing an appropriate problem-solvingstrategy or combination of strategieschosen from, but not restricted to, thefollowing:- guess and check- look for a pattern- make a systematic list- make and use a drawing or model- eliminate possibilities- work backward- simplify the original problem- develop alternative original approaches- analyse keywords
• demonstrate the ability to workindividually and co-operatively to solveproblems
• determine that their solutions are correctand reasonable
• clearly communicate a solution to aproblem and the process used to solve it
• interpret their solutions by describingwhat the solution means within thecontext of the original problem
• use appropriate technology to assist inproblem solving
PROBLEM SOLVING
It is expected that students will use a variety of methods to solve real-life, practical, technical, and theoretical problems.
Illustrative Examples for Problem Solving have beenindicated with an asterisk (*) throughout Appendix G.

G-38
APPENDIX G: ILLUSTRATIVE EXAMPLES • Applications of Mathematics 11
Prescribed Learning Outcomes Illustrative Examples
NUMBER (Number Operations)
It is expected that students will solve consumer problems, using arithmetic operations.
• solve consumer problems, including: - wages earned in various situations - property taxation - exchange rates - unit prices
Calculate and compare wage situations involving minimumwage rates, regular pay, overtime pay, gratuities, piecework,straight commission, salary and commission, salary plusquota, and graduated commission.
Jane has a choice of two restaurants at which to work.Mario’s pays $8/h, and tips average $24 daily. Teppan’spays $5.50/h, and tips average $35 daily. If Jane works 30hours weekly, spread over four days, how much would sheearn at each restaurant?
Identify and calculate various payroll deductions, includingincome tax, CPP, UI, medical benefits, union andprofessional dues and life insurance premiums.
Estimate, calculate and compare gross and net pay forvarious wage or salary earners in your community.
The Ningart property has a market value of $105,000. Theassessed values in the area are 60% of market values. Thetax rate is 32.3 mills of assessed value. What is the Ningarts’monthly tax payment?
The exchange rate on a given day in the United States is 28%and in Canada 38.8%. Explain why this is possible.
A Canadian traveller goes from Switzerland to Germany.She knows that one Swiss franc is equivalent to $1.26Canadian (including exchange cost) and that one Germanmark is $0.97 Canadian (including exchange cost). Howmany German marks does she get for 100 Swiss francs?
Which provides better value for tomato soup, $0.69 for 284mL or $1.79 for 907 mL?
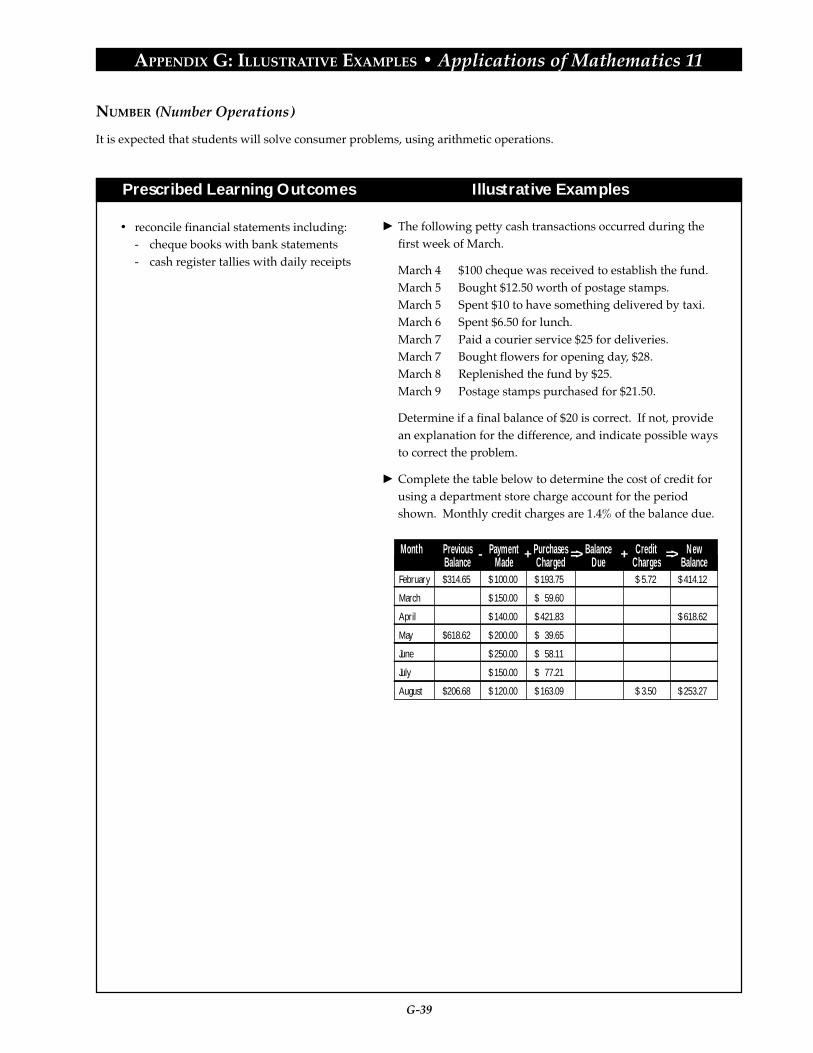
G-39
APPENDIX G: ILLUSTRATIVE EXAMPLES • Applications of Mathematics 11
Prescribed Learning Outcomes Illustrative Examples
NUMBER (Number Operations)
It is expected that students will solve consumer problems, using arithmetic operations.
• reconcile financial statements including:- cheque books with bank statements- cash register tallies with daily receipts
The following petty cash transactions occurred during thefirst week of March.
March 4 $100 cheque was received to establish the fund.March 5 Bought $12.50 worth of postage stamps.March 5 Spent $10 to have something delivered by taxi.March 6 Spent $6.50 for lunch.March 7 Paid a courier service $25 for deliveries.March 7 Bought flowers for opening day, $28.March 8 Replenished the fund by $25.March 9 Postage stamps purchased for $21.50.
Determine if a final balance of $20 is correct. If not, providean explanation for the difference, and indicate possible waysto correct the problem.
Complete the table below to determine the cost of credit forusing a department store charge account for the periodshown. Monthly credit charges are 1.4% of the balance due.
Month Previous Payment Purchases Balance Credit NewBalance Made Charged Due Charges Balance
February
March
April
May
June
July
August
$314.65
$618.62
$206.68
$ 193.75
$ 59.60
$ 421.83
$ 39.65
$ 58.11
$ 77.21
$ 163.09
$ 5.72
$ 3.50
$ 414.12
$ 618.62
$ 253.27
$ 100.00
$ 150.00
$ 140.00
$ 200.00
$ 250.00
$ 150.00
$ 120.00
- => =>+ +

G-40
APPENDIX G: ILLUSTRATIVE EXAMPLES • Applications of Mathematics 11
Prescribed Learning Outcomes Illustrative Examples
NUMBER (Number Operations)
It is expected that students will solve consumer problems, using arithmetic operations.
• solve budget problems, using graphs andtables to communicate solutions
*Research and calculate the cost of operating a vehicle for ayear. Decide how to classify each cost, how to collect thedata and how to display the results.
As a project, prepare a monthly budget for one of thefollowing:a) the familyb) an assumed persona; e.g., a celebrityc) a schoold) a vacatione) a fishing/hunting/shopping tripf) a municipality
The diagram shows Julie’s monthly budget of $1200. Shewants to move to her own apartment that costs $450 permonth. Construct a new budget that will include her rent.Explain the choices and changes that Julie could make.
Julie Barnes’ Monthly Budget Total = $1200
Clothing20%
Food20%
Savings20%
Car20%
Recreation20%

G-41
APPENDIX G: ILLUSTRATIVE EXAMPLES • Applications of Mathematics 11
Prescribed Learning Outcomes Illustrative Examples
• solve investment and credit problemsinvolving simple and compound interest
Determine the effective annual interest rate on a loan of$1,000 at 10% per year, compounded quarterly.
Calculate the compound amount, after one year, of a depositof $1000. Assume the current nominal annual interest whenthe interest is compounded:a) annuallyb) monthlyc) daily
*A bank offers an interest rate of 8% per year, compoundedannually. A second bank offers an interest rate of 8% peryear, compounded quarterly. If $2000 were deposited, forten years, in each bank, how much more income would begained in the second bank than in the first?
Calculate the interest paid on various forms of credit,including:a) credit cardsb) loansc) mortgages
A loan of $5,000 carries an interest rate of 9% per year,compounded monthly. Adele makes a payment of $350every month. Use a spreadsheet to determine how muchshe still owes after making 12 payments.
NUMBER (Number Operations)
It is expected that students will solve consumer problems, using arithmetic operations.
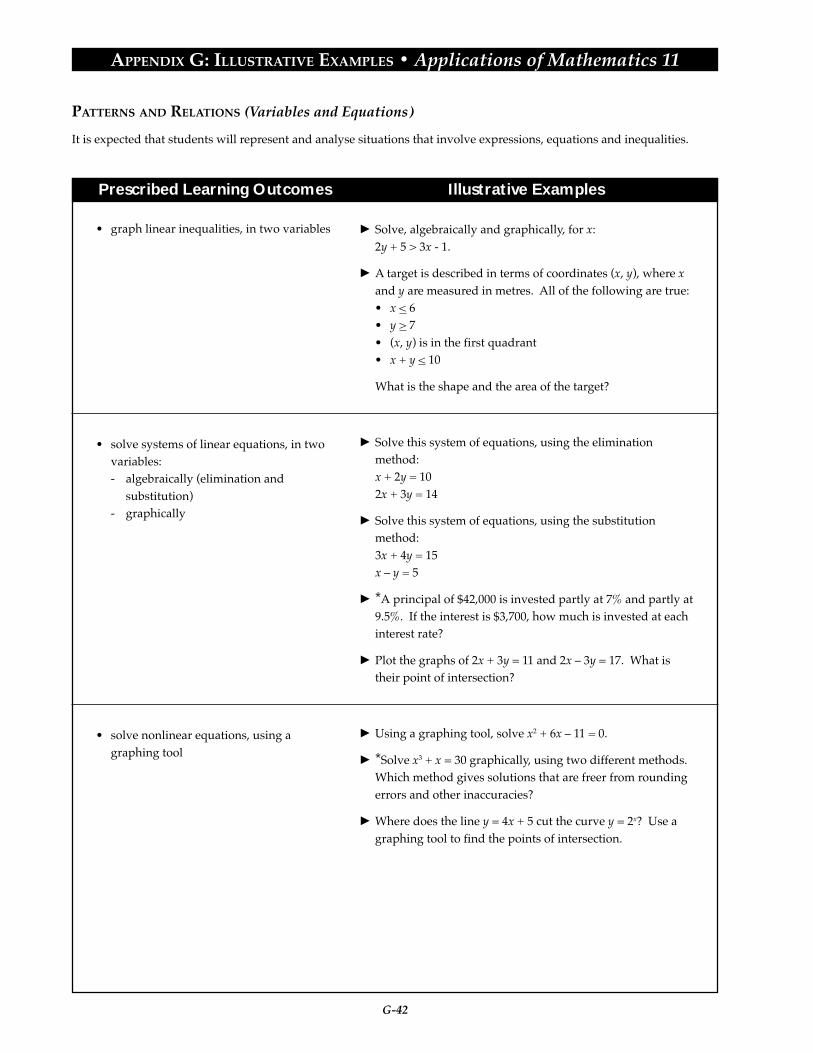
G-42
APPENDIX G: ILLUSTRATIVE EXAMPLES • Applications of Mathematics 11
Prescribed Learning Outcomes Illustrative Examples
PATTERNS AND RELATIONS (Variables and Equations)
It is expected that students will represent and analyse situations that involve expressions, equations and inequalities.
• graph linear inequalities, in two variables Solve, algebraically and graphically, for x:2y + 5 > 3x - 1.
A target is described in terms of coordinates (x, y), where xand y are measured in metres. All of the following are true:• x < 6• y > 7• (x, y) is in the first quadrant• x + y < 10
What is the shape and the area of the target?
Solve this system of equations, using the eliminationmethod:x + 2y = 102x + 3y = 14
Solve this system of equations, using the substitutionmethod:3x + 4y = 15x – y = 5
*A principal of $42,000 is invested partly at 7% and partly at9.5%. If the interest is $3,700, how much is invested at eachinterest rate?
Plot the graphs of 2x + 3y = 11 and 2x – 3y = 17. What istheir point of intersection?
Using a graphing tool, solve x2 + 6x – 11 = 0.
*Solve x3 + x = 30 graphically, using two different methods.Which method gives solutions that are freer from roundingerrors and other inaccuracies?
Where does the line y = 4x + 5 cut the curve y = 2x? Use agraphing tool to find the points of intersection.
• solve systems of linear equations, in twovariables:- algebraically (elimination and
substitution)- graphically
• solve nonlinear equations, using agraphing tool

G-43
APPENDIX G: ILLUSTRATIVE EXAMPLES • Applications of Mathematics 11
Prescribed Learning Outcomes Illustrative Examples
PATTERNS AND RELATIONS (Variables and Equations)
It is expected that students will use linear programming to solve optimization problems.
• solve systems of linear inequalities in twovariables using graphing technology
• design and solve linear and nonlinearsystems, in two variables, to modelproblem situations
Graph the solution to the following system of inequalities:3x - y > 42x + y ≤ 6
Given the following diagram, provide the system ofinequalities whose solution is the interior of ∆ABC.
A farmer has chickens and turkeys. He has fewer than 100birds. He sells chickens for $10 each and turkeys for $30each, and he earns more than $1500. Represent the situationgraphically, and shade the region containing possiblesolutions.
*A desktop publisher has to design formats for rectangulardata tables and uses graphing grids as a design tool. Shadethe region on the grid that represents the possibledimensions of rectangles in which the length is less thantwice the width, the perimeter is at most 48 cm, and the areais at least 32 cm2.
BC
(0,0) (4,0)
(2,3)
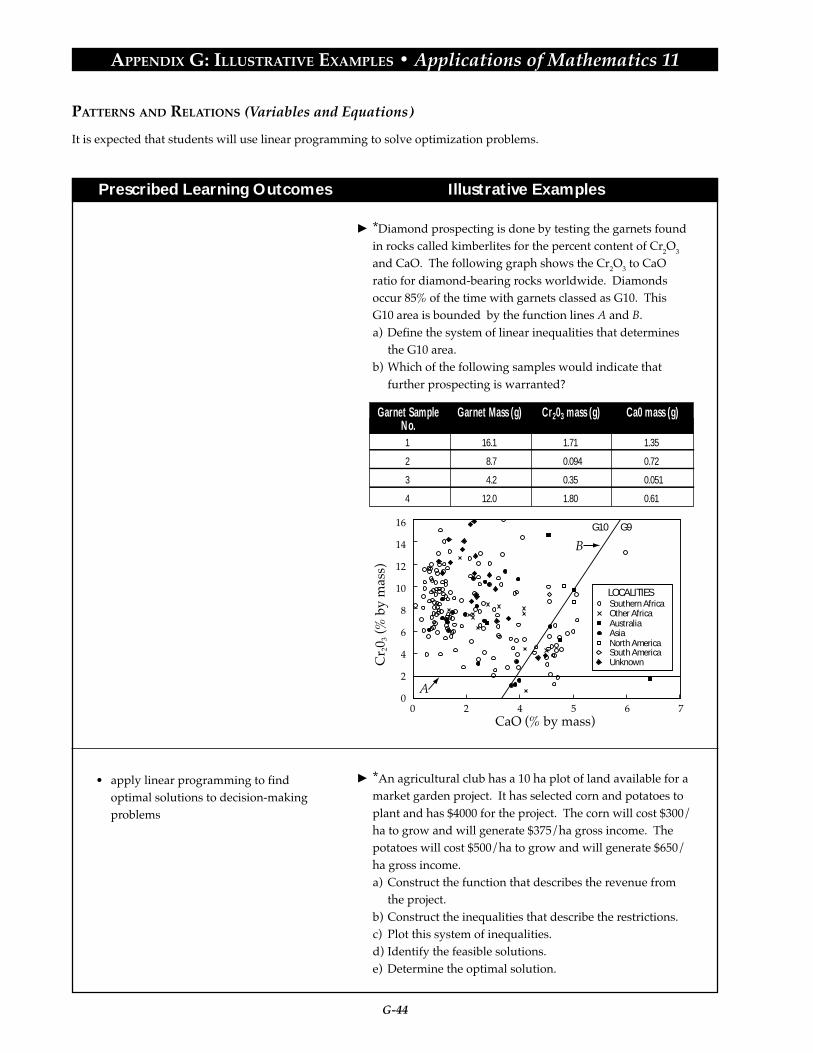
G-44
APPENDIX G: ILLUSTRATIVE EXAMPLES • Applications of Mathematics 11
Prescribed Learning Outcomes Illustrative Examples
PATTERNS AND RELATIONS (Variables and Equations)
It is expected that students will use linear programming to solve optimization problems.
*Diamond prospecting is done by testing the garnets foundin rocks called kimberlites for the percent content of Cr2O3
and CaO. The following graph shows the Cr2O3 to CaOratio for diamond-bearing rocks worldwide. Diamondsoccur 85% of the time with garnets classed as G10. ThisG10 area is bounded by the function lines A and B.a) Define the system of linear inequalities that determines
the G10 area.b) Which of the following samples would indicate that
further prospecting is warranted?
00
2
4
6
8
10
12
14
16
2 4 5 6 7
B
A
CaO (% by mass)
Cr 2
0 3 (%
by
mas
s)
G10 G9
LOCALITIESSouthern AfricaOther AfricaAustralia
South AmericaUnknown
North AmericaAsia
Garnet SampleNo.
Garnet Mass (g) Cr203 mass (g) Ca0 mass (g)
1
2
3
4
16.1
8.7
4.2
12.0
1.71
0.094
0.35
1.80
1.35
0.72
0.051
0.61
*An agricultural club has a 10 ha plot of land available for amarket garden project. It has selected corn and potatoes toplant and has $4000 for the project. The corn will cost $300/ha to grow and will generate $375/ha gross income. Thepotatoes will cost $500/ha to grow and will generate $650/ha gross income.a) Construct the function that describes the revenue from
the project.b) Construct the inequalities that describe the restrictions.c) Plot this system of inequalities.d) Identify the feasible solutions.e) Determine the optimal solution.
• apply linear programming to findoptimal solutions to decision-makingproblems

G-45
APPENDIX G: ILLUSTRATIVE EXAMPLES • Applications of Mathematics 11
Prescribed Learning Outcomes Illustrative Examples
PATTERNS AND RELATIONS (Variables and Equations)
It is expected that students will use linear programming to solve optimization problems.
*A manufacturing company originally has three employees.The company directive is to hire additional persons to buildwidgets. Widgets can only be built by teams of 2 people.Eight teams can produce 500 widgets and 10 teams canproduce 600 widgets. It is assumed that a linear relationexists between the number of teams and the number ofwidgets produced. The plant has the capacity to produce1000 widgets. The Department of Health limits the totalnumber of employees in the building to 15, due to the airquality problem. Write a presentation to the board ofdirectors explaining how to optimize production.
Find the maximum and minimum values of the quantity C,where C = 2x - 5y, given the constraints:x > 0y > 0x < 12y < x + 8x + 2y < 283x + y < 39

G-46
APPENDIX G: ILLUSTRATIVE EXAMPLES • Applications of Mathematics 11
Prescribed Learning Outcomes Illustrative Examples
PATTERNS AND RELATIONS (Relations and Functions)
It is expected that students will represent and analyse quadratic, polynomial, and rational functions, usingtechnology as appropriate.
• determine the following characteristics ofthe graph of a quadratic function:- vertex- domain and range- axis of symmetry- intercepts
Given the graph of any quadratic function, determine thefollowing:a) vertexb) domainc) ranged) axis of symmetrye) intercepts
Use technology to graph f(x) = x2 - 6x + 4 and to determinethe vertex, domain, range, axis of symmetry and intercepts.
*One model concerning the rate of population growth ofEarth has the annual rate of increase varying jointly as thepopulation and the unused carrying capacity of Earth. Theequation of the model is: y = 0.001x(21 – x), where y = therate of increase in population (in billions per year), andx = the present population (in billions).a) Plot this model of growth.b) The present population of Earth is 5.8 billion. What is the
annual increase in population at present?c) What is the population when the rate of increase in
population is at its greatest?d) What is the population when the rate of increase is zero?e) What is the projected maximum population that Earth
can accommodate, according to this model?

G-47
APPENDIX G: ILLUSTRATIVE EXAMPLES • Applications of Mathematics 11
Prescribed Learning Outcomes Illustrative Examples
SHAPE AND SPACE (Measurement)
It is expected that students will demonstrate an understanding of scale factors, and their interrelationship with thedimensions of similar shapes and objects.
A classroom has dimensions of nine metres by eight metres.Produce a scale drawing of the classroom to a scale of 1:50.
Using surveyor’s chains, tapes or other linear measuringdevices, measure a chosen plot of land, and calculate itsarea. Make a scale drawing, using the same measurementsystem for the drawing as was used with the measurementinstruments.
From the scale drawing below, construct an actual sizedmodel of the box.
To better visualize an object, architects often build claymodels. Use molding clay or building blocks to build amodel of the object that is shown in the plan below.Scale = 2:3
• enlarge or reduce a dimensioned object,according to a specified scale
Scale = 1:3
SideFront
Top
Side
Front
Top

G-48
APPENDIX G: ILLUSTRATIVE EXAMPLES • Applications of Mathematics 11
Prescribed Learning Outcomes Illustrative Examples
SHAPE AND SPACE (Measurement)
It is expected that students will use measuring devices to make estimates and to perform calculations in solvingproblems.
The diagrams represent the top and side views of a drawerhandle. If the tolerance specifications are as shown below,determine the maximum and minimum dimensions for thedistance between the two centres.
A = 10.50 ± 0.02 cmB = 8.20 ± 0.04 cm
To carry a high electric current to an LRT car, a wire musthave a cross-sectional area of 45 ± 2 mm2. What are themaximum and minimum diameters allowed for this wire?
Steel ball bearings have a diameter of 0.80 ± 0.02 cm. Findthe volume of one ball bearing, in cm3, with the toleranceincluded. What is the maximum number of such ballbearings that can be made from 1000 cm3 of steel?
• calculate maximum and minimum values,using tolerances, for lengths, areas andvolumes
Figure 1: Top View Figure 2: Side View
A
B
A
B
• solve problems involving percentage errorwhen input variables are expressed withpercentage errors
A rectangular table was measured to be 420 cm long and 170cm wide. The length was measured with an error of 1.5%and the width with an error of 2%. Calculate the maximumand minimum possible areas, and estimate the percentageerror in the calculated area.
*An experiment is done to find the density of a ball bearing.The mass is measured to be 473 g, with a percentage error of4%. The diameter is measured to be 5.1 cm ± 2%.a) Calculate the density of the ball bearing, showing its
percentage error.b) Which is more effective in reducing percentage error:
using a new balance that gives a mass of 473 g ± 1.5%, orusing a new calliper that gives a diameter of 5.1 cm ± 1%?Justify your answer with appropriate calculations.

G-49
APPENDIX G: ILLUSTRATIVE EXAMPLES • Applications of Mathematics 11
Prescribed Learning Outcomes Illustrative Examples
SHAPE AND SPACE (Measurement)
It is expected that students will use measuring devices to make estimates and to perform calculations in solvingproblems.
Design and construct a measuring device; e.g., a planimeterwith a horizontal vernier scale and cardboard wheel,graduated accordingly. Apply the constructed instrumentto find, according to scale, the areas of large, irregularshapes.
*To calculate the loss of wheat after a hailstorm, a farmercounts the total number of wheat heads and the number ofbroken wheat heads in a small area, calculates theproportion of broken heads in the sample and extrapolatesthis proportion to the entire field. Explain the process usedto gather the data, and explain how the estimate of loss isdetermined.
• design an appropriate measuring processor device to solve a problem
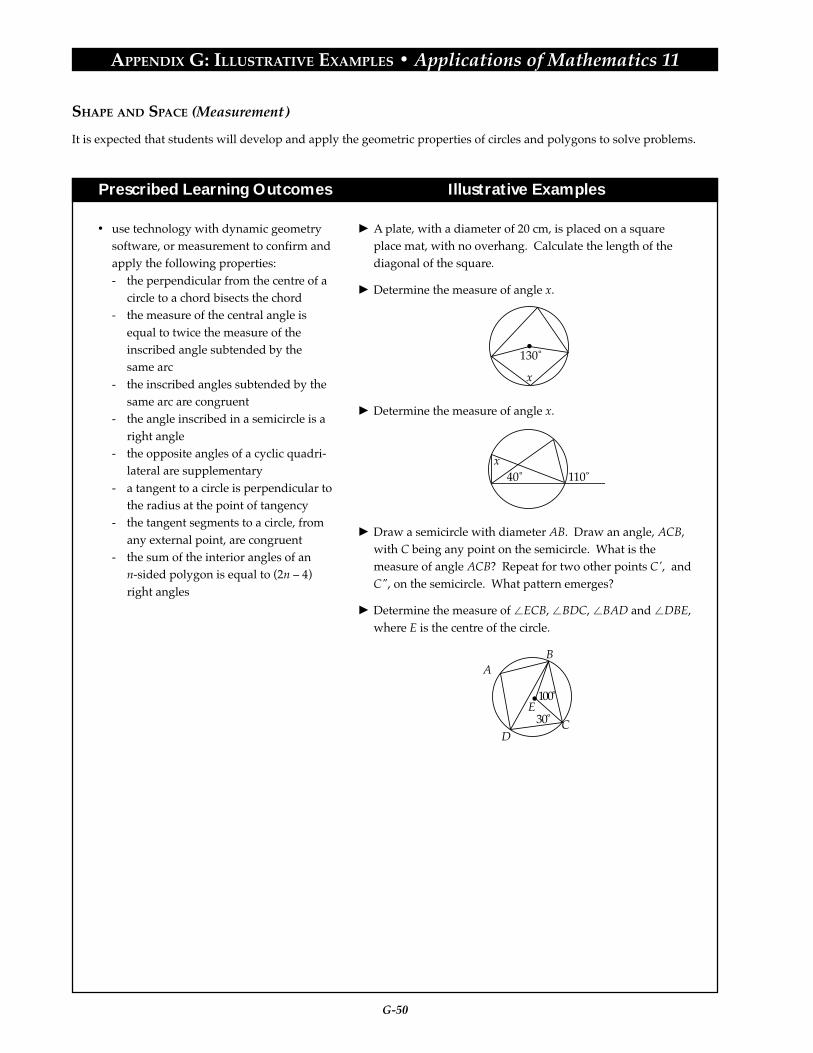
G-50
APPENDIX G: ILLUSTRATIVE EXAMPLES • Applications of Mathematics 11
Prescribed Learning Outcomes Illustrative Examples
SHAPE AND SPACE (Measurement)
It is expected that students will develop and apply the geometric properties of circles and polygons to solve problems.
• use technology with dynamic geometrysoftware, or measurement to confirm andapply the following properties:- the perpendicular from the centre of a
circle to a chord bisects the chord- the measure of the central angle is
equal to twice the measure of theinscribed angle subtended by thesame arc
- the inscribed angles subtended by thesame arc are congruent
- the angle inscribed in a semicircle is aright angle
- the opposite angles of a cyclic quadri-lateral are supplementary
- a tangent to a circle is perpendicular tothe radius at the point of tangency
- the tangent segments to a circle, fromany external point, are congruent
- the sum of the interior angles of ann-sided polygon is equal to (2n – 4)right angles
A plate, with a diameter of 20 cm, is placed on a squareplace mat, with no overhang. Calculate the length of thediagonal of the square.
Determine the measure of angle x.
Determine the measure of angle x.
Draw a semicircle with diameter AB. Draw an angle, ACB,with C being any point on the semicircle. What is themeasure of angle ACB? Repeat for two other points C', andC", on the semicircle. What pattern emerges?
Determine the measure of ECB, BDC, BAD and DBE,where E is the centre of the circle.
x
130˚
x110˚40˚
AB
CD
E100
3 0
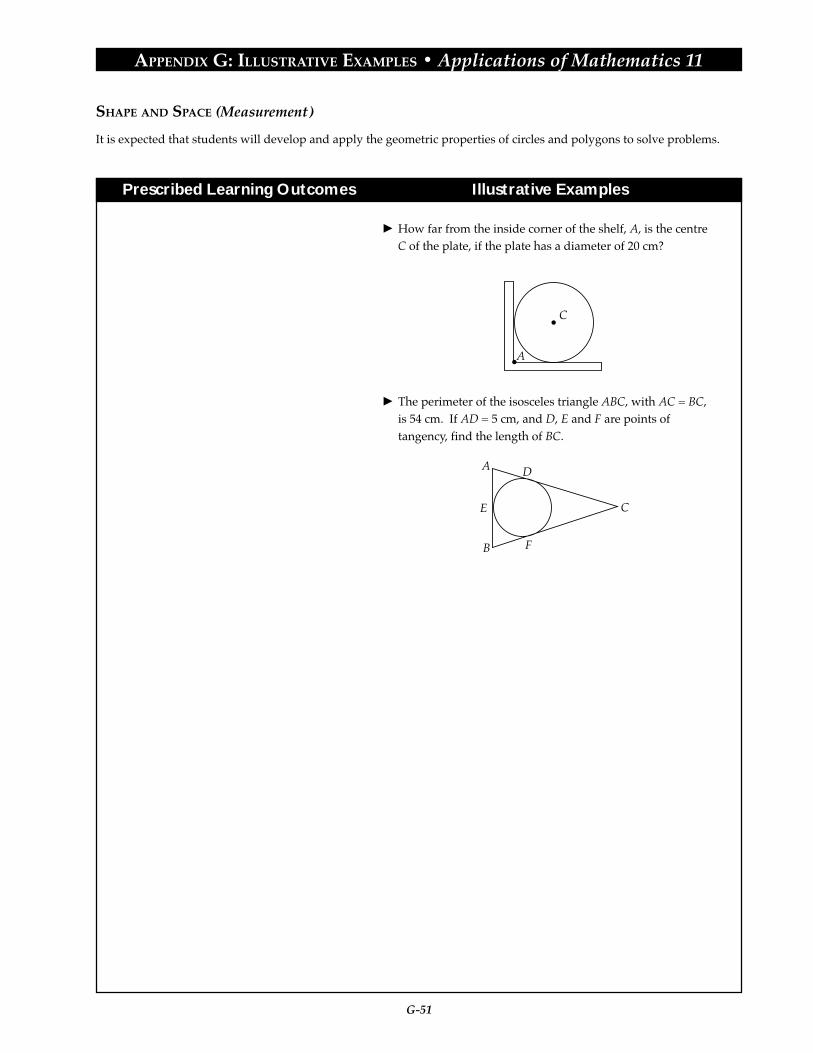
G-51
APPENDIX G: ILLUSTRATIVE EXAMPLES • Applications of Mathematics 11
Prescribed Learning Outcomes Illustrative Examples
How far from the inside corner of the shelf, A, is the centreC of the plate, if the plate has a diameter of 20 cm?
The perimeter of the isosceles triangle ABC, with AC = BC,is 54 cm. If AD = 5 cm, and D, E and F are points oftangency, find the length of BC.
A
C
A
B
E
F
D
C
SHAPE AND SPACE (Measurement)
It is expected that students will develop and apply the geometric properties of circles and polygons to solve problems.

G-52
APPENDIX G: ILLUSTRATIVE EXAMPLES • Applications of Mathematics 11
Prescribed Learning Outcomes Illustrative Examples
SHAPE AND SPACE (2-D Shapes and 3-D Objects)
It is expected that students will develop and apply the geometric properties of circles and polygons to solve problems.
The pattern on a piece of vinyl flooring consists of a squareand four equilateral triangles. Each equilateral triangle hasas its base one side of the square. Circles are inscribed ineach triangle and in the square.a) Start with a square of side length 6 cm. Draw the design,
full size.b) Determine the ratio of the area of the small circle to the
area of the large circle.
A standard sheet of paper is 22 cm by 28 cm. The marginsare 3 cm on the left, on the right and at the top. The bottommargin is 4 cm. A project summary consists of one table thatis 10 cm by 6 cm, three tables that are 8 cm by 5 cm each and50 cm2 of text that can be arranged in any shape(s).a) Prepare a possible layout, assuming that the tables can be
oriented with their long sides parallel to any edge of thepaper.
b) Prepare a possible layout, assuming that the long side ofany table must be parallel to the top edge of the paper.
c) What is the maximum area of text that can be includedwith the four tables, if each table must have at least 1 cmmargins?
*A school has 325 students, all of whom have pictures to beput in the yearbook. The yearbook pages are 9.5 inches by12 inches. The inside margins are 1.5 inches, the outsidemargins are 1 inch, the top margin is 1.2 inches, and thebottom margin is 1.5 inches. Each photograph is 53 mm by35 mm. The minimum space between sides of pictures is 0.5inches and between the bottom of one picture and the top ofthe next is 0.9 inches.a) How many photographs can be put on a single page?b) If the number of pages used must be divisible by 8,
design a layout so that all 325 photographs can beincluded, without having any blank pages.
• use properties of circles and polygons tosolve design and layout problems
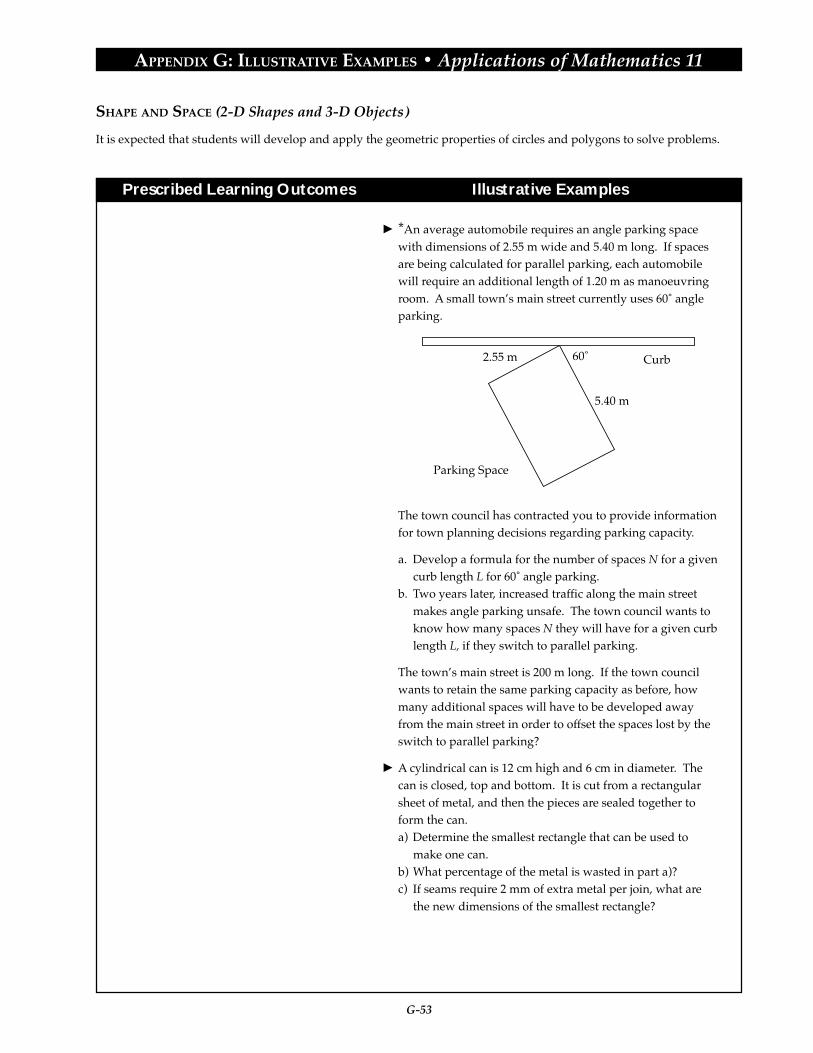
G-53
APPENDIX G: ILLUSTRATIVE EXAMPLES • Applications of Mathematics 11
Prescribed Learning Outcomes Illustrative Examples
SHAPE AND SPACE (2-D Shapes and 3-D Objects)
It is expected that students will develop and apply the geometric properties of circles and polygons to solve problems.
*An average automobile requires an angle parking spacewith dimensions of 2.55 m wide and 5.40 m long. If spacesare being calculated for parallel parking, each automobilewill require an additional length of 1.20 m as manoeuvringroom. A small town’s main street currently uses 60˚ angleparking.
The town council has contracted you to provide informationfor town planning decisions regarding parking capacity.
a. Develop a formula for the number of spaces N for a givencurb length L for 60˚ angle parking.
b. Two years later, increased traffic along the main streetmakes angle parking unsafe. The town council wants toknow how many spaces N they will have for a given curblength L, if they switch to parallel parking.
The town’s main street is 200 m long. If the town councilwants to retain the same parking capacity as before, howmany additional spaces will have to be developed awayfrom the main street in order to offset the spaces lost by theswitch to parallel parking?
A cylindrical can is 12 cm high and 6 cm in diameter. Thecan is closed, top and bottom. It is cut from a rectangularsheet of metal, and then the pieces are sealed together toform the can.a) Determine the smallest rectangle that can be used to
make one can.b) What percentage of the metal is wasted in part a)?c) If seams require 2 mm of extra metal per join, what are
the new dimensions of the smallest rectangle?
Parking Space
2.55 m 60˚
5.40 m
Curb

G-54
APPENDIX G: ILLUSTRATIVE EXAMPLES • Applications of Mathematics 11
Prescribed Learning Outcomes Illustrative Examples
STATISTICS AND PROBABILITY (Data Analysis)
It is expected that students will analyse graphs or charts of given situations to derive specific information.
• extract information from given graphs ofdiscrete or continuous data, using:- time series- continuous data- contour lines
Sometimes points representing discrete data are joined, eventhough specific values for intermediate points may not beavailable. Give examples where such a practice is acceptableand other examples where it is not.
*A department store may experience “peaks” and “troughs”in its revenue (sales). Christmas season and summerholidays are the two strongest periods. January to April canbe the weakest period. If net profits are greater than netlosses over the year, the business can stay in operation.
a) During periods of net loss, what might the business dofor finances?
b) Over which of the two curves, Sales or Costs, does thebusiness have the most managerial control?
c) Discuss the net profit for May.
PROFIT/LOSS CYCLE FOR A DEPARTMENT STORE
Months of the Year
Sale
s/C
osts
in T
hous
ands
of D
olla
rs
Net Loss
Net Profit Costs
Sales
Jan. Feb. Mar. Apr. May June July Aug. Sep. Oct. Nov. Dec.
1
2
3
4
5
6
7
8
9
10
1112

G-55
APPENDIX G: ILLUSTRATIVE EXAMPLES • Applications of Mathematics 11
Prescribed Learning Outcomes Illustrative Examples
STATISTICS AND PROBABILITY (Data Analysis)
It is expected that students will analyse graphs or charts of given situations to derive specific information.
*The map below shows the atmospheric pressure, measuredin hectopascals, forecast at various weather stations forJune 3, 1996. A current Environment Canada map can befound on the Internet at:http://www.cmc.ec.gc.ca/cmc/html/analysis.html
From Environment Canada, on line, June 2, 1996, with permission.
a) Using a current map, estimate the forecasted atmosphericpressure at your location.
b) What is the lowest pressure recorded in Canada for thedate on your map?
c) What is the highest pressure recorded in Canada for thedate on your map?
d) Shaded areas show where rain is falling. Whatconnection is there between atmospheric pressure andrainfall?

G-56
APPENDIX G: ILLUSTRATIVE EXAMPLES • Applications of Mathematics 11
Prescribed Learning Outcomes Illustrative Examples
The bar graph below shows the projected Canadianpopulation, by age group, for the period from 1992 to 2036.
Reproduced by authority of the Minister of Industry, 1998, Statistics Canada,Canadian Social Trends, Catalogue 11–008E, Number 29 Summer 1993, p. 6.
a) What year is Canada’s population expected to reach30 million?
b) Describe the rate of increase of Canada’s population,both overall and by age group.
c) Estimate the median age of the Canadian population in1992 and in 2036.
d) Estimate when Canada’s population will reach 40million.
• draw and validate inferences, includinginterpolations and extrapolations, fromgraphical and tabular data
STATISTICS AND PROBABILITY (Data Analysis)
It is expected that students will analyse graphs or charts of given situations to derive specific information.
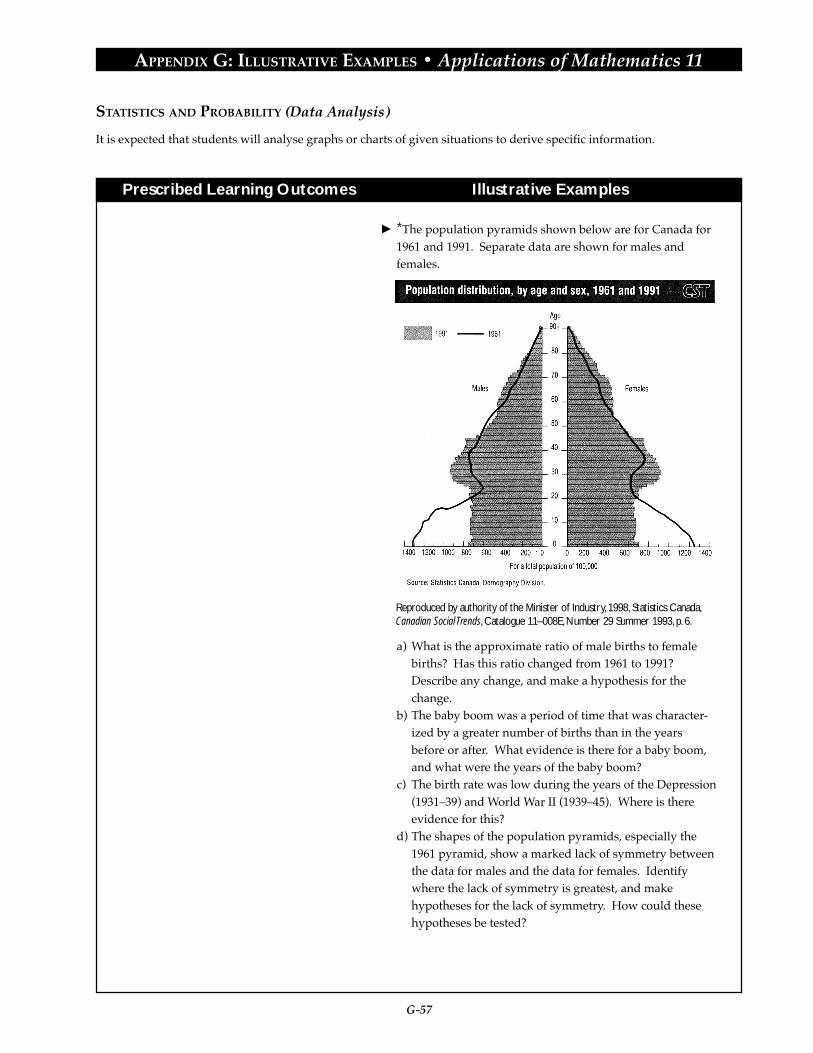
G-57
APPENDIX G: ILLUSTRATIVE EXAMPLES • Applications of Mathematics 11
Prescribed Learning Outcomes Illustrative Examples
STATISTICS AND PROBABILITY (Data Analysis)
It is expected that students will analyse graphs or charts of given situations to derive specific information.
*The population pyramids shown below are for Canada for1961 and 1991. Separate data are shown for males andfemales.
Reproduced by authority of the Minister of Industry, 1998, Statistics Canada,Canadian Social Trends, Catalogue 11–008E, Number 29 Summer 1993, p. 6.
a) What is the approximate ratio of male births to femalebirths? Has this ratio changed from 1961 to 1991?Describe any change, and make a hypothesis for thechange.
b) The baby boom was a period of time that was character-ized by a greater number of births than in the yearsbefore or after. What evidence is there for a baby boom,and what were the years of the baby boom?
c) The birth rate was low during the years of the Depression(1931–39) and World War II (1939–45). Where is thereevidence for this?
d) The shapes of the population pyramids, especially the1961 pyramid, show a marked lack of symmetry betweenthe data for males and the data for females. Identifywhere the lack of symmetry is greatest, and makehypotheses for the lack of symmetry. How could thesehypotheses be tested?

G-58
APPENDIX G: ILLUSTRATIVE EXAMPLES • Applications of Mathematics 11
Prescribed Learning Outcomes Illustrative Examples
STATISTICS AND PROBABILITY (Data Analysis)
It is expected that students will analyse graphs or charts of given situations to derive specific information.
A small store in a shopping mall sells neckties for $50 each.The ties cost the merchant $25 each. Yearly operatingexpenses, such as wages, rent, utilities and insurance, are$125,000.
VC + FC = TC, R – VC = GP, GP – FC = NP,R – TC = NP (or NL)
If the store sold 100 ties, the sales (R) would not pay for theexpenses; therefore, the store would be losing money. At$250 000 in sales, the store’s sales just cover all the cost ofthe goods sold (VC) and expenses (FC). Therefore, the storejust breaks even. If the store sells 9000 ties in a year:a) What is the net profit?b) What is the gross profit?c) What is the fixed cost?
BREAK EVEN ANALYSIS
Number of Ties Sold (000s)
Dol
lars
(000
S)
Net Loss(NL)
Net Profit(NP)
GrossProfit(GP)
Break EvenPoint
Fixed Cost (FC)
Total Cost (TC)
Variable Cost (VC)
R=Revenue (Sales)
1 2 3 4 5 6 7 8 9 10
50
100
150
200
250
300
350
400
450

G-59
APPENDIX G: ILLUSTRATIVE EXAMPLES • Applications of Mathematics 11
Prescribed Learning Outcomes Illustrative Examples
STATISTICS AND PROBABILITY (Data Analysis)
It is expected that students will analyse graphs or charts of given situations to derive specific information.
• design different ways of presenting dataand analyzing results, by focusing on thetruthful display of data and the clarity ofpresentation
Collect an example from a newspaper or magazine in whicha graph has been presented in a potentially deceptivemanner. Identify the source from which the graph wastaken. Explain briefly the ways in which the graph mighthave been deceptively presented and then show ways thedata might be presented more fairly or in a less distortedfashion. Include the graph with the project, and cite itssource.
Excerpted and adapted with permission from Data Analysis and Statistics(Curriculum and Evaluation Addenda Series, Grades 9–12), copyright 1992 by theNational Council of Teachers of Mathematics. All rights reserved.
*Using data for 10-year intervals, as provided in Canada’sPopulation table on the following page, starting in 1921 andending in 1991, design an honest presentation of the datathat can be included in different term papers dealing witheach of the following topics:a) the increase in Canada’s populationb) the westward shift of Canada’s populationc) the population of Saskatchewand) the dominant position of Ontario and Quebec within
Canada.
Explain your choice of data selection and data presentation.

G-60
APPENDIX G: ILLUSTRATIVE EXAMPLES • Applications of Mathematics 11
Prescribed Learning Outcomes Illustrative Examples
Reproduced by authority of the Minister of Industry, 1998, Statistics Canada,Canada Year Book 1994, Catalogue No. 11–402E/1994, p. 112.
STATISTICS AND PROBABILITY (Data Analysis)
It is expected that students will analyse graphs or charts of given situations to derive specific information.

G-61
APPENDIX G: ILLUSTRATIVE EXAMPLES • Applications of Mathematics 11
Prescribed Learning Outcomes Illustrative Examples
STATISTICS AND PROBABILITY (Data Analysis)
It is expected that students will analyse graphs or charts of given situations to derive specific information.
• collect experimental data and use best-fitexponential and quadratic functions, tomake predictions and solve problems
Plot the world population on the vertical axis and the dateon the horizontal axis. Use the graph to predict the datewhen the population reached 4 billion and to predict thepresent population of the world.
Date Population1650
1850
1930
1950
1970
1988
500 000 000
1 100 000 000
2 000 000 000
2 500 000 000
3 600 000 000
5 100 000 000


APPENDIX G
ILLUSTRATIVE EXAMPLES
Applications of Mathematics 12


G-65
APPENDIX G: ILLUSTRATIVE EXAMPLES • Applications of Mathematics 12
Prescribed Learning Outcomes Illustrative Examples
It is expected that students will:
• solve problems that involve a specificcontent area
• solve problems that involve more thanone content area
• solve problems that involve mathematicswithin other disciplines
• analyse problems and identify thesignificant elements
• develop specific skills in selecting andusing an appropriate problem-solvingstrategy or combination of strategieschosen from, but not restricted to, thefollowing:- guess and check- look for a pattern- make a systematic list- make and use a drawing or model- eliminate possibilities- work backward- simplify the original problem- develop alternative original approaches- analyse keywords
• demonstrate the ability to workindividually and co-operatively to solveproblems
• determine that their solutions are correctand reasonable
• clearly communicate a solution to aproblem and the process used to solve it
• interpret their solutions by describingwhat the solution means within thecontext of the original problem
• use appropriate technology to assist inproblem solving
PROBLEM SOLVING
It is expected that students will use a variety of methods to solve real-life, practical, technical, and theoretical problems.
Illustrative Examples for Problem Solving have beenindicated with an asterisk (*) throughout Appendix G.

G-66
APPENDIX G: ILLUSTRATIVE EXAMPLES • Applications of Mathematics 12
Prescribed Learning Outcomes Illustrative Examples
NUMBER (Number Operations)
It is expected that students will describe and apply operations on matrices to solve problems, using technology asrequired
• model and solve problems, includingthose solved previously, usingtechnology to perform matrix operationsof addition, subtraction and scalarmultiplication as required
c CFL Western Division StandingsAgainst Eastern teams
W T L PointsBC 1 0 2 2Calgary 2 0 0 4Saskatchewan 1 0 1 2Edmonton 1 0 2 2
Against Western teamsW T L Points
BC 4 0 0 8Calgary 3 0 2 6Saskatchewan 1 0 4 2Edmonton 1 0 3 2
a) Create a combined table using matrix addition.b) What condition is necessary for there to be a matrix sum
A + B, given original matrices A and B?
c *A store sells items that are tax free, items that have a 7%GST charge on the base price, and items that have both a 7%GST and a 9% PST charge on the base price. A weekend’ssales, before tax, is represented in the table:
a) Determine each amount of tax (GST and PST) collected bythe store on this weekend, using any method.
b) Model and solve the problem, using appropriate matricesderived from the table given.
c) How would you change your matrix model for a newGST rate of 5% and a new PST rate of 12%?
Sales by Tax Category Saturday Sales ($) Sunday Sales ($)Tax free
GST only
GST and PST
700
400
700
500
1250
800

G-67
APPENDIX G: ILLUSTRATIVE EXAMPLES • Applications of Mathematics 12
Prescribed Learning Outcomes Illustrative Examples
Starting Point Length of Tour and Cost 4 Days 7 Days 10 Days 15 Days
Yellowknife
Edmonton
Toronto
Vancouver
$ 740
$1640
$2240
$1940
$1145
$2045
$2645
$2345
$1550
$2450
$3050
$2750
$2225
$3125
$3725
$3425
c An Artic expedition outfitter has the following price list fortours of varying lengths and starting points. The prices arequoted in Canadian dollars.
a) Research to find a table that compares the Canadiandollar to other currencies.
b) Write a row matrix that represents the cost, in US dollars,of the four tours from a Toronto starting point.
c) Write a matrix, in Japanese yen, for the entire price list.
• model and solve consumer and networkproblems, using technology to performmatrix multiplication, as required
c *Singh’s Grocery sells several different kinds of breakfastcereal, each at a different price:- cereal A is 2.65/bx.- cereal B is 3.73/bx.- cereal C is 3.15/bx.- cereal D is 2.99/bx.
On Wednesday, they sold the following:- 5 boxes of cereal A- 8 boxes of cereal B- 7 boxes of cereal C- 10 boxes of cereal D
a) What is Wednesday's total revenues? Model and solvethis problem, using an appropriate row matrix, and anappropriate column matrix, then use matrixmultiplication to solve.
b) Can the total revenue be calculated, if six boxes of cerealE (price unknown) were sold? Justify your response.
c Sales of economy cars were 200 in 1998 and fell by 4% in 1999.Sales of midsize cars were 300 in 1998 and rose by 10% in 1999.Sales of luxury cars were 40 in 1998 and rose by 3% in 1999.a) Represent the 1998 and 1999 sales by appropriate column
matrices.b) Represent the changes from 1998 to 1999 by an
appropriate matrix multiplication.
NUMBER (Number Operations)
It is expected that students will describe and apply operations on matrices to solve problems, using technology asrequired

G-68
APPENDIX G: ILLUSTRATIVE EXAMPLES • Applications of Mathematics 12
Prescribed Learning Outcomes Illustrative Examples
NUMBER (Number Operations)
It is expected that students will describe and apply operations on matrices to solve problems, using technology asrequired
c *Soccer administrators have been experimenting with usingleague standings to discourage tie games, especially those inwhich no goals are scored. The traditional scheme of 2points for a win and 1 point for any tie has been replaced bya scheme that awards 3 points for a win and 1 point for allties. Two already proposed schemes are 3 points for a win, 1point for ties that have goals scored and 0 points for tieswith no goals; and a scheme with 5 points for a win, 3 pointsfor a tie with goals scored and 0 points for a tie with nogoals. In a local soccer league the top four team recordsafter 42 games are:
a) Determine the points for each team, using the traditionalscheme.
b) Model this solution, using matrix multiplication.c) Using matrices, model and determine the points for each
team, using new scheme. Repeat for the other twoproposed schemes.
d) Which of the alternative scoring systems can make theIrish second in the standings?
e) Which of the alternative scoring systems can make theColts second in the standings?
f) Which of the alternative scoring systems can make theJets second in the standings?
g) Design a system that would drop the Tigers out of firstplace.
Wins Ties withGoals
Ties withno Goals
Losses
Tigers
Irish
Colts
Jets
30
24
25
26
2
9
7
1
8
2
0
10
2
7
10
5

G-69
APPENDIX G: ILLUSTRATIVE EXAMPLES • Applications of Mathematics 12
Prescribed Learning Outcomes Illustrative Examples
NUMBER (Number Operations)
It is expected that students will describe and apply operations on matrices to solve problems, using technology asrequired
c A laundry soap is sold in 6 L and 10 L packages. Marketresearch shows that 40% of the users of the 6 L size switch tothe 10 L size for their next purchase, and 20% of the users ofthe 10 L size switch to the 6 L size for their next purchase.a) If the original market share was 60% for 6 L and 40% for
10 L, what is the market share for each size in the nextround of purchases?
b) What is the market share for each size for the third roundof purchases?
c *Air freight is transported among several cities in WesternCanada, using Calgary as the hub. This means that all airfreight either originates in Calgary or is transported throughCalgary.a) Set up a network matrix A for the following cities, using 1
to represent a direct freight transport between two citiesand 0 to indicate there is no direct freight transportbetween two cities.
b) The matrix A2 can represent the network matrix for thoseroutes with exactly one stop. Evaluate the matrix A2.
c) Explain why there is one element equal to 3, nineelements equal to 1, and six elements equal to 0 in thematrix A2 .
Cities in the Network
EdmontonWhitehorse
VancouverCalgary (hub)

G-70
APPENDIX G: ILLUSTRATIVE EXAMPLES • Applications of Mathematics 12
Prescribed Learning Outcomes Illustrative Examples
NUMBER (Number Operations)
It is expected that students will design or use a spreadsheet to make and justify financial decisions.
c *For the following invoice, develop a spreadsheet thatcalculates the totals and that requires the operator to input aminimum number of entries.
• design a financial spreadsheet template toallow users to input their own variables
Item No. Auto Parts Quantity Unit Price Total Labour
1
2
3
Total Labour
Total Parts
PST on Parts (8%)
GST (7%)
TOTAL
Total Parts
26.34
5.25
30.16
26.34
10.50
30.16
67.00
1
2
1
Brake pads
Wheel seals
Rotor
O/H Front Brakes (0.9 hrs. @ 53.00/hr.)
Machined and Replace Rotor (Flat Rate)
47.70
10.10
57.70
67.70
5.36
8.73
138.79
ACME AUTO PARTS
Customer Inquiries

G-71
APPENDIX G: ILLUSTRATIVE EXAMPLES • Applications of Mathematics 12
Prescribed Learning Outcomes Illustrative Examples
• analyse the costs and benefits of rentingor buying an increasing asset such as landor property, under various circumstances
c *The Wong family is faced with a move and has the choiceof buying a home for $145,000 with a $25,000 downpayment, or renting a similar house for $975 per month.Four options are available.1. Buy the house with a 20-year mortgage and continue
investing at the same rate after the mortgage is paid.2. Buy the house with a 30-year mortgage.3. Rent a house and invest the $25,000.4. Rent a house and invest both the $25,000 and the
difference each month between the rent and the mortgagepayment.
Set up analysis spreadsheets that include the followinginputs:a) mortgage interest rate, taking 8.5% as a starting valueb) taxation rate, taking 1.5% of market value as a starting
valuec) annual rent increase, taking 5% per annum as a starting
valued) annual increase in house value, taking 4% per annum as a
starting valuee) investment return, taking 7.0% as a starting value
Try different scenarios, varying from 1 year to 30 years.Summarize circumstances in which buying makes sense,and summarize circumstances when renting makes sense.
NUMBER (Number Operations)
It is expected that students will design or use a spreadsheet to make and justify financial decisions.
c *A car lease runs for 36 months at $305 per month, with adown payment of $1,105, a lease-end value of $7,105 and aninterest rate of 11.6%. Maintenance is the purchaser’sresponsibility. Set up a spreadsheet to include the monthlyvalues of the opening balance, interest paid, lease paymentand closing balance. Use the spreadsheet to answer thefollowing questions.a) What part of the $305 is used to pay the interest on the
$7,105?b) What total price is being charged for the car?c) What is the change in the monthly lease payment, if the
lease-end value is reduced to $5,700?d) What is the monthly payment for a straight purchase over
36 months with a 20% down payment?e) What is the annual percentage depreciation rate assumed
with the $7,105 lease-end value?
• analyse the costs and benefits of leasingor buying a decreasing asset, such as avehicle or computer, under variouscircumstances
G-72
APPENDIX G: ILLUSTRATIVE EXAMPLES • Applications of Mathematics 12
Prescribed Learning Outcomes Illustrative Examples
NUMBER (Number Operations)
It is expected that students will design or use a spreadsheet to make and justify financial decisions.
• analyse an investment portfolio applyingsuch concepts as interest rate, rate ofreturn and total return
c The time needed for an investment to double in value can beestimated using the rule of 72, which states that n = 72
iwhere i is the annual percentage interest rate and n thenumber of years.a) Compare the rule of 72 doubling time with the exact
doubling time for the following interest rates:- 4% per annum, compounded annually- 8% per annum, compounded annually- 24% per annum, compounded annually
b) What general conclusion can be drawn as to the accuracyof the rule of 72 calculations?
c Annette makes several investments in her RRSP. She invests$5,000 in a GIC paying 6%, compounded semi-annually,when she is 25 years old. At the age of 30, she places $12,000in a GIC paying 8 1/2 %, compounded annually. On her 35th
birthday, she invests $8,000 in a GIC paying 7%, compoundsemi-annually.a) What will her GICs be worth when she is 65, if she keeps
them invested at the rates given until her 65th birthday?b) What is the average annual rate of return over the last 30
years of the investment?
c An investment of $10,000 is held from December 31, 1995 toDecember 31, 1998. It contains 75% Canadian stocks thattrack the Toronto Stock Exchange (TSE) 300 composite index,and 25% invested in guaranteed investment certificates(GICs) that pay 6.5% compounded annually. On December31, 1995 the TSE 300 composite index was at 4714. OnDecember 31, 1998, the TSE 300 composite index was at6486.a) What was the value of the total portfolio on December 31,
1998?b) What average annual rate of return does this represent?

G-73
APPENDIX G: ILLUSTRATIVE EXAMPLES • Applications of Mathematics 12
Prescribed Learning Outcomes Illustrative Examples
• describe periodic events, including thoserepresented by sinusoidal curves, usingthe terms amplitude, period, maximumand minimum values, vertical andhorizontal shift
Time(days after May1)60
10
-10
-20
-30
-60-180-240 120
(85, 15)
(-100, -30)
Temperature(˚C)
c A temperature-time graph was drawn for a northernSaskatchewan town, using long-term average data for eachdate of a calendar year. The variable plotted on thehorizontal axis is the calendar date, with May 1 as zero andthe unit of measure being days. The variable plotted on thevertical axis is the temperature in degrees Celsius. The graphis dramn below. Estimate the:a) amplitudeb) periodc) average maximun and minimum valuesd) the average temperature for the yeare) average date for the maximum temperaturef) average date for the minimum temperature
PATTERNS AND RELATIONS (Patterns)
It is expected that students will generate and analyse cyclic, recursive, and fractal patterns.

G-74
APPENDIX G: ILLUSTRATIVE EXAMPLES • Applications of Mathematics 12
Prescribed Learning Outcomes Illustrative Examples
c *The following are graphs showing the patterns producedon an oscilloscope when four different musical instrumentsare played.
From Fundmentals of Physics by Martindale et al. Reprinted by permission of ITPNelson Canada.
For each instrument:a) estimate the amplitudeb) estimate the periodc) sketch an approximate form for the graph, if the
instrument is played louderd) sketch an approximate form for the graph, if the
instrument is used to play a higher note
Voltage1.0
0.005
violin
Time(s)
-1.0
Voltage1.0
0.005
tuning fork
Time(s)
-1.0
Voltage1.0
0.005
clarinet
Time(s)
-1.0
Voltage1.0
0.005
organ pipe
Time(s)
-1.0
PATTERNS AND RELATIONS (Patterns)
It is expected that students will generate and analyse cyclic, recursive, and fractal patterns.

G-75
APPENDIX G: ILLUSTRATIVE EXAMPLES • Applications of Mathematics 12
Prescribed Learning Outcomes Illustrative Examples
PATTERNS AND RELATIONS (Patterns)
It is expected that students will generate and analyse cyclic, recursive, and fractal patterns.
• collect sinusoidal data; graph the datausing technology, and represent the datawith a best fit equation of the form:- y = a sin (bx + c) + d
• use best fit sinusoidal equations, andtheir associated graphs, to makepredictions (interpolation,extrapolation)
cResearch the sunrise time, each day, for a period of oneyear, and graph it. From your graph, determine the time ofsunrise for March 12.
c Collect data from real-world situations, such as:a) hours of daylightb) low tide and high tidec) average low and average high temperatures on different
dates of the year
Plot the data, and determine an approximate equation forthe data in the form of: y = a sin (bx + c) + d.
c *Sketch a graph, and build an equation to represent thefollowing situation.
From Environment Canada, find the average dailymaximum temperatures on the 1st and 15th day of eachmonth for one year, in a city of your choice. Use asinusoidal equation to predict:a) the highest daily average maximum temperatureb) the lowest daily average maximum temperaturec) what time of year will the highest temperature will occurd) what time of year will the lowest temperature will occur

G-76
APPENDIX G: ILLUSTRATIVE EXAMPLES • Applications of Mathematics 12
Prescribed Learning Outcomes Illustrative Examples
PATTERNS AND RELATIONS (Patterns)
It is expected that students will generate and analyse cyclic, recursive, and fractal patterns.
• use technology to generate and graphsequences that model real-life phenomena
c *A mild infection spreads through a school. On any givenday 10% of the uninfected population becomes infected, and20% of the infected population is cured. Once cured, thereis zero chance of further infection. On the first day ofschool, 100 students are infected, 900 students areuninfected, and zero students are cured.a) Track the epidemic for 30 days.b) Graph numbers of infected, uninfected, and cured as a
function of time for 30 days.
Fig. 1
Fig. 2
• use technology to construct a fractalpattern by repeatedly applying aprocedure to a geometric figure
c The following example is the Koch snowflake curve.Construct an equilateral triangle (Fig. 1). Trisect each side,construct an equilateral triangle on each middle third, anddelete the middle third (Fig. 2).
For each segment in Fig. 2, repeat the above.
c Construct your own fractal pattern.
c *For the previous illustrative example, predict the perimeterof the fifth pattern.
• use the concept of self-similarity tocompare and/or predict the perimeters,areas and volumes of fractal patterns
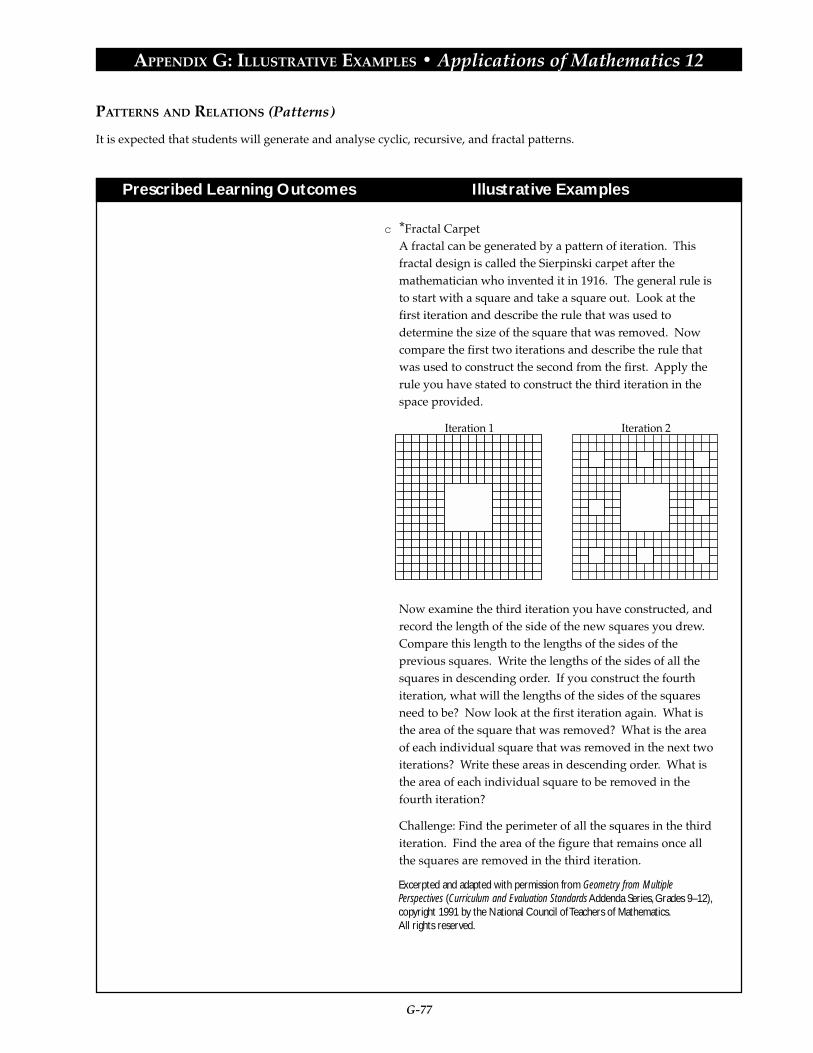
G-77
APPENDIX G: ILLUSTRATIVE EXAMPLES • Applications of Mathematics 12
Prescribed Learning Outcomes Illustrative Examples
PATTERNS AND RELATIONS (Patterns)
It is expected that students will generate and analyse cyclic, recursive, and fractal patterns.
c *Fractal CarpetA fractal can be generated by a pattern of iteration. Thisfractal design is called the Sierpinski carpet after themathematician who invented it in 1916. The general rule isto start with a square and take a square out. Look at thefirst iteration and describe the rule that was used todetermine the size of the square that was removed. Nowcompare the first two iterations and describe the rule thatwas used to construct the second from the first. Apply therule you have stated to construct the third iteration in thespace provided.
Now examine the third iteration you have constructed, andrecord the length of the side of the new squares you drew.Compare this length to the lengths of the sides of theprevious squares. Write the lengths of the sides of all thesquares in descending order. If you construct the fourthiteration, what will the lengths of the sides of the squaresneed to be? Now look at the first iteration again. What isthe area of the square that was removed? What is the areaof each individual square that was removed in the next twoiterations? Write these areas in descending order. What isthe area of each individual square to be removed in thefourth iteration?
Challenge: Find the perimeter of all the squares in the thirditeration. Find the area of the figure that remains once allthe squares are removed in the third iteration.
Excerpted and adapted with permission from Geometry from MultiplePerspectives (Curriculum and Evaluation Standards Addenda Series, Grades 9–12),copyright 1991 by the National Council of Teachers of Mathematics.All rights reserved.
Iteration 1 Iteration 2

G-78
APPENDIX G: ILLUSTRATIVE EXAMPLES • Applications of Mathematics 12
Prescribed Learning Outcomes Illustrative Examples
PATTERNS AND RELATIONS (Patterns)
It is expected that students will generate and analyse cyclic, recursive, and fractal patterns.
c *The Sierpinski triangle can be created by using dilations andisometries. You may begin with an arbitrary triangle. Anequilateral triangle is used for the procedures described below.a) Draw an equilateral triangle.b) Reduce the triangle by a factor of 1/2. Make three copies
of the reduced triangle.c) Place the three reduced similar triangles on the original,
one at each vertex.d) Eliminate the remaining portion of the original triangle
by blackening it.
Your work should result in the figure shown here.
Answer the following questions:a) Let the area of the original triangle be 1 area unit. What
area remains? What area has been removed?b) Let the side of the original triangle be 1 length unit.
What is the perimeter of the figure with the dark regionremoved?
Repeat steps a) through d) of the original procedure for eachof the triangular regions remaining in the figure shown.Sketch the result of your work.
Answer the following questions:a) What is the area of the remaining triangular region?b) What is the perimeter of the new “holey” triangular
region?c) What would the next iteration of the procedure look like?
Make a sketch.d) Write an expression for the area of the Sierpinski triangle
after carrying out the procedure n times.e) Write an expression for the perimeter of the Sierpinski
triangle after carrying out the procedure n times.f) How would your expressions differ, if you began with a
triangle other than an equilateral triangle?
Excerpted and adapted with permission from Geometry from Multiple Perspectives(Curriculum and Evaluation Standards Addenda Series, Grades 9–12), copyright1991 by the National Council of Teachers of Mathematics. All rights reserved.

G-79
APPENDIX G: ILLUSTRATIVE EXAMPLES • Applications of Mathematics 12
Prescribed Learning Outcomes Illustrative Examples
PATTERNS AND RELATIONS (Patterns)
It is expected that students will generate and analyse cyclic, recursive, and fractal patterns.
c Construct a cylinder with the dimensions: r = 10 cm, h = 20cm. A second figure is constructed by halving the previousradius and height. A third is constructed by halving thesecond and so on.a) Predict the lateral surface area and the volume of the
sixth pattern.b) Write an expression for the lateral surface area after
carrying out the procedure n times.c) Write an expression for the volume after carrying out the
procedure n times.
h
r
r2
h2

G-80
APPENDIX G: ILLUSTRATIVE EXAMPLES • Applications of Mathematics 12
Prescribed Learning Outcomes Illustrative Examples
SHAPE AND SPACE (Measurement)
It is expected that students will analyse objects, shapes, and processes to solve cost and design problems.
c Determine the volume of the plastic book end shown below.
If the book end is constructed using an injection mold, findthe materials cost, if the plastic ingredients cost 6¢/cm2.
c *The following diagram shows a structure for enclosing acable system. All the angles are right angles and the lengthsare in metres.
A special latex coating is applied to all outside surfaces ofthe structure. What is the cost of the latex coating, if itcosts 28¢/cm2?
• use dimensions and unit prices to solveproblems involving perimeter, area andvolume
12 cm
12 cm
8 cm
8 cm
2 cm
2 cm
10 cm
3
32
1
1
1
1 1
c A swimming pool is 50 m by 21 m. The deep end is 4.0 mdeep and extends out 12 m. The shallow end is 1.2 m deepand extends out 12 m. There is a uniform slope connectingthe deep and shallow ends.a) Draw scale diagrams showing the top view and the side
view of the pool.b) Calculate the cost of filling it with water at $2.00/m3.c) Waterproofing of the underwater surfaces costs $17/m2.
Determine the cost of waterproofing.
• solve problems involving estimation andcosting for objects, shapes or processeswhen a design is given

G-81
APPENDIX G: ILLUSTRATIVE EXAMPLES • Applications of Mathematics 12
Prescribed Learning Outcomes Illustrative Examples
• design an object, shape, layout or processwithin a specified budget
c *To satisfy the building code, an auditorium has to have1200 m2 of washroom space. In a washroom for males, theaverage space needed is 1.9 m2 per user and the averageusage time is 97 s. In a washroom for females, the averagespace needed is 2.4 m2 per user and the average usage timeis 145 s. Determine the required washroom space:a) on the basis of equal areas for males and femalesb) on the basis of equal users per hour for males and females
SHAPE AND SPACE (Measurement)
It is expected that students will analyse objects, shapes, and processes to solve cost and design problems.
c *Tin plate for making cylindrical cans comes in sheets thatare 240 cm by 160 cm and costs $3.20 per sheet. Cans are 6cm in diameter and 11 cm high, and they have 3 seals each.Seals cost 0.8¢ each to make. One sheet of tin plate is usedfor making pieces for ends, and two sheets are used formaking pieces for sides.a) How many ends and how many sides can be made from
the three sheets of tin plate?b) How many cans can be made from the three sheets, and
what is the cost per can?c) Is there another way of making more cans from the three
sheets, or the same number of cans from less tin plate?d) How much money is saved doing it the second way?
c To produce a voters’ list for a city riding, a sum of $1.70 pervoter is allocated. Four methods of enumerating arepossible:
For a riding of 40 000 potential voters, find the maximumnumber of voters who can be enumerated within the budgetand the minimum budget needed to be sure of enumerating98% of the potential voters.

G-82
APPENDIX G: ILLUSTRATIVE EXAMPLES • Applications of Mathematics 12
Prescribed Learning Outcomes Illustrative Examples
c A window cleaner has been asked by the owner of a largeoffice tower to submit a quotation for cleaning the windowsof the building. The window cleaner has the followinginformation:a) there are 24 floorsb) there are 14 windows per side on each floorc) there are 4 sides to the building
From experience, the window cleaner knows that thetransfer time between windows on the same floor and sameside of the building is 60 seconds. The transfer time betweensides of the building is 120 seconds and between floors is 30seconds. The time to clean one window is 120 seconds. Thewindow cleaner has a base charge of $120. The maximumperiod of time he works at one stretch is 3 hours, then hetakes a 30 minute rest. In addition to his rate of $25/hour,he wants to make 25% profit from the job for reinvestmentin his business. What would be the best quote?
SHAPE AND SPACE (Measurement)
It is expected that students will analyse objects, shapes, and processes to solve cost and design problems.
• use simplified models to estimate thesolutions to complex measurementproblems
c Obtain a Mercator projection map and a polar projectionmap of Canada. Use a transparent overlay grid to estimatethe area of the Yukon by counting squares.a) Which type of map gives the most accurate estimate of
the area? Explain the sources of error when the estimatesare compared to the exact area given in a reference source.
b) Estimate the area by splitting it into rectangles andtriangles, and compare this method to the previous oneyou used.
Which method is most accurate? Which type of map givesthe most reliable estimate for the area of the Yukon? Whereare the main sources of error in the estimate?
c *A water tank is a sphere of diameter 3.6 m.a) Estimate the volume of water in the tank, if the depth of
water is 24 cm.b) Describe the estimation process you used.
180 cm
24 cm

G-83
APPENDIX G: ILLUSTRATIVE EXAMPLES • Applications of Mathematics 12
Prescribed Learning Outcomes Illustrative Examples
SHAPE AND SPACE (3-D objects and 2-D shapes)
It is expected that students will solve problems involving polygons and vectors, including both 3-D and 2-D applications.
• use appropriate terminology to describe:- vector (i.e., magnitude, direction)- scalar quantities (i.e., magnitude)
c A car at location A is travelling toward location B. Thespeed is constant at 50 km/h.
a) Describe the speed in terms of a scalar.b) Describe the velocity in terms of a vector.
NorthB
A
c The vector a represents a velocity of 40 km/h east. Make ascale drawing of each of the following vectors:a) 3 ab) 7 ac) –3 ad) 1.6 a + 4 a
What velocities do each of these vectors represent?
• assign meaning to the multiplication of avector by a scalar
c
Using the above diagram of a rhombus ACEG, determine thevector addition of each of the following:
c *A ski jumper encounters a horizontal friction of 85 Nbackward, a vertical weight of 750 N downward and an airresistance of 340 N upward. Draw the vector addition ofthese forces, and use the drawing to find the magnitude anddirection of the resultant force.
• determine the magnitude and direction ofa resultant vector, using triangle orparallelogram methods
GF E
DH
A CB
a)AH + HG b)GF + BC c)GF + CB d)FD + DE.

G-84
APPENDIX G: ILLUSTRATIVE EXAMPLES • Applications of Mathematics 12
Prescribed Learning Outcomes Illustrative Examples
• model and solve problems in 2-D andsimple 3-D, using vector diagrams andtechnology
c A boat is traveling across a river with a forward velocity of14 m/s, and there is a current of 3 m/s down the river.How fast is the boat traveling?
c *John and Marie are using two ropes held horizontally topull a rock on a horizontal plane.
a) Draw a vector diagram to estimate the magnitude anddirection of the resultant applied force.
b) Verify the estimate by a calculation.c) If the rock does not move, what is the magnitude and
direction of the force of friction?
Rock
Top View
500 N (Marie)
400 N (John)
25˚
25˚35˚
c Model, by drawing a diagram, Jack’s jogging route, if hejogs north at 15 km/h for 30 minutes and then turns eastand jogs at 12 km/h for 20 minutes. How far has he joggedin total? How far is he from his starting point? In whatdirection does he need to go to return to the start by theshortest path?
c *An aircraft flying horizontally on a heading of 285º ispushed by a wind from 195º. Angles are measuredclockwise from north. The indicated air speed of the aircraftis 300 km/h. The wind is constant at 90 km/h. After 1 hourand 15 minutes of flight, what will be the aircraft’s changein location?
c *An aircraft flies at 80 m/s due north and climbs at an angleof 20º with the horizontal. A horizontal wind blows fromwest to east at 30 m/s.a) What is the magnitude of the velocity of the aircraft?b) What is the angle that the aircraft’s track makes with the
horizontal?
SHAPE AND SPACE (3-D objects and 2-D shapes)
It is expected that students will solve problems involving polygons and vectors, including both 3-D and 2-D applications.
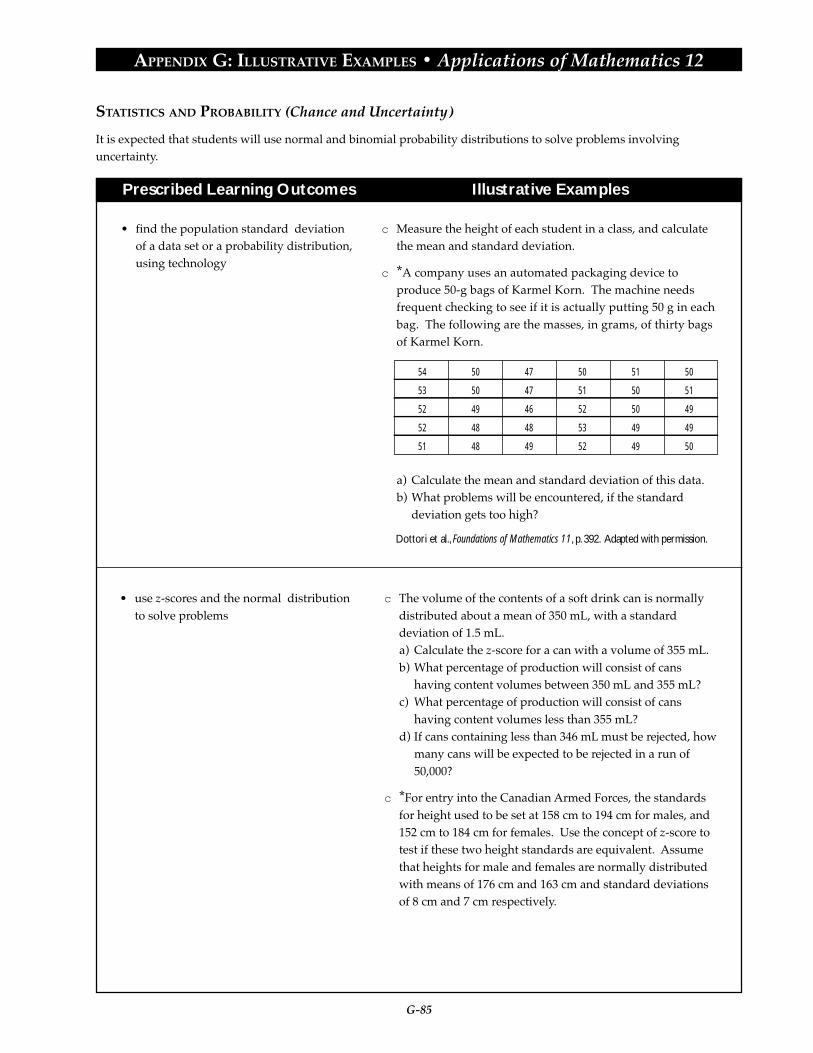
G-85
APPENDIX G: ILLUSTRATIVE EXAMPLES • Applications of Mathematics 12
Prescribed Learning Outcomes Illustrative Examples
STATISTICS AND PROBABILITY (Chance and Uncertainty)
It is expected that students will use normal and binomial probability distributions to solve problems involvinguncertainty.
• find the population standard deviationof a data set or a probability distribution,using technology
c Measure the height of each student in a class, and calculatethe mean and standard deviation.
c *A company uses an automated packaging device toproduce 50-g bags of Karmel Korn. The machine needsfrequent checking to see if it is actually putting 50 g in eachbag. The following are the masses, in grams, of thirty bagsof Karmel Korn.
a) Calculate the mean and standard deviation of this data.b) What problems will be encountered, if the standard
deviation gets too high?
Dottori et al., Foundations of Mathematics 11, p. 392. Adapted with permission.
54
53
52
52
51
50
50
49
48
48
47
47
46
48
49
50
51
52
53
52
51
50
50
49
49
50
51
49
49
50
c The volume of the contents of a soft drink can is normallydistributed about a mean of 350 mL, with a standarddeviation of 1.5 mL.a) Calculate the z-score for a can with a volume of 355 mL.b) What percentage of production will consist of cans
having content volumes between 350 mL and 355 mL?c) What percentage of production will consist of cans
having content volumes less than 355 mL?d) If cans containing less than 346 mL must be rejected, how
many cans will be expected to be rejected in a run of50,000?
c *For entry into the Canadian Armed Forces, the standardsfor height used to be set at 158 cm to 194 cm for males, and152 cm to 184 cm for females. Use the concept of z-score totest if these two height standards are equivalent. Assumethat heights for male and females are normally distributedwith means of 176 cm and 163 cm and standard deviationsof 8 cm and 7 cm respectively.
• use z-scores and the normal distributionto solve problems

G-86
APPENDIX G: ILLUSTRATIVE EXAMPLES • Applications of Mathematics 12
Prescribed Learning Outcomes Illustrative Examples
c *A sample of 122 people gives a mean body temperature of36.8°C, with a standard deviation of 0.35°C. Assuming anormal distribution, find:a) the expected number of people with temperatures above
37.0°Cb) the expected number of people with temperatures below
36.0°C
Also, estimate the range of temperatures contained withinthe sample.
c In the general population, the IQ scores of individuals isnormally distributed with a mean of 100 and a standarddeviation of 10. If a large group of people is tested:a) What proportion of this group is expected to have IQs
between 100 and 120?b) What is the probability that an individual in the group
has an IQ greater than 120?
STATISTICS AND PROBABILITY (Chance and Uncertainty)
It is expected that students will use normal and binomial probability distributions to solve problems involvinguncertainty.
• use the normal approximation to thebinomial distribution to solve problemsinvolving probability calculations for largesamples (where npq > 10)
c Based on past experience, a car salesperson will completesales to 10% of the customers that enter the showroom. Ifthe salesperson has 200 customers in the next month,establish a symmetric 95% confidence interval for thenumber of completed sales for the month.
c *From a sample of 250, pollsters estimate that the number ofdecided voters in favour of a particular provincial law is64%, and the number opposed is 36%.
Discuss how the percentage margin of error changes as thesample size changes.
c A true/false test has 40 questions. Assume all questions areanswered by guessing. Use a normal distribution to estimatethe probability of guessing 25 or more questions correctly.

G-87
APPENDIX G: ILLUSTRATIVE EXAMPLES • Applications of Mathematics 12
Prescribed Learning Outcomes Illustrative Examples
STATISTICS AND PROBABILITY (Chance and Uncertainty)
It is expected that students will solve problems based on the counting of sets, using techniques such as thefundamental counting principle, permutations, and combinations.
• solve pathway problems, interpretingand applying any constraints
c Given the following “pinball” situation, what is theprobability of the ball reaching each of the exits?
What assumptions are made in the solution?
A B C D E Exits
Drop Ball Here
c Joe has three different shirts, two different pairs of pants andfive different pairs of shoes. List all possible outfits in such away as to ensure that all have been counted and none havebeen counted twice. How many possible outfits are there?Use the fundamental counting principle to determine thenumber of outfits there should be. Do your answers match?
c *An airline pilot reported that in seven days she spent oneday in Winnipeg, one day in Regina, two days in Edmontonand three days in Yellowknife. How many differentitineraries are possible? What difference would it make ifthe first day and the last day were spent in Yellowknife?
• use the fundamental counting principleto determine the number of differentways to perform multistep operations
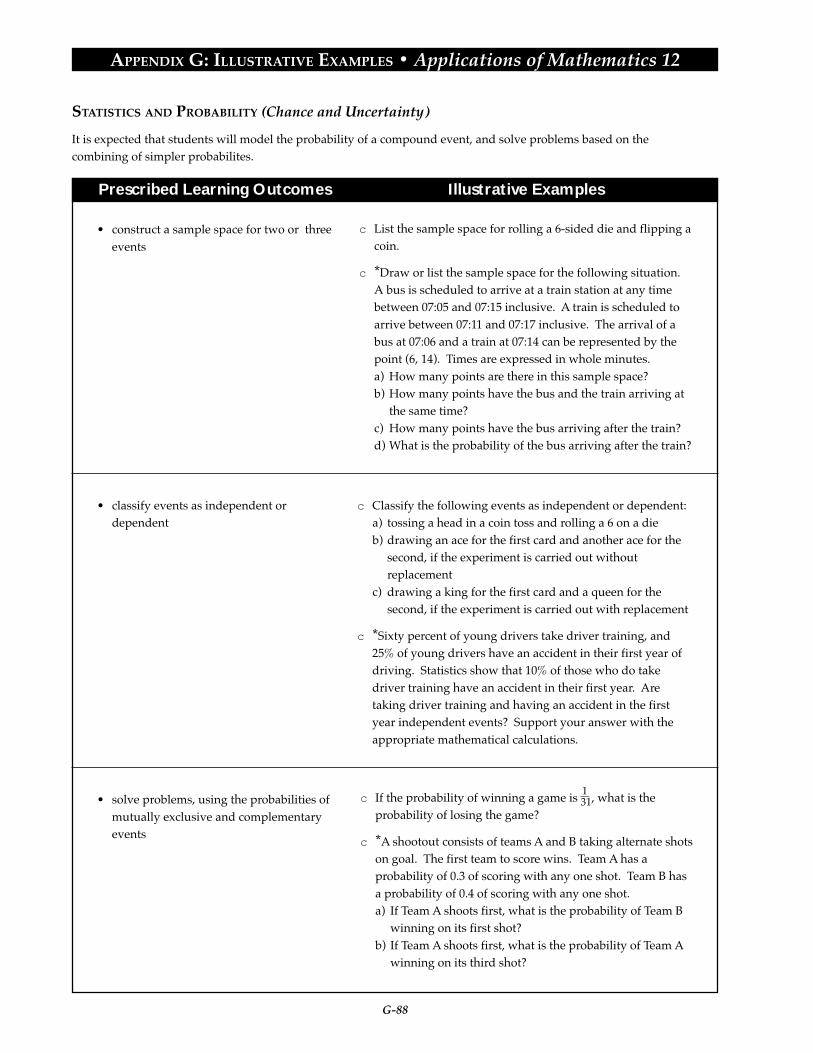
G-88
APPENDIX G: ILLUSTRATIVE EXAMPLES • Applications of Mathematics 12
Prescribed Learning Outcomes Illustrative Examples
STATISTICS AND PROBABILITY (Chance and Uncertainty)
It is expected that students will model the probability of a compound event, and solve problems based on thecombining of simpler probabilites.
• construct a sample space for two or threeevents
c List the sample space for rolling a 6-sided die and flipping acoin.
c *Draw or list the sample space for the following situation.A bus is scheduled to arrive at a train station at any timebetween 07:05 and 07:15 inclusive. A train is scheduled toarrive between 07:11 and 07:17 inclusive. The arrival of abus at 07:06 and a train at 07:14 can be represented by thepoint (6, 14). Times are expressed in whole minutes.a) How many points are there in this sample space?b) How many points have the bus and the train arriving at
the same time?c) How many points have the bus arriving after the train?d) What is the probability of the bus arriving after the train?
• classify events as independent ordependent
c Classify the following events as independent or dependent:a) tossing a head in a coin toss and rolling a 6 on a dieb) drawing an ace for the first card and another ace for the
second, if the experiment is carried out withoutreplacement
c) drawing a king for the first card and a queen for thesecond, if the experiment is carried out with replacement
c *Sixty percent of young drivers take driver training, and25% of young drivers have an accident in their first year ofdriving. Statistics show that 10% of those who do takedriver training have an accident in their first year. Aretaking driver training and having an accident in the firstyear independent events? Support your answer with theappropriate mathematical calculations.
• solve problems, using the probabilities ofmutually exclusive and complementaryevents
c If the probability of winning a game is 131, what is the
probability of losing the game?
c *A shootout consists of teams A and B taking alternate shotson goal. The first team to score wins. Team A has aprobability of 0.3 of scoring with any one shot. Team B hasa probability of 0.4 of scoring with any one shot.a) If Team A shoots first, what is the probability of Team B
winning on its first shot?b) If Team A shoots first, what is the probability of Team A
winning on its third shot?

APPENDIX G
ILLUSTRATIVE EXAMPLES
Essentials of Mathematics 10


G-91
APPENDIX G: ILLUSTRATIVE EXAMPLES • Essentials of Mathematics 10
Prescribed Learning Outcomes Illustrative Examples
It is expected that students will:
• solve problems that involve a specificcontent area
• solve problems that involve more thanone content area
• solve problems that involve mathematicswithin other disciplines
• analyse problems and identify thesignificant elements
• develop specific skills in selecting andusing an appropriate problem-solvingstrategy or combination of strategieschosen from, but not restricted to, thefollowing:- guess and check- look for a pattern- make a systematic list- make and use a drawing or model- eliminate possibilities- work backward- simplify the original problem- develop alternative original approaches- analyse keywords
• demonstrate the ability to workindividually and co-operatively to solveproblems
• determine that their solutions are correctand reasonable
• clearly communicate a solution to aproblem and the process used to solve it
• interpret their solutions by describingwhat the solution means within thecontext of the original problem
• use appropriate technology to assist inproblem solving
PROBLEM SOLVING
It is expected that students will use a variety of methods to solve real-life, practical, technical, and theoretical problems.
Illustrative Examples for Problem Solving have beenindicated with an asterisk (*) throughout Appendix G.

G-92
APPENDIX G: ILLUSTRATIVE EXAMPLES • Essentials of Mathematics 10
Prescribed Learning Outcomes Illustrative Examples
PERSONAL BANKING
It is expected that students will describe consumer banking services, including types of accounts and their uses.
It is expected that students will:
• name and describe various types ofcommonly used consumer bank accounts
• complete various banking forms• describe the use of a bank card for
automated teller machines (ATMs) anddebit payments
• identify different types of bank servicecharges and their relative costs
There are errors in the way the following cheque is written.Can you identified the errors?
Solution:The errors are• in the currency area — write $12 as 12. 00• place line before and after written monetary amount—
__________________ twelve__________________xx/100
Terry Atwal is depositing the following items into herchecking account 22-763-4 today. Currency: 20 toonies; five$10 bills; 20 quarters; four dimes; six pennies; threecheques of $14.67, $53.26, and $5.64. Filled in a deposit slipfor her.
JOHN DOEANY STREETCITY, PROVINCEPOSTAL CODE
ANY BANKYOUR TOWNPROVINCE
Pay to theorder of _________________________________________________________________ $ ___________________
________________________________________________________________________________________ DOLLARS
______________________ 19 ____
_____________________________
:26167...001: 1234...567...
December 26 97
A. Baron
twelve
John Doe
12
____________________ANY STREETCITY, PROVINCEPOSTAL CODE
ANY CREDIT UNIONYOUR TOWNPROVINCE
CURRENCYCOIN
CHEQUES ORCOUPONS
TOTALLESS Received in Cash
Please sign in presence of Teller
AMOUNT OF DEPOSIT $
______________________ 19 ____
__________________________________DEPOSITED BY
ACCT NO. _______________

G-93
APPENDIX G: ILLUSTRATIVE EXAMPLES • Essentials of Mathematics 10
Prescribed Learning Outcomes Illustrative Examples
Complete the following cheque register.Balance: Sept. 1, $767.34Cheques: #26 Sept. 4 to Sports Wear for $50.76; #27 Sept. 4to Value Foods for $54.90; #28 Sept 10 to K. Turner for$200.00; #29 Sept. 21 to Holm’s Rental Agency for $535.00 ;#30 Sept. 23 to CD Music for $26.92; Oct. 2 #31 to FitnessPhysio for $31. 00Deposits: Sept. 5 $535.00; Oct. 2 $250.00
PERSONAL BANKING
It is expected that students will describe consumer banking services, including types of accounts and their uses.
• reconcile financial statements, such ascheque books
DATE CHEQUENO.
CHEQUEAMOUNT
DEPOSITAMOUNT
DEDUCTCHEQUES
ADD DEPOSITS
BALANCE FORWARDCHEQUES ISSUED TOOR DESCRIPTION OF DEPOSIT
CHEQUE –DEPOSIT +
BALANCE
TO
FOR
CHEQUE –DEPOSIT +
BALANCE
TO
FOR
CHEQUE –DEPOSIT +
BALANCE
TO
FOR
CHEQUE –DEPOSIT +
BALANCE
TO
FOR
CHEQUE –DEPOSIT +
BALANCE
TO
FOR
CHEQUE –DEPOSIT +
BALANCE
TO
FOR
CHEQUE –DEPOSIT +
BALANCE
TO
FOR
CHEQUE –DEPOSIT +
BALANCE
TO
FOR
CHEQUE –DEPOSIT +
BALANCE
TO
FOR
CHEQUE –DEPOSIT +
BALANCE
TO
FOR

G-94
APPENDIX G: ILLUSTRATIVE EXAMPLES • Essentials of Mathematics 10
Prescribed Learning Outcomes Illustrative Examples
PERSONAL BANKING
It is expected that students will describe consumer banking services, including types of accounts and their uses.
DATE
20
DAY MO.
BALANCE FORWARD 08 350 00
BALANCECREDITSDEBITSDESCRIPTION
DEPOSITCHEQUE #98CHEQUE #99CHEQUE #100CHEQUE #101DEPOSITDEPOSITCHEQUE #102SERVICE CHARGE
ACCU CREDIT
1021412456
1258
452
215280
90128870
4575
51
0000
516149619191914671
2125
27
30
31
0808
08
08
08
802699558533476691971846837
*David Hartley had a balance of $231.18 in his account. OnSeptember 30, he wrote cheque #344 for $198.00 to Sears. Onthe same day, he received his pay for $488.90. October 1, hewrote a cheque #345 for $385 to Lanes Rental Group for hisapartment. What is his balance?
*Complete a reconciliation statement form for this account
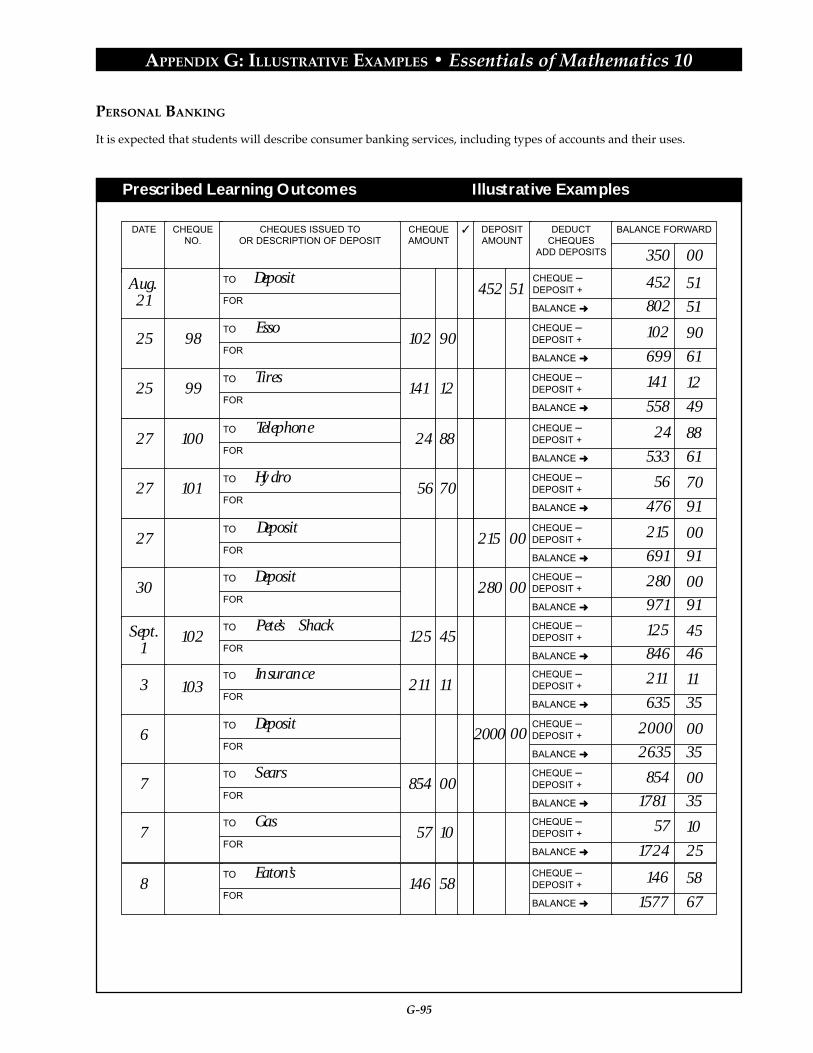
G-95
APPENDIX G: ILLUSTRATIVE EXAMPLES • Essentials of Mathematics 10
Prescribed Learning Outcomes Illustrative Examples
PERSONAL BANKING
It is expected that students will describe consumer banking services, including types of accounts and their uses.
DATE CHEQUENO.
CHEQUEAMOUNT
DEPOSITAMOUNT
DEDUCTCHEQUES
ADD DEPOSITS
BALANCE FORWARD
350 00
CHEQUES ISSUED TOOR DESCRIPTION OF DEPOSIT
Aug.21
452CHEQUE –DEPOSIT +
BALANCE
452
802
TO DepositFOR
51
51
25 98 102 90CHEQUE –DEPOSIT +
BALANCE
102
699
TO EssoFOR
90
61
25 99 141 12CHEQUE –DEPOSIT +
BALANCE
141
558
TO TiresFOR
12
49
27 100 24 88CHEQUE –DEPOSIT +
BALANCE
24
533
TO TelephoneFOR
88
61
27 101 56 70 CHEQUE –DEPOSIT +
BALANCE
56
476
TO HydroFOR
70
91
27 215 CHEQUE –DEPOSIT +
BALANCE
215
691
TO DepositFOR
00
91
30 280CHEQUE –DEPOSIT +
BALANCE
280
971
TO DepositFOR
00
91
Sept.1
102 125 45CHEQUE –DEPOSIT +
BALANCE
125
846
TO Pete’s ShackFOR
45
46
3 103 211 11CHEQUE –DEPOSIT +
BALANCE
211
635
TO InsuranceFOR
11
35
6 2000CHEQUE –DEPOSIT +
BALANCE
2000
2635
TO DepositFOR
00
35
51
00
00
00
7 854 00 CHEQUE –DEPOSIT +
BALANCE
854
1781
TO SearsFOR
00
35
7 57 10 CHEQUE –DEPOSIT +
BALANCE
57
1724
TO GasFOR
10
25
8 146 58 CHEQUE –DEPOSIT +
BALANCE
146
1577
TO Eaton’sFOR
58
67

G-96
APPENDIX G: ILLUSTRATIVE EXAMPLES • Essentials of Mathematics 10
Prescribed Learning Outcomes Illustrative Examples
STATEMENT OF RECONCILIATION
Bank Statement
FINAL BALANCE shown on this bank statement
ADD DEPOSITS made since statementdate
Subtotal ________________Subtract outstanding cheques
FINAL BALANCE: ________________________
Chequebook Record
FINAL BALANCE shown in chequebook record
SUBTRACT all withdrawals which are not shownin chequebook record
FINAL BALANCE: ________________________
PERSONAL BANKING
It is expected that students will describe consumer banking services, including types of accounts and their uses.
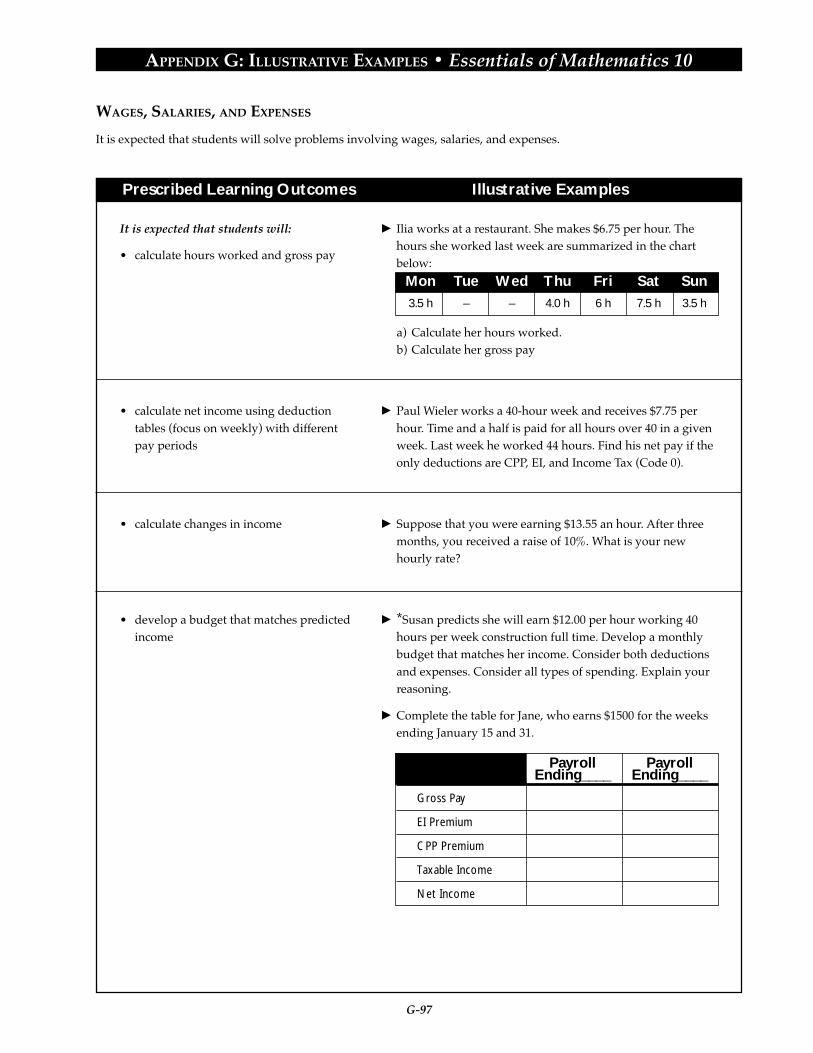
G-97
APPENDIX G: ILLUSTRATIVE EXAMPLES • Essentials of Mathematics 10
Prescribed Learning Outcomes Illustrative Examples
It is expected that students will:
• calculate hours worked and gross pay
• calculate net income using deductiontables (focus on weekly) with differentpay periods
• calculate changes in income
• develop a budget that matches predictedincome
WAGES, SALARIES, AND EXPENSES
It is expected that students will solve problems involving wages, salaries, and expenses.
Ilia works at a restaurant. She makes $6.75 per hour. Thehours she worked last week are summarized in the chartbelow:
a) Calculate her hours worked.b) Calculate her gross pay
Paul Wieler works a 40-hour week and receives $7.75 perhour. Time and a half is paid for all hours over 40 in a givenweek. Last week he worked 44 hours. Find his net pay if theonly deductions are CPP, EI, and Income Tax (Code 0).
Suppose that you were earning $13.55 an hour. After threemonths, you received a raise of 10%. What is your newhourly rate?
*Susan predicts she will earn $12.00 per hour working 40hours per week construction full time. Develop a monthlybudget that matches her income. Consider both deductionsand expenses. Consider all types of spending. Explain yourreasoning.
Complete the table for Jane, who earns $1500 for the weeksending January 15 and 31.
Mon3.5 h
Tue–
Wed–
Thu4.0 h
Fri6 h
Sat7.5 h
Sun3.5 h
Gross Pay
EI Premium
CPP Premium
Taxable Income
Net Income
PayrollEnding____
PayrollEnding____

G-98
APPENDIX G: ILLUSTRATIVE EXAMPLES • Essentials of Mathematics 10
Prescribed Learning Outcomes Illustrative Examples
SPREADSHEETS
It is expected that students will design and use a spreadsheet to make and justify decisions.
It is expected that students will:
• create a spreadsheet using differentformatting options
• use a spreadsheet template to solveproblems
What is the difference between a row and a column? What are the three types of information that can go into a
cell? Explain in your words what each is. Write the specific steps to:
- format a number to two decimal places- format a number to show dollars and cents (currency)- change a column’s width.- change cell values- add/delete rows/columns
Use the spreadsheet of a sod-laying company to calculatethe areas and perimeters of these custom orders
length width area perimeter diagonal lengtha) 12 9b) 18 5c) 22 13d) 23.5 17.32
A B C D1
2
3
4
5
6
Length
Width
Perimeter
Area

G-99
APPENDIX G: ILLUSTRATIVE EXAMPLES • Essentials of Mathematics 10
Prescribed Learning Outcomes Illustrative Examples
*
Roger has $5000. He would like to invest it to eventuallyhave $10 000. He thought that investing at 5% for threeyears would work. As you can see, he was wrong. Find theright combination of time and rate, given $5000, to achievethe amount of $10 000. Remember that 5% is expressed as0.05. You are also not allowed to use an interest rate greaterthan 15%. Can you find more that one combination?
List at least two possible types of problem situations thatcould be solved using spreadsheets. Explain your choices.
SPREADSHEETS
It is expected that students will design and use a spreadsheet to make and justify decisions.
A B1
2
3
4
5
6
initial amount
rate
years
final value
$5000.00
0.05
3
$5788.13
1
2
3
4
5
6
7
Your Name Name
Bob
Susan
Jeff
Randi
Carrie
Scott
test 1
70
85
75
96
56
87
test 2
75
82
70
89
65
78
term mark exam
65
75
65
82
51
72
finalA B C D E F G
Create a new spreadsheet to record a teacher’s marks. Theterm mark is the average of the two tests. The final mark isthe exam mark times 40% plus the term mark times 60%.
*Questions for any Spreadsheeta) Write a formula to add the values and cells C12 and C13.b) Write a formula to find a difference between cells D10
and D9.c) Write a formula to multiply A10, A11 and A12 together.d) Write a formula to add cells B6 to B10.
• create a spreadsheet using formulas andfunctions
• use a spreadsheet to answer “what-if”questions
• identify where spreadsheets could beeffectively used
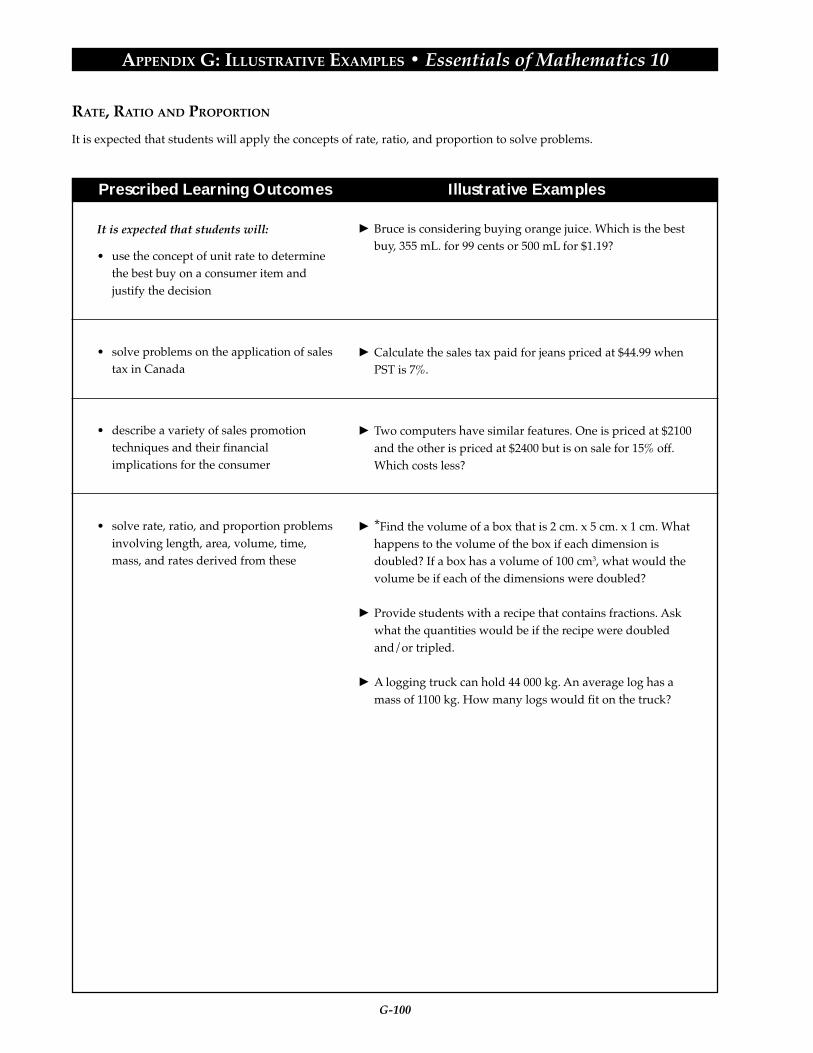
G-100
APPENDIX G: ILLUSTRATIVE EXAMPLES • Essentials of Mathematics 10
Prescribed Learning Outcomes Illustrative Examples
RATE, RATIO AND PROPORTION
It is expected that students will apply the concepts of rate, ratio, and proportion to solve problems.
It is expected that students will:
• use the concept of unit rate to determinethe best buy on a consumer item andjustify the decision
• solve problems on the application of salestax in Canada
• describe a variety of sales promotiontechniques and their financialimplications for the consumer
• solve rate, ratio, and proportion problemsinvolving length, area, volume, time,mass, and rates derived from these
Bruce is considering buying orange juice. Which is the bestbuy, 355 mL. for 99 cents or 500 mL for $1.19?
Calculate the sales tax paid for jeans priced at $44.99 whenPST is 7%.
Two computers have similar features. One is priced at $2100and the other is priced at $2400 but is on sale for 15% off.Which costs less?
*Find the volume of a box that is 2 cm. x 5 cm. x 1 cm. Whathappens to the volume of the box if each dimension isdoubled? If a box has a volume of 100 cm3, what would thevolume be if each of the dimensions were doubled?
Provide students with a recipe that contains fractions. Askwhat the quantities would be if the recipe were doubledand/or tripled.
A logging truck can hold 44 000 kg. An average log has amass of 1100 kg. How many logs would fit on the truck?

G-101
APPENDIX G: ILLUSTRATIVE EXAMPLES • Essentials of Mathematics 10
Prescribed Learning Outcomes Illustrative Examples
TRIGONOMETRY
It is expected that students will demonstrate an understanding of ratio and proportion and apply these concepts insolving triangles.
The length of a shadow cast by a tree is 10.5 m. At the sametime, the length of a shadow cast by a 45 cm tomato plant is75 cm. How tall is the tree?
A 6.0 m ladder rests against the side of a house. Martin isstanding right under the ladder. He is 1.70 m tall and hishead touches 2.0 m up the ladder. How high does the ladderreach up the wall of the house?
*The side of a triangular roof of a house is 6 m long and theroof is 2.5 m tall. The model of the house constructed by thearchitect has a roof that is 6 cm long and its side measures 4cm. Draw a sketch of both the roof of the house and themodel and fill in the known measurements. Hint: Whichtriangle should you consider in the roof when solving thisproblem: the whole roof or half the roof?- How long is the actual roof of the house?- How tall is the roof of the model house?
Use the data tables and diagrams to complete the tasksoutlined below.
Part I- Measure and record the sizes of all angles on the triangle
worksheet.- Use the table below (Table 1) to record the angles and
ratios accurate to the unit digit:
- What do you notice about the ratios of angles of thetriangles?
It is expected that students will:
• apply ratio and proportion in similartriangles.
Diagram 1
C
A
Ba
b c
Diagram 2
C
A
Ba
b c
angle A (degrees) angle B (degrees) angle C (degrees) angle A’ (degrees) angle B’ (degrees) angle C’ (degrees) angle A / angle A’ angle B / angle B’ angle C / angle C’
Cost ($)Table 1

G-102
APPENDIX G: ILLUSTRATIVE EXAMPLES • Essentials of Mathematics 10
Prescribed Learning Outcomes Illustrative Examples
Part II- Label the sides of each triangle. For example, the side
opposite of angle A is called a, the side opposite of angleA’ is called a’, etc..
- For each triangle, measure and record the lengths of allsides on the triangle and record this in a table like the onebelow (Table 2).
- Calculate and record all nine ratios of sides accurate toone decimal place. Use the values you found in theprevious section. For example, triangle ABC has ratiosa/b, b/a, a/c, c/a, b/c, and c/b.
- What do you notice about the lengths of sides ratiosbetween pairs of triangles?
Length of side a (cm) Length of side b (cm) Length of side c (cm) Length of side a’ (cm) Length of side b’ (cm) Length of side c’ (cm)
a/a’ b/b’ c/c’ a/b a’/b’ a/c a’/c’ b/c b’/c’
Cost ($)Table 2
TRIGONOMETRY
It is expected that students will demonstrate an understanding of ratio and proportion and apply these concepts insolving triangles.

G-103
APPENDIX G: ILLUSTRATIVE EXAMPLES • Essentials of Mathematics 10
Prescribed Learning Outcomes Illustrative Examples
Use the data tables from the previous illustrative exampleto answer the following:
- Set your calculator to degree mode. Use your findingsfrom the previous exercise to fill in the following table forthe right triangle ABC.
- Compare the table entries to the lengths of sides ratiosyou found in the previous exercise. What do you notice?
- Repeat the exercise with triangle A’B’C’ from the previousworksheet.
State whether you would use the sine, the cosine or thetangent ratio to find x for each figure.
If a grasshopper jumps a vertical distance of 1.5 cm and ahorizontal distance of 8.0 cm., at what angle did it rise fromthe ground?
A 6 m ladder is leaning against the wall of a house. Theangle between the ladder and the ground is 68o. Give youranswers accurate to two decimal places.- How far away is the ladder from the wall?- How high up the house does the ladder reach?
*An airplane is flying at an altitude of 10 km. You spot theairplane at an angle of 55o. Give your answers to the nearestkilometre.- How far away is the airplane directly from you?- How far away is the airplane on the ground from you?- Are these measurements exact? What did you assume
about solving this problem? Hint: Is the Earth flat? Whatdo you see with?
TRIGONOMETRY
It is expected that students will demonstrate an understanding of ratio and proportion and apply these concepts insolving triangles.
• use the trigonometric ratios sine, cosineand tangent in finding the sides or anglesin right triangles
sine A sine B cosine A cosine B tangent A tangent B
Cost ($)
a) 43
25x
b)
75
52
4065
x
x
c)
d) e)
15
60x
xx
40
80
80 80
x
f)
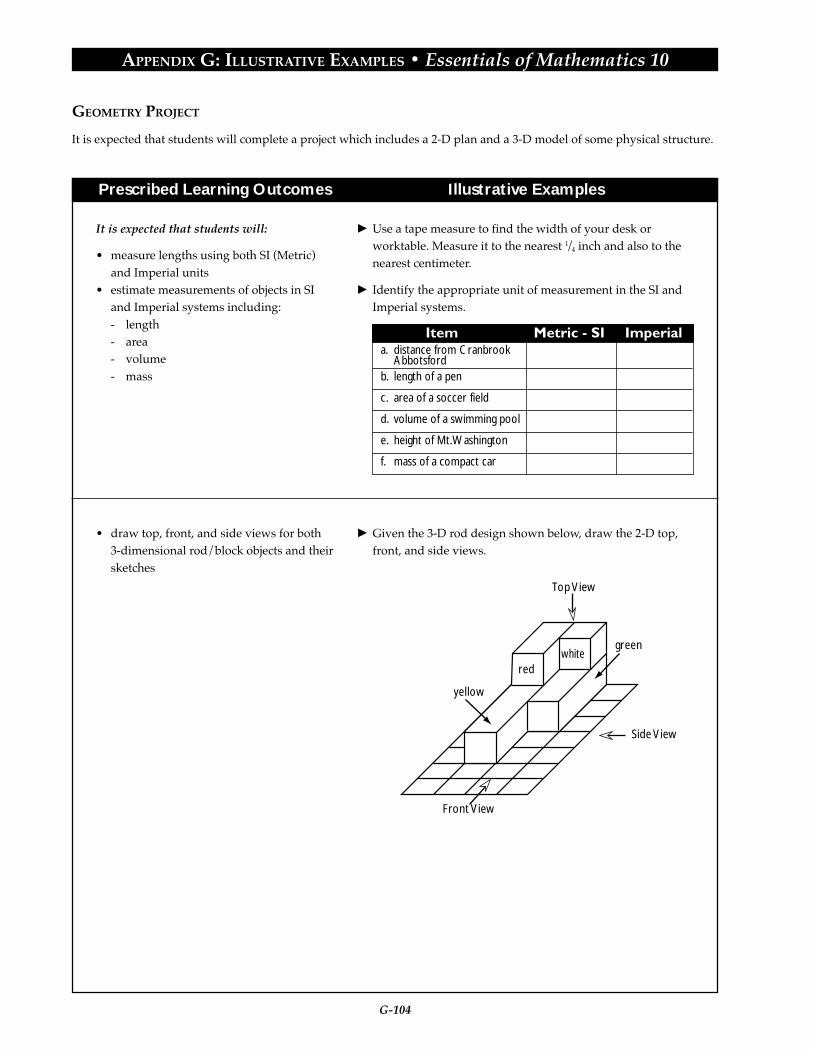
G-104
APPENDIX G: ILLUSTRATIVE EXAMPLES • Essentials of Mathematics 10
Prescribed Learning Outcomes Illustrative Examples
GEOMETRY PROJECT
It is expected that students will complete a project which includes a 2-D plan and a 3-D model of some physical structure.
It is expected that students will:
• measure lengths using both SI (Metric)and Imperial units
• estimate measurements of objects in SIand Imperial systems including:- length- area- volume- mass
• draw top, front, and side views for both3-dimensional rod/block objects and theirsketches
Use a tape measure to find the width of your desk orworktable. Measure it to the nearest 1/4 inch and also to thenearest centimeter.
Identify the appropriate unit of measurement in the SI andImperial systems.
Given the 3-D rod design shown below, draw the 2-D top,front, and side views.
a. distance from Cranbrook Abbotsfordb. length of a pen
c. area of a soccer field
d. volume of a swimming pool
e. height of Mt. Washington
f. mass of a compact car
red
Top View
Side View
Front View
yellow
greenwhite
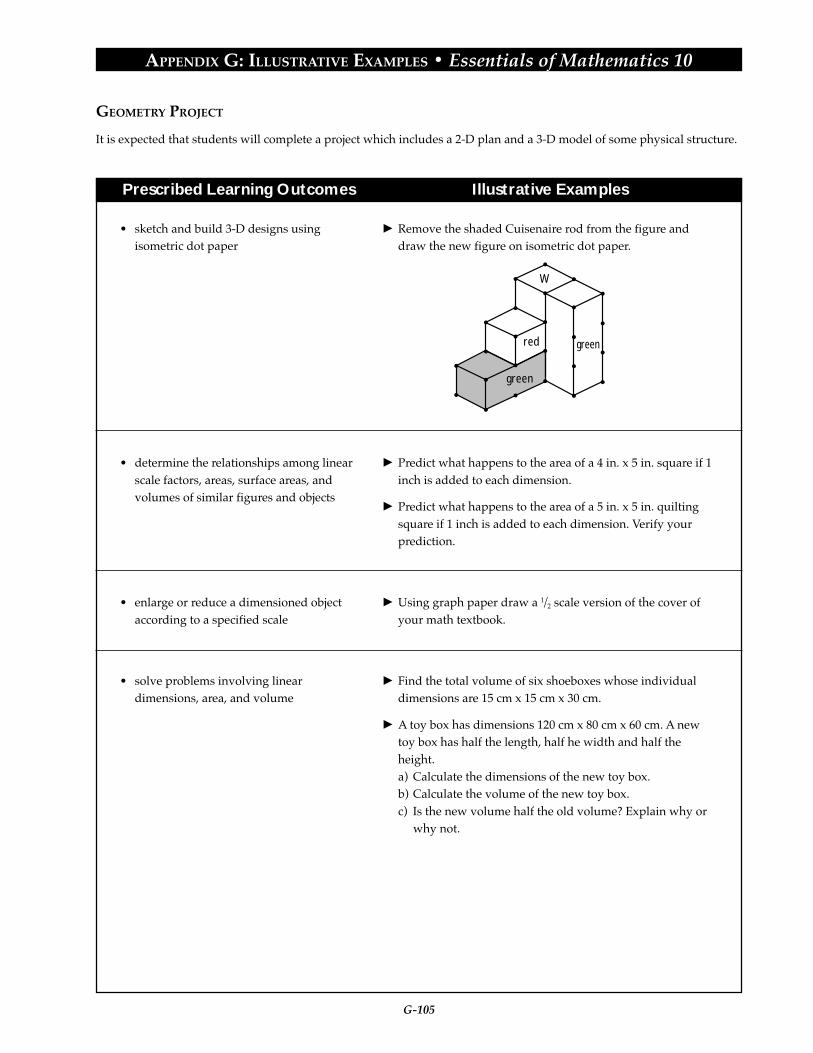
G-105
APPENDIX G: ILLUSTRATIVE EXAMPLES • Essentials of Mathematics 10
Prescribed Learning Outcomes Illustrative Examples
Remove the shaded Cuisenaire rod from the figure anddraw the new figure on isometric dot paper.
Predict what happens to the area of a 4 in. x 5 in. square if 1inch is added to each dimension.
Predict what happens to the area of a 5 in. x 5 in. quiltingsquare if 1 inch is added to each dimension. Verify yourprediction.
Using graph paper draw a 1/2 scale version of the cover ofyour math textbook.
Find the total volume of six shoeboxes whose individualdimensions are 15 cm x 15 cm x 30 cm.
A toy box has dimensions 120 cm x 80 cm x 60 cm. A newtoy box has half the length, half he width and half theheight.a) Calculate the dimensions of the new toy box.b) Calculate the volume of the new toy box.c) Is the new volume half the old volume? Explain why or
why not.
• sketch and build 3-D designs usingisometric dot paper
• determine the relationships among linearscale factors, areas, surface areas, andvolumes of similar figures and objects
• enlarge or reduce a dimensioned objectaccording to a specified scale
• solve problems involving lineardimensions, area, and volume
GEOMETRY PROJECT
It is expected that students will complete a project which includes a 2-D plan and a 3-D model of some physical structure.
W
red
green
green
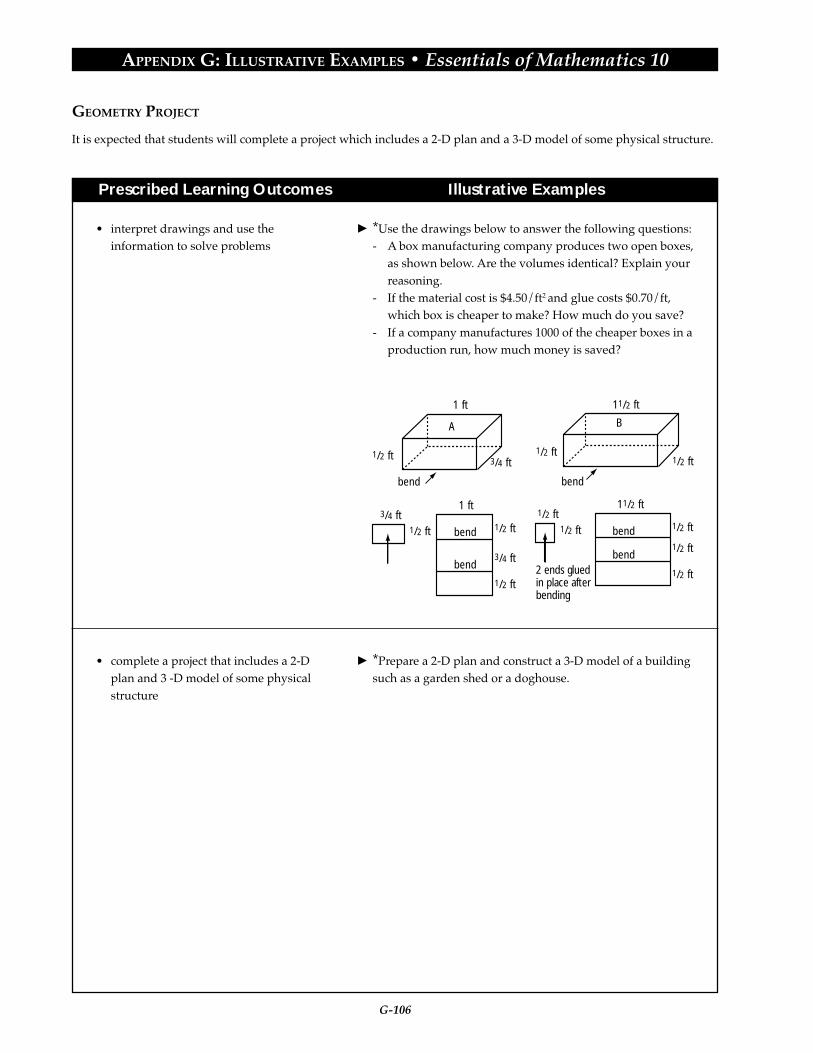
G-106
APPENDIX G: ILLUSTRATIVE EXAMPLES • Essentials of Mathematics 10
Prescribed Learning Outcomes Illustrative Examples
A
1 ft
1 ft
1/2 ft
1/2 ft
1/2 ft
3/4 ft
1/2 ft
3/4 ft
3/4 ft
bend
bend
bend
B
11/2 ft
11/2 ft
1/2 ft
1/2 ft
1/2 ft
1/2 ft
1/2 ft
1/2 ft
1/2 ft
bend
bend
bend 2 ends glued in place after bending
*Use the drawings below to answer the following questions:- A box manufacturing company produces two open boxes,
as shown below. Are the volumes identical? Explain yourreasoning.
- If the material cost is $4.50/ft2 and glue costs $0.70/ft,which box is cheaper to make? How much do you save?
- If a company manufactures 1000 of the cheaper boxes in aproduction run, how much money is saved?
*Prepare a 2-D plan and construct a 3-D model of a buildingsuch as a garden shed or a doghouse.
• interpret drawings and use theinformation to solve problems
• complete a project that includes a 2-Dplan and 3 -D model of some physicalstructure
GEOMETRY PROJECT
It is expected that students will complete a project which includes a 2-D plan and a 3-D model of some physical structure.

G-107
APPENDIX G: ILLUSTRATIVE EXAMPLES • Essentials of Mathematics 10
Prescribed Learning Outcomes Illustrative Examples
PROBABILITY AND SAMPLING
It is expected that students will implement and analyse sampling procedures, and draw appropriate inferences from thedata collected.
It is expected that students will:
• read and interpret graphs
The graph below shows the results of a survey of 60students. What do you think the survey is about? Abouthow many students are in each category?
Pizza
Burgers
Hot Dogs
Other

G-108
APPENDIX G: ILLUSTRATIVE EXAMPLES • Essentials of Mathematics 10
Prescribed Learning Outcomes Illustrative Examples
Boys GirlsSales person
Welder
Grounds keeper
Liscensed practical nurse
PROBABILITY AND SAMPLING
It is expected that students will develop and implement a plan for the collection, display, and analysis of data usingtechnology as required.
Carmen designed and handed out 100 questionnaires tomiddle-year students in her school. One question she askedwas this:
What do you want to be? Choose one.o Sales person o Weldero Grounds keeper o Liscensed pratical nurse
50 questionnaires were returned. Here are the results.
Carmen reached the conclusion that most students willwork in sales.
Do you agree with each of the following?What else might Carmen have done?a) the wording of Carmen’s questionb) the method of gathering datac) the sample she chose to surveyd) the conclusion she reached
Explain what would be the most appropriate methods forcollecting data
For each of these questions:a) Does smoking cause lung cancer?b) Does pet ownership enhance the quality of life for senior
citizens?
Identify potential ethical problems, the need for sensitivityto personal and cultural beliefs, and cost when designingquestions and collecting data.
• discuss how collected data are affectedby the nature of the sample, the methodof collection, the sample size, and biases
• describe issues to be considered whencollecting data (e.g., appropriatelanguage, ethics, cost, privacy, culturalsensitivity)

G-109
APPENDIX G: ILLUSTRATIVE EXAMPLES • Essentials of Mathematics 10
Prescribed Learning Outcomes Illustrative Examples
PROBABILITY AND SAMPLING
It is expected that students will develop and implement a plan for the collection, display, and analysis of data usingtechnology as required.
• select, defend and use appropriatemethods of collecting data:- designing and using questionnaires- interviews- experiments- research
• determine and use measures of centraltendency to support decisions
• use sample data to make predictions anddecisions
As a member of your school’s student council, you wish todetermine the number of students who will attend a schooldance. Explain how you could collect this information.
A city council is trying to determine if a major road in yourdistrict needs to be widened. Explain a procedure thatcould be used to help city council make this decision.
Bill surveyed people entering a theatre and asked them ifthey would support building a new sports arena in thecommunity. Discuss this method of collecting data in termsof its appropriateness.
Find the mean, median, and mode for the following sets oftest scores:a) 42, 62, 68, 73, 75, 75, 86, 89, 92b) 10, 20, 20, 30, 50, 70
Do a survey of your class on favourite car colour, anddetermine the mode.
Explain why each of the following people might select themean, median, or mode in a set of data.a) a store owner deciding what sizes of shoes to orderb) someone moving to a new city and looking at house
costsc) reporting the average score on a test
Collect class data on shoe size. Use this data to predict thenumber of pairs of size 11 men’s shoes found in a sample of1000 grade 10 boys. If you owned a shoe store, what decisionwould you make concerning the purchase of men's shoes?
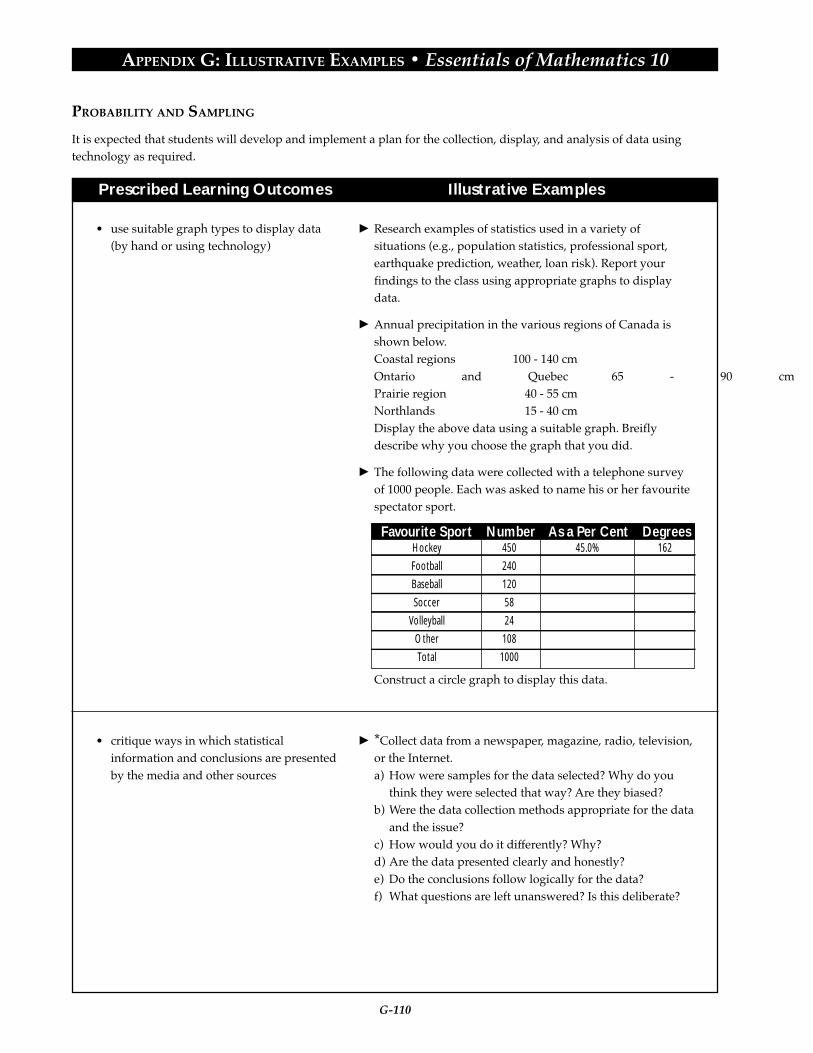
G-110
APPENDIX G: ILLUSTRATIVE EXAMPLES • Essentials of Mathematics 10
Prescribed Learning Outcomes Illustrative Examples
PROBABILITY AND SAMPLING
It is expected that students will develop and implement a plan for the collection, display, and analysis of data usingtechnology as required.
Research examples of statistics used in a variety ofsituations (e.g., population statistics, professional sport,earthquake prediction, weather, loan risk). Report yourfindings to the class using appropriate graphs to displaydata.
Annual precipitation in the various regions of Canada isshown below.Coastal regions 100 - 140 cmOntario and Quebec 65 - 90 cmPrairie region 40 - 55 cmNorthlands 15 - 40 cmDisplay the above data using a suitable graph. Breiflydescribe why you choose the graph that you did.
The following data were collected with a telephone surveyof 1000 people. Each was asked to name his or her favouritespectator sport.
Construct a circle graph to display this data.
*Collect data from a newspaper, magazine, radio, television,or the Internet.a) How were samples for the data selected? Why do you
think they were selected that way? Are they biased?b) Were the data collection methods appropriate for the data
and the issue?c) How would you do it differently? Why?d) Are the data presented clearly and honestly?e) Do the conclusions follow logically for the data?f) What questions are left unanswered? Is this deliberate?
• use suitable graph types to display data(by hand or using technology)
• critique ways in which statisticalinformation and conclusions are presentedby the media and other sources
Hockey
Football
Baseball
Soccer
Volleyball
Other
Total
450
240
120
58
24
108
1000
45.0% 162Favourite Sport Number As a Per Cent Degrees

APPENDIX G
ILLUSTRATIVE EXAMPLES
Essentials of Mathematics 11


G-113
APPENDIX G: ILLUSTRATIVE EXAMPLES • Essentials of Mathematics 11
Prescribed Learning Outcomes Illustrative Examples
PROBLEM SOLVING
It is expected that students will use a variety of methods to solve real-life, practical, technical, and theoretical problems.
Illustrative Examples for Problem Solving have beenindicated with an asterisk (*) throughout Appendix G.
It is expected that students will:
• solve problems that involve a specificcontent area
• solve problems that involve more thanone content area
• solve problems that involve mathematicswithin other disciplines
• analyse problems and identify thesignificant elements
• develop specific skills in selecting andusing an appropriate problem-solvingstrategy or combination of strategieschosen from, but not restricted to, thefollowing:- guess and check- look for a pattern- make a systematic list- make and use a drawing or model- eliminate possibilities- work backward- simplify the original problem- develop alternative original approaches- analyse keywords
• demonstrate the ability to workindividually and co-operatively to solveproblems
• determine that their solutions are correctand reasonable
• clearly communicate a solution to aproblem and the process used to solve it
• interpret their solutions by describingwhat the solution means within thecontext of the original problem
• use appropriate technology to assist inproblem solving
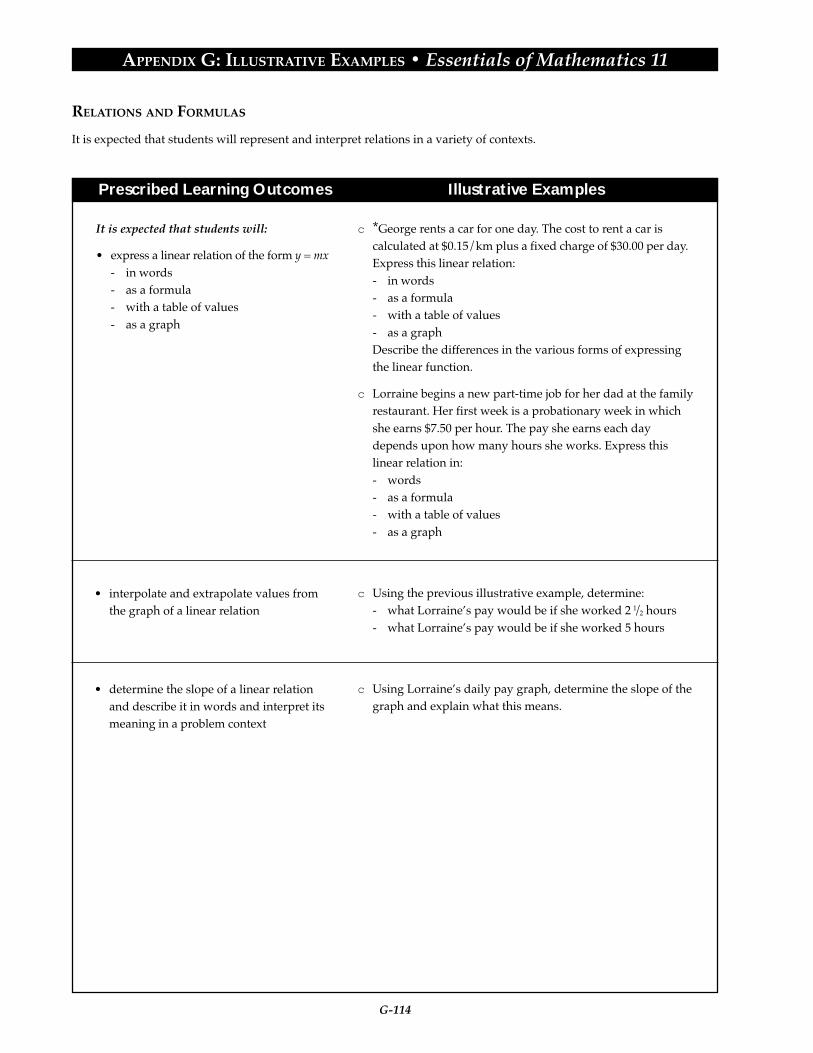
G-114
APPENDIX G: ILLUSTRATIVE EXAMPLES • Essentials of Mathematics 11
Prescribed Learning Outcomes Illustrative Examples
It is expected that students will:
• express a linear relation of the form y = mx- in words- as a formula- with a table of values- as a graph
c *George rents a car for one day. The cost to rent a car iscalculated at $0.15/km plus a fixed charge of $30.00 per day.Express this linear relation:- in words- as a formula- with a table of values- as a graphDescribe the differences in the various forms of expressingthe linear function.
c Lorraine begins a new part-time job for her dad at the familyrestaurant. Her first week is a probationary week in whichshe earns $7.50 per hour. The pay she earns each daydepends upon how many hours she works. Express thislinear relation in:- words- as a formula- with a table of values- as a graph
c Using the previous illustrative example, determine:- what Lorraine’s pay would be if she worked 2 1/2 hours- what Lorraine’s pay would be if she worked 5 hours
c Using Lorraine’s daily pay graph, determine the slope of thegraph and explain what this means.
• interpolate and extrapolate values fromthe graph of a linear relation
• determine the slope of a linear relationand describe it in words and interpret itsmeaning in a problem context
RELATIONS AND FORMULAS
It is expected that students will represent and interpret relations in a variety of contexts.

G-115
APPENDIX G: ILLUSTRATIVE EXAMPLES • Essentials of Mathematics 11
Prescribed Learning Outcomes Illustrative Examples
c The cost associated with renting a car for a day fromCompany A is shown on the graph. The cost depends on thenumber of kilometres driven plus a daily charge.
a) What does the cost depend on?b) Determine the slope of the line.c) What does this slope represent?d) What is the daily charge for a rental?e) Write the formula that describes this problem (using
words and using letters).
c The following sketch represents a person walking a dog.Write a story to correspond to the graph.
• interpret the graph of a relation anddescribe it in words
Distance (km)
Cos
t ($)
0 100
10
20
30
40
50
60
200 300 400 500
Daily CarRental Cost
RELATIONS AND FORMULAS
It is expected that students will represent and interpret relations in a variety of contexts.
Distance of a Dog Walk
Time (minutes)
Dis
tanc
e (k
m)
0
0 10 20 30 40 50
1
2
3
4
5
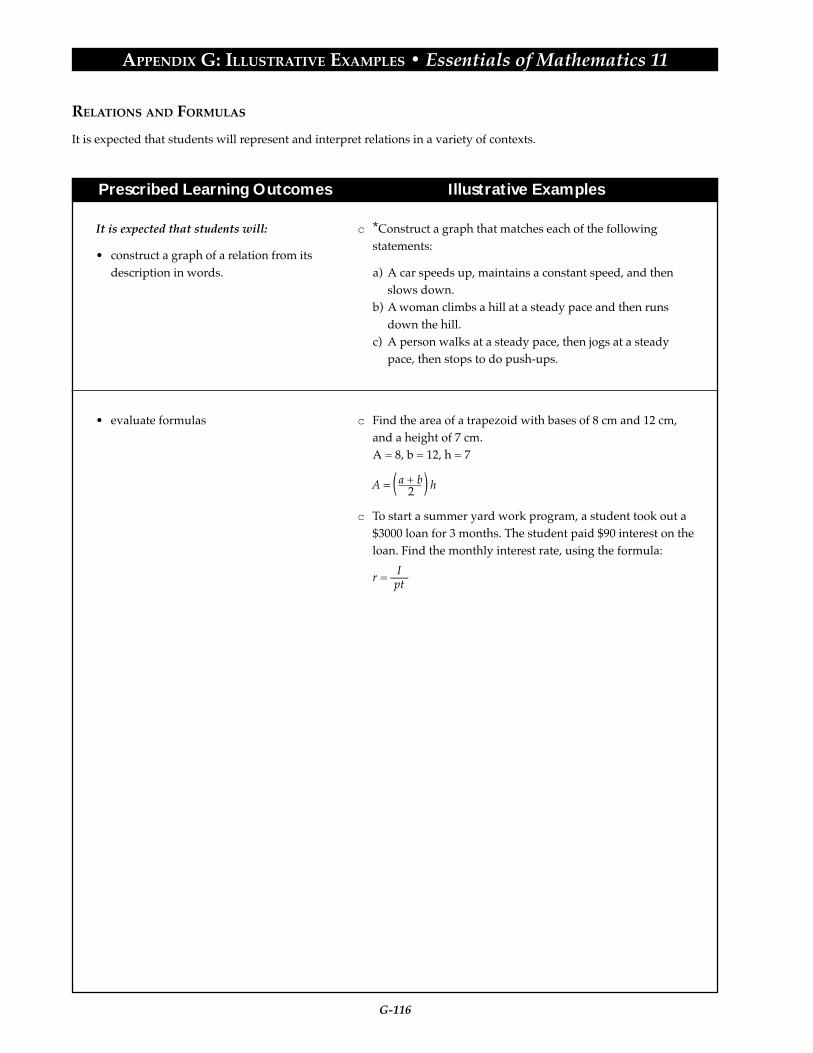
G-116
APPENDIX G: ILLUSTRATIVE EXAMPLES • Essentials of Mathematics 11
Prescribed Learning Outcomes Illustrative Examples
RELATIONS AND FORMULAS
It is expected that students will represent and interpret relations in a variety of contexts.
It is expected that students will:
• construct a graph of a relation from itsdescription in words.
• evaluate formulas
c *Construct a graph that matches each of the followingstatements:
a) A car speeds up, maintains a constant speed, and thenslows down.
b) A woman climbs a hill at a steady pace and then runsdown the hill.
c) A person walks at a steady pace, then jogs at a steadypace, then stops to do push-ups.
c Find the area of a trapezoid with bases of 8 cm and 12 cm,and a height of 7 cm.A = 8, b = 12, h = 7
c To start a summer yard work program, a student took out a$3000 loan for 3 months. The student paid $90 interest on theloan. Find the monthly interest rate, using the formula:
r = —–
A = h2a + b( )
Ipt

G-117
APPENDIX G: ILLUSTRATIVE EXAMPLES • Essentials of Mathematics 11
Prescribed Learning Outcomes Illustrative Examples
INCOME AND DEBT
It is expected that students will demonstrate an awareness of selected forms of personal income and debt.
It is expected that students will:
• solve problems involving performance-based income, including commissionsales, piecework and salary pluscommission
c Weili is an insurance salesperson. He receives a 30%commission on the first year’s premium of each lifeinsurance policy he sells. Weili sells three life insurancepolicies this week. If the premiums for the first year are$350, $400, and $440, what was Weili’s gross pay this week?
c Weili decides to work for another company that will givehim a weekly salary of $350 and a commission rate of 6% forany goods sold over $3000. If he sold goods worth $5688this week, what is his gross pay?
c *Evan works for a machine company that pays him 1% onthe first $5000 sold, 2% on the next $15,000 sold and 3% onanything over $20,000. What would his gross pay be if hesold $25,000?
c Mary works for a packaging company, assembling condimentpackages for a fast-food industry. She earns $0.08 for eachpackage. Calculate her earnings for the week. Thecalculations for Monday have been done for you.
c Jace Manufacturing Co. makes pallets. Their workers get$1.20 per pallet. If a worker assembles 100 pallets in a day,what would be the gross pay in a five-day week?
Day # of Packages Daily EarningsMonday
Tuesday
Wednesday
Thursday
Friday
Saturday
760
690
792
420
608
201
760 x 0.08 = $60.80
Weekly Earnings

G-118
APPENDIX G: ILLUSTRATIVE EXAMPLES • Essentials of Mathematics 11
Prescribed Learning Outcomes Illustrative Examples
INCOME AND DEBT
It is expected that students will demonstrate an awareness of selected forms of personal income and debt.
c May Hill owes $200 on her credit card. She misses apayment. She must pay interest for 28 days. If the yearlyinterest rate is 18%, how much interest would she pay for 28days?
c What is the compound interest earned on a deposit of $1000after two years if it is compounded semi-annually at a rateof 6%?
c Review the following information about a $20,000 loan to berepaid at the rate shown over a period of 9 years. Explainhow you could use a spreadsheet to find the closing balanceafter 8 years.
c A purchase of $220 was made on June 14. Nothing was paidon the first due date of July 20. Calculate the daily interestcharge for the purchase if the rate is 18.6% per year. The nextdue date is August 20.
c Amy would like to buy a computer. She has found one thatshe likes for $2400 plus taxes. She doesn’t have the moneyright now so she decides to take out a personal fixed rate loan.a) How much will she pay per month if she takes the loan
out for two years?b) How much interest will she pay?
• use simple and compound interestcalculations to solve problems
• solve consumer problems involving– credit cards– exchange rates– personal loans
Year OpeningBalance
InterestRate %
InterestCharged
AnnualPayment
ClosingBalance
1
2
3
5
5
5
$20 000.00
$18 000.00
$15 900.00
$1 000.00
$ 900.00
$ 795.00
$3 000.00
$3 000.00
$3 000.00
$18 000.00
$15 900.00
$13 695.00

G-119
APPENDIX G: ILLUSTRATIVE EXAMPLES • Essentials of Mathematics 11
Prescribed Learning Outcomes Illustrative Examples
c A banker needs to provide clients with information onforeign exchange. Use the foreign exchange chart provided,or a current chart from a newspaper, to answer thefollowing questions.a) Calculate the cost in Canadian dollars of a refrigerator
that costs $850 US.b) Calculate the cost in US dollars of an outboard motor
selling in Canada for $1200.c) Hans receives a cheque for 100 Swiss francs from his
uncle in Berne. How many Dutch guilders would he getfor this cheque? How many Canadian dollars?
Canada dollar
US dollar
British pound
German mark
Japanese yen
Swiss franc
French franc
Dutch guilder
Italian lira
Canada US British German Japanesedollar dollar pound mark yen
— 1.3743 2.0762 0.9227 0.012850
0.7276 — 1.5107 0.6714 0.009350
0.4816 0.6619 — 0.4444 0.006189
1.0838 1.4894 2.2501 — 0.013927
77.82 106.95 161.57 71.81 —
0.8821 1.2122 1.8313 0.8139 0.011335
3.7230 5.1165 7.7297 3.4352 0.047841
1.2134 1.6676 2.5194 1.1196 0.015593
1156.07 1588.79 2400.23 1066.71 14.855491
Exchange - Cross Rates
Canada dollar
US dollar
British pound
German mark
Japanese yen
Swiss franc
French franc
Dutch guilder
Italian lira
Swiss French Dutch Italianfranc franc guilder lira
1.1337 0.2686 0.8241 0.000865
0.8249 0.1954 0.5997 0.000629
0.5460 0.1294 0.3969 0.000417
1.2287 0.2911 0.8931 0.000937
88.23 20.90 64.13 0.067315
— 0.2369 0.7269 0.000763
4.2208 — 3.0681 0.003220
1.3757 0.3259 — 0.001050
1310.64 310.52 952.72 —
Exchange - Cross Rates
INCOME AND DEBT
It is expected that students will demonstrate an awareness of selected forms of personal income and debt.

G-120
APPENDIX G: ILLUSTRATIVE EXAMPLES • Essentials of Mathematics 11
Prescribed Learning Outcomes Illustrative Examples
c
Use the information from the chart above to answer thefollowing questions.a) Find the interest charged on both credit cards for the
month, using the formula I = p x r x t (Interest = Principlex Interest Rate x Time).
b) Including the card fee, which card is cheaper to use tomake a cash advance of $750.00 that is paid back afterone month.
c *Fill in the missing informationCredit Card Statement Account #12345609/07 Previous Balance Owing $125.00
Payment Thank you 100.0011/07 Ralph's Tire Shop 36.9920/07 The Shoe Shop 27.99 cr27/07 Super Sports 24.8730/07 Disco Jim's 79.99
*From the statement, identifya) credit limitb) daily interest ratec) if previous bill was paidd) total expenditures
Card 1 Card 2Balance Owing $750.00 $750.00
Interest Rate Per Year 15% 18%
Annual Card Fee $36.00 $0.00
$500.00 $125.00
Cue Date: August 22Minimum Payment
10% of Balance
Credit Remaining
$2.30
MaximumCredit
Balance onLast Statement
Interest Charged
Total PurchasesThis Statement
Total Payment and Credits ThisStatement
New Balance
INCOME AND DEBT
It is expected that students will demonstrate an awareness of selected forms of personal income and debt.
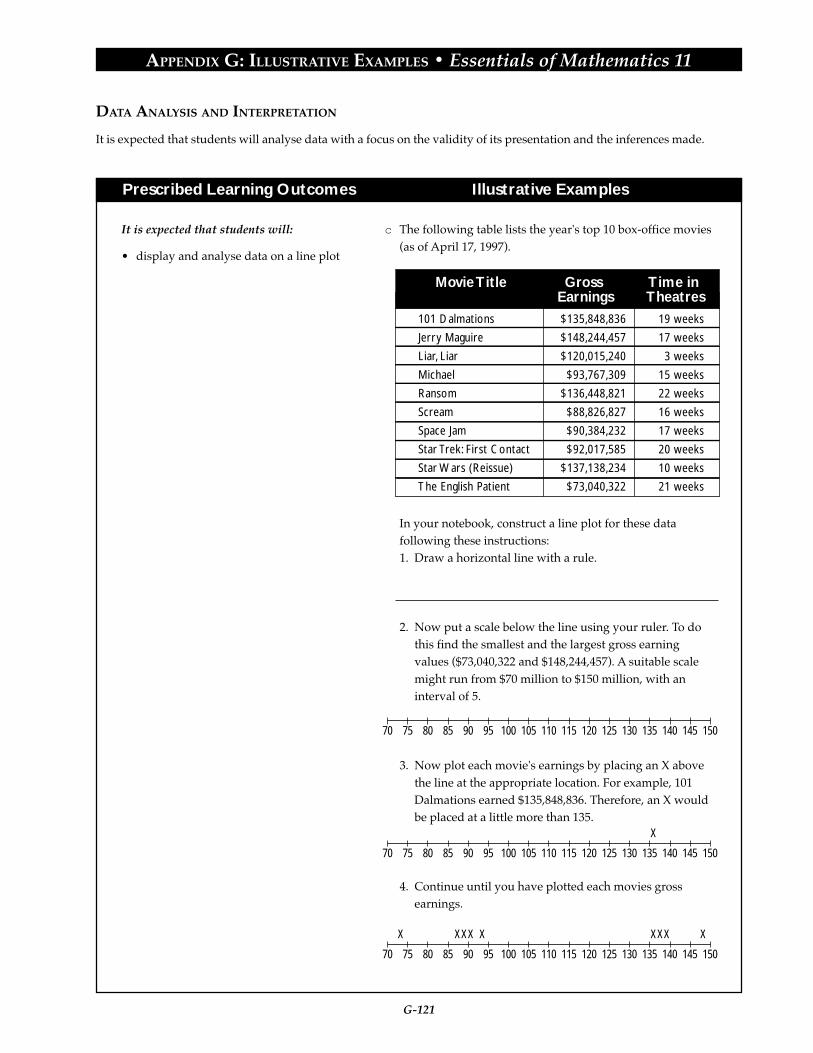
G-121
APPENDIX G: ILLUSTRATIVE EXAMPLES • Essentials of Mathematics 11
Prescribed Learning Outcomes Illustrative Examples
DATA ANALYSIS AND INTERPRETATION
It is expected that students will analyse data with a focus on the validity of its presentation and the inferences made.
It is expected that students will:
• display and analyse data on a line plot
c The following table lists the year's top 10 box-office movies(as of April 17, 1997).
In your notebook, construct a line plot for these datafollowing these instructions:1. Draw a horizontal line with a rule.
2. Now put a scale below the line using your ruler. To dothis find the smallest and the largest gross earningvalues ($73,040,322 and $148,244,457). A suitable scalemight run from $70 million to $150 million, with aninterval of 5.
3. Now plot each movie's earnings by placing an X abovethe line at the appropriate location. For example, 101Dalmations earned $135,848,836. Therefore, an X wouldbe placed at a little more than 135.
4. Continue until you have plotted each movies grossearnings.
Movie Title Gross Earnings
Time inTheatres
101 Dalmations
Jerry Maguire
Liar, Liar
Michael
Ransom
Scream
Space Jam
Star Trek: First Contact
Star Wars (Reissue)
The English Patient
$135,848,836
$148,244,457
$120,015,240
$93,767,309
$136,448,821
$88,826,827
$90,384,232
$92,017,585
$137,138,234
$73,040,322
19 weeks
17 weeks
3 weeks
15 weeks
22 weeks
16 weeks
17 weeks
20 weeks
10 weeks
21 weeks
70 75 80 85 90 95 100 105 110 115 120 125 130 135 140 145 150
70 75 80 85 90 95 100 105 110 115 120 125 130 135 140 145 150
X
70 75 80 85 90 95 100 105 110 115 120 125 130 135 140 145 150
XXX XXX X XX

G-122
APPENDIX G: ILLUSTRATIVE EXAMPLES • Essentials of Mathematics 11
Prescribed Learning Outcomes Illustrative Examples
c *Assume that the following data represent the number ofCanadians who were unemployed during the years 1990 -1995.
A federal employment agency wishes to demonstrate thatthe government’s policies and practices have caused adramatic decrease in unemployment. The agency hasproduced this graph:
a) What is your overall impression of this graph?b) How was the graph constructed to give this impression?c) Assume that you are a member of the political opposition
party. You feel that the government’s policies andpractices have not caused a significant decrease inunemployment. As part of your statement to the press,you wish to include a graph. Using the data from thechart, construct a graph that will support your party’spoint of view.
DATA ANALYSIS AND INTERPRETATION
It is expected that students will analyse data with a focus on the validity of its presentation and the inferences made.
YearNumber
1990
1105
1991
1151
1992
1164
1994
897
1993
1060
1995
738
Unemployed Canadians (1000s)
Canadian Unemployment
Year
1000
s U
nem
ploy
ed
1990
720
780
840
900
960
1020
1080
1140
1200
1991 1992 1993 1994
Number
1995
• manipulate the presentation of data tostress a particular point of view

G-123
APPENDIX G: ILLUSTRATIVE EXAMPLES • Essentials of Mathematics 11
Prescribed Learning Outcomes Illustrative Examples
MEASUREMENT TECHNOLOGY
It is expected that students will determine measurements in Systeme International (SI) and Imperial systems usingdifferent measuring devices.
It is expected that students will:
• select and use appropriate measuringdevices and measurement units (inImperial or SI units)
c Use calipers to measure:- the inside diameter of a piece of pipe- the depth of a cylinder- the internal and external diameters of a cylinder
c Use a micrometer to measure:- the thickness of a human hair- the thickness of one sheet of paper
c Using a metre stick, ruler, tape measure, or any othersuitable device, measure the following rectangular shapeditems in your classroom. For each item, give the length andwidth. Estimate your answers first.
Item Estimate SI
Actual SI
Estimate Imperial
Actual Imperial
a) desktop
b) textbook
c) classroom
d) window
e) door
f) teacher’s desk

G-124
APPENDIX G: ILLUSTRATIVE EXAMPLES • Essentials of Mathematics 11
Prescribed Learning Outcomes Illustrative Examples
MEASUREMENT TECHNOLOGY
It is expected that students will determine measurements in Systeme International (SI) and Imperial systems usingdifferent measuring devices.
c
Convert the following measures into the units (within thesame system) as indicated:a) 3 m = cm e) 5 ft. = in.b) 25 mm = cm f) 3 yd. = ft.c) 0.65 m = mm g) 27 in. = ft. in.d) 800 g = kg h) 1 mi. = yd.
• perform basic conversions within andbetween the Imperial and SI systemsusing technology as appropriate
Capacity
1 Canadian Gallon
1 litre
Volume
1 cubic inch
1 cubic centimetre
1 cubic yard
1 cubic metre
Length
1 inch
1 centimetre
1 foot
1 metre
1 yard
1 metre
1 mile
1 kilometre
Area
1 square inch
1 square centimetre
1 square foot
1 square metre
1 square yard
1 square metre
1 acre
1 hectare
Mass
1 ounce
1 gram
1 pound
1 kilogram
4.546 litres
0.220 Canadian Gallons
16.387 cubic centimetres
0.061 cubic inches
0.765 cubic metres
1.308 cubic yards
2.540 centimetres
0.394 inches
0.305 metres
3.281 feet
0.914 metres
1.094 yards
1.609 kilometres
.621 miles
6.452 square centimetres
0.155 square inches
0.093 square metres
10.764 square feet
0.836 square metres
1.196 square yards
0.405 hectares
2.471 acres
28.350 grams
0.035 ounces
0.454 kilograms
2.205 pounds
Imperial/Metric Conversion Table

G-125
APPENDIX G: ILLUSTRATIVE EXAMPLES • Essentials of Mathematics 11
Prescribed Learning Outcomes Illustrative Examples
MEASUREMENT TECHNOLOGY
It is expected that students will determine measurements in Systeme International (SI) and Imperial systems usingdifferent measuring devices.
It is expected that students will:
• use measurement strategies to solveproblems
c How many paper clips could be made from 1000 metres ofwire? How many kilometres of wire are required for acompany to manufacture one million paper clips?
c A room measures 12 ft. 6 in. x 15 ft. and has a ceiling heightof 116 ft.a) Ignoring any openings such as doors or windows, find
the total square footage of wall area to be painted.b) If the ceiling area is to be tiled, how many tiles measuring
12 ft. x 12 ft. will it take to finish the ceiling tile?
c *Frank is building a fence with 8 ft. sections. Assumingthere is to be no space between the boards, how many 1 x 6fence boards should he order for each section? (Investigatethe actual dimensions of a 1 x 6 fence board.)
Frank's fence has a total of 12 sections. How many boardsshould he order, if he includes 3% extra to allow forunusable lumber?
8 ft.
post post

G-126
APPENDIX G: ILLUSTRATIVE EXAMPLES • Essentials of Mathematics 11
Prescribed Learning Outcomes Illustrative Examples
OWNING AND OPERATING A VEHICLE
It is expected that students will analyse the cost of acquiring and operating a vehicle.
It is expected that students will:
• solve problems involving the acquisitionand operation of a vehicle including:- renting- leasing- buying- licensing- insuring- operating (e.g., fuel and oil)- maintaining (e.g., repairs, tune-ups).
c Dez would like to buy a Camaro Z28 Sports Coupe. Thebase price is $32,000. He adds option package #8 to it for anextra cost of $1585, plus he wants an automatic transmissionfor an additional $695. Freight on the car is $655. Thedealership will give him a trade-in allowance of $5000 on hisold car. What is his total price?
c Identify some of the advantages and disadvantages ofleasing a vehicle.
c *The following describes a 1999 sports utility vehicle. Thecost of the vehicle is $34,000 plus taxes (freight is included inthis price). The monthly lease payment is $349 plus taxes fora lease term of 36 months. For leasing, a down payment of$3850 is required. As well, a refundable security deposit of$500 and the first month’s payment must be made when thelease is signed.a) Calculate the total monthly payment.b) Calculate the total lease payment (total for three years),c) Calculate the residual value at the end of the lease if the
residual value rate for this type of vehicle is 75% afterthree years.
d) At the end of the three-year lease, you have the option ofreturning the vehicle or purchasing it for its residualvalue. If you decide to purchase the vehicle, what is thetotal cost of purchasing the vehicle (this includes the costof the lease).
c A car requires 52 litres of gasoline. If the cost of gasoline is$0.629 per litre, calculate the cost to fill the tank.
c Jane took her vehicle to a car dealer for servicing. The oiland the oil filter were changed, and new wiper blades wereinstalled. She also asked them to check over the motor as shewas planning to go on a long trip. The costs were as follows:four litres of oil at $2.05 per litre, one oil filter at $5.60 andtwo wiper blades at $9.75 per pair. The time required forservicing was 0.6 hours. The shop rate for labour was $59per hour. How much is this servicing going to cost Jane?

G-127
APPENDIX G: ILLUSTRATIVE EXAMPLES • Essentials of Mathematics 11
Prescribed Learning Outcomes Illustrative Examples
OWNING AND OPERATING A VEHICLE
It is expected that students will analyse the cost of acquiring and operating a vehicle.
c The trade-in value of a car decreases yearly. This loss invalue is called depreciation and is illustrated in the graphbelow. The per cents given in the graph are based on theprice of the car when it was new.
Carli et al., Consumer and Career Mathematics, p 274.Reprinted and adapted with permission.
a) Mark and Cathy bought a new car for $18,900 two yearsago. What is the approximate trade-in value of the car,and how much has the car depreciated?
b) Find the value of the car after seven years.c) Make a generalization about the depreciation of a new
car over several years.
12
34
5
100%
Percent of Selling Price
Years after Purchase
90%80%70%60%50%40%30%20%10%0%

G-128
APPENDIX G: ILLUSTRATIVE EXAMPLES • Essentials of Mathematics 11
Prescribed Learning Outcomes Illustrative Examples
PERSONAL INCOME TAX
It is expected that students will prepare a simple income tax form.
It is expected that students will:
• prepare an income tax form for anindividual who is single, employed andwithout dependents
c Calculate your personal income tax, using an appropriateprinted or electronic Canada Customs and Revenue Agencyform. Note: Canada Customs and Revenue Agency willsupply student activity booklets for this.

G-129
APPENDIX G: ILLUSTRATIVE EXAMPLES • Essentials of Mathematics 11
Prescribed Learning Outcomes Illustrative Examples
APPLICATIONS OF PROBABILITY
It is expected that students will demonstrate an awareness of the applications of probability to real world situations.
It is expected that students will:
• express probabilities as ratios, fractions,decimals, percents, and in words
• use probability to predict the result in agiven situation
• determine the odds for and against aparticular event occurring
• compare experimental observations withtheoretical predictions
• use probabilities to calculate expectedgains and losses
c After rolling a die, express the probability that a 5 will berolled:- as a ratio- as a fraction- as a decimal- as a percent- in words
c The probability of drawing a diamond from a well shuffleddeck is 1 in 4. If you made 20 draws (returning each card),how many diamonds would you theoretically expect todraw?
c What are the odds of rolling a 1 or 2 with a 6-sided die?
c What are the odds against drawing a diamond from a wellshuffled deck?
c Using a die with faces numbered 1 to 6,- what is the probability of rolling: a 6? a 4? a 1?- perform an experiment with a die and compare the
results
c *For each game decide whether you are willing to play thegame and explain your decision:a) Pay $1. Toss a coin. If it shows heads, you get $2 back.b) Pay $1. Draw a card from a shuffled deck. If it is a heart,
you get $5.c) Pay $2. Draw a card from a shuffled deck. If it is a jack or
ace, you get $10.d) Pay $1. Roll a dice. If a 2 or 3 shows up, you get $4 back.e) Pay $1. Toss two coins. If they are both heads, you get $3
back.

G-130
APPENDIX G: ILLUSTRATIVE EXAMPLES • Essentials of Mathematics 11
Prescribed Learning Outcomes Illustrative Examples
c It costs $2 to play the game “Pick the Marble.” In this game,a bag contains four red marbles, one black marble, and fivewhite marbles. You randomly pick a marble from the bag. Ifit is red, you win $5, and if it is black, you win $10.However, if it is white, you do not win anything. Determinethe expected value of the game. If you play this game 20times, what would your expected gain or loss be?
c Sherry takes a 100-item multiple-choice examination. Eachitem has four possible choices. She knows 68 of the answersand guess randomly at the other 32. calculate her expectednumber of correct answers.a) Explain how you calculated her expected score.b) If Sherry's score was actually higher or lower that her
expected score, how would you explain it to her?
• communicate and justify solutions toprobability problems
APPLICATIONS OF PROBABILITY
It is expected that students will demonstrate an awareness of the applications of probability to real world situations.

G-131
APPENDIX G: ILLUSTRATIVE EXAMPLES • Essentials of Mathematics 11
Prescribed Learning Outcomes Illustrative Examples
BUSINESS PLAN
It is expected that students will prepare a plan to own and operate a successful business.
c *As owner and manager of a proposed Running Shoe Storein the mall, you must first produce a business plan before abank will loan you the money to start.a) Decide on the type of shoe to sell, and the number of
pairs of each shoe to stock.b) Determine the monthly cost of operation including rent,
wages including deductions, insurance, utilities andadvertising.
c) Design an employee schedule.d) Develop a cash flow model including estimated daily
sales, gross profit, and estimated time to profitability.e) Draw a floor plan to scale.
c You decide to set up a lawn-care business. Prepare abusiness plan to apply for a student loan.
It is expected that students will:
• prepare a business plan to own andoperate a business that includes thefollowing information to appropriate:- monthly cost of operation (e.g.
inventory, rent, wages, insurance,advertising, loan payments, etc.)
- hours of operation- estimated daily sales (average)- gross/net profit,- hourly earning
• draw a scale floor plan of the store
APPENDIX G
ILLUSTRATIVE EXAMPLES
Essentials of Mathematics 12

G-135
APPENDIX G: ILLUSTRATIVE EXAMPLES • Essentials of Mathematics 12
Prescribed Learning Outcomes Illustrative Examples
It is expected that students will:
• solve problems that involve a specificcontent area
• solve problems that involve more thanone content area
• solve problems that involve mathematicswithin other disciplines
• analyse problems and identify thesignificant elements
• develop specific skills in selecting andusing an appropriate problem-solvingstrategy or combination of strategieschosen from, but not restricted to, thefollowing:- guess and check- look for a pattern- make a systematic list- make and use a drawing or model- eliminate possibilities- work backward- simplify the original problem- develop alternative original approaches- analyse keywords
• demonstrate the ability to workindividually and co-operatively to solveproblems
• determine that their solutions are correctand reasonable
• clearly communicate a solution to aproblem and the process used to solve it
• interpret their solutions by describingwhat the solution means within thecontext of the original problem
• use appropriate technology to assist inproblem solving
PROBLEM SOLVING
It is expected that students will use a variety of methods to solve real-life, practical, technical, and theoretical problems.
Illustrative Examples for Problem Solving have beenindicated with an asterisk (*) throughout Appendix G.
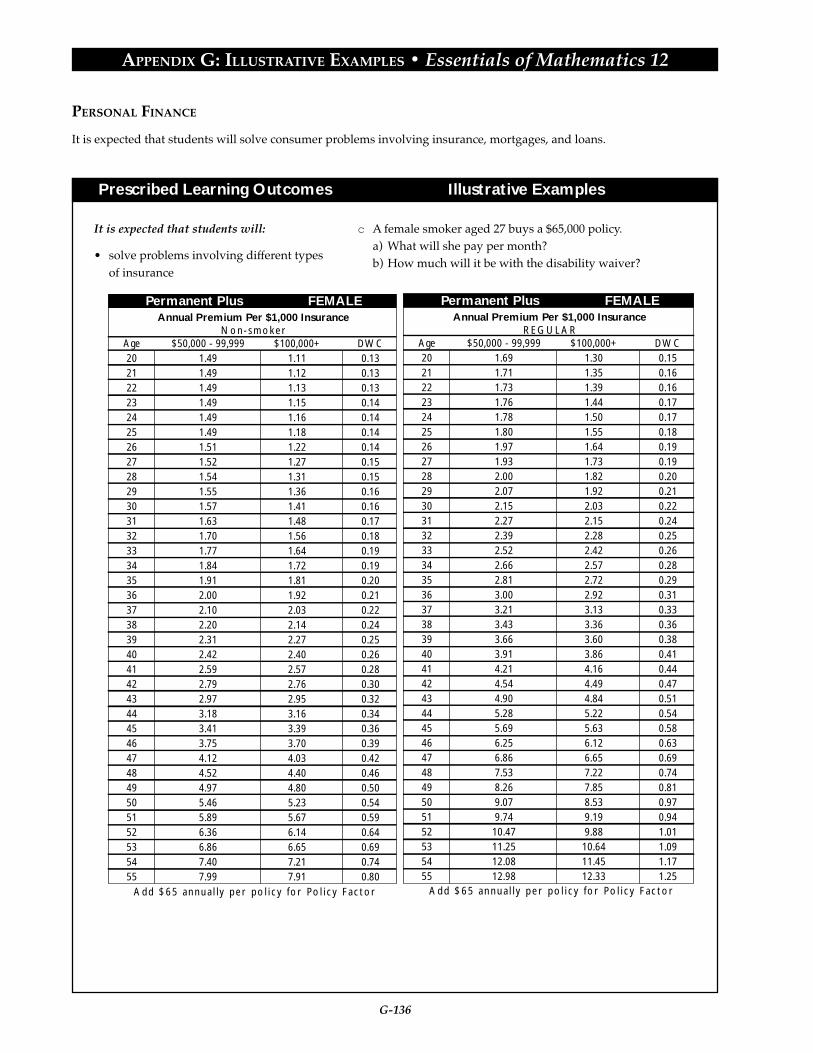
G-136
APPENDIX G: ILLUSTRATIVE EXAMPLES • Essentials of Mathematics 12
Prescribed Learning Outcomes Illustrative Examples
PERSONAL FINANCE
It is expected that students will solve consumer problems involving insurance, mortgages, and loans.
It is expected that students will:
• solve problems involving different typesof insurance
c A female smoker aged 27 buys a $65,000 policy.a) What will she pay per month?b) How much will it be with the disability waiver?
Age202122232425262728293031323334353637383940414243444546474849505152535455
Annual Premium Per $1,000 InsuranceNon-smoker
$50,000 - 99,9991.491.491.491.491.491.491.511.521.541.551.571.631.701.771.841.912.002.102.202.312.422.592.792.973.183.413.754.124.524.975.465.896.366.867.407.99
$100,000+1.111.121.131.151.161.181.221.271.311.361.411.481.561.641.721.811.922.032.142.272.402.572.762.953.163.393.704.034.404.805.235.676.146.657.217.91
DWC0.130.130.130.140.140.140.140.150.150.160.160.170.180.190.190.200.210.220.240.250.260.280.300.320.340.360.390.420.460.500.540.590.640.690.740.80
Permanent Plus FEMALE
Add $65 annual ly per pol icy for Pol icy Factor
Age202122232425262728293031323334353637383940414243444546474849505152535455
Annual Premium Per $1,000 InsuranceREGULAR
$50,000 - 99,9991.691.711.731.761.781.801.971.932.002.072.152.272.392.522.662.813.003.213.433.663.914.214.544.905.285.696.256.867.538.269.079.7410.4711.2512.0812.98
$100,000+1.301.351.391.441.501.551.641.731.821.922.032.152.282.422.572.722.923.133.363.603.864.164.494.845.225.636.126.657.227.858.539.199.8810.6411.4512.33
DWC0.150.160.160.170.170.180.190.190.200.210.220.240.250.260.280.290.310.330.360.380.410.440.470.510.540.580.630.690.740.810.970.941.011.091.171.25
Permanent Plus FEMALE
Add $65 annual ly per pol icy for Pol icy Factor
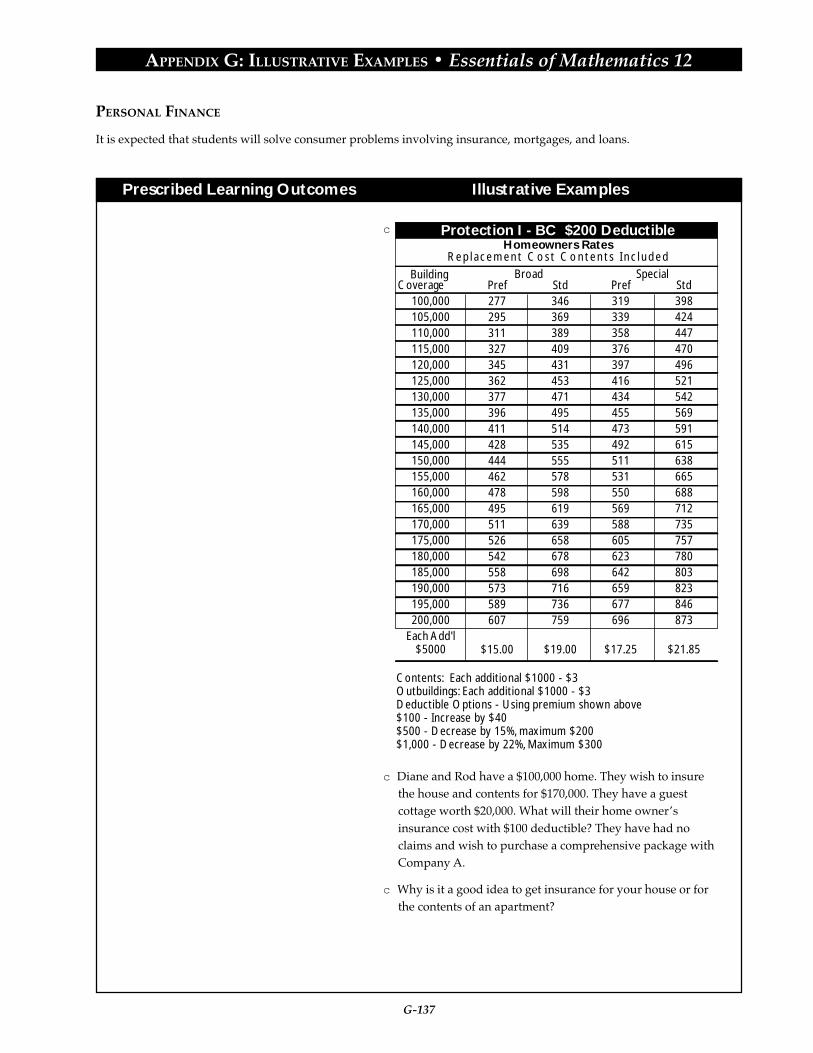
G-137
APPENDIX G: ILLUSTRATIVE EXAMPLES • Essentials of Mathematics 12
Prescribed Learning Outcomes Illustrative Examples
PERSONAL FINANCE
It is expected that students will solve consumer problems involving insurance, mortgages, and loans.
Building Coverage
100,000105,000110,000115,000120,000125,000130,000135,000140,000145,000150,000155,000160,000165,000170,000175,000180,000185,000190,000195,000200,000
Each Add'l$5000
Homeowners RatesReplacement Cost Contents Inc luded
BroadPref277295311327345362377396411428444462478495511526542558573589607
$15.00
Std346369389409431453471495514535555578598619639658678698716736759
$19.00
SpecialPref319339358376397416434455473492511531550569588605623642659677696
$17.25
Std398424447470496521542569591615638665688712735757780803823846873
$21.85
Protection I - BC $200 Deductible
Contents: Each additional $1000 - $3Outbuildings: Each additional $1000 - $3Deductible Options - Using premium shown above$100 - Increase by $40$500 - Decrease by 15%, maximum $200$1,000 - Decrease by 22%, Maximum $300
c
c Diane and Rod have a $100,000 home. They wish to insurethe house and contents for $170,000. They have a guestcottage worth $20,000. What will their home owner’sinsurance cost with $100 deductible? They have had noclaims and wish to purchase a comprehensive package withCompany A.
c Why is it a good idea to get insurance for your house or forthe contents of an apartment?
G-138
APPENDIX G: ILLUSTRATIVE EXAMPLES • Essentials of Mathematics 12
Prescribed Learning Outcomes Illustrative Examples
c *The Baileys live in Prince George and are relocating toVictoria. They purchase a house for $220,000 and hire amover to move their personal belongings. The movercharges $1,500. They hire a lawyer to look after legalities fora fee of $800. An appraisal is done of the property at a costof $120. A survey of the property is done for a cost of $450.The Baileys’ possession date is July 7th with the firstpayment due on July 15th. The interest cost for the additional8 days is $140. Property taxes are $1,750 for which theBaileys agree to pay for the six months of July to December.Before moving in the Baileys have the yard re-sod for $3,500and replace the stove and fridge for $750 and $900respectively. They split the costs of the appliances with theseller. Mrs. Bailey replaces the drapes in the living room for$500 and has the master bedroom painted for $350. Theseller notifies the family that they prepaid the water andgarbage to the end of the year at $49.50 per month. TheBaileys agree to pay for July to December. The cost to hookup the phone is $65 and to activate the natural gas costs $45.They increase their insurance to $680 from $256 per yearand pay for the remaining six months.Create a spreadsheet to complete the necessary calculationsfor finding the additional costs besides the cost of the houseitself.
c A person decided to buy a house worth $85,000. The downpayment will be $6,000, the monthly property taxes are$120, the heating costs are $110 per month. Calculate themaximum affordable price, the monthly mortgage paymentand the gross debt ratio if the bank will finance the house at7.50% for 25 years. The gross monthly income is $2,500.
• determine the costs involved inpurchasing a home, including gross debtservice ratio
PERSONAL FINANCE
It is expected that students will solve consumer problems involving insurance, mortgages, and loans.
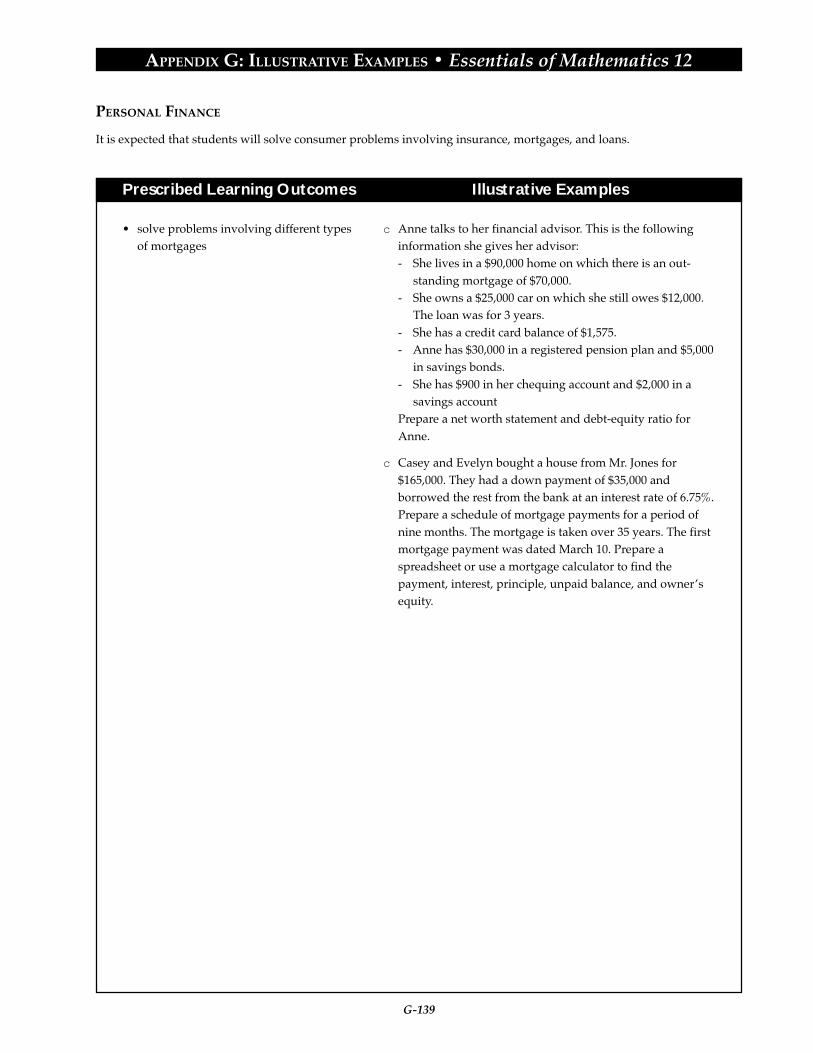
G-139
APPENDIX G: ILLUSTRATIVE EXAMPLES • Essentials of Mathematics 12
Prescribed Learning Outcomes Illustrative Examples
• solve problems involving different typesof mortgages
PERSONAL FINANCE
It is expected that students will solve consumer problems involving insurance, mortgages, and loans.
c Anne talks to her financial advisor. This is the followinginformation she gives her advisor:- She lives in a $90,000 home on which there is an out-
standing mortgage of $70,000.- She owns a $25,000 car on which she still owes $12,000.
The loan was for 3 years.- She has a credit card balance of $1,575.- Anne has $30,000 in a registered pension plan and $5,000
in savings bonds.- She has $900 in her chequing account and $2,000 in a
savings accountPrepare a net worth statement and debt-equity ratio forAnne.
c Casey and Evelyn bought a house from Mr. Jones for$165,000. They had a down payment of $35,000 andborrowed the rest from the bank at an interest rate of 6.75%.Prepare a schedule of mortgage payments for a period ofnine months. The mortgage is taken over 35 years. The firstmortgage payment was dated March 10. Prepare aspreadsheet or use a mortgage calculator to find thepayment, interest, principle, unpaid balance, and owner’sequity.

G-140
APPENDIX G: ILLUSTRATIVE EXAMPLES • Essentials of Mathematics 12
Prescribed Learning Outcomes Illustrative Examples
DESIGN AND MEASUREMENTS
It is expected that students will analyse objects, shapes, and processes to solve cost and design problems.
It is expected that students will:
• analyse objects that are shown in“exploded” format
• draw objects in “exploded” format
• solve problems involving estimation andcosting for objects, shapes, or processeswhen a design in given
• design an object within a specified budget
c Find an example of an exploded diagram from a hardwarestore, home improvement store, lumber yard, or othersource. Using your exploded diagram to answer thefollowing questions:a) Can the object in question be constructed from the drawn
pieces?b) What information about the object not been included in
the diagram?c) What is the purpose of providing an exploded diagam?
c *The following diagram is a sketch of a log cabin blockdesign for quilts:
a) If you want to create a 60” x 72” twin quilt (not includinga border), how many 12” x 12” blocks must you make?
b) Create an exploded view of this quilt block.c) Create a diagram of the constituent parts using a scale of
1:2.d) Seams for each piece in the block are to be 1/4” wide. Bolts
of material are 45” wide. What total length of materialwould need to be purchased to create the twin quilt?
e) If material is sold only by the metre, what total length ofmaterial would need to be purchased?
f) Color the design pieces using black and white. Black clothis sold at $7.25 per metre and white cloth at $4.95 permetre. What is the cost of the quilt if these two colors areused?
g) What is the cost of the material wasted?
c You are given $25 to build a birdhouse. Provide a 3-Ddiagram and exploded view diagram of your design.Compile a materials list and cost the materials with aminimum of two suppliers. Adjust your materials to workwithin the $25 limit.
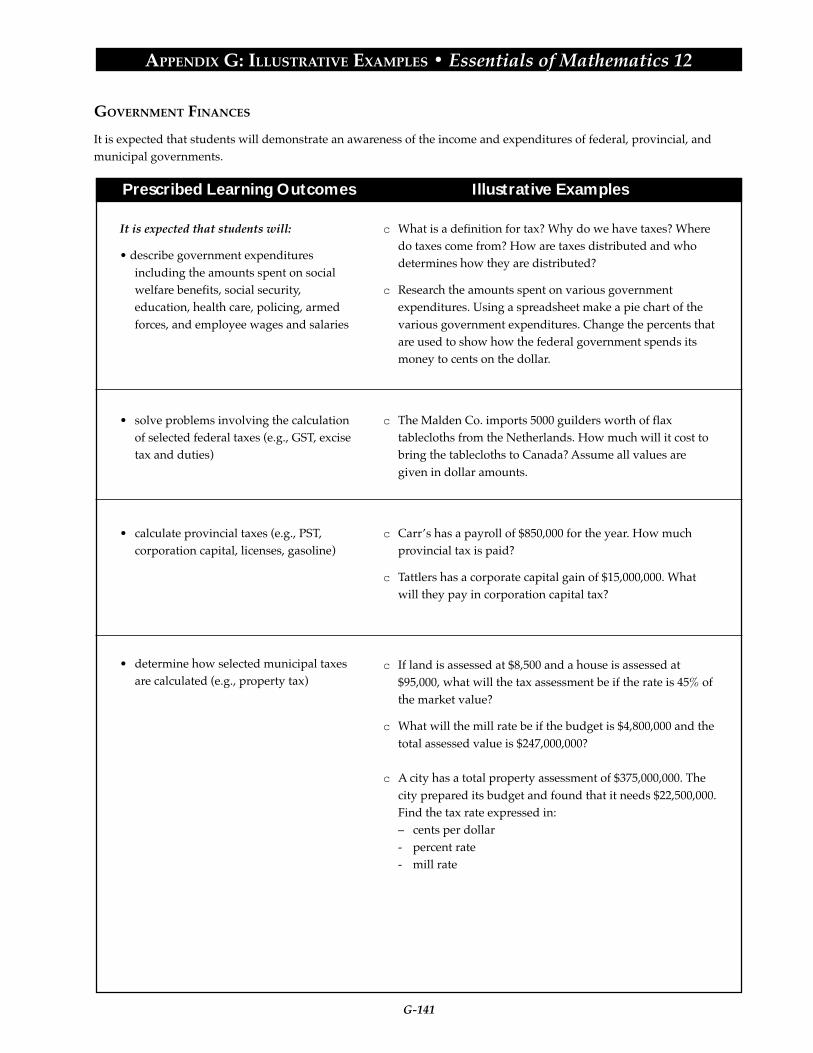
G-141
APPENDIX G: ILLUSTRATIVE EXAMPLES • Essentials of Mathematics 12
Prescribed Learning Outcomes Illustrative Examples
GOVERNMENT FINANCES
It is expected that students will demonstrate an awareness of the income and expenditures of federal, provincial, andmunicipal governments.
It is expected that students will:
• describe government expendituresincluding the amounts spent on socialwelfare benefits, social security,education, health care, policing, armedforces, and employee wages and salaries
• solve problems involving the calculationof selected federal taxes (e.g., GST, excisetax and duties)
• calculate provincial taxes (e.g., PST,corporation capital, licenses, gasoline)
• determine how selected municipal taxesare calculated (e.g., property tax)
c What is a definition for tax? Why do we have taxes? Wheredo taxes come from? How are taxes distributed and whodetermines how they are distributed?
c Research the amounts spent on various governmentexpenditures. Using a spreadsheet make a pie chart of thevarious government expenditures. Change the percents thatare used to show how the federal government spends itsmoney to cents on the dollar.
c The Malden Co. imports 5000 guilders worth of flaxtablecloths from the Netherlands. How much will it cost tobring the tablecloths to Canada? Assume all values aregiven in dollar amounts.
c Carr’s has a payroll of $850,000 for the year. How muchprovincial tax is paid?
c Tattlers has a corporate capital gain of $15,000,000. Whatwill they pay in corporation capital tax?
c If land is assessed at $8,500 and a house is assessed at$95,000, what will the tax assessment be if the rate is 45% ofthe market value?
c What will the mill rate be if the budget is $4,800,000 and thetotal assessed value is $247,000,000?
c A city has a total property assessment of $375,000,000. Thecity prepared its budget and found that it needs $22,500,000.Find the tax rate expressed in:– cents per dollar- percent rate- mill rate

G-142
APPENDIX G: ILLUSTRATIVE EXAMPLES • Essentials of Mathematics 12
Prescribed Learning Outcomes Illustrative Examples
c What is a levy? What is an educational levy and how is itused?
c A property owner receives a Statement and Demand fortaxes each year. This is what it looks like. Show how thelevies are calculated.
c Andy’s house is assessed for $58,000. The municipal levy is21 mills and the educational tax levy is 29 mills. There is anextra $400 that will be added for street lights, paid over thenext five years. What is the total tax to be paid?
GOVERNMENT FINANCES
It is expected that students will demonstrate an awareness of the income and expenditures of federal, provincial, andmunicipal governments.

G-143
APPENDIX G: ILLUSTRATIVE EXAMPLES • Essentials of Mathematics 12
Prescribed Learning Outcomes Illustrative Examples
LIFE/CAREER PROJECT
It is expected that students will research career choices and perform a comparative study.
It is expected that students will:
• determine what factors are important inanalyzing careers
• describe two specific career opportunities
• identify the mathematical educationalrequirements for two careers
• compare two careers in terms of salary,working hours, training time and cost,cost of living, and benefits
c Make a list of factors which are important to you inchoosing a career.
c Analyse two career choices you are interested in and look atthe factors that will determine some lifestyle options.Factors that you need to consider are food, clothing, shelter,education, salary, job security, transportation, insurance,recreation, taxes, family size, and charitable politicalcontibutions. In your descriptions of the research, provide:- a job description for each selected career- educational backgrounds or training requirements,
including associated costs- salary/wage levels for each career- available employment opportunities in the field- opportunity for advancement
c *From the above two careers, analyse in depth one of yourchoices and the lifestyle it permits. The following itemsshould be considered in detail:- Describe the job in terms of duties, salary/wage, dress
code, benefits, and employment opportunities.- Detail the educational requirements and the associated
costs for the career with particular reference to themathematical requirements.
- Prepare an annual budget to determine the moneyneeded to acquire the training.
- Identify potential issues that may be relevant to thecareer (e.g., stress, environment, or other associatedfactors).
- Describe a lifestyle which a career might ensure, includ-ing a budgetary analysis supporting the description.
- Create a resume and application for the selected career.

G-144
APPENDIX G: ILLUSTRATIVE EXAMPLES • Essentials of Mathematics 12
Prescribed Learning Outcomes Illustrative Examples
INVESTMENTS
It is expected that students will demonstrate and recognize the differences among different types of financialinvestments.
It is expected that students will:
• determine a financial plan to achievepersonal goals
c List three goals you hope to achieve this year. Discuss why theyare important to you and how you plan on achieving them.
c List the top ten things you value most in life. Briefly describewhy each value is important to you.
c What are the functions of advertising and how does itinfluence your goals?
c List your favourite and least favourite ad on TV, in magazinesor newspapers. Describe why you like or dislike these ads.
c List three financial goals for people at different stages of life(e.g., 20s single, 50s married).
c *Complete the following worksheet for yourself. Its purposeis to help you realize the amount of income you may needlater in life and the type of investments that are appropriatefor your needs.a) At what age would you like to retire?____________
How old are you now?____________b) What is the monthly income you think you will need to
maintain your expected lifestyle upon retiring? (in todaysdollars) ____________
c) Using the figure above and assuming a 4% inflation rate,how much does this amount translate to when you expectto retire? ____________ (use the chart below)
d) What are your expected sources of retirement income?__________________________________________________
e) What amount of investment will be required to providean income for the retirement income above (assuming an8% return on your investment)?______________________
c What is the difference between GICs and bonds?
c What is the difference between mutual funds and stocks?
• describe different investment vehicles(e.g., GICs, bonds, mutual funds, stocks,and real estate)
Years to Retirement Inflation factor at 4%5
15
25
35
1.2
1.8
2.7
4.0
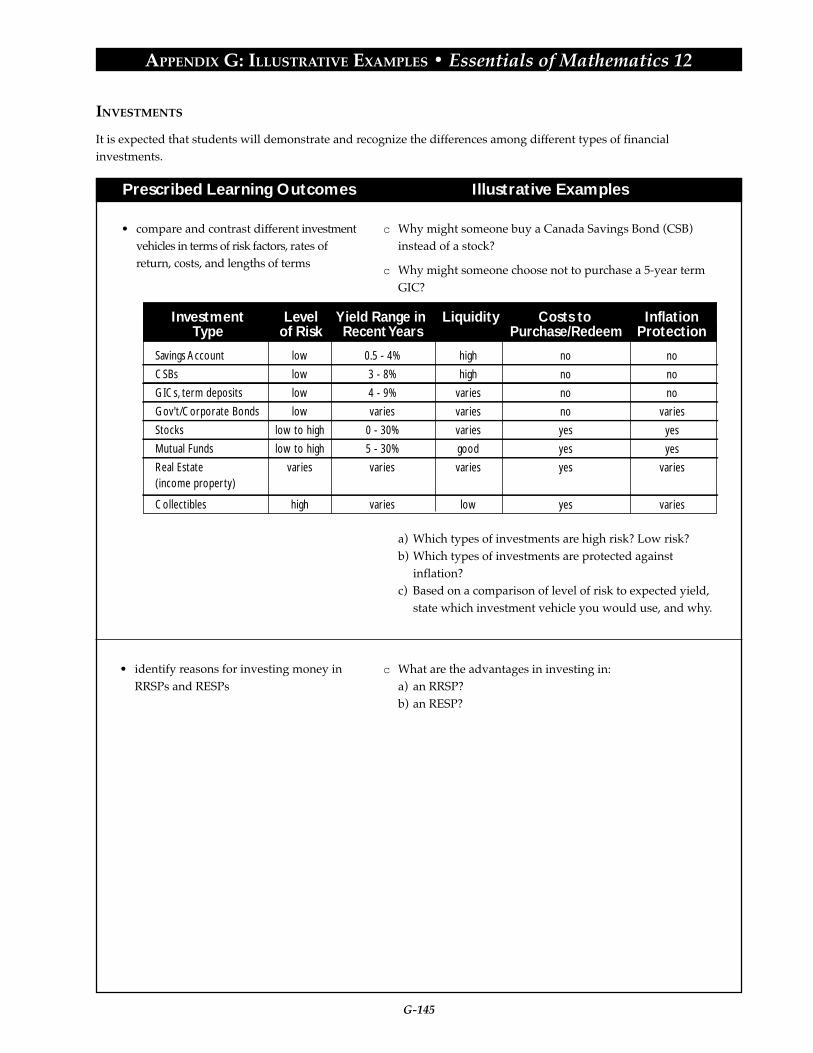
G-145
APPENDIX G: ILLUSTRATIVE EXAMPLES • Essentials of Mathematics 12
Prescribed Learning Outcomes Illustrative Examples
Savings Account
CSBs
GICs, term deposits
Gov't/Corporate Bonds
Stocks
Mutual Funds
Real Estate(income property)
Collectibles
low
low
low
low
low to high
low to high
varies
high
0.5 - 4%
3 - 8%
4 - 9%
varies
0 - 30%
5 - 30%
varies
varies
high
high
varies
varies
varies
good
varies
low
no
no
no
no
yes
yes
yes
yes
no
no
no
varies
yes
yes
varies
varies
InvestmentType
Levelof Risk
Yield Range in Recent Years
Liquidity Costs to Purchase/Redeem
InflationProtection
c Why might someone choose not to purchase a 5-year termGIC?
a) Which types of investments are high risk? Low risk?b) Which types of investments are protected against
inflation?c) Based on a comparison of level of risk to expected yield,
state which investment vehicle you would use, and why.
c What are the advantages in investing in:a) an RRSP?b) an RESP?
INVESTMENTS
It is expected that students will demonstrate and recognize the differences among different types of financialinvestments.
• identify reasons for investing money inRRSPs and RESPs
c Why might someone buy a Canada Savings Bond (CSB)instead of a stock?
• compare and contrast different investmentvehicles in terms of risk factors, rates ofreturn, costs, and lengths of terms

G-146
APPENDIX G: ILLUSTRATIVE EXAMPLES • Essentials of Mathematics 12
Prescribed Learning Outcomes Illustrative Examples
INVESTMENTS
It is expected that students will demonstrate and recognize the differences among different types of financialinvestments.
It is expected that students will:
• investigate how to purchase and sellstocks
c Jon’s broker advised him to invest some of his money inABC Ltd. ABC is currently listed on a stock exchange at$21.45 a share. How much will it cost Jon to purchase 200shares?
c If Jon’s broker charges him a fee of 2% of the value of theorder, calculate the total cost to purchase the 200 shares.
c Some brokers use a commission schedule based on a pershare basis, regardless of the price of the stock. Following isa fee schedule used by one broker.
Use the schedule to answer the following:
$0.08 per share for 1 - 499 shares
$0.065 per share for 500 - 999 shares
$0.05 per share for 1000 - 2499 shares
$0.04 per share for over 2500 shares
Base Charge
of $40 plus:
Number of Shares
Cost per Share
Stock Commission Total Cost
Ashton 600 $1.55
Denison 3000 $0.45
Polyair 2300 $3.75
Softkey 800 $27.27

G-147
APPENDIX G: ILLUSTRATIVE EXAMPLES • Essentials of Mathematics 12
Prescribed Learning Outcomes Illustrative Examples
TAXATION
It is expected that students will demonstrate an ability to fill out an income tax form.
It is expected that students will:
• fill out income tax forms for:- single parent with a child- married couple with one person
working- married couple with children
c *Profile: Married couple with children
Tina and Brad Shoe have three children, Jimmy, Timmy, andKimmy.
Tina works part-time at The Grocery Store. In 1998, Tinamade $9,264. Tina was born April 18, 1969.
Brad is a construction worker who worked for nine monthsin 1998 and made $56,490. For the other three months, Bradcollected employment insurance benefits. The attached T4Eslip show these benefits. He paid $960 in union dues lastyear. In addition he contributed $4,500 to his RESP, which hewill be able to claim in full.
Tina and Brad made $350worth of charitable donations lastyear. They also had medical expenses of $1434 and interestincome of $458 on their savings account.
Complete Tina and Brad’s income tax return for 1998.

G-148
APPENDIX G: ILLUSTRATIVE EXAMPLES • Essentials of Mathematics 12
Prescribed Learning Outcomes Illustrative Examples
TAXATION
It is expected that students will demonstrate an ability to fill out an income tax form.

G-149
APPENDIX G: ILLUSTRATIVE EXAMPLES • Essentials of Mathematics 12
Prescribed Learning Outcomes Illustrative Examples
VARIATION AND FORMULAS
It is expected that students will use algebraic and graphical models to generalize patterns, make predictions, and solveproblems.
It is expected that students will:
• plot and analyse examples of directvariation, partial variation, and inversevariation
c The distance (d) that a car travels at 90 km/h is directlyproportional to the time (t) traveled. Write an equation andfind sufficient points to graph this relationship.
c According to Ohm’s Law, the current (A) flowing in a wire isinversely proportional to the resistance (Ω) of the wire. If thecurrent is 5 amperes when the resistance is 24 ohms, what isthe current when the resistance is 3 ohms?
c In each of the following situations, state what kind ofvariation is represented. Sketch the graph.a)
b)
c A private parking lot charges $1.00 to park on their lot forany amount of time up to 30 minutes. Additional time isrounded up the nearest 1/2 hour and cost $0.75per half hourto a maximum of $5.50 per day. Complete a table of valuesin 30 minute time intervals that shows the cost of parking.What is the minimum amount of time parked needed toallow the daily maximum.
• given data, graph, or a situation,recognize the variation represented
x y
0 0
1 2
2 8
3 18
4 32
5 50
x y
1 360
2 180
3 120
4 90
5 72

G-150
APPENDIX G: ILLUSTRATIVE EXAMPLES • Essentials of Mathematics 12
Prescribed Learning Outcomes Illustrative Examples
• use formulas to solve problems
c Carla walks toward her house and then walks away fromit. Which graph best represents this situation if the distancefrom the house is on a vertical axis and elapsed time is onthe horizontal axis?
c Write a relationship that describes each of the followinggraphs. Be sure to label your axes.
c Consider the formula for the volume of a cylinder:
V r h= π 2
a) How is the volume affected if the height is doubled?b) How is the volume affected if the radius is doubled?c) What is the effect of halving the radius and tripling the
height?
Ad
t
Dd
t
Cd
t
Bd
t
A B
DC
VARIATION AND FORMULAS
It is expected that students will use algebraic and graphical models to generalize patterns, make predictions, and solveproblems.

G-151
APPENDIX G: ILLUSTRATIVE EXAMPLES • Essentials of Mathematics 12
Prescribed Learning Outcomes Illustrative Examples
VARIATION AND FORMULAS
It is expected that students will use algebraic and graphical models to generalize patterns, make predictions, and solveproblems.
c In order for a satellite to remain in orbit, the speed of thesatellite can be determined by the formula s =
d5.15x1012
,where s represents the speed in km/h and d is the distancebetween the satellite and the centre of the Earth in km. If theEarth has a diameter of 12,750 km, find the speed of asatellite that is 36,000 km above the Earth.
c *I have just inherited some money from my grandfather. Iwant to spend some of it now, but also want to save somefor college or university next year.a) On a one-year GIC, $5000 minimum investment, the bank
pays 5.5% interest, compounded annually. How muchwill I have to invest in the GIC in order to have $6000 inone year’s time?
b) If I wait three years to go to school, I can invest themoney for three years in a GIC that pays 6% interest,compounded annually. How much would I have to investat this rate in order to have $6000 in three years?


APPENDIX G
ILLUSTRATIVE EXAMPLES
Principles of Mathematics 10


G-155
APPENDIX G: ILLUSTRATIVE EXAMPLES • Principles of Mathematics 10
Prescribed Learning Outcomes Illustrative Examples
It is expected that students will:
• solve problems that involve a specificcontent area
• solve problems that involve more thanone content area
• solve problems that involve mathematicswithin other disciplines
• analyse problems and identify thesignificant elements
• develop specific skills in selecting andusing an appropriate problem-solvingstrategy or combination of strategieschosen from, but not restricted to, thefollowing:- guess and check- look for a pattern- make a systematic list- make and use a drawing or model- eliminate possibilities- work backward- simplify the original problem- develop alternative original approaches- analyse keywords
• demonstrate the ability to work individu-ally and co-operatively to solve problems
• determine that their solutions are correctand reasonable
• clearly communicate a solution to aproblem and the process used to solve it
• interpret their solutions by describingwhat the solution means within thecontext of the original problem
• use appropriate technology to assist inproblem solving
PROBLEM SOLVING
It is expected that students will use a variety of methods to solve real-life, practical, technical, and theoretical problems.
Illustrative Examples for Problem Solving have beenindicated with an asterisk (*) throughout Appendix G.
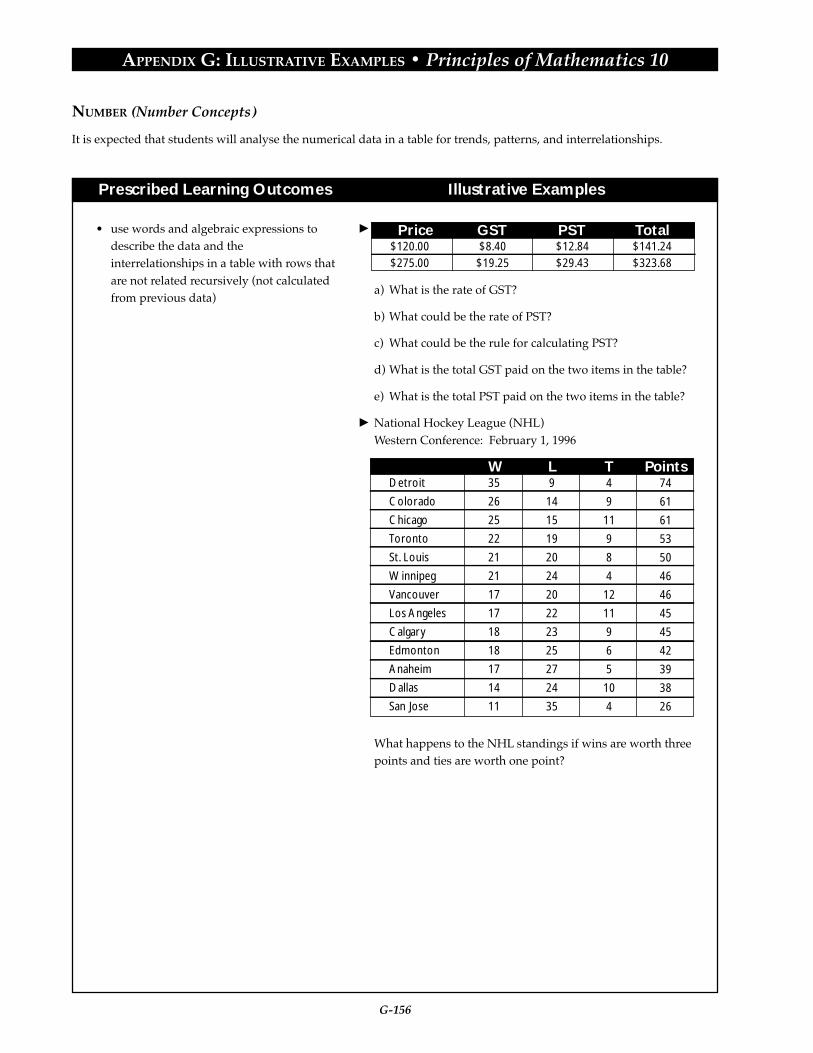
G-156
APPENDIX G: ILLUSTRATIVE EXAMPLES • Principles of Mathematics 10
Prescribed Learning Outcomes Illustrative Examples
NUMBER (Number Concepts)
It is expected that students will analyse the numerical data in a table for trends, patterns, and interrelationships.
• use words and algebraic expressions todescribe the data and theinterrelationships in a table with rows thatare not related recursively (not calculatedfrom previous data)
a) What is the rate of GST?
b) What could be the rate of PST?
c) What could be the rule for calculating PST?
d) What is the total GST paid on the two items in the table?
e) What is the total PST paid on the two items in the table?
National Hockey League (NHL)Western Conference: February 1, 1996
What happens to the NHL standings if wins are worth threepoints and ties are worth one point?
Price GST PST Total$120.00 $8.40 $12.84 $141.24$275.00 $19.25 $29.43 $323.68
W L T PointsDetroit
Colorado
Chicago
Toronto
St. Louis
Winnipeg
Vancouver
Los Angeles
Calgary
Edmonton
Anaheim
Dallas
San Jose
35
26
25
22
21
21
17
17
18
18
17
14
11
9
14
15
19
20
24
20
22
23
25
27
24
35
4
9
11
9
8
4
12
11
9
6
5
10
4
74
61
61
53
50
46
46
45
45
42
39
38
26

G-157
APPENDIX G: ILLUSTRATIVE EXAMPLES • Principles of Mathematics 10
Prescribed Learning Outcomes Illustrative Examples
NUMBER (Number Concepts)
It is expected that students will analyse the numerical data in a table for trends, patterns, and interrelationships.
• use words and algebraic expressions todescribe the data and theinterrelationships in a table with rowsthat are related recursively (calculatedfrom previous data)
*The following table provides data on the repayment of a$100,000 farm loan. The farmer has negotiated for oneannual payment to be made each year after harvest and forthe right to make an extra payment, if the harvest is good.Use the table to answer the questions.
Year Opening Interest Interest Regular Extra ClosingBalance Rate (%) Charged Payment Payment Balance
1
2
3
4
5
6
7
8
9
10
$100 000.00
$ 93 097.05
$ 85 641.87
$ 77 590.27
$ 68 894.54
$ 59 503.15
$ 49 360.46
$ 38 406.34
$ 26 575.90
$ 13 799.03
8
8
8
8
8
8
8
8
8
8
$8000.00
$7447.76
$6851.35
$6207.22
$5511.56
$4760.25
$3948.84
$3072.51
$2126.07
$1103.92
$14 902.95
$14 902.95
$14 902.95
$14 902.95
$14 902.95
$14 902.95
$14 902.95
$14 902.95
$14 902.95
$14 902.95
$93 097.05
$85 641.87
$77 590.27
$68 894.54
$59 503.15
$49 360.46
$38 406.34
$26 575.90
$13 799.03
$ 0.00
a) What is the period of the loan?
b) What is the amount of the annual payment?
c) How much of the annual payment at the end of Year 5went toward the opening balance? Show how todetermine the answer in two different ways.
d) Create an algebraic expression to find the answer in c).
e) If the interest rate went up to 11% in Year 10, how muchwould be owing at the end of Year 10?
f) What extra payment at the end of Year 4 would pay theloan off at the end of Year 8?
G-158
APPENDIX G: ILLUSTRATIVE EXAMPLES • Principles of Mathematics 10
Prescribed Learning Outcomes Illustrative Examples
NUMBER (Number Concepts)
It is expected that students will explain and illustrate the structure and the interrelationship of the sets of numberswithin the real number system.
• classify numbers as natural, whole,integer, rational or irrational, and showthat these number sets are “nested”within the real number system
Explain why the number 1.112111211112 . . . is irrational.
Given a set of numbers, place them in their appropriate boxin a nested Venn diagram.
Describe, orally and in writing, whether or not a number isirrational.
Give evidence that a particular real number, such as 3 , isrational or irrational.

G-159
APPENDIX G: ILLUSTRATIVE EXAMPLES • Principles of Mathematics 10
Prescribed Learning Outcomes Illustrative Examples
Write a set of instructions that will allow another student tofind:
a) 1 2 3
b) 9 4 3 5
c) the reciprocal of the square root of a number, using ascientific calculator
d) a 5% commission on a sale of $40 200
Mahal indicates that 2 8 has an approximate value of3.16. Use estimates to show whether Mahal’s answer isreasonable, and use a calculator to verify the accuracy ofMahal’s answer.
Find a decimal approximation of 5 - 23
to three decimalplaces.
Arrange the following in order of value from least to greatest:
7, 2 13, 3 6 , 4 5 , 5 2 .Use decimal approximations.
Evaluate 128 4 (3 16 )3 to three decimal places.
Find the length of the base and the height of an equilateraltriangle of area 24 cm2.
NUMBER (Number Operations)
It is expected that students will use basic arithmetic operations on real numbers to solve problems.
• communicate a set of instructions used tosolve an arithmetic problem
• perform arithmetic operations onirrational numbers, using appropriatedecimal approximations
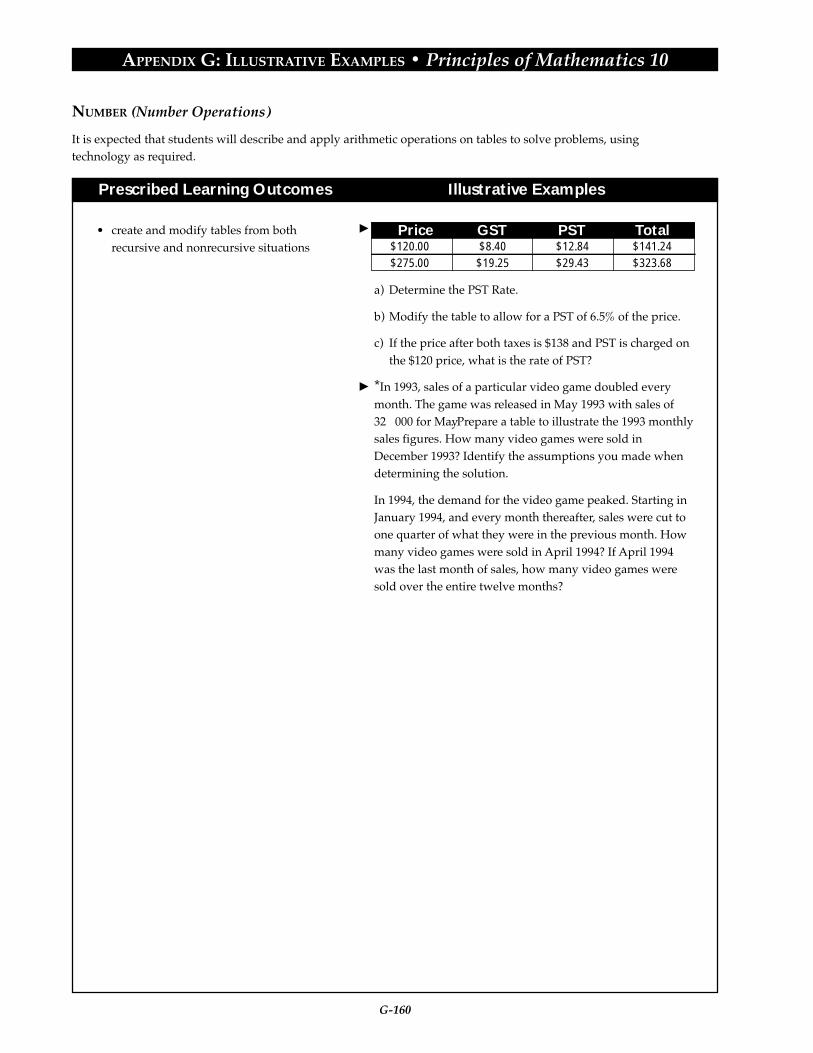
G-160
APPENDIX G: ILLUSTRATIVE EXAMPLES • Principles of Mathematics 10
Prescribed Learning Outcomes Illustrative Examples
NUMBER (Number Operations)
It is expected that students will describe and apply arithmetic operations on tables to solve problems, usingtechnology as required.
• create and modify tables from bothrecursive and nonrecursive situations
a) Determine the PST Rate.
b) Modify the table to allow for a PST of 6.5% of the price.
c) If the price after both taxes is $138 and PST is charged onthe $120 price, what is the rate of PST?
*In 1993, sales of a particular video game doubled everymonth. The game was released in May 1993 with sales of32 000 for May. Prepare a table to illustrate the 1993 monthlysales figures. How many video games were sold inDecember 1993? Identify the assumptions you made whendetermining the solution.
In 1994, the demand for the video game peaked. Starting inJanuary 1994, and every month thereafter, sales were cut toone quarter of what they were in the previous month. Howmany video games were sold in April 1994? If April 1994was the last month of sales, how many video games weresold over the entire twelve months?
Price GST PST Total$120.00 $8.40 $12.84 $141.24$275.00 $19.25 $29.43 $323.68
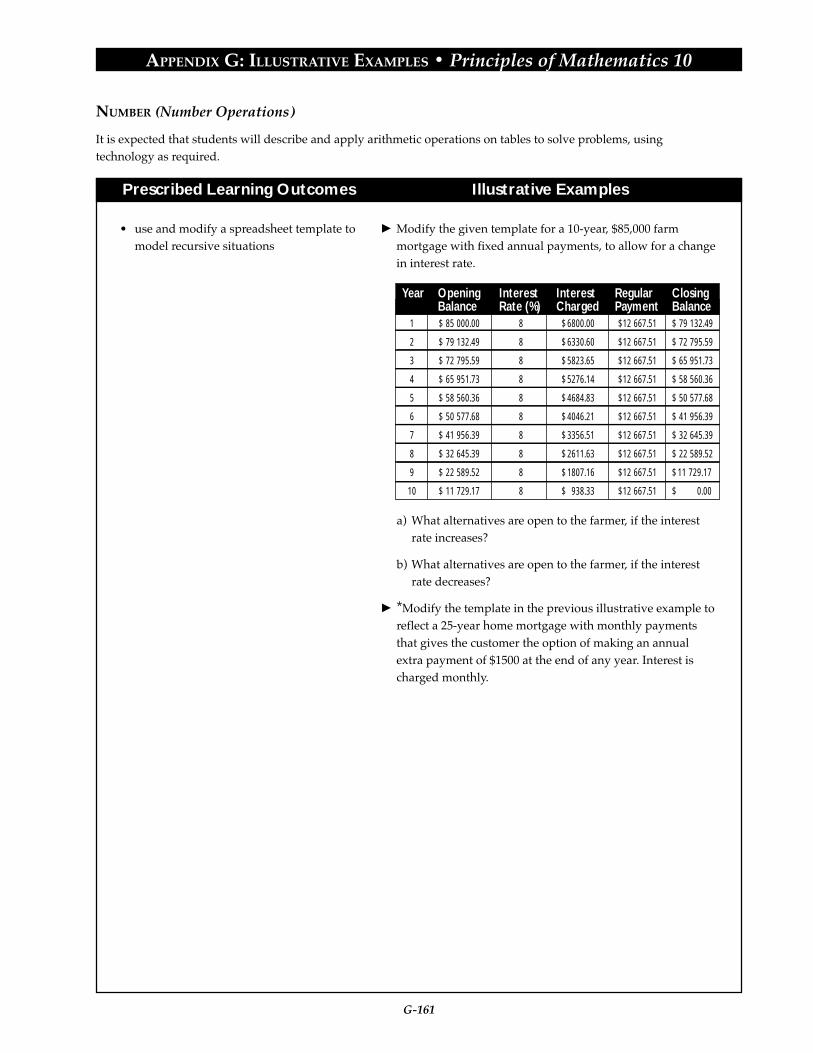
G-161
APPENDIX G: ILLUSTRATIVE EXAMPLES • Principles of Mathematics 10
Prescribed Learning Outcomes Illustrative Examples
NUMBER (Number Operations)
It is expected that students will describe and apply arithmetic operations on tables to solve problems, usingtechnology as required.
• use and modify a spreadsheet template tomodel recursive situations
Modify the given template for a 10-year, $85,000 farmmortgage with fixed annual payments, to allow for a changein interest rate.
Year Opening Interest Interest Regular ClosingBalance Rate (%) Charged Payment Balance
1
2
3
4
5
6
7
8
9
10
$ 85 000.00
$ 79 132.49
$ 72 795.59
$ 65 951.73
$ 58 560.36
$ 50 577.68
$ 41 956.39
$ 32 645.39
$ 22 589.52
$ 11 729.17
8
8
8
8
8
8
8
8
8
8
$6800.00
$6330.60
$5823.65
$5276.14
$4684.83
$4046.21
$3356.51
$2611.63
$1807.16
$ 938.33
$12 667.51
$12 667.51
$12 667.51
$12 667.51
$12 667.51
$12 667.51
$12 667.51
$12 667.51
$12 667.51
$12 667.51
$ 79 132.49
$ 72 795.59
$ 65 951.73
$ 58 560.36
$ 50 577.68
$ 41 956.39
$ 32 645.39
$ 22 589.52
$11 729.17
$ 0.00
a) What alternatives are open to the farmer, if the interestrate increases?
b) What alternatives are open to the farmer, if the interestrate decreases?
*Modify the template in the previous illustrative example toreflect a 25-year home mortgage with monthly paymentsthat gives the customer the option of making an annualextra payment of $1500 at the end of any year. Interest ischarged monthly.

G-162
APPENDIX G: ILLUSTRATIVE EXAMPLES • Principles of Mathematics 10
Prescribed Learning Outcomes Illustrative Examples
NUMBER (Number Operations)
It is expected that students will use exact values, arithmetic operations, and algebraic operations on real numbers tosolve problems.
• perform operations on irrational numbersof monomial and binomial form, usingexact values
Show that 2 8 3 2 .
Find an equivalent form of 5
32 that has a whole number
as its denominator.
Arrange the following in order from least to greatest:
7, 2 13, 3 6 , 4 5 , 5 2 . Do not use decimalapproximations.
Simplify 128 4( )3 163 ,giving the answer as an exactvalue.
Find an equivalent of 5 4 23( ) 5 3 24( ).
*An equilateral triangle is inscribed in a circle. If the area ofthe circle is 36π, find the exact area of the equilateraltriangle.

G-163
APPENDIX G: ILLUSTRATIVE EXAMPLES • Principles of Mathematics 10
Prescribed Learning Outcomes Illustrative Examples
NUMBER (Number Operations)
It is expected that students will use exact values, arithmetic operations, and algebraic operations on real numbers tosolve problems.
• explain and apply the exponent laws forpowers of numbers and for variables withrational exponents
Simplify 8( )27
2( )3
.
Write the number expression 72( )3
, using radicals.
Simplify x3( )5 x2( )3 .
Write an equivalent expression for 3x53 2 , using exponents.
Prove that 2 is an irrational number.
*The 5 5 geoboard shown in the diagram can be used toconstruct squares whose areas are whole numbers. Thesides of the squares can be constructed by joining dotshorizontally, vertically or diagonally. What whole numberareas can be constructed? Justify your answers withappropriate drawings and calculations.
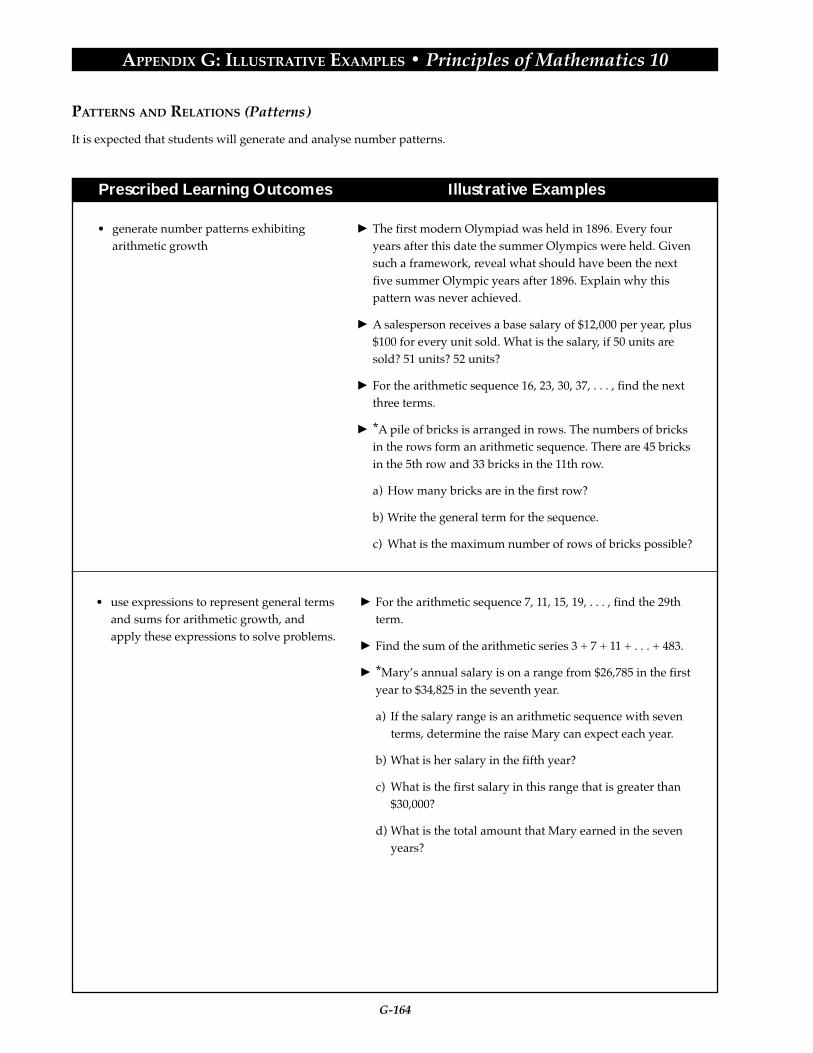
G-164
APPENDIX G: ILLUSTRATIVE EXAMPLES • Principles of Mathematics 10
Prescribed Learning Outcomes Illustrative Examples
PATTERNS AND RELATIONS (Patterns)
It is expected that students will generate and analyse number patterns.
• generate number patterns exhibitingarithmetic growth
The first modern Olympiad was held in 1896. Every fouryears after this date the summer Olympics were held. Givensuch a framework, reveal what should have been the nextfive summer Olympic years after 1896. Explain why thispattern was never achieved.
A salesperson receives a base salary of $12,000 per year, plus$100 for every unit sold. What is the salary, if 50 units aresold? 51 units? 52 units?
For the arithmetic sequence 16, 23, 30, 37, . . . , find the nextthree terms.
*A pile of bricks is arranged in rows. The numbers of bricksin the rows form an arithmetic sequence. There are 45 bricksin the 5th row and 33 bricks in the 11th row.
a) How many bricks are in the first row?
b) Write the general term for the sequence.
c) What is the maximum number of rows of bricks possible?
• use expressions to represent general termsand sums for arithmetic growth, andapply these expressions to solve problems.
For the arithmetic sequence 7, 11, 15, 19, . . . , find the 29thterm.
Find the sum of the arithmetic series 3 + 7 + 11 + . . . + 483.
*Mary’s annual salary is on a range from $26,785 in the firstyear to $34,825 in the seventh year.
a) If the salary range is an arithmetic sequence with seventerms, determine the raise Mary can expect each year.
b) What is her salary in the fifth year?
c) What is the first salary in this range that is greater than$30,000?
d) What is the total amount that Mary earned in the sevenyears?

G-165
APPENDIX G: ILLUSTRATIVE EXAMPLES • Principles of Mathematics 10
Prescribed Learning Outcomes Illustrative Examples
PATTERNS AND RELATIONS (Patterns)
It is expected that students will generate and analyse number patterns.
• relate arithmetic sequences to linearfunctions defined over the naturalnumbers
If three eggs are used for every carrot cake made in a bakery,write a function that determines the number of eggs for ncakes.
To rent an ice arena, there is an initial charge for cleaning theice, plus a rental fee for each hour or part of an hour. Therates posted on the board are:
Time (h) Cost ($)Less than 1 100More than 1, less than 2 180More than 2, less than 3 260. . .
Graph the function that models the rates posted on theboard.
• generate number patterns exhibitinggeometric growth
Insert three numbers between 5 and 80, so that the fivenumbers form a geometric sequence.
A store is conducting a Dutch auction. It will take 10% offthe cost of an item each day. If an item originally costs $150,find its cost for each of the next five days.

G-166
APPENDIX G: ILLUSTRATIVE EXAMPLES • Principles of Mathematics 10
Prescribed Learning Outcomes Illustrative Examples
PATTERNS AND RELATIONS (Variables and Equations)
It is expected that students will generalize operations on polynomials to include rational expressions.
• factor polynomial expressions of the formax2 + bx + c, and a2x2 - b2y2
Factor:
a) 5x2 + 6x - 8
b) 6x2 – x – 2.
Factor 4x2 + 20x + 25.
a) Compare the two factors.
b) For this special product, what is the relationship betweenthe coefficients of the terms of the factors and thecoefficients of the terms of the trinomial?
Factor 4x2 – 25.
a) Compare the two factors.
b) For this special product, what is the relationship betweenthe coefficients of the terms of the factors and thecoefficients of the terms of the binomial?
For which integral values of k can 4x2 + kx + 3 be factoredover the set of rational numbers?
Factor (x + b)2 + 6(x + b) + 8.
Factor 6x4 - x2 - 2.
• find the product of polynomials Find the product and simplify:
a) (3x – 4) (2x2 + 3x + 1)
b) (2x – y)3.
• divide a polynomial by a binomial, andexpress the result in the forms:
-
- P = DQ + R- P(x) = D(x)Q(x) + R
Divide (3x3 + 2x2 – 7x + 8) by (x + 2).
Divide (t2 - 3t - 10) by (t - 3).
Divide (6x3 - 2x2 + 7x - 11) by (3x2 - 2).
When the polynomial P(t) = 4t4 - 17t2 - 36t - 20 is divided by(2t - 5), the remainder is -60. Express the division in theforms:
a)
b) P(t) = Q(t) (2t - 5) + R
P(t) 2t-5— =Q(t)+ —R
2t-5
P R D D— = Q + —

G-167
APPENDIX G: ILLUSTRATIVE EXAMPLES • Principles of Mathematics 10
Prescribed Learning Outcomes Illustrative Examples
PATTERNS AND RELATIONS (Variables and Equations)
It is expected that students will generalize operations on polynomials to include rational expressions.
• determine equivalent forms of simplerational expression with polynomialnumerations, and denominators that aremonomials, binomials or trinomials thatcan be factored
Change each rational expression to its simplest equivalentform:
a)
b)
c)
• determine the nonpermissible values forthe variable in rational expressions
For what value(s) of x are each of the following not defined?Explain your conclusion in each case.
a) b) c)
d) e) f)
g) h) i)
• perform the operations of addition,subtraction, multiplication and divisionon rational expressions
For each expression perform the indicated operations, andidentify any nonpermissible values.
a)
b)
c)
d)
e)
2x4x4 - 6x3 + 2x2 - 10x
x2 - 36x2 - 5x - 6
x2 + x - 6x2 + 3x
3 x
-2 x + 1
43x - 4
2x + 1x2 - 4
5xx2 - 3x - 4
5x + y3x - y
7x2 - 6xy + 3y2
4x2 -9y2
2 x3
5 (x3 - 1)
+1x ( ) 3
2x ( )
( )+ x -1x2 - x - 2 ( )2x +1
x - 1
( ) x2 - 25x2 + 6x + 5 ( )x2 + 2x +1
x - 5
- 1x - 2 ( )4
x + 1 ( )
( ) 3x + 1x - 3 ( )3x2 + 10x +3
x2 - 9

G-168
APPENDIX G: ILLUSTRATIVE EXAMPLES • Principles of Mathematics 10
Prescribed Learning Outcomes Illustrative Examples
PATTERNS AND RELATIONS (Variables and Equations)
It is expected that students will generalize operations on polynomials to include rational expressions.
f)
g)
h)
• find and verify the solutions of rationalequations that reduce to linear form
Solve for x, checking for any nonpermissible values.
a)
b)
c)
d)
e)
f)
*The average speed of an airplane is five times as fast as theaverage speed of a passenger train. To travel 400 km, thetrain requires four hours more than the airplane. Find theaverage speeds of the train and the airplane.
32x ( )2x + 6x + 1 ( )x2 + 1x + 3 ( )
1x ( )+ 3
1x ( )- 3
2 x— = -3
4 3 11 x 2x 4— + — = —
5 2 x - 1 x + 1—— + —— = 2
2x + 1 x - 2 x + 3 x + 1——— - —— = 5
3 2 4 x2 - 25 x + 5 x - 5——— + —— = ——
4 4 x - 5 x - 5—— + 6 = ——

G-169
APPENDIX G: ILLUSTRATIVE EXAMPLES • Principles of Mathematics 10
Prescribed Learning Outcomes Illustrative Examples
PATTERNS AND RELATIONS (Relations and Functions)
It is expected that students will examine the nature of relations with an emphasis on functions.
• plot linear and nonlinear data, usingappropriate scales
The mass of a beaker is recorded when the beaker containsvarying volumes of ethanol. The results of the experimentare recorded in the table below.
Measurements may be assumed correct to the nearest mLand to the nearest g.
Plot this data on a scatterplot, using appropriate scales, andanswer the following questions.
a) Assuming that this pattern continues, determine the massof the beaker and liquid when 250 mL of ethanol ispresent.
b) When a volume of 200 mL of ethanol is in the beaker,determine the mass of the ethanol alone.
c) The density of a liquid is defined as the mass of 1 mL ofthe liquid. Determine the density of the ethanol.
Nannook’s Pizza uses the following price structure.
Plot this data on a scatterplot, using appropriate scales, anddescribe the pattern.
050
100150200
90129168207246
Mass of Beaker and Liquid (g)Volume of Ethanol (mL)
810121416
6.5010.2014.6519.9026.00
Cost ($)Diameter (inches)
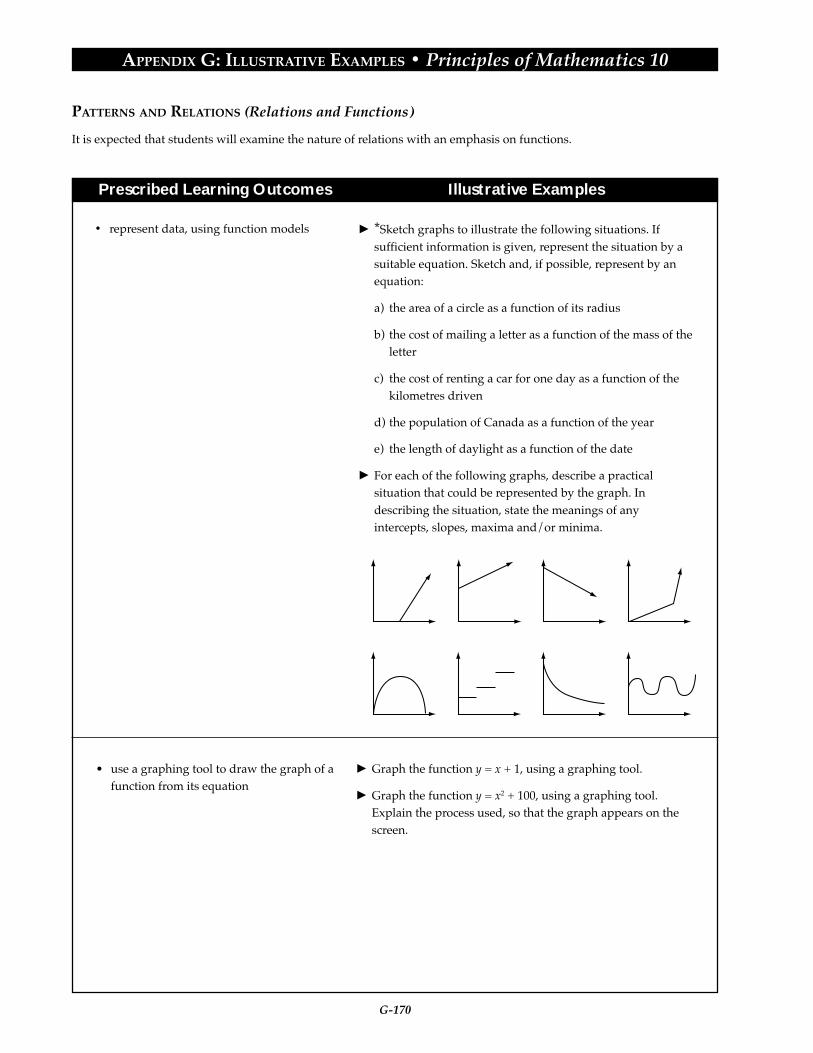
G-170
APPENDIX G: ILLUSTRATIVE EXAMPLES • Principles of Mathematics 10
Prescribed Learning Outcomes Illustrative Examples
PATTERNS AND RELATIONS (Relations and Functions)
It is expected that students will examine the nature of relations with an emphasis on functions.
*Sketch graphs to illustrate the following situations. Ifsufficient information is given, represent the situation by asuitable equation. Sketch and, if possible, represent by anequation:
a) the area of a circle as a function of its radius
b) the cost of mailing a letter as a function of the mass of theletter
c) the cost of renting a car for one day as a function of thekilometres driven
d) the population of Canada as a function of the year
e) the length of daylight as a function of the date
For each of the following graphs, describe a practicalsituation that could be represented by the graph. Indescribing the situation, state the meanings of anyintercepts, slopes, maxima and/or minima.
• represent data, using function models
Graph the function y = x + 1, using a graphing tool.
Graph the function y = x2 + 100, using a graphing tool.Explain the process used, so that the graph appears on thescreen.
• use a graphing tool to draw the graph of afunction from its equation
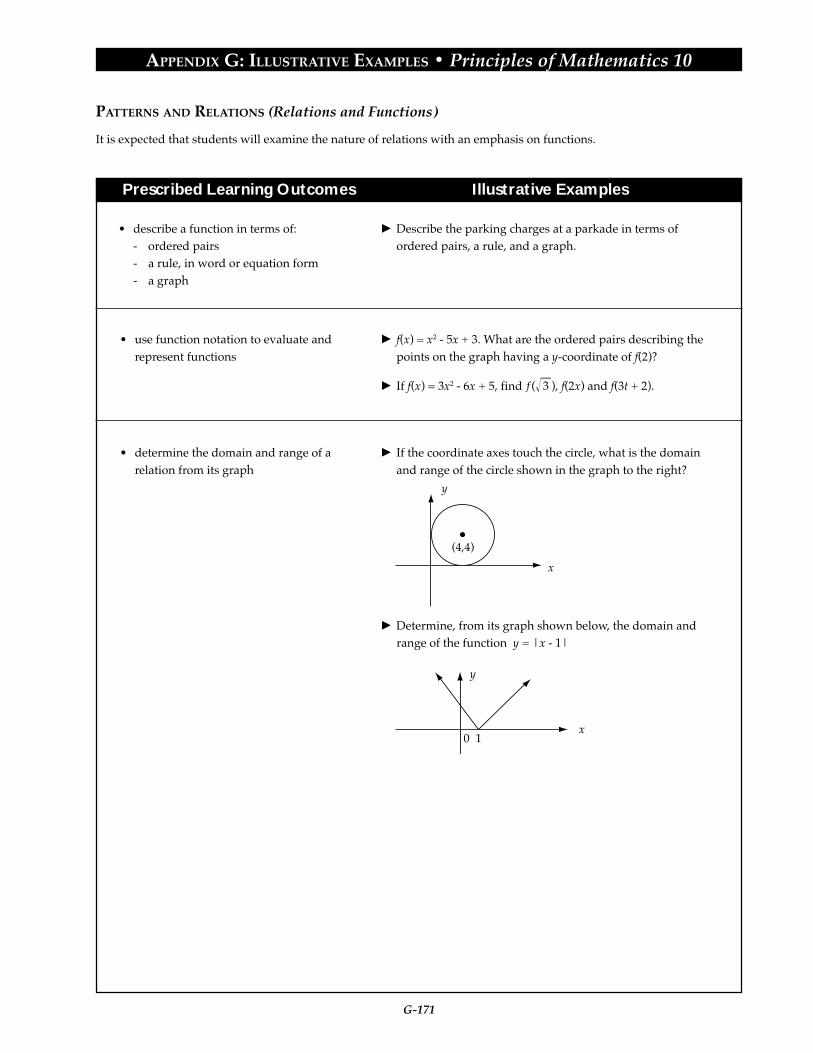
G-171
APPENDIX G: ILLUSTRATIVE EXAMPLES • Principles of Mathematics 10
Prescribed Learning Outcomes Illustrative Examples
PATTERNS AND RELATIONS (Relations and Functions)
It is expected that students will examine the nature of relations with an emphasis on functions.
• describe a function in terms of:- ordered pairs- a rule, in word or equation form- a graph
Describe the parking charges at a parkade in terms ofordered pairs, a rule, and a graph.
• use function notation to evaluate andrepresent functions
f(x) = x2 - 5x + 3. What are the ordered pairs describing thepoints on the graph having a y-coordinate of f(2)?
If f(x) = 3x2 - 6x + 5, find ƒ( 3 ), f(2x) and f(3t + 2).
• determine the domain and range of arelation from its graph
If the coordinate axes touch the circle, what is the domainand range of the circle shown in the graph to the right?
Determine, from its graph shown below, the domain andrange of the function y = |x - 1|
(4,4)
x
y
0 1x
y
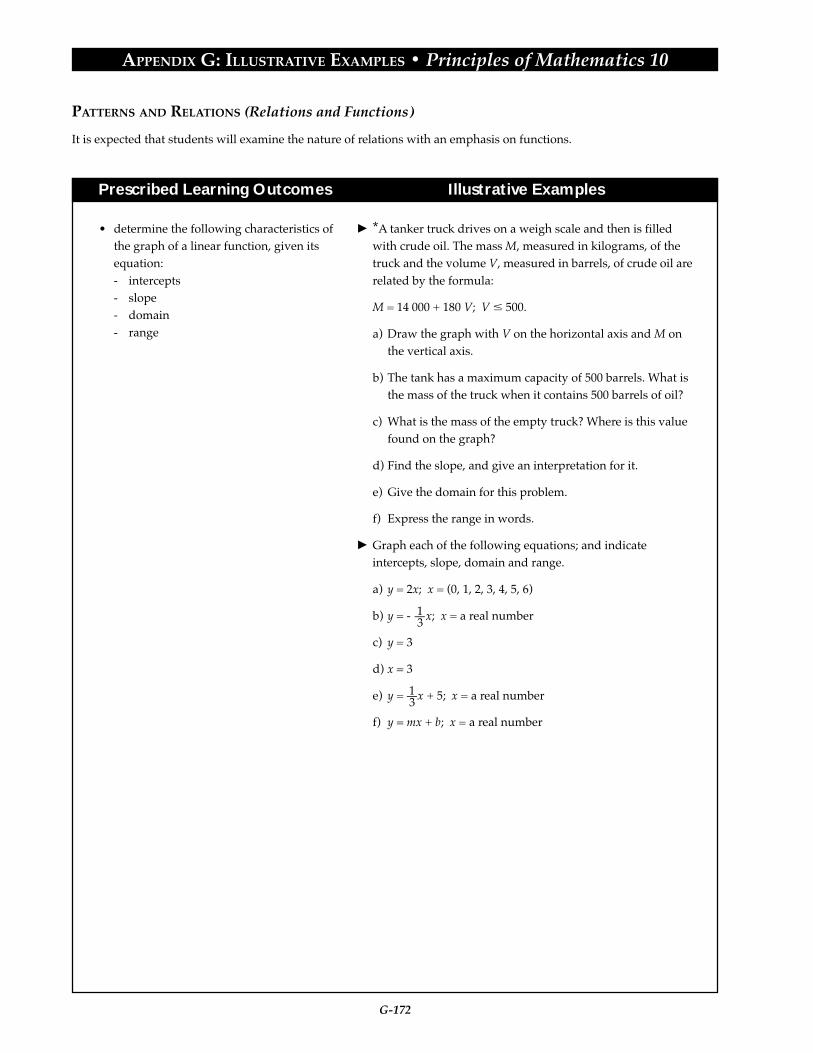
G-172
APPENDIX G: ILLUSTRATIVE EXAMPLES • Principles of Mathematics 10
Prescribed Learning Outcomes Illustrative Examples
• determine the following characteristics ofthe graph of a linear function, given itsequation:- intercepts- slope- domain- range
*A tanker truck drives on a weigh scale and then is filledwith crude oil. The mass M, measured in kilograms, of thetruck and the volume V, measured in barrels, of crude oil arerelated by the formula:
M = 14 000 + 180 V; V 500.
a) Draw the graph with V on the horizontal axis and M onthe vertical axis.
b) The tank has a maximum capacity of 500 barrels. What isthe mass of the truck when it contains 500 barrels of oil?
c) What is the mass of the empty truck? Where is this valuefound on the graph?
d) Find the slope, and give an interpretation for it.
e) Give the domain for this problem.
f) Express the range in words.
Graph each of the following equations; and indicateintercepts, slope, domain and range.
a) y = 2x; x = (0, 1, 2, 3, 4, 5, 6)
b) y = - x; x = a real number
c) y = 3
d) x = 3
e) y = x + 5; x = a real number
f) y = mx + b; x = a real number
PATTERNS AND RELATIONS (Relations and Functions)
It is expected that students will examine the nature of relations with an emphasis on functions.
1 3—
1 3—

G-173
APPENDIX G: ILLUSTRATIVE EXAMPLES • Principles of Mathematics 10
Prescribed Learning Outcomes Illustrative Examples
PATTERNS AND RELATIONS (Relations and Functions)
It is expected that students will represent data, using linear function models.
A hydrologist studied the relationship between the pressureon an object and its depth of submersion in a liquid. Thefollowing graph was sketched.
Draw conclusions based upon the sketch.
Simple interest varies directly with the amount borrowed.
a) If the interest is $5 for $100 borrowed, what would theinterest be for $325 borrowed?
b) Graph the relation, and write the equation of the graph.
*A jet ski rental operation at Okanagan Lake charges a fixedinsurance premium, plus an hourly rate. The total cost fortwo hours is $50 and for five hours is $110.
a) Graph the relation.
b) Determine the fixed insurance premium and the hourlyrate to rent the jet ski.
*With new equipment coming on line, a soft drinkmanufacturer has been increasing its production each dayaccording to the following table. Assume a maximum dailyoutput of 25 000 cans.
Day 1 2 3 4Units 4000 4200 4400 4600
a) Graph the relation. Hint: this is a discrete case.
b) On what day will they be able to produce 20 000 cans, ifthis trend continues?
• use partial variation and arithmeticsequences as applications of linearfunctions
100
Depth (m)
Pressure (kPa)
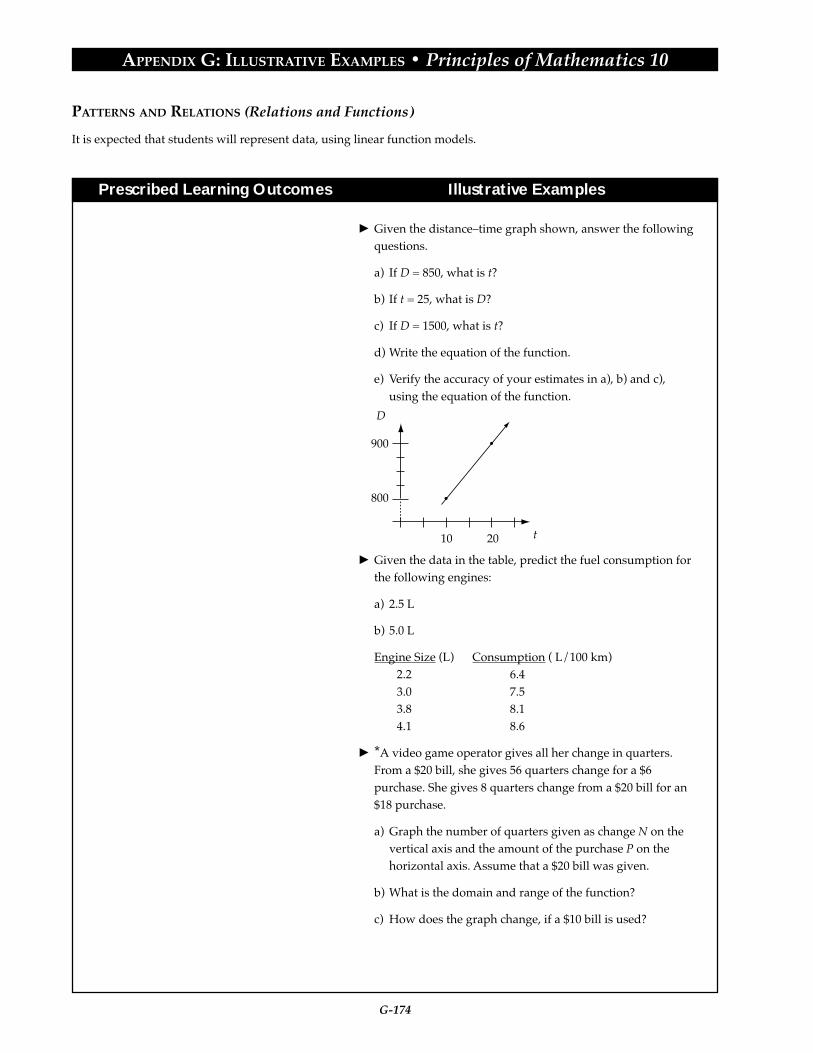
G-174
APPENDIX G: ILLUSTRATIVE EXAMPLES • Principles of Mathematics 10
Prescribed Learning Outcomes Illustrative Examples
Given the distance–time graph shown, answer the followingquestions.
a) If D = 850, what is t?
b) If t = 25, what is D?
c) If D = 1500, what is t?
d) Write the equation of the function.
e) Verify the accuracy of your estimates in a), b) and c),using the equation of the function.
800
10 20
900
D
t
Given the data in the table, predict the fuel consumption forthe following engines:
a) 2.5 L
b) 5.0 L
Engine Size (L) Consumption ( L/100 km)2.2 6.43.0 7.53.8 8.14.1 8.6
*A video game operator gives all her change in quarters.From a $20 bill, she gives 56 quarters change for a $6purchase. She gives 8 quarters change from a $20 bill for an$18 purchase.
a) Graph the number of quarters given as change N on thevertical axis and the amount of the purchase P on thehorizontal axis. Assume that a $20 bill was given.
b) What is the domain and range of the function?
c) How does the graph change, if a $10 bill is used?
PATTERNS AND RELATIONS (Relations and Functions)
It is expected that students will represent data, using linear function models.

G-175
APPENDIX G: ILLUSTRATIVE EXAMPLES • Principles of Mathematics 10
Prescribed Learning Outcomes Illustrative Examples
SHAPE AND SPACE (Measurement)
It is expected that students will demonstrate an understanding of scale factors, and their interrelationship with thedimensions of similar shapes and objects.
Calculate the volume and surface area of a beach ball ofradius 15 cm.
*A sphere fits tightly inside a cube. If the radius of the sphereis 10 cm, find the surface area of the cube. Explain and justifyyour calculations.
Determine the total surface are of the container and thenjustify your answer.
What is the volume of the air inside the cylinder and outsidethe balls?
*A hot air balloon has a spherical shape and a diameter of 4m. If 30 additional cubic metres of air are pumped into theballoon, what will be the new values for the diameter,volume and surface area?
*A silo is composed of a cylinder with a hemisphere on topas the roof. What is the surface are of the silo if the height is10m and the radius of the cylinder is 3m?
• calculate the volume and surface area of asphere, using formulas that are provided
The area of a region in a plane is 10 cm2. By what factor musteach of the dimensions of this region be multiplied to increasethe area by 20 cm2? Explain how you arrived at your answer.
*A model train is built to a scale of 1:50. If the length of themodel engine is 20 cm and the area of sheet metal used tocover the outside surface of the model is 180 cm2, what is theactual length of the engine and the actual area of thesheeting used to cover the engine? If the volume displacedby the model engine is 126 cm3, what is the volumedisplaced by the real engine, in m3?
*It is improbable that a giant human, 6 m in height (three orfour times normal human height), could exist. Which biologicalsystems are most likely to break down? Explain your answer.
• determine the relationships among linearscale factors, areas, the surface areas andthe volumes of similar figures and objects
66

G-176
APPENDIX G: ILLUSTRATIVE EXAMPLES • Principles of Mathematics 10
Prescribed Learning Outcomes Illustrative Examples
SHAPE AND SPACE (Measurement)
It is expected that students will solve problems involving triangles, including those found in 3-D and 2-D applications.
• solve problems involving two righttriangles
*From the top of a 100 m fire tower, a fire ranger observestwo fires, one at an angle of depression of 5˚ and the otherat an angle of depression of 2˚. Assuming that the fires andthe tower are in a straight line, determine the distancebetween the fires for the following:
a) when the fires are on the same side of the tower
b) when the fires are on opposite sides of the tower
The triangles ABC and BCD have right angles at B and Crespectively. Calculate the length of side CD, and state theratio of length BD to length AC. Explain your reasoning ateach step.
*Find the perimeter of the shaded triangle in therectanglular solid. Justify your thought processes.
*Canada’s highest waterfall is Della Falls on VancouverIsland. An observer standing at the same level as the base ofthe falls views the top of the falls at an angle of elevation of58˚. When the observer moves 31 m closer to the base of thefalls, the angle of elevation increases to 61˚. Find the heightof Della Falls.
In the figure; AD = BF, DE = DB, DE is parallel to BC andAC is perpendicular to BF, FD is perpendicular to AB.Name the triangle that is congruent to triangle ADE andjustify your reasoning at each step.
2 cm
60˚60˚
CD
BA
4
3
2
B
A
F E
H
C
D
B
D
A
F
GC E
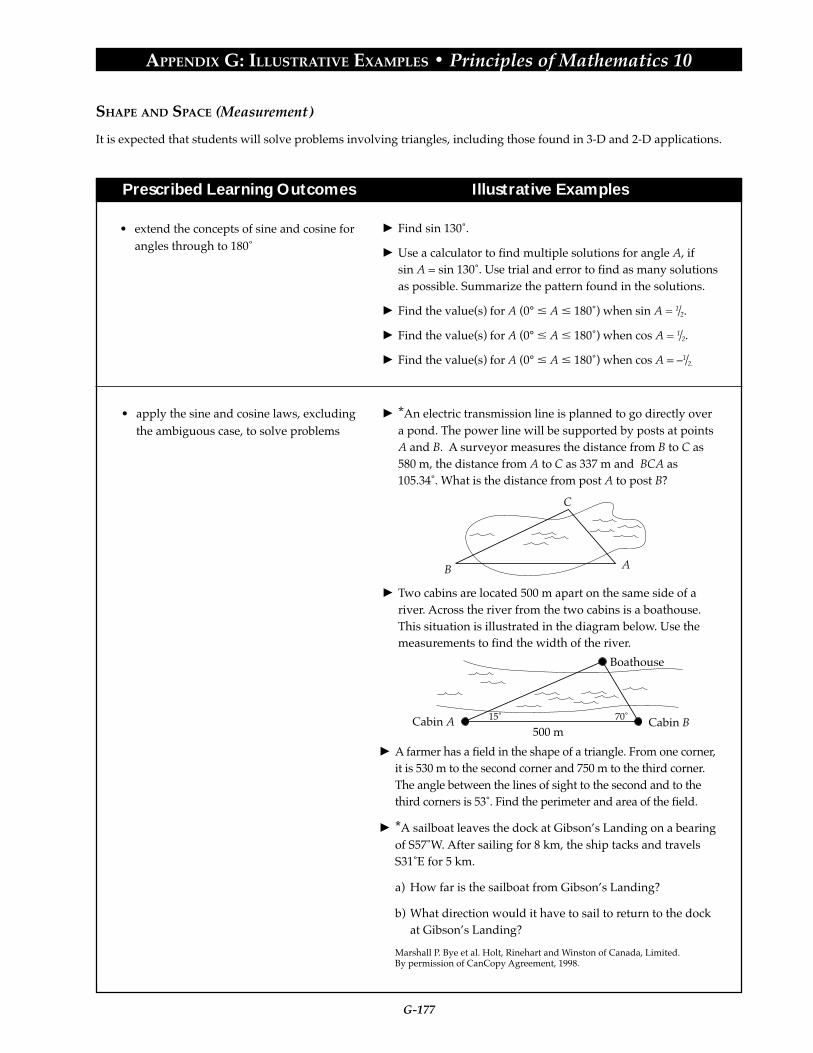
G-177
APPENDIX G: ILLUSTRATIVE EXAMPLES • Principles of Mathematics 10
Prescribed Learning Outcomes Illustrative Examples
SHAPE AND SPACE (Measurement)
It is expected that students will solve problems involving triangles, including those found in 3-D and 2-D applications.
• apply the sine and cosine laws, excludingthe ambiguous case, to solve problems
*An electric transmission line is planned to go directly overa pond. The power line will be supported by posts at pointsA and B. A surveyor measures the distance from B to C as580 m, the distance from A to C as 337 m and BCA as105.34˚. What is the distance from post A to post B?
Two cabins are located 500 m apart on the same side of ariver. Across the river from the two cabins is a boathouse.This situation is illustrated in the diagram below. Use themeasurements to find the width of the river.
A farmer has a field in the shape of a triangle. From one corner,it is 530 m to the second corner and 750 m to the third corner.The angle between the lines of sight to the second and to thethird corners is 53˚. Find the perimeter and area of the field.
*A sailboat leaves the dock at Gibson’s Landing on a bearingof S57˚W. After sailing for 8 km, the ship tacks and travelsS31˚E for 5 km.
a) How far is the sailboat from Gibson’s Landing?
b) What direction would it have to sail to return to the dockat Gibson’s Landing?
Marshall P. Bye et al. Holt, Rinehart and Winston of Canada, Limited.By permission of CanCopy Agreement, 1998.
• extend the concepts of sine and cosine forangles through to 180˚
Find sin 130˚.
Use a calculator to find multiple solutions for angle A, ifsin A = sin 130˚. Use trial and error to find as many solutionsas possible. Summarize the pattern found in the solutions.
Find the value(s) for A (0° A 180˚) when sin A = 1/2.
Find the value(s) for A (0° A 180˚) when cos A = 1/2.
Find the value(s) for A (0° A 180˚) when cos A = –1/2.
C
B A
500 m15˚ 70˚Cabin A Cabin B
Boathouse

G-178
APPENDIX G: ILLUSTRATIVE EXAMPLES • Principles of Mathematics 10
Prescribed Learning Outcomes Illustrative Examples
SHAPE AND SPACE (3-D Objects and 2-D Shapes)
It is expected that students will solve coordinate geometry problems involving lines and line segments.
• solve problems involving distancesbetween points in the coordinate plane
Bob and Christine want to meet; see map below. Each blockhas dimensions of 120 m by 120 m. Assuming the roads areof negligible width, how far does Bob B have to travel to getto Christine C? Find two separate answers, one for a pathalong the roads and one for a direct path.
Plot the points (-4, -2) and (1, 5) on the coordinate plane.Describe two different ways to calculate the distancebetween the two points.
Generate a method of determining the distance between anytwo points in the coordinate plane without having to plotthe points. Justify your method.
Program a calculator or computer to accept, as input, thecoordinates of two points and to give, as output, thedistance between the two points. Document the program sothat someone else can use it without assistance.
B
C
• solve problems involving midpoints ofline segments
Explain to a partner the meaning of the midpoint of the linesegment joining two points without using the word midpoint.
*On a map with numerical coordinates in kilometres, thevillage of Sundown is at (6.3, 2.9), while the town of Sunup isat (4.7, 13.2). It was decided to construct a water main on thedirect line joining Sunup with Sundown. Each communitywas responsible for the cost of construction from the commu-nity to the midpoint. Find the coordinates of the midpointand Sundown’s costs, if Sundown spent $63,475 per kilometrefor construction. Determine alternative methods that could beused to solve the problem. Justify your answer.
Given the line AB with the point A (1, 5) and midpoint M(7, 2) determine the coordinates of B. Justify your statementsusing a diagram.
2
4
6
642 108
f(x)
x

G-179
APPENDIX G: ILLUSTRATIVE EXAMPLES • Principles of Mathematics 10
Prescribed Learning Outcomes Illustrative Examples
SHAPE AND SPACE (3-D Objects and 2-D Shapes)
It is expected that students will solve coordinate geometry problems involving lines and line segments.
• solve problems involving rise, run andslope of line segments
If the slope of a line is 6 (m = 6) and the line passes throughthe points (2, 5) and (1, k), what is the value of k?
If two points on a line are (4, 3) and (6, 4), find one otherpoint on the line. Use a graphing utility to demonstrate thereasonableness of your answer.
• determine the equation of a line, giveninformation that uniquely determines theline
Use a graphing device to examine changes in the graph ofy = mx + b as the values of m and b are changed. Use theresults to explain why the equation y = mx + b is called theslope and y-intercept form of a linear equation.
Write a clear explanation of the nature of the following lines:x = a, y = b, x = y.
Manipulate the standard form of a straight line(Ax + By + C = 0) into the slope and y-intercept form of thesame line. Determine rules that connect A, B and C to theslope (m) and to the intercepts.
Find the equation of a line passing through the points (-1, 3)and (4, 2).
Given the graph of an oblique line, determine an equationfor the line.
*A spring with no masses attached is 25.2 cm long. For each1-g mass attached to the spring, the spring’s length increasesby 4 mm. Graph this scenario, label the axes, and find anequation for the graph.
• solve problems using slopes of:- parallel lines- perpendicular lines
Graphically examine the slopes of various lines, all of whichare perpendicular to the line y = x + 2 . Describe theslopes, and make a rule for finding the slope of aperpendicular to a given line.
Two perpendicular lines intersect on the x-axis. Theequation of one of the lines is y = 2x - 6. Find the equation ofthe second line.
2 3—
G-180
APPENDIX G: ILLUSTRATIVE EXAMPLES • Principles of Mathematics 10
Prescribed Learning Outcomes Illustrative Examples
STATISTICS AND PROBABILITY (Data Analysis)
It is expected that students will implement and analyse sampling procedures, and draw appropriate inferences from thedata collected.
• choose, justify and apply samplingtechniques that will result in anappropriate, unbiased sample from agiven population
A toothpaste company advertises that three out of fourdentists prefer their product. Analyse this statement for itscompleteness and its accuracy in terms of population,sample, possible sampling technique, validity and bias.
A school cafeteria wants to introduce a new dessert.Describe how a survey could be conducted to decide whichof three choices should be the new dessert.
*To predict a winner in a federal election, a magazinecompiled a list of about 200 000 names from sources, such astelephone books, lists of automobile owners, clubmembership lists and its own subscription lists. Themagazine mailed a questionnaire to everybody on the list,and 4000 returned it. The 4000 responses became thesample. Discuss the potential sources of bias.
*To determine a preference for spending $50 in either aclothing store, an electronics shop or a restaurant, customerswere surveyed one Saturday morning at the mall. Fifty-nineprecent preferred spending in a clothing store, 32% in anelectronics shop and 9% in a restaurant. Whatgeneralizations can be made from these results? Does thesample adequately represent the population to be surveyed?Design a more reliable sampling method to obtain thisinformation, and include details of the questionnaires usedand the method of selecting the sample.
Search through various forms of media to find examples ofgeneralizations that have been made about populations,based on data from samples. Do you agree or disagree withthe generalizations? Explain why.
• defend or oppose inferences andgeneralizations about populations, basedon data from samples

APPENDIX G
ILLUSTRATIVE EXAMPLES
Principles of Mathematics 11


G-183
APPENDIX G: ILLUSTRATIVE EXAMPLES • Principles of Mathematics 11
Prescribed Learning Outcomes Illustrative Examples
It is expected that students will:
• solve problems that involve a specificcontent area
• solve problems that involve more thanone content area
• solve problems that involve mathematicswithin other disciplines
• analyse problems and identify thesignificant elements
• develop specific skills in selecting andusing an appropriate problem-solvingstrategy or combination of strategieschosen from, but not restricted to, thefollowing:- guess and check- look for a pattern- make a systematic list- make and use a drawing or model- eliminate possibilities- work backward- simplify the original problem- develop alternative original approaches- analyse keywords
• demonstrate the ability to work individu-ally and co-operatively to solve problems
• determine that their solutions are correctand reasonable
• clearly communicate a solution to aproblem and the process used to solve it
• interpret their solutions by describingwhat the solution means within thecontext of the original problem
• use appropriate technology to assist inproblem solving
PROBLEM SOLVING
It is expected that students will use a variety of methods to solve real-life, practical, technical, and theoretical problems.
Illustrative Examples for Problem Solving have beenindicated with an asterisk (*) throughout Appendix G.

G-184
APPENDIX G: ILLUSTRATIVE EXAMPLES • Principles of Mathematics 11
Prescribed Learning Outcomes Illustrative Examples
NUMBER (Number Operations)
It is expected that students will solve consumer problems, using arithmetic operations.
• solve consumer problems, including: - wages earned in various situations - property taxation - exchange rates - unit prices
c Calculate and compare wage situations involving minimumwage rates, regular pay, overtime pay, gratuities, piecework,straight commission, salary and commission, salary plusquota and graduated commission.
c Jane has a choice of two restaurants at which to work.Mario’s pays $8/h, and tips average $24 daily. Teppan’spays $5.50/h, and tips average $35 daily. If Jane works 30hours weekly, spread over four days, how much would sheearn at each restaurant?
c Identify and calculate various payroll deductions, includingincome tax, CPP, EI, medical benefits, union and profes-sional dues and life insurance premiums.
c Estimate, calculate and compare gross and net pay forvarious wage or salary earners in your community.
c *The Ningart property has a market value of $105 000. Theassessed values in the area are 60% of market values. Thetax rate is 32.3 mills of assessed value. What is the Ningarts’monthly tax payment?
c The exchange rate for converting currency on a given day inthe United States is 28% and in Canada 38.8%. Explain whythis is possible.
c Which is a better deal, 284 mL of tomato soup for $0.69 or907 mL for $1.70?

G-185
APPENDIX G: ILLUSTRATIVE EXAMPLES • Principles of Mathematics 11
Prescribed Learning Outcomes Illustrative Examples
NUMBER (Number Operations)
It is expected that students will solve consumer problems, using arithmetic operations.
• reconcile financial statements including:- cheque books with bank statements- cash register tallies with daily receipts
c *The following petty cash transactions occurred during thefirst week of March.
March 4 $100 cheque was received to establish the fund.March 5 Bought $12.50 worth of postage stamps.March 5 Spent $10 to have something delivered by taxi.March 6 Spent $6.50 for lunch.March 7 Paid a courier service $25 for deliveries.March 7 Bought flowers for opening day, $28.March 8 Replenished the fund by $25.March 9 Postage stamps purchased for $21.50.
Determine if a final balance of $20 is correct. If not, providean explanation for the difference, and indicate possible waysto correct the problem.
c Complete the table below to determine the cost of credit forusing a department store charge account for the periodshown. Monthly credit charges are 1.4% of the balance due.
Month Previous Payment Purchases Balance Credit NewBalance Made Charged Due Charges Balance
February
March
April
May
June
July
August
$314.65
$618.62
$206.68
$ 193.75
$ 59.60
$ 421.83
$ 39.65
$ 58.11
$ 77.21
$ 163.09
$ 5.72
$ 3.50
$ 414.12
$ 618.62
$ 253.27
$ 100.00
$ 150.00
$ 140.00
$ 200.00
$ 250.00
$ 150.00
$ 120.00
- => =>+ +

G-186
APPENDIX G: ILLUSTRATIVE EXAMPLES • Principles of Mathematics 11
Prescribed Learning Outcomes Illustrative Examples
NUMBER (Number Operations)
It is expected that students will solve consumer problems, using arithmetic operations.
• solve budget problems, using graphs andtables to communicate solutions
c Research and calculate the cost of running a car for a year.Decide how to classify each cost, how to collect the data andhow to display the results.
c *As a project, prepare a monthly budget for one of thefollowing:a) the familyb) an assumed persona (e.g., a celebrity)c) a schoold) a vacatione) a fishing/hunting/shopping tripf) a municipality
c The diagram shows Julie’s monthly budget of $1,200. Shewants to move to her own apartment that costs $450 permonth. Construct a new budget that will include her rent.Explain the choices and changes that Julie could make.
Julie Barnes’ Monthly Budget Total = $1,200
Clothing20%
Food20%
Savings20%
Car20%
Recreation20%

G-187
APPENDIX G: ILLUSTRATIVE EXAMPLES • Principles of Mathematics 11
Prescribed Learning Outcomes Illustrative Examples
NUMBER (Number Operations)
It is expected that students will solve consumer problems, using arithmetic operations.
• solve investment and credit problemsinvolving simple and compound interest
c Determine the effective annual interest rate on a loan of$1,000 at 10% per year, compounded quarterly.
c Calculate the compound amount, after one year, of a depositof $1,000. Assume the current nominal annual interest whenthe interest is compounded:a) annuallyb) monthlyc) daily
c A bank offers an interest rate of 8% per year, compoundedannually. A second bank offers an interest rate of 8% peryear, compounded quarterly. If $2,000 were deposited, forten years, in each bank, how much more income would begained in the second bank than in the first?
c Calculate the interest paid on various forms of credit,including:a) credit cardsb) loansc) mortgages
c A loan of $5,000 carries an interest rate of 9% per year,compounded monthly. Adele makes a payment of $350every month. Use a spreadsheet to determine how muchshe still owes after making 12 payments.
c Compare two investments in an RRSP for one year withcontributions starting January 1.a) $100 is invested monthly at 10% per annum, com-
pounded monthly.b) $600 is invested semi-annually at 10% per annum,
compounded semi-annually.

G-188
APPENDIX G: ILLUSTRATIVE EXAMPLES • Principles of Mathematics 11
Prescribed Learning Outcomes Illustrative Examples
PATTERNS AND RELATIONS (Patterns)
It is expected that students will apply the principles of mathematical reasoning to solve problems and to justify solutions.
• differentiate between inductive anddeductive reasoning
c Find, inductively, the sum of the angles of a triangle, by:a) constructing triangles and tearing the corners offb) putting the torn corners together to form a straight line.
c *Show, deductively, that the sum of the measures a, b and cis 180˚, by:a) drawing a triangleb) using one side as a base and drawing a parallel line
segment on the opposite vertexc) knowing that a = a, b = b, and c is included in both;
a + c + b = 180°.
• explain and apply connecting words, suchas and, or and not, to solve problems
c *Each member of a sports club plays at least one of thefollowing sports: soccer, rugby or tennis. The followinginformation is given:a) 163 play tennis; 36 play tennis and rugby; 13 play tennis
and soccerb) 6 play all three sports; 11 play soccer and rugby; 208 play
rugby and tennisc) 98 play soccer and rugby.
Use this information to determine the number of membersin the club.
c On a number line, indicate the location of the setscorresponding to the following:a) x < 2 or x > 5b) x < 2 and x > 5c) x < 5 or x > 2d) x < 5 and not x > 2.
a
a b
b
c

G-189
APPENDIX G: ILLUSTRATIVE EXAMPLES • Principles of Mathematics 11
Prescribed Learning Outcomes Illustrative Examples
PATTERNS AND RELATIONS (Patterns)
It is expected that students will apply the principles of mathematical reasoning to solve problems and to justify solutions.
• use examples and counterexamples toanalyse conjectures
c Rajiv concluded that whenever he added two primenumbers the sum was always even. Find a counterexampleto prove that Rajiv’s conjecture is false.
c A science text states that water boils at 100˚C. Find acounterexample.
c Mary used her graphing calculator to graph y = xx. Shefound the screen to be blank for x < 0 and made a conjecturethat xx is undefined when x < 0. Find an example to showthat Mary’s conjecture is reasonable. Find a counterexampleto show that Mary’s conjecture is false.
c Change the statement “Multiples of 3 are always multiplesof 6” into “if–then” form, and write the converse andcontrapositive of the “if–then” statement. Decide on thetruth of all three propositions.
c Create a true proposition whose converse andcontrapositive are both true.
• distinguish between an if–thenproposition, its converse and itscontrapositive
• prove assertions in a variety of settings,using direct and indirect reasoning
c Angle ABC is obtuse, and AD is the median of BC. If AD isnot an altitude, prove that ABC is a scalene triangle.
c Prove that the medians of a triangle cannot bisect each other.
c In the diagram below, show:a) x + y < 180˚b) if x + y = 180˚, lines l1 and l2 are parallel.
c Prove that the difference of squares of two odd numbers isalways divisible by 4.
x
y
l1
l2

G-190
APPENDIX G: ILLUSTRATIVE EXAMPLES • Principles of Mathematics 11
Prescribed Learning Outcomes Illustrative Examples
PATTERNS AND RELATIONS (Variables and Equations)
It is expected that students will represent and analyse situations that involve expressions, equations, and inequalities.
• graph linear inequalities, in twovariables
c Solve, algebraically and graphically, for x: 2x + 5 > 3x - 1.
c A target is described in terms of coordinates (x, y), where xand y are measured in metres. All of the following are true:• x < 6• y > 7• (x, y) is in the first quadrant• x + y < 10.
What is the shape and the area of the target?
• solve systems of linear equations, in twovariables:- algebraically (elimination and
substitution)- graphically
c Solve this system of equations:a) x + 2y = 10
2x + 3y = 14
b) 3x + 4y = 15x – y = 5
c In what situations is one method of solving a system oflinear equations (elimination or substitution) preferrable toanother?
c *A principal of $42,000 is invested partly at 7% and partly at9.5%. If the interest is $3,700, how much is invested at eachinterest rate?
c Plot the graphs of 2x + 3y = 11 and 2x – 3y = 17. What istheir point of intersection?
• solve systems of linear equations, in threevariables:- algebraically- with technology
c Determine the solution to the following system:2x + y - z = 3x + 2y + z = 03x - y - 2z = 11
c The total revenue R is a quadratic function of the price p ofbooks sold. So R = ap2 + bp + c. Find the values of a, b and c,if the revenue is $6,000 at a price of $30; $6,000 at a price of$40; and $5,000 at a price of $50.
G-191
APPENDIX G: ILLUSTRATIVE EXAMPLES • Principles of Mathematics 11
Prescribed Learning Outcomes Illustrative Examples
PATTERNS AND RELATIONS (Variables and Equations)
It is expected that students will represent and analyse situations that involve expressions, equations, and inequalities.
• solve nonlinear equations:- by factoring- graphically
• use the Remainder Theorem to evaluatepolynomial expressions, the RationalZero Theorem, and the Factor Theoremto determine factors of polynomials
c Solve by factoring:a) x2 - 2x = 24b) x3 = 1c) 2x2 + 9x - 5 = 0d) 7x2 + 4x – 11 = 0
c Solve each of the above graphically. For example, x2 – 2x = 24can be solved by graphing y = x2 – 2x and y = 24 and usingthe points of intersection to determine the solution.
c Solve 3x2 + 1 = 10x - 2 graphically in two different ways. Isthere one way that gives more reliable results? Explain yourprocedures and the results obtained.
c The polynomial P(x) = 4x3 + bx2 + cx + 11 has a remainder of-7 when divided by (x + 2) and a remainder of 14 whendivided by (x - 1). Find the values of b and c.
c Factor x3 - 2x2 - 5x + 6.
• solve nonlinear equations, using agraphing tool
c Using a graphing tool, solve x2 + 6x – 11 = 0.
c Solve x3 + x = 30 graphically, using two different methods.Which method gives solutions that are more free fromrounding errors and other inaccuracies?
c Where does the line y = 4x + 5 cut the curve y = 2x? Use agraphing tool to find the points of intersection.

G-192
APPENDIX G: ILLUSTRATIVE EXAMPLES • Principles of Mathematics 11
Prescribed Learning Outcomes Illustrative Examples
• determine the solution to a system ofnonlinear equations, using technologyas appropriate
c Find the solutions to the following system:y = x2
y = 8 - x2
c Graphically, find the solution set to the following system:
y = 3x + 2 and y = 2x
How do you know that the solution set is complete?
c *The world’s population grows by 2% per year. The worldfood production can sustain an additional 200 millionpeople per year. In 1987 the population was 5 billion, andfood production could sustain 6 billion people. The popula-tion growth can be modelled by the equation P1 = 5(1.02)n,with the food production being modelled by P2 = 0.2n + 6.The variable n is the number of years after 1987.a) When does P1 = P2?b) If P1 > P2 is true, when does this happen, and how is this
inequality interpreted?
PATTERNS AND RELATIONS (Variables and Equations)
It is expected that students will represent and analyse situations that involve expressions, equations, and inequalities.

G-193
APPENDIX G: ILLUSTRATIVE EXAMPLES • Principles of Mathematics 11
Prescribed Learning Outcomes Illustrative Examples
PATTERNS AND RELATIONS (Relations and Functions)
It is expected that students will represent and analyse quadratic, polynomial and rational functions, using technology asappropriate.
c Given the graph of any quadratic function, determine thefollowing:a) vertexb) domainc) ranged) axis of symmetrye) intercepts
c Use technology to graph f(x) = x2 - 6x + 4 and to determinethe vertex, domain, range, axis of symmetry and intercepts.
c *One model concerning the rate of population growth ofEarth has the annual rate of increase varying jointly as thepopulation and the unused carrying capacity of Earth. Theequation of the model is: y = 0.001x(21 – x), where y equalsthe rate of increase in population (in billions per year), and xequals the present population (in billions).a) Plot this model of growth.b) The present population of Earth is 5.8 billion. What is the
annual increase in population at present?c) What is the population when the rate of increase in
population is at its greatest?d) What is the population when the rate of increase is zero?e) What is the projected maximum population that Earth
can accommodate, according to this model?
• determine the following characteristics ofthe graph of a quadratic function:- vertex- domain and range- axis of symmetry- intercepts

G-194
APPENDIX G: ILLUSTRATIVE EXAMPLES • Principles of Mathematics 11
Prescribed Learning Outcomes Illustrative Examples
PATTERNS AND RELATIONS (Relations and Functions)
It is expected that students will examine the nature of relations with an emphasis on functions.
c If f(x) = 3x + 2 and g(x) = x2, find:a) 3f(x)b) f(x) • g(x)c) f(x) + g(x)d) f(g(x))e) f(f(x))
c A ball thrown in the air has a velocity given byv(t) = 49 - 9.8t. The kinetic energy function K(v) is given byK(v) = 0.4v2. Express the ball’s kinetic energy as a functionK(t) of time.
• perform operations on functions andcompositions of functions
• determine the inverse of a function c Is the inverse of f(x) = 2x – 5 a function?
c Sketch the inverse of the following. Is the inverse a junction?
c Sketch the inverse of y = x3
c If f(x) = 2x – 1 and g(x) = x + 12 , find f(g(x)) and g(f(x)), and
show that the functions f(x) and g(x) are inverses of each other.
c Determine the domain and range for each of the functions inthe two previous illustrative examples.
c *Graph the inverse of y = x(x - 1)
, and determine the
equation, domain, and range of the inverse.
P(2, 1)
R(4, 3)Q(0, 3)

G-195
APPENDIX G: ILLUSTRATIVE EXAMPLES • Principles of Mathematics 11
Prescribed Learning Outcomes Illustrative Examples
PATTERNS AND RELATIONS (Relations and Functions)
It is expected that students will represent and analyse quadratic, polynomial and rational functions, using technology asappropriate.
• connect algebraic and graphical transfor-mations of quadratic functions, usingcompleting the square as required
c Graph f(x) = 2x2 + 5x - 7.
c Give a list of events or situations that might be described bya quadratic, parabolic, shape.
c Given the graph of y = x2, sketch y = -2(x - 3)2 - 4.
c Given the graph of y = x2, what is the equation for thetransformed graph shown here?
c Rewrite the equation of f(x) = 2x2 - 12x + 13 in the formf(x) = a(x - p)2 + q, and graph the function.
c *Computer software programs are sold to students for $20each, and 300 students are willing to buy them at that price.For every $5 increase in price, there are 30 fewer studentswilling to buy the software. What is the maximum revenue?
c What is the maximum rectangular area that can be enclosedby 120 m of fencing, if one of the sides of the rectangle is anexisting wall?
P(12, 11)
Q(0, 7)
• model real-world situations, usingquadratic functions

G-196
APPENDIX G: ILLUSTRATIVE EXAMPLES • Principles of Mathematics 11
Prescribed Learning Outcomes Illustrative Examples
• solve quadratic equations, and relate thesolutions to the zeros of a correspondingquadratic function, using:- factoring- the quadratic formula- graphing
• determine the character of the real andnon-real roots of a quadratic equation,using:- the discriminant in the quadratic
formula- graphing
c Solve 3x2 - 5x + 2 = 0 algebraically and by graphing thecorresponding function f(x) = 3x2 – 5x + 2.
c *When bicycles are sold for $280 each, a cycle store can sell80 in a season. For every $10 increase in the price, thenumber sold drops by 3.a) Represent the sales revenue as a quadratic function of
either the number sold or the price.b) What is the number sold, and the price, if the total sales
revenue is exactly $20,000?c) What is the range of prices that will give a sales revenue
that exceeds $15,000?
c Write a quadratic equation whose roots are 32 and 14
- . Isthis equation unique?
c If 3x2 - mx + 2 = 0 can be factored, what values of m arepossible?
c Discuss the implications of a negative discriminant whendescribing the zeros of a quadratic function.
c Given 3x2 – mx + 3 = 0:a) For what value(s) of m would one root be double the
other?b) For what values of m would the roots not be real?
c *The profit y for publishing a book is given by the equationy = -5x2 + 400x - 3000, where x is the selling price per book.a) Is it possible to set a selling price that will earn a total
profit of $6,000? Explain your solution with reference toappropriate equations and graphs.
b) What range of selling prices allows the publisher to makea profit on this book?
PATTERNS AND RELATIONS (Relations and Functions)
It is expected that students will represent and analyse quadratic, polynomial and rational functions, using technology asappropriate.

G-197
APPENDIX G: ILLUSTRATIVE EXAMPLES • Principles of Mathematics 11
Prescribed Learning Outcomes Illustrative Examples
PATTERNS AND RELATIONS (Relations and Functions)
It is expected that students will represent and analyse quadratic, polynomial and rational functions, using technology asappropriate.
• describe, graph and analyse polynomialand rational functions, using technology
c Determine if each of the following examples is a rationalfunction, a polynomial function or some other type offunction, and justify your conclusion.
c Examine the following graphs. Which could be graphs ofrational functions, and which could be graphs of polyno-mial functions?
c Graph y = x2(x2 - 4). What is the domain and range of thisfunction?
c Graph y = x2 -1, identify the zeros of this function, and use
these to predict the asymptotes of 1(x2 - 1).
Then graph y = 1(x2 - 1), using a graphing tool. Compare the
two graphs, considering domain, range, asymptotes and
zeros.
c Use a graphing tool to graph x2
y =(x2 - 4) and to predict the
domain, range and zeros. Describe the symmetry.
c *Use technology to graph f(x) = x3 - 4x2 + k for variousvalues of k.a) Estimate the values of k for which the equation f(x) = 0
appears to have a double root.b) Show that k = 0 ensures that f(x) = 0 has a double root.
c) Show that k = 25627
ensures that f(x) = 0 has a double root.
a) b)
c) d)
y = x2 - 3x + 7
y = (x - 5)-1
y = x4 + 3x3 - 12x - 0.75 15
y = 7x5 + x2
y = 2x - 9
y = 3x - 7x2 - 5x + 6
a)
b)
c)
d)
e)
f)

G-198
APPENDIX G: ILLUSTRATIVE EXAMPLES • Principles of Mathematics 11
Prescribed Learning Outcomes Illustrative Examples
PATTERNS AND RELATIONS (Relations and Functions)
It is expected that students will represent and analyse quadratic, polynomial and rational functions, using technology asappropriate.
c Sketch ƒ(x) = |x - 1| - 4, and determine the values of x forwhich ƒ(x) > 0.
c Solve for x:
c The point P lies on the y-axis, while points A and B are (-9, 0)and (5, 0) respectively. If PA + PB is 28 units long, determinethe coordinates of P.
• formulate and apply strategies to solveabsolute value equations, radical equa-tions, rational equations and inequalities
|x - 1|> 7
(x - 1) + (x + 4) = 5
xx + 2 (x + 2) >
|x - 1|+ |2x - 1|> 7
a)
b)
c)
d)

G-199
APPENDIX G: ILLUSTRATIVE EXAMPLES • Principles of Mathematics 11
Prescribed Learning Outcomes Illustrative Examples
SHAPE AND SPACE (Measurement)
It is expected that students will solve problems involving triangles, including those found in 3-D and 2-D applications.
• solve problems involving ambiguouscase triangles in 3-D and 2-D
c An 11 cm long line AB is drawn at an angle of 44˚ to ahorizontal line AE. A circle with centre B and a radius of 9cm is drawn, cutting the horizontal line at points C and D.Calculate the length of the chord CD.
c The line segment of equation y = 2.4x, passes through A(0, 0)and C(5, 12), has a length of 13 and makes an angle of 67.3˚with the horizontal x-axis.a) What points are located with CB = 10 and AB horizontal?b) Check your answer by determining the intersection points
of the circle (x - 5)2 + (y - 12)2 = 100 and the line y = 0.c) Use a suitable diagram to explain why the answers to a)
and b) are the same.
c *Streetlights A, B, C, D and E are placed 50 m apart on themain road, as indicated on the diagram. The light from astreetlight can travel 24 m. Determine the furthest point onthe side road that is lighted and the length of side road thatis illuminated by both streetlight C and streetlight D.
AMain Road
Side Road
31˚B C D E
G-200
APPENDIX G: ILLUSTRATIVE EXAMPLES • Principles of Mathematics 11
Prescribed Learning Outcomes Illustrative Examples
SHAPE AND SPACE (3-D Objects and 2-D Shapes)
It is expected that students will solve coordinate geometry problems involving lines and line segments, and justify thesolutions.
c Determine the shortest distance from (3, 4) to the line2x – 5y = 7.
c The lines y = 3x + 1 and y = 3x - 9 are parallel. Determinethe vertical distance between the two lines, the horizontaldistance between the two lines and the shortest distancebetween the two lines.
c Given A = (-1, 3), B = (0, 5) and C = (-2, 6):a) Verify that ABC is a right-angled triangle.b) Is ABC isosceles? Justify your assertion.c) If M is the midpoint of AB and N is the midpoint of AC,
prove that MN is parallel to BC.d) Find a point D so that ABCD is a parallelogram. Prove
that ABCD is not a rectangle.
c *Use coordinate geometry to prove that:a) the diagonals of any parallelogram bisect one another in
their midpointsb) if ABC is any triangle, with M as the midpoint of AB
and N as the midpoint of AC, then MN is parallel to BCand is half its length
c Use coordinate geometry to divide the line segment withend points A(4, 7) and B(-3, 8) into five congruent parts.
• solve problems involving distancesbetween points and lines
• verify and prove assertions in planegeometry, using coordinate geometry

G-201
APPENDIX G: ILLUSTRATIVE EXAMPLES • Principles of Mathematics 11
Prescribed Learning Outcomes Illustrative Examples
SHAPE AND SPACE (3-D Objects and 2-D Shapes)
It is expected that students will develop and apply the geometric properties of circles and polygons to solve problems.
• use technology with dynamic geometrysoftware and measurement to confirmand apply the following properties:- the perpendicular from the centre of a
circle to a chord bisects the chord- the measure of the central angle is equal
to twice the measure of the inscribedangle subtended by the same arc
- the inscribed angles subtended by thesame arc are congruent
- the angle inscribed in a semicircle is aright angle
- the opposite angles of a cyclic quadri-lateral are supplementary
- a tangent to a circle is perpendicular tothe radius at the point of tangency
- the tangent segments to a circle, fromany external point, are congruent
- the angle between a tangent and achord is equal to the inscribed angle onthe opposite side of the chord
- the sum of the interior angles of an n-sided polygon is (2n – 4) right angles
c A plate, with a diameter of 20 cm, is placed on a squareplace mat, with no overhang. Calculate the length of thediagonal of the square.
c Determine the measure of angle x. Justify your assertions.
c Determine the measure of angle x. Justify your assertions.
c Draw a semicircle with diameter AB. Draw an angle, ACB,with C being any point on the semicircle. What is themeasure of angle ACB? Repeat for two other points C', andC", on the semicircle. What pattern emerges?
c Determine the measure of /ECB, /BDC, /BAD and /DBE,where E is the centre of the circle.
c How far from the inside corner of the shelf, A, is the centre Cof the plate, if the plate has a diameter of 20 cm?
x
130˚
x110˚40˚
AB
CD
E100
3 0
A
C

G-202
APPENDIX G: ILLUSTRATIVE EXAMPLES • Principles of Mathematics 11
Prescribed Learning Outcomes Illustrative Examples
c Find the length of the side of the square if the diameter ofthe semicircle is 20 cm. Justify your assertions.
c The perimeter of the isosceles triangle ABC, with AC = BC,is 54 cm. If AD = 5 cm, and D, E and F are points of tan-gency, find the length of BC.
c Determine the measure of /CAE, if /BDF = 60˚ and/FDE = 70˚.
c A circular hole 30 cm in diameter is cut in a sheet of metaland a spherical globe 34 cm in diameter is set into the hole.How far below the top surface of the metal sheet will thesphere extend?
x
15 15
17
A
B
E
F
D
C
D
C
E
A
B
F
A B
D C0
SHAPE AND SPACE (3-D Objects and 2-D Shapes)
It is expected that students will develop and apply the geometric properties of circles and polygons to solve problems.

G-203
APPENDIX G: ILLUSTRATIVE EXAMPLES • Principles of Mathematics 11
Prescribed Learning Outcomes Illustrative Examples
SHAPE AND SPACE (3-D Objects and 2-D Shapes)
It is expected that students will develop and apply the geometric properties of circles and polygons to solve problems.
• prove the following general properties,using established concepts and theorems:- the perpendicular bisector of a chord
contains the centre of the circle- the measure of the central angle is
equal to twice the measure of theinscribed angle subtended by the samearc (for the case when the centre of thecircle is in the interior of the inscribedangle)
- the inscribed angles subtended by thesame arc are congruent
- the angle inscribed in a semicircle is aright angle
- the opposite angles of a cyclic quadri-lateral are supplementary
- a tangent to a circle is perpendicular tothe radius at the point of tangency
- the tangent segments to a circle fromany external point are congruent
- the angle between a tangent and achord is equal to the inscribed angleon the opposite side of the chord
- the sum of the interior angles of an n-sided polygon is (2n - 4) right angles.
c a) For what values of c does the line y = c touch the circlex2 + y2 = r2?
b) Use the result from part a) to show that the tangent to acircle is perpendicular to the radius at the point oftangency.
c Show that the angle inscribed in a semicircle is a right angle.
c *The chord AB is one side of a regular polygon of n sides.The polygon is inscribed in a circle. If D is any other vertexof the polygon, prove that the magnitude of angle ADB is 180˚
n .
c Explore the relationships between the number of sides of aregular polygon and the sum of the internal angles.
5x˚ x˚ ˚=
sum of interior angles

G-204
APPENDIX G: ILLUSTRATIVE EXAMPLES • Principles of Mathematics 11
Prescribed Learning Outcomes Illustrative Examples
c If diameter CD is perpendicular to chord AB at E, prove thattriangle ABC is isosceles.
c Show that BC bisects angle ECA, if AC is the diameter of thecircle, CE is perpendicular to DF and DF is a tangent at B.
c Determine the measure of /BAF, if /DEF = 60˚ and/BFD = 70˚. Provide a reason for each step in the solutionstrategy.
c *A chain on a bicycle connects two gear wheels of diameters9 cm and 19 cm respectively. The centres of the gear wheelsare 87 cm apart. Find the minimum length of the chain.
• solve problems, using a variety of circleproperties, and justify the solutionstrategy used
CA
D B E F
1 3
2 4
5
6
DC E
A
B
D
C
E
A
B
F
SHAPE AND SPACE (3-D Objects and 2-D Shapes)
It is expected that students will develop and apply the geometric properties of circles and polygons to solve problems.

APPENDIX G
ILLUSTRATIVE EXAMPLES
Principles of Mathematics 12


G-207
APPENDIX G: ILLUSTRATIVE EXAMPLES • Principles of Mathematics 12
Prescribed Learning Outcomes Illustrative Examples
It is expected that students will:
• solve problems that involve a specificcontent area
• solve problems that involve more thanone content area
• solve problems that involve mathematicswithin other disciplines
• analyse problems and identify thesignificant elements
• develop specific skills in selecting andusing an appropriate problem-solvingstrategy or combination of strategieschosen from, but not restricted to, thefollowing:- guess and check- look for a pattern- make a systematic list- make and use a drawing or model- eliminate possibilities- work backward- simplify the original problem- develop alternative original approaches- analyse keywords
• demonstrate the ability to workindividually and co-operatively to solveproblems
• determine that their solutions are correctand reasonable
• clearly communicate a solution to aproblem and the process used to solve it
• interpret their solutions by describingwhat the solution means within thecontext of the original problem
• use appropriate technology to assist inproblem solving
PROBLEM SOLVING
It is expected that students will use a variety of methods to solve real-life, practical, technical, and theoretical problems.
Illustrative Examples for Problem Solving have beenindicated with an asterisk (*) throughout Appendix G.

G-208
APPENDIX G: ILLUSTRATIVE EXAMPLES • Principles of Mathematics 12
Prescribed Learning Outcomes Illustrative Examples
PATTERNS AND RELATIONS (Patterns)
It is expected that students will generate and analyse exponential patterns.
• derive and apply expressions to representgeneral terms and sums for geometricgrowth and to solve problems
c Determine the nth term and the sum of the first n terms of thegeometric sequence whose first three terms are 2, 6, and 18.
c Mathematicians use sigma notation as a way to write the
sum of a series. For example: ∑5
k = 12k = 21 + 22 + 23 + 24 + 25 .
Use sigma notation to write the series 5 – 15 + 45 – . . . + 3645.
c *Suppose that a principal of P dollars is invested at anannual interest rate r that is compounded annually. Theamount A after t years is given by A = P(1 + r)t.a) Find the number of years for the amount to double, if
$2000 is invested at a rate of 7.5%, compounded annually.b) If the interest rate were 7.25% per annum, compounded
semi-annually, how would the doubling period change?c) What would be the doubling period, if the rate were 7%
per annum, compounded daily?
c For the geometric series 131- + +1
9 - 127 ..., find the sum of 20
terms.
c *The time needed for an investment to double in value canbe estimated using the rule of 72, which states that n = 72
iwhere i is the annual percentage interest rate and n thenumber of years.a) Compare the rule of 72 doubling time with the exact
doubling time for the following interest rates:• 4% per annum, compounded annually• 8% per annum, compounded annually• 24% per annum, compounded annually.
b) What general conclusion can be drawn as to the accuracyof rule of 72 calculations?

G-209
APPENDIX G: ILLUSTRATIVE EXAMPLES • Principles of Mathematics 12
Prescribed Learning Outcomes Illustrative Examples
PATTERNS AND RELATIONS (Patterns)
It is expected that students will generate and analyse exponential patterns.
c The world’s population grows by 2% per year. The worldfood production can sustain an additional 200 millionpeople per year. In 1987 the population was 5 billion, andfood production could sustain 6 billion people.a) Calculate the population in 1998, 2009, 2019.b) Calculate the population that food production could
sustain in 1998, 2009, 2019.c) When will the population exceed the food supply?
c *The following is a school trip telephoning tree.
a) At what level are 64 students contacted?b) How many are contacted at the 8th level?c) By the 8th level how many students, in total, have been
contacted?d) By the nth level how many students, in total, have been
contacted?e) If there are 300 students in total, by what level will all
have been contacted?
• connect geometric sequences toexponential functions over the naturalnumbers
Level 1, teacher
Level 2, students
Level 3, students
• estimate values of expressions for infinitegeometric processes
c For the infinite series 252 + + +2
25 ..., estimate the sum to fourdecimal places.
c An oil well produces 25 000 barrels of oil during its firstmonth of production. If its production drops by 5% eachmonth, estimate the total production before the wellruns dry.
G-210
APPENDIX G: ILLUSTRATIVE EXAMPLES • Principles of Mathematics 12
Prescribed Learning Outcomes Illustrative Examples
PATTERNS AND RELATIONS (Variables and Equations)
It is expected that students will solve exponential, logarithmic and trigonometric equations and identities.
c Solve for x: 3(4x - 1) = 272x.
c *A string of ones and zeros is the binary representation of anumber. If this number is converted to the base-16hexadecimal representation, it is 9 digits shorter. As well,the decimal and hexadecimal representations have the samenumber of digits.a) How many digits are there in the binary representation of
the original number?b) Between what two decimal numbers does the original
number lie?
• solve exponential equations having basesthat are powers of one another
• solve and verify exponential andlogarithmic equations and identities
c Solve for x: log2 (x - 2) + log2 (x) = log2 (3).
c Solve for x: 2 × 3x = 5(x - 1).
c Solve for x, checking for any extraneous solutions:log5 (3x + 1) + log5 (x – 3) = 3.
c *The pH of an acid is given by pH = –log10 [H+], where [H+]
is the hydrogen ion concentration in moles per litre. Whatis the hydrogen ion concentration of a weak vinegarsolution of pH = 3.1?
c Joe has $50,000 invested at an interest rate of 7% per annum,compounded monthly. Laura has $40,000 invested at 9.5%per annum, compounded annually. After how many yearswill the two investments be equal in value?
c Verify the identity loga 1x )( = -logax for any base a and any
positive value of x.

G-211
APPENDIX G: ILLUSTRATIVE EXAMPLES • Principles of Mathematics 12
Prescribed Learning Outcomes Illustrative Examples
PATTERNS AND RELATIONS (Variables and Equations)
It is expected that students will solve exponential, logarithmic and trigonometric equations and identities.
• distinguish between degree and radianmeasure, and solve problems, using both
c Draw an angle of one radian, and show how its radius andarc length are related.
c Convert the following angles to degrees: 2π3 , 1.6 rad.
c Convert the following angles to radians expressed in termsof π: 180˚, 55˚.
c *In an experiment to verify the law of refraction,measurements were made of the angles of incidence andrefraction. A spreadsheet was used to calculate the sines ofboth angles and the ratio of the two sines. The results of thespreadsheet calculation are shown in the following table.
a) In the calculations of sin i and sin r, are the angles takenas being in degrees or in radians?
b) Modify the spreadsheet so that all entries reflect radianmeasure.
c) Modify the spreadsheet so that all entries reflect degreemeasure.
d) What conclusion can be drawn from either b) or c)?
Angle of incidencei (degrees)
Angle of refractionr (degrees)
sin i sin r (sin i) (sin r)
10
20
30
40
50
60
70
80
-0.83
2.17
-6.59
-5.63
0.27
0.71
2.61
-1.33
7
13
19
25
30
35
38
40
-0.544
0.913
-0.988
0.745
-0.262
-0.305
0.774
-0.994
0.657
0.420
0.150
-0.132
-0.988
-0.428
0.296
0.745
• determine the exact and the approximatevalues of trigonometric ratios for anymultiples of 0˚, 30˚, 45˚, 60˚ and 90˚ and 0,π6
π4
, , π3
, π2
c Given an equilateral triangle with a side of 2 units,determine the exact trigonometric ratios of 30°.
c Find the exact values for 7π6sin 2π
3, tan 7π4, cos .
30˚2 1
12

G-212
APPENDIX G: ILLUSTRATIVE EXAMPLES • Principles of Mathematics 12
Prescribed Learning Outcomes Illustrative Examples
PATTERNS AND RELATIONS (Variables and Equations)
It is expected that students will solve exponential, logarithmic and trigonometric equations and identities.
• solve first and second degreetrigonometric equations over a domain oflength 2π:- algebraically- graphically
c Find, algebraically and graphically, the solution to thefollowing trigonometric equations:a) 1 + 2 cos x = 5 cos x; 0 < x < 2π. Give solutions in
decimal form.b) sin2x - sin x = 0; 0 < x < 2π. Give solutions as exact
values.c) cos 4x = 0.5; 0 < x < 2π. Give solutions as exact values.
• determine the general solutions totrigonometric equations where thedomain is the set of real numbers
c Sketch the graph of y = sin 3x. Use the graph to find allsolutions of sin 3x = 0 in the interval 0 < x < 2π.
c *Use technology to graph y = x - 2 sin x, and use the graphto find all solutions to the equation 2 sin x = x. Expressanswers to a three-decimal place accuracy.
c What is the relation between the graphs of y = sin x andy = 1
2 and the roots of the equation 0 = 2 sin x -1?
c Use technology to solve sin 3x = 12 , and then write the
general solution.
• analyse trigonometric identities:- graphically- algebraically for general cases
c a) Verify that sin2x + cos2x = 1 for any real number x.b) Use this identity to show that 1 + tan2x = sec2x for all x,
where cos x ≠ 0.
c *Given the identity sinx1 - cosx = 1 - cosx
sinx :a) verify the identity for the particular case when π
3x =
b) verify for a general angle, using an algebraic approachc) verify, by graphing the left-hand side and the right-hand
side of the given identity
• use sum, difference and double angleidentities for sine and cosine to verify andsimplify trigonometric expressions
c Write 2 (sin 5)(cos 5) in terms of a single trigonometricfunction.
c *Graph the function 2 tan x1 + tan2xƒ(x) = .
a) Make a conjecture for the period of the above graph.b) Simplify the expression for f(x) to a single trigonometric
function, and then find the period of f(x).c) Compare the solutions to a) and b).
G-213
APPENDIX G: ILLUSTRATIVE EXAMPLES • Principles of Mathematics 12
Prescribed Learning Outcomes Illustrative Examples
PATTERNS AND RELATIONS (Relations and Functions)
It is expected that students will represent and analyse exponential and logarithmic functions, using technology asappropriate.
• model, graph and apply exponentialfunctions to solve problems
c The summertime population of gophers in a field can bemodelled by the equation P = 100(1.1)n, where n is measuredin years. Plot the graph for a 10-summer period, and use thegraph to find out how long it takes for the gopherpopulation to double.
c The half-life of sodium-24 is 14.9 hours. Suppose that ahospital buys a 40 mg sample of sodium-24.a) How much of the sample will remain after 48 hours?b) How long will it be until only 1 mg remains?
c *The population of a certain country is 28 million and growsat a rate of 3% annually. Assuming the population iscontinuously growing, the population P, in millions, t yearsfrom now can be determined by the formula P = 28e0.03t.a) In how many years will the population be 40 million?b) What factors could contribute to the breakdown of this
model?
• change functions from exponential formto logarithmic form and vice versa
• model, graph and apply logarithmicfunctions to solve problems
c Rewrite y = 2x as a logarithmic function.
c *The ionization of pure water is shown in the equations:[H+] [OH-] = 1.0 ¥ 10-14 and [H+] = [OH-]. If the pH of anysolution is defined as pH = -log10[H
+], what is the pH of purewater?
c Research the strength of earthquakes, and compare them,using the Richter scale.
c *The Armenian earthquake, Richter scale 6.9, produced3.5 × 1013 J of energy. How much energy did the Alaskaearthquake, Richter scale 8.2, produce?
c Graph y = log10x and y = log2x on the same set of coordinateaxes. What is the likely position of the graph of y = log5x?
c Analyse the graph of y = log10 (2x + 3). Identify thedomain, range, asymptotes and intercepts.
• explain the relationship between the lawsof logarithms and the laws of exponents
c *Explain how the exponent law ax × ay = a(x + y) is related tothe logarithmic law loga(MN) = logaM + logaN.
c Use a calculator to find log58, and justify your procedure.

G-214
APPENDIX G: ILLUSTRATIVE EXAMPLES • Principles of Mathematics 12
Prescribed Learning Outcomes Illustrative Examples
PATTERNS AND RELATIONS (Relations and Functions)
It is expected that students will represent and analyse trigonometric functions, using technology as appropriate.
• describe the three primary trigonometricfunctions as circular functions withreference to the unit circle and an angle instandard position
c Triangle OBA has vertices O(0, 0), B(4, 0) and A(4, 3). Theunit circle, centred at (0, 0), intersects OA at point P.a) Use similar triangles to find the coordinates of point P.b) Use trigonometric ratios to find the sine and cosine of
angle AOB.c) Compare your results in b) to the coordinates of point P.
• draw (using technology), sketch andanalyse the graphs of sine, cosine andtangent functions, for:- amplitude, if defined- period- domain and range- asymptotes, if any- behaviour under transformations
c Using a graphing utility, graph y = sin x and y = cos x on thesame set of axes.a) What relationship seems to exist between the two?b) What is the amplitude and period of each graph?
c Graph y = tan x and y = tan 2x. Compare the period, thedomain and the range of y = tan x to those of y = tan 2x.
c *In the equation y = A sin [B(x + C)] + D; A = 4, B = 3,C = -3π
4 and D = -3. Compare the graph of this function tothe graph of y = sin x with respect to domain, range,amplitude, period, x and y intercepts, horizontal phase shiftand vertical displacement.

G-215
APPENDIX G: ILLUSTRATIVE EXAMPLES • Principles of Mathematics 12
Prescribed Learning Outcomes Illustrative Examples
PATTERNS AND RELATIONS (Relations and Functions)
It is expected that students will represent and analyse trigonometric functions, using technology as appropriate.
c *For a Saskatchewan town, the latest sunrise time is onDecember 21, at 09:15. The earliest sunrise time is on June21, at 03:15. Sunrise times on other dates can be predictedfrom a sinusoidal equation. Note: There is no DaylightSaving Time in Saskatchewan.a) What is the equation that describes sunrise times?b) What is the amplitude and period of the equation
describing sunrise times?c) Use the equation to predict the time of sunrise on April 9.d) What is the average time of sunrise throughout the year?
c The depth of water in a harbour is given by the equationd(t) = – 4.5 cos (0.16πt) + 13.7, where d(t) is the depth, inmetres, and t is the time, in hours, after low tide.a) Sketch the graph of d(t).b) What is the period of the tide, from one high tide to the
next?c) A bulk carrier needs at least 14.5 m of water to dock
safely. For how many hours per cycle can the bulkcarrier dock safely?
c *The average daily maximum temperature in Vancouverfollows a sinusoidal pattern with a highest value of 23.6˚Con July 26, and a lowest value of 4.2˚C on January 26.a) Describe this variation with a sine or cosine equation.b) What is the expected maximum temperature for May 26?c) How many days will have an expected maximum of
21.0˚C or higher?d) Explain why different equations give the same answers
for b) and c).
• use trigonometric functions to model andsolve problems

G-216
APPENDIX G: ILLUSTRATIVE EXAMPLES • Principles of Mathematics 12
Prescribed Learning Outcomes Illustrative Examples
SHAPE AND SPACE (3-D Objects and 2-D Shapes)
It is expected that students will classify conic sections, using their shapes and equations.
c Visualize the shapes generated from the intersection of adouble-napped cone and a plane. For each conic section,describe the relationship between the plane, the central axisof the cone and the cone’s generator.
• classify conic sections according to shape
• classify conic sections according to a givenequation in general or standard(completed square) form (vertical orhorizontal axis of symmetry only)
• convert a given equation of a conicsection from general to standard formand vice versa
c Convert to standard form:a) x2 + y2 + 6x - 8y = 11b) 3x2 + y2 + 6x + 4y = 9
c Convert to general form:a)
b)
c A circle with a radius of 4 units has the equationx2 + y2 - 16 = 0. What are the values of A, C and F in thegeneral form? What is the radius of the circle25x2 + 25y2 - 100 = 0?
c a) Graph the circle x2 + y2 = 25.b) Graph Ax2 + y2 = 25 where A > 1.c) Graph Ax2 + y2 = 25 where 0 < A < 1.d) Graph Ax2 + y2 = 25 where A = 0.e) Graph x2 + Cy2 = 25 where C > 1.f) Graph x2 + Cy2 = 25 where 0 < C < 1.g) Graph x2 + Cy2 = 25 where C = 0.h) Draw a conclusion based on the results found in
b) through g).
c Graph 2x2 + y2 - 12 = 0, using technology. Graph two otherequations of this type, by changing one of the coefficients.What shape is represented by this type of graph?
c Graph 4x2 - 25y2 - 100 = 0, using technology. Graph twoother equations of this type, by changing one of thecoefficients. What shape is represented by this type ofgraph?
(x - 4)2
9 + = 1(y + 2)2
16
(x + 3)2
25 - = 1(y - 4)2
16
G-217
APPENDIX G: ILLUSTRATIVE EXAMPLES • Principles of Mathematics 12
Prescribed Learning Outcomes Illustrative Examples
SHAPE AND SPACE (Transformations)
It is expected that students will perform, analyse and create transformations of functions and relations that aredescribed by equations or graphs.
c Describe how the graph of y = x2 compares to the graph ofy = x2 - 2.
c Graph any function f(x). On the same set of coordinate axes,sketch the graph of:a) f(x) - 2b) f(x - 2)c) f(x - 2) + 1
• describe how various translations offunctions affect graphs and their relatedequations:- y = f(x - h)- y - k = f(x)
• describe how various stretches offunctions (compressions and expansions)affect graphs and their related equations:- y = af(x)- y = f(kx)
c Describe how the graph of y = x2 compares to the graph of:a) y = 2x2
b) 23 x2y =
c Graph any function f(x). On the same set of coordinateaxes, sketch the graph of:a) 2f(x)b) -2f(x)c) 2
3 ƒ(x)
Discuss the changes.
c Given the graph of f(x) = sin x, sketch the graph of:a) f(2x)b) 2
3 ƒ(x)
c Given the graph of f(x) = x3 and its image under thetransformation g(x) = 3f(x), find the equation describing g(x).
c Graph any function f(x). Sketch the graph of:a) -f(x)b) f(-x)c) f-1(x)d) f-1[f(x)]
c If g(x) is the reflection of f(x) in the y-axis, write the equationof g(x) in terms of f(x).
• describe how reflections of functions inboth axes and in the line y = x affectgraphs and their related equations:- y = f(-x)- y = -f(x)- y = f-1(x)
G-218
APPENDIX G: ILLUSTRATIVE EXAMPLES • Principles of Mathematics 12
Prescribed Learning Outcomes Illustrative Examples
SHAPE AND SPACE (Transformations)
It is expected that students will perform, analyse and create transformations of functions and relations that aredescribed by equations or graphs.
• describe and perform singletransformations and combinations oftransformations on functions andrelations
c Given f(x) = x2, sketch the graph of f(x), and sketch the graphof -2f(x - 1) + 3.
c Determine the equation of the ellipse x2 + 4y2 - 25 = 0, aftereach of the following transformations:a) translated two units to the rightb) translated three units downc) expanded by a factor of two along the horizontal axisd) expanded by a factor of one quarter along the vertical axis
c *Given the circle x2 + y2 = 1 and its image under a translationdescribed by the ordered pair (2, -3);a) Write the equation of the imageb) If a point P(a, b) is on the graph of the circle x2 + y2 = 1
and P1(a1, b1) is the transformed image of P, what are thecoordinates of P1
in terms of a and b?
• using the graph and/or the equation off(x), describe and sketch |f(x)|
c Given the graph of f(x) = 2x + 1, sketch |f(x)|.
c Sketch y = 3|sin x|. What is the period of this function?
c Sketch 1|x2 - 1|
ƒ(x)= .
c *An AC generator has a voltage given by V = 170 cos(120πt), where V is the voltage and t the time in seconds. Asimple DC rectifier has voltage output given byV = 170|cos (120πt)|. Sketch the output graphs for bothdevices, and describe the similarities and differences.
• using the graph and/or the equation off(x), describe and sketch 1
ƒ(x)
c Given f(x) = 2x + 1, sketch the graph of f(x) and of 1ƒ(x) .
What happens to the x-intercepts of f(x)?
c Sketch the graph of f(x) = sin x, and sketch 1sin x .
c Sketch 1ƒ(x) , if f(x) is shown by the accompanying sketch.
ƒ(x)
x
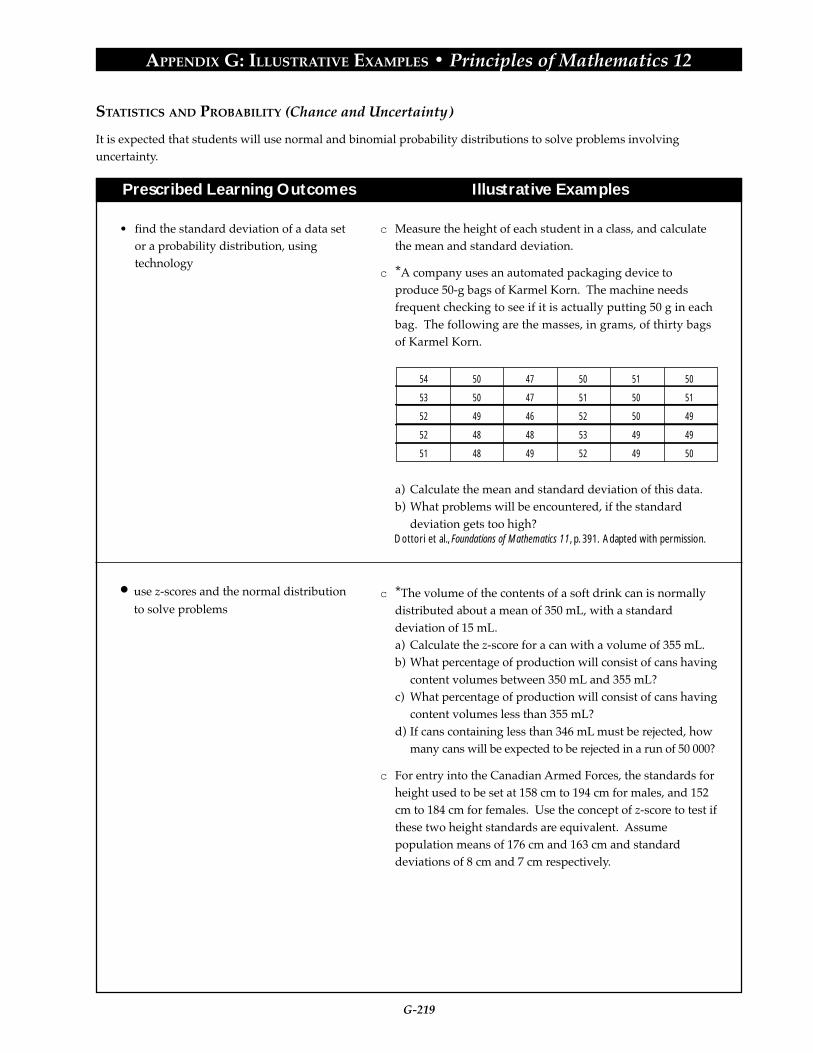
G-219
APPENDIX G: ILLUSTRATIVE EXAMPLES • Principles of Mathematics 12
Prescribed Learning Outcomes Illustrative Examples
STATISTICS AND PROBABILITY (Chance and Uncertainty)
It is expected that students will use normal and binomial probability distributions to solve problems involvinguncertainty.
• find the standard deviation of a data setor a probability distribution, usingtechnology
54
53
52
52
51
50
50
49
48
48
47
47
46
48
49
50
51
52
53
52
51
50
50
49
49
50
51
49
49
50
• use z-scores and the normal distributionto solve problems
c Measure the height of each student in a class, and calculatethe mean and standard deviation.
c *A company uses an automated packaging device toproduce 50-g bags of Karmel Korn. The machine needsfrequent checking to see if it is actually putting 50 g in eachbag. The following are the masses, in grams, of thirty bagsof Karmel Korn.
a) Calculate the mean and standard deviation of this data.b) What problems will be encountered, if the standard
deviation gets too high?Dottori et al., Foundations of Mathematics 11, p. 391. Adapted with permission.
c *The volume of the contents of a soft drink can is normallydistributed about a mean of 350 mL, with a standarddeviation of 15 mL.a) Calculate the z-score for a can with a volume of 355 mL.b) What percentage of production will consist of cans having
content volumes between 350 mL and 355 mL?c) What percentage of production will consist of cans having
content volumes less than 355 mL?d) If cans containing less than 346 mL must be rejected, how
many cans will be expected to be rejected in a run of 50 000?
c For entry into the Canadian Armed Forces, the standards forheight used to be set at 158 cm to 194 cm for males, and 152cm to 184 cm for females. Use the concept of z-score to test ifthese two height standards are equivalent. Assumepopulation means of 176 cm and 163 cm and standarddeviations of 8 cm and 7 cm respectively.

G-220
APPENDIX G: ILLUSTRATIVE EXAMPLES • Principles of Mathematics 12
Prescribed Learning Outcomes Illustrative Examples
STATISTICS AND PROBABILITY (Chance and Uncertainty)
It is expected that students will use normal and binomial probability distributions to solve problems involvinguncertainty.
c A sample of 122 people gives a mean body temperature of36.8°C, with a standard deviation of 0.35°C. Assuming anormal distribution, find:a) the expected number of people with temperatures above
37.0°Cb) the expected number of people with temperatures below
36.0°C
Also, estimate the range of temperatures contained withinthe sample.
c In the general population, the IQ scores of individuals isnormally distributed with a mean of 110 and a standarddeviation of 10. If a large group of people is tested:a) What proportion of this group is expected to have IQs
between 100 and 120?b) What is the probability that an individual in the group
has an IQ greater than 120?
• use the normal approximation to thebinomial distribution to solve problemsinvolving probability calculations for largesamples (where npq > 10)
c *Pollsters estimate that the number of decided voters infavour of a particular bylaw is 64%, and the numberopposed is 36%.a) If the sample size is 250, find the expected mean and
standard deviation of yes voters.b) Estimate, for this sample, the expected percentage of yes
voters, with a symmetric 95% confidence interval used toestablish the margin of error.
c) If the margin of error for the percentage of yes votersmust be less than ±1.0%, what would be the minimumsample size required?
c The probability that a car salesperson will complete a sale is0.10.a) If the salesperson has 200 customers in the next month,
estimate the number of sales that she will make duringthat interval.
b) Construct a 95% confidence interval for her monthlysales.

G-221
APPENDIX G: ILLUSTRATIVE EXAMPLES • Principles of Mathematics 12
Prescribed Learning Outcomes Illustrative Examples
STATISTICS AND PROBABILITY (Chance and Uncertainty)
It is expected that students will solve problems based on the counting of sets, using techniques such as thefundamental counting principle, permutations, and combinations.
• solve pathway problems, interpretingand applying any constraints
c Given the following “pinball” situation, what is theprobability of the ball reaching each of the exits?
What assumptions are made in the solution?
A B C D E Exits
Drop Ball Here
• use the fundamental counting principle todetermine the number of different waysto perform multistep operations
c Joe has three different shirts, two different pairs of pantsand five different pairs of shoes. List all possible outfits insuch a way as to ensure that all have been counted and nonehave been counted twice. How many possible outfits arethere? Use the fundamental counting principle to determinethe number of outfits there should be. Do your answersmatch?
c *An airline pilot reported that in seven days she spent oneday in Winnipeg, one day in Regina, two days in Edmontonand three days in Yellowknife. How many differentitineraries are possible? What difference would it make ifthe first day and the last day had to be spent in Yellowknife?
G-222
APPENDIX G: ILLUSTRATIVE EXAMPLES • Principles of Mathematics 12
Prescribed Learning Outcomes Illustrative Examples
c List all possible permutations of the letters in the word bold.
c Calculate the number of ways that an executive consistingof four people (president, vice-president, treasurer andsecretary) can be selected from a group of 20 people.
c Explain the meaning of 8P3. Why does 3P8 not make sense?
c Develop and solve a problem where 8P3 would be applicable.
c Solve nP2 = 30.
c On a 12-question multiple-choice test, three answers are A,three are B, three are C and three are D. How manydifferent answer keys are possible?
• determine the number of permutations ofn different objects taken r at a time, anduse this to solve problems
STATISTICS AND PROBABILITY (Chance and Uncertainty)
It is expected that students will solve problems based on the counting of sets, using techniques such as thefundamental counting principle, permutations, and combinations.
• determine the number of combinations ofn different objects taken r at a time, anduse this to solve problems
c *From a group of five student representatives, three will bechosen to work on the dance committee.a) List all possible committees.b) Calculate 5C3, and compare to the answer in part a).c) If the committee had to have a chairperson, would it still
be a combination? Why or why not?d) How many committees of three, with a chairperson, can
be chosen from a group of 10 student representatives?
c Show that nCk = nC(n - k), using two different methods. Verify thetruth of this assertion for the special case with n = 10 and k = 3.
c *How many diagonals are there in a regular polygon with20 sides? What is the general formula for the number ofdiagonals in an n-sided polygon?
• solve problems, using the binomialtheorem where N belongs to the set ofnatural numbers
c Expand (x + y)7, using the binomial theorem.
c Find the 11th term of the expansion of (x - 2)13.
c *Investigate the sample space for flipping 1 coin, 2 coins, 3coins, 4 coins . . . , and make an organized list. Relate thisorganized list to Pascal’s triangle and the binomial theorem.
c Given a set of four elements, list the different proper andimproper subsets, and organize them. How is this related toPascal’s triangle? How many subsets are there in total?

G-223
APPENDIX G: ILLUSTRATIVE EXAMPLES • Principles of Mathematics 12
Prescribed Learning Outcomes Illustrative Examples
STATISTICS AND PROBABILITY (Chance and Uncertainty)
It is expected that students will model the probability of a compound event, and solve problems based on thecombining of simpler probabilities.
• construct a sample space for two or threeevents
c List the sample space for rolling a 6-sided die and flippinga coin.
c *Draw or list the sample space for the following situation.A bus is scheduled to arrive at a train station at any timebetween 07:05 and 07:15 inclusive. A train is scheduled toarrive between 07:11 and 07:17 inclusive. The arrival of abus at 07:06 and a train at 07:14 can be represented by thepoint (6, 14). Times are expressed in whole minutes.a) How many points are there in this sample space?b) How many points have the bus and the train arriving at
the same time?c) How many points have the bus arriving after the train?d) What is the probability of the bus arriving after the train?
• classify events as independent ordependent
c Classify the following events as independent or dependent:a) tossing a head in a coin toss and rolling a 6 on a dieb) drawing an ace for the first card and another ace for the
second, if the experiment is carried out without replacementc) drawing a king for the first card and a queen for the
second, if the experiment is carried out with replacement
c *Sixty percent of young drivers take driver training, and25% of young drivers have an accident in their first year ofdriving. Statistics show that 10% of those who do takedriver training have an accident in their first year. Aretaking driver training and having an accident in the firstyear independent events?
• solve problems, using the probabilities ofmutually exclusive and complementaryevents
c If the probability of winning a game is 131, what is the
probability of losing the game?
c *A shootout consists of teams A and B taking alternate shotson goal. The first team to score wins. Team A has aprobability of 0.3 of scoring with any one shot. Team B has aprobability of 0.4 of scoring with any one shot.a) If Team A shoots first, what is the probability of Team B
winning on its first shot?b) If Team A shoots first, what is the probability of Team A
winning on its third shot?
G-224
APPENDIX G: ILLUSTRATIVE EXAMPLES • Principles of Mathematics 12
Prescribed Learning Outcomes Illustrative Examples
STATISTICS AND PROBABILITY (Chance and Uncertainty)
It is expected that students will model the probability of a compound event, and solve problems based on thecombining of simpler probabilities.
• determine the conditional probability oftwo events
c In a particular country, the probability of a child being a girlis 0.510. A family of five children is known to have at leasttwo girls. What is the probability of this family havingexactly four girls?
c *It is known that 10% of a population has a certain disease.For a patient without the disease, a blood test for the diseasegives a correct diagnosis 95% of the time. For a patient withthe disease, the test gives a correct diagnosis 99% of thetime. What is the probability that a person whose blood testshows the disease actually has the disease?
• solve probability problems involvingpermutations, and combinations andconditional probability
c Five books, each of a different colour, and including one redand one green book, are placed on a shelf. What is theprobability of the red book being at one end and the greenbook at the other?
c What is the probability of holding all four aces in a five-cardhand dealt from a standard 52-card deck?
c *A shootout consists of teams A and B taking alternate shotson goal. The first team to score wins. Team A has aprobability of 0.3 of scoring with any one shot. Team B hasa probability of 0.4 of scoring with any one shot.a) If Team A shoots first, what is the probability of Team B
winning on its first shot?b) If Team A shoots first, what is the probability of Team A
winning on its third shot?c) What is the probability of Team A eventually winning?d) If Team B shot first, what is the probability of Team B
eventually winning?

APPENDIX G
ILLUSTRATIVE EXAMPLES
Calculus 12

G-227
APPENDIX G: ILLUSTRATIVE EXAMPLES • Calculus 12
Prescribed Learning Outcomes Illustrative Examples
FUNCTIONS, GRAPHS AND LIMITS (Functions and their Graphs)
It is expected that students will represent and analyse inverse trigonometric, base e exponential, natural logarithmic,elementary implicit, and composite functions, using technology as appropriate.
It is expected that students will:
• model and apply inverse trigonometric,base e exponential, natural logarithmic,elementary implicit, and compositefunctions to solve problems
• draw (using technology), sketch andanalyse the graphs for rational, inversetrigonometric, base e exponential, naturallogarithmic, elementary implicit andcomposite functions, for:- domain and range- intercepts
• recognize the relationship between a basea exponential function (a>0) and theequivalent base e exponential function(convert y a y ex x a= = to (ln ) )
(Differentiation problems will also requirestudents to demonstrate achievement ofthis outcome.)
• determine using the appropriate method(analylitic or graaphing utility) the pointswhere f(x) = 0
c Find the area of the part of the first quadrant that is insidethe circle x y2 2 4+ = and to the left of the line x u= . (Theinverse sine function will be useful here.)
c Suppose that under continuous compounding 1 dollar growsafter t years to (1.05)t dollars. Find the number r such that( . )1 05 t rte= . (This r is called the nominal yearly interest rate.)
c Sketch the graph of x
x
2
2 1−.
c Write sin(tan )−1 x in a form that does not involve anytrigonometric functions.
c a) Let f x ex( ) ln( )= . Sketch the graph of f(x).b) Let g(x) be the inverse function of f(x). Sketch the graph of
g(x).c) Find an explicit formula for g(x).
c Sketch the curve y ex= +ln( )1 .
c Let f x x x( ) = .a) Express f(x) in the form f x eg x( ) ( )= .b) Find the minimum value taken on by f(x) on the interval
( , )0 ∞ .
c [No example for this prescribed learning outcome
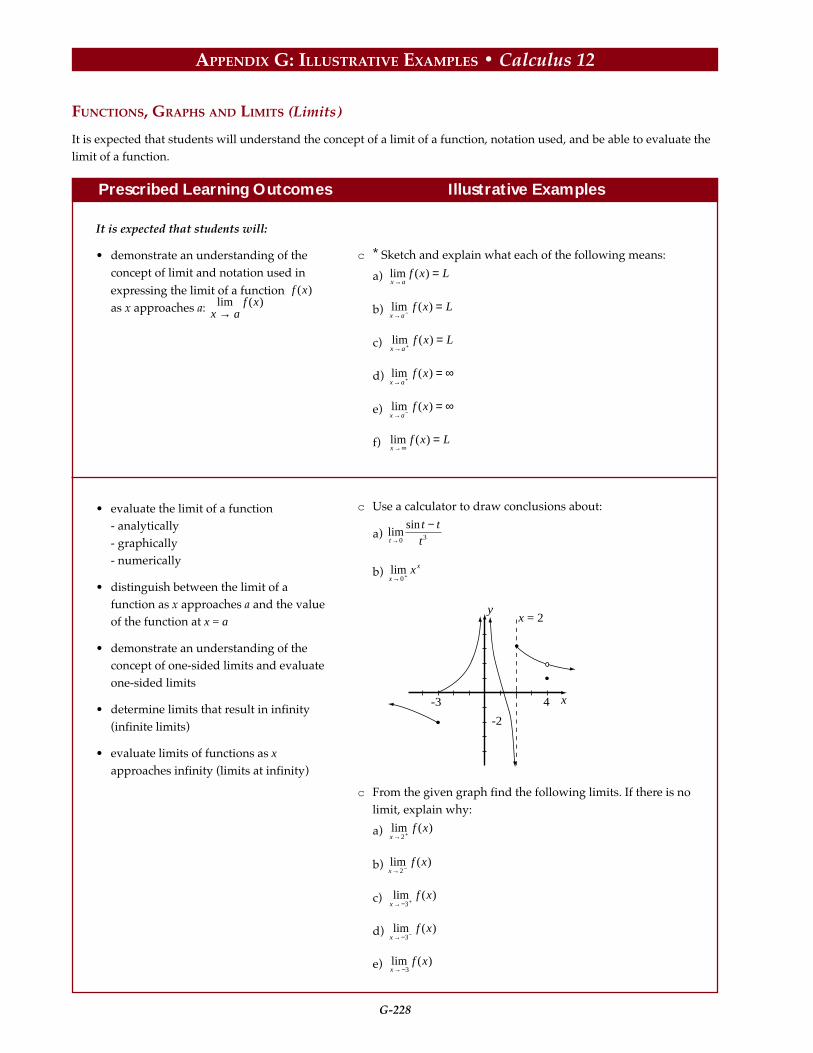
G-228
APPENDIX G: ILLUSTRATIVE EXAMPLES • Calculus 12
Prescribed Learning Outcomes Illustrative Examples
FUNCTIONS, GRAPHS AND LIMITS (Limits)
It is expected that students will understand the concept of a limit of a function, notation used, and be able to evaluate thelimit of a function.
It is expected that students will:
• demonstrate an understanding of theconcept of limit and notation used inexpressing the limit of a function f x( )
as x approaches a: lim ( )x a
f x→
c * Sketch and explain what each of the following means:
a) lim ( )x a
f x L→
=
b) lim ( )x a
f x L→ −
=
c) lim ( )x a
f x L→ +
=
d) lim ( )x a
f x→ +
= ∞
e) lim ( )x a
f x→ −
= ∞
f) lim ( )x
f x L→∞
=
c Use a calculator to draw conclusions about:
a) limsin
t
t t
t→
−0 3
b) limx
xx→ +0
-2
x = 2
x
y
-3 4
c From the given graph find the following limits. If there is nolimit, explain why:
a) lim ( )x
f x→ +2
b) lim ( )x
f x→ −2
c) lim ( )x
f x→− +3
d) lim ( )x
f x→− −3
e) lim ( )x
f x→−3
• evaluate the limit of a function- analytically- graphically- numerically
• distinguish between the limit of afunction as x approaches a and the valueof the function at x = a
• demonstrate an understanding of theconcept of one-sided limits and evaluateone-sided limits
• determine limits that result in infinity(infinite limits)
• evaluate limits of functions as xapproaches infinity (limits at infinity)
G-229
APPENDIX G: ILLUSTRATIVE EXAMPLES • Calculus 12
Prescribed Learning Outcomes Illustrative Examples
FUNCTIONS, GRAPHS AND LIMITS (Limits)
It is expected that students will understand the concept of a limit of a function, notation used, and be able to evaluate thelimit of a function.
f) lim ( )x
f x→4
g) f ( )4
h) lim ( )x
f x→0
c Find the limits:
a) lim( )
h
1 h
h→
+ −0
2 1
b) lim( )t t→ −6 2
176
c) lim( )
h
h
h→
−+ −0
2 142
d) limv
v v
v→
+ −−2
2
4
2 816
e) limx
x
x→ −
−−8
88
f) limx
x
x→
− −0
21 1
g) limsin
x
x
x→0
3
h) limtan
θ
θθ→0
3
i) limsin
sinθ
θθ→0
3
5
j) limx
x
x→∞
+−
3 54
2
2
k) lim sinx
xx→∞
1
l) limx
x x
x→∞
++
2 44 1
m) limx x→ + +0
1
2 101
n) limx x→ − +0
1
2 101

G-230
APPENDIX G: ILLUSTRATIVE EXAMPLES • Calculus 12
Prescribed Learning Outcomes Illustrative Examples
FUNCTIONS, GRAPHS AND LIMITS (Limits)
It is expected that students will understand the concept of a limit of a function, notation used, and be able to evaluate thelimit of a function.
• determine vertical and horizontalasymptotes of a function, using limits
c Find the horizontal and vertical asymptotes of each of thefollowing curves:
a) yx
x=
+ 4
b) yx
x =
−1
2
2
c) yx
x =
+1
2
2
d) y1
x =
−1 2( )
c *Given f x
x x
x x
x x
( )
;
;
( ) ;
=− <− ≤ ≤− >
0
3 0 3
3 32
a) find:
i) lim ( )x
f x→ +0
ii) lim ( )x
f x→ −0
iii) lim ( )x
f x→0
iv) lim ( )x
f x→ −3
v) lim ( )x
f x→ +3
vi) lim ( )x
f x→3
b) Where is the graph discontinuous. Why?c) Sketch the graph.
• determine whether a function iscontinuous at x a =

G-231
APPENDIX G: ILLUSTRATIVE EXAMPLES • Calculus 12
Prescribed Learning Outcomes Illustrative Examples
THE DERIVATIVE (Concept and Interpretations)
It is expected that students will understand the concept of a derivative and evaluate derivatives of a function using thedefinition of derivative.
It is expected that students will:
• describe geometrically a secant line and atangent line for the graph of a function atx =a.
• define and evaluate the derivative at x = a
as: lim( ) ( )
h
f a h f a
h→
+ −0
and lim( ) ( )
x a
f x f a
x a→
−−
• define and calculate the derivative of afunction using:
f xf x h f x
hh' ( ) lim
( ) ( )= + −→0
or
f xf x x f x
xx' ( ) lim
( ) ( )= + −→∆
∆∆0
or
f xy
xx' ( ) lim=
→∆
∆∆0
• use alternate notation interchangeably to
express derivatives (i.e., f xdy
dxy' ( ), , ' , etc.)
• compute derivatives using the definitionof derivative
• distinguish between continuity anddifferentiability of a function at a point
• determine when a function is non-differentiable, and explain why
• determine the slope of a tangent line to acurve at a given point
• determine the equation of the tangent lineto a curve at a given point
c Calculate the derivatives of the given function directly fromthe definition:a) f x x x( ) = +2 3
b) g xx
x( ) =
−1
c) H t t( ) = +1
c Using the definition of derivative, find the equation of thetangent line to the curve: y x x= + −5 4 2 92 at the point ( , ) .
c Determine where f x x( ) = −3 is non differentiable.
c Find an equation of the line tangent to the given curve at the
point indicated. Sketch the curve:
yx
x=+
= −11
12 at
c *Find all the values of a for which the tangent line to y = lnxat x = a is parallel to the tangent line to y = tan-1 x at x = a.

G-232
APPENDIX G: ILLUSTRATIVE EXAMPLES • Calculus 12
Prescribed Learning Outcomes Illustrative Examples
• for a displacement function s s t= ( ) ,calculate the average velocity over agiven time interval and the instantaneousvelocity at a given time
• distinguish between average andinstantaneous rate of change
c The position of a particle is given by s t= 3 . Find the velocitywhen t = 2.
c *The displacement in metres of a particle moving in astraight line is given by s t t= + −5 4 2 where t ismeasured in seconds.a) Find the average velocity from t = 2 to t = 3, t = 2 to t =
2.1, and t = 2 to t = 2.01.b) Find the instantaneous velocity when t = 2.c) Draw the graph of s as a function of t and draw the secant
lines whose slopes are average velocity as in a).d) Draw the tangent line whose slope is the instantaneous
velocity in b).
THE DERIVATIVE (Concept and Interpretations)
It is expected that students will understand the concept of a derivative and evaluate derivatives of a function using thedefinition of derivative.
G-233
APPENDIX G: ILLUSTRATIVE EXAMPLES • Calculus 12
Prescribed Learning Outcomes Illustrative Examples
THE DERIVATIVE (Computing Derivatives)
It is expected that students will determine derivatives of functions using a variety of techniques.
It is expected that students will:
• compute and recall the derivatives ofelementary functions including:
-d
dxx rxr r-1( ) = , r e ℜ
-d
dxe ex x( ) =
-d
dxx
x(ln ) =
1
-d
dxx x(cos ) sin= −
-d
dxx x(sin ) cos=
-d
dxx x(tan ) sec= 2
-d
dxx
x(sin )− =
−1 1
1 2
-d
dxx
x(tan )− =
+1 1
1 2
• use the following derivative formulas tocompute derivatives for thecorresponding types of functions:
- constant times a function: d
dxcu c
du
dx=
-d
dxu v
du
dx
dv
dx( )+ = + (sum rule)
-d
dxuv u
dv
dxv
du
dx( ) = + (product rule)
- d
dx
u
v
vdu
dxu
dv
dxv( ) =−
2 (quotient rule)
-d
dxu nu
du
dxn n( ) = −1 (power rule)
• use the Chain Rule to compute thederivative of a composite function:dy
dx
du
dx
dy
du= or
d
dxF g x g x F g x( ( ( ))) ( ) ( ( ))= ′ ′
c Calculate the derivatives of the following functions:a) y x x x= − − +3 4 5 62 2
b) zS S= −5 3
15
c) f tt
( ) =−4
2 5
d) y x= +( )2 3 6
e) y x x= + +( )2 29 3
f) f x x( ) = sin 2
g) y x x( ) ( )= −cos2 5 4 3
h) y t= + ln ( )3 62
i) y e x= −2
j) y ex= tan ( )
k) F x( ) = log (3x - 8) 5
l) y x= 24
m) y = sin 2x-1( )
n) y x= tan-1( )3
c Let f x x x( ) ln= + +( )4 2 . Find f’(x) and simplify.
c A certain function f(x) has f(1) = 4 and f ’(1) = 5. Letg x
f x( )
( )=
+1
2 1 . Find ′g ( )1 .

G-234
APPENDIX G: ILLUSTRATIVE EXAMPLES • Calculus 12
Prescribed Learning Outcomes Illustrative Examples
THE DERIVATIVE (Computing Derivatives)
It is expected that students will determine derivatives of functions using a variety of techniques.
• compute the derivative of an implicitfunction.
• use the technique of logarithmicdifferentiation.
• compute higher order derivatives
c Find dy
dx in terms of x and y if:
a) xy x y= + +2 1
b) x y xy3 5 2+ =
c Find the equation of the tangent line at the given point:
x y x y2 3 3 2 12 1 2− = − at ( , )
c Find ′′y by implicit differentiation:
x y2 2 1− =
c The equation x x y y y4 2 4 27 6+ + = − defines y implicitly as afunction of x near the point (2,1). Calculate y’ and y” at (2,1).
c Let y x x x e x= + + +( ) ( ) ( )1 2 1 3 12 3 4 5 . Use logarithmic
differentiation to find dy
dx.
c Using logarithmic differentiation, finda) ′ = >y y x xx if ( )0
b)dy
dxy x if = +52 1
c) ′ = ++
f x f xx x
x( ) ( )
( ) if
5 2
2 3
34
c Find ′ ′′ ′′′y y y, , and for the functions:
a) y xx
= −2 1
b) yx
x= −
+11
c Let f xx
( ) =+1
1. Find f x( ) ( )7 , the seventh derivative of f (x).

G-235
APPENDIX G: ILLUSTRATIVE EXAMPLES • Calculus 12
Prescribed Learning Outcomes Illustrative Examples
APPLICATIONS OF DERIVATIVE (Derivatives and the Graph of the Function)
It is expected that students will use the first and second derivatives to describe the characteristic of the graph of a function.
It is expected that students will:
• given the graph of y f x= ( ) :- graph y f x= ' ( ) and y f x= ' ' ( )
- relate the sign of the derivative on aninterval to whether the function isincreasing or decreasing over thatinterval.
- relate the sign of the second derivativeto the concavity of a function
• determine the critical numbers andinflection points of a function.
• determine the maximum and minimumvalues of a function and use the first and/or second derivative test(s) to justify theirsolutions
• use Newton’s iterative formula (withtechnology) to find the solution of givenequations, f x( ) = 0
c For the following functions, find the critical numbers, theinflection points, and the vertical and horizontalasymptotes. Sketch the graph, and verify using a graphingcalculator.
a) f xx
x( ) =
−
3
2 1
b) yx
x=
+3
2 1
2
2
c) f xx x
( ) =−1
2
d) f x x( ) ( )= −22
31
c Find the critical and inflection points for f x xe x( ) = − −2 andsketch the graph of f x x( ) for ≥ 0 .
c Sketch the graph g x x x( ) = + cos . Determine where thefunction is increasing most rapidly and least rapidly.
c Using a calculator, complete at least 5 iterations of Newton’smethod for g x x x x( ) = − + = −sin if 1 10 .
c Explain why the function f, where f xx
x( )
ln=+
21 2 , has exactly
one critical number. Use Newton’s Method to find thatcritical number, correct to two decimal places.
c Use Newton’s Method to find, correct to two decimal places,the x-coordinate of a point at which the curve y = tanx meetsthe curve y = x + 2. Also look at the problem by using the“solve” feature of your calculator and by graphing the curves.

G-236
APPENDIX G: ILLUSTRATIVE EXAMPLES • Calculus 12
Prescribed Learning Outcomes Illustrative Examples
APPLICATIONS OF DERIVATIVE (Derivatives and the Graph of the Function)
It is expected that students will use the first and second derivatives to describe the characteristic of the graph of a function.
• use the tangent line approximation toestimate values of a function near a pointand analyse the approximation using thesecond derivative.
c Determine the tangent line approximation for f(x) = sinx inthe neighbourhood of x = 0. Zoom in on both graphs andcompare the results.
c A certain curve has equation e y xy2 2+ = . Note that the point(1,0) lies on the curve. Use a suitable tangent lineapproximation to give an estimate of the y-coordinate of thepoint on the curve that has x-coordinate equal to 1.2.
c A certain function f(x) has derivative given by′ = −f x x( ) 23 1 . It is also known that f ( )3 4= .
a) Use the tangent line approximation to approximate f(3.2).b) Use the second derivative of f to determine whether the
approximation in part (a) is bigger or smaller than thetrue value of f(3.2).
c The diameter of a ball bearing is found to be 0.48 cm, withpossible error ±0 005. cm . Use the tangent line approximationto approximate:a) the largest possible error in computing the volume of the
ball bearing,b) the maximum percentage error

G-237
APPENDIX G: ILLUSTRATIVE EXAMPLES • Calculus 12
Prescribed Learning Outcomes Illustrative Examples
APPLICATIONS OF DERIVATIVE (Applied Problems)
It is expected that students will solve applied problems from a variety of fields including the physical and biologicalsciences, economics, and business.
It is expected that students will:
• solve problems involving distance,velocity, acceleration
• solve related rate problems (rates ofchange of two or more related variablesthat are changing with respect to time)
c The average velocity of a particle in the time interval from
1 to t is e
e
t
t −1 for t > 1. Find the displacement and velocity at
time t = 2.
c Car P (a police car) was travelling in a northerly directionalong the y-axis at a steady 50 kilometres per hour, while carQ was travelling eastward along the x-axis at varyingspeeds. At the instant when P was 60 metres north of theorigin, Q was 90 metrs east of the origin. A radar unit onP recorded that the straight-line distance between P and Qwas, at that instant, increasing at the rate of 80 kilometresper hour. How fast was car Q going?
c *A swimming pool is 25 metres wide and 25 metres long.When the pool is full, the water at the shallow end is 1metre deep, and the water at the other end is 6 metres deep.The bottom of the pool slopes at a constant angle from theshallow end to the deep end. Water is flowing into the deepend of the pool at 1 cubic meter per minute. How fast is thedepth of water at the deep end increasing when the waterthere is 4 metres deep?
1
4
6
c Boyle’s Law states that if gas is compressed but kept atconstant temperature, then the pressure P and the volume Vof the gas are related by the equation PV=C, where C is aconstant that depends on temperature and the quantity ofgas present. At a certain instant, the volume of gas inside apressure chamber is 2000 cubic centimetres, the pressure is100 kilopascals, and the pressure is increasing at 15kilopascals per minute. How fast is the volume of the gasdecreasing at this instant?

G-238
APPENDIX G: ILLUSTRATIVE EXAMPLES • Calculus 12
Prescribed Learning Outcomes Illustrative Examples
APPLICATIONS OF DERIVATIVE (Applied Problems)
It is expected that students will solve applied problems from a variety of fields including the physical and biologicalsciences, economics, and business.
• solve optimization problems (appliedmaximum/minimum problems)
c A striped ball is thrown vertically upward, having a velocityof 12 m/s. After t seconds its altitude is represented bys t t= −12 4.9 2 . At what instant will it reach a maximumheight and how high will it rise?
c *Construct an open-topped box with a maximum volumefrom a 20 cm x 20 cm piece of cardboard by cutting out fourequal corners. Use more than one method. Compare yourresults.
c Triangle ABC has AB=AC=8, BC=10. Find the dimensions ofthe rectangle of maximum area that can be inscribed in∆ABC with one side on the rectangle on BC.
A
CB
c A pharmaceuticals company can sell its veterinary antibioticfor a price of $450 per unit. Assume that the total cost ofproducing x units in a year is given by C(x) whereC(x) = 800 000 + 50x + 0.004x2. How many units per yearshould the company produce in order to maximize yearlyprofit?
c Find the volume of the cone of maximum volume that canbe inscribed in a sphere of radius 1. Hint: let X be as shownin the diagram.
1X
G-239
APPENDIX G: ILLUSTRATIVE EXAMPLES • Calculus 12
Prescribed Learning Outcomes Illustrative Examples
ANTIDIFFERENTIATION (Recovering Functions from their Derivatives)
It is expected that students will recognize antidifferentiation (indefinite integral) as the reverse of the differentiationprocess.
It is expected that students will:
• explain the meaning of the phrase “F(x) isan antiderivative (or indefinite integral) off(x)”
• use antiderivative notation appropriately(i.e., f x dx( )∫ for the antiderivative off x( ) )
• compute the antiderivatives of linearcombinations of functions whoseindividual antiderivatives are knownincluding:
- k dx kx C = +∫- x dx
x
rCr
r
=+
++
∫1
1 if r ≠ −1
-dx
xx C= +∫ ln
- e dx e Cx x= +∫- sin cosx dx x C = − +∫- cos sinx dx x C = +∫- sec tan2 x dx x C = +∫-
dx
xx C
1 2
1
−= +−∫ sin
-dx
xx C
1 21
+= +−∫ tan
• compute f ax b dx( )+∫ if f u du( ) ∫ is
known
• create integration formulas from theknown differentiation formulas
c Is it true that 22
2 22
xe dx xee
Cx xx
∫ = − + ?
c Is it true that 12
112
2 2 1− = − + +∫ −x dxx
x x C sin ?
c Is it true that x x dxx
x C cos sin = +∫2
2 ?
c Evaluate the following indefinite integrals:
a) ( )1 3 5+∫ x dx
b) e dxx / 2∫
c)5
1 4 2
dx
x( )+∫
c Suppose that d y
dx x
2
2 = sinπ .
a) Find a general formula for dy
dx as a function of x.
b) Find a general formula for y as a function of x.
c Let a be a positive constant other than 1. Find a dxx∫ .
c Use the fact that sec tan2 21x x= + to find tan 2∫ x dx .
c Use the identity cos sin2 1 2 2x x= − to find sin 2∫ x dx .
c Find x x dxcos 3∫ by guessing that one antiderivative isx x sin 3 , differentiating, and then adjusting your guess.

G-240
APPENDIX G: ILLUSTRATIVE EXAMPLES • Calculus 12
Prescribed Learning Outcomes Illustrative Examples
ANTIDIFFERENTIATION (Recovering Functions from their Derivatives)
It is expected that students will recognize antidifferentiation (indefinite integral) as the reverse of the differentiationprocess.
• solve initial value problems using theconcept that if F x G x' ( ) ' ( )= on aninterval, then F x( ) and G x( ) differ by aconstant on that interval
c Suppose that f ’’(t) = 3t2 for all t and f(1) = 2, f’(1) = 5. Find aformula for f(t).
c It is known that f ’(x) = ex/2 and f(6 ln 2) = 10. Find a generalformula for f(x).
c a) Verify that the function f given byf(x) = 3e-x sin 3x - e-x cos 3x is an antiderivative of10e-x cos 3x.
b) Use the result of part a) to find an antiderivative G(x) of10e-x cos 3x such that G(0) = 5.
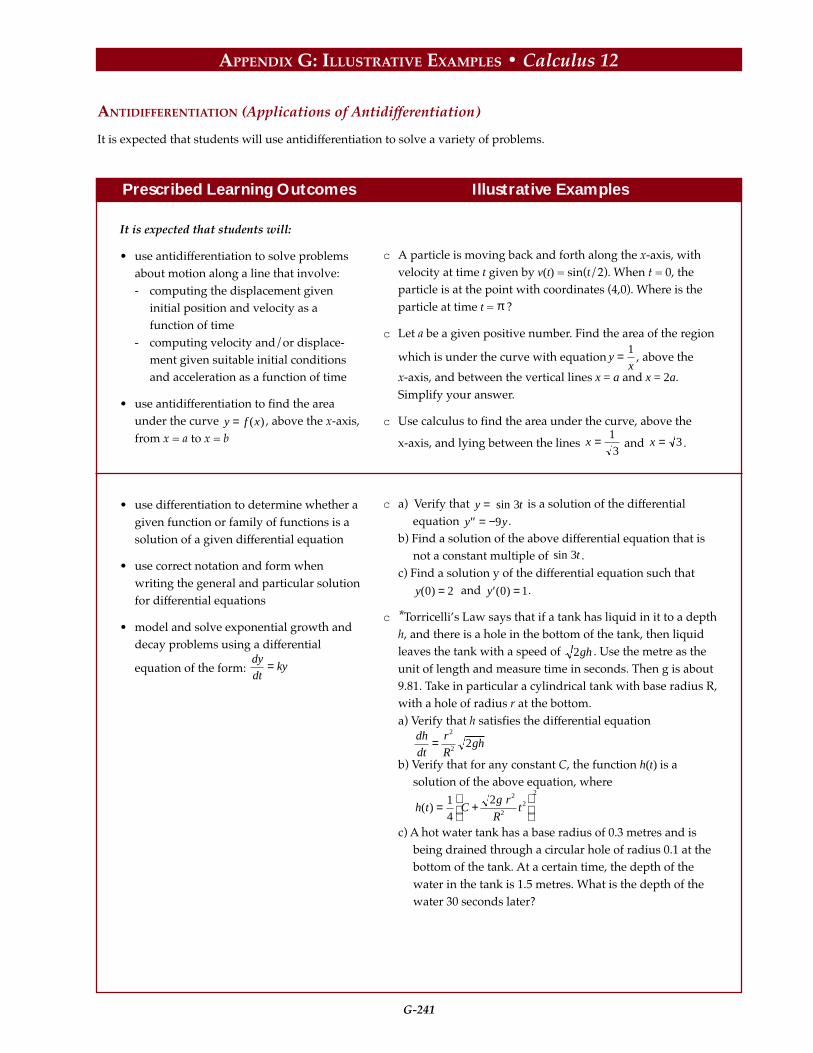
G-241
APPENDIX G: ILLUSTRATIVE EXAMPLES • Calculus 12
Prescribed Learning Outcomes Illustrative Examples
ANTIDIFFERENTIATION (Applications of Antidifferentiation)
It is expected that students will use antidifferentiation to solve a variety of problems.
It is expected that students will:
• use antidifferentiation to solve problemsabout motion along a line that involve:- computing the displacement given
initial position and velocity as afunction of time
- computing velocity and/or displace-ment given suitable initial conditionsand acceleration as a function of time
• use antidifferentiation to find the areaunder the curve y f x= ( ) , above the x-axis,from x = a to x = b
• use differentiation to determine whether agiven function or family of functions is asolution of a given differential equation
• use correct notation and form whenwriting the general and particular solutionfor differential equations
• model and solve exponential growth anddecay problems using a differential
equation of the form: dy
dtky=
c A particle is moving back and forth along the x-axis, withvelocity at time t given by v(t) = sin(t/2). When t = 0, theparticle is at the point with coordinates (4,0). Where is theparticle at time t = π ?
c Let a be a given positive number. Find the area of the region
which is under the curve with equation yx
= 1, above the
x-axis, and between the vertical lines x = a and x = 2a.Simplify your answer.
c Use calculus to find the area under the curve, above the
x-axis, and lying between the lines x = 13
and x = 3 .
c a) Verify that y t= sin 3 is a solution of the differentialequation ′′ = −y y9 .
b) Find a solution of the above differential equation that isnot a constant multiple of sin 3t .
c) Find a solution y of the differential equation such thaty( )0 2= and ′ =y ( )0 1.
c *Torricelli’s Law says that if a tank has liquid in it to a depthh, and there is a hole in the bottom of the tank, then liquidleaves the tank with a speed of 2gh . Use the metre as theunit of length and measure time in seconds. Then g is about9.81. Take in particular a cylindrical tank with base radius R,with a hole of radius r at the bottom.a) Verify that h satisfies the differential equation
dh
dt
r
Rgh=
2
2 2
b) Verify that for any constant C, the function h(t) is asolution of the above equation, where
h t Cg r
Rt( ) = +
14
2 2
22
2
c) A hot water tank has a base radius of 0.3 metres and isbeing drained through a circular hole of radius 0.1 at thebottom of the tank. At a certain time, the depth of thewater in the tank is 1.5 metres. What is the depth of thewater 30 seconds later?

G-242
APPENDIX G: ILLUSTRATIVE EXAMPLES • Calculus 12
Prescribed Learning Outcomes Illustrative Examples
ANTIDIFFERENTIATION (Applications of Antidifferentiation)
It is expected that students will use antidifferentiation to solve a variety of problems.
c *Shortly after a person was exposed to iodine-131, the levelof radioactivity in the person’s thyroid was 20 times the“safe” level. Three hours later, the level had decreased to15.5 time the safe level. How much longer must the personwait until the level of radioactivity in the thyroid reaches“safe” territory?
c *A simple model for the growth of a fish of a particularspecies goes as follows: Let M be the maximum length thatcan be reached by a member of that species. At the instantwhen the length of an individual of that species is y, thelength of the individual is growing at a rate proportional toM y− , that is, y satisfies the differential equationdy
dtk M y= −( ) for some constant k.
a) Let w = M y− . Verify that w satisfies the differential
equation dw
dtkw= − .
b) Write down the general solution of the differentialequation of part a). Then write down a general formulafor y as a function of time.
c) Suppose that for a certain species, the maximum achiev-able length M is 60 cm, and that when t is measured inyears, k = 0.05. A fish of that species has current length of10 cm. How long will it take to reach a length of 20c m?
c *Coffee in a well-insulated cup started out at 95°, and wasbrought into an office that was held at a constant 20°. After10 minutes, the temperature of the coffee was 90°. Assumethat Newton’s Law of Cooling applies. How muchadditional time must elapse until the coffee reaches 80°?
• model and solve problems involvingNewton’s Law of Cooling using adifferential equation of the form:dy
dtay b= +

APPENDIX HAdditional Support for Instruction

H-2
APPENDIX H: ADDITIONAL SUPPORT FOR INSTRUCTION

H-3
APPENDIX H: ADDITIONAL SUPPORT FOR INSTRUCTION
This appendix contains detailedinformation about specific teachingstrategies referred to in this Integrated
Resource Package. This information isprovided in cases where explanations ofstrategies and activities are too extensive tofit in the Suggested Instructional Strategiescolumn or where the same activity is referredto several times in the IRP.
Derivation of Quadratic Formula
ax2 + bx + c = 0 or ax2 + bx + c = 0
4a2x2 + 4abx + 4ac = 0
(2ax + b)2 - b2 + 4ac = 0
(2ax + b)2 = b2 - 4ac
ax2 + bx = - c
x2 + –x = –ba
-c a
x2 + –x + — = — - –ba
b2
4a2b2
4a2ca
x2 + –x + — = — - –ba
b2
4a2b2
4a2ca
x + — = —–—b2a
b2 - 4ac
4a2)( 2
b2 - 4ac
4a2x + — = ± —–—b2a
x = ——–—–—-b ± b2 - 4ac2a
2ax + b = ± b2 - 4ac
2ax = - b ± b2 - 4ac
b2 - 4ac
4a2x = — ± —–—-b2a
2ax = —————— - b ± b2 - 4ac

H-4
APPENDIX H: ADDITIONAL SUPPORT FOR INSTRUCTION
Take out GCF First
Polynomial with4 or More Terms
Trinomial
Left withLeft with Left with
Binomial
FACTORING POLYNOMIALS
Differenceof Squares
x2-y2=(x-y)(x+y)
a2-16=(a-4)(a+4)
9k2-25m2=(3k-5m)(3k+5m)
PerfectSquare
Trinomial
a2x2+2abx+b2=(ax+b)2
x2+6x+9=(x+3)2
4x2-20x+25=(2x-5)2
Grouping2 and 2
ax+ay+bx+by=a(x-y)+b(x+y)
=(x+y)(a+b)
5x+5y-kx-ky
=5(x+y)-k(x+y)
=(x+y)(5-y)
x2+xy+3x+3y
=x(x+y)-3(x+y)
=(x+y)(x+3)
Difference of Squares
3 and 1
a2x2+2abx+b2-y2=(ax+b)2-y2
=(ax+b-y)(ax+b+ y)
x2+4x+4-y2=(x+2)2-y2
=(x+2-y)(x+2+y)
Coefficientof 1
x2+(a+b)x+ab=(x+a)(x+b)
x2 + 5x + 6 =
sum product
(x+3)(x+2)
x2 + 2x - 8 = (x+4)(x-2)
x2 - x - 12 = (x-4)(x+3)
x2 - 8x + 15 = (x-5)(x-3)
Coefficientof Other Two
acx2+(ad+bc)x+bd=(ax+b)(cx+d)
4x2 + 8x + 3
12
6 2
4x2 + 6x + 2x + 3
2x(2x+3)+1(2x+3)
(2x+3)+1(2x+1)
6x2 + 13x - 5
-30
2 -15
6x2 + 2x - 15x - 5
2x(3x+1)-5(3x+1)
(3x+1)+1(2x-5)

H-5
APPENDIX H: ADDITIONAL SUPPORT FOR INSTRUCTION
COSINE/SINE LAW MATRIX
The following chart may be useful in thepresentation and development of the cosinelaw, sine law and the solution of obliquetriangles.
In oblique triangles there are six cases
Note: • verify larges sides are oppositelarges angles
•• to avoid the ambiguous case withsine law, always solve for thesmallest angles first
SSS
1. Cosine law to find /1
2. ••sine law or cosine lawto find /2
3. 180˚ - (/1+/2)=/3
SAS ASA
1. Cosine law to find 3rd side
2. ••use either law to find /2
3. 180˚ - (/1+/2)=/3
1. 180˚ - (/1+/2)=/3
2. sine law to find the other2 sidesA
AAS
1. 180˚ - (/1+/2)=/3
2. sine law to find theother 2 sidesAA
AAS (SSA) AAA
Given: /A, a, b no uniquesolution
Case 1: a<h ∴ no triangle
Case 2: a=h ∴ 1 right triangle(/B=90˚)
Case 3: h<a<b ∴ 2 triangles(1. /B<90˚)(2. /B>90˚)
Case 4: b≤a ∴ 1 triangle
AB
bh
a
