mathematics curriculum map - chandler unified school ... · mathematics curriculum map algebra ii...
TRANSCRIPT
Arizona’sCommonCoreStandards
Mathematics Curriculum Map
AlgebraII
ARIZONA DEPARTMENT OF EDUCATION
HIGH ACADEMIC STANDARDS
State Board Approved June 2010
Arizona Department of Education
Chandler Unified School District #80
State Board Approved June 2010 Page 2 of 86
Revised: March 2015
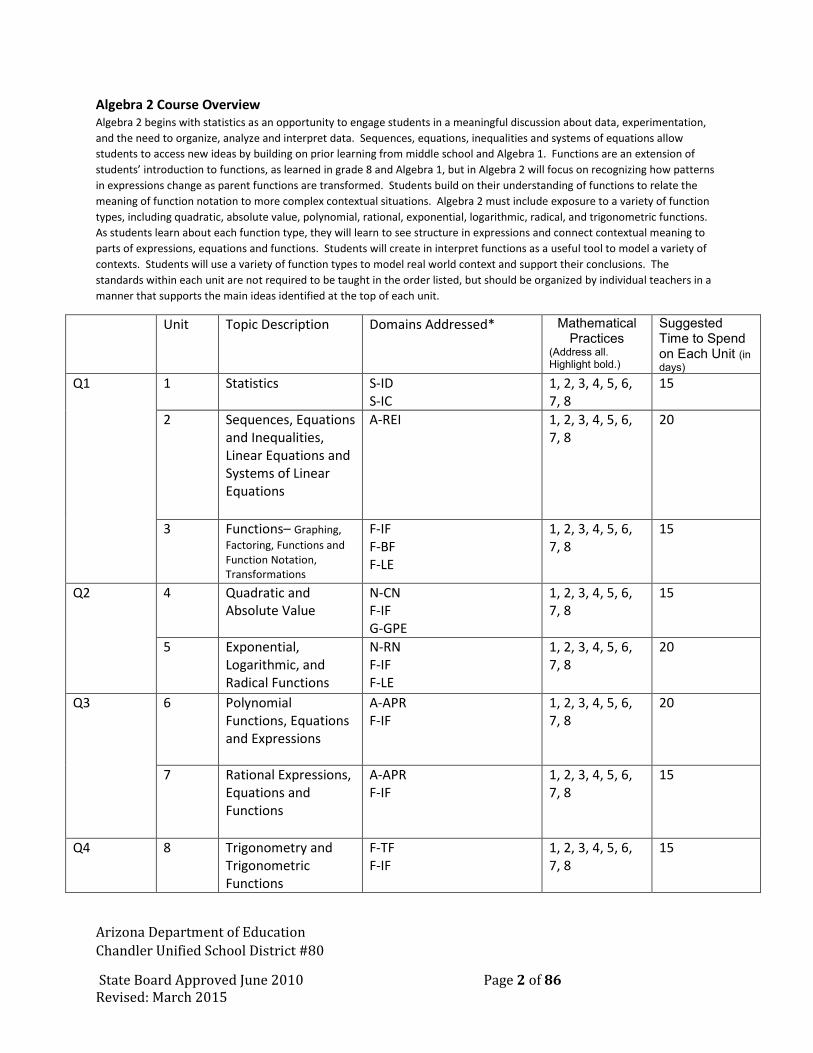
Algebra 2 Course Overview
Algebra 2 begins with statistics as an opportunity to engage students in a meaningful discussion about data, experimentation,
and the need to organize, analyze and interpret data. Sequences, equations, inequalities and systems of equations allow
students to access new ideas by building on prior learning from middle school and Algebra 1. Functions are an extension of
students’ introduction to functions, as learned in grade 8 and Algebra 1, but in Algebra 2 will focus on recognizing how patterns
in expressions change as parent functions are transformed. Students build on their understanding of functions to relate the
meaning of function notation to more complex contextual situations. Algebra 2 must include exposure to a variety of function
types, including quadratic, absolute value, polynomial, rational, exponential, logarithmic, radical, and trigonometric functions.
As students learn about each function type, they will learn to see structure in expressions and connect contextual meaning to
parts of expressions, equations and functions. Students will create in interpret functions as a useful tool to model a variety of
contexts. Students will use a variety of function types to model real world context and support their conclusions. The
standards within each unit are not required to be taught in the order listed, but should be organized by individual teachers in a
manner that supports the main ideas identified at the top of each unit.
Unit Topic Description Domains Addressed* Mathematical Practices
(Address all. Highlight bold.)
Suggested Time to Spend on Each Unit (in days)
Q1 1 Statistics S-ID
S-IC
1, 2, 3, 4, 5, 6,
7, 8
15
2 Sequences, Equations
and Inequalities,
Linear Equations and
Systems of Linear
Equations
A-REI 1, 2, 3, 4, 5, 6,
7, 8
20
3 Functions– Graphing,
Factoring, Functions and
Function Notation,
Transformations
F-IF
F-BF
F-LE
1, 2, 3, 4, 5, 6,
7, 8
15
Q2 4 Quadratic and
Absolute Value
N-CN
F-IF
G-GPE
1, 2, 3, 4, 5, 6,
7, 8
15
5 Exponential,
Logarithmic, and
Radical Functions
N-RN
F-IF
F-LE
1, 2, 3, 4, 5, 6,
7, 8
20
Q3 6 Polynomial
Functions, Equations
and Expressions
A-APR
F-IF
1, 2, 3, 4, 5, 6,
7, 8
20
7 Rational Expressions,
Equations and
Functions
A-APR
F-IF
1, 2, 3, 4, 5, 6,
7, 8
15
Q4 8 Trigonometry and
Trigonometric
Functions
F-TF
F-IF
1, 2, 3, 4, 5, 6,
7, 8
15

Arizona Department of Education
Chandler Unified School District #80
State Board Approved June 2010 Page 3 of 86
Revised: March 2015
Note: Included at the end of each unit (in orange) are “global” standards that will be implemented to support the important
ideas in each unit. These are not “optional” or “additional” standards. These standards must be taught in conjunction with the
other content standards in each unit and will support teaching and learning of the essential ideas defined at the top of every
unit.
Arizona Department of Education Chandler Unified School District #80
State Board Approved June 2010 Page 4 of 86 Revised: March 2015
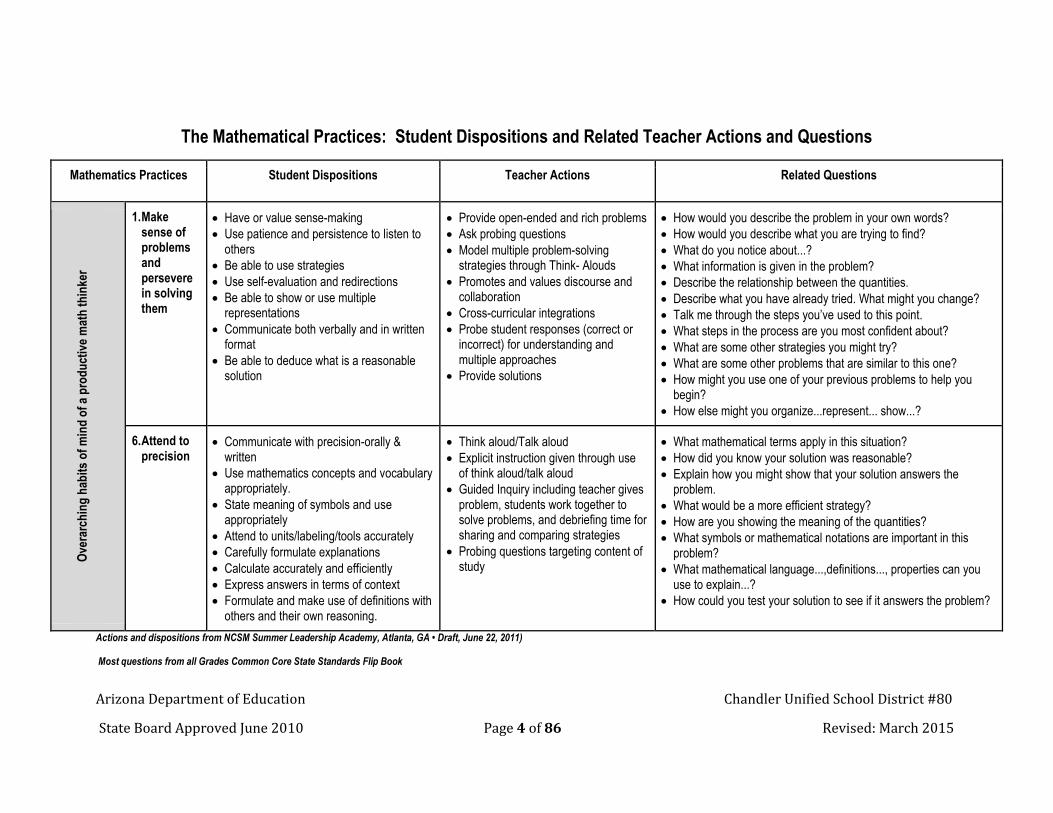
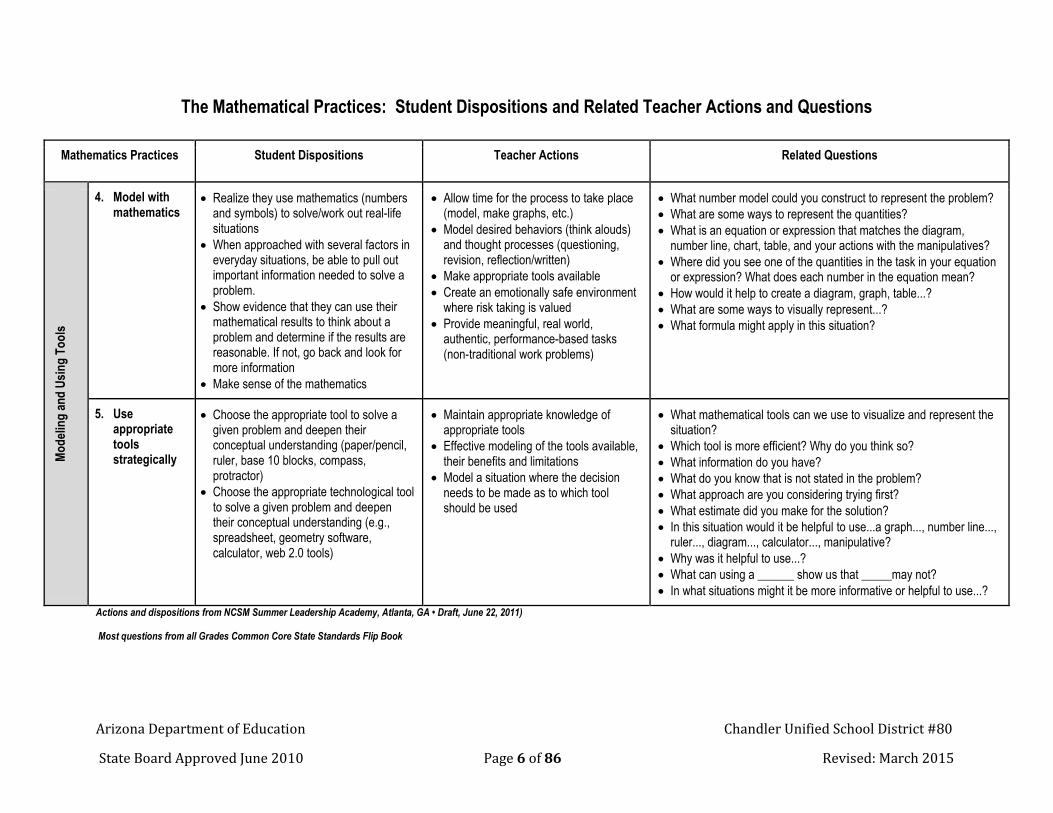
The Mathematical Practices: Student Dispositions and Related Teacher Actions and Questions
Mathematics Practices Student Dispositions Teacher Actions Related Questions
Ove
rarching hab
its of mind of a productive math thinke
r
1. Make sense of problems and persevere in solving them
• Have or value sense-making • Use patience and persistence to listen to others
• Be able to use strategies • Use self-evaluation and redirections • Be able to show or use multiple representations
• Communicate both verbally and in written format
• Be able to deduce what is a reasonable solution
• Provide open-ended and rich problems • Ask probing questions • Model multiple problem-solving strategies through Think- Alouds
• Promotes and values discourse and collaboration
• Cross-curricular integrations • Probe student responses (correct or incorrect) for understanding and multiple approaches
• Provide solutions
• How would you describe the problem in your own words? • How would you describe what you are trying to find? • What do you notice about...? • What information is given in the problem? • Describe the relationship between the quantities. • Describe what you have already tried. What might you change? • Talk me through the steps you’ve used to this point. • What steps in the process are you most confident about? • What are some other strategies you might try? • What are some other problems that are similar to this one? • How might you use one of your previous problems to help you begin?
• How else might you organize...represent... show...?
6. Attend to precision
• Communicate with precision-orally & written
• Use mathematics concepts and vocabulary appropriately.
• State meaning of symbols and use appropriately
• Attend to units/labeling/tools accurately • Carefully formulate explanations • Calculate accurately and efficiently • Express answers in terms of context • Formulate and make use of definitions with others and their own reasoning.
• Think aloud/Talk aloud • Explicit instruction given through use of think aloud/talk aloud
• Guided Inquiry including teacher gives problem, students work together to solve problems, and debriefing time for sharing and comparing strategies
• Probing questions targeting content of study
• What mathematical terms apply in this situation? • How did you know your solution was reasonable? • Explain how you might show that your solution answers the problem.
• What would be a more efficient strategy? • How are you showing the meaning of the quantities? • What symbols or mathematical notations are important in this problem?
• What mathematical language...,definitions..., properties can you use to explain...?
• How could you test your solution to see if it answers the problem?
Actions and dispositions from NCSM Summer Leadership Academy, Atlanta, GA • Draft, June 22, 2011)
Most questions from all Grades Common Core State Standards Flip Book
Arizona Department of Education Chandler Unified School District #80
State Board Approved June 2010 Page 5 of 86 Revised: March 2015
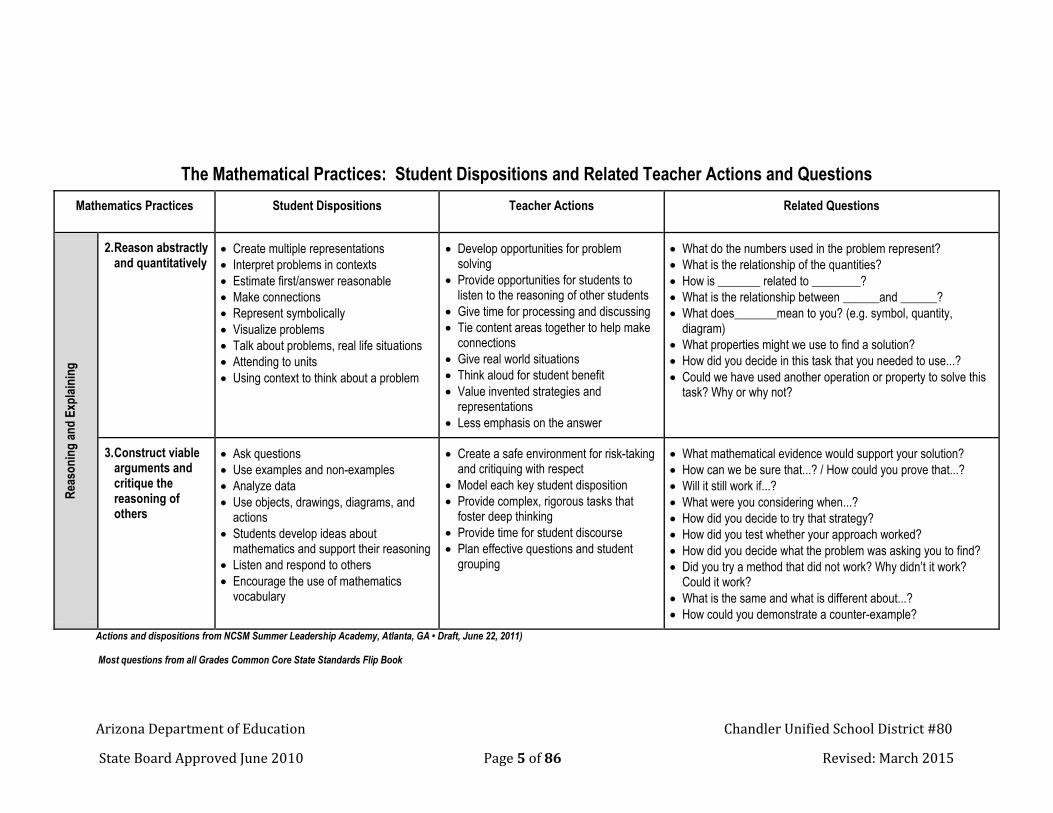
The Mathematical Practices: Student Dispositions and Related Teacher Actions and Questions
Actions and dispositions from NCSM Summer Leadership Academy, Atlanta, GA • Draft, June 22, 2011)
Most questions from all Grades Common Core State Standards Flip Book
Mathematics Practices Student Dispositions Teacher Actions Related Questions
Rea
soning and Exp
laining
2. Reason abstractly and quantitatively
• Create multiple representations • Interpret problems in contexts • Estimate first/answer reasonable • Make connections • Represent symbolically • Visualize problems • Talk about problems, real life situations • Attending to units • Using context to think about a problem
• Develop opportunities for problem solving
• Provide opportunities for students to listen to the reasoning of other students
• Give time for processing and discussing • Tie content areas together to help make connections
• Give real world situations • Think aloud for student benefit • Value invented strategies and representations
• Less emphasis on the answer
• What do the numbers used in the problem represent? • What is the relationship of the quantities? • How is _______ related to ________? • What is the relationship between ______and ______? • What does_______mean to you? (e.g. symbol, quantity, diagram)
• What properties might we use to find a solution? • How did you decide in this task that you needed to use...? • Could we have used another operation or property to solve this task? Why or why not?
3. Construct viable arguments and critique the reasoning of others
• Ask questions • Use examples and non-examples • Analyze data • Use objects, drawings, diagrams, and actions
• Students develop ideas about mathematics and support their reasoning
• Listen and respond to others • Encourage the use of mathematics vocabulary
• Create a safe environment for risk-taking and critiquing with respect
• Model each key student disposition • Provide complex, rigorous tasks that foster deep thinking
• Provide time for student discourse • Plan effective questions and student grouping
• What mathematical evidence would support your solution? • How can we be sure that...? / How could you prove that...? • Will it still work if...? • What were you considering when...? • How did you decide to try that strategy? • How did you test whether your approach worked? • How did you decide what the problem was asking you to find? • Did you try a method that did not work? Why didn’t it work? Could it work?
• What is the same and what is different about...? • How could you demonstrate a counter-example?
Arizona Department of Education Chandler Unified School District #80
State Board Approved June 2010 Page 6 of 86 Revised: March 2015
The Mathematical Practices: Student Dispositions and Related Teacher Actions and Questions
Actions and dispositions from NCSM Summer Leadership Academy, Atlanta, GA • Draft, June 22, 2011)
Most questions from all Grades Common Core State Standards Flip Book
Mathematics Practices Student Dispositions Teacher Actions Related Questions
Modeling and Using Tools
4. Model with mathematics
• Realize they use mathematics (numbers and symbols) to solve/work out real-life situations
• When approached with several factors in everyday situations, be able to pull out important information needed to solve a problem.
• Show evidence that they can use their mathematical results to think about a problem and determine if the results are reasonable. If not, go back and look for more information
• Make sense of the mathematics
• Allow time for the process to take place (model, make graphs, etc.)
• Model desired behaviors (think alouds) and thought processes (questioning, revision, reflection/written)
• Make appropriate tools available • Create an emotionally safe environment where risk taking is valued
• Provide meaningful, real world, authentic, performance-based tasks (non-traditional work problems)
• What number model could you construct to represent the problem? • What are some ways to represent the quantities? • What is an equation or expression that matches the diagram, number line, chart, table, and your actions with the manipulatives?
• Where did you see one of the quantities in the task in your equation or expression? What does each number in the equation mean?
• How would it help to create a diagram, graph, table...? • What are some ways to visually represent...? • What formula might apply in this situation?
5. Use appropriate tools strategically
• Choose the appropriate tool to solve a given problem and deepen their conceptual understanding (paper/pencil, ruler, base 10 blocks, compass, protractor)
• Choose the appropriate technological tool to solve a given problem and deepen their conceptual understanding (e.g., spreadsheet, geometry software, calculator, web 2.0 tools)
• Maintain appropriate knowledge of appropriate tools
• Effective modeling of the tools available, their benefits and limitations
• Model a situation where the decision needs to be made as to which tool should be used
• What mathematical tools can we use to visualize and represent the situation?
• Which tool is more efficient? Why do you think so? • What information do you have? • What do you know that is not stated in the problem? • What approach are you considering trying first? • What estimate did you make for the solution? • In this situation would it be helpful to use...a graph..., number line..., ruler..., diagram..., calculator..., manipulative?
• Why was it helpful to use...? • What can using a ______ show us that _____may not? • In what situations might it be more informative or helpful to use...?
Arizona Department of Education Chandler Unified School District #80
State Board Approved June 2010 Page 7 of 86 Revised: March 2015
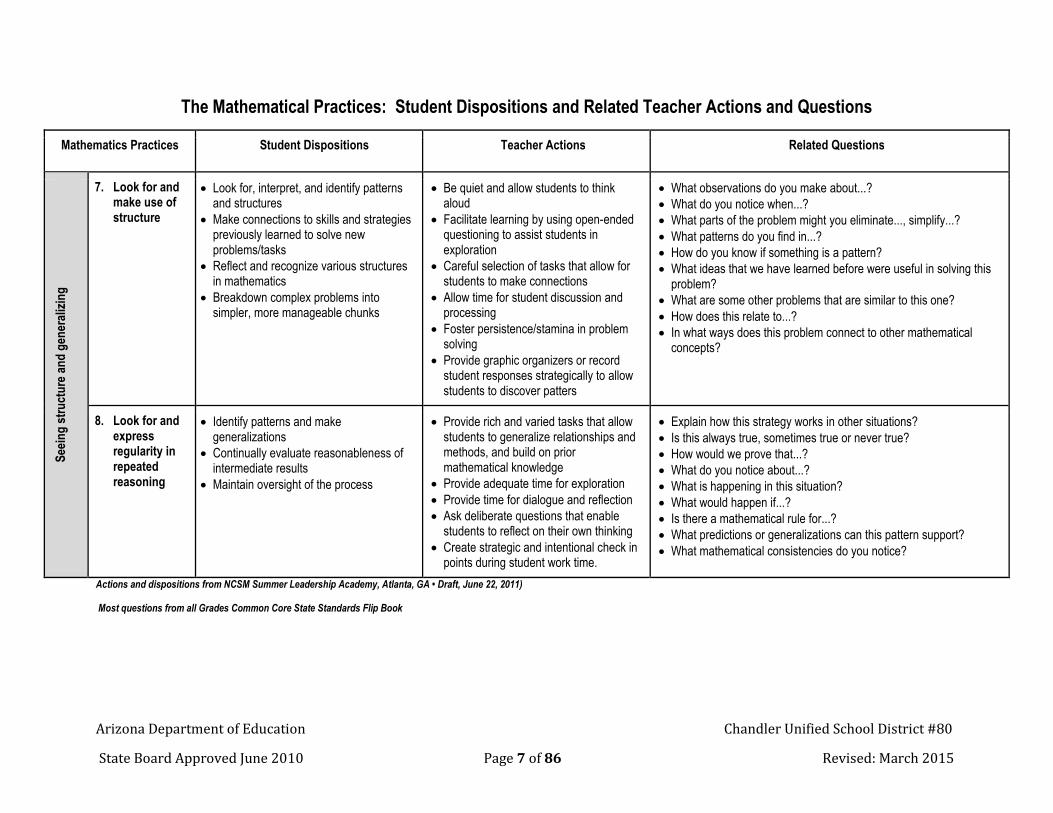
The Mathematical Practices: Student Dispositions and Related Teacher Actions and Questions
Mathematics Practices Student Dispositions Teacher Actions Related Questions
See
ing structure and gen
eralizing
7. Look for and make use of structure
• Look for, interpret, and identify patterns and structures
• Make connections to skills and strategies previously learned to solve new problems/tasks
• Reflect and recognize various structures in mathematics
• Breakdown complex problems into simpler, more manageable chunks
• Be quiet and allow students to think aloud
• Facilitate learning by using open-ended questioning to assist students in exploration
• Careful selection of tasks that allow for students to make connections
• Allow time for student discussion and processing
• Foster persistence/stamina in problem solving
• Provide graphic organizers or record student responses strategically to allow students to discover patters
• What observations do you make about...? • What do you notice when...? • What parts of the problem might you eliminate..., simplify...? • What patterns do you find in...? • How do you know if something is a pattern? • What ideas that we have learned before were useful in solving this problem?
• What are some other problems that are similar to this one? • How does this relate to...? • In what ways does this problem connect to other mathematical concepts?
8. Look for and express regularity in repeated reasoning
• Identify patterns and make generalizations
• Continually evaluate reasonableness of intermediate results
• Maintain oversight of the process
• Provide rich and varied tasks that allow students to generalize relationships and methods, and build on prior mathematical knowledge
• Provide adequate time for exploration • Provide time for dialogue and reflection • Ask deliberate questions that enable students to reflect on their own thinking
• Create strategic and intentional check in points during student work time.
• Explain how this strategy works in other situations? • Is this always true, sometimes true or never true? • How would we prove that...? • What do you notice about...? • What is happening in this situation? • What would happen if...? • Is there a mathematical rule for...? • What predictions or generalizations can this pattern support? • What mathematical consistencies do you notice?
Actions and dispositions from NCSM Summer Leadership Academy, Atlanta, GA • Draft, June 22, 2011)
Most questions from all Grades Common Core State Standards Flip Book
Arizona Department of Education Chandler Unified School District #80
State Board Approved June 2010 Page 8 of 86 Revised: March 2015
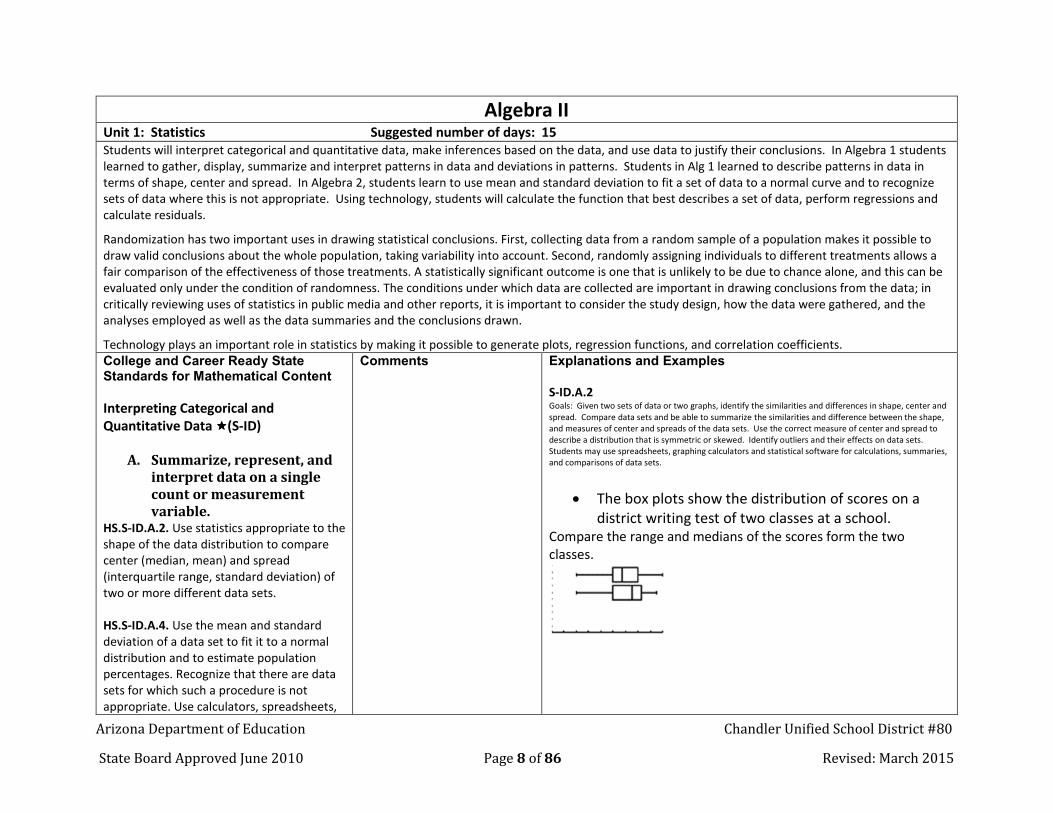
Algebra II
Unit 1: Statistics Suggested number of days: 15
Students will interpret categorical and quantitative data, make inferences based on the data, and use data to justify their conclusions. In Algebra 1 students
learned to gather, display, summarize and interpret patterns in data and deviations in patterns. Students in Alg 1 learned to describe patterns in data in
terms of shape, center and spread. In Algebra 2, students learn to use mean and standard deviation to fit a set of data to a normal curve and to recognize
sets of data where this is not appropriate. Using technology, students will calculate the function that best describes a set of data, perform regressions and
calculate residuals.
Randomization has two important uses in drawing statistical conclusions. First, collecting data from a random sample of a population makes it possible to
draw valid conclusions about the whole population, taking variability into account. Second, randomly assigning individuals to different treatments allows a
fair comparison of the effectiveness of those treatments. A statistically significant outcome is one that is unlikely to be due to chance alone, and this can be
evaluated only under the condition of randomness. The conditions under which data are collected are important in drawing conclusions from the data; in
critically reviewing uses of statistics in public media and other reports, it is important to consider the study design, how the data were gathered, and the
analyses employed as well as the data summaries and the conclusions drawn.
Technology plays an important role in statistics by making it possible to generate plots, regression functions, and correlation coefficients. College and Career Ready State Standards for Mathematical Content
Interpreting Categorical and
Quantitative Data ����(S-ID)
A. Summarize,represent,and
interpretdataonasingle
countormeasurement
variable. HS.S-ID.A.2. Use statistics appropriate to the
shape of the data distribution to compare
center (median, mean) and spread
(interquartile range, standard deviation) of
two or more different data sets.
HS.S-ID.A.4. Use the mean and standard
deviation of a data set to fit it to a normal
distribution and to estimate population
percentages. Recognize that there are data
sets for which such a procedure is not
appropriate. Use calculators, spreadsheets,
Comments
Explanations and Examples
S-ID.A.2 Goals: Given two sets of data or two graphs, identify the similarities and differences in shape, center and
spread. Compare data sets and be able to summarize the similarities and difference between the shape,
and measures of center and spreads of the data sets. Use the correct measure of center and spread to
describe a distribution that is symmetric or skewed. Identify outliers and their effects on data sets.
Students may use spreadsheets, graphing calculators and statistical software for calculations, summaries,
and comparisons of data sets.
• The box plots show the distribution of scores on a
district writing test of two classes at a school. Compare the range and medians of the scores form the two
classes.
Arizona Department of Education Chandler Unified School District #80
State Board Approved June 2010 Page 9 of 86 Revised: March 2015
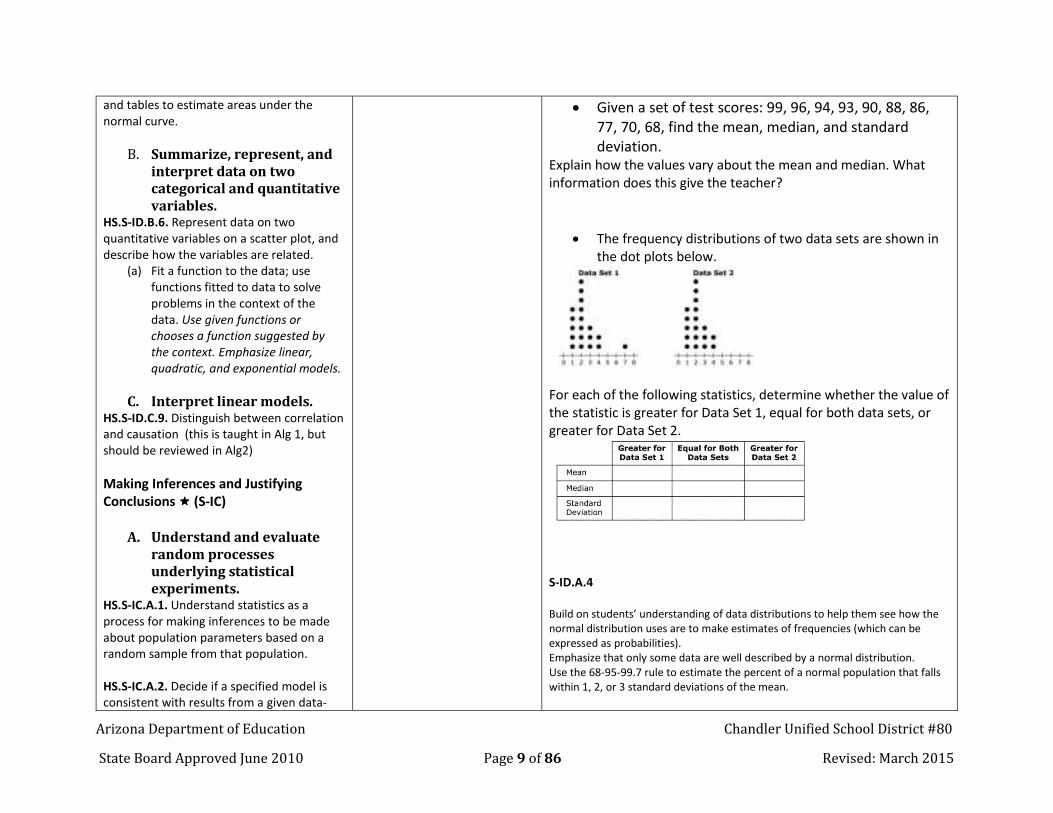
and tables to estimate areas under the
normal curve.
B. Summarize,represent,and
interpretdataontwo
categoricalandquantitative
variables. HS.S-ID.B.6. Represent data on two
quantitative variables on a scatter plot, and
describe how the variables are related.
(a) Fit a function to the data; use
functions fitted to data to solve
problems in the context of the
data. Use given functions or
chooses a function suggested by
the context. Emphasize linear,
quadratic, and exponential models.
C. Interpretlinearmodels. HS.S-ID.C.9. Distinguish between correlation
and causation (this is taught in Alg 1, but
should be reviewed in Alg2)
Making Inferences and Justifying
Conclusions ���� (S-IC)
A. Understandandevaluate
randomprocesses
underlyingstatistical
experiments. HS.S-IC.A.1. Understand statistics as a
process for making inferences to be made
about population parameters based on a
random sample from that population.
HS.S-IC.A.2. Decide if a specified model is
consistent with results from a given data-
• Given a set of test scores: 99, 96, 94, 93, 90, 88, 86,
77, 70, 68, find the mean, median, and standard
deviation. Explain how the values vary about the mean and median. What
information does this give the teacher?
• The frequency distributions of two data sets are shown in
the dot plots below.
For each of the following statistics, determine whether the value of
the statistic is greater for Data Set 1, equal for both data sets, or
greater for Data Set 2.
S-ID.A.4
Build on students’ understanding of data distributions to help them see how the
normal distribution uses are to make estimates of frequencies (which can be
expressed as probabilities).
Emphasize that only some data are well described by a normal distribution.
Use the 68-95-99.7 rule to estimate the percent of a normal population that falls
within 1, 2, or 3 standard deviations of the mean.
Arizona Department of Education Chandler Unified School District #80
State Board Approved June 2010 Page 10 of 86 Revised: March
2015
generating process, e.g., using simulation.
For example, a model says a spinning coin
will fall heads up with probability 0.5. Would
a result of 5 tails in a row cause you to
question the model?
B. Makeinferencesandjustify
conclusionsfromsample
surveys,experiments,and
observationalstudies. HS.S-IC.B.3. Recognize the purposes of and
differences among sample surveys,
experiments, and observational studies;
explain how randomization relates to each.
HS.S-IC.B.4. Use data from a sample survey
to estimate a population mean or
proportion; develop a margin of error
through the use of simulation models for
random sampling.
HS.S-IC.B.5. Use data from a randomized
experiment to compare two treatments; use
simulations to decide if differences between
parameters are significant.
HS.S-IC.B.6. Evaluate reports based on data.
Number and Quantity: Quantities ���� (N-
Q)
A. Reasonqualitativelyanduse
unitstosolveproblems.
HS.N-Q.A.2. Define appropriate quantities
for the purpose of descriptive modeling.
Recognize that normal distributions are only appropriate for unimodal and
symmetric shapes.
Students may use spreadsheets, graphing calculators and statistical software, and
tables to analyze the fit between a data set and normal distributions and estimate
areas under the curve.
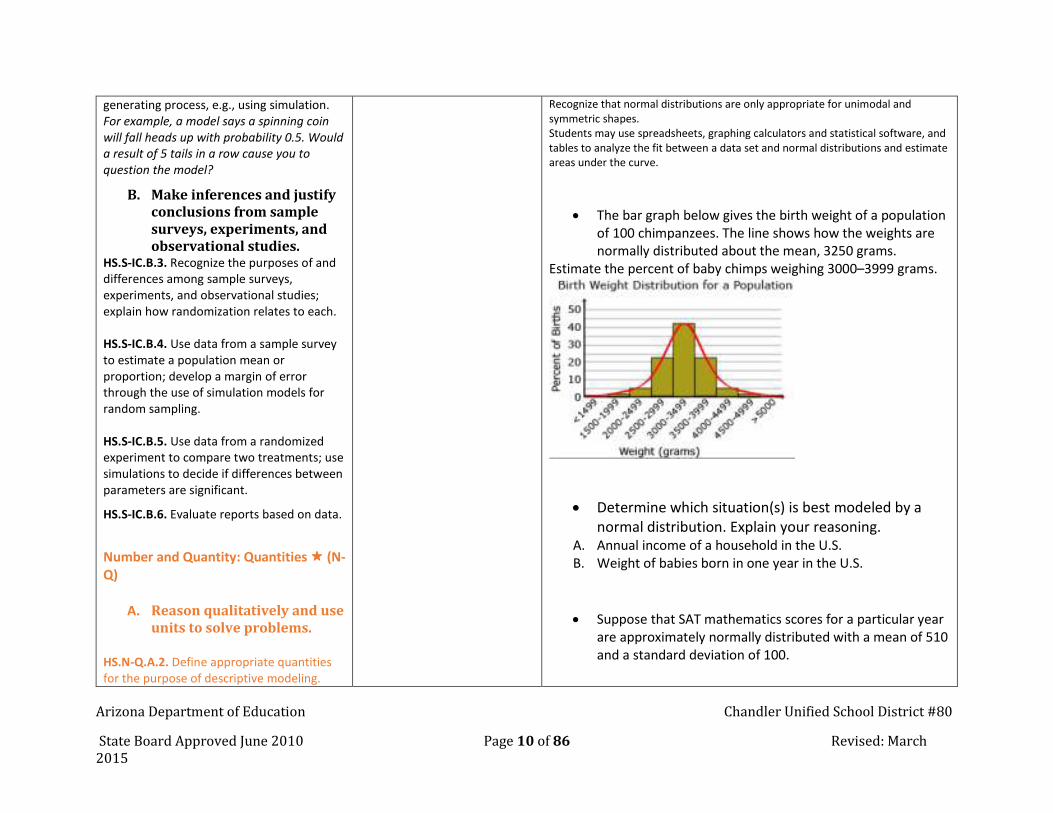
• The bar graph below gives the birth weight of a population
of 100 chimpanzees. The line shows how the weights are
normally distributed about the mean, 3250 grams.
Estimate the percent of baby chimps weighing 3000–3999 grams.
• Determine which situation(s) is best modeled by a
normal distribution. Explain your reasoning. A. Annual income of a household in the U.S.
B. Weight of babies born in one year in the U.S.
• Suppose that SAT mathematics scores for a particular year
are approximately normally distributed with a mean of 510
and a standard deviation of 100.
Arizona Department of Education Chandler Unified School District #80
State Board Approved June 2010 Page 11 of 86 Revised: March
2015
Algebra: Creating Equations ���� (A-CED)
A. Createequationsthatdescribenumbersor
relationships. HS.A-CED.A.1. Create equations and
inequalities in one variable and use them to
solve problems. Include equations arising
from linear and quadratic functions, and
simple rational and exponential functions.
Algebra: Reasoning with Equations and
Inequalities ���� (A-REI)
A. Understandsolving
equationsasaprocessof
reasoningandexplainthe
reasoning. HS.A-REI.A.1. Explain each step in solving a
simple equation as following from the
equality of numbers asserted at the previous
step, starting from the assumption that the
original equation has a solution. Construct a
viable argument to justify a solution
method.
B. Solveequationsand
inequalitiesinonevariable.
D. Representandsolveequationsandinequalities
graphically.
1. What is the probability that a randomly selected score is greater
than 610?
2. Greater than 710?
3. Between 410 and 710?
4. If a student is known to score 750, what is the student’s
percentile score (the proportion of scores below 750)?
S-ID.B.6.a
Determine when linear, quadratic, and exponential models should be used to
represent a data set.
Use algebraic methods and technology to fit a linear, exponential or quadratic
function to the data. Use the function to predict values.
Explain the meaning of the slope and y-intercept in context.
Explain the meaning of the growth rate and y-intercept in context.
Explain the meaning of the constant and coefficients in context.
• Measure the wrist and neck size of each person in your
class and make a scatter plot. Find the least squares
regression line. Calculate and interpret the correlation
coefficient for this linear regression model. Graph the
residuals and evaluate the fit of the linear equations.
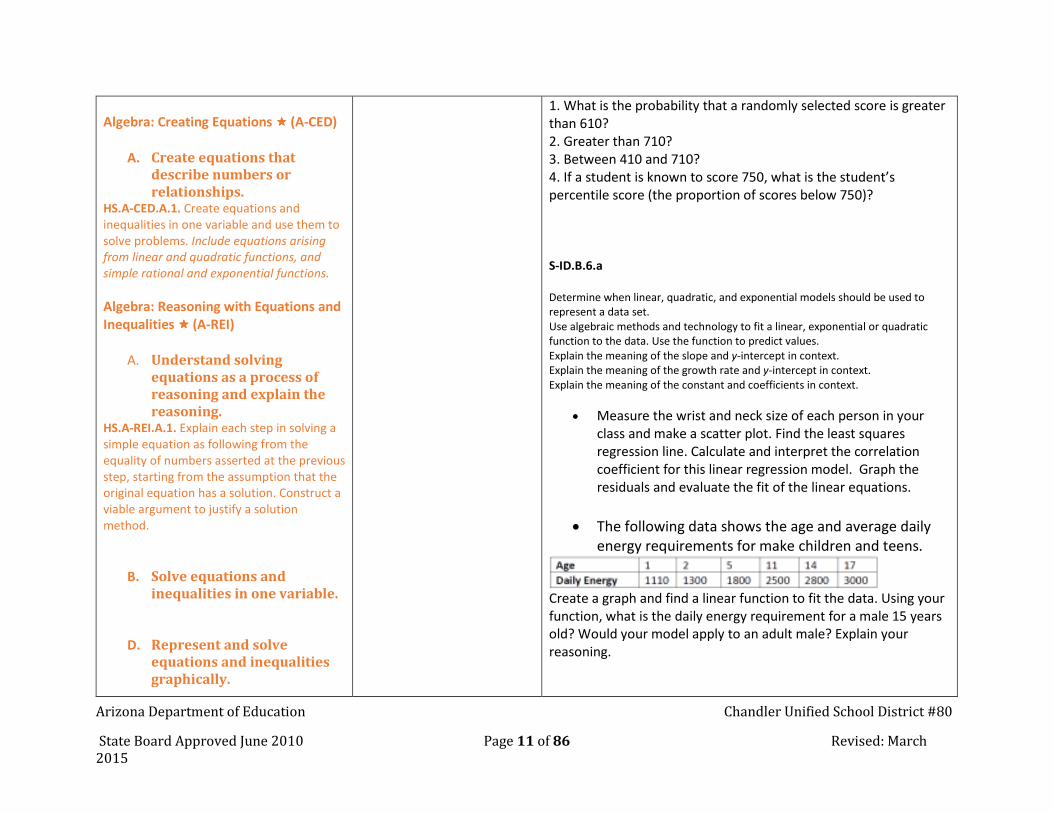
• The following data shows the age and average daily
energy requirements for make children and teens.
Create a graph and find a linear function to fit the data. Using your
function, what is the daily energy requirement for a male 15 years
old? Would your model apply to an adult male? Explain your
reasoning.
Arizona Department of Education Chandler Unified School District #80
State Board Approved June 2010 Page 12 of 86 Revised: March
2015
HS.A-REI.D.11. Explain why the x-
coordinates of the points where the graphs
of the equations
y = f(x) and y = g(x) intersect are the
solutions of the equation
f(x) = g(x); find the solutions approximately,
e.g., using technology to graph the
functions, make tables of values, or find
successive approximations. Include cases
where f(x) and/or g(x) are linear,
polynomial, rational, absolute value,
exponential, and logarithmic functions.
Algebra: Seeing Structure in
Expressions (A-SSE)
A. Interpretthestructureofexpressions.
HS.A-SSE.A.2. Use the structure of an
expression to identify ways to rewrite it. For
example,
see x4 – y4 as (x2)2 – (y2)2, thus recognizing it
as a difference of squares that can be
factored as
(x2 – y2)(x2 + y2).
B. Writeexpressionsin
equivalentformstosolve
problems.
HS.A-SSE.B.3. Choose and produce an
equivalent form of an expression to reveal
and explain properties of the quantity
represented by the expression.
• Collect data on forearm length and height in a class. Plot
the data and estimate a linear function for the data.
Compare and discuss different student representations of
the data and equations students discover.
Could the equations(s) be used to estimate the height for any
person with a known forearm length?
Why or why not?
S-ID.C.9
Understand and explain the difference between correlation and causation.
Understand and explain that a strong correlation does not mean causation.
Determine if statements of causation seem reasonable or unreasonable and justify
reasoning.
Choose two variables that could be correlated because one is the cause of the other; defend
and justify selection of variables.
Choose two variables that could be correlated even though neither variable could
reasonably be considered to be the cause of the other; defend and justify selection of
variables.
Some data leads observers to believe that there is a cause and effect relationship when a
strong relationship is observed. Students should be careful not to assume that correlation
implies causation. The determination that one thing causes another requires a controlled
randomized experiment.
• Diane did a study for a health class about the effects of a
student's end-of-year math test scores on height. Based on
a graph of her data, she found that there was a direct
relationship between students’ math scores and height.
She concluded that "doing well on your end-of-course
math tests makes you tall."
Is this conclusion justified? Explain any flaws in Diane's reasoning.
• Discuss data that has correlation but no causation
(height vs. foot length)
Arizona Department of Education Chandler Unified School District #80
State Board Approved June 2010 Page 13 of 86 Revised: March
2015
HS.A-SSE.B.4. Derive the formula for the
sum of a finite geometric series (when the
common ratio is not 1), and use the formula
to solve problems. For example, calculate
mortgage payments.
• Discuss data that has correlation and causation (number
of M&Ms in a cup vs. weight of the cup).
S-IC.A.1
Define populations, population parameter, random sample, and inference.
Explain why randomization is used to draw a sample that represents a population
well.
Recognize that statistics involves drawing conclusions about a population based
on the results obtained from a random sample of the population.
• From a class containing 12 girls and 10 boys, three
students are to be selected to serve on a school advisory
panel. Here are four different methods of making the
selection.
I. Select the first three names on the class roll.
II. Select the first three students who volunteer.
III. Place the names of the 22 students in a hat, mix them
thoroughly, and select three names from the mix.
IV. Select the first three students who show up for class
tomorrow.
Which is the best sampling method, among these four, if you want
the school panel to represent a fair and representative view of the
opinions of your class?
Explain the weaknesses of the three you did not select as the best.
Arizona Department of Education Chandler Unified School District #80
State Board Approved June 2010 Page 14 of 86 Revised: March
2015
Note: Provide opportunities for students to clearly distinguish
between a population parameter which is a constant, and a sample
statistic which is a variable.
S-IC.A.2 Include comparing theoretical and empirical results to evaluate the effectiveness of a
treatment.
Explain how well and why a sample represents the variable of interest from a population.
Demonstrate understanding of the different kinds of sampling methods.
Design simulations of random sampling, assign digits in appropriate proportions for events,
carry out the simulation using random number generators and random number tables and
explain the outcomes in context of the population and the known proportions.
Possible data-generating processes include (but are not limited to): Flipping coins, spinning
spinners, rolling a number cube, and simulations using the random number generators.
Students may use graphing calculators, spreadsheet programs, or applets to conduct
simulations and quickly perform large numbers of trials.
The law of large numbers states that as the sample size increases, the experimental
probability will approach the theoretical probability. Comparison of data from repetitions of
the same experiment is part of the model building verification process.
• Have multiple groups flip coins. One group flips a coin 5
times, one group flips a coin 20 times, and one group flips
a coin 100 times. Which group’s results will most likely
approach the theoretical probability?
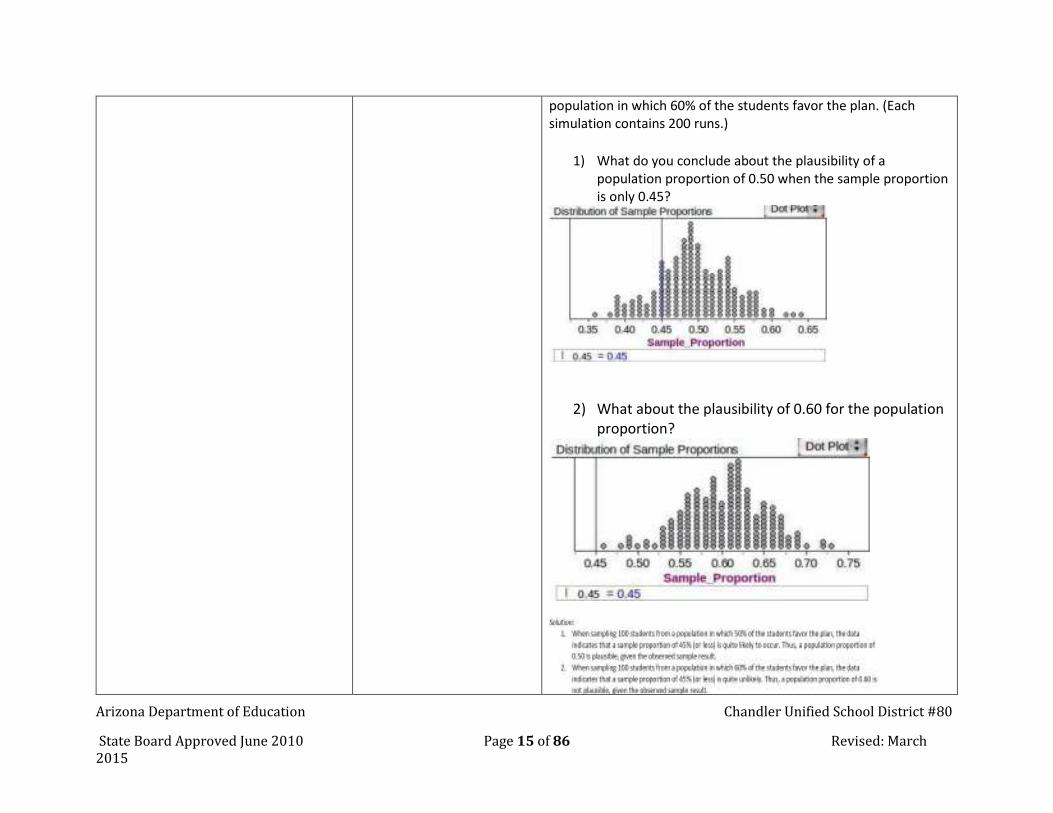
• A random sample of 100 students from a specific high
school resulted in 45% of them favoring a plan to
implement block scheduling. Is it plausible that a majority
of the students in the school actually favor the block
schedule? Simulation can help answer the questions.
The accompanying plot shows a simulated distribution of sample
proportions for samples of size 100 from a population in which
50% of the students favor the plan, and another distribution from a
Arizona Department of Education Chandler Unified School District #80
State Board Approved June 2010 Page 15 of 86 Revised: March
2015
population in which 60% of the students favor the plan. (Each
simulation contains 200 runs.)
1) What do you conclude about the plausibility of a
population proportion of 0.50 when the sample proportion
is only 0.45?
2) What about the plausibility of 0.60 for the population
proportion?
Arizona Department of Education Chandler Unified School District #80
State Board Approved June 2010 Page 16 of 86 Revised: March
2015
S-IC.B.3
Identify situations as either sample survey, experiment, or observational study. Discuss the
appropriateness of each one’s use in contexts with limiting factors. Describe the purposes
and differences of each.
Design or evaluate sample surveys, experiments and observational studies with
randomization. Discuss the importance of randomization in these processes.
Students should be able to explain techniques/applications for randomly selecting study
subjects from a population and how those techniques/applications differ from those used to
randomly assign existing subjects to control groups or experimental groups in a statistical
experiment.
In statistics, and observational study draws inferences about the possible effect of a
treatment on subjects, where the assignment of subjects into a treated group versus a
control group is outside the control of the investigator (for example, observing data on
academic achievement and socio-economic status to see if there is a relationship between
them). This is in contrast to controlled experiments, such as randomized controlled trials,
where each subject is randomly assigned to a treated group or a control group before the
start of the treatment.
• Students in a high school mathematics class decided that
their term project would be a study of the strictness of the
parents or guardians of students in the school. Their goal
was to estimate the proportion of students in the school
who thought of their parents or guardians as “strict”. They
do not have time to interview all 1000 students in the
school, so they plan to obtain data from a sample of
students.
a. Describe the parameter of interest and a statistic the students
could use to estimate the parameter.
b. Is the best design for this study a sample survey, an
experiment, or an observational study? Explain your
reasoning.
c. The students quickly realized that, as there is no definition of
“strict”, they could not simply ask a student, “Are your parents
Arizona Department of Education Chandler Unified School District #80
State Board Approved June 2010 Page 17 of 86 Revised: March
2015
or guardians strict?” Write three questions that could provide
objective data related to strictness.
d. Describe an appropriate method for obtaining a sample of 100
students, based on your answer in part (a) above. (See Math Flip Book on ADE webpage for solutions)
S-IC.B.4 For S.IC.4-5 focus on the variability of results from experiments. Focus on statistics as a way
of dealing with, not eliminating, inherent randomness.
Calculate the sample mean and proportion.
Use sample means and sample proportions to estimate population values.
Defend the statement, “The population mean or proportion is close to the sample mean or
proportion when the sample is randomly selected and large enough to represent the
population well.”
Infer that the population mean or proportion is equal to the sample mean or proportion and
conduct simulation to determined which sample results are typical of this model and which
results are considered outliers (possible, but unexpected).
Choose an appropriate margin of error for the sample mean or proportion and create a
confidence interval based on the results of the simulation conducted.
Determine how often the true population mean or proportion is within the margin of error
of each sample mean or proportion.
Pose a question regarding the mean or proportion of a population, use statistical techniques
to estimate the parameter, and design an appropriate product to summarize the process
and report the estimate. Explain what the results mean about variability in a population and
use results to calculate the error for these estimates.
Students may use computer generated simulation models based upon the results of sample
surveys to estimate population statistics and margins of error.
• Is normal body temperature the same for men and
women? Medical researchers interested in this question
collected data from a large number of men and women.
Random samples from that data are recorded in the table
below.
a. Use a 95% confidence interval to estimate the mean body
temperature of men.
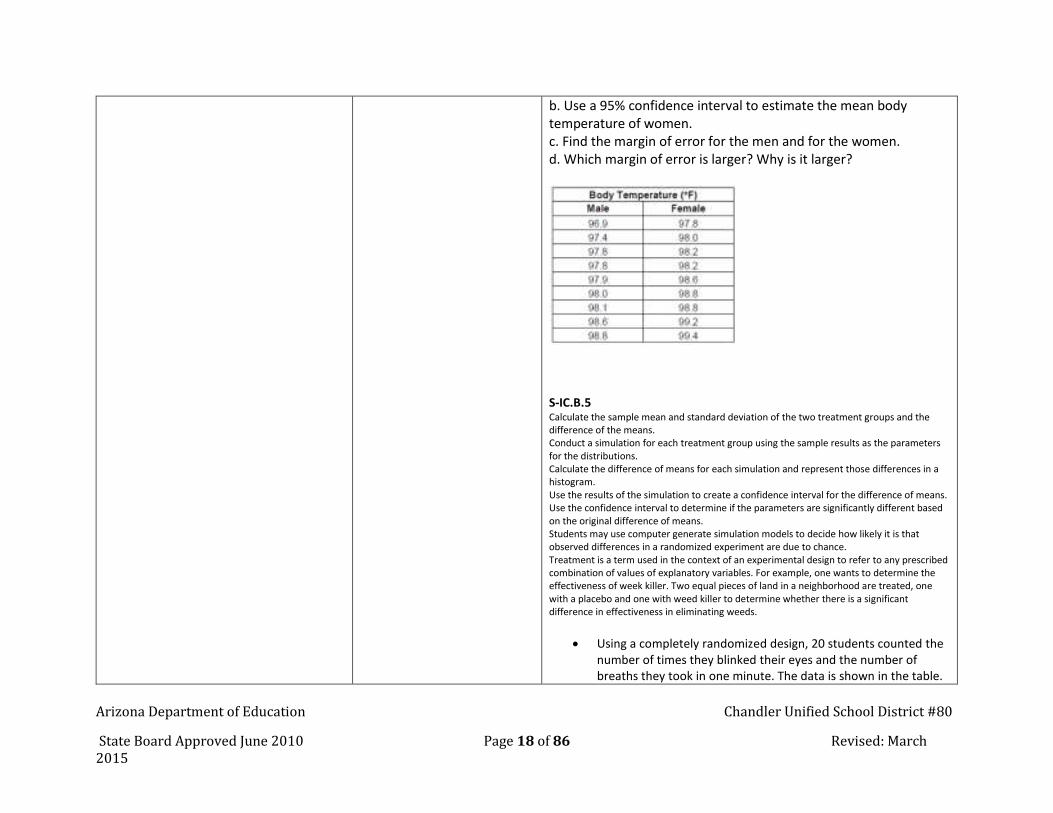
Arizona Department of Education Chandler Unified School District #80
State Board Approved June 2010 Page 18 of 86 Revised: March
2015
b. Use a 95% confidence interval to estimate the mean body
temperature of women.
c. Find the margin of error for the men and for the women.
d. Which margin of error is larger? Why is it larger?
S-IC.B.5 Calculate the sample mean and standard deviation of the two treatment groups and the
difference of the means.
Conduct a simulation for each treatment group using the sample results as the parameters
for the distributions.
Calculate the difference of means for each simulation and represent those differences in a
histogram.
Use the results of the simulation to create a confidence interval for the difference of means.
Use the confidence interval to determine if the parameters are significantly different based
on the original difference of means.
Students may use computer generate simulation models to decide how likely it is that
observed differences in a randomized experiment are due to chance.
Treatment is a term used in the context of an experimental design to refer to any prescribed
combination of values of explanatory variables. For example, one wants to determine the
effectiveness of week killer. Two equal pieces of land in a neighborhood are treated, one
with a placebo and one with weed killer to determine whether there is a significant
difference in effectiveness in eliminating weeds.
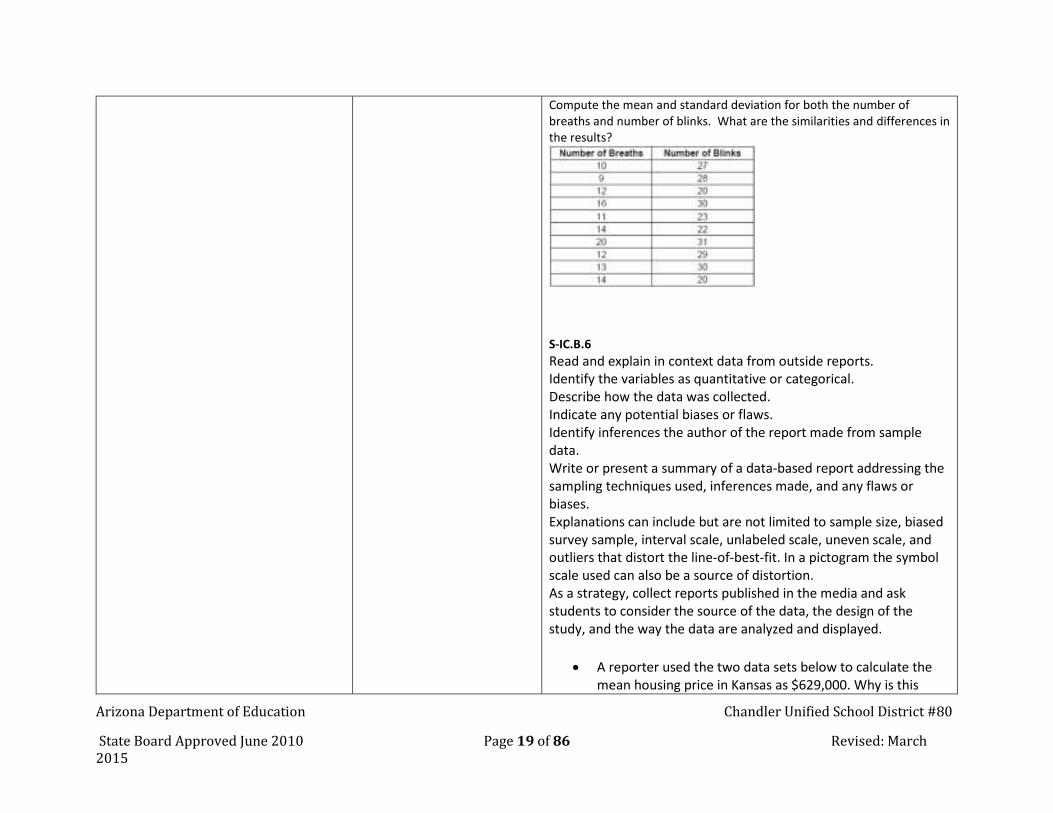
• Using a completely randomized design, 20 students counted the
number of times they blinked their eyes and the number of
breaths they took in one minute. The data is shown in the table.
Arizona Department of Education Chandler Unified School District #80
State Board Approved June 2010 Page 19 of 86 Revised: March
2015
Compute the mean and standard deviation for both the number of
breaths and number of blinks. What are the similarities and differences in
the results?
S-IC.B.6
Read and explain in context data from outside reports.
Identify the variables as quantitative or categorical.
Describe how the data was collected.
Indicate any potential biases or flaws.
Identify inferences the author of the report made from sample
data.
Write or present a summary of a data-based report addressing the
sampling techniques used, inferences made, and any flaws or
biases.
Explanations can include but are not limited to sample size, biased
survey sample, interval scale, unlabeled scale, uneven scale, and
outliers that distort the line-of-best-fit. In a pictogram the symbol
scale used can also be a source of distortion.
As a strategy, collect reports published in the media and ask
students to consider the source of the data, the design of the
study, and the way the data are analyzed and displayed.
• A reporter used the two data sets below to calculate the
mean housing price in Kansas as $629,000. Why is this
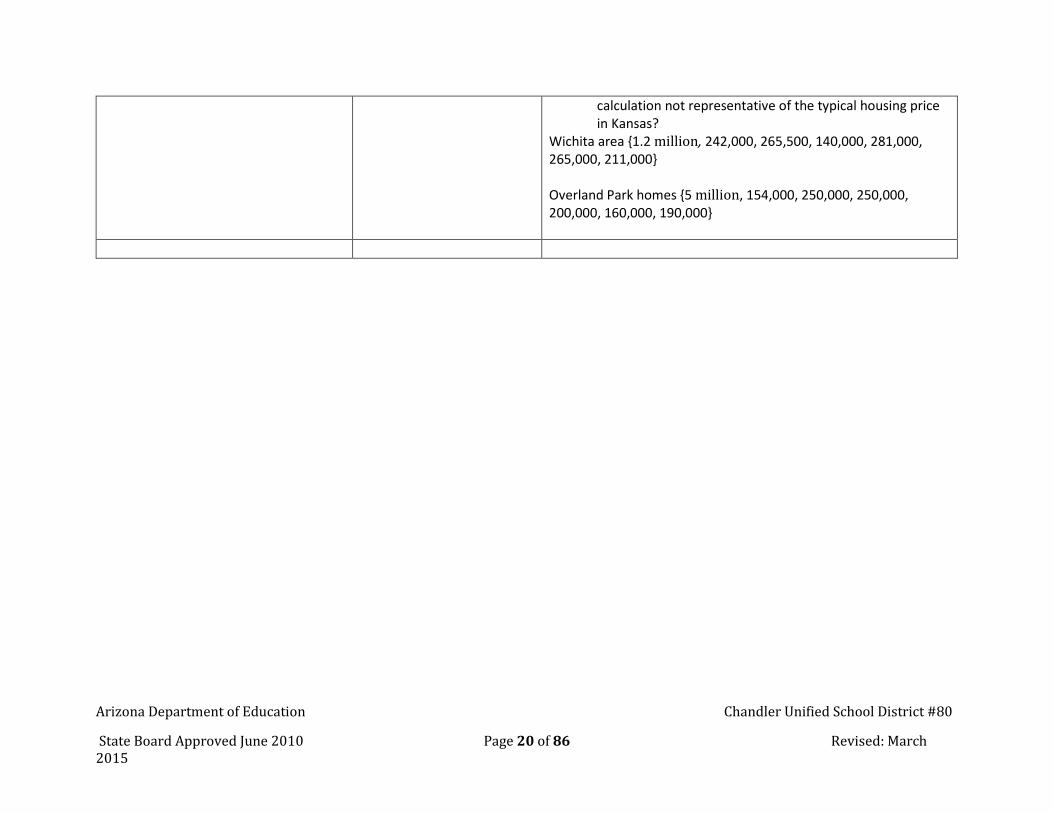
Arizona Department of Education Chandler Unified School District #80
State Board Approved June 2010 Page 20 of 86 Revised: March
2015
calculation not representative of the typical housing price
in Kansas?
Wichita area {1.2 million, 242,000, 265,500, 140,000, 281,000,
265,000, 211,000}
Overland Park homes {5 million, 154,000, 250,000, 250,000,
200,000, 160,000, 190,000}
Arizona Department of Education Chandler Unified School District #80
State Board Approved June 2010 Page 21 of 86 Revised: March
2015
Algebra II
Unit 2: Arithmetic and Geometric Sequences, Equations and Inequalities, Linear Equations and Systems of Linear Equations
Suggested number of days: 20
Students will…
An equation is a statement of equality between two expressions, often viewed as a question asking for which values of the variables the expressions on
either side are in fact equal. These values are the solutions to the equation. An identity, in contrast, is true for all values of the variables; identities are often
developed by rewriting an expression in an equivalent form.
The solutions of an equation in one variable form a set of numbers; the solutions of an equation in two variables form a set of ordered pairs of numbers,
which can be plotted in the coordinate plane. Two or more equations and/or inequalities form a system. A solution for such a system must satisfy every
equation and inequality in the system.
An equation can often be solved by successively deducing from it one or more simpler equations. For example, one can add the same constant to both sides
without changing the solutions, but squaring both sides might lead to extraneous solutions. Strategic competence in solving includes looking ahead for
productive manipulations and anticipating the nature and number of solutions.
Some equations have no solutions in a given number system, but have a solution in a larger system. For example, the solution of x + 1 = 0 is an integer, not a
whole number; the solution of 2x + 1 = 0 is a rational number, not an integer; the solutions of x2 – 2 = 0 are real numbers, not rational numbers; and the
solutions of x2 + 2 = 0 are complex numbers, not real numbers.
The same solution techniques used to solve equations can be used to rearrange formulas. For example, the formula for the area of a trapezoid, A =
((b1+b2)/2)h, can be solved for h using the same deductive process.
Inequalities can be solved by reasoning about the properties of inequality. Many, but not all, of the properties of equality continue to hold for inequalities
and can be useful in solving them.
Reasoning with Equations and
Inequalities � (A-REI)
A. Understandsolvingequationsasaprocessof
reasoningandexplainthe
reasoning.
HS.A-REI.A.1. Explain each step in solving a
simple equation as following from the
equality of numbers asserted at the previous
MP.1 Make sense of problems and
persevere in solving them. MP.7 Look
for and make use of structure.
MP.2 Reason abstractly and
quantitatively.
MP.3 Construct viable arguments and
critique the reasoning of others.
A-REI.A.1 Assuming an equation has a solution, construct a convincing
argument that justifies each step in the solution process.
Justifications may include the associative, commutative, and division
properties, combining like terms, multiplication by 1, etc.
Properties of operations can be used to change expressions on
either side of the equation to equivalent expressions. In addition,
adding the same term to both sides of an equation or multiplying
both sides by a non-zero constant produces an equation with the
same solutions. Other operations, such as squaring both sides, may
produce equations that have extraneous solutions.
Arizona Department of Education Chandler Unified School District #80
State Board Approved June 2010 Page 22 of 86 Revised: March
2015
step, starting from the assumption that the
original equation has a solution. Construct a
viable argument to justify a solution method.
B. Solveequationsand
inequalitiesinonevariable.
C. Solvesystemsofequations.
HS.A-REI.C.6. Solve systems of linear
equations exactly and approximately (e.g.,
with graphs), focusing on pairs of linear
equations in two variables.
HS.A-REI.C.7. Solve a simple system
consisting of a linear equation and a
quadratic equation in two variables
algebraically and graphically. For example,
find the points of intersection between the
line
y = –3x and the circle x2 + y2 = 3.
D. Representandsolve
equationsandinequalities
graphically.
HS.A-REI.D.11. Explain why the x-coordinates
of the points where the graphs of the
equations
y = f(x) and y = g(x) intersect are the
solutions of the equation
f(x) = g(x); find the solutions approximately,
e.g., using technology to graph the functions,
make tables of values, or find successive
Ex 1) Explain why the equation x/2 + 7/3 = 5 has the
same solutions as the equation 3x + 14 = 30.
Does this mean that x/2 + 7/3 is equal to 3x + 14?
Ex 2) Show that x = 2 and x = –3 are solutions to the
equation �� + � = 6.
Write the equation in a form that shows these are the
only solutions, explaining each step in your reasoning.
Ex 3) Connect the idea of adding two equations
together as a means of justifying steps of solving a
simple equation to the process of solving a system of
equations. A system consisting of two linear functions
such as 2x + 3y = 8 and
x - 3y = 1 can be solved by adding the equations
together, and can be justified by exactly the same
reason that solving the equation 2x - 4 = 5 can begin by
adding the equation 4 = 4.
Investigate the solutions to equations such as 3 = � +√2� − 3. By graphing the two functions, y = 3 and 3 =� + √2� − 3. students can visualize that graphs of the functions only
intersect at one point. However, subtracting x = x from
the original equation yields 3 − � = √2� − 3which
when both sides are squared produces a quadratic
equation that has two roots x = 2 and x = 6. Students
should recognize that there is only one solution
Arizona Department of Education Chandler Unified School District #80
State Board Approved June 2010 Page 23 of 86 Revised: March
2015
approximations. Include cases where f(x)
and/or g(x) are linear, polynomial, rational,
absolute value, exponential, and logarithmic
functions.
HS.F-BF.A.1. Write a function that describes
a relationship between two quantities.
(a) Determine an explicit expression, a
recursive process, or steps for
calculation from a context. (b) Combine standard function types
using arithmetic operations. For
example, build a function that
(x = 2) and that x = 6 is generated when a quadratic
equation results from squaring both sides; x = 6 is
extraneous to the original equation. Some rational
equations, such as �
���=
�
���+
�
�result in extraneous
solutions as well.
A-REI.C.6 The system solution methods can include but are not
limited to graphical, elimination/linear combination,
substitution, and modeling. Systems can be written
algebraically or can be represented in context. Students
may use graphing calculators, programs, or applets to
model and find approximate solutions for systems of
equations.
Ex 1) A restaurant serves a vegetarian and a chicken
lunch special each day. Each vegetarian special is the
same price. Each chicken special is the same price.
However, the price of the vegetarian special is different
from the price of the chicken special.
o On Thursday, the restaurant collected $467 selling 21
vegetarian specials and 40 chicken specials.
o On Friday, the restaurant collected $484 selling 28
vegetarian specials and 36 chicken specials.
What is the cost of each lunch special?
Solution: vegetarian: $7 and chicken: $8
Arizona Department of Education Chandler Unified School District #80
State Board Approved June 2010 Page 24 of 86 Revised: March
2015
models the temperature of a cooling
body by adding a constant function
to a decaying exponential, and
relate these functions to the model. HS.F-BF.A.2. Write arithmetic and geometric
sequences both recursively and with an
explicit formula, use them to model
situations, and translate between the two
forms.
A-REI.C.7 Include systems consisting of one linear and one
quadratic equation. Include systems that lead to work
with fractions. For example, finding the intersections
between x2 + y2 = 1 and y = (x + 1)/2 leads to the point (3/5,
4/5) on
the unit circle, corresponding to the Pythagorean triple
32 + 42 = 52.
Ex 1) Two friends are driving to the Grand Canyon in
separate cars. Suzette has been there before and knows
the way but Andrea does not. During the trip Andrea
gets ahead of Suzette and pulls over to wait for her.
Suzette is traveling at a constant rate of 65 miles per
hour. Andrea sees Suzette drive past. To catch up,
Andrea accelerates at a constant rate. The distance in
miles (d) that her car travels as a function of time in
hours (t) since Suzette’s car passed is given by d =
3500t2.
Write and solve a system of equations to determine
how long it takes for Andrea to catch up with Suzette.
Ex 2) Sketch the circle with equation x2 + y2 = 1 and the
line with equation y = 2x−1 on the same pair of axes.
a. There is one solution to the pair of equations
x2 + y2 = 1
y = 2x−1
That is clearly identifiable from the sketch. What is it?
Verify that it is a solution.
Arizona Department of Education Chandler Unified School District #80
State Board Approved June 2010 Page 25 of 86 Revised: March
2015
b. Find all the solutions to this pair of equations
A-REI.D.11
In Algebra 2 extend this standard to include higher-
order polynomials, rational, radical, absolute value and
exponential functions.
Ex 1) Graph the following system and give the
solutions for f(x) = g(x).
Ex 2) Graph the following system and give the solutions
for f(x) = g(x).
Examples:
• Graph the solution: y < 2x + 3.
Arizona Department of Education Chandler Unified School District #80
State Board Approved June 2010 Page 26 of 86 Revised: March
2015
• A publishing company publishes a total of no more
than 100 magazines every year. At least 30 of these
are women’s magazines, but the company always
publishes at least as many women’s magazines as
men’s magazines. Find a system of inequalities that
describes the possible number of men’s and
women’s magazines that the company can produce
each year consistent with these policies. Graph the
solution set.
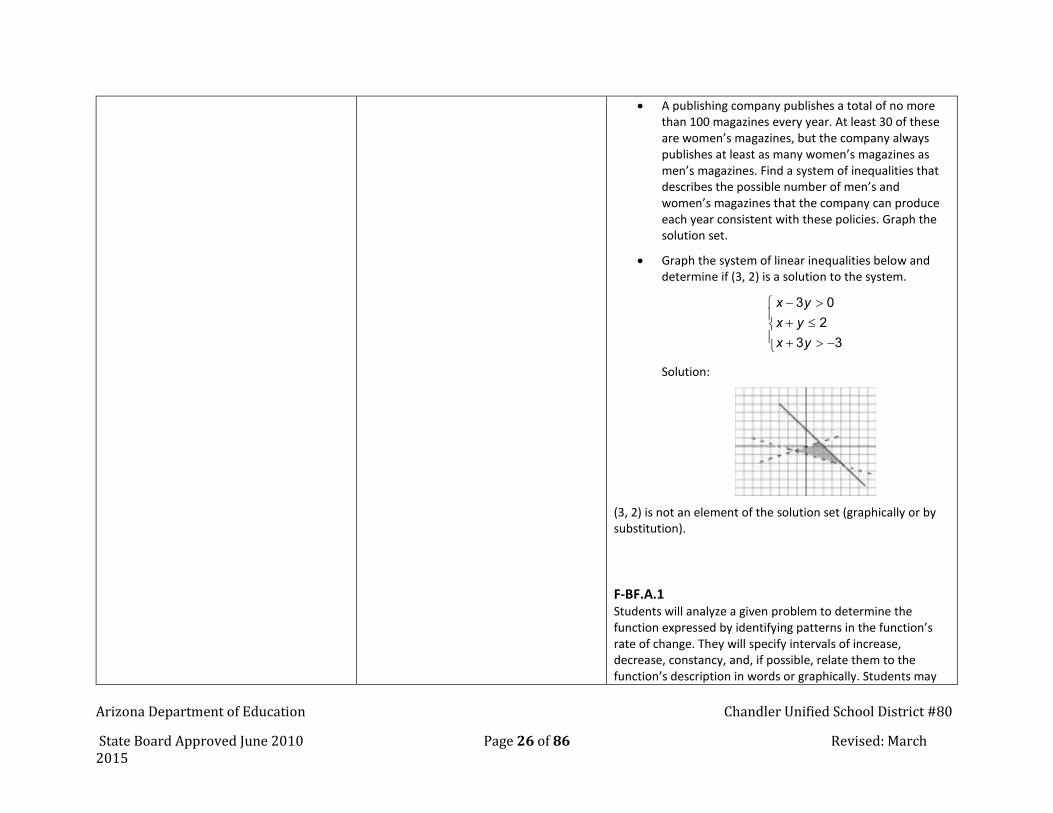
• Graph the system of linear inequalities below and
determine if (3, 2) is a solution to the system.
−>+
≤+
>−
33
2
03
yx
yx
yx
Solution:
(3, 2) is not an element of the solution set (graphically or by
substitution).
F-BF.A.1
Students will analyze a given problem to determine the
function expressed by identifying patterns in the function’s
rate of change. They will specify intervals of increase,
decrease, constancy, and, if possible, relate them to the
function’s description in words or graphically. Students may
Arizona Department of Education Chandler Unified School District #80
State Board Approved June 2010 Page 27 of 86 Revised: March
2015
use graphing calculators or programs, spreadsheets, or
computer algebra systems to model functions.
Examples:
• You buy a $10,000 car with an annual interest rate of
6 percent compounded annually and make monthly
payments of $250. Express the amount remaining to
be paid off as a function of the number of months,
using a recursion equation.
• A cup of coffee is initially at a temperature of 93º F.
The difference between its temperature and the
room temperature of 68º F decreases by 9% each
minute. Write a function describing the temperature
of the coffee as a function of time.
The radius of a circular oil slick after t hours is given in feet by
� = 10�� − 0.5�, for 0 ≤ t ≤ 10. Find the area of the oil slick as
a function of time.
F-BF.A.2
An explicit rule for the nth term of a sequence gives an as an
expression in the term’s position n; a recursive rule gives the
first term of a sequence, and a recursive equation relates an
to the preceding term(s). Both methods of presenting a
sequence describe an as a function of n.
Examples:
• Generate the 5th-11th terms of a sequence if A1= 2
and 1)( 2)1( −=+ nn AA
• Use the formula: An= A1 + d(n - 1) where d is the
common difference to generate a sequence whose
first three terms are: -7, -4, and -1.
• There are 2,500 fish in a pond. Each year the
population decreases by 25 percent, but 1,000 fish
Arizona Department of Education Chandler Unified School District #80
State Board Approved June 2010 Page 28 of 86 Revised: March
2015
are added to the pond at the end of the year. Find
the population in five years. Also, find the long-term
population.
• Given the formula An= 2n - 1, find the 17th term of
the sequence. What is the 9th term in the sequence
3, 5, 7, 9, …?
• Given a1 = 4 and an = an-1 + 3, write the explicit
formula.
Number and Quantity: Quantities ���� (N-
Q)
A. Reasonqualitativelyanduse
unitstosolveproblems.
HS.N-Q.A.2. Define appropriate quantities
for the purpose of descriptive modeling.
Algebra: Creating Equations ���� (A-CED)
A. Createequationsthat
describenumbersor
relationships. HS.A-CED.A.1. Create equations and
inequalities in one variable and use them to
solve problems. Include equations arising
from linear and quadratic functions, and
simple rational and exponential functions.
Algebra: Reasoning with Equations and
Inequalities ���� (A-REI)
A. Understandsolving
equationsasaprocessof
Arizona Department of Education Chandler Unified School District #80
State Board Approved June 2010 Page 29 of 86 Revised: March
2015
reasoningandexplainthe
reasoning. HS.A-REI.A.1. Explain each step in solving a
simple equation as following from the
equality of numbers asserted at the previous
step, starting from the assumption that the
original equation has a solution. Construct a
viable argument to justify a solution method.
B. Solveequationsand
inequalitiesinonevariable.
HS.A-REI.B.4. Solve quadratic equations in
one variable.
b. Solve quadratic equations by inspection
(e.g., for x2 = 49), taking square roots,
completing the square, the quadratic
formula and factoring, as appropriate to the
initial form of the equation. Recognize when
the quadratic formula gives complex
solutions and write them as a ± bi for real
numbers a and b.
D. Representandsolve
equationsandinequalities
graphically. HS.A-REI.D.11. Explain why the x-coordinates
of the points where the graphs of the
equations
y = f(x) and y = g(x) intersect are the
solutions of the equation
f(x) = g(x); find the solutions approximately,
e.g., using technology to graph the functions,
make tables of values, or find successive
approximations. Include cases where f(x)
Arizona Department of Education Chandler Unified School District #80
State Board Approved June 2010 Page 30 of 86 Revised: March
2015
and/or g(x) are linear, polynomial, rational,
absolute value, exponential, and logarithmic
functions.
Algebra: Seeing Structure in
Expressions (A-SSE)
A. Interpretthestructureof
expressions.
HS.A-SSE.A.2. Use the structure of an
expression to identify ways to rewrite it. For
example,
see x4 – y4 as (x2)2 – (y2)2, thus recognizing it
as a difference of squares that can be
factored as
(x2 – y2)(x2 + y2).
B. Writeexpressionsin
equivalentformstosolve
problems.
HS.A-SSE.B.3. Choose and produce an
equivalent form of an expression to reveal
and explain properties of the quantity
represented by the expression.
c. Use the properties of exponents to
transform expressions for exponential
functions. For example the expression 1.15t
can be rewritten as
(1.151/12)12t ≈ 1.01212t to reveal the
approximate equivalent monthly interest rate
if the annual rate is 15%.
Arizona Department of Education Chandler Unified School District #80
State Board Approved June 2010 Page 31 of 86 Revised: March
2015
HS.A-SSE.B.4. Derive the formula for the sum
of a finite geometric series (when the
common ratio is not 1), and use the formula
to solve problems. For example, calculate
mortgage payments.
Algebra II
Unit 3: Functions Suggested number of days: 15
Students will be introduced to the parent functions, learn to transform these parent functions, compare and contrast the types of functions.
Students will interpret and build functions to model context.
Functions: Building Functions (F-BF)
B. Buildnewfunctionsfrom
existingfunctions. HS.F-BF.B.3. Identify the effect on the graph of
replacing f(x) by f(x) + k, k f(x), f(kx), and f(x + k)
for specific values of k (both positive and
negative); find the value of k given the graphs.
Experiment with cases and illustrate an
explanation of the effects on the graph using
technology. Include recognizing even and odd
functions from their graphs and algebraic
expressions for them.
Functions: Interpreting Functions (F-
IF)
A. Understandtheconceptofa
functionanduseoffunction
notation.
Explanations and Examples:
F-BF.B.3
1) Is (�) = �3 − 3�2
+ 2�+ 1 even, odd, or
neither? Explain your answer orally or in
written format.
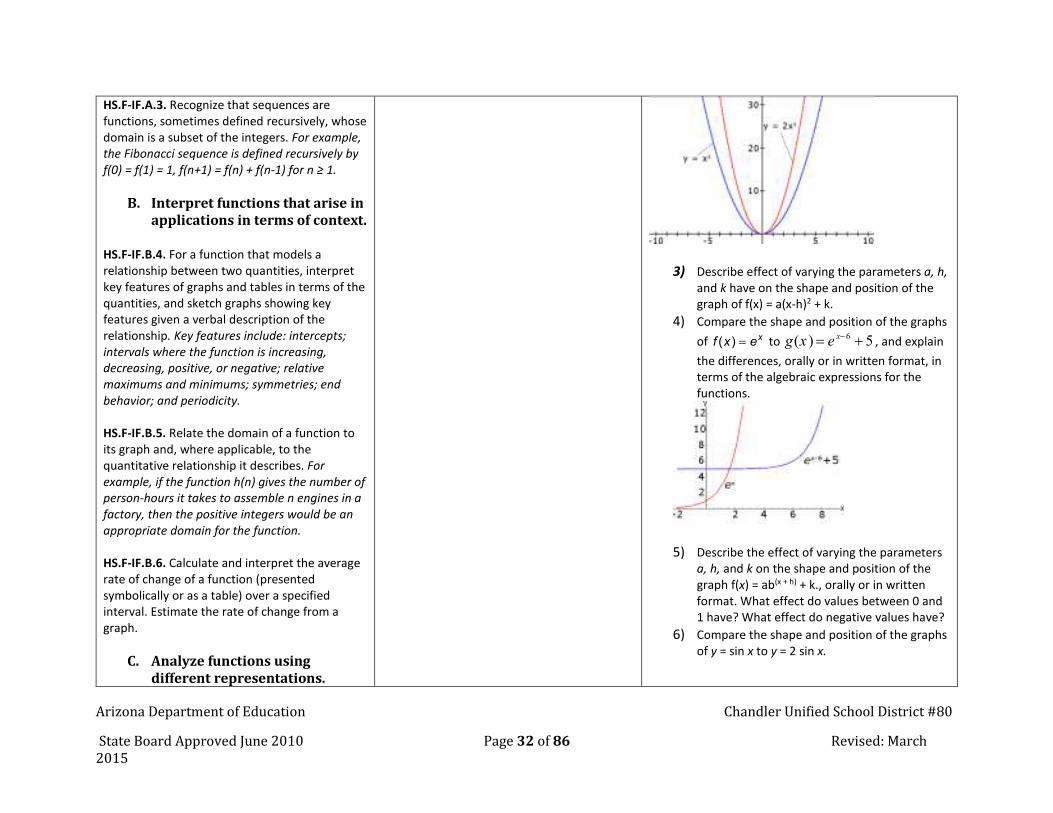
2) Compare the shape and position of the
graphs of �(�) = �2
and �(�) = 2�2 , and explain the differences in
terms of the algebraic expressions for the
functions.
Arizona Department of Education Chandler Unified School District #80
State Board Approved June 2010 Page 32 of 86 Revised: March
2015
HS.F-IF.A.3. Recognize that sequences are
functions, sometimes defined recursively, whose
domain is a subset of the integers. For example,
the Fibonacci sequence is defined recursively by
f(0) = f(1) = 1, f(n+1) = f(n) + f(n-1) for n ≥ 1.
B. Interpretfunctionsthatariseinapplicationsintermsofcontext.
HS.F-IF.B.4. For a function that models a
relationship between two quantities, interpret
key features of graphs and tables in terms of the
quantities, and sketch graphs showing key
features given a verbal description of the
relationship. Key features include: intercepts;
intervals where the function is increasing,
decreasing, positive, or negative; relative
maximums and minimums; symmetries; end
behavior; and periodicity.
HS.F-IF.B.5. Relate the domain of a function to
its graph and, where applicable, to the
quantitative relationship it describes. For
example, if the function h(n) gives the number of
person-hours it takes to assemble n engines in a
factory, then the positive integers would be an
appropriate domain for the function.
HS.F-IF.B.6. Calculate and interpret the average
rate of change of a function (presented
symbolically or as a table) over a specified
interval. Estimate the rate of change from a
graph.
C. Analyzefunctionsusing
differentrepresentations.
3) Describe effect of varying the parameters a, h,
and k have on the shape and position of the
graph of f(x) = a(x-h)2 + k.
4) Compare the shape and position of the graphs
of xexf =)( to g(x ) = e x−6 +5 , and explain
the differences, orally or in written format, in
terms of the algebraic expressions for the
functions.
5) Describe the effect of varying the parameters
a, h, and k on the shape and position of the
graph f(x) = ab(x + h) + k., orally or in written
format. What effect do values between 0 and
1 have? What effect do negative values have? 6) Compare the shape and position of the graphs
of y = sin x to y = 2 sin x.
Arizona Department of Education Chandler Unified School District #80
State Board Approved June 2010 Page 33 of 86 Revised: March
2015
HS.F-IF.C.7. Graph functions expressed
symbolically and show key features of the graph,
by hand in simple cases and using technology for
more complicated cases.
(c) Graph polynomial functions, identifying
zeros when suitable factorizations are
available, and showing end behavior. (e) Graph exponential and logarithmic
functions, showing intercepts and end
behavior, and trigonometric functions,
showing period, midline, and amplitude. HS.F-IF.C.8. Write a function defined by an
expression in different but equivalent forms to
reveal and explain different properties of the
function.
HS.F-IF.C.9. Compare properties of two
functions each represented in a different way
(algebraically, graphically, numerically in tables,
or by verbal descriptions). For example, given a
graph of one quadratic function and an algebraic
expression for another, say which has the larger
maximum.
Functions: Building Functions (F-BF)
A. Buildafunctionthatmodelsa
relationshipbetweentwo
quantities. HS.F-BF.A.1. Write a function that describes a
relationship between two quantities.
(a) Determine an explicit expression, a
recursive process, or steps for
calculation from a context.
F-IF.A.3
In F.IF.3 draw a connection to F.BF.2, which
requires students to write arithmetic and
geometric sequences. Emphasize arithmetic and
geometric sequences as examples of linear and
exponential functions.
Students should be able to explain that a recursive
formula tells how a sequence starts and how to
use the previous value(s) to generate the next
element of the sequence.
Students should be able to explain that an explicit
formula allows them to find any element of a
sequence without knowing the element before it
(e.g., If I want to know the 11th number on the list,
I substitute the number 11 into the explicit
formula).
Students need to be able to distinguish between
explicit and recursive formulas for sequences.
F-IF.B.4
Students may be given graphs to interpret or produce
graphs given an expression or table for the function, by
hand or using technology.
Examples:
Arizona Department of Education Chandler Unified School District #80
State Board Approved June 2010 Page 34 of 86 Revised: March
2015
(b) Combine standard function types using
arithmetic operations. For example,
build a function that models the
temperature of a cooling body by
adding a constant function to a
decaying exponential, and relate these
functions to the model. HS.F-BF.A.2. Write arithmetic and geometric
sequences both recursively and with an explicit
formula, use them to model situations, and
translate between the two forms.
B. Buildnewfunctionsfrom
existingfunctions.
HS.F-BF.B.4 Find inverse functions.
(a) Solve an equation of the form f(x) = c
for a simple function f that has an
inverse and write an expression for the
inverse. For example, f(x) =2 x3 or f(x) =
(x+1)/(x-1) for x ≠ 1.
Functions: Linear, Quadratic, and
Exponential Models � (F-LE)
A. Constructandcomparelinear,
quadratic,andexponential
modelsandsolveproblems.
HS.F-LE.A.1. Distinguish between situations that
can be modeled with linear functions and with
exponential functions.
HS.F-LE.A.2. Construct linear and exponential
functions, including arithmetic and geometric
sequences, given a graph, a description of a
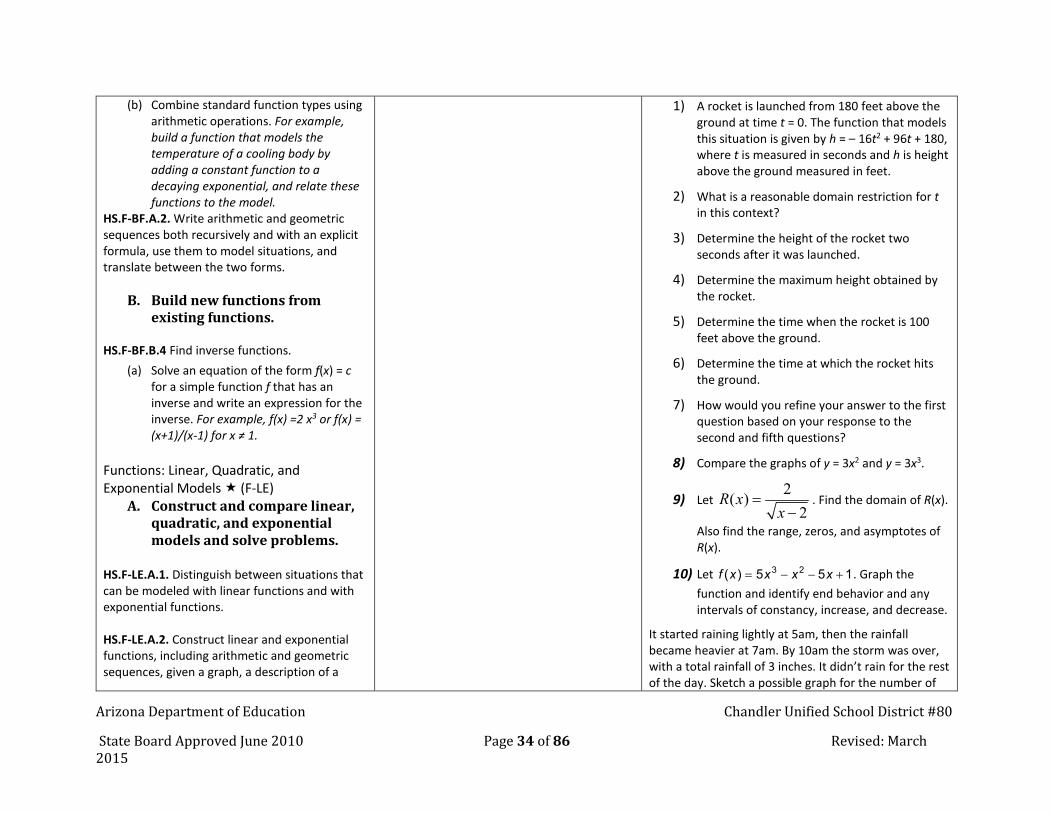
1) A rocket is launched from 180 feet above the
ground at time t = 0. The function that models
this situation is given by h = – 16t2 + 96t + 180,
where t is measured in seconds and h is height
above the ground measured in feet.
2) What is a reasonable domain restriction for t
in this context?
3) Determine the height of the rocket two
seconds after it was launched.
4) Determine the maximum height obtained by
the rocket.
5) Determine the time when the rocket is 100
feet above the ground.
6) Determine the time at which the rocket hits
the ground.
7) How would you refine your answer to the first
question based on your response to the
second and fifth questions?
8) Compare the graphs of y = 3x2 and y = 3x3.
9) Let 2
( )2
R xx
=−
. Find the domain of R(x).
Also find the range, zeros, and asymptotes of
R(x).
10) Let 155)( 23 +−−= xxxxf . Graph the
function and identify end behavior and any
intervals of constancy, increase, and decrease.
It started raining lightly at 5am, then the rainfall
became heavier at 7am. By 10am the storm was over,
with a total rainfall of 3 inches. It didn’t rain for the rest
of the day. Sketch a possible graph for the number of
Arizona Department of Education Chandler Unified School District #80
State Board Approved June 2010 Page 35 of 86 Revised: March
2015
relationship, or two input-output pairs (include
reading these from a table).
HS.F-LE.A.3. Observe using graphs and tables
that a quantity increasing exponentially
eventually exceeds a quantity increasing
linearly, quadratically, or (more generally) as a
polynomial function.
B. Interpretexpressionsfor
functionsintermsofthe
situationtheymodel. HS.F-LE.B.5. Interpret the parameters in a linear
or exponential function in terms of a context.
inches of rain as a function of time, from midnight to
midday.
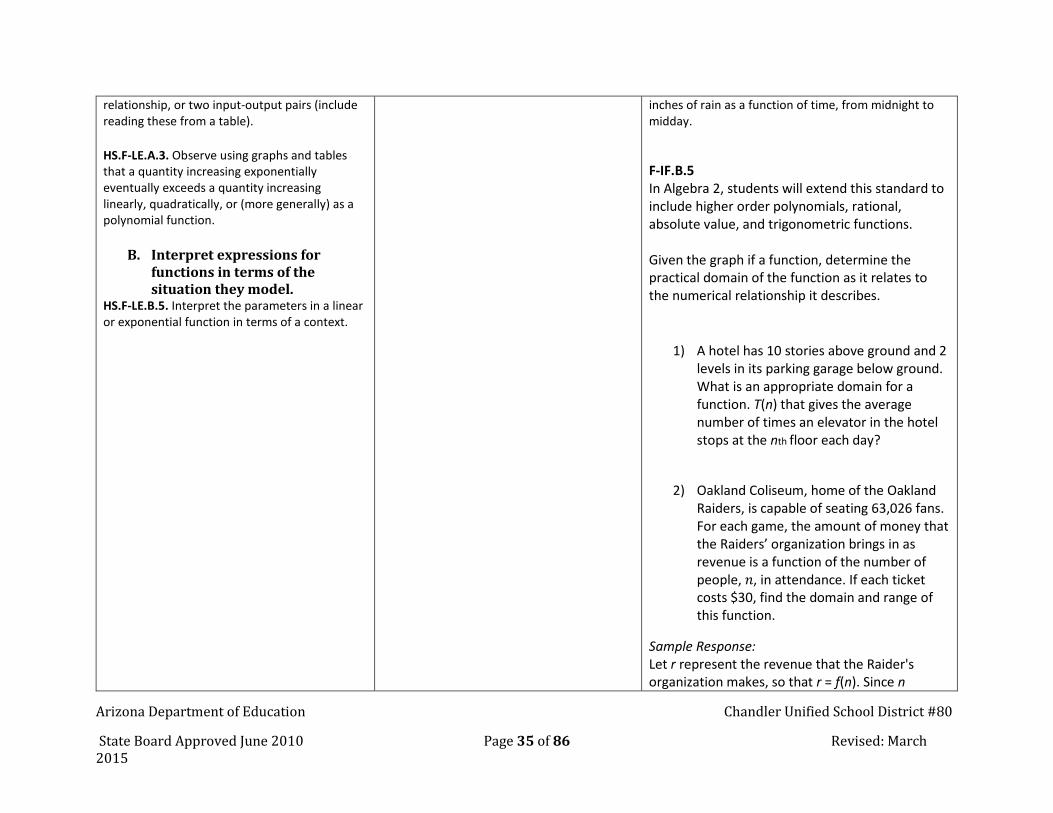
F-IF.B.5
In Algebra 2, students will extend this standard to
include higher order polynomials, rational,
absolute value, and trigonometric functions.
Given the graph if a function, determine the
practical domain of the function as it relates to
the numerical relationship it describes.
1) A hotel has 10 stories above ground and 2
levels in its parking garage below ground.
What is an appropriate domain for a
function. T(n) that gives the average
number of times an elevator in the hotel
stops at the nth floor each day?
2) Oakland Coliseum, home of the Oakland
Raiders, is capable of seating 63,026 fans.
For each game, the amount of money that
the Raiders’ organization brings in as
revenue is a function of the number of
people, �, in attendance. If each ticket
costs $30, find the domain and range of
this function.
Sample Response:
Let r represent the revenue that the Raider's
organization makes, so that r = f(n). Since n
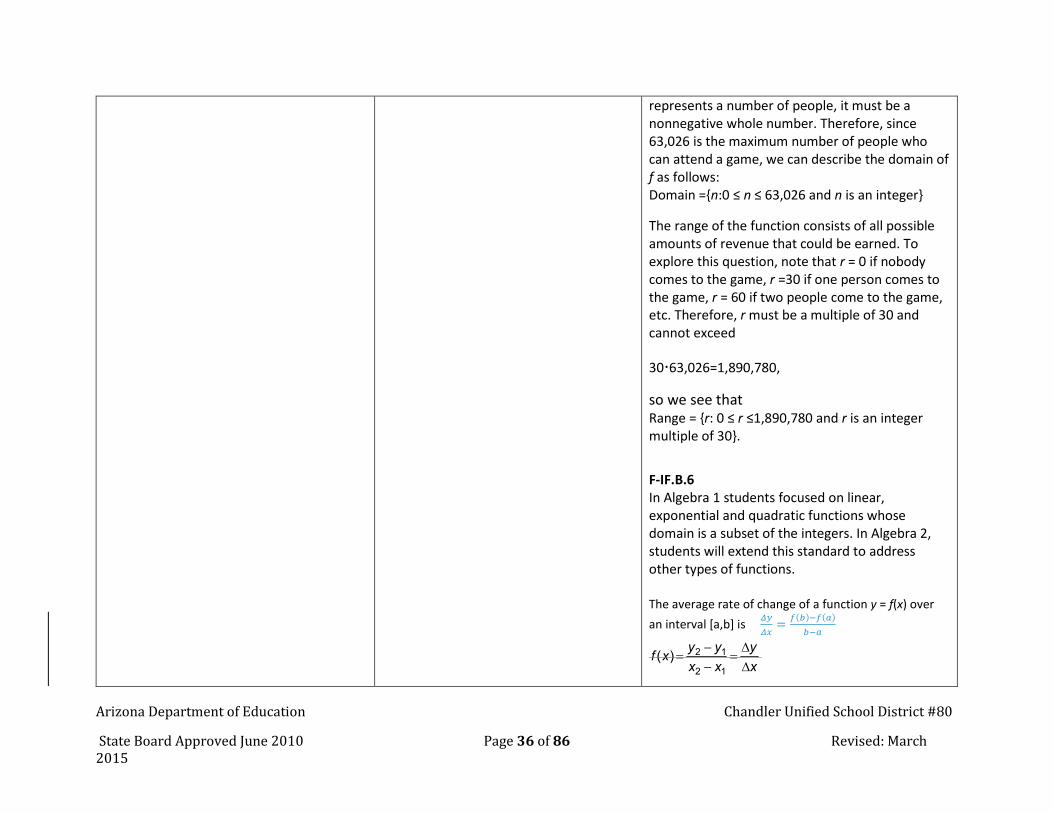
Arizona Department of Education Chandler Unified School District #80
State Board Approved June 2010 Page 36 of 86 Revised: March
2015
represents a number of people, it must be a
nonnegative whole number. Therefore, since
63,026 is the maximum number of people who
can attend a game, we can describe the domain of
f as follows:
Domain ={n:0 ≤ n ≤ 63,026 and n is an integer}
The range of the function consists of all possible
amounts of revenue that could be earned. To
explore this question, note that r = 0 if nobody
comes to the game, r =30 if one person comes to
the game, r = 60 if two people come to the game,
etc. Therefore, r must be a multiple of 30 and
cannot exceed
30⋅63,026=1,890,780,
so we see that Range = {r: 0 ≤ r ≤1,890,780 and r is an integer
multiple of 30}.
F-IF.B.6
In Algebra 1 students focused on linear,
exponential and quadratic functions whose
domain is a subset of the integers. In Algebra 2,
students will extend this standard to address
other types of functions.
The average rate of change of a function y = f(x) over
an interval [a,b] is ��
��=
� !"�� #"
!�#
x
y
xx
yyxf
∆
∆=
−
−=
12
12)(
Arizona Department of Education Chandler Unified School District #80
State Board Approved June 2010 Page 37 of 86 Revised: March
2015
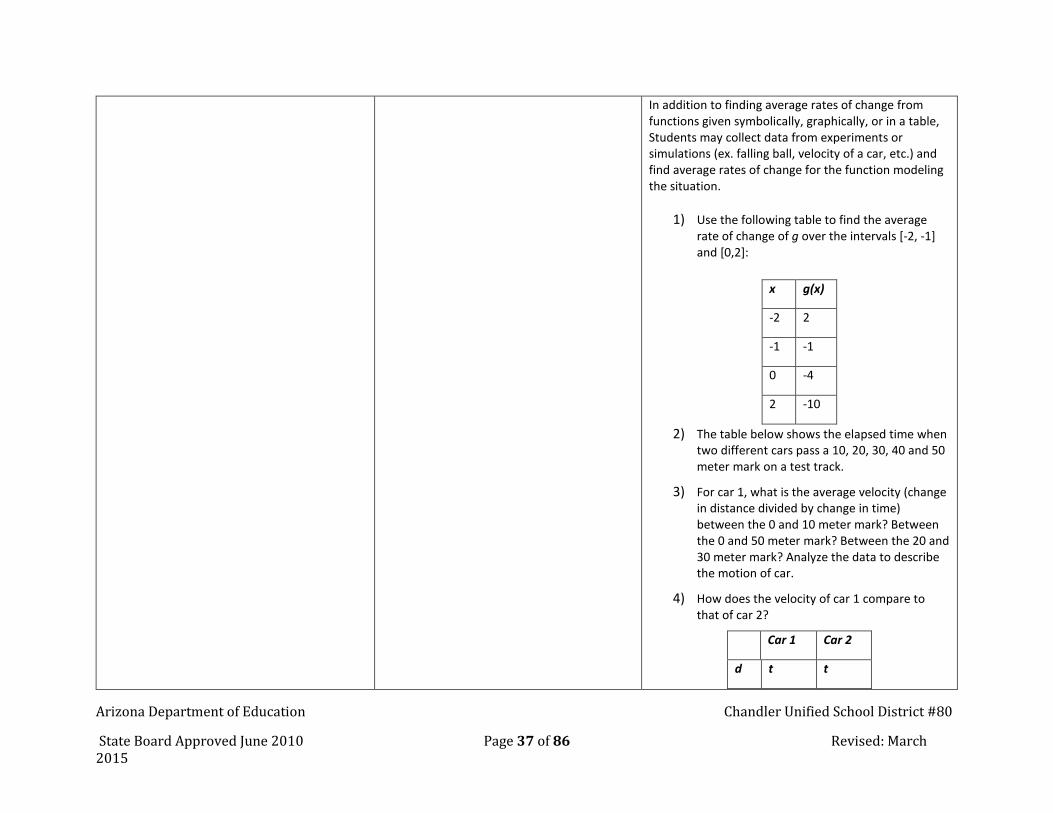
In addition to finding average rates of change from
functions given symbolically, graphically, or in a table,
Students may collect data from experiments or
simulations (ex. falling ball, velocity of a car, etc.) and
find average rates of change for the function modeling
the situation.
1) Use the following table to find the average
rate of change of g over the intervals [-2, -1]
and [0,2]:
x g(x)
-2 2
-1 -1
0 -4
2 -10
2) The table below shows the elapsed time when
two different cars pass a 10, 20, 30, 40 and 50
meter mark on a test track.
3) For car 1, what is the average velocity (change
in distance divided by change in time)
between the 0 and 10 meter mark? Between
the 0 and 50 meter mark? Between the 20 and
30 meter mark? Analyze the data to describe
the motion of car.
4) How does the velocity of car 1 compare to
that of car 2?
Car 1 Car 2
d t t
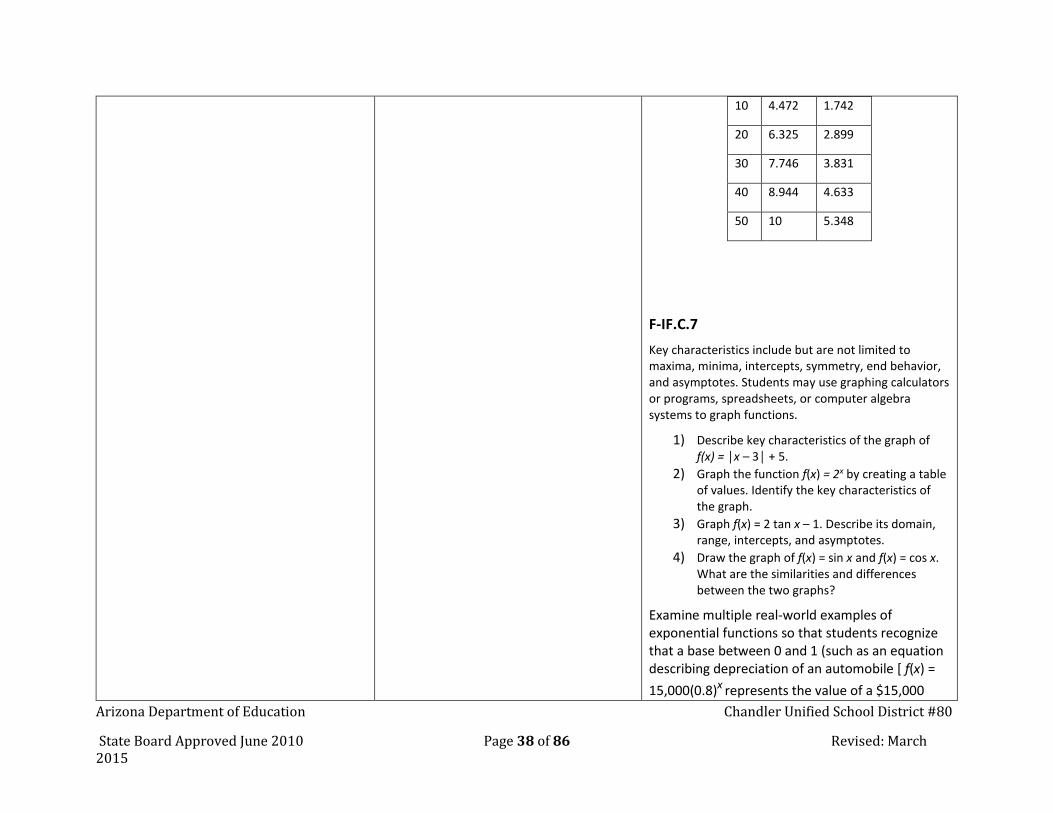
Arizona Department of Education Chandler Unified School District #80
State Board Approved June 2010 Page 38 of 86 Revised: March
2015
10 4.472 1.742
20 6.325 2.899
30 7.746 3.831
40 8.944 4.633
50 10 5.348
F-IF.C.7
Key characteristics include but are not limited to
maxima, minima, intercepts, symmetry, end behavior,
and asymptotes. Students may use graphing calculators
or programs, spreadsheets, or computer algebra
systems to graph functions.
1) Describe key characteristics of the graph of
f(x) = │x – 3│ + 5.
2) Graph the function f(x) = 2x by creating a table
of values. Identify the key characteristics of
the graph.
3) Graph f(x) = 2 tan x – 1. Describe its domain,
range, intercepts, and asymptotes.
4) Draw the graph of f(x) = sin x and f(x) = cos x.
What are the similarities and differences
between the two graphs?
Examine multiple real-world examples of
exponential functions so that students recognize
that a base between 0 and 1 (such as an equation
describing depreciation of an automobile [ f(x) =
15,000(0.8)x represents the value of a $15,000
Arizona Department of Education Chandler Unified School District #80
State Board Approved June 2010 Page 39 of 86 Revised: March
2015
automobile that depreciates 20% per year over
the course of x years]) results in an exponential
decay, while a base greater than 1 (such as the
value of an investment over time [ f(x) =
5,000(1.07)x represents the value of an
investment of $5,000 when increasing in value by
7% per year for x years]) illustrates growth.
Graphing utilities on a calculator and/or computer
can be used to demonstrate the changes in
behavior of a function as various parameters are
varied.
F-IF.C.8
In Algebra 1 focus on this standard was with linear,
exponential and quadratic functions. In Algebra 2
students will extend their work to focus on
applications and how key features relate to
characteristics of a situation making selection of a
particular type of function.
1) Write the following function in a different
form and explain what each form tells you
about the function:
� �" = �$ − 6�� + 3� + 10
2) An investment advisor provides you with 3
options for your investment.
Arizona Department of Education Chandler Unified School District #80
State Board Approved June 2010 Page 40 of 86 Revised: March
2015
a. Investment A’s future value can be
calculated based on the following
function:
� �" = � .97"' , where � represents the amount of
the initial investment and � represents the number of
years since the original investment was made.
b. Investment B’s future value can be
calculated based on the following
function:
� �" = � 1.02"�', where � represents the amount of
the initial investment and � represents the number of
years since the original investment was made.
c. Investment C’s future value can be
calculated based on the following
function:
ℎ �" = � 1.01").�', where � represents the amount of
the initial investment and � represents the number of
years since the original investment was made.
Determine the annual growth rate for each investment
option and the compounding period. Explain which
investment option would maximize the value of your
investment 5 years after your initial investment.
Provide mathematical evidence to support your choice.
3) The projected population of Delroysville is
given by the formula (�) = 1500(1.08). You
have been selected by the city council to
help them plan for future growth. Explain
what the formula (�) = 1500(1.08)means
to the city council members.
Arizona Department of Education Chandler Unified School District #80
State Board Approved June 2010 Page 41 of 86 Revised: March
2015
4) Which of the following functions will
represent $500 placed into a mutual fund
yielding 10% per year for 4 years
a. * = 500(.10)4
b. * = 500(1.1)4
c. * = 500(4)(.10) d. * = 500(1.04)10
F-IF.C.9
Focus in Algebra 1 was on linear, exponential and
quadratic functions. In Algebra 2, tasks will involve
polynomial, exponential, logarithmic, and
trigonometric functions.
1) Consider the two functions below. Which has
the larger maximum? How do you know?
� �" = −�+ − 4�$ + �� + 16� + 12
Arizona Department of Education Chandler Unified School District #80
State Board Approved June 2010 Page 42 of 86 Revised: March
2015
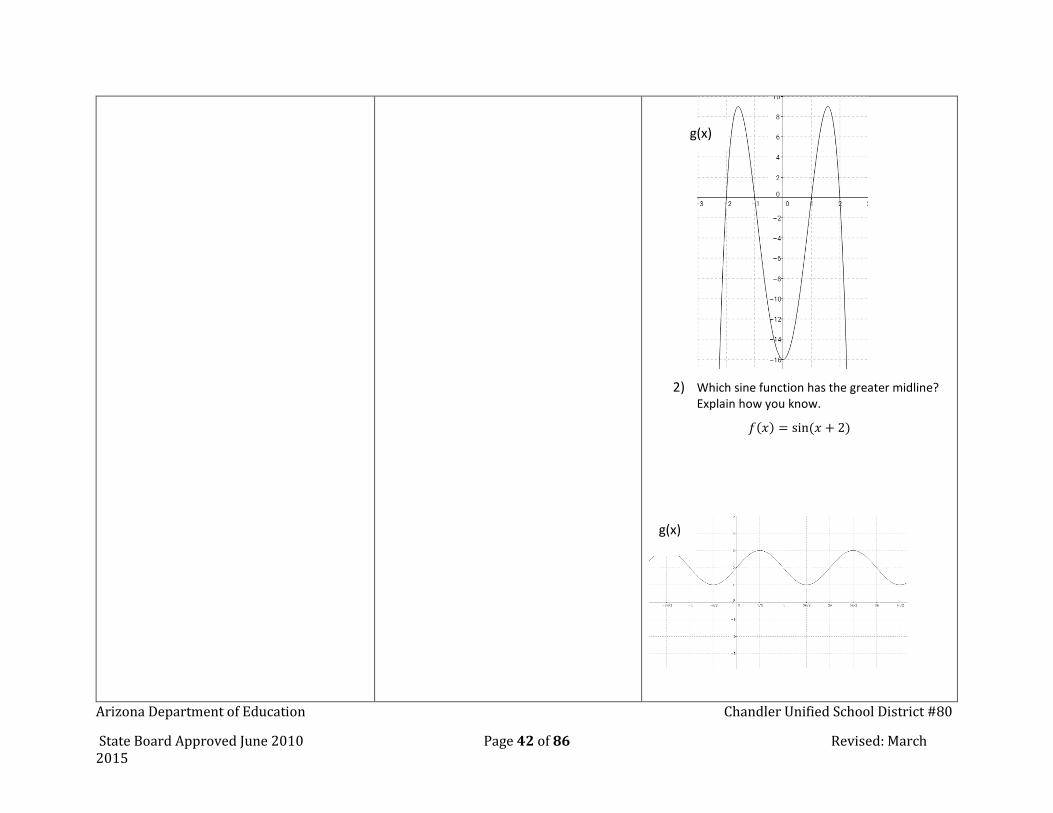
2) Which sine function has the greater midline?
Explain how you know.
� �" = sin � + 2"
g(x)
g(x)
Arizona Department of Education Chandler Unified School District #80
State Board Approved June 2010 Page 43 of 86 Revised: March
2015
F-BF.A.1
From context, write an explicit expression, define
a recursive process, or describe the calculations
need to model a function between tow quantities. 1) You buy a $10,000 car with an annual interest
rate of 6 percent compounded annually and
make monthly payments of $250. Express the
amount remaining to be paid off as a function
of the number of months, using a recursion
equation.
2) A cup of coffee is initially at a temperature of
93º F. The difference between its temperature
and the room temperature of 68º F decreases
by 9% each minute. Write a function
describing the temperature of the coffee as a
function of time.
3) The radius of a circular oil slick after t hours is
given in feet by � = 10�� − 0.5�, for 0 ≤ t ≤
10. Find the area of the oil slick as a function
of time.
F-BF.A.2
An explicit rule for the nth term of a sequence gives an
as an expression in the term’s position n; a recursive
rule gives the first term of a sequence, and a recursive
equation relates an to the preceding term(s). Both
methods of presenting a sequence describe an as a
function of n.
Arizona Department of Education Chandler Unified School District #80
State Board Approved June 2010 Page 44 of 86 Revised: March
2015
1) Generate the 5th-11th terms of a sequence if
A1= 2 and 1)( 2)1( −=+ nn AA
2) Use the formula: An= A1 + d(n - 1) where d is
the common difference to generate a
sequence whose first three terms are: -7, -4,
and -1.
3) There are 2,500 fish in a pond. Each year the
population decreases by 25 percent, but 1,000
fish are added to the pond at the end of the
year. Find the population in five years. Also,
find the long-term population.
4) Given the formula An= 2n - 1, find the 17th
term of the sequence. What is the 9th term in
the sequence 3, 5, 7, 9, …?
5) Given a1 = 4 and an = an-1 + 3, write the explicit
formula.
F-BF.B.4
Focus on linear functions but consider simple
situations where the domain of the functions
must be restricted in order for the invers to exist,
such as f(x) = x2, x 0. This work will be extended
in Algebra 2 to include simple rational, simple
radical and simple exponential functions.
1) For the function h(x) = (x – 2)3, defined on the
domain of all real numbers, find the inverse
function if it exists or explain why it doesn’t
exist. 2) Graph h(x) and h-1(x) and explain how they
relate to each other graphically.
Arizona Department of Education Chandler Unified School District #80
State Board Approved June 2010 Page 45 of 86 Revised: March
2015
3) Find a domain for f(x) = 3x2 + 12x - 8 on which
it has an inverse. Explain why it is necessary to
restrict the domain of the function.
F-LE.A.1
• A couple wants to buy a house in five years.
They need to save a down payment of $8,000.
They deposit $1,000 in a bank account earning
3.25% interest, compounded quarterly. How
much will they need to save each month in
order to meet their goal?
• Sketch and analyze the graphs of the following
two situations. What information can you
conclude about the types of growth each type
of interest has?
o Lee borrows $9,000 from his mother to
buy a car. His mom charges him 5%
interest a year, but she does not
compound the interest.
o Lee borrows $9,000 from a bank to buy a
car. The bank charges 5% interest
compounded annually.
• Calculate the future value of a given amount of
money, with and without technology.
• Calculate the present value of a certain amount
of money for a given length of time in the future,
with and without technology.
F-LE.A.2
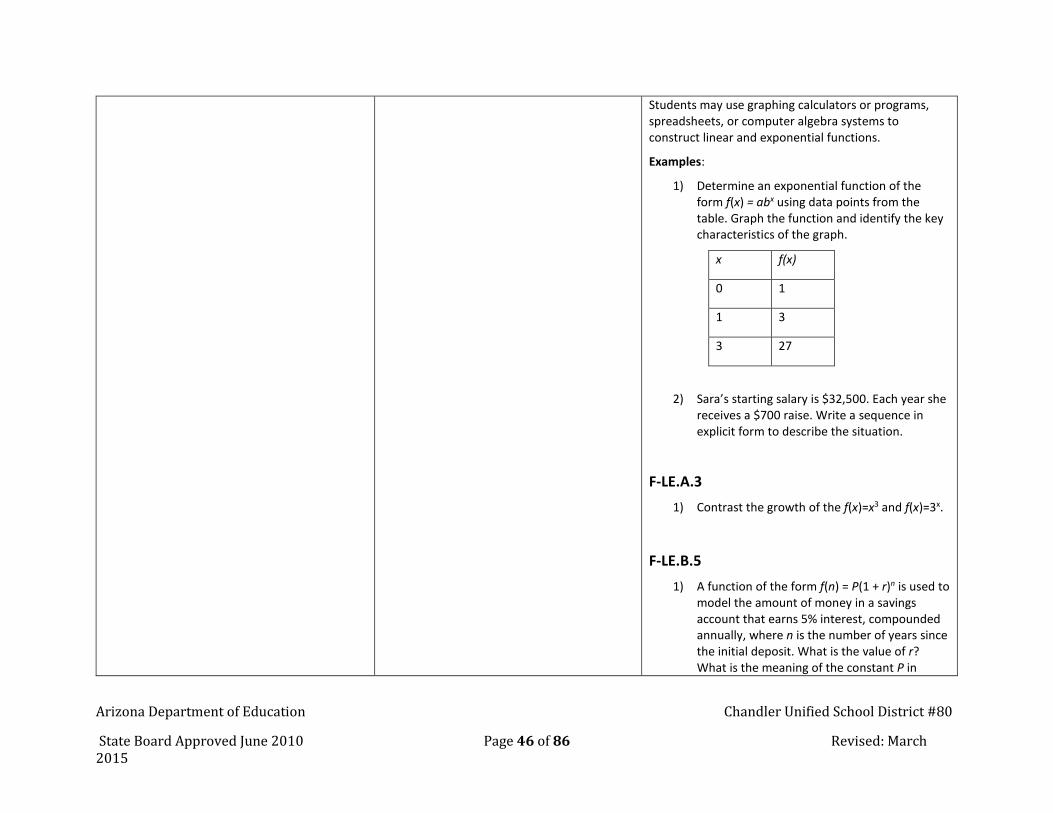
Arizona Department of Education Chandler Unified School District #80
State Board Approved June 2010 Page 46 of 86 Revised: March
2015
Students may use graphing calculators or programs,
spreadsheets, or computer algebra systems to
construct linear and exponential functions.
Examples:
1) Determine an exponential function of the
form f(x) = abx using data points from the
table. Graph the function and identify the key
characteristics of the graph.
x f(x)
0 1
1 3
3 27
2) Sara’s starting salary is $32,500. Each year she
receives a $700 raise. Write a sequence in
explicit form to describe the situation.
F-LE.A.3
1) Contrast the growth of the f(x)=x3 and f(x)=3x.
F-LE.B.5
1) A function of the form f(n) = P(1 + r)n is used to
model the amount of money in a savings
account that earns 5% interest, compounded
annually, where n is the number of years since
the initial deposit. What is the value of r?
What is the meaning of the constant P in
Arizona Department of Education Chandler Unified School District #80
State Board Approved June 2010 Page 47 of 86 Revised: March
2015
terms of the savings account? Explain either
orally or in written format.
Number and Quantity: Quantities ���� (N-Q)
A. Reasonqualitativelyanduse
unitstosolveproblems.
HS.N-Q.A.2. Define appropriate quantities for
the purpose of descriptive modeling.
Algebra: Creating Equations ���� (A-CED)
A. Createequationsthatdescribe
numbersorrelationships. HS.A-CED.A.1. Create equations and inequalities
in one variable and use them to solve problems.
Include equations arising from linear and
quadratic functions, and simple rational and
exponential functions.
Algebra: Reasoning with Equations and
Inequalities ���� (A-REI)
A. Understandsolvingequations
asaprocessofreasoningand
explainthereasoning. HS.A-REI.A.1. Explain each step in solving a
simple equation as following from the equality
of numbers asserted at the previous step,
starting from the assumption that the original
equation has a solution. Construct a viable
argument to justify a solution method.
Arizona Department of Education Chandler Unified School District #80
State Board Approved June 2010 Page 48 of 86 Revised: March
2015
D. Representandsolveequations
andinequalitiesgraphically. HS.A-REI.D.11. Explain why the x-coordinates of
the points where the graphs of the equations
y = f(x) and y = g(x) intersect are the solutions of
the equation
f(x) = g(x); find the solutions approximately,
e.g., using technology to graph the functions,
make tables of values, or find successive
approximations. Include cases where f(x) and/or
g(x) are linear, polynomial, rational, absolute
value, exponential, and logarithmic functions.
Algebra: Seeing Structure in
Expressions (A-SSE)
A. Interpretthestructureof
expressions.
HS.A-SSE.A.2. Use the structure of an expression
to identify ways to rewrite it. For example,
see x4 – y4 as (x2)2 – (y2)2, thus recognizing it as a
difference of squares that can be factored as
(x2 – y2)(x2 + y2).
B. Writeexpressionsinequivalent
formstosolveproblems.
HS.A-SSE.B.3. Choose and produce an
equivalent form of an expression to reveal and
explain properties of the quantity represented
by the expression.
Arizona Department of Education Chandler Unified School District #80
State Board Approved June 2010 Page 49 of 86 Revised: March
2015
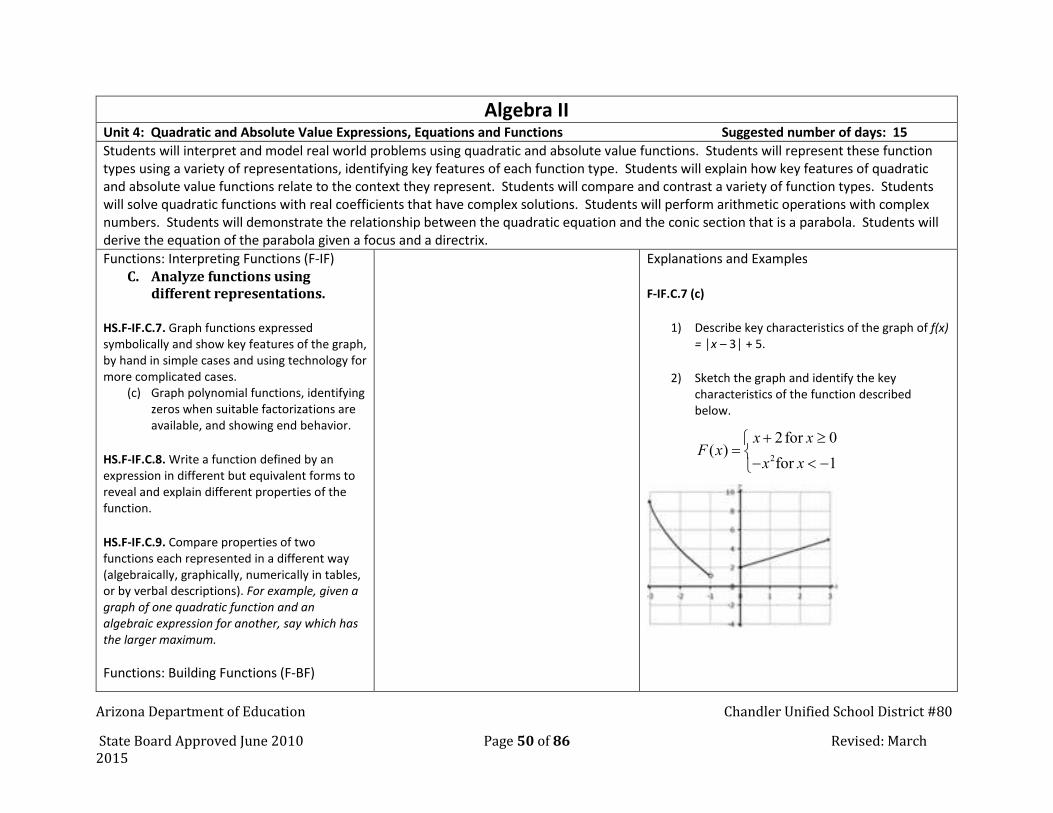
Arizona Department of Education Chandler Unified School District #80
State Board Approved June 2010 Page 50 of 86 Revised: March
2015
Algebra II
Unit 4: Quadratic and Absolute Value Expressions, Equations and Functions Suggested number of days: 15
Students will interpret and model real world problems using quadratic and absolute value functions. Students will represent these function
types using a variety of representations, identifying key features of each function type. Students will explain how key features of quadratic
and absolute value functions relate to the context they represent. Students will compare and contrast a variety of function types. Students
will solve quadratic functions with real coefficients that have complex solutions. Students will perform arithmetic operations with complex
numbers. Students will demonstrate the relationship between the quadratic equation and the conic section that is a parabola. Students will
derive the equation of the parabola given a focus and a directrix.
Functions: Interpreting Functions (F-IF)
C. Analyzefunctionsusing
differentrepresentations.
HS.F-IF.C.7. Graph functions expressed
symbolically and show key features of the graph,
by hand in simple cases and using technology for
more complicated cases.
(c) Graph polynomial functions, identifying
zeros when suitable factorizations are
available, and showing end behavior. HS.F-IF.C.8. Write a function defined by an
expression in different but equivalent forms to
reveal and explain different properties of the
function.
HS.F-IF.C.9. Compare properties of two
functions each represented in a different way
(algebraically, graphically, numerically in tables,
or by verbal descriptions). For example, given a
graph of one quadratic function and an
algebraic expression for another, say which has
the larger maximum.
Functions: Building Functions (F-BF)
Explanations and Examples
F-IF.C.7 (c)
1) Describe key characteristics of the graph of f(x)
= │x – 3│ + 5.
2) Sketch the graph and identify the key
characteristics of the function described
below.
2
2for 0( )
for 1
x xF x
x x
+ ≥=
− < −
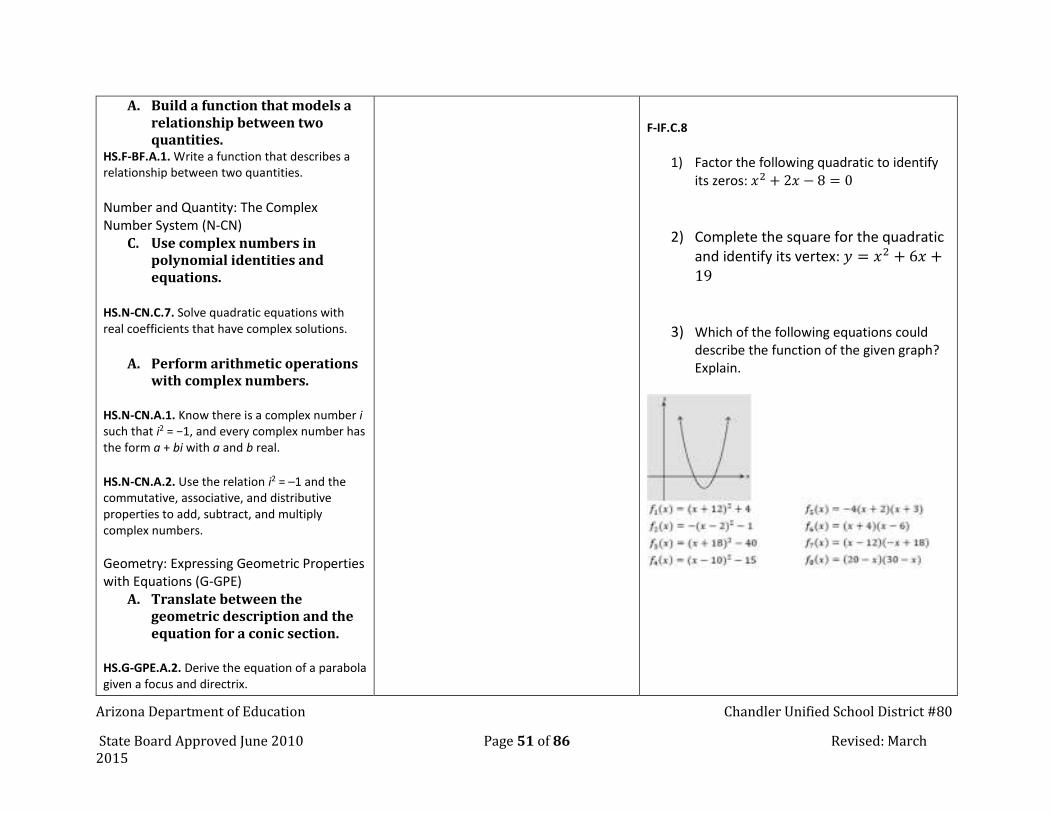
Arizona Department of Education Chandler Unified School District #80
State Board Approved June 2010 Page 51 of 86 Revised: March
2015
A. Buildafunctionthatmodelsa
relationshipbetweentwo
quantities. HS.F-BF.A.1. Write a function that describes a
relationship between two quantities.
Number and Quantity: The Complex
Number System (N-CN)
C. Usecomplexnumbersin
polynomialidentitiesand
equations.
HS.N-CN.C.7. Solve quadratic equations with
real coefficients that have complex solutions.
A. Performarithmeticoperations
withcomplexnumbers.
HS.N-CN.A.1. Know there is a complex number i
such that i2 = −1, and every complex number has
the form a + bi with a and b real.
HS.N-CN.A.2. Use the relation i2 = –1 and the
commutative, associative, and distributive
properties to add, subtract, and multiply
complex numbers.
Geometry: Expressing Geometric Properties
with Equations (G-GPE)
A. Translatebetweenthe
geometricdescriptionandthe
equationforaconicsection.
HS.G-GPE.A.2. Derive the equation of a parabola
given a focus and directrix.
F-IF.C.8
1) Factor the following quadratic to identify
its zeros: �� + 2� − 8 = 0
2) Complete the square for the quadratic
and identify its vertex: / = �� + 6� +19
3) Which of the following equations could
describe the function of the given graph?
Explain.
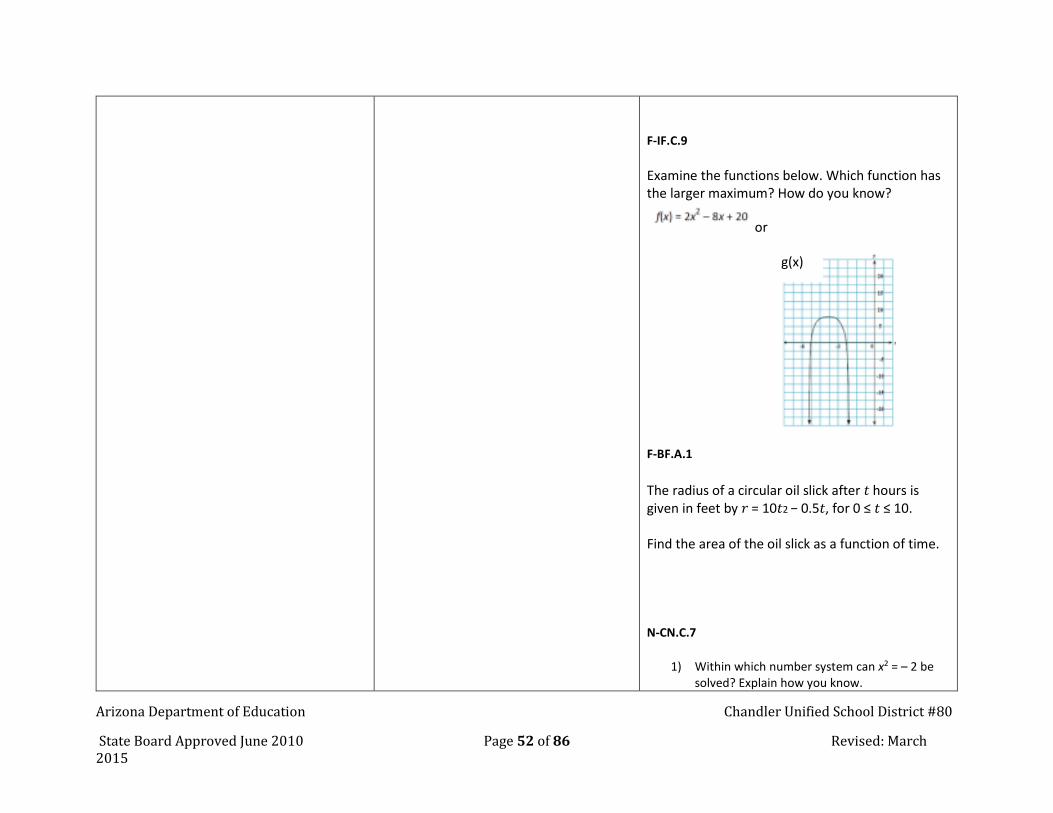
Arizona Department of Education Chandler Unified School District #80
State Board Approved June 2010 Page 52 of 86 Revised: March
2015
F-IF.C.9
Examine the functions below. Which function has
the larger maximum? How do you know?
or
F-BF.A.1
The radius of a circular oil slick after �hours is
given in feet by �= 10�2 − 0.5�, for 0 ≤ �≤ 10.
Find the area of the oil slick as a function of time.
N-CN.C.7
1) Within which number system can x2 = – 2 be
solved? Explain how you know.
g(x)
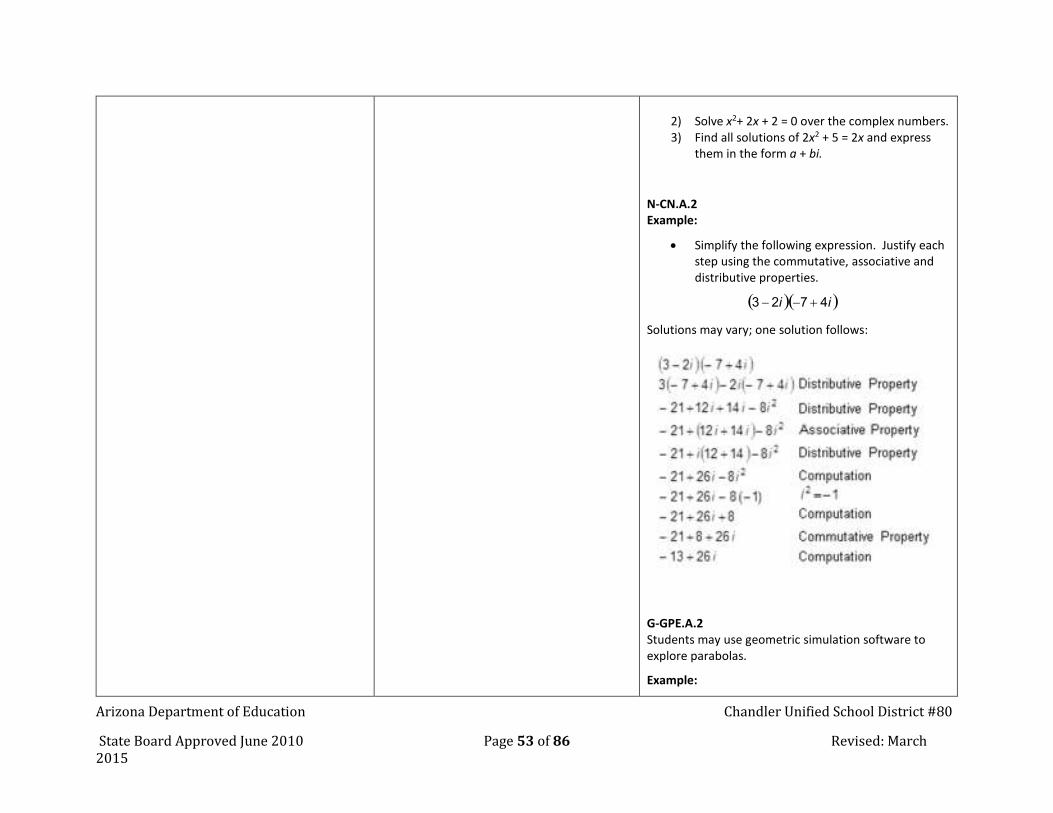
Arizona Department of Education Chandler Unified School District #80
State Board Approved June 2010 Page 53 of 86 Revised: March
2015
2) Solve x2+ 2x + 2 = 0 over the complex numbers.
3) Find all solutions of 2x2 + 5 = 2x and express
them in the form a + bi.
N-CN.A.2
Example:
• Simplify the following expression. Justify each
step using the commutative, associative and
distributive properties.
( )( )ii 4723 +−−
Solutions may vary; one solution follows:
G-GPE.A.2
Students may use geometric simulation software to
explore parabolas.
Example:
Arizona Department of Education Chandler Unified School District #80
State Board Approved June 2010 Page 54 of 86 Revised: March
2015
Write and graph an equation for a parabola with focus
(2, 3) and directrix y = 1.
Number and Quantity: Quantities ���� (N-Q)
A. Reasonqualitativelyanduse
unitstosolveproblems.
HS.N-Q.A.2. Define appropriate quantities for
the purpose of descriptive modeling.
Algebra: Creating Equations ���� (A-CED)
A. Createequationsthatdescribe
numbersorrelationships. HS.A-CED.A.1. Create equations and inequalities
in one variable and use them to solve problems.
Include equations arising from linear and
quadratic functions, and simple rational and
exponential functions.
Algebra: Reasoning with Equations and
Inequalities ���� (A-REI)
A. Understandsolvingequations
asaprocessofreasoningand
explainthereasoning. HS.A-REI.A.1. Explain each step in solving a
simple equation as following from the equality
of numbers asserted at the previous step,
starting from the assumption that the original
equation has a solution. Construct a viable
argument to justify a solution method.
Arizona Department of Education Chandler Unified School District #80
State Board Approved June 2010 Page 55 of 86 Revised: March
2015
HS.A-REI.A.2. Solve simple rational and radical
equations in one variable, and give examples
showing how extraneous solutions may arise.
B. Solveequationsand
inequalitiesinonevariable.
HS.A-REI.B.4. Solve quadratic equations in one
variable.
b. Solve quadratic equations by inspection (e.g.,
for x2 = 49), taking square roots, completing the
square, the quadratic formula and factoring, as
appropriate to the initial form of the equation.
Recognize when the quadratic formula gives
complex solutions and write them as a ± bi for
real numbers a and b.
D. Representandsolveequationsandinequalitiesgraphically.
HS.A-REI.D.11. Explain why the x-coordinates of
the points where the graphs of the equations
y = f(x) and y = g(x) intersect are the solutions of
the equation
f(x) = g(x); find the solutions approximately,
e.g., using technology to graph the functions,
make tables of values, or find successive
approximations. Include cases where f(x) and/or
g(x) are linear, polynomial, rational, absolute
value, exponential, and logarithmic functions.
Algebra: Seeing Structure in
Expressions (A-SSE)
A. Interpretthestructureofexpressions.
Arizona Department of Education Chandler Unified School District #80
State Board Approved June 2010 Page 56 of 86 Revised: March
2015
HS.A-SSE.A.2. Use the structure of an expression
to identify ways to rewrite it. For example,
see x4 – y4 as (x2)2 – (y2)2, thus recognizing it as a
difference of squares that can be factored as
(x2 – y2)(x2 + y2).
B. Writeexpressionsinequivalent
formstosolveproblems.
HS.A-SSE.B.3. Choose and produce an
equivalent form of an expression to reveal and
explain properties of the quantity represented
by the expression.
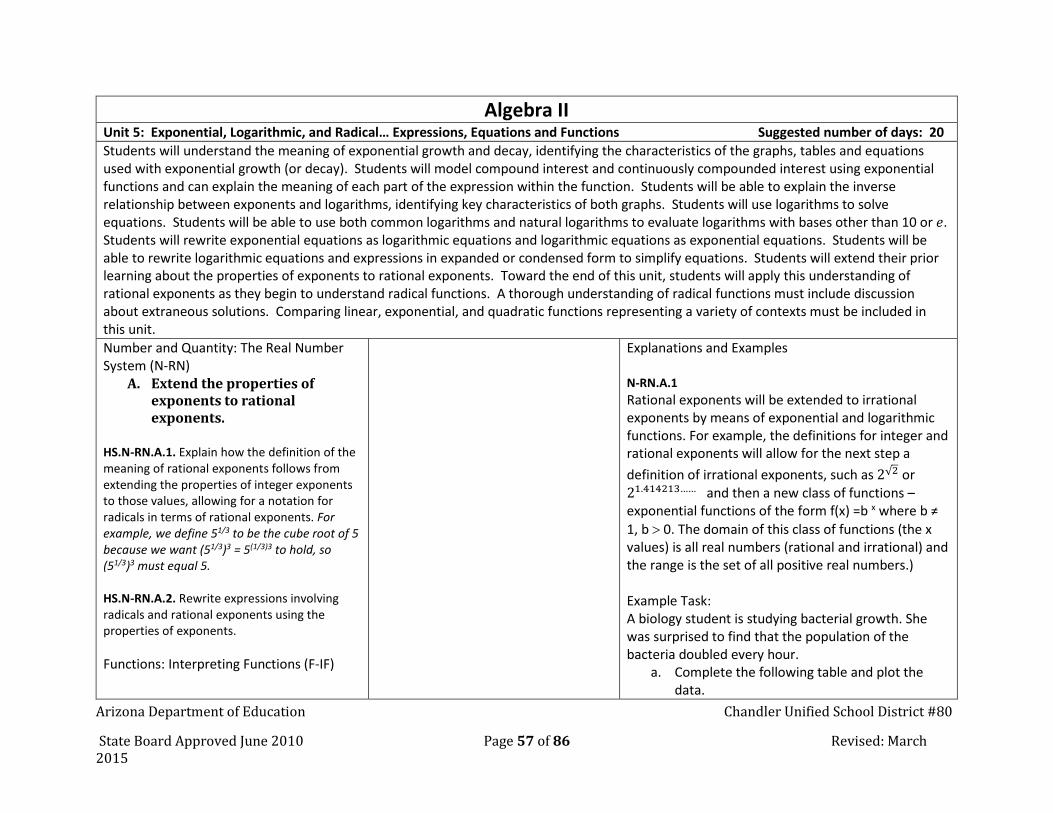
Arizona Department of Education Chandler Unified School District #80
State Board Approved June 2010 Page 57 of 86 Revised: March
2015
Algebra II
Unit 5: Exponential, Logarithmic, and Radical… Expressions, Equations and Functions Suggested number of days: 20
Students will understand the meaning of exponential growth and decay, identifying the characteristics of the graphs, tables and equations
used with exponential growth (or decay). Students will model compound interest and continuously compounded interest using exponential
functions and can explain the meaning of each part of the expression within the function. Students will be able to explain the inverse
relationship between exponents and logarithms, identifying key characteristics of both graphs. Students will use logarithms to solve
equations. Students will be able to use both common logarithms and natural logarithms to evaluate logarithms with bases other than 10 or 0.
Students will rewrite exponential equations as logarithmic equations and logarithmic equations as exponential equations. Students will be
able to rewrite logarithmic equations and expressions in expanded or condensed form to simplify equations. Students will extend their prior
learning about the properties of exponents to rational exponents. Toward the end of this unit, students will apply this understanding of
rational exponents as they begin to understand radical functions. A thorough understanding of radical functions must include discussion
about extraneous solutions. Comparing linear, exponential, and quadratic functions representing a variety of contexts must be included in
this unit.
Number and Quantity: The Real Number
System (N-RN)
A. Extendthepropertiesofexponentstorational
exponents. HS.N-RN.A.1. Explain how the definition of the
meaning of rational exponents follows from
extending the properties of integer exponents
to those values, allowing for a notation for
radicals in terms of rational exponents. For
example, we define 51/3 to be the cube root of 5
because we want (51/3)3 = 5(1/3)3 to hold, so
(51/3)3 must equal 5.
HS.N-RN.A.2. Rewrite expressions involving
radicals and rational exponents using the
properties of exponents.
Functions: Interpreting Functions (F-IF)
Explanations and Examples
N-RN.A.1
Rational exponents will be extended to irrational
exponents by means of exponential and logarithmic
functions. For example, the definitions for integer and
rational exponents will allow for the next step a
definition of irrational exponents, such as 2√� or
21.+1+�1$…… and then a new class of functions –
exponential functions of the form f(x) =b x where b ≠
1, b > 0. The domain of this class of functions (the x
values) is all real numbers (rational and irrational) and
the range is the set of all positive real numbers.)
Example Task:
A biology student is studying bacterial growth. She
was surprised to find that the population of the
bacteria doubled every hour.
a. Complete the following table and plot the
data.
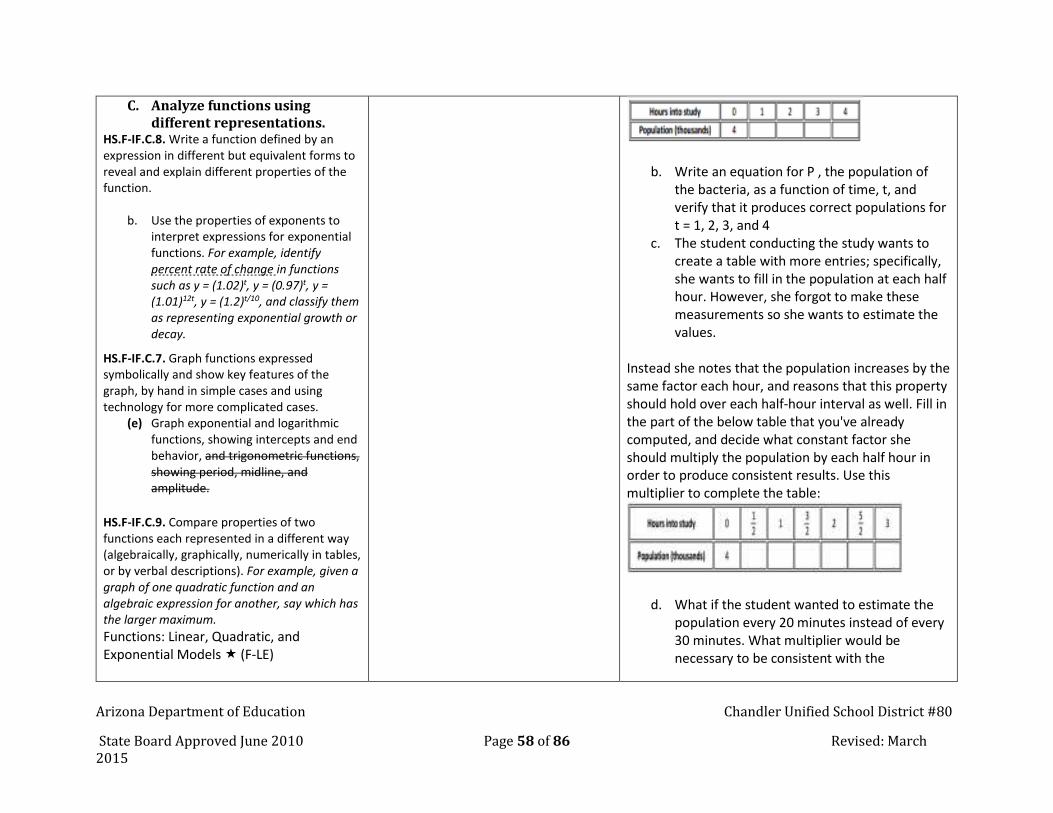
Arizona Department of Education Chandler Unified School District #80
State Board Approved June 2010 Page 58 of 86 Revised: March
2015
C. Analyzefunctionsusing
differentrepresentations.HS.F-IF.C.8. Write a function defined by an
expression in different but equivalent forms to
reveal and explain different properties of the
function.
b. Use the properties of exponents to
interpret expressions for exponential
functions. For example, identify
percent rate of change in functions
such as y = (1.02)t, y = (0.97)t, y =
(1.01)12t, y = (1.2)t/10, and classify them
as representing exponential growth or
decay.
HS.F-IF.C.7. Graph functions expressed
symbolically and show key features of the
graph, by hand in simple cases and using
technology for more complicated cases.
(e) Graph exponential and logarithmic
functions, showing intercepts and end
behavior, and trigonometric functions,
showing period, midline, and
amplitude.
HS.F-IF.C.9. Compare properties of two
functions each represented in a different way
(algebraically, graphically, numerically in tables,
or by verbal descriptions). For example, given a
graph of one quadratic function and an
algebraic expression for another, say which has
the larger maximum. Functions: Linear, Quadratic, and
Exponential Models � (F-LE)
b. Write an equation for P , the population of
the bacteria, as a function of time, t, and
verify that it produces correct populations for
t = 1, 2, 3, and 4
c. The student conducting the study wants to
create a table with more entries; specifically,
she wants to fill in the population at each half
hour. However, she forgot to make these
measurements so she wants to estimate the
values.
Instead she notes that the population increases by the
same factor each hour, and reasons that this property
should hold over each half-hour interval as well. Fill in
the part of the below table that you've already
computed, and decide what constant factor she
should multiply the population by each half hour in
order to produce consistent results. Use this
multiplier to complete the table:
d. What if the student wanted to estimate the
population every 20 minutes instead of every
30 minutes. What multiplier would be
necessary to be consistent with the
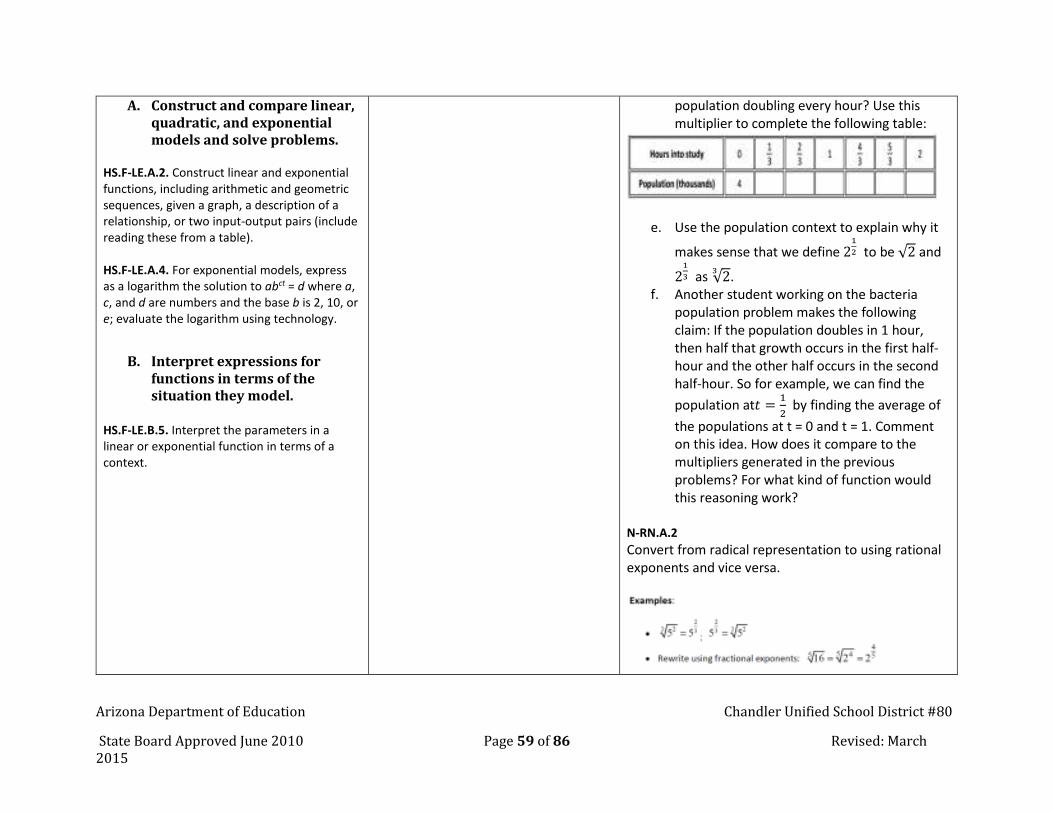
Arizona Department of Education Chandler Unified School District #80
State Board Approved June 2010 Page 59 of 86 Revised: March
2015
A. Constructandcomparelinear,
quadratic,andexponential
modelsandsolveproblems.
HS.F-LE.A.2. Construct linear and exponential
functions, including arithmetic and geometric
sequences, given a graph, a description of a
relationship, or two input-output pairs (include
reading these from a table).
HS.F-LE.A.4. For exponential models, express
as a logarithm the solution to abct = d where a,
c, and d are numbers and the base b is 2, 10, or
e; evaluate the logarithm using technology.
B. Interpretexpressionsfor
functionsintermsofthe
situationtheymodel. HS.F-LE.B.5. Interpret the parameters in a
linear or exponential function in terms of a
context.
population doubling every hour? Use this
multiplier to complete the following table:
e. Use the population context to explain why it
makes sense that we define 234 to be √2 and
235 as √25
.
f. Another student working on the bacteria
population problem makes the following
claim: If the population doubles in 1 hour,
then half that growth occurs in the first half-
hour and the other half occurs in the second
half-hour. So for example, we can find the
population at� =1
� by finding the average of
the populations at t = 0 and t = 1. Comment
on this idea. How does it compare to the
multipliers generated in the previous
problems? For what kind of function would
this reasoning work?
N-RN.A.2
Convert from radical representation to using rational
exponents and vice versa.
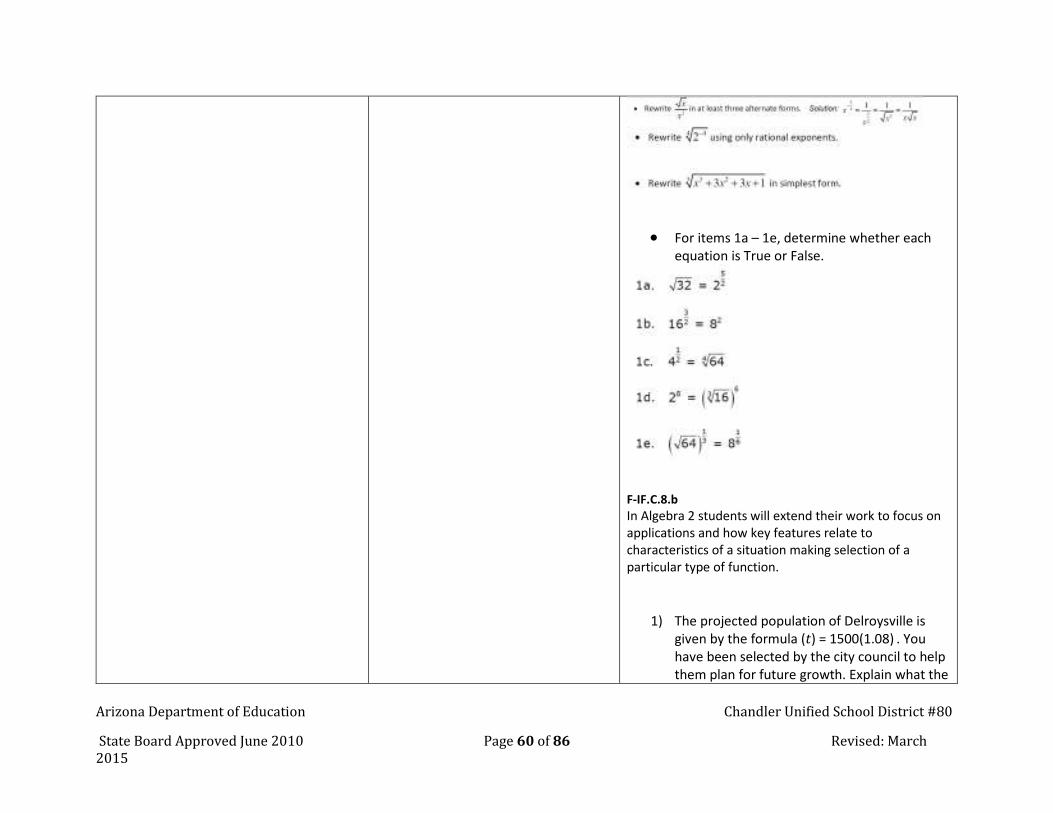
Arizona Department of Education Chandler Unified School District #80
State Board Approved June 2010 Page 60 of 86 Revised: March
2015
• For items 1a – 1e, determine whether each
equation is True or False.
F-IF.C.8.b
In Algebra 2 students will extend their work to focus on
applications and how key features relate to
characteristics of a situation making selection of a
particular type of function.
1) The projected population of Delroysville is
given by the formula (�) = 1500(1.08). You
have been selected by the city council to help
them plan for future growth. Explain what the

Arizona Department of Education Chandler Unified School District #80
State Board Approved June 2010 Page 61 of 86 Revised: March
2015
formula (�) = 1500(1.08)means to the city
council members.
2) Which of the following functions will
represent $500 placed into a mutual fund
yielding 10% per year for 4 years
F-IF.C.7.e
Key characteristics include but are not limited to
maxima, minima, intercepts, symmetry, end behavior,
and asymptotes. Students may use graphing
calculators or programs, spreadsheets, or computer
algebra systems to graph functions.
Examine multiple real-world examples of exponential
functions so that students recognize that a base
between 0 and 1 (such as an equation describing
depreciation of an automobile [ f(x) = 15,000(0.8)x
represents the value of a $15,000 automobile that
depreciates 20% per year over the course of x years])
results in an exponential decay, while a base greater
than 1 (such as the value of an investment over time [
f(x) = 5,000(1.07)x represents the value of an
investment of $5,000 when increasing in value by 7%
per year for x years]) illustrates growth.
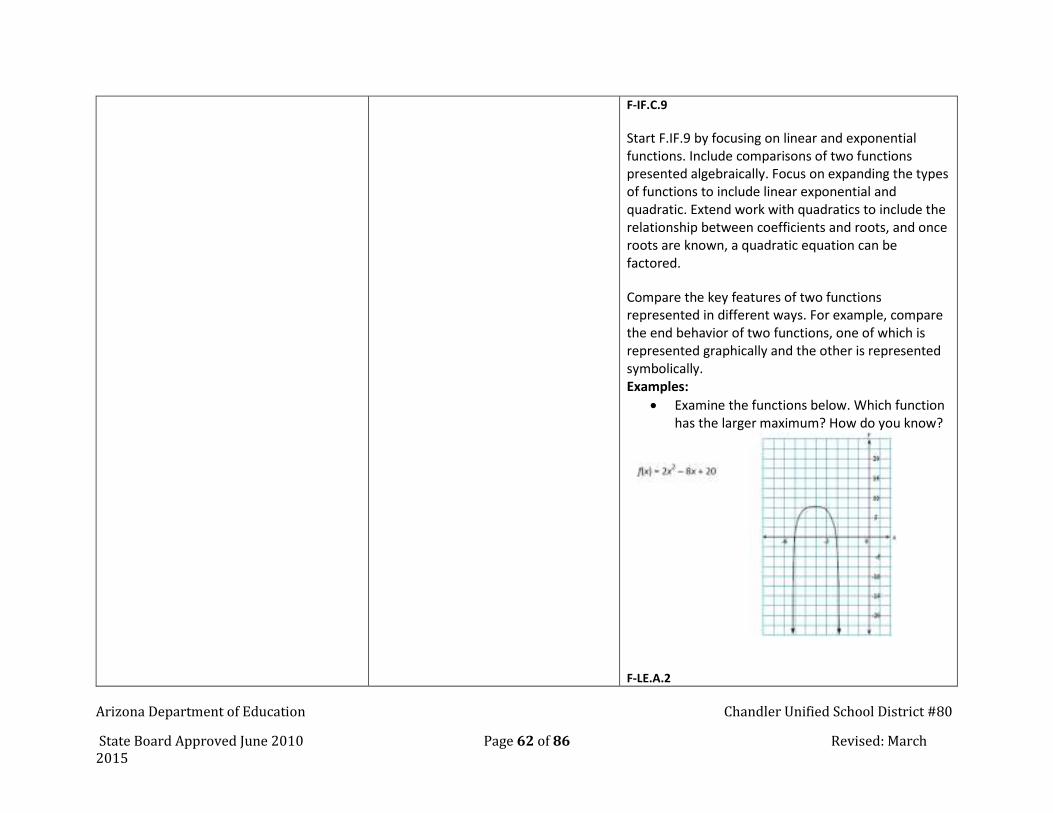
Arizona Department of Education Chandler Unified School District #80
State Board Approved June 2010 Page 62 of 86 Revised: March
2015
F-IF.C.9
Start F.IF.9 by focusing on linear and exponential
functions. Include comparisons of two functions
presented algebraically. Focus on expanding the types
of functions to include linear exponential and
quadratic. Extend work with quadratics to include the
relationship between coefficients and roots, and once
roots are known, a quadratic equation can be
factored.
Compare the key features of two functions
represented in different ways. For example, compare
the end behavior of two functions, one of which is
represented graphically and the other is represented
symbolically.
Examples:
• Examine the functions below. Which function
has the larger maximum? How do you know?
F-LE.A.2
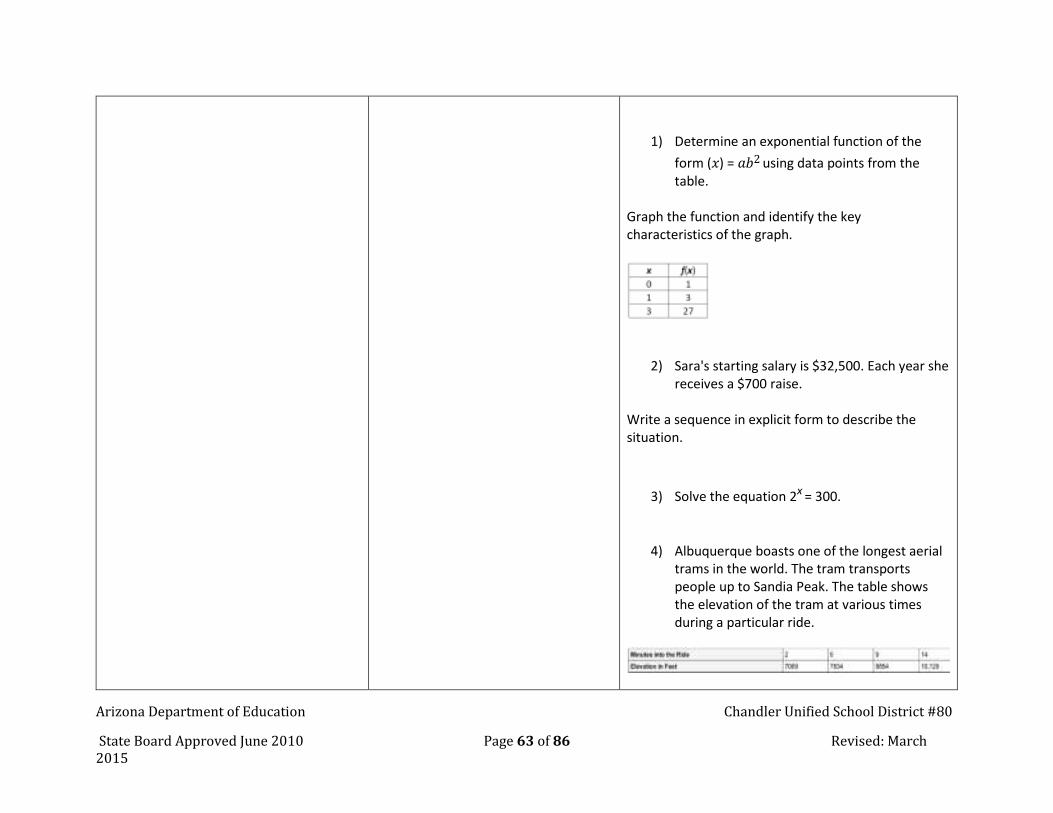
Arizona Department of Education Chandler Unified School District #80
State Board Approved June 2010 Page 63 of 86 Revised: March
2015
1) Determine an exponential function of the
form (�) = 672using data points from the
table.
Graph the function and identify the key
characteristics of the graph.
2) Sara's starting salary is $32,500. Each year she
receives a $700 raise.
Write a sequence in explicit form to describe the
situation.
3) Solve the equation 2x = 300.
4) Albuquerque boasts one of the longest aerial
trams in the world. The tram transports
people up to Sandia Peak. The table shows
the elevation of the tram at various times
during a particular ride.
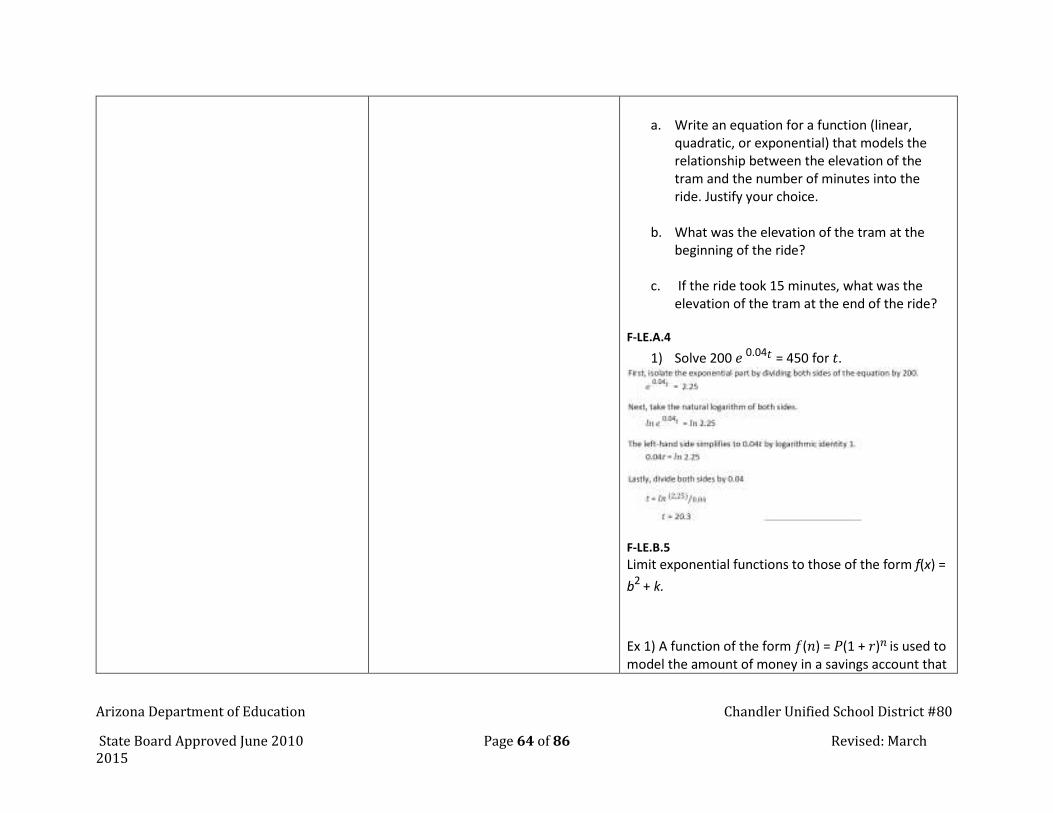
Arizona Department of Education Chandler Unified School District #80
State Board Approved June 2010 Page 64 of 86 Revised: March
2015
a. Write an equation for a function (linear,
quadratic, or exponential) that models the
relationship between the elevation of the
tram and the number of minutes into the
ride. Justify your choice.
b. What was the elevation of the tram at the
beginning of the ride?
c. If the ride took 15 minutes, what was the
elevation of the tram at the end of the ride?
F-LE.A.4
1) Solve 200 00.04�= 450 for �.
F-LE.B.5
Limit exponential functions to those of the form f(x) =
b2
+ k.
Ex 1) A function of the form �(�) = 8(1 + �)�is used to
model the amount of money in a savings account that
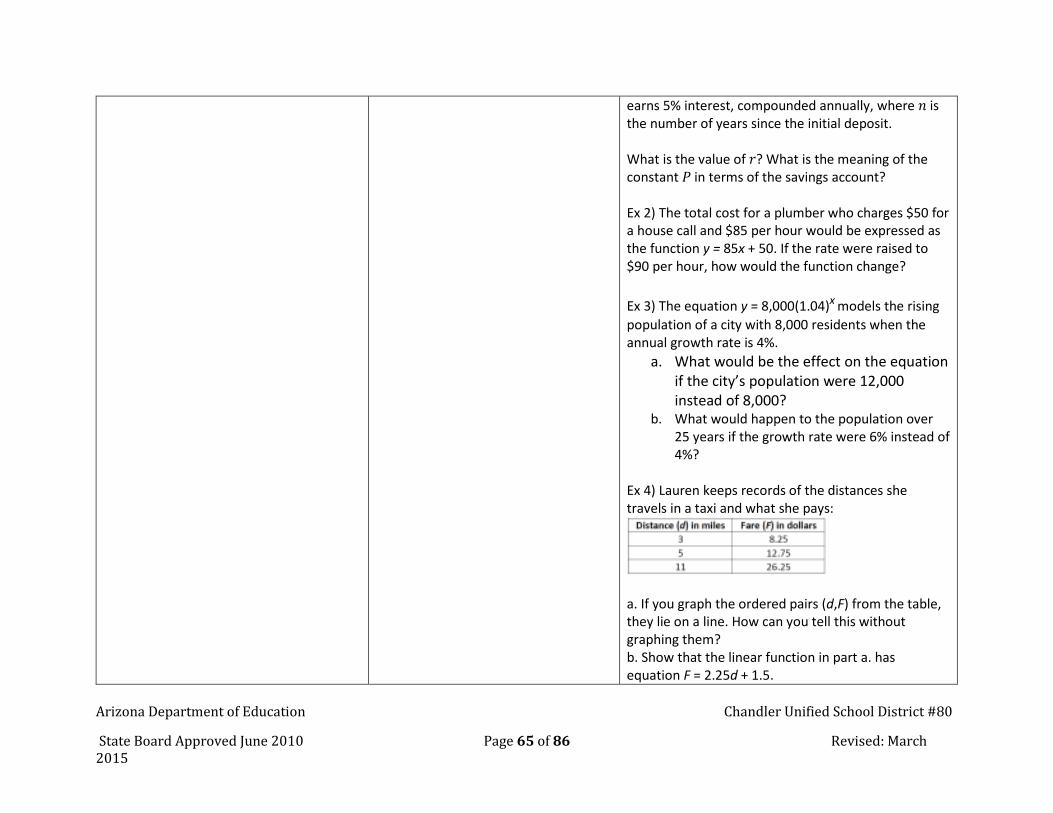
Arizona Department of Education Chandler Unified School District #80
State Board Approved June 2010 Page 65 of 86 Revised: March
2015
earns 5% interest, compounded annually, where �is
the number of years since the initial deposit.
What is the value of �? What is the meaning of the
constant 8in terms of the savings account?
Ex 2) The total cost for a plumber who charges $50 for
a house call and $85 per hour would be expressed as
the function y = 85x + 50. If the rate were raised to
$90 per hour, how would the function change?
Ex 3) The equation y = 8,000(1.04)x models the rising
population of a city with 8,000 residents when the
annual growth rate is 4%.
a. What would be the effect on the equation
if the city’s population were 12,000
instead of 8,000? b. What would happen to the population over
25 years if the growth rate were 6% instead of
4%?
Ex 4) Lauren keeps records of the distances she
travels in a taxi and what she pays:
a. If you graph the ordered pairs (d,F) from the table,
they lie on a line. How can you tell this without
graphing them?
b. Show that the linear function in part a. has
equation F = 2.25d + 1.5.
Arizona Department of Education Chandler Unified School District #80
State Board Approved June 2010 Page 66 of 86 Revised: March
2015
c. What do the 2.25 and the 1.5 in the equation
represent in terms of taxi rides?
Number and Quantity: Quantities ���� (N-Q)
A. Reasonqualitativelyanduseunitstosolveproblems.
HS.N-Q.A.2. Define appropriate quantities for
the purpose of descriptive modeling.
Algebra: Creating Equations ���� (A-CED)
A. Createequationsthatdescribenumbersorrelationships.
HS.A-CED.A.1. Create equations and
inequalities in one variable and use them to
solve problems. Include equations arising from
linear and quadratic functions, and simple
rational and exponential functions.
Algebra: Reasoning with Equations and
Inequalities ���� (A-REI)
A. Understandsolvingequations
asaprocessofreasoningand
explainthereasoning. HS.A-REI.A.1. Explain each step in solving a
simple equation as following from the equality
of numbers asserted at the previous step,
starting from the assumption that the original
equation has a solution. Construct a viable
argument to justify a solution method.
Arizona Department of Education Chandler Unified School District #80
State Board Approved June 2010 Page 67 of 86 Revised: March
2015
B. Solveequationsand
inequalitiesinonevariable.
D. Representandsolveequationsandinequalitiesgraphically.
HS.A-REI.D.11. Explain why the x-coordinates
of the points where the graphs of the
equations
y = f(x) and y = g(x) intersect are the solutions
of the equation
f(x) = g(x); find the solutions approximately,
e.g., using technology to graph the functions,
make tables of values, or find successive
approximations. Include cases where f(x)
and/or g(x) are linear, polynomial, rational,
absolute value, exponential, and logarithmic
functions.
Algebra: Seeing Structure in
Expressions (A-SSE)
A. Interpretthestructureofexpressions.
HS.A-SSE.A.2. Use the structure of an
expression to identify ways to rewrite it. For
example,
see x4 – y4 as (x2)2 – (y2)2, thus recognizing it as
a difference of squares that can be factored as
(x2 – y2)(x2 + y2).

Arizona Department of Education Chandler Unified School District #80
State Board Approved June 2010 Page 68 of 86 Revised: March
2015
B. Writeexpressionsin
equivalentformstosolve
problems.
HS.A-SSE.B.3. Choose and produce an
equivalent form of an expression to reveal and
explain properties of the quantity represented
by the expression.
c. Use the properties of exponents to transform
expressions for exponential functions. For
example the expression 1.15t can be
rewritten as
(1.151/12)12t ≈ 1.01212t to reveal the
approximate equivalent monthly interest rate if
the annual rate is 15%.
HS.A-SSE.B.4. Derive the formula for the sum
of a finite geometric series (when the common
ratio is not 1), and use the formula to solve
problems. For example, calculate mortgage
payments.
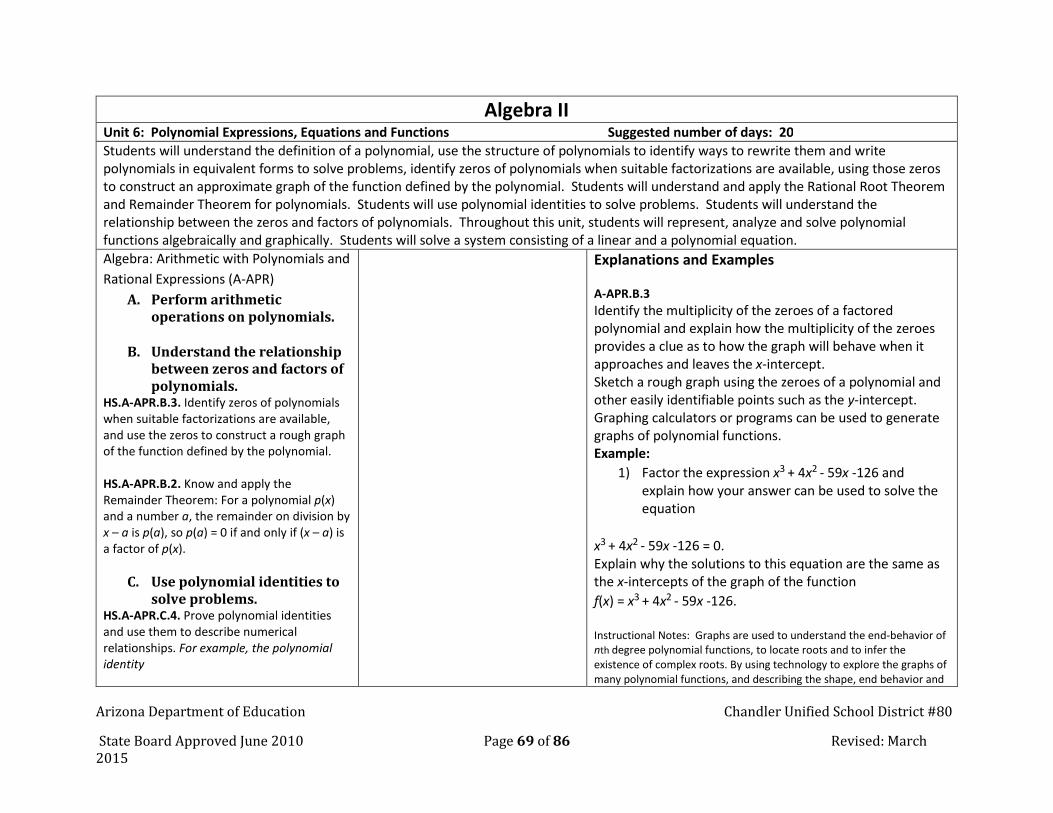
Arizona Department of Education Chandler Unified School District #80
State Board Approved June 2010 Page 69 of 86 Revised: March
2015
Algebra II
Unit 6: Polynomial Expressions, Equations and Functions Suggested number of days: 20
Students will understand the definition of a polynomial, use the structure of polynomials to identify ways to rewrite them and write
polynomials in equivalent forms to solve problems, identify zeros of polynomials when suitable factorizations are available, using those zeros
to construct an approximate graph of the function defined by the polynomial. Students will understand and apply the Rational Root Theorem
and Remainder Theorem for polynomials. Students will use polynomial identities to solve problems. Students will understand the
relationship between the zeros and factors of polynomials. Throughout this unit, students will represent, analyze and solve polynomial
functions algebraically and graphically. Students will solve a system consisting of a linear and a polynomial equation.
Algebra: Arithmetic with Polynomials and
Rational Expressions (A-APR)
A. Performarithmetic
operationsonpolynomials.
B. Understandtherelationshipbetweenzerosandfactorsof
polynomials. HS.A-APR.B.3. Identify zeros of polynomials
when suitable factorizations are available,
and use the zeros to construct a rough graph
of the function defined by the polynomial.
HS.A-APR.B.2. Know and apply the
Remainder Theorem: For a polynomial p(x)
and a number a, the remainder on division by
x – a is p(a), so p(a) = 0 if and only if (x – a) is
a factor of p(x).
C. Usepolynomialidentitiesto
solveproblems. HS.A-APR.C.4. Prove polynomial identities
and use them to describe numerical
relationships. For example, the polynomial
identity
Explanations and Examples
A-APR.B.3
Identify the multiplicity of the zeroes of a factored
polynomial and explain how the multiplicity of the zeroes
provides a clue as to how the graph will behave when it
approaches and leaves the x-intercept.
Sketch a rough graph using the zeroes of a polynomial and
other easily identifiable points such as the y-intercept.
Graphing calculators or programs can be used to generate
graphs of polynomial functions.
Example:
1) Factor the expression x3 + 4x2
- 59x -126 and
explain how your answer can be used to solve the
equation
x3 + 4x2
- 59x -126 = 0.
Explain why the solutions to this equation are the same as
the x-intercepts of the graph of the function
f(x) = x3 + 4x2
- 59x -126.
Instructional Notes: Graphs are used to understand the end-behavior of
nth degree polynomial functions, to locate roots and to infer the
existence of complex roots. By using technology to explore the graphs of
many polynomial functions, and describing the shape, end behavior and
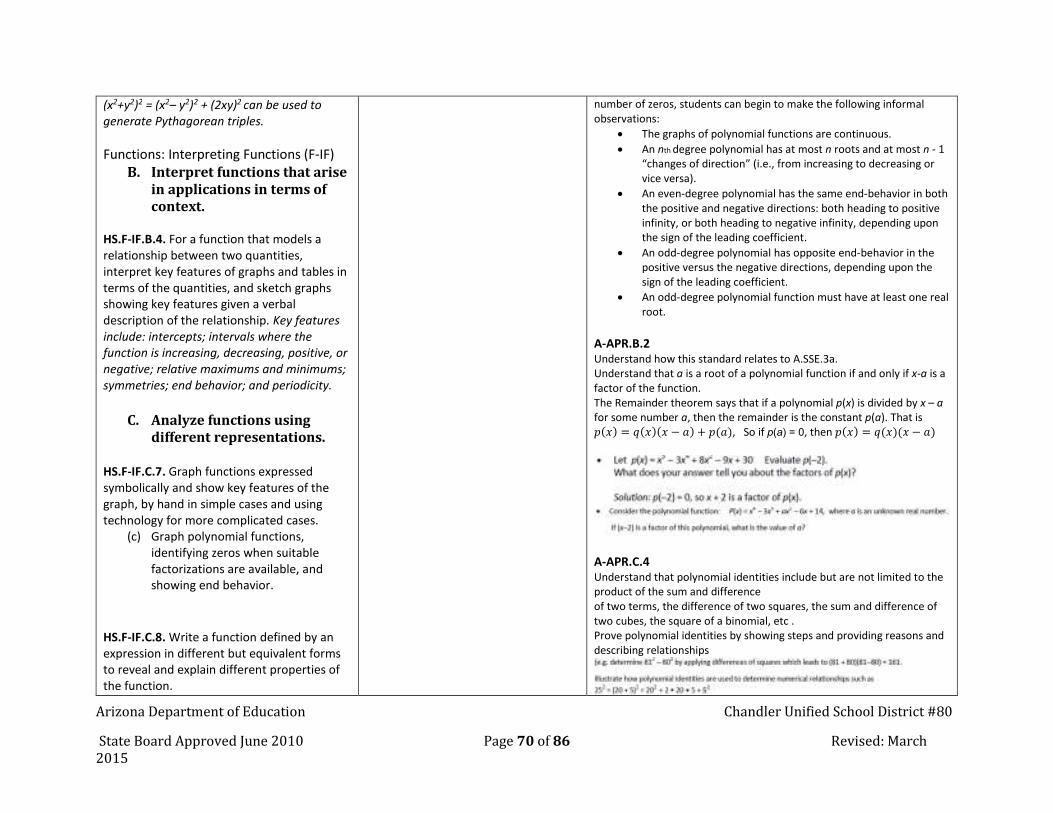
Arizona Department of Education Chandler Unified School District #80
State Board Approved June 2010 Page 70 of 86 Revised: March
2015
(x2+y2)2 = (x2– y2)2 + (2xy)2 can be used to
generate Pythagorean triples.
Functions: Interpreting Functions (F-IF)
B. Interpretfunctionsthatarise
inapplicationsintermsof
context.
HS.F-IF.B.4. For a function that models a
relationship between two quantities,
interpret key features of graphs and tables in
terms of the quantities, and sketch graphs
showing key features given a verbal
description of the relationship. Key features
include: intercepts; intervals where the
function is increasing, decreasing, positive, or
negative; relative maximums and minimums;
symmetries; end behavior; and periodicity.
C. Analyzefunctionsusing
differentrepresentations.
HS.F-IF.C.7. Graph functions expressed
symbolically and show key features of the
graph, by hand in simple cases and using
technology for more complicated cases.
(c) Graph polynomial functions,
identifying zeros when suitable
factorizations are available, and
showing end behavior.
HS.F-IF.C.8. Write a function defined by an
expression in different but equivalent forms
to reveal and explain different properties of
the function.
number of zeros, students can begin to make the following informal
observations:
• The graphs of polynomial functions are continuous.
• An nth degree polynomial has at most n roots and at most n - 1
“changes of direction” (i.e., from increasing to decreasing or
vice versa).
• An even-degree polynomial has the same end-behavior in both
the positive and negative directions: both heading to positive
infinity, or both heading to negative infinity, depending upon
the sign of the leading coefficient.
• An odd-degree polynomial has opposite end-behavior in the
positive versus the negative directions, depending upon the
sign of the leading coefficient.
• An odd-degree polynomial function must have at least one real
root.
A-APR.B.2
Understand how this standard relates to A.SSE.3a.
Understand that a is a root of a polynomial function if and only if x-a is a
factor of the function.
The Remainder theorem says that if a polynomial p(x) is divided by x – a
for some number a, then the remainder is the constant p(a). That is
9 �" = : �" � − 6" + 9 6", So if p(a) = 0, then 9 �" = : �" � − 6"
A-APR.C.4
Understand that polynomial identities include but are not limited to the
product of the sum and difference
of two terms, the difference of two squares, the sum and difference of
two cubes, the square of a binomial, etc .
Prove polynomial identities by showing steps and providing reasons and
describing relationships
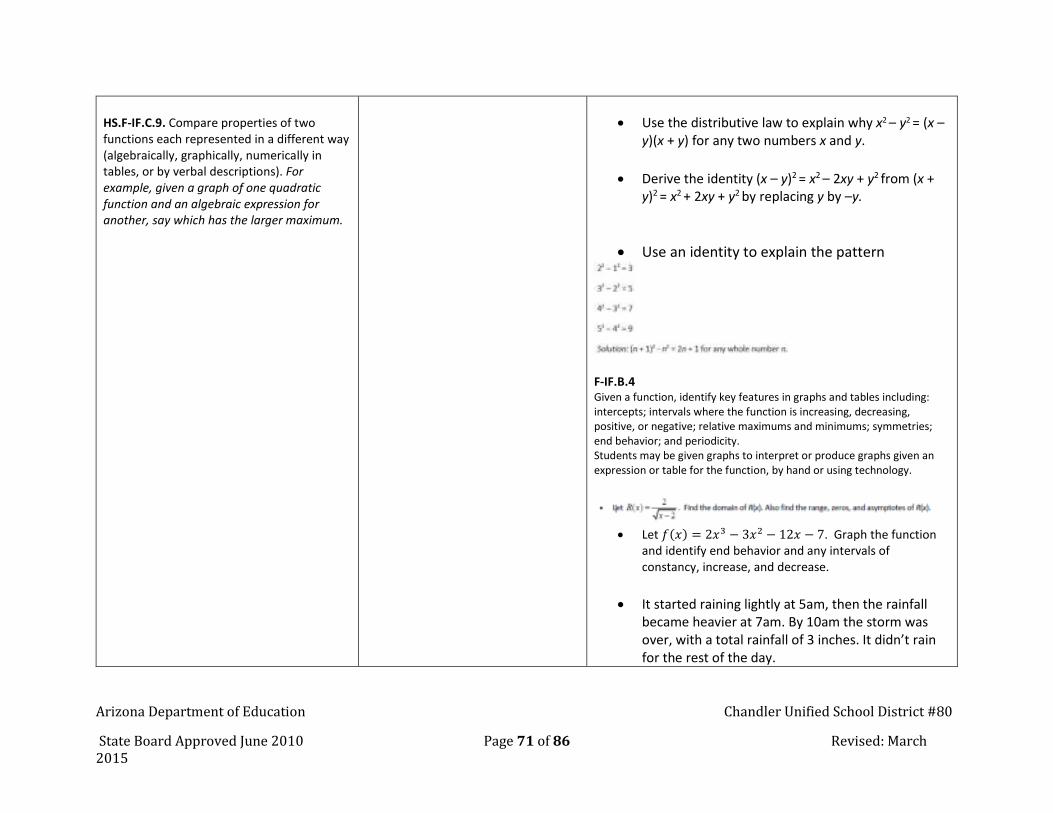
Arizona Department of Education Chandler Unified School District #80
State Board Approved June 2010 Page 71 of 86 Revised: March
2015
HS.F-IF.C.9. Compare properties of two
functions each represented in a different way
(algebraically, graphically, numerically in
tables, or by verbal descriptions). For
example, given a graph of one quadratic
function and an algebraic expression for
another, say which has the larger maximum.
• Use the distributive law to explain why x2 – y2
= (x –
y)(x + y) for any two numbers x and y.
• Derive the identity (x – y)2 = x2
– 2xy + y2 from (x +
y)2 = x2 + 2xy + y2
by replacing y by –y.
• Use an identity to explain the pattern
F-IF.B.4
Given a function, identify key features in graphs and tables including:
intercepts; intervals where the function is increasing, decreasing,
positive, or negative; relative maximums and minimums; symmetries;
end behavior; and periodicity.
Students may be given graphs to interpret or produce graphs given an
expression or table for the function, by hand or using technology.
• Let � �" = 2�$ − 3�� − 12� − 7. Graph the function
and identify end behavior and any intervals of
constancy, increase, and decrease.
• It started raining lightly at 5am, then the rainfall
became heavier at 7am. By 10am the storm was
over, with a total rainfall of 3 inches. It didn’t rain
for the rest of the day.
Arizona Department of Education Chandler Unified School District #80
State Board Approved June 2010 Page 72 of 86 Revised: March
2015
Sketch a possible graph for the number of inches of rain as
a function of time, from midnight to midday.
F-IF.C.7.c
Discover that the factored form of a quadratic or polynomial
equation can be used to determine the zeros, which in turn can
be used to identify maxima, minima and end behaviors.
Use various representations of the same function to emphasize
different characteristics of that function.
For example, the y-intercept of the function y = x2 -4x – 12
is easy to recognize as (0, -12). However, rewriting the
function as y = (x – 6)(x + 2) reveals zeros at (6, 0) and at ( -
2, 0). Furthermore, completing the square allows the
equation to be written as y = (x – 2)2
– 16, which shows that
the vertex (and minimum point) of the parabola is at
(2, -16).
F-IF.C.8
In Algebra 2 students will extend their work to focus on applications and
how key features relate to characteristics of a situation making selection
of a particular type of function.
F-IF.C.9
Compare the key features of two functions represented in different
ways. For example, compare the end behavior of two functions, one of
which is represented graphically and the other is represented
symbolically.
Number and Quantity: Quantities ���� (N-
Q)
A. Reasonqualitativelyanduse
unitstosolveproblems.
Arizona Department of Education Chandler Unified School District #80
State Board Approved June 2010 Page 73 of 86 Revised: March
2015
HS.N-Q.A.2. Define appropriate quantities for
the purpose of descriptive modeling.
Algebra: Creating Equations ���� (A-CED)
A. Createequationsthat
describenumbersor
relationships. HS.A-CED.A.1. Create equations and
inequalities in one variable and use them to
solve problems. Include equations arising
from linear and quadratic functions, and
simple rational and exponential functions.
Algebra: Reasoning with Equations and
Inequalities ���� (A-REI)
A. Understandsolving
equationsasaprocessof
reasoningandexplainthe
reasoning. HS.A-REI.A.1. Explain each step in solving a
simple equation as following from the
equality of numbers asserted at the previous
step, starting from the assumption that the
original equation has a solution. Construct a
viable argument to justify a solution method.
B. Solveequationsand
inequalitiesinonevariable.
HS.A-REI.B.4. Solve quadratic equations in
one variable.
Arizona Department of Education Chandler Unified School District #80
State Board Approved June 2010 Page 74 of 86 Revised: March
2015
b. Solve quadratic equations by inspection
(e.g., for x2 = 49), taking square roots,
completing the square, the quadratic formula
and factoring, as appropriate to the initial
form of the equation. Recognize when the
quadratic formula gives complex solutions
and write them as a ± bi for real numbers a
and b.
D. Representandsolveequationsandinequalities
graphically. HS.A-REI.D.11. Explain why the x-coordinates
of the points where the graphs of the
equations
y = f(x) and y = g(x) intersect are the solutions
of the equation
f(x) = g(x); find the solutions approximately,
e.g., using technology to graph the functions,
make tables of values, or find successive
approximations. Include cases where f(x)
and/or g(x) are linear, polynomial, rational,
absolute value, exponential, and logarithmic
functions.
Algebra: Seeing Structure in
Expressions (A-SSE)
A. Interpretthestructureof
expressions.
HS.A-SSE.A.2. Use the structure of an
expression to identify ways to rewrite it. For
example,
Arizona Department of Education Chandler Unified School District #80
State Board Approved June 2010 Page 75 of 86 Revised: March
2015
see x4 – y4 as (x2)2 – (y2)2, thus recognizing it
as a difference of squares that can be
factored as
(x2 – y2)(x2 + y2).
B. Writeexpressionsin
equivalentformstosolve
problems.
HS.A-SSE.B.3. Choose and produce an
equivalent form of an expression to reveal
and explain properties of the quantity
represented by the expression.
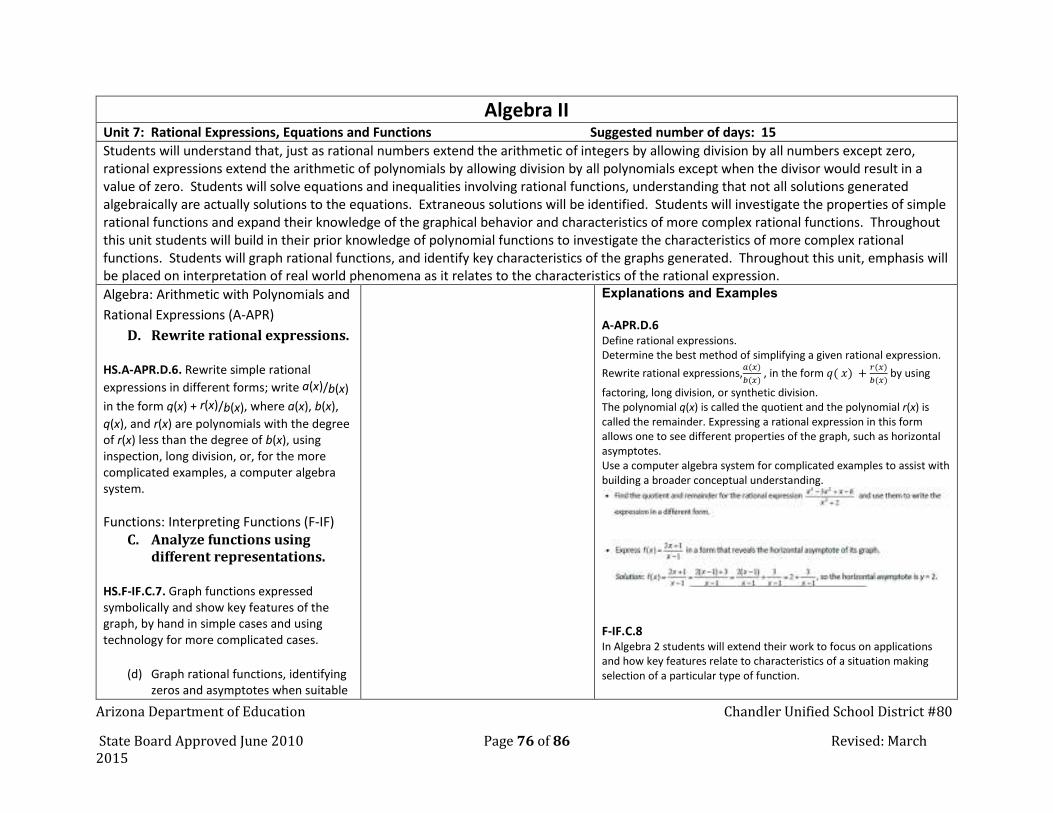
Arizona Department of Education Chandler Unified School District #80
State Board Approved June 2010 Page 76 of 86 Revised: March
2015
Algebra II
Unit 7: Rational Expressions, Equations and Functions Suggested number of days: 15
Students will understand that, just as rational numbers extend the arithmetic of integers by allowing division by all numbers except zero,
rational expressions extend the arithmetic of polynomials by allowing division by all polynomials except when the divisor would result in a
value of zero. Students will solve equations and inequalities involving rational functions, understanding that not all solutions generated
algebraically are actually solutions to the equations. Extraneous solutions will be identified. Students will investigate the properties of simple
rational functions and expand their knowledge of the graphical behavior and characteristics of more complex rational functions. Throughout
this unit students will build in their prior knowledge of polynomial functions to investigate the characteristics of more complex rational
functions. Students will graph rational functions, and identify key characteristics of the graphs generated. Throughout this unit, emphasis will
be placed on interpretation of real world phenomena as it relates to the characteristics of the rational expression.
Algebra: Arithmetic with Polynomials and
Rational Expressions (A-APR)
D. Rewriterationalexpressions. HS.A-APR.D.6. Rewrite simple rational
expressions in different forms; write a(x)/b(x)
in the form q(x) + r(x)/b(x), where a(x), b(x),
q(x), and r(x) are polynomials with the degree
of r(x) less than the degree of b(x), using
inspection, long division, or, for the more
complicated examples, a computer algebra
system.
Functions: Interpreting Functions (F-IF)
C. Analyzefunctionsusing
differentrepresentations.
HS.F-IF.C.7. Graph functions expressed
symbolically and show key features of the
graph, by hand in simple cases and using
technology for more complicated cases.
(d) Graph rational functions, identifying
zeros and asymptotes when suitable
Explanations and Examples
A-APR.D.6
Define rational expressions.
Determine the best method of simplifying a given rational expression.
Rewrite rational expressions,# �"
! �" , in the form : �" +
; �"
! �" by using
factoring, long division, or synthetic division.
The polynomial q(x) is called the quotient and the polynomial r(x) is
called the remainder. Expressing a rational expression in this form
allows one to see different properties of the graph, such as horizontal
asymptotes.
Use a computer algebra system for complicated examples to assist with
building a broader conceptual understanding.
F-IF.C.8
In Algebra 2 students will extend their work to focus on applications
and how key features relate to characteristics of a situation making
selection of a particular type of function.
Arizona Department of Education Chandler Unified School District #80
State Board Approved June 2010 Page 77 of 86 Revised: March
2015
factorizations are available, and
showing end behavior. HS.F-IF.C.8. Write a function defined by an
expression in different but equivalent forms
to reveal and explain different properties of
the function.
HS.F-IF.C.9. Compare properties of two
functions each represented in a different way
(algebraically, graphically, numerically in
tables, or by verbal descriptions). For
example, given a graph of one quadratic
function and an algebraic expression for
another, say which has the larger maximum.
F-IF.C.9
Compare the key features of two functions represented in different
ways. For example, compare the end behavior of two functions, one of
which is represented graphically and the other is represented
symbolically.
Number and Quantity: Quantities ���� (N-
Q)
A. Reasonqualitativelyanduse
unitstosolveproblems.
HS.N-Q.A.2. Define appropriate quantities for
the purpose of descriptive modeling.
Algebra: Creating Equations ���� (A-CED)
A. Createequationsthat
describenumbersor
relationships. HS.A-CED.A.1. Create equations and
inequalities in one variable and use them to
solve problems. Include equations arising
from linear and quadratic functions, and
simple rational and exponential functions.
Arizona Department of Education Chandler Unified School District #80
State Board Approved June 2010 Page 78 of 86 Revised: March
2015
Algebra: Reasoning with Equations and
Inequalities ���� (A-REI)
A. Understandsolvingequations
asaprocessofreasoningand
explainthereasoning. HS.A-REI.A.1. Explain each step in solving a
simple equation as following from the
equality of numbers asserted at the previous
step, starting from the assumption that the
original equation has a solution. Construct a
viable argument to justify a solution method.
HS.A-REI.A.2. Solve simple rational and
radical equations in one variable, and give
examples showing how extraneous solutions
may arise.
B. Solveequationsand
inequalitiesinonevariable.
D. Representandsolve
equationsandinequalities
graphically. HS.A-REI.D.11. Explain why the x-coordinates
of the points where the graphs of the
equations
y = f(x) and y = g(x) intersect are the solutions
of the equation
f(x) = g(x); find the solutions approximately,
e.g., using technology to graph the functions,
make tables of values, or find successive
approximations. Include cases where f(x)
and/or g(x) are linear, polynomial, rational,
Arizona Department of Education Chandler Unified School District #80
State Board Approved June 2010 Page 79 of 86 Revised: March
2015
absolute value, exponential, and logarithmic
functions.
Algebra: Seeing Structure in
Expressions (A-SSE)
A. Interpretthestructureofexpressions.
HS.A-SSE.A.2. Use the structure of an
expression to identify ways to rewrite it. For
example,
see x4 – y4 as (x2)2 – (y2)2, thus recognizing it as
a difference of squares that can be factored as
(x2 – y2)(x2 + y2).
B. Writeexpressionsin
equivalentformstosolve
problems.
HS.A-SSE.B.3. Choose and produce an
equivalent form of an expression to reveal
and explain properties of the quantity
represented by the expression.
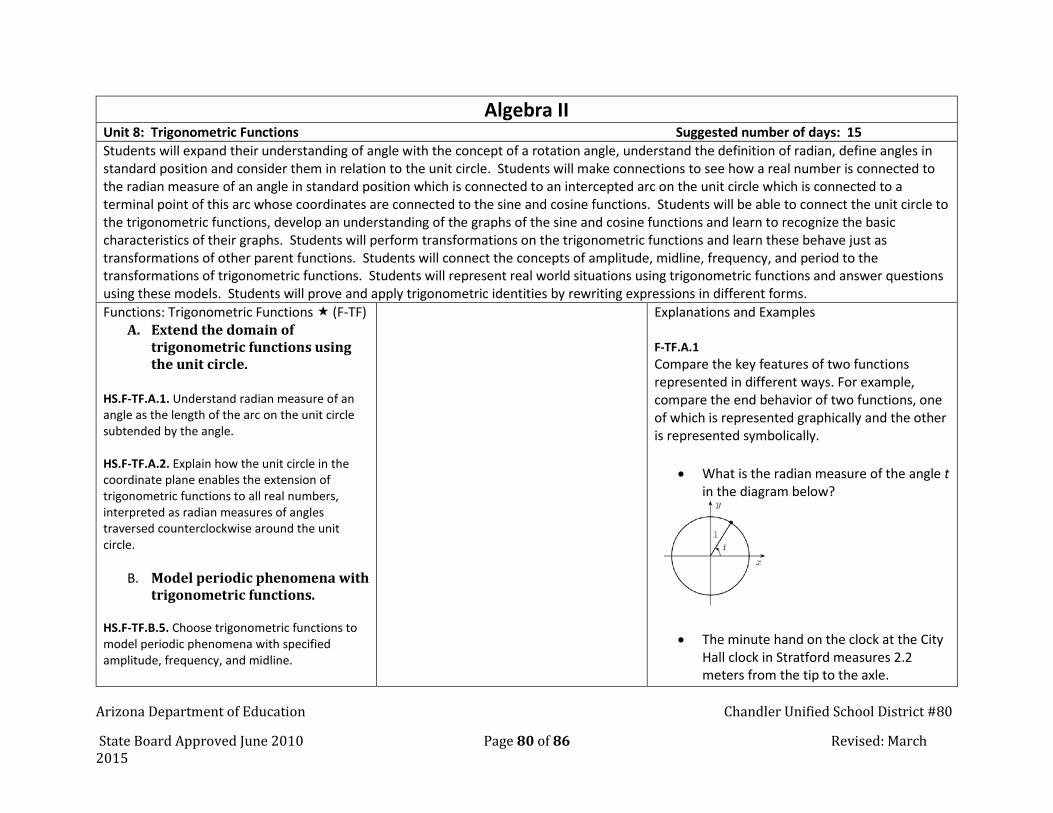
Arizona Department of Education Chandler Unified School District #80
State Board Approved June 2010 Page 80 of 86 Revised: March
2015
Algebra II
Unit 8: Trigonometric Functions Suggested number of days: 15
Students will expand their understanding of angle with the concept of a rotation angle, understand the definition of radian, define angles in
standard position and consider them in relation to the unit circle. Students will make connections to see how a real number is connected to
the radian measure of an angle in standard position which is connected to an intercepted arc on the unit circle which is connected to a
terminal point of this arc whose coordinates are connected to the sine and cosine functions. Students will be able to connect the unit circle to
the trigonometric functions, develop an understanding of the graphs of the sine and cosine functions and learn to recognize the basic
characteristics of their graphs. Students will perform transformations on the trigonometric functions and learn these behave just as
transformations of other parent functions. Students will connect the concepts of amplitude, midline, frequency, and period to the
transformations of trigonometric functions. Students will represent real world situations using trigonometric functions and answer questions
using these models. Students will prove and apply trigonometric identities by rewriting expressions in different forms.
Functions: Trigonometric Functions � (F-TF)
A. Extendthedomainof
trigonometricfunctionsusing
theunitcircle.
HS.F-TF.A.1. Understand radian measure of an
angle as the length of the arc on the unit circle
subtended by the angle.
HS.F-TF.A.2. Explain how the unit circle in the
coordinate plane enables the extension of
trigonometric functions to all real numbers,
interpreted as radian measures of angles
traversed counterclockwise around the unit
circle.
B. Modelperiodicphenomenawith
trigonometricfunctions.
HS.F-TF.B.5. Choose trigonometric functions to
model periodic phenomena with specified
amplitude, frequency, and midline.
Explanations and Examples
F-TF.A.1 Compare the key features of two functions
represented in different ways. For example,
compare the end behavior of two functions, one
of which is represented graphically and the other
is represented symbolically.
• What is the radian measure of the angle t
in the diagram below?
• The minute hand on the clock at the City
Hall clock in Stratford measures 2.2
meters from the tip to the axle.
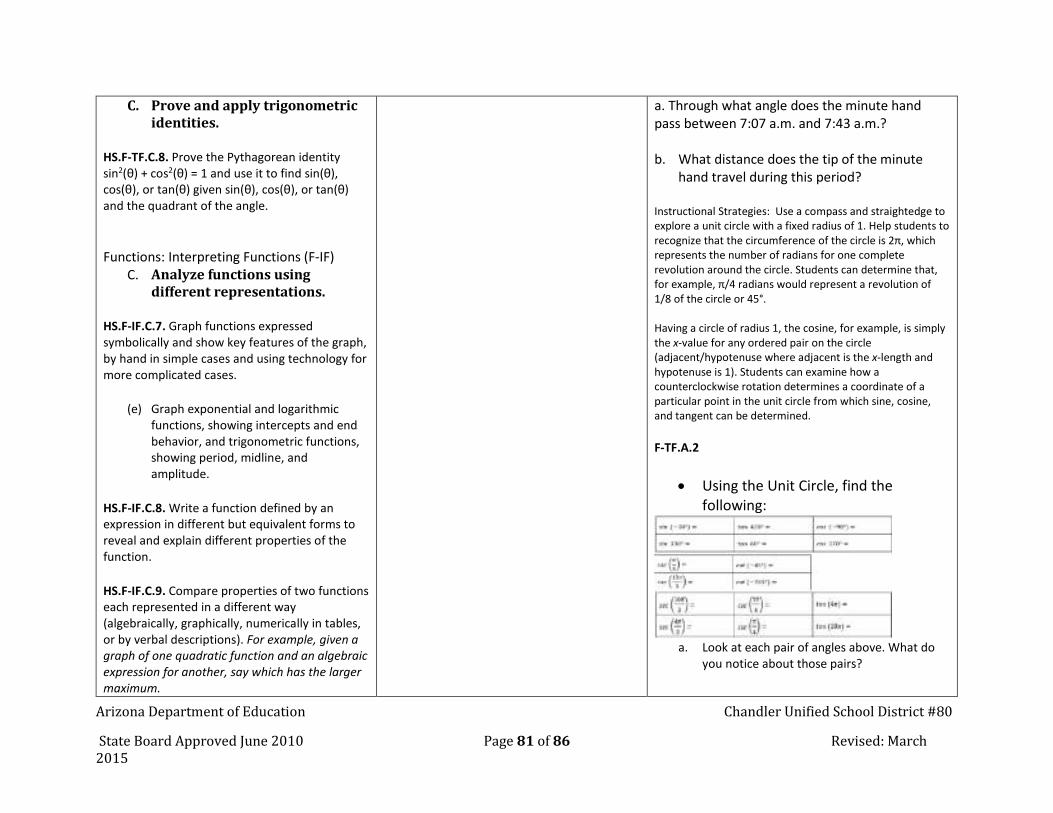
Arizona Department of Education Chandler Unified School District #80
State Board Approved June 2010 Page 81 of 86 Revised: March
2015
C. Proveandapplytrigonometric
identities.
HS.F-TF.C.8. Prove the Pythagorean identity
sin2(θ) + cos2(θ) = 1 and use it to find sin(θ),
cos(θ), or tan(θ) given sin(θ), cos(θ), or tan(θ)
and the quadrant of the angle.
Functions: Interpreting Functions (F-IF)
C. Analyzefunctionsusing
differentrepresentations. HS.F-IF.C.7. Graph functions expressed
symbolically and show key features of the graph,
by hand in simple cases and using technology for
more complicated cases.
(e) Graph exponential and logarithmic
functions, showing intercepts and end
behavior, and trigonometric functions,
showing period, midline, and
amplitude. HS.F-IF.C.8. Write a function defined by an
expression in different but equivalent forms to
reveal and explain different properties of the
function.
HS.F-IF.C.9. Compare properties of two functions
each represented in a different way
(algebraically, graphically, numerically in tables,
or by verbal descriptions). For example, given a
graph of one quadratic function and an algebraic
expression for another, say which has the larger
maximum.
a. Through what angle does the minute hand
pass between 7:07 a.m. and 7:43 a.m.?
b. What distance does the tip of the minute
hand travel during this period?
Instructional Strategies: Use a compass and straightedge to
explore a unit circle with a fixed radius of 1. Help students to
recognize that the circumference of the circle is 2π, which
represents the number of radians for one complete
revolution around the circle. Students can determine that,
for example, π/4 radians would represent a revolution of
1/8 of the circle or 45°.
Having a circle of radius 1, the cosine, for example, is simply
the x-value for any ordered pair on the circle
(adjacent/hypotenuse where adjacent is the x-length and
hypotenuse is 1). Students can examine how a
counterclockwise rotation determines a coordinate of a
particular point in the unit circle from which sine, cosine,
and tangent can be determined.
F-TF.A.2
• Using the Unit Circle, find the
following:
a. Look at each pair of angles above. What do
you notice about those pairs?

Arizona Department of Education Chandler Unified School District #80
State Board Approved June 2010 Page 82 of 86 Revised: March
2015
b. What conclusions can you draw about the
trigonometric functions and how they work
about the circle?
F-TF.B.5
Define amplitude, frequency, and midline of a
trigonometric function.
Explain the connection between frequency and
period.
Use sine and cosine to model periodic
phenomena such as the ocean’s tide or the
rotation of a Ferris wheel.
Given the amplitude; frequency; and midline in
situations or graphs, determine a trigonometric
function used to model the situation.
Write a function notation for the trigonometric
function that models a problem situation.
• The temperature of a chemical reaction
oscillates between a low of 20℃and a
high of 120℃. The temperature is at its
lowest point when �= 0 and completes
one cycle over a 6-hour period.
a. Sketch the temperature, =, against the elapsed
time, �, over a 12-hour period.
b. Find the period, amplitude, and the midline of
the graph you drew in part a.
c. Write a function to represent the relationship
between time and temperature.
d. What will the temperature of the reaction be
14 hours after it began?
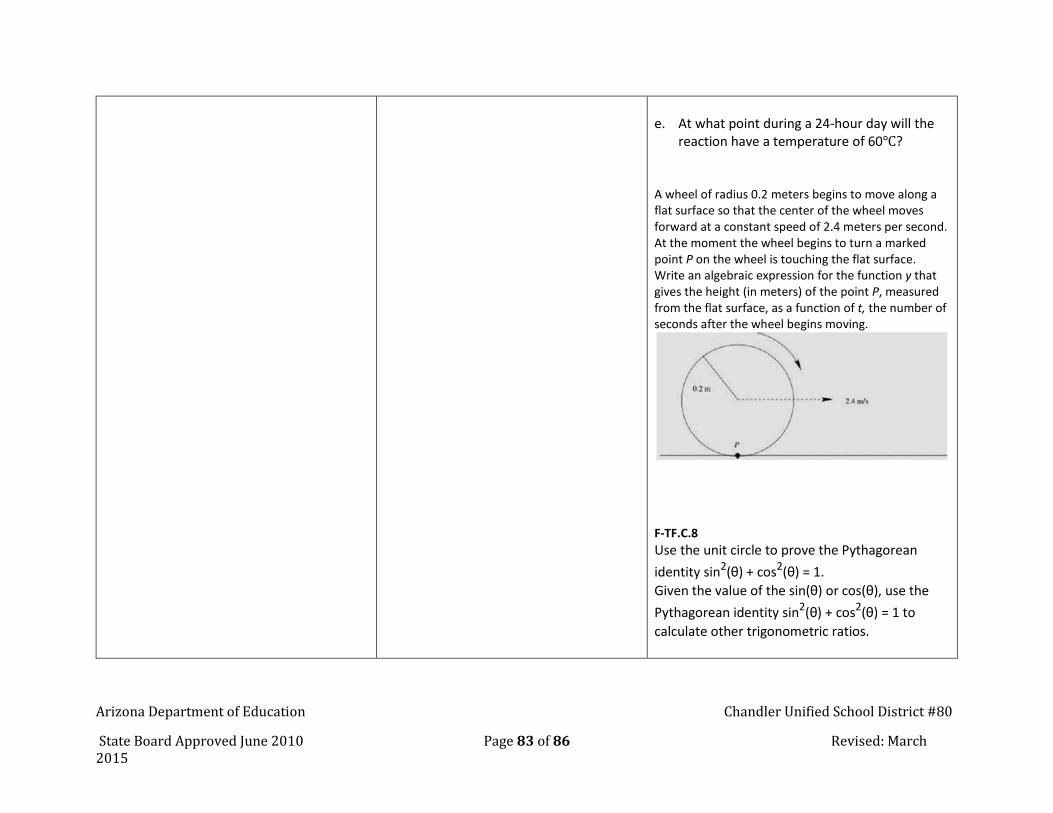
Arizona Department of Education Chandler Unified School District #80
State Board Approved June 2010 Page 83 of 86 Revised: March
2015
e. At what point during a 24-hour day will the
reaction have a temperature of 60℃?
A wheel of radius 0.2 meters begins to move along a
flat surface so that the center of the wheel moves
forward at a constant speed of 2.4 meters per second.
At the moment the wheel begins to turn a marked
point P on the wheel is touching the flat surface.
Write an algebraic expression for the function y that
gives the height (in meters) of the point P, measured
from the flat surface, as a function of t, the number of
seconds after the wheel begins moving.
F-TF.C.8
Use the unit circle to prove the Pythagorean
identity sin2(θ) + cos2(θ) = 1.
Given the value of the sin(θ) or cos(θ), use the
Pythagorean identity sin2(θ) + cos2(θ) = 1 to
calculate other trigonometric ratios.
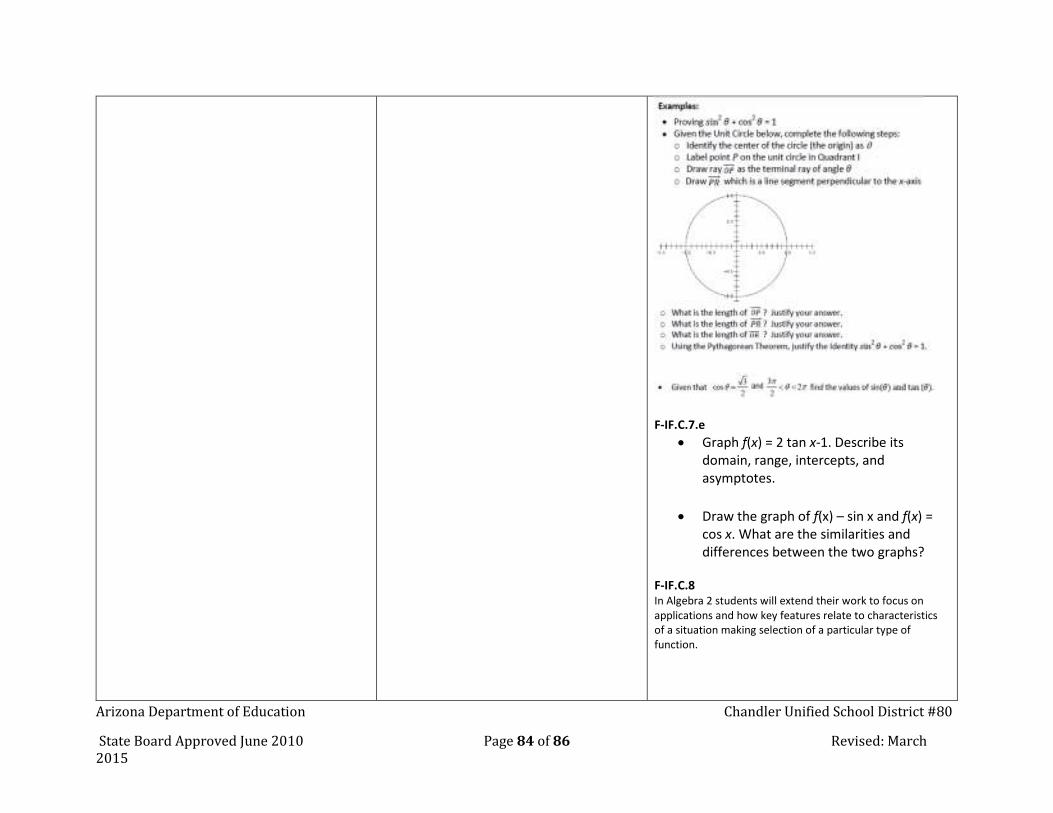
Arizona Department of Education Chandler Unified School District #80
State Board Approved June 2010 Page 84 of 86 Revised: March
2015
F-IF.C.7.e
• Graph f(x) = 2 tan x-1. Describe its
domain, range, intercepts, and
asymptotes.
• Draw the graph of f(x) – sin x and f(x) =
cos x. What are the similarities and
differences between the two graphs?
F-IF.C.8
In Algebra 2 students will extend their work to focus on
applications and how key features relate to characteristics
of a situation making selection of a particular type of
function.
Arizona Department of Education Chandler Unified School District #80
State Board Approved June 2010 Page 85 of 86 Revised: March
2015
F-IF.C.9
Compare the key features of two functions represented in
different ways. For example, compare the end behavior of
two functions, one of which is represented graphically and
the other is represented symbolically.
Number and Quantity: Quantities ���� (N-Q)
A. Reasonqualitativelyanduseunitstosolveproblems.
HS.N-Q.A.2. Define appropriate quantities for
the purpose of descriptive modeling.
Algebra: Creating Equations ���� (A-CED)
A. Createequationsthatdescribenumbersorrelationships.
Algebra: Reasoning with Equations and
Inequalities ���� (A-REI)
A. Understandsolvingequations
asaprocessofreasoningand
explainthereasoning. HS.A-REI.A.1. Explain each step in solving a
simple equation as following from the equality of
numbers asserted at the previous step, starting
from the assumption that the original equation
has a solution. Construct a viable argument to
justify a solution method.
Algebra: Seeing Structure in Expressions
(A-SSE)
Arizona Department of Education Chandler Unified School District #80
State Board Approved June 2010 Page 86 of 86 Revised: March
2015
A. Interpretthestructureof
expressions.
HS.A-SSE.A.2. Use the structure of an expression
to identify ways to rewrite it.
.
B. Writeexpressionsinequivalent
formstosolveproblems.
HS.A-SSE.B.3. Choose and produce an equivalent
form of an expression to reveal and explain
properties of the quantity represented by the
expression.