mathematics preliminary summative assessment blueprints€¦ · grade 8 mathematics preliminary...
TRANSCRIPT
Mathematics
Preliminary Summative Assessment Blueprints
This document contains preliminary Smarter Balanced Summative Assessment Blueprints for mathematics. The document is organized to
show first the blueprint tables for all grades, followed by the assessment target sampling tables for all grades.
Table of Contents
Blueprint Tables
Grades 3-5 Mathematics Preliminary Summative Assessment Blueprint—Table 5a ............................................................................................... 2
Grades 6-8 Mathematics Preliminary Summative Assessment Blueprint—Table 5b ............................................................................................... 3
Grade 11 Mathematics Preliminary Summative Assessment Blueprint—Table 5c .................................................................................................. 4
Target Sampling
Grade 3 Mathematics Preliminary Summative Assessment Blueprint Target Sampling—Table 6a ........................................................................ 5
Grade 4 Mathematics Preliminary Summative Assessment Blueprint Target Sampling—Table 6a ........................................................................ 8
Grade 5 Mathematics Preliminary Summative Assessment Blueprint Target Sampling—Table 6a ...................................................................... 11
Grade 6 Mathematics Preliminary Summative Assessment Blueprint Target Sampling—Table 6b ...................................................................... 14
Grade 7 Mathematics Preliminary Summative Assessment Blueprint Target Sampling—Table 6b ...................................................................... 17
Grade 8 Mathematics Preliminary Summative Assessment Blueprint Target Sampling—Table 6b ...................................................................... 20
Grade 11 Mathematics Preliminary Summative Assessment Blueprint Target Sampling—Table 6c .................................................................... 23
1
Mathematics Preliminary Summative Assessment Blueprint
Blueprint Table Mathematics Grades 3-5—Table 5a
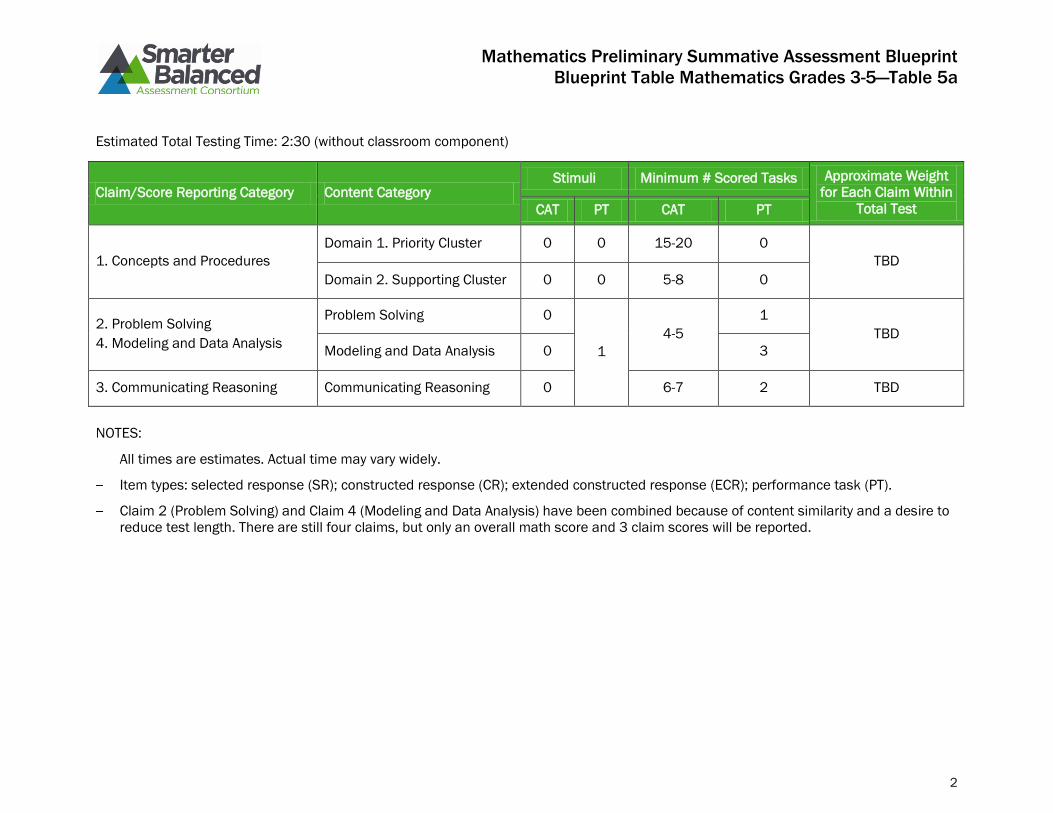
Estimated Total Testing Time: 2:30 (without classroom component)
Claim/Score Reporting Category Content Category Stimuli Minimum # Scored Tasks Approximate Weight
for Each Claim Within
Total Test CAT PT CAT PT
1. Concepts and Procedures
Domain 1. Priority Cluster 0 0 15-20 0
TBD
Domain 2. Supporting Cluster 0 0 5-8 0
2. Problem Solving
4. Modeling and Data Analysis
Problem Solving 0
1
4-5
1
TBD
Modeling and Data Analysis 0 3
3. Communicating Reasoning Communicating Reasoning 0 6-7 2 TBD
NOTES:
All times are estimates. Actual time may vary widely.
Item types: selected response (SR); constructed response (CR); extended constructed response (ECR); performance task (PT).
Claim 2 (Problem Solving) and Claim 4 (Modeling and Data Analysis) have been combined because of content similarity and a desire to
reduce test length. There are still four claims, but only an overall math score and 3 claim scores will be reported.
2
Mathematics Preliminary Summative Assessment Blueprint
Blueprint Table Mathematics Grades 6-8—Table 5b
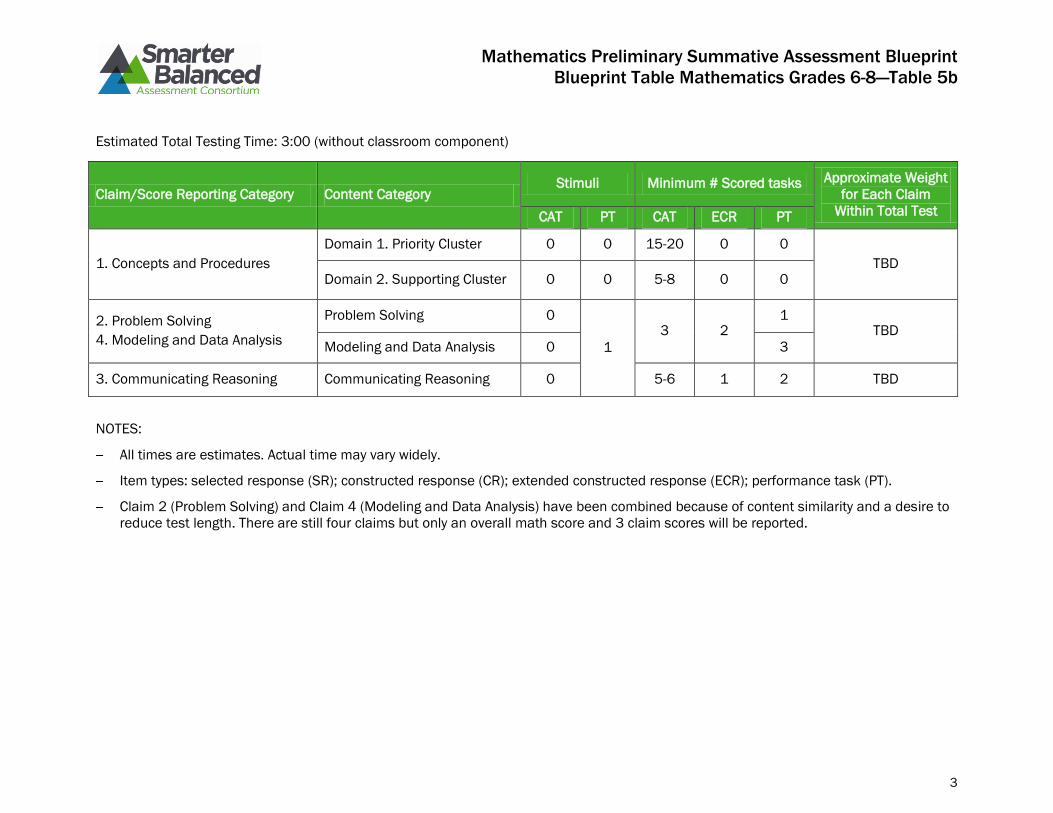
Estimated Total Testing Time: 3:00 (without classroom component)
Claim/Score Reporting Category Content Category Stimuli Minimum # Scored tasks Approximate Weight
for Each Claim
Within Total Test CAT PT CAT ECR PT
1. Concepts and Procedures
Domain 1. Priority Cluster 0 0 15-20 0 0
TBD Domain 2. Supporting Cluster 0 0 5-8 0 0
2. Problem Solving
4. Modeling and Data Analysis
Problem Solving 0
1
3 2 1
TBD
Modeling and Data Analysis 0 3
3. Communicating Reasoning Communicating Reasoning 0 5-6 1 2 TBD
NOTES:
All times are estimates. Actual time may vary widely.
Item types: selected response (SR); constructed response (CR); extended constructed response (ECR); performance task (PT).
Claim 2 (Problem Solving) and Claim 4 (Modeling and Data Analysis) have been combined because of content similarity and a desire to
reduce test length. There are still four claims but only an overall math score and 3 claim scores will be reported.
3
Mathematics Preliminary Summative Assessment Blueprint
Blueprint Table Mathematics Grade 11—Table 5c
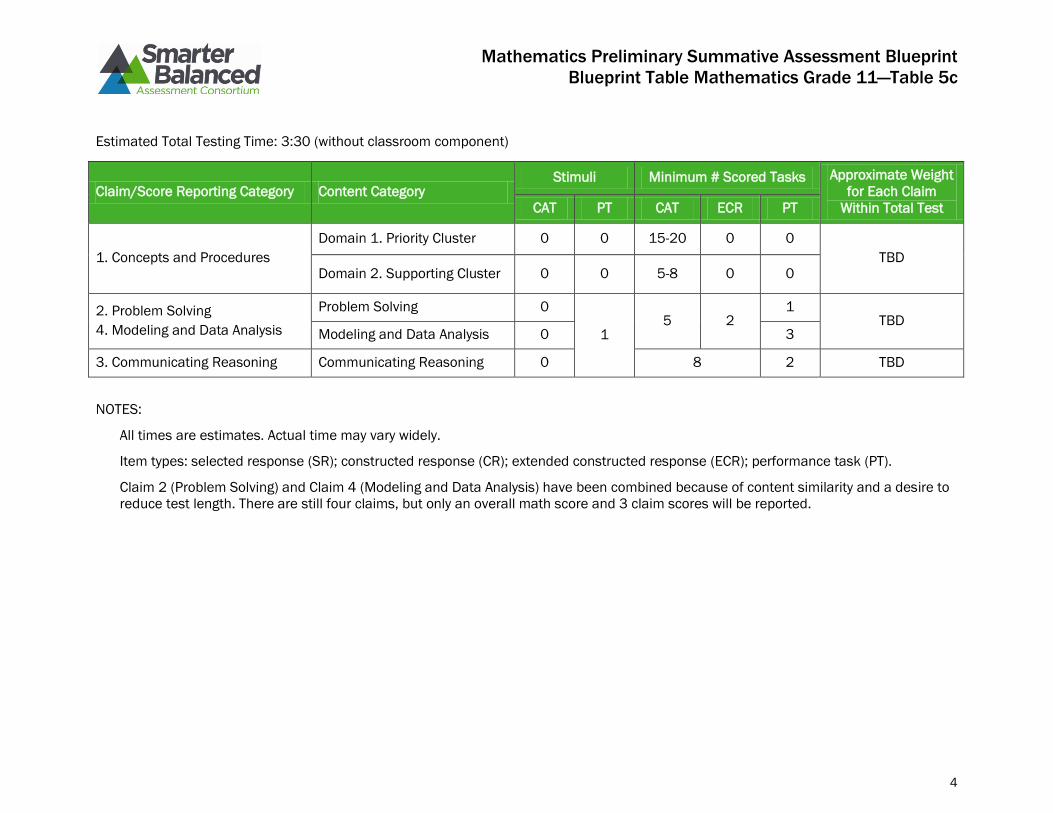
Estimated Total Testing Time: 3:30 (without classroom component)
Claim/Score Reporting Category Content Category Stimuli Minimum # Scored Tasks Approximate Weight
for Each Claim
Within Total Test CAT PT CAT ECR PT
1. Concepts and Procedures
Domain 1. Priority Cluster 0 0 15-20 0 0
TBD Domain 2. Supporting Cluster 0 0 5-8 0 0
2. Problem Solving
4. Modeling and Data Analysis
Problem Solving 0
1 5 2
1 TBD
Modeling and Data Analysis 0 3
3. Communicating Reasoning Communicating Reasoning 0 8 2 TBD
NOTES:
All times are estimates. Actual time may vary widely.
Item types: selected response (SR); constructed response (CR); extended constructed response (ECR); performance task (PT).
Claim 2 (Problem Solving) and Claim 4 (Modeling and Data Analysis) have been combined because of content similarity and a desire to
reduce test length. There are still four claims, but only an overall math score and 3 claim scores will be reported.
4
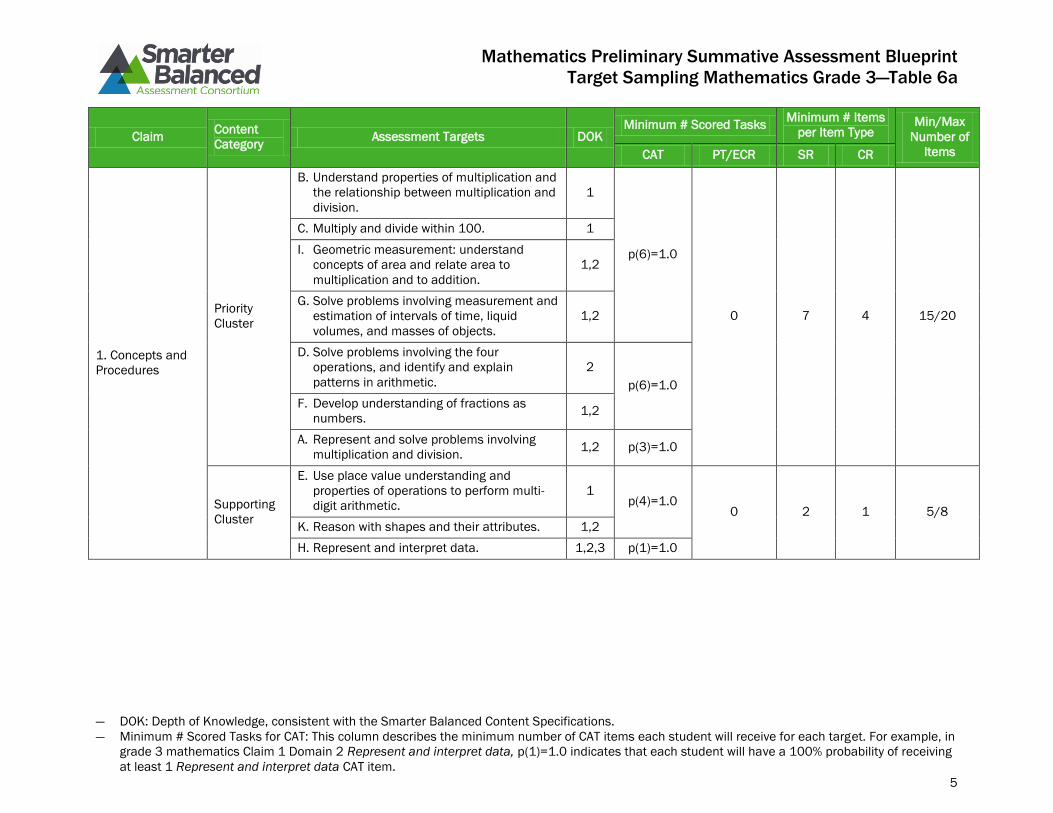
Mathematics Preliminary Summative Assessment Blueprint
Target Sampling Mathematics Grade 3—Table 6a
— DOK: Depth of Knowledge, consistent with the Smarter Balanced Content Specifications.
— Minimum # Scored Tasks for CAT: This column describes the minimum number of CAT items each student will receive for each target. For example, in
grade 3 mathematics Claim 1 Domain 2 Represent and interpret data, p(1)=1.0 indicates that each student will have a 100% probability of receiving
at least 1 Represent and interpret data CAT item.
Claim Content
Category Assessment Targets DOK
Minimum # Scored Tasks Minimum # Items
per Item Type Min/Max
Number of
Items CAT PT/ECR SR CR
1. Concepts and
Procedures
Priority
Cluster
B. Understand properties of multiplication and
the relationship between multiplication and
division.
1
p(6)=1.0
0 7 4 15/20
C. Multiply and divide within 100. 1
I. Geometric measurement: understand
concepts of area and relate area to
multiplication and to addition.
1,2
G. Solve problems involving measurement and
estimation of intervals of time, liquid
volumes, and masses of objects.
1,2
D. Solve problems involving the four
operations, and identify and explain
patterns in arithmetic.
2
p(6)=1.0
F. Develop understanding of fractions as
numbers. 1,2
A. Represent and solve problems involving
multiplication and division. 1,2 p(3)=1.0
Supporting
Cluster
E. Use place value understanding and
properties of operations to perform multi-
digit arithmetic.
1 p(4)=1.0
0 2 1 5/8
K. Reason with shapes and their attributes. 1,2
H. Represent and interpret data. 1,2,3 p(1)=1.0
5
Mathematics Preliminary Summative Assessment Blueprint
Target Sampling Mathematics Grade 3—Table 6a
— DOK: Depth of Knowledge, consistent with the Smarter Balanced Content Specifications.
— Minimum # Scored Tasks for CAT: This column describes the minimum number of CAT items each student will receive for each target. For example, in
grade 3 mathematics Claim 1 Domain 2 Represent and interpret data, p(1)=1.0 indicates that each student will have a 100% probability of receiving
at least 1 Represent and interpret data CAT item.
Claim Content
Category Assessment Targets DOK
Minimum # Scored Tasks Minimum # Items
per Item Type Min/Max
Number of
Items CAT PT/ECR SR CR
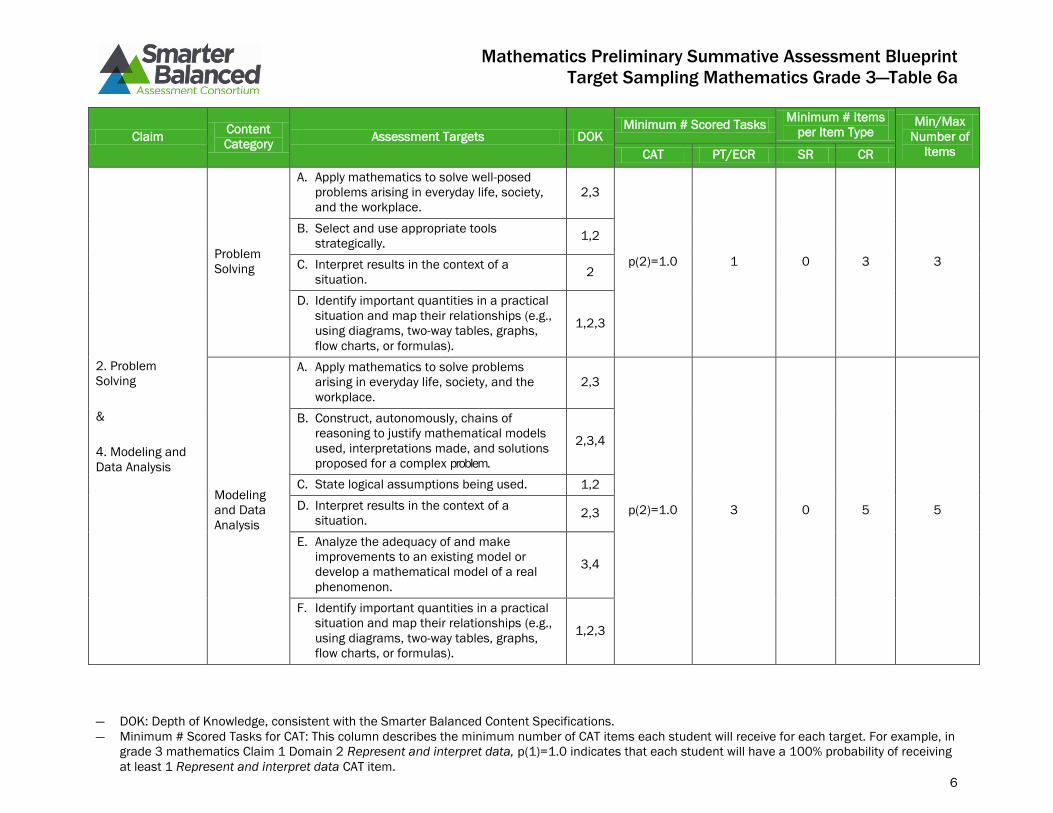
2. Problem
Solving
&
4. Modeling and
Data Analysis
Problem
Solving
A. Apply mathematics to solve well-posed
problems arising in everyday life, society,
and the workplace.
2,3
p(2)=1.0 1 0 3 3
B. Select and use appropriate tools
strategically. 1,2
C. Interpret results in the context of a
situation. 2
D. Identify important quantities in a practical
situation and map their relationships (e.g.,
using diagrams, two-way tables, graphs,
flow charts, or formulas).
1,2,3
Modeling
and Data
Analysis
A. Apply mathematics to solve problems
arising in everyday life, society, and the
workplace.
2,3
p(2)=1.0 3 0 5 5
B. Construct, autonomously, chains of
reasoning to justify mathematical models
used, interpretations made, and solutions
proposed for a complex problem.
2,3,4
C. State logical assumptions being used. 1,2
D. Interpret results in the context of a
situation. 2,3
E. Analyze the adequacy of and make
improvements to an existing model or
develop a mathematical model of a real
phenomenon.
3,4
F. Identify important quantities in a practical
situation and map their relationships (e.g.,
using diagrams, two-way tables, graphs,
flow charts, or formulas).
1,2,3
6
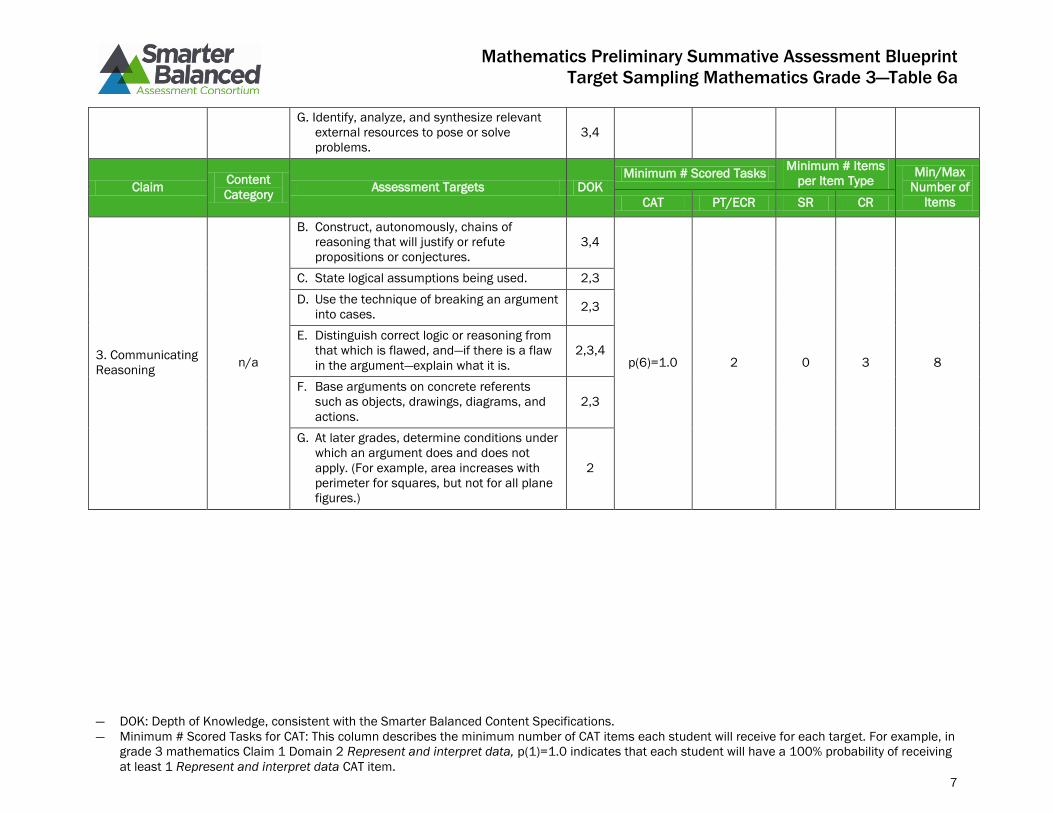
Mathematics Preliminary Summative Assessment Blueprint
Target Sampling Mathematics Grade 3—Table 6a
— DOK: Depth of Knowledge, consistent with the Smarter Balanced Content Specifications.
— Minimum # Scored Tasks for CAT: This column describes the minimum number of CAT items each student will receive for each target. For example, in
grade 3 mathematics Claim 1 Domain 2 Represent and interpret data, p(1)=1.0 indicates that each student will have a 100% probability of receiving
at least 1 Represent and interpret data CAT item.
G. Identify, analyze, and synthesize relevant
external resources to pose or solve
problems.
3,4
Claim Content
Category Assessment Targets DOK
Minimum # Scored Tasks Minimum # Items
per Item Type Min/Max
Number of
Items CAT PT/ECR SR CR
3. Communicating
Reasoning n/a
B. Construct, autonomously, chains of
reasoning that will justify or refute
propositions or conjectures.
3,4
p(6)=1.0 2 0 3 8
C. State logical assumptions being used. 2,3
D. Use the technique of breaking an argument
into cases. 2,3
E. Distinguish correct logic or reasoning from
that which is flawed, and—if there is a flaw
in the argument—explain what it is.
2,3,4
F. Base arguments on concrete referents
such as objects, drawings, diagrams, and
actions.
2,3
G. At later grades, determine conditions under
which an argument does and does not
apply. (For example, area increases with
perimeter for squares, but not for all plane
figures.)
2
7
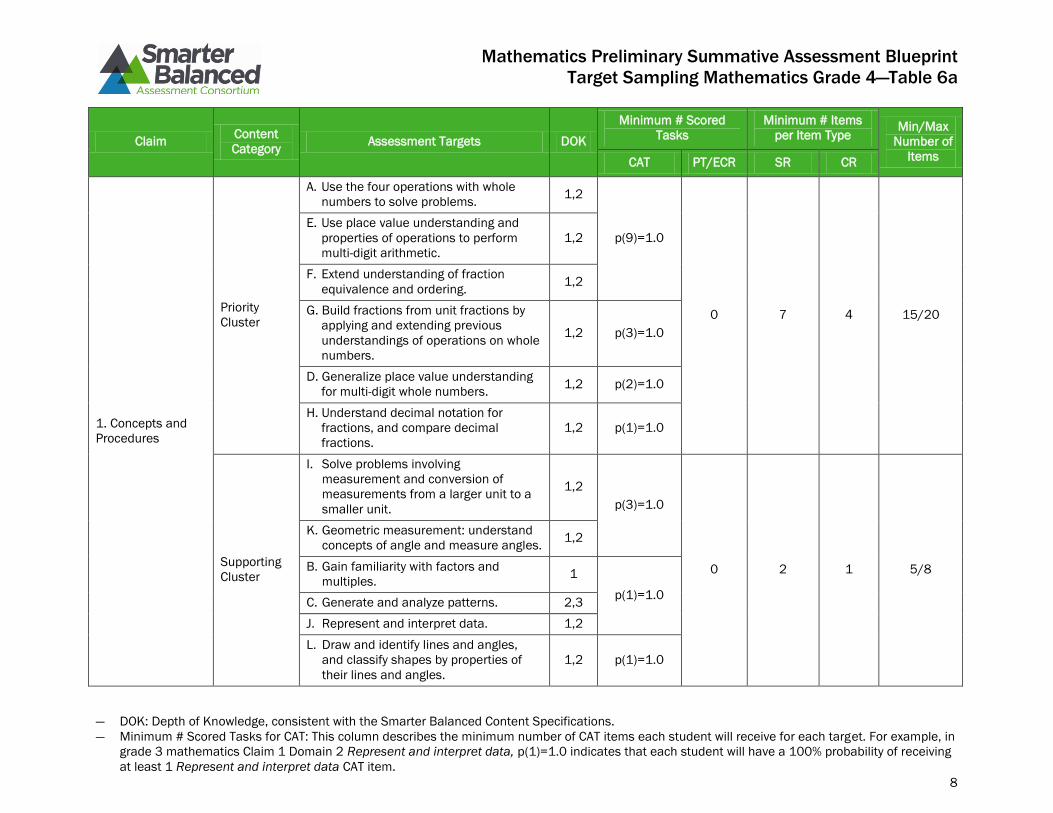
Mathematics Preliminary Summative Assessment Blueprint
Target Sampling Mathematics Grade 4—Table 6a
— DOK: Depth of Knowledge, consistent with the Smarter Balanced Content Specifications.
— Minimum # Scored Tasks for CAT: This column describes the minimum number of CAT items each student will receive for each target. For example, in
grade 3 mathematics Claim 1 Domain 2 Represent and interpret data, p(1)=1.0 indicates that each student will have a 100% probability of receiving
at least 1 Represent and interpret data CAT item.
Claim Content
Category Assessment Targets DOK
Minimum # Scored
Tasks
Minimum # Items
per Item Type Min/Max
Number of
Items CAT PT/ECR SR CR
1. Concepts and
Procedures
Priority
Cluster
A. Use the four operations with whole
numbers to solve problems. 1,2
p(9)=1.0
0 7 4 15/20
E. Use place value understanding and
properties of operations to perform
multi-digit arithmetic.
1,2
F. Extend understanding of fraction
equivalence and ordering. 1,2
G. Build fractions from unit fractions by
applying and extending previous
understandings of operations on whole
numbers.
1,2 p(3)=1.0
D. Generalize place value understanding
for multi-digit whole numbers. 1,2 p(2)=1.0
H. Understand decimal notation for
fractions, and compare decimal
fractions.
1,2 p(1)=1.0
Supporting
Cluster
I. Solve problems involving
measurement and conversion of
measurements from a larger unit to a
smaller unit.
1,2
p(3)=1.0
0 2 1 5/8
K. Geometric measurement: understand
concepts of angle and measure angles. 1,2
B. Gain familiarity with factors and
multiples. 1
p(1)=1.0 C. Generate and analyze patterns. 2,3
J. Represent and interpret data. 1,2
L. Draw and identify lines and angles,
and classify shapes by properties of
their lines and angles.
1,2 p(1)=1.0
8
Mathematics Preliminary Summative Assessment Blueprint
Target Sampling Mathematics Grade 4—Table 6a
— DOK: Depth of Knowledge, consistent with the Smarter Balanced Content Specifications.
— Minimum # Scored Tasks for CAT: This column describes the minimum number of CAT items each student will receive for each target. For example, in
grade 3 mathematics Claim 1 Domain 2 Represent and interpret data, p(1)=1.0 indicates that each student will have a 100% probability of receiving
at least 1 Represent and interpret data CAT item.
Claim Content
Category Assessment Targets DOK
Minimum # Scored
Tasks
Minimum # Items
per Item Type Minimum
Number of
Items CAT PT/ECR SR CR
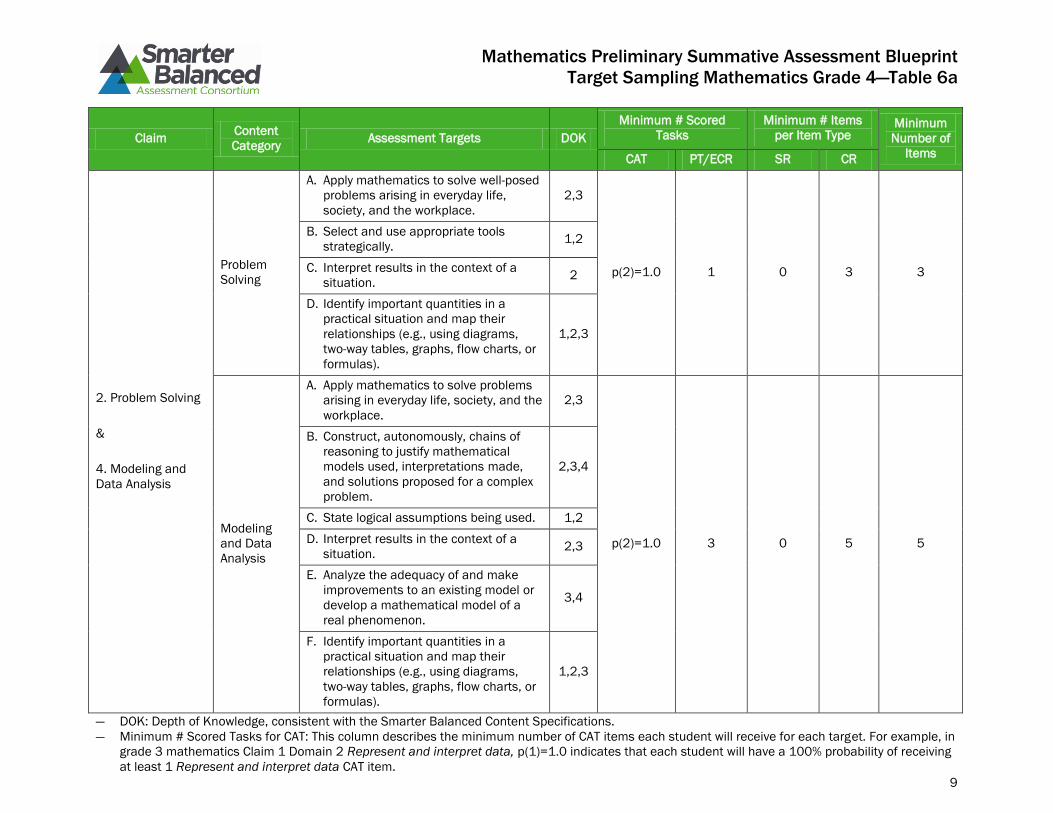
2. Problem Solving
&
4. Modeling and
Data Analysis
Problem
Solving
A. Apply mathematics to solve well-posed
problems arising in everyday life,
society, and the workplace.
2,3
p(2)=1.0 1 0 3 3
B. Select and use appropriate tools
strategically. 1,2
C. Interpret results in the context of a
situation. 2
D. Identify important quantities in a
practical situation and map their
relationships (e.g., using diagrams,
two-way tables, graphs, flow charts, or
formulas).
1,2,3
Modeling
and Data
Analysis
A. Apply mathematics to solve problems
arising in everyday life, society, and the
workplace.
2,3
p(2)=1.0 3 0 5 5
B. Construct, autonomously, chains of
reasoning to justify mathematical
models used, interpretations made,
and solutions proposed for a complex
problem.
2,3,4
C. State logical assumptions being used. 1,2
D. Interpret results in the context of a
situation. 2,3
E. Analyze the adequacy of and make
improvements to an existing model or
develop a mathematical model of a
real phenomenon.
3,4
F. Identify important quantities in a
practical situation and map their
relationships (e.g., using diagrams,
two-way tables, graphs, flow charts, or
formulas).
1,2,3
9

Mathematics Preliminary Summative Assessment Blueprint
Target Sampling Mathematics Grade 4—Table 6a
— DOK: Depth of Knowledge, consistent with the Smarter Balanced Content Specifications.
— Minimum # Scored Tasks for CAT: This column describes the minimum number of CAT items each student will receive for each target. For example, in
grade 3 mathematics Claim 1 Domain 2 Represent and interpret data, p(1)=1.0 indicates that each student will have a 100% probability of receiving
at least 1 Represent and interpret data CAT item.
G. Identify, analyze, and synthesize
relevant external resources to pose or
solve problems.
3,4
Claim Content
Category Assessment Targets DOK
Minimum # Scored
Tasks
Minimum # Items
per Item Type Minimum
Number of
Items CAT PT/ECR SR CR
3. Communicating
Reasoning n/a
B. Construct, autonomously, chains of
reasoning that will justify or refute
propositions or conjectures.
3,4
p(6)=1.0 2 0 3 8
C. State logical assumptions being used. 2,3
D. Use the technique of breaking an
argument into cases. 2,3
E. Distinguish correct logic or reasoning
from that which is flawed, and—if there
is a flaw in the argument—explain what
it is.
2,3,4
F. Base arguments on concrete referents
such as objects, drawings, diagrams,
and actions.
2,3
G. At later grades, determine conditions
under which an argument does and
does not apply. (For example, area
increases with perimeter for squares,
but not for all plane figures.)
2
10
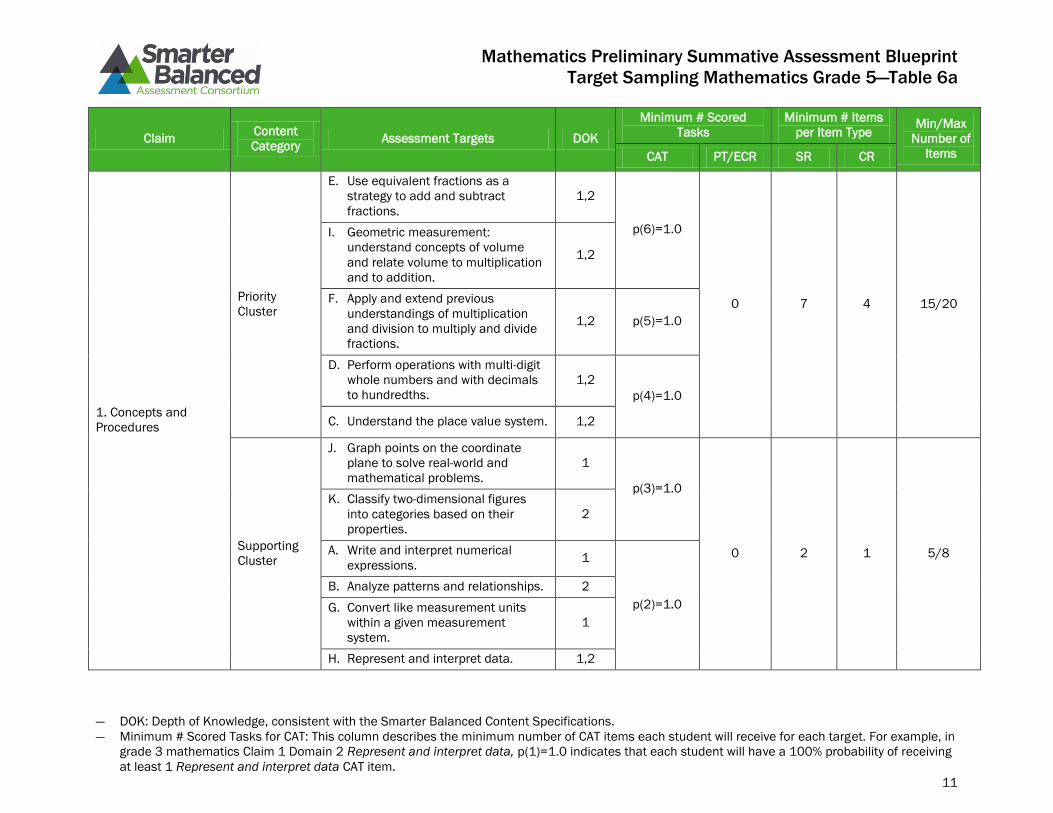
Mathematics Preliminary Summative Assessment Blueprint
Target Sampling Mathematics Grade 5—Table 6a
— DOK: Depth of Knowledge, consistent with the Smarter Balanced Content Specifications.
— Minimum # Scored Tasks for CAT: This column describes the minimum number of CAT items each student will receive for each target. For example, in
grade 3 mathematics Claim 1 Domain 2 Represent and interpret data, p(1)=1.0 indicates that each student will have a 100% probability of receiving
at least 1 Represent and interpret data CAT item.
Claim Content
Category Assessment Targets DOK
Minimum # Scored
Tasks
Minimum # Items
per Item Type Min/Max
Number of
Items CAT PT/ECR SR CR
1. Concepts and
Procedures
Priority
Cluster
E. Use equivalent fractions as a
strategy to add and subtract
fractions.
1,2
p(6)=1.0
0 7 4 15/20
I. Geometric measurement:
understand concepts of volume
and relate volume to multiplication
and to addition.
1,2
F. Apply and extend previous
understandings of multiplication
and division to multiply and divide
fractions.
1,2 p(5)=1.0
D. Perform operations with multi-digit
whole numbers and with decimals
to hundredths.
1,2
p(4)=1.0
C. Understand the place value system. 1,2
Supporting
Cluster
J. Graph points on the coordinate
plane to solve real-world and
mathematical problems.
1
p(3)=1.0
0 2 1 5/8
K. Classify two-dimensional figures
into categories based on their
properties.
2
A. Write and interpret numerical
expressions. 1
p(2)=1.0
B. Analyze patterns and relationships. 2
G. Convert like measurement units
within a given measurement
system.
1
H. Represent and interpret data. 1,2
11
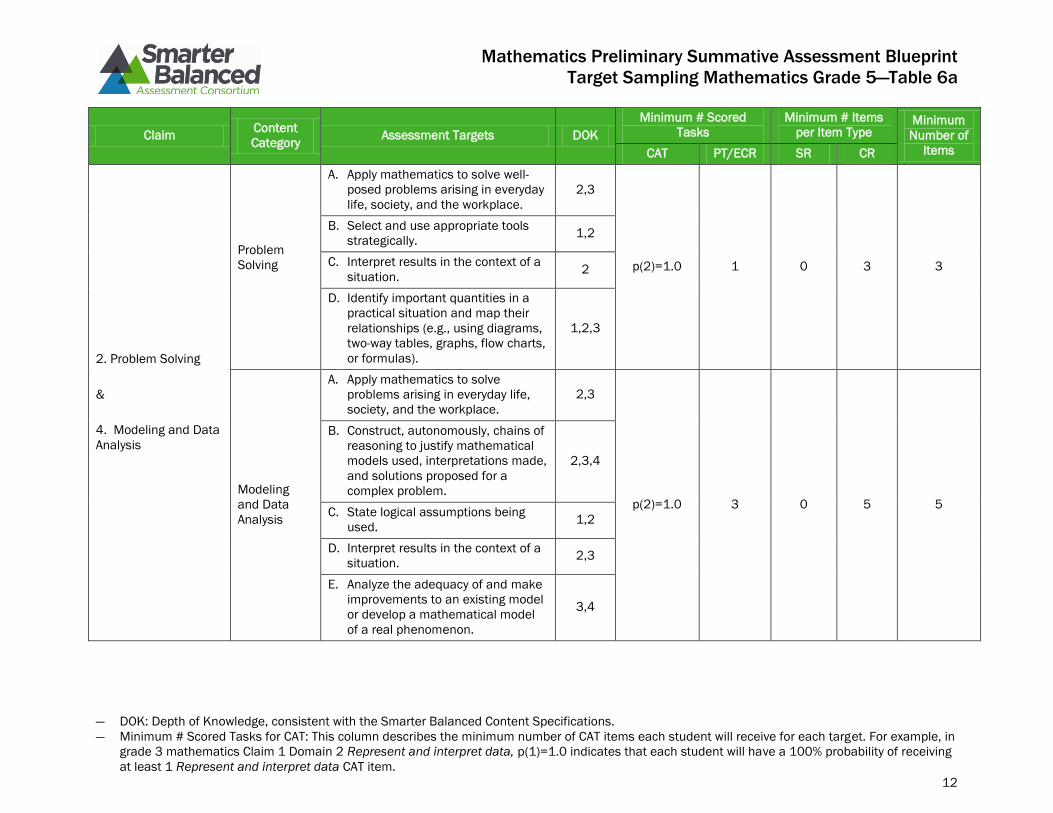
Mathematics Preliminary Summative Assessment Blueprint
Target Sampling Mathematics Grade 5—Table 6a
— DOK: Depth of Knowledge, consistent with the Smarter Balanced Content Specifications.
— Minimum # Scored Tasks for CAT: This column describes the minimum number of CAT items each student will receive for each target. For example, in
grade 3 mathematics Claim 1 Domain 2 Represent and interpret data, p(1)=1.0 indicates that each student will have a 100% probability of receiving
at least 1 Represent and interpret data CAT item.
Claim Content
Category Assessment Targets DOK
Minimum # Scored
Tasks
Minimum # Items
per Item Type Minimum
Number of
Items CAT PT/ECR SR CR
2. Problem Solving
&
4. Modeling and Data
Analysis
Problem
Solving
A. Apply mathematics to solve well-
posed problems arising in everyday
life, society, and the workplace.
2,3
p(2)=1.0 1 0 3 3
B. Select and use appropriate tools
strategically. 1,2
C. Interpret results in the context of a
situation. 2
D. Identify important quantities in a
practical situation and map their
relationships (e.g., using diagrams,
two-way tables, graphs, flow charts,
or formulas).
1,2,3
Modeling
and Data
Analysis
A. Apply mathematics to solve
problems arising in everyday life,
society, and the workplace.
2,3
p(2)=1.0 3 0 5 5
B. Construct, autonomously, chains of
reasoning to justify mathematical
models used, interpretations made,
and solutions proposed for a
complex problem.
2,3,4
C. State logical assumptions being
used. 1,2
D. Interpret results in the context of a
situation. 2,3
E. Analyze the adequacy of and make
improvements to an existing model
or develop a mathematical model
of a real phenomenon.
3,4
12
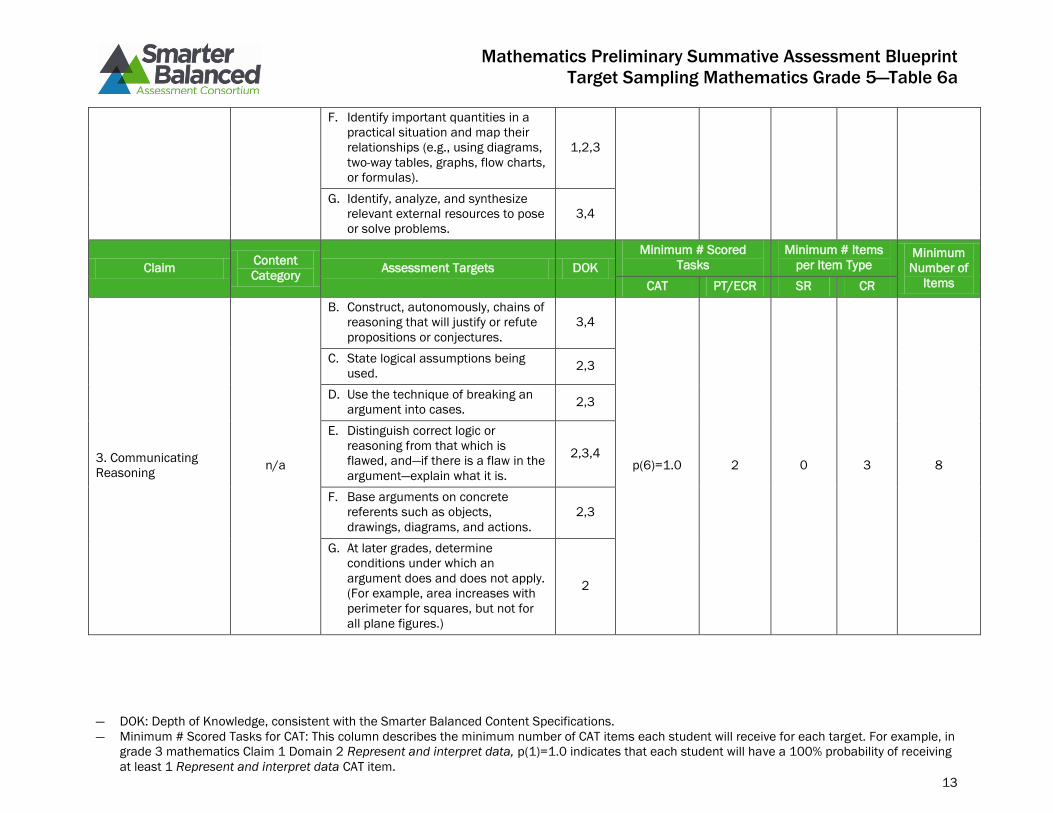
Mathematics Preliminary Summative Assessment Blueprint
Target Sampling Mathematics Grade 5—Table 6a
— DOK: Depth of Knowledge, consistent with the Smarter Balanced Content Specifications.
— Minimum # Scored Tasks for CAT: This column describes the minimum number of CAT items each student will receive for each target. For example, in
grade 3 mathematics Claim 1 Domain 2 Represent and interpret data, p(1)=1.0 indicates that each student will have a 100% probability of receiving
at least 1 Represent and interpret data CAT item.
F. Identify important quantities in a
practical situation and map their
relationships (e.g., using diagrams,
two-way tables, graphs, flow charts,
or formulas).
1,2,3
G. Identify, analyze, and synthesize
relevant external resources to pose
or solve problems.
3,4
Claim Content
Category Assessment Targets DOK
Minimum # Scored
Tasks
Minimum # Items
per Item Type Minimum
Number of
Items CAT PT/ECR SR CR
3. Communicating
Reasoning n/a
B. Construct, autonomously, chains of
reasoning that will justify or refute
propositions or conjectures.
3,4
p(6)=1.0 2 0 3 8
C. State logical assumptions being
used. 2,3
D. Use the technique of breaking an
argument into cases. 2,3
E. Distinguish correct logic or
reasoning from that which is
flawed, and—if there is a flaw in the
argument—explain what it is.
2,3,4
F. Base arguments on concrete
referents such as objects,
drawings, diagrams, and actions.
2,3
G. At later grades, determine
conditions under which an
argument does and does not apply.
(For example, area increases with
perimeter for squares, but not for
all plane figures.)
2
13
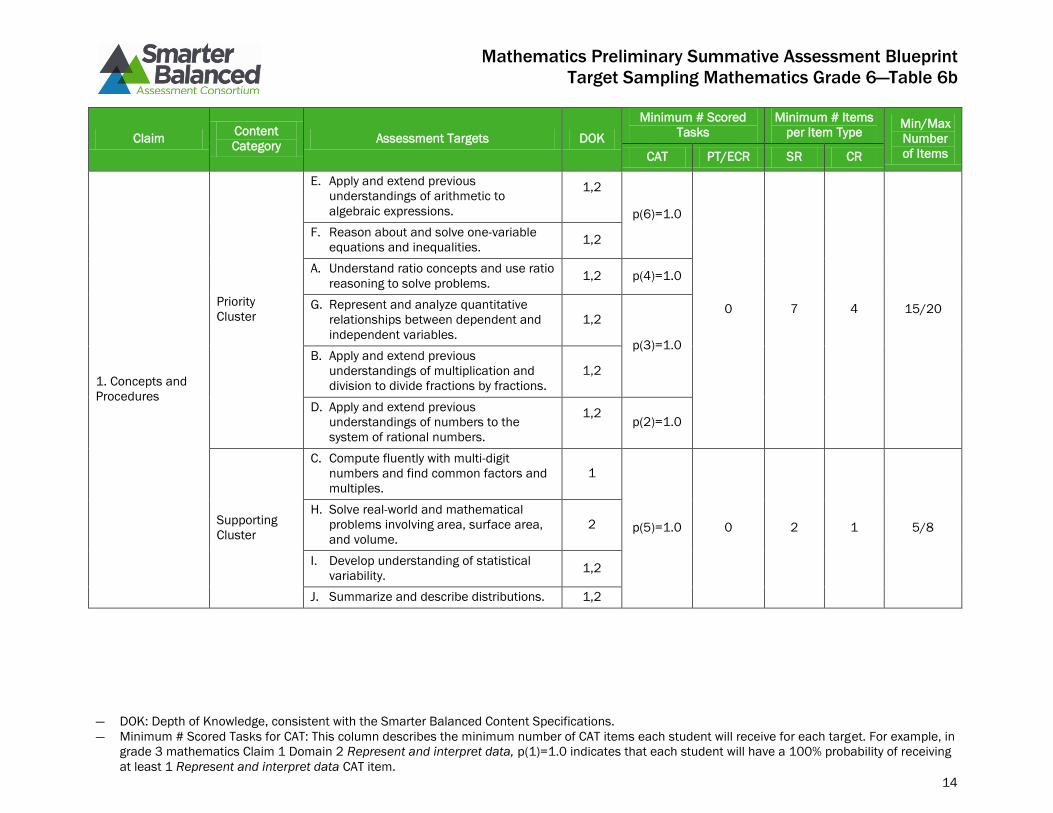
Mathematics Preliminary Summative Assessment Blueprint
Target Sampling Mathematics Grade 6—Table 6b
— DOK: Depth of Knowledge, consistent with the Smarter Balanced Content Specifications.
— Minimum # Scored Tasks for CAT: This column describes the minimum number of CAT items each student will receive for each target. For example, in
grade 3 mathematics Claim 1 Domain 2 Represent and interpret data, p(1)=1.0 indicates that each student will have a 100% probability of receiving
at least 1 Represent and interpret data CAT item.
Claim Content
Category Assessment Targets DOK
Minimum # Scored
Tasks
Minimum # Items
per Item Type Min/Max
Number
of Items CAT PT/ECR SR CR
1. Concepts and
Procedures
Priority
Cluster
E. Apply and extend previous
understandings of arithmetic to
algebraic expressions.
1,2
p(6)=1.0
0 7 4 15/20
F. Reason about and solve one-variable
equations and inequalities. 1,2
A. Understand ratio concepts and use ratio
reasoning to solve problems. 1,2 p(4)=1.0
G. Represent and analyze quantitative
relationships between dependent and
independent variables.
1,2
p(3)=1.0 B. Apply and extend previous
understandings of multiplication and
division to divide fractions by fractions.
1,2
D. Apply and extend previous
understandings of numbers to the
system of rational numbers.
1,2
p(2)=1.0
Supporting
Cluster
C. Compute fluently with multi-digit
numbers and find common factors and
multiples.
1
p(5)=1.0 0 2 1 5/8
H. Solve real-world and mathematical
problems involving area, surface area,
and volume.
2
I. Develop understanding of statistical
variability. 1,2
J. Summarize and describe distributions. 1,2
14
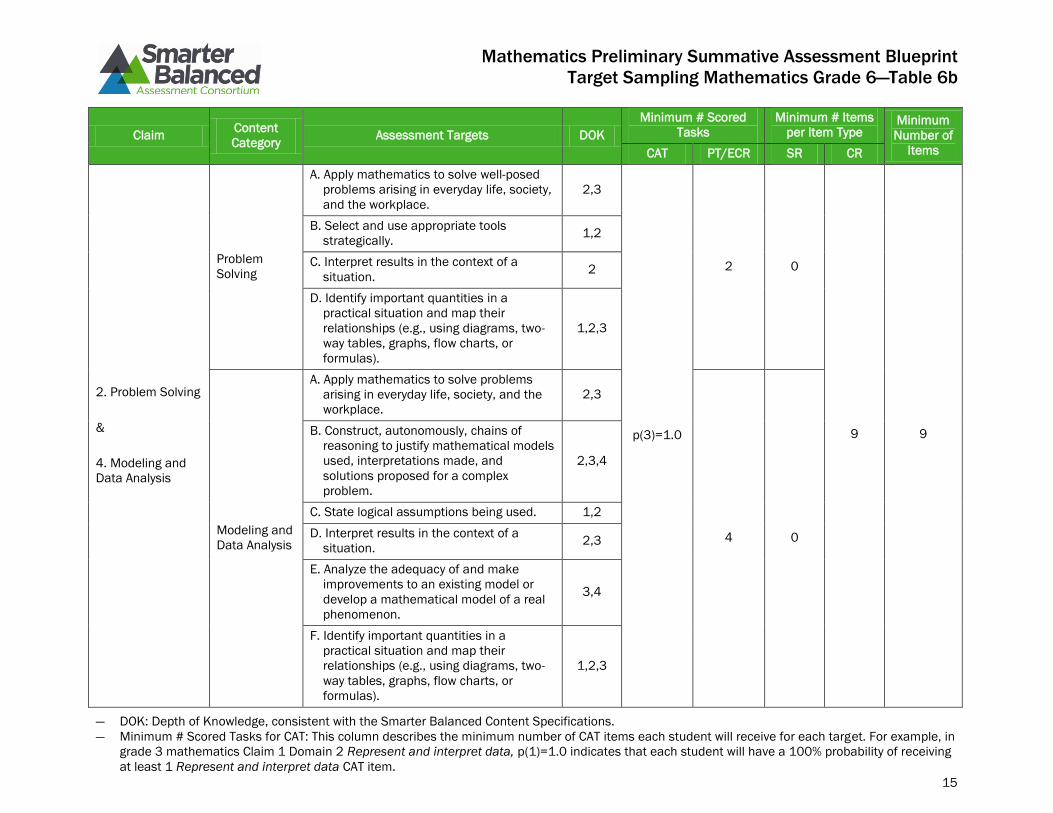
Mathematics Preliminary Summative Assessment Blueprint
Target Sampling Mathematics Grade 6—Table 6b
— DOK: Depth of Knowledge, consistent with the Smarter Balanced Content Specifications.
— Minimum # Scored Tasks for CAT: This column describes the minimum number of CAT items each student will receive for each target. For example, in
grade 3 mathematics Claim 1 Domain 2 Represent and interpret data, p(1)=1.0 indicates that each student will have a 100% probability of receiving
at least 1 Represent and interpret data CAT item.
Claim Content
Category Assessment Targets DOK
Minimum # Scored
Tasks
Minimum # Items
per Item Type Minimum
Number of
Items CAT PT/ECR SR CR
2. Problem Solving
&
4. Modeling and
Data Analysis
Problem
Solving
A. Apply mathematics to solve well-posed
problems arising in everyday life, society,
and the workplace.
2,3
p(3)=1.0
2 0
9 9
B. Select and use appropriate tools
strategically. 1,2
C. Interpret results in the context of a
situation. 2
D. Identify important quantities in a
practical situation and map their
relationships (e.g., using diagrams, two-
way tables, graphs, flow charts, or
formulas).
1,2,3
Modeling and
Data Analysis
A. Apply mathematics to solve problems
arising in everyday life, society, and the
workplace.
2,3
4 0
B. Construct, autonomously, chains of
reasoning to justify mathematical models
used, interpretations made, and
solutions proposed for a complex
problem.
2,3,4
C. State logical assumptions being used. 1,2
D. Interpret results in the context of a
situation. 2,3
E. Analyze the adequacy of and make
improvements to an existing model or
develop a mathematical model of a real
phenomenon.
3,4
F. Identify important quantities in a
practical situation and map their
relationships (e.g., using diagrams, two-
way tables, graphs, flow charts, or
formulas).
1,2,3
15
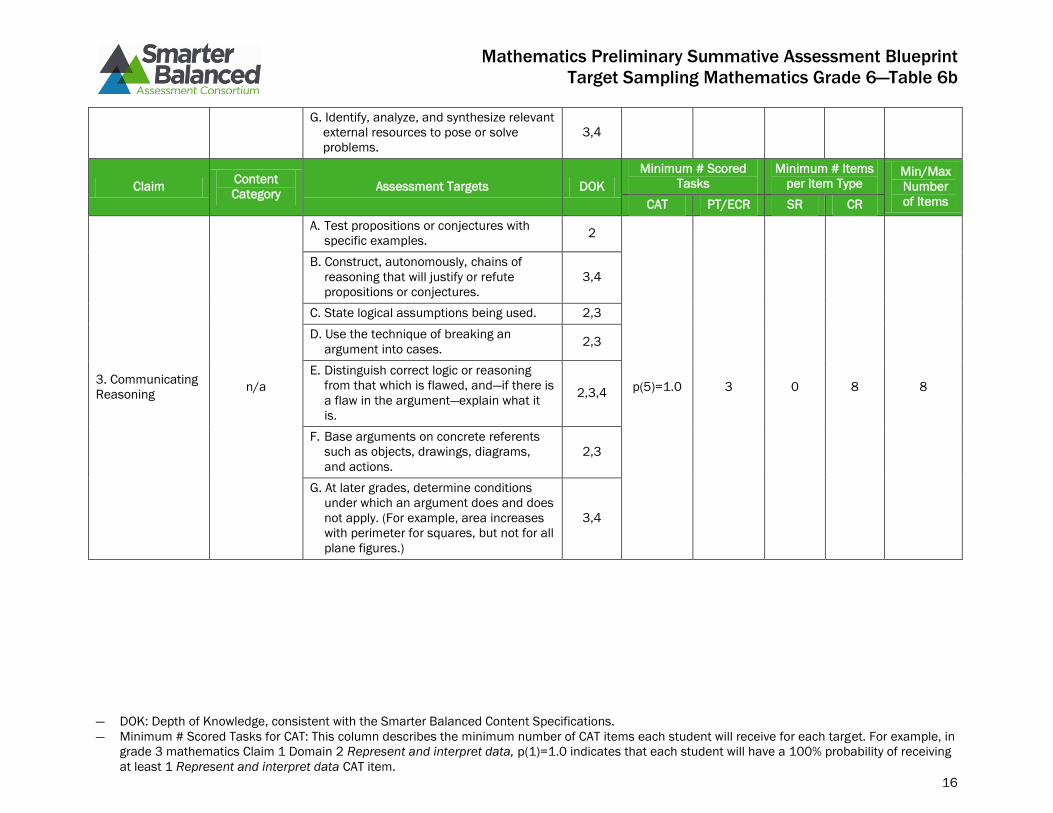
Mathematics Preliminary Summative Assessment Blueprint
Target Sampling Mathematics Grade 6—Table 6b
— DOK: Depth of Knowledge, consistent with the Smarter Balanced Content Specifications.
— Minimum # Scored Tasks for CAT: This column describes the minimum number of CAT items each student will receive for each target. For example, in
grade 3 mathematics Claim 1 Domain 2 Represent and interpret data, p(1)=1.0 indicates that each student will have a 100% probability of receiving
at least 1 Represent and interpret data CAT item.
G. Identify, analyze, and synthesize relevant
external resources to pose or solve
problems.
3,4
Claim Content
Category Assessment Targets DOK
Minimum # Scored
Tasks
Minimum # Items
per Item Type Min/Max
Number
of Items CAT PT/ECR SR CR
3. Communicating
Reasoning n/a
A. Test propositions or conjectures with
specific examples. 2
p(5)=1.0 3 0 8 8
B. Construct, autonomously, chains of
reasoning that will justify or refute
propositions or conjectures.
3,4
C. State logical assumptions being used. 2,3
D. Use the technique of breaking an
argument into cases. 2,3
E. Distinguish correct logic or reasoning
from that which is flawed, and—if there is
a flaw in the argument—explain what it
is.
2,3,4
F. Base arguments on concrete referents
such as objects, drawings, diagrams,
and actions.
2,3
G. At later grades, determine conditions
under which an argument does and does
not apply. (For example, area increases
with perimeter for squares, but not for all
plane figures.)
3,4
16
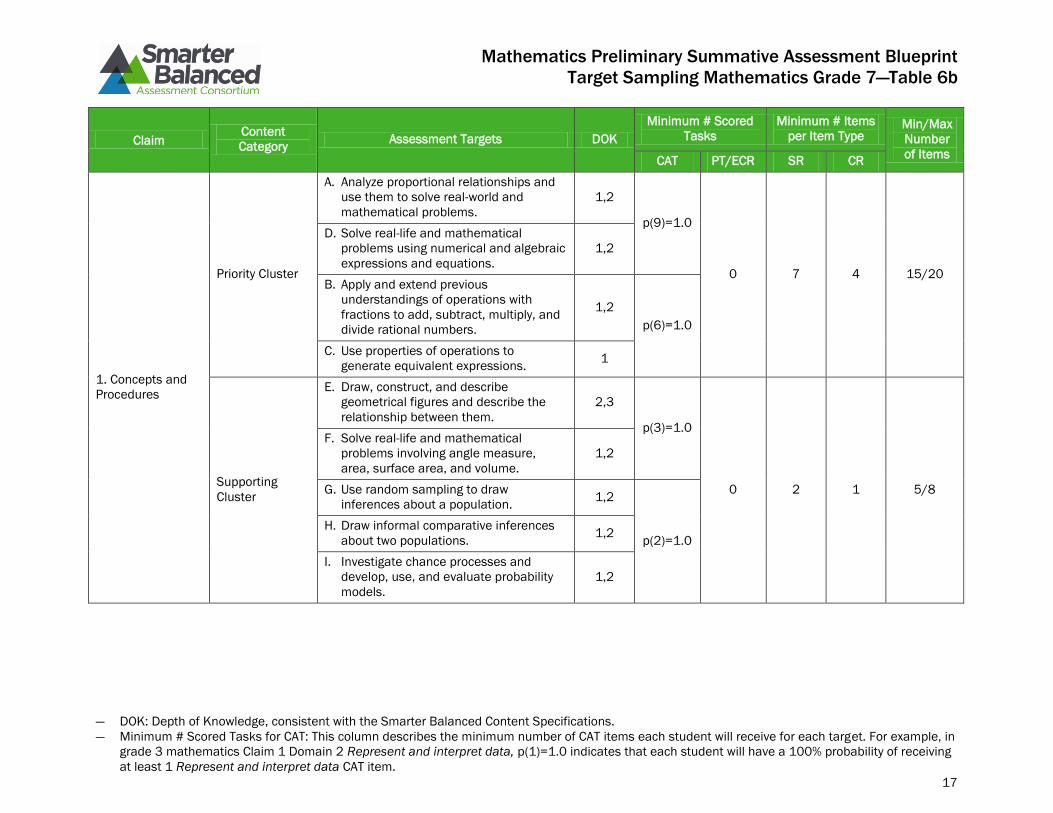
Mathematics Preliminary Summative Assessment Blueprint
Target Sampling Mathematics Grade 7—Table 6b
— DOK: Depth of Knowledge, consistent with the Smarter Balanced Content Specifications.
— Minimum # Scored Tasks for CAT: This column describes the minimum number of CAT items each student will receive for each target. For example, in
grade 3 mathematics Claim 1 Domain 2 Represent and interpret data, p(1)=1.0 indicates that each student will have a 100% probability of receiving
at least 1 Represent and interpret data CAT item.
Claim Content
Category Assessment Targets DOK
Minimum # Scored
Tasks
Minimum # Items
per Item Type Min/Max
Number
of Items CAT PT/ECR SR CR
1. Concepts and
Procedures
Priority Cluster
A. Analyze proportional relationships and
use them to solve real-world and
mathematical problems.
1,2
p(9)=1.0
0 7 4 15/20
D. Solve real-life and mathematical
problems using numerical and algebraic
expressions and equations.
1,2
B. Apply and extend previous
understandings of operations with
fractions to add, subtract, multiply, and
divide rational numbers.
1,2
p(6)=1.0
C. Use properties of operations to
generate equivalent expressions. 1
Supporting
Cluster
E. Draw, construct, and describe
geometrical figures and describe the
relationship between them.
2,3
p(3)=1.0
0 2 1 5/8
F. Solve real-life and mathematical
problems involving angle measure,
area, surface area, and volume.
1,2
G. Use random sampling to draw
inferences about a population. 1,2
p(2)=1.0
H. Draw informal comparative inferences
about two populations. 1,2
I. Investigate chance processes and
develop, use, and evaluate probability
models.
1,2
17
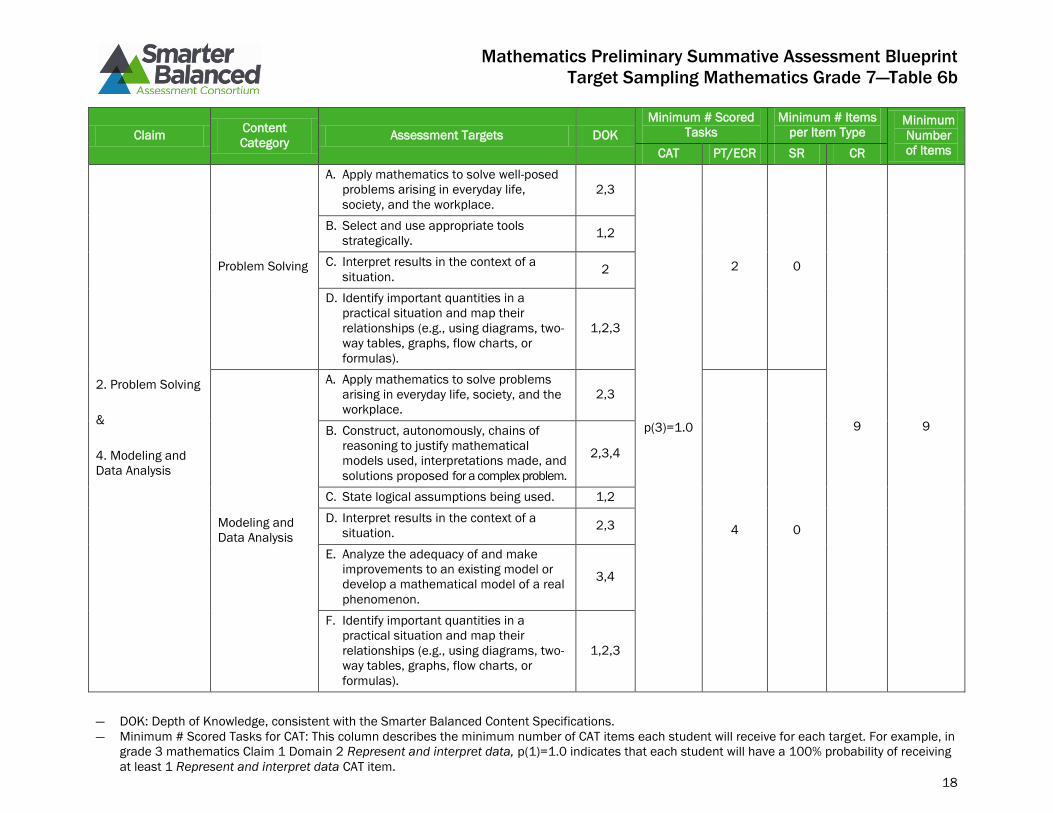
Mathematics Preliminary Summative Assessment Blueprint
Target Sampling Mathematics Grade 7—Table 6b
— DOK: Depth of Knowledge, consistent with the Smarter Balanced Content Specifications.
— Minimum # Scored Tasks for CAT: This column describes the minimum number of CAT items each student will receive for each target. For example, in
grade 3 mathematics Claim 1 Domain 2 Represent and interpret data, p(1)=1.0 indicates that each student will have a 100% probability of receiving
at least 1 Represent and interpret data CAT item.
Claim Content
Category Assessment Targets DOK
Minimum # Scored
Tasks
Minimum # Items
per Item Type Minimum
Number
of Items CAT PT/ECR SR CR
2. Problem Solving
&
4. Modeling and
Data Analysis
Problem Solving
A. Apply mathematics to solve well-posed
problems arising in everyday life,
society, and the workplace.
2,3
p(3)=1.0
2 0
9 9
B. Select and use appropriate tools
strategically. 1,2
C. Interpret results in the context of a
situation. 2
D. Identify important quantities in a
practical situation and map their
relationships (e.g., using diagrams, two-
way tables, graphs, flow charts, or
formulas).
1,2,3
Modeling and
Data Analysis
A. Apply mathematics to solve problems
arising in everyday life, society, and the
workplace.
2,3
4 0
B. Construct, autonomously, chains of
reasoning to justify mathematical
models used, interpretations made, and
solutions proposed for a complex problem.
2,3,4
C. State logical assumptions being used. 1,2
D. Interpret results in the context of a
situation. 2,3
E. Analyze the adequacy of and make
improvements to an existing model or
develop a mathematical model of a real
phenomenon.
3,4
F. Identify important quantities in a
practical situation and map their
relationships (e.g., using diagrams, two-
way tables, graphs, flow charts, or
formulas).
1,2,3
18

Mathematics Preliminary Summative Assessment Blueprint
Target Sampling Mathematics Grade 7—Table 6b
— DOK: Depth of Knowledge, consistent with the Smarter Balanced Content Specifications.
— Minimum # Scored Tasks for CAT: This column describes the minimum number of CAT items each student will receive for each target. For example, in
grade 3 mathematics Claim 1 Domain 2 Represent and interpret data, p(1)=1.0 indicates that each student will have a 100% probability of receiving
at least 1 Represent and interpret data CAT item.
G. Identify, analyze, and synthesize
relevant external resources to pose or
solve problems.
3,4
Claim Content
Category Assessment Targets DOK
Minimum # Scored
Tasks
Minimum # Items
per Item Type Minimum
Number
of Items CAT PT/ECR SR CR
3. Communicating
Reasoning n/a
A. Test propositions or conjectures with
specific examples. 2
p(5)=1.0 3 0 8 8
B. Construct, autonomously, chains of
reasoning that will justify or refute
propositions or conjectures.
3,4
C. State logical assumptions being used. 2,3
D. Use the technique of breaking an
argument into cases. 2,3
E. Distinguish correct logic or reasoning
from that which is flawed, and—if there
is a flaw in the argument—explain what
it is.
2,3,4
F. Base arguments on concrete referents
such as objects, drawings, diagrams,
and actions.
2,3
G. At later grades, determine conditions
under which an argument does and
does not apply. (For example, area
increases with perimeter for squares,
but not for all plane figures.)
3,4
19
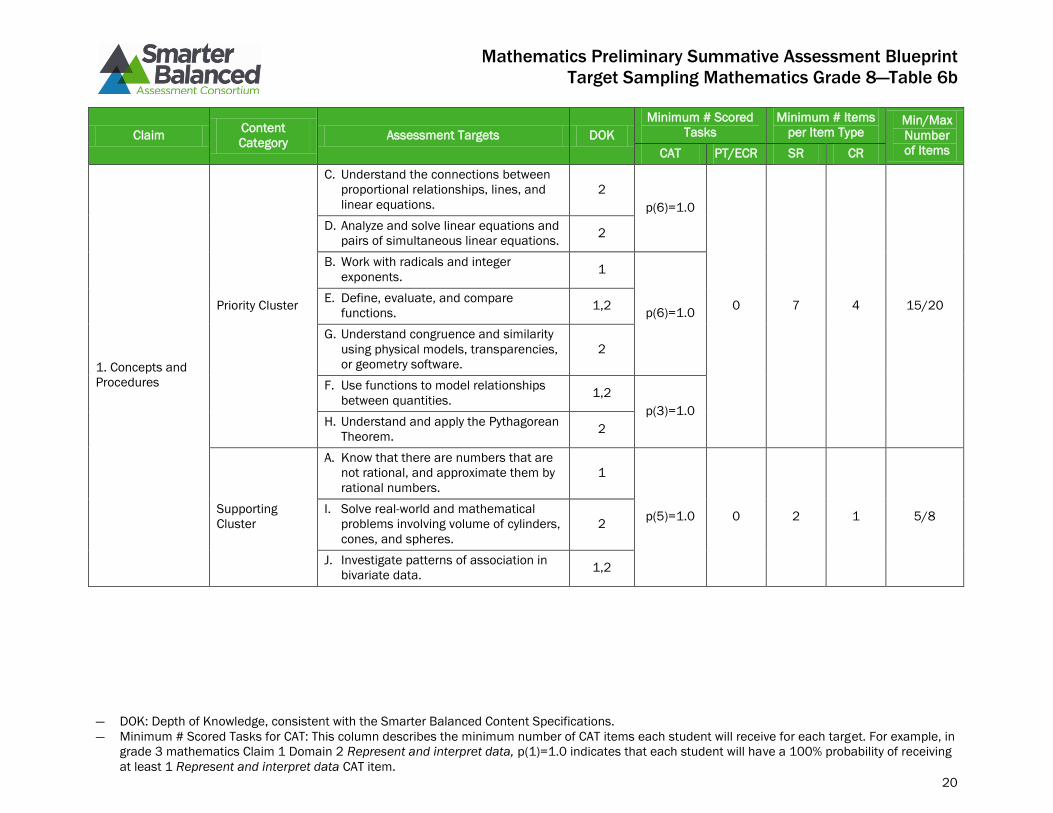
Mathematics Preliminary Summative Assessment Blueprint
Target Sampling Mathematics Grade 8—Table 6b
— DOK: Depth of Knowledge, consistent with the Smarter Balanced Content Specifications.
— Minimum # Scored Tasks for CAT: This column describes the minimum number of CAT items each student will receive for each target. For example, in
grade 3 mathematics Claim 1 Domain 2 Represent and interpret data, p(1)=1.0 indicates that each student will have a 100% probability of receiving
at least 1 Represent and interpret data CAT item.
Claim Content
Category Assessment Targets DOK
Minimum # Scored
Tasks
Minimum # Items
per Item Type Min/Max
Number
of Items CAT PT/ECR SR CR
1. Concepts and
Procedures
Priority Cluster
C. Understand the connections between
proportional relationships, lines, and
linear equations.
2
p(6)=1.0
0 7 4 15/20
D. Analyze and solve linear equations and
pairs of simultaneous linear equations. 2
B. Work with radicals and integer
exponents. 1
p(6)=1.0
E. Define, evaluate, and compare
functions. 1,2
G. Understand congruence and similarity
using physical models, transparencies,
or geometry software.
2
F. Use functions to model relationships
between quantities. 1,2
p(3)=1.0 H. Understand and apply the Pythagorean
Theorem. 2
Supporting
Cluster
A. Know that there are numbers that are
not rational, and approximate them by
rational numbers.
1
p(5)=1.0 0 2 1 5/8 I. Solve real-world and mathematical
problems involving volume of cylinders,
cones, and spheres.
2
J. Investigate patterns of association in
bivariate data. 1,2
20
Mathematics Preliminary Summative Assessment Blueprint
Target Sampling Mathematics Grade 8—Table 6b
— DOK: Depth of Knowledge, consistent with the Smarter Balanced Content Specifications.
— Minimum # Scored Tasks for CAT: This column describes the minimum number of CAT items each student will receive for each target. For example, in
grade 3 mathematics Claim 1 Domain 2 Represent and interpret data, p(1)=1.0 indicates that each student will have a 100% probability of receiving
at least 1 Represent and interpret data CAT item.
Claim Content
Category Assessment Targets DOK
Minimum # Scored
Tasks
Minimum # Items
per Item Type Minimum
Number of
Items CAT PT/ECR SR CR
2. Problem Solving
&
4. Modeling and
Data Analysis
Problem Solving
A. Apply mathematics to solve well-posed
problems arising in everyday life,
society, and the workplace.
2,3
p(3)=1.0
2 0
9 9
B. Select and use appropriate tools
strategically. 1,2
C. Interpret results in the context of a
situation. 2
D. Identify important quantities in a
practical situation and map their
relationships (e.g., using diagrams,
two-way tables, graphs, flow charts, or
formulas).
1,2,3
Modeling and
Data Analysis
A. Apply mathematics to solve problems
arising in everyday life, society, and the
workplace.
2,3
4 0
B. Construct, autonomously, chains of
reasoning to justify mathematical
models used, interpretations made,
and solutions proposed for a complex
problem.
2,3,4
C. State logical assumptions being used. 1,2
D. Interpret results in the context of a
situation. 2,3
E. Analyze the adequacy of and make
improvements to an existing model or
develop a mathematical model of a
real phenomenon.
3,4
F. Identify important quantities in a
practical situation and map their
relationships (e.g., using diagrams,
two-way tables, graphs, flow charts, or
formulas).
1,2,3
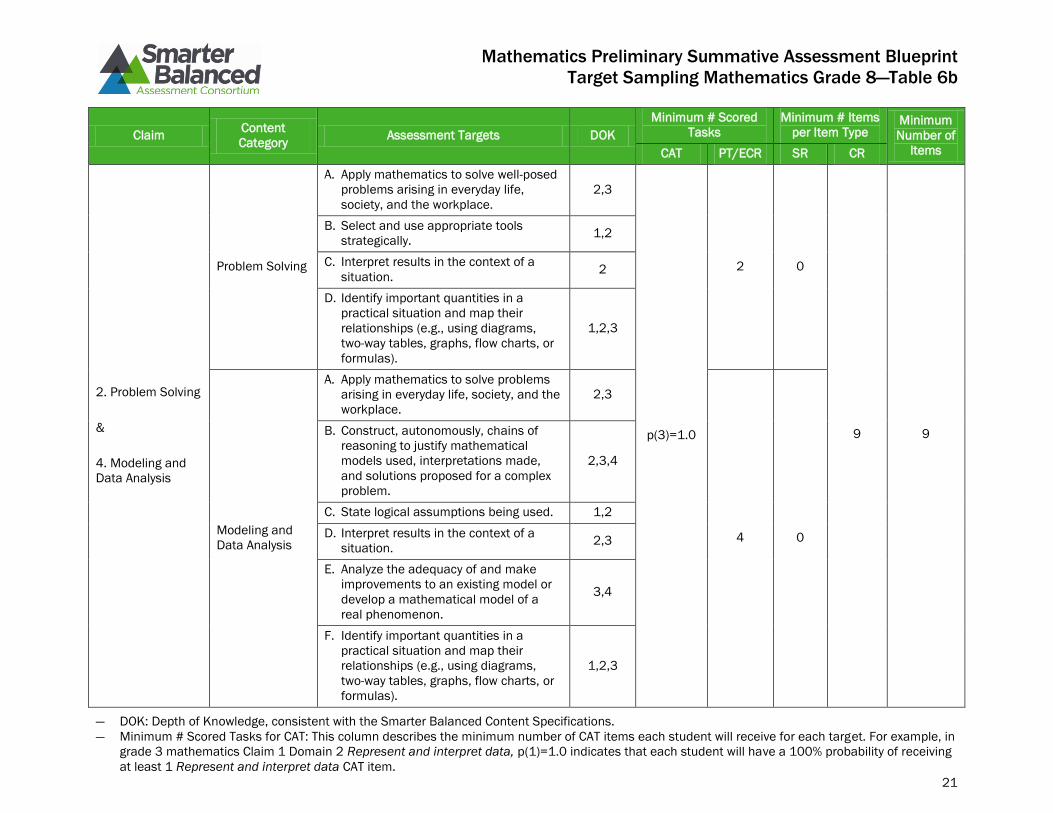
21

Mathematics Preliminary Summative Assessment Blueprint
Target Sampling Mathematics Grade 8—Table 6b
— DOK: Depth of Knowledge, consistent with the Smarter Balanced Content Specifications.
— Minimum # Scored Tasks for CAT: This column describes the minimum number of CAT items each student will receive for each target. For example, in
grade 3 mathematics Claim 1 Domain 2 Represent and interpret data, p(1)=1.0 indicates that each student will have a 100% probability of receiving
at least 1 Represent and interpret data CAT item.
G. Identify, analyze, and synthesize
relevant external resources to pose or
solve problems.
3,4
Claim Content
Category Assessment Targets DOK
Minimum # Scored
Tasks
Minimum # Items
per Item Type Minimum
Number of
Items CAT PT/ECR SR CR
3. Communicating
Reasoning n/a
A. Test propositions or conjectures with
specific examples. 2
p(5)=1.0 3 0 8 8
B. Construct, autonomously, chains of
reasoning that will justify or refute
propositions or conjectures.
3,4
C. State logical assumptions being used. 2,3
D. Use the technique of breaking an
argument into cases. 2,3
E. Distinguish correct logic or reasoning
from that which is flawed, and—if there
is a flaw in the argument—explain what
it is.
2,3,4
F. Base arguments on concrete referents
such as objects, drawings, diagrams,
and actions.
2,3
G. At later grades, determine conditions
under which an argument does and
does not apply. (For example, area
increases with perimeter for squares,
but not for all plane figures.)
3,4
22