matlab-based modeling to study the effects of partial shading on pv array characteristics-dhz
DESCRIPTION
IEEE-RESEARCH PAPERTRANSCRIPT
302 IEEE TRANSACTIONS ON ENERGY CONVERSION, VOL. 23, NO. 1, MARCH 2008
MATLAB-Based Modeling to Study the Effectsof Partial Shading on PV Array Characteristics
Hiren Patel and Vivek Agarwal, Senior Member, IEEE
Abstract—The performance of a photovoltaic (PV) array isaffected by temperature, solar insolation, shading, and arrayconfiguration. Often, the PV arrays get shadowed, completely orpartially, by the passing clouds, neighboring buildings and towers,trees, and utility and telephone poles. The situation is of particularinterest in case of large PV installations such as those used indistributed power generation schemes. Under partially shadedconditions, the PV characteristics get more complex with multiplepeaks. Yet, it is very important to understand and predict them inorder to extract the maximum possible power. This paper presentsa MATLAB-based modeling and simulation scheme suitable forstudying the I–V and P–V characteristics of a PV array undera nonuniform insolation due to partial shading. It can also beused for developing and evaluating new maximum power pointtracking techniques, especially for partially shaded conditions. Theproposed models conveniently interface with the models of powerelectronic converters, which is a very useful feature. It can also beused as a tool to study the effects of shading patterns on PV panelshaving different configurations. It is observed that, for a given num-ber of PV modules, the array configuration (how many modules inseries and how many in parallel) significantly affects the maximumavailable power under partially shaded conditions. This is anotheraspect to which the developed tool can be applied. The model hasbeen experimentally validated and the usefulness of this researchis highlighted with the help of several illustrations. The MATLABcode of the developed model is freely available for download.
Index Terms—Array configuration, maximum powerpoint tracking (MPPT), partial shading, photovoltaic (PV)characteristics.
I. INTRODUCTION
WITH a spurt in the use of nonconventional energy
sources, photovoltaic (PV) installations are being in-
creasingly employed in several applications, such as distributed
power generation and stand-alone systems. However, a major
challenge in using a PV source is to tackle its nonlinear output
characteristics, which vary with temperature and solar inso-
lation. The characteristics get more complicated if the entire
array does not receive uniform insolation, as in partially cloudy
(shaded) conditions, resulting in multiple peaks. The presence
of multiple peaks reduces the effectiveness of the existing maxi-
mum power point tracking (MPPT) schemes [1]–[3] due to their
inability to discriminate between the local and global peaks.
Nevertheless, it is very important to understand and predict the
Manuscript received October 30, 2006; revised March 25, 2007. Paper no.TEC-00506-2006.
H. Patel is with the Department of Electrical Engineering, Indian Instituteof Technology–Bombay, Mumbai 400 076, India. He is also with the Sarva-janik College of Engineering and Technology, Surat 395001, India (e-mail:[email protected]).
V. Agarwal is with the Department of Electrical Engineering, Indian In-stitute of Technology–Bombay, Mumbai 400 076, India (e-mail: [email protected]).
Digital Object Identifier 10.1109/TEC.2007.914308
PV characteristics in order to use a PV installation effectively,
under all conditions.
Over the years, several researchers have studied the charac-
teristics of PV modules and the factors that affect them [4]–[7].
Walker [4] has proposed a MATLAB-based model of a PV mod-
ule to simulate its characteristics for studying the effect of tem-
perature, insolation, and load variation on the available power.
However, the model does not consider the effect of shading on
the PV characteristics. Alonso-Gracia et al. [5] have experimen-
tally obtained the I–V characteristics of the PV module and the
constituent cells to study the effect of partial shading. How-
ever, their work is limited to module-level study and does not
discuss the shading effects on an entire PV array. Kawamura
et al. [6] have also investigated the effect of shading on the
output of the PV modules and the associated change in their
I–V characteristics. However, the I–V and P–V characteristics
of the single module, considered in their study, do not predict
the presence of multiple steps and peaks, which are common in
the I–V and P–V characteristics of large PV arrays that receive
nonuniform insolation. A numerical algorithm, which considers
the mismatch in individual PV cells and their shading levels, has
also been proposed [8] to simulate the complex characteristics
of a PV array. It requires each element (each cell of the module,
bypass diode, blocking diode, etc.) to be represented by a math-
ematical expression. This can render accurate results, though at
the expense of complex modeling, involving large and complex
matrix computations, more computation time and efforts, and
higher memory requirement.
Some researchers have studied the effects of fluctuations
in PV power on the utility and connected systems. Kern
et al. [9] have studied the consequences of the shading of PV,
due to passing clouds, on the fluctuations of PV power genera-
tion, and therefore, on the performance of the electrical utility
to which it is connected. Giraud and Salameh [10], using a
neural-network-based model, have also investigated the effects
of passing clouds on a grid-connected PV system with battery
storage. It is important to select a proper size of the PV array
and batteries in such systems [11]. Otherwise, a sudden, large
change in PV power because of insolation variation, caused by
shading, may lead to instability. Shading caused due to passing
clouds also has a financial implication on the utility. Jewell and
Unruh have carried out an economic analysis to estimate the
cost of the fluctuations in power generation from a PV source
[12].
It is not only the size (i.e., the total number of modules)
of the PV array but also its configuration (i.e., the number of
modules in series and parallel, respectively) that significantly
affects its power output, and therefore, the performance of the
system under partially shaded conditions.
0885-8969/$25.00 © 2008 IEEE
Authorized licensed use limited to: IEEE Xplore. Downloaded on May 10,2010 at 19:15:00 UTC from IEEE Xplore. Restrictions apply.

PATEL AND AGARWAL: MATLAB-BASED MODELING TO STUDY THE EFFECTS OF PARTIAL SHADING ON PV ARRAY CHARACTERISTICS 303
From the preceding paragraphs, it may be concluded that,
while it is very important to model, study, and understand the
effects of shading on PV arrays, a “simple-to-use,” accurate and
economical computer-aided design (CAD) tool is not available
for the purpose. Therefore, it is felt that there is a need for
a flexible, interactive, and comprehensive simulation model,
which can serve as the following.
1) A basic tool for professionals and researchers to accurately
predict the PV characteristics (including multiple peaks)
and output power under partially shaded conditions.
2) A design aid for users who want to build actual PV sys-
tems, study the stability and interfacing aspects (e.g., dis-
tributed generation applications) without going into the
intricate details (e.g., semiconductor physics).
3) A tool to study the effect of array configuration on the
output power for a likely/known shading pattern.
4) A planning tool that can help in the installation of efficient
and optimum PV arrays in a given surrounding.
5) A tool to develop and validate the effectiveness of existing
and new MPPT schemes.
Software packages like PV-Spice, PV-DesignPro, SolarPro,
PVcad, and PVsyst are available, but have one or more of the
following limitations:
1) commercial, proprietary in nature and expensive;
2) too complex to model the shading effects;
3) do not support the interfacing of the PV arrays with actual
power electronic systems.
This paper presents a MATLAB-based simulator cum learn-
ing tool, which can be used to enhance the understanding and
predict the I–V and P–V characteristics of large PV arrays. It can
be used to study the effect of temperature and insolation varia-
tion, varying shading patterns (characterized by multiple peaks
in the power–voltage curves), and the role of array configuration
on the PV characteristics. A notable advantage of the presented
paper is that the PV array model can be interfaced with the mod-
els of actual systems (e.g., power electronic converters) making
it possible to simulate complete PV systems and their interaction
with other systems. The reason for using MATLAB is that it is
available in most academic, research, and industrial organiza-
tions and considered useful for several engineering disciplines.
It provides several features that can be used to simulate highly
complex systems, electronic and power electronic circuits and
systems, and distributed generation power systems [13]–[15].
The usefulness of the proposed tool is demonstrated with the
help of several illustrative examples.
II. MODEL OF A PV ARRAY
A PV cell can be represented by an equivalent circuit, as
shown in Fig. 1. The characteristics of this PV cell can be
obtained using standard equations [4]. For simulating an entire
PV array, the model of a PV module is developed first. Each
PV module considered in this paper comprises 36 PV cells
connected in series providing an open circuit voltage (Voc) =
21 V and a short-circuit current (Isc) = 3.74 A.
The shading pattern for a large array is very complex to model.
A special categorization and terminology is used in this paper
Fig. 1. Equivalent circuit of a PV cell.
Fig. 2. PV array terminologies. (a) PV module. (b) Series-assembly with twoseries-connected subassemblies S1 and S2. (c) Group. (d) PV array with groupsG1 to G4.
to describe the various components of a PV array. These are
explained with the help of Fig. 2. A “subassembly” is formed
with several series-connected PV modules receiving the same
level of insolation. Several such series-connected subassem-
blies, each with a different level of insolation, form a series
assembly [Fig. 2(b)]. Series assemblies, having similar shading
patterns, form a “group” [Fig. 2(c)]. Various groups (with ith
group represented by “Gi”), having different shading patterns
and connected in parallel, form a PV array, as shown in Fig. 2(d).
III. SIMULATION PROCEDURE
This section describes the procedure used for simulating the
I–V and P–V characteristics of a partially shaded PV array.
It is important to understand how the shading pattern and the
PV array structure are defined in MATLAB using the proposed
scheme. This procedure consists of defining groups, assemblies,
etc., for use with the MATLAB model developed corresponding
to Fig. 2(d). This is explained with the help of illustration 1. To
begin with, a simple case is considered with just two different
shades on the PV array.
A. Illustration 1
Given a PV array consisting of 1000 PV modules arranged
into 100 series assemblies, connected in parallel, each having 10
modules. It is desired to obtain the I–V and P–V characteristics
of the various components (module through group, as described
in Fig. 2) of this PV array, which consists of three groups with
different insolation patterns, as given in Table I. Groups G1
through G3 have 40, 38, and 22 series assemblies, respectively.
The complete PV array is shown in Fig. 3. As seen in Fig. 3,
Authorized licensed use limited to: IEEE Xplore. Downloaded on May 10,2010 at 19:15:00 UTC from IEEE Xplore. Restrictions apply.

304 IEEE TRANSACTIONS ON ENERGY CONVERSION, VOL. 23, NO. 1, MARCH 2008
TABLE ISHADING PATTERN AND CONFIGURATION OF THE ARRAY USED IN
ILLUSTRATION
Fig. 3. PV array configuration for illustration 1, corresponding to the shadingpattern of Table I.
Fig. 4. PV array with bypass and blocking diodes. The dark modules implyshading.
only two different insolation levels are considered for simplicity.
Shaded modules, receiving an insolation, λ = 0.1 kW/m2 , are
indicated in dark color.
The aforementioned illustration explains the method and
the format in which the input parameters are fed and the array
configuration is described in the software to obtain the PV
characteristics.
1) Effect of Bypass and Blocking Diodes on PV Characteris-
tics: Fig. 4 shows a PV array with bypass and blocking diodes
connected in the array. It is important to note that the character-
istics of an array with bypass and blocking diodes differ from
that of an array without these diodes. The developed simulation
tool has a provision to simulate the array characteristics, for any
value of temperature, insolation, and for any array configuration,
with and without the bypass and blocking diodes. Illustration
1 considers the case where bypass diodes are connected across
every module and at least one blocking diode is connected in
series with each of the series assemblies, as shown in Fig. 4. To
Fig. 5. Screen shot of the MATLAB command window showing how the inputparameters are fed and array configuration is described in the software.
learn more on how the characteristics differ in these two cases,
an illustration (illustration 2) is included in a later section.
Fig. 5 shows a screen shot of the MATLAB command window
through which the given array configuration, temperature, and
the insolation level(s) are described to the software. The matrix
U of size G × 3, where G is the number of groups, represents the
array configuration. Each row indicates a group with a particu-
lar shading pattern on the series assemblies within that group.
The elements of each row represent the number of unshaded
and shaded modules, respectively, in a series assembly, and the
number of such series assemblies in the group. This implies that
the first row of U is same as the first row of Table I corresponding
to G1 and so on. “Diodes = 1” indicates the presence of bypass
and blocking diodes, while their absence is indicated by entering
“Diodes = 0.” “Highinsol” and “Lowinsol” are the insolation
levels (λ = 1 and λ = 0.1 kW/m2) on the unshaded and shaded
modules, respectively. Similarly, “Thigh” and “Tlow” denote
the working temperatures (in degrees Celsius) of the respective
modules.
Once the information is fed into the software, various win-
dows pop up on the monitor, as shown in Fig. 6. These windows
display the I–V and P–V characteristics of different components
of the PV array described in Fig. 2.
The I–V and P–V characteristics of the two PV (shaded and
unshaded modules of Fig. 3) modules at the same temperature
but at different insolation levels are shown in Fig. 6. It is
Authorized licensed use limited to: IEEE Xplore. Downloaded on May 10,2010 at 19:15:00 UTC from IEEE Xplore. Restrictions apply.

PATEL AND AGARWAL: MATLAB-BASED MODELING TO STUDY THE EFFECTS OF PARTIAL SHADING ON PV ARRAY CHARACTERISTICS 305
Fig. 6. Characteristics of the PV modules under different insolation levels (λ = 1 and λ = 0.1 kW/m2 ). (a) I–V characteristics. (b) P–V characteristics.
Fig. 7. Characteristics of series assemblies with different insolation levels. (a)I–V characteristics. (b) P–V characteristics.
assumed that a shaded module consists of at least three shaded
cells displaying the characteristics shown in Fig. 6(a) and (b). If
these two PV modules are connected in series, they will conduct
the same current, but the voltage across them will be different.
In order to obtain the I–V characteristics of the series-connected
modules (series assembly) conducting a current Io , the voltages
across these modules, V1 and V2 , are added to determine the
resultant output voltage. The characteristics for series assembly
are, thus, obtained internally by the software by applying
similar procedure at all the points on the I–V curve of the
series-connected modules.
Fig. 7 shows the resulting characteristics of series assemblies
C1, C2, and C3 belonging to groups G1, G2, and G3, respec-
Fig. 8. Output characteristics of the groups (parallel-connected series assem-blies). (a) I–V characteristics. (b) P–V characteristics.
tively. If similar series assemblies having identical insolation
patterns are connected in parallel to form a group, the current
output is multiplied, but there is no change in the output voltage.
Fig. 8 shows the characteristics of these groups. To obtain the
overall resultant characteristics of all these groups (i.e., of the
entire array), a common voltage is considered, while the current
output of each of these groups is added to obtain the resultant
current. The resultant characteristics of the PV array are shown
in Fig. 9.
IV. SIMULATION RESULTS WITH THE PROPOSED MODEL
This section describes the usefulness of the proposed sim-
ulation model in simulating and understanding the effect of
Authorized licensed use limited to: IEEE Xplore. Downloaded on May 10,2010 at 19:15:00 UTC from IEEE Xplore. Restrictions apply.

306 IEEE TRANSACTIONS ON ENERGY CONVERSION, VOL. 23, NO. 1, MARCH 2008
Fig. 9. Output characteristics of the entire array considered in illustration 1.(a) I–V characteristics. (b) P–V characteristics.
bypass and blocking diodes, array configuration, varying inso-
lation level(s), and different shading pattern(s) on the global
peak power and its position. This is studied with the help of
illustrations 2, 3, and 4, given next.
A. Illustration 2
The effect of the bypass and blocking diodes on the PV char-
acteristics under partially shaded conditions has been simulated
for the array described in Table I.
The curves C1, C2, and C3, in Fig. 10, represent the I–V and
P–V characteristics of the array in the following three cases,
respectively: 1) under uniform insolation (λ = 1 kW/m2); 2)
under partially shaded condition (λ = 1 and λ = 0.1 kW/m2)
and without diodes; and 3) under partially shaded condition as
in case (2), but with diodes.
It is seen from the I–V characteristics shown in Fig. 10(a) that
the presence of bypass diodes will allow the unshaded modules
of all the series assemblies to conduct their maximum current
at a given insolation and temperature. On the other hand, if the
bypass diodes are not present, the shaded modules will limit
the current output of the unshaded modules of the series assem-
bly. This may not only lead to a thermal destruction of the PV
modules but may also decrease the available output power from
the PV array. The blocking diodes will prevent the reverse cur-
rent through the series assemblies, which generate lower output
voltage as compared to the others connected in parallel. This re-
verse current may cause excessive heat generation and thermal
breakdown of PV modules. Fig. 10 reveals that the array having
these diodes introduces multiple steps in the I–V characteristics
Fig. 10. Three different cases discussed in illustration 2. (a) I–V curves. (b)P–V curves.
and multiple peaks in the P–V characteristics, under the partially
shaded conditions.
B. Illustration 3
The objective of this illustration is to simulate the response of
a partially shaded PV array with different configurations. Con-
sider an array of 300 PV modules organized into three groups
G1, G2, and G3 with three, five, and x series assemblies, respec-
tively, where x is obtained by deducting the number of series
assemblies of G1 and G2 from the total parallel-connected se-
ries assemblies. Each row of Table II describes the different
array configuration considered. It is assumed that four modules
of the series assemblies of group G1, six modules of the series
assemblies of G2, and none in G3 experience a low insolation
(λ = 0.5 kW/m2).
Fig. 11 shows that the peak power from the PV array un-
der nonuniform insolation is dependent on the configuration
in which the modules are connected. It shows the existence of
multiple peaks, whose number is equal to the number of dif-
ferent shading patterns on the PV array. Fig. 11 reveals that
maximum power is obtained with “C6,” which represents the
array configuration having 30 series assemblies, each with 10
series-connected modules. Therefore, it is desirable to have a
large number of parallel-connected series assemblies, each with
a lower number of series-connected modules in it.
C. Illustration 4
A PV array consisting of 900 modules is considered. With the
array configuration and shading pattern as defined in Table III,
Authorized licensed use limited to: IEEE Xplore. Downloaded on May 10,2010 at 19:15:00 UTC from IEEE Xplore. Restrictions apply.
PATEL AND AGARWAL: MATLAB-BASED MODELING TO STUDY THE EFFECTS OF PARTIAL SHADING ON PV ARRAY CHARACTERISTICS 307
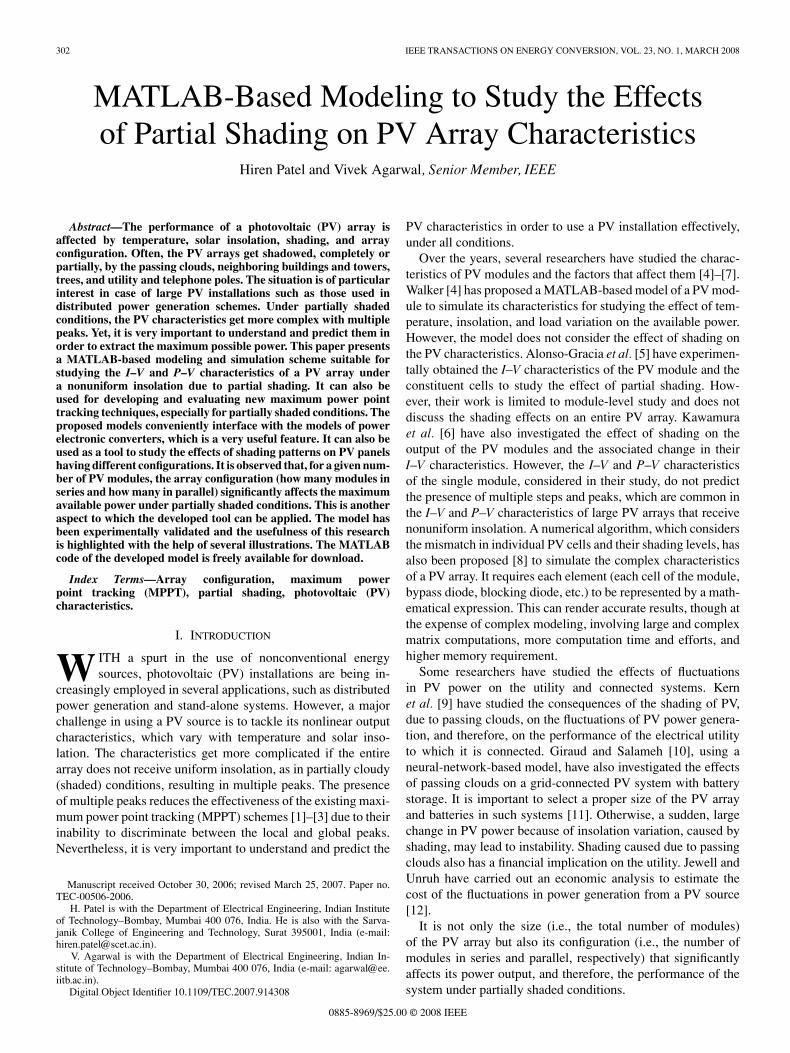
TABLE IIVARIOUS CONFIGURATIONS OF THE PV ARRAY FOR ILLUSTRATION 3
TABLE IIIPV ARRAY CONFIGURATION TO STUDY THE GLOBAL PEAK AND ITS POSITION
Fig. 11. P–V curves showing the effect of array configuration. “Ci” implies acurve for the ith configuration of Table II.
it is desired to investigate the P–V curves of this array as the
insolation changes in steps of 0.15 kW/m2 . The response is
shown in Fig. 12.
Fig. 12 shows the resulting P–V characteristics at various
insolation levels. It is observed that the number of prominent
peaks increases with decrease in the insolation level on the
shaded modules. At higher insolation levels, the global peak
lies toward the voltage source region and shifts more toward the
current source region with a decrease in the insolation.
V. GENERALIZED MODEL AND EVALUATION OF MPPT
This section discusses a generalized model, which can be
used to simulate PV characteristics under partial shading. Un-
like the model presented in Section III, which considers only two
different shades, this model can accept different levels of inso-
lation, temperature, shading patterns, and array configurations.
Illustration 5 discusses this model and the input interface.
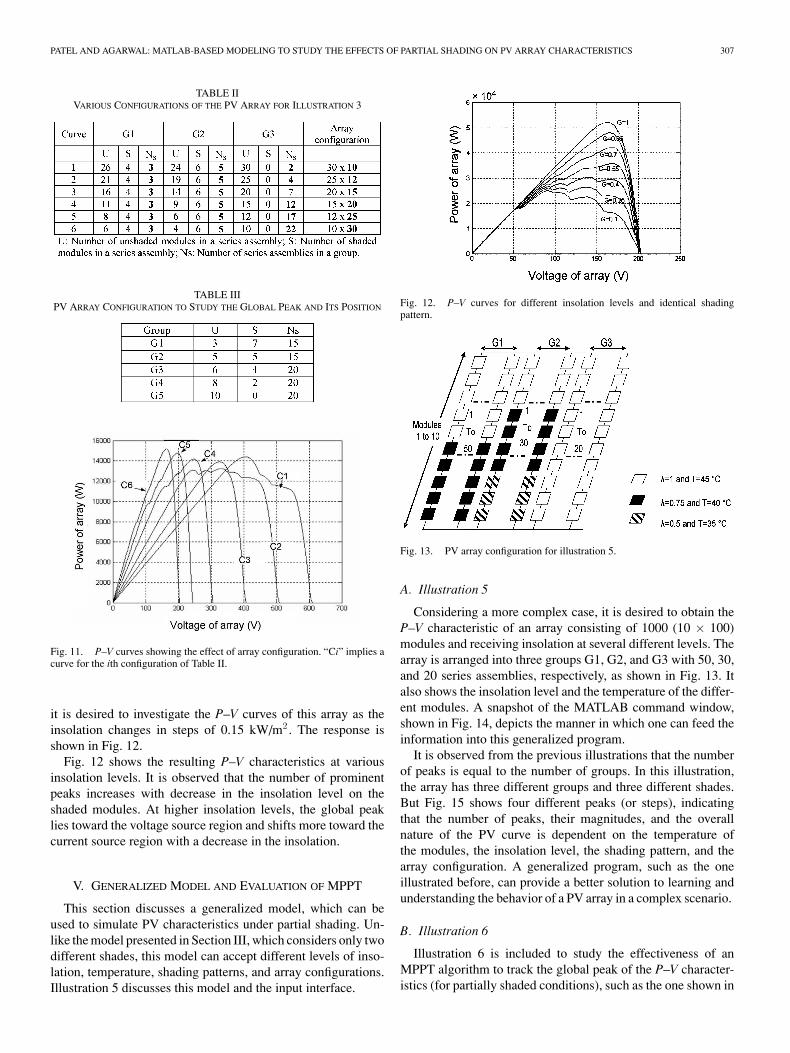
Fig. 12. P–V curves for different insolation levels and identical shadingpattern.
Fig. 13. PV array configuration for illustration 5.
A. Illustration 5
Considering a more complex case, it is desired to obtain the
P–V characteristic of an array consisting of 1000 (10 × 100)
modules and receiving insolation at several different levels. The
array is arranged into three groups G1, G2, and G3 with 50, 30,
and 20 series assemblies, respectively, as shown in Fig. 13. It
also shows the insolation level and the temperature of the differ-
ent modules. A snapshot of the MATLAB command window,
shown in Fig. 14, depicts the manner in which one can feed the
information into this generalized program.
It is observed from the previous illustrations that the number
of peaks is equal to the number of groups. In this illustration,
the array has three different groups and three different shades.
But Fig. 15 shows four different peaks (or steps), indicating
that the number of peaks, their magnitudes, and the overall
nature of the PV curve is dependent on the temperature of
the modules, the insolation level, the shading pattern, and the
array configuration. A generalized program, such as the one
illustrated before, can provide a better solution to learning and
understanding the behavior of a PV array in a complex scenario.
B. Illustration 6
Illustration 6 is included to study the effectiveness of an
MPPT algorithm to track the global peak of the P–V character-
istics (for partially shaded conditions), such as the one shown in
Authorized licensed use limited to: IEEE Xplore. Downloaded on May 10,2010 at 19:15:00 UTC from IEEE Xplore. Restrictions apply.
308 IEEE TRANSACTIONS ON ENERGY CONVERSION, VOL. 23, NO. 1, MARCH 2008
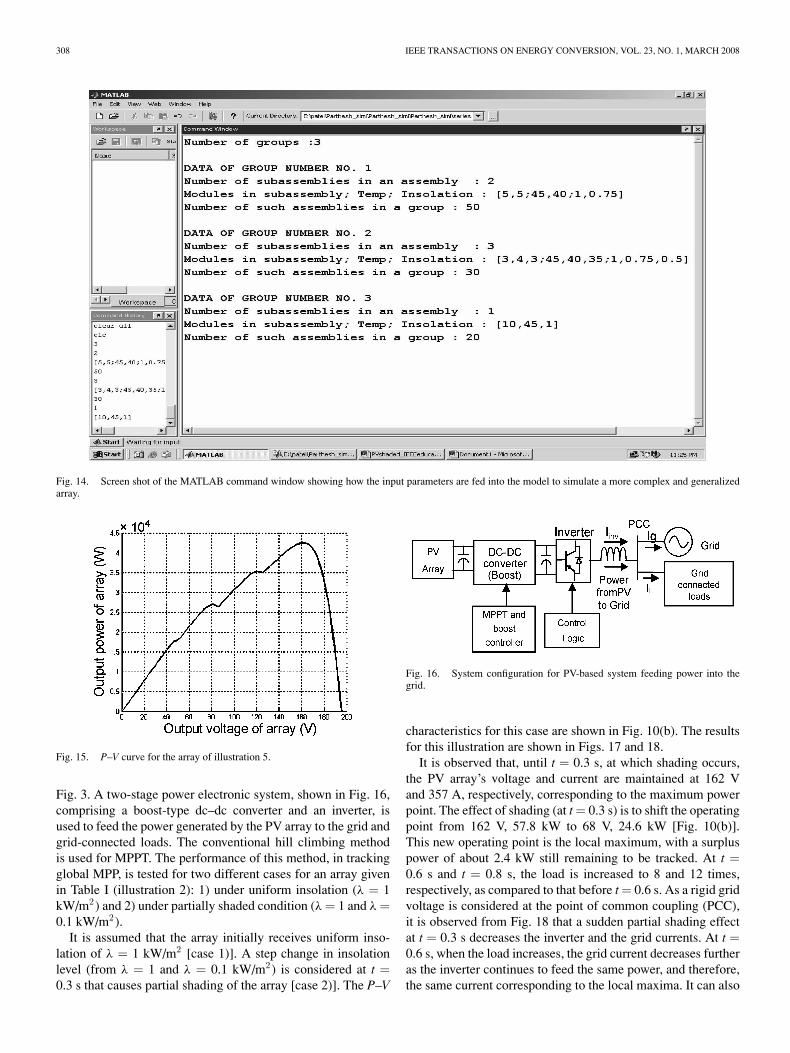
Fig. 14. Screen shot of the MATLAB command window showing how the input parameters are fed into the model to simulate a more complex and generalizedarray.
Fig. 15. P–V curve for the array of illustration 5.
Fig. 3. A two-stage power electronic system, shown in Fig. 16,
comprising a boost-type dc–dc converter and an inverter, is
used to feed the power generated by the PV array to the grid and
grid-connected loads. The conventional hill climbing method
is used for MPPT. The performance of this method, in tracking
global MPP, is tested for two different cases for an array given
in Table I (illustration 2): 1) under uniform insolation (λ = 1
kW/m2) and 2) under partially shaded condition (λ = 1 and λ =
0.1 kW/m2).
It is assumed that the array initially receives uniform inso-
lation of λ = 1 kW/m2 [case 1)]. A step change in insolation
level (from λ = 1 and λ = 0.1 kW/m2) is considered at t =
0.3 s that causes partial shading of the array [case 2)]. The P–V
Fig. 16. System configuration for PV-based system feeding power into thegrid.
characteristics for this case are shown in Fig. 10(b). The results
for this illustration are shown in Figs. 17 and 18.
It is observed that, until t = 0.3 s, at which shading occurs,
the PV array’s voltage and current are maintained at 162 V
and 357 A, respectively, corresponding to the maximum power
point. The effect of shading (at t = 0.3 s) is to shift the operating
point from 162 V, 57.8 kW to 68 V, 24.6 kW [Fig. 10(b)].
This new operating point is the local maximum, with a surplus
power of about 2.4 kW still remaining to be tracked. At t =
0.6 s and t = 0.8 s, the load is increased to 8 and 12 times,
respectively, as compared to that before t = 0.6 s. As a rigid grid
voltage is considered at the point of common coupling (PCC),
it is observed from Fig. 18 that a sudden partial shading effect
at t = 0.3 s decreases the inverter and the grid currents. At t =
0.6 s, when the load increases, the grid current decreases further
as the inverter continues to feed the same power, and therefore,
the same current corresponding to the local maxima. It can also
Authorized licensed use limited to: IEEE Xplore. Downloaded on May 10,2010 at 19:15:00 UTC from IEEE Xplore. Restrictions apply.

PATEL AND AGARWAL: MATLAB-BASED MODELING TO STUDY THE EFFECTS OF PARTIAL SHADING ON PV ARRAY CHARACTERISTICS 309
Fig. 17. (a)–(c) Output voltage, current, and output power from the PV array.(d) Output voltage of the boost converter (illustration 6).
Fig. 18. (a) Variation in the load current IL . (b) Current fed from inverterIinv . (c) Grid current Ig (illustration 6).
be observed from Fig. 18 that no power is transferred to the
grid, after t = 0.8 s. In fact, the grid has to supply the power. If
the grid is replaced by a weak source, it may lead to a collapse
of the system. This illustration highlights the limitation of the
conventional MPPT schemes when multiple peaks are present.
They cannot distinguish between the global and local peaks.
VI. TESTING AND VALIDATION OF MODEL
The simulation model was tested with an actual PV ar-
ray, shown in Fig. 19, comprising two groups, each with
two series assemblies of six 38FR36 PV modules. The rat-
ing of the PV modules are Pmax = 38 W, IMPP = 2.29 A,
VMPP = 16.6 V, Isc = 2.55 A, and Voc = 21.5 V at an inso-
lation level of 1000 W/m2
and 25 ◦C temperature. The mea-
surements were recorded with and without the bypass diodes
(connected across the shaded modules) and blocking diodes
(one connected in series with each series assembly).
Fig. 19. Experimental setup for validation of the model.
Fig. 20. Simulation and experimental results on the test setup. (a) I–V char-acteristics. (b) P–V characteristics.
Fig. 20 shows the simulated and experimental results. The
shading effect was artificially generated by covering two
modules of each series assembly of the first group with partially
transparent gelatin paper. It is observed that the simulated
results closely match the measured values. The average solar
flux on the tilted array for the simulation model was considered
as 680 W/m2
that is in accordance with the solar flux at 2:10
P.M. on November 12 at Bombay, India [16]. The discrepancies
in the curves at some points may be due to two reasons: 1)
the change in irradiation over a time span during which the
measurements were carried out and 2) voltage drop across the
diode is neglected in the simulation.
Fig. 20 shows the characteristics of the PV array used for
experiments. As expected and discussed in illustration 2, the
Authorized licensed use limited to: IEEE Xplore. Downloaded on May 10,2010 at 19:15:00 UTC from IEEE Xplore. Restrictions apply.
310 IEEE TRANSACTIONS ON ENERGY CONVERSION, VOL. 23, NO. 1, MARCH 2008
presence of diodes introduces an additional peak in the P–V
characteristic and generates more output power compared to the
case where the diodes are absent.
VII. CONCLUSION
A method to obtain the I–V and P–V characteristics of a PV
array, having a large number of series- and/or parallel-connected
modules, under partially shaded conditions is described. The PV
curves show multiple peaks under partially shaded conditions.
The existing MPPT schemes, which assume a unique maximum
power point, therefore, remain inadequate. The magnitude of
the global peak is dependent on the PV array configuration and
shading pattern besides the commonly known factors, i.e., inso-
lation level and temperature. It is demonstrated that, if the likely
shading pattern on the PV array is known, the simulation model
is handy to design the most optimum configuration of the PV
array to extract the maximum power. The results obtained with
this model can be effectively used with off-line capabilities of
MATLAB/SIMULINK to investigate the effectiveness of MPPT
methods working under nonuniform insolation conditions. The
generalized model is available for free download from the fol-
lowing Web site: http://www.ee.iitb.ac.in/uma/∼phiren/.
REFERENCES
[1] E. Koutroulis, K. Kalaitzakis, and N. C. Voulgaris, “Development of amicrocontroller-based photovoltaic maximum power point tracking con-trol system,” IEEE Trans. Power Electron., vol. 16, no. 1, pp. 46–54, Jan.2001.
[2] K. H. Hussein and I. Muta, “Maximum photovoltaic power tracking: Analgorithm for rapidly changing atmospheric conditions,” Proc. Inst. Electr.Eng. Gener., Transmiss. Distrib., vol. 142, no. 1, pp. 59–64, Jan. 1995.
[3] S. Jain and V. Agarwal, “A new algorithm for rapid tracking of approximatemaximum power point in photovoltaics systems,” IEEE Power Electron.Lett., vol. 2, no. 1, pp. 16–19, Mar. 2004.
[4] G. Walker, “Evaluating MPPT converter topologies using a MATLAB PVmodel,” J. Electr. Electron. Eng. Aust., vol. 21, no. 1, pp. 49–56, 2001.
[5] M. C. Alonso-Gracia, J. M. Ruiz, and F. Chenlo, “Experimental study ofmismatch and shading effects in the,” Solar Energy Mater. Solar Cells,vol. 90, no. 3, pp. 329–340, Feb. 2006.
[6] H. Kawamura, K. Naka, N. Yonekura, S. Yamanaka, H. Kawamura,H. Ohno, and K. Naito, “Simulation of I–V characteristics of a PV modulewith shaded PV cells,” Solar Energy Mater. Solar Cells, vol. 75, no. 3/4,pp. 613–621, Feb. 2003.
[7] T. Shimizu, M. Hirakata, T. Kamezawa, and H. Watanabe, “Generationcontrol circuit for photovoltaic modules,” IEEE Trans. Power Electron.,vol. 16, no. 3, pp. 293–300, May 2001.
[8] V. Quaschning and R. Hanitsch, “Numerical simulation of current–voltagecharacteristics of photovoltaic systems with shaded solar cells,” SolarEnergy, vol. 56, no. 6, pp. 513–520, Feb. 1996.
[9] E. C. Kern, E. M. Gulachenski, and G. A. Kern, “Cloud effects on dis-tributed photovoltaic generation: Slow transients at the Gardner, Mas-sachusetts photovoltaic experiment,” IEEE Trans. Energy Convers., vol. 4,no. 2, pp. 184–190, Jun. 1989.
[10] F. Giraud and Z. Salameh, “Analysis of the effects of a passing cloud ona grid-interactive photovoltaic system with battery storage using neuralnetworks,” IEEE Trans. Energy Convers., vol. 14, no. 4, pp. 1572–1577,Dec. 1999.
[11] M. G. Jaboori, M. M. Saied, and A. R. Hanafy, “A contribution to thesimulation and design optimization of photovoltaic systems,” IEEE Trans.Energy Convers., vol. 6, no. 3, pp. 401–406, Sep. 1991.
[12] W. T. Jewell and T. D. Unruh, “Limits on cloud-induced fluctuation inphotovoltaic generation,” IEEE Trans. Energy Convers., vol. 5, no. 1,pp. 8–14, Mar. 1990.
[13] N. Reddy and V. Agarwal, “Utility interactive hybrid distributed genera-tion scheme with compensation feature,” IEEE Trans. Energy Convers.,vol. 22, no. 3, pp. 666–673, 2007.
[14] V. F. Pires, J. Fernando, and A. Silva, “Teaching nonlinear model-ing, simulation, and control of electronic power converters using MAT-LAB/SIMULINK,” IEEE Trans. Educ., vol. 45, no. 3, pp. 253–261, Aug.2002.
[15] E. Allen, N. LaWhite, Y. Yoon, J. Chapman, and M. Ilic, “Interac-tive object-oriented simulation of interconnected power systems usingSIMULINK,” IEEE Trans. Educ., vol. 44, no. 1, pp. 87–94, Feb. 2001.
[16] S. P. Sukhatme, Solar Energy: Principles of Thermal Collection and Stor-age, 2nd ed. New Delhi, India: Tata McGraw-Hill, 1996.
Hiren Patel received the B.E. degree in electricalengineering from the S.V. Regional College of Engi-neering and Technology (now S.V. National Instituteof Technology), South Gujarat University, Surat, In-dia, in 1996, and the M.Tech. degree in energy sys-tems in 2003 from the Indian Institute of Technology–Bombay (IITB), Mumbai, India, where he is cur-rently working toward the Ph.D. degree in electricalengineering.
He is currently an Assistant Professor at the Sarva-janik College of Engineering and Technology, Surat.
His current research interests include computer-aided simulation techniques,distributed generation, and renewable energy, especially energy extraction fromphotovoltaic arrays.
Vivek Agarwal (S’92–M’95–SM’01) received theBachelor’s degree in physics from St. Stephen’sCollege, Delhi University, New Delhi, India, the Inte-grated Master’s degree in electrical engineering fromthe Indian Institute of Science, Bangalore, India, andthe Ph.D. degree from the Department of Electricaland Computer Engineering, University of Victoria,British Columbia, Canada.
He was a Research Engineer at Statpower Tech-nologies, Burnaby, Canada. In 1995, he joined theDepartment of Electrical Engineering, Indian Insti-
tute of Technology–Bombay, Mumbai, India, where he is currently a Professor.His current research interests include power electronics, the modeling and sim-ulation of new power converter configurations, intelligent and hybrid controlof power electronic systems, power quality issues, electromagnetic interfer-ence/electromagnetic compatibility (EMI/EMC) issues, and conditioning of en-ergy from nonconventional sources.
Prof. Agarwal is a Fellow of the Institution of Electronics and Telecommuni-cation Engineers (IETE) and a Life Member of the Indian Society for TechnicalEducation (ISTE).
Authorized licensed use limited to: IEEE Xplore. Downloaded on May 10,2010 at 19:15:00 UTC from IEEE Xplore. Restrictions apply.