matlab/r dictionary r meetup nyc january 7, 2010 harlan harris [email protected] @harlanh marck...
TRANSCRIPT

MATLAB/R DictionaryR meetup NYC
January 7, 2010
Harlan [email protected]
@HarlanH
Marck [email protected]
@wahalulu
MATLAB and the MATLAB logo are registered trademarks of The Mathworks.
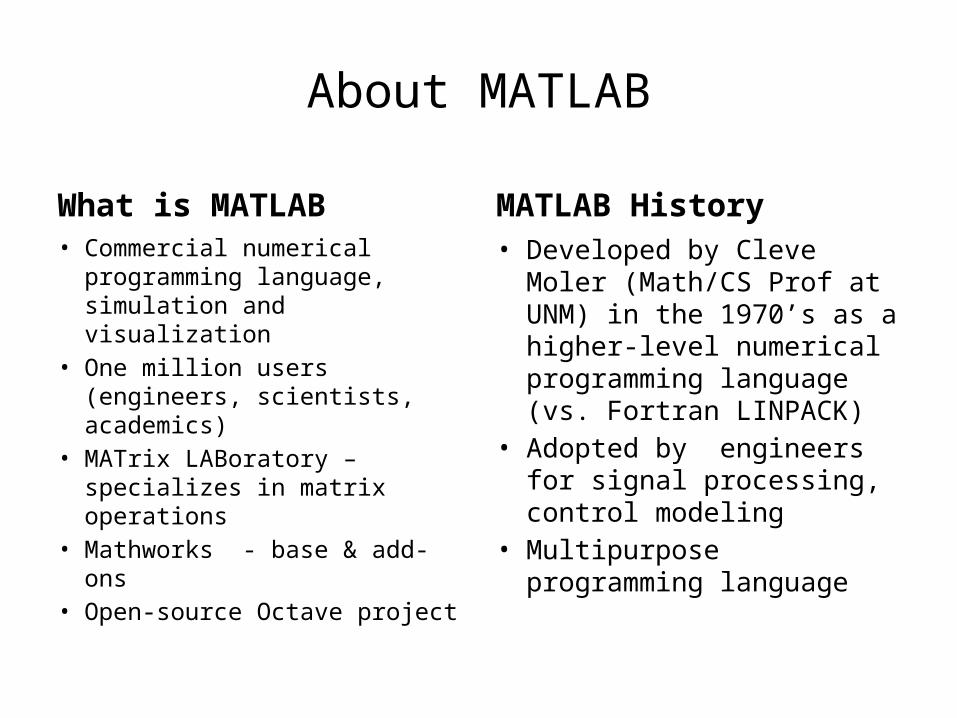
About MATLAB
What is MATLAB• Commercial numerical
programming language, simulation and visualization
• One million users (engineers, scientists, academics)
• MATrix LABoratory – specializes in matrix operations
• Mathworks - base & add-ons• Open-source Octave project
MATLAB History• Developed by Cleve Moler
(Math/CS Prof at UNM) in the 1970’s as a higher-level numerical programming language (vs. Fortran LINPACK)
• Adopted by engineers for signal processing, control modeling
• Multipurpose programming language

Notes
• Today’s focus: Compare MATLAB & R for data analysis, contrast as programming languages
• MATLAB is Base plus many toolboxes– Base includes: descriptive stats, covariance and
correlation, linear and nonlinear regression – Statistics toolbox adds: dataset and category (like
data.frames and factors) arrays, more visualizations, distributions, ANOVA, multivariate regression, hypothesis tests

->
• Interactive programming: Scripts and Read-Evaluate-Print Loop
• Similar representations of data– Both use vectors/arrays as the primary data structures
• Matlab is based on 2-D matricies; R is based on 1-D vectors
– Both prefer vectorized functions to for loops– Variables are declared dynamically
• Can do most MATLAB functionality in R; can do most R functionality in MATLAB.

The basics: vectors, matrices and indexing
Task
Create a row vector v = [1 2 3 4] v<-c(1,2,3,4)
Create a column vector v=[1;2;3;4] or v=[1 2 3 4]’ v<-c(1,2,3,4) Note: R does not distinguish between row and column vectors
Enter a matrix A A=[1 2 3; 4 5 6] Enter values by row:A<-matrix(c(1,2,3,4,5,6), nrow=2, byrow=TRUE)Enter values by column:A<-matrix(c(1,4,2,5,3,6), nrow=2)
Access third element of vector v v(3) v[3] or v[[3]]
Access element of matrix A A(2,3) A[2,3]
“Glue” two matrices a1 and a2, same number of rows, side by side
A=[a1 a2] A<-cbind(a1,a2)
“Stack” two matrices a1 and a2, same number of columns
A=[a1;a2] A<-rbind(a1,a2)
Reshape* matrix A, making it an m x n matrix with elements taken columnwise from A
A=reshape(A,m,n) dim(A)<-c(m,n)
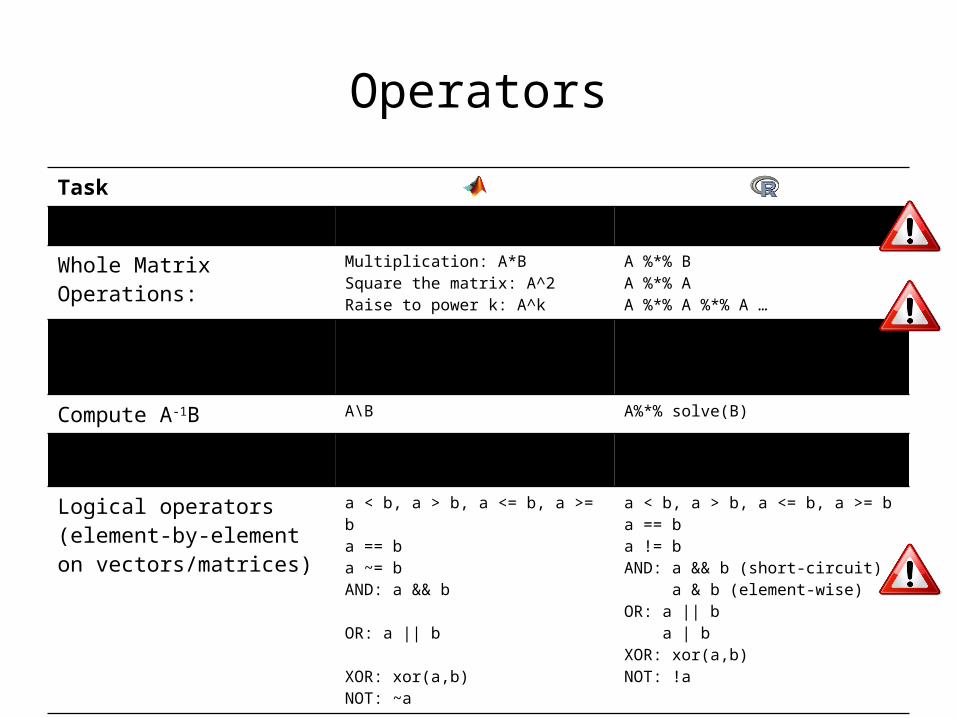
Operators
Task
Assignment = <- or =
Whole Matrix Operations: Multiplication: A*BSquare the matrix: A^2Raise to power k: A^k
A %*% BA %*% AA %*% A %*% A …
Element-by-element Operations:
A.*BA./BA.^k
A*BA/BA^k
Compute A-1B A\B A%*% solve(B)
Sums Columns of matrix: sum(A)Rows of matrix: sum(A,2)
colSums(A)rowSums(A)
Logical operators (element-by-element on vectors/matrices)
a < b, a > b, a <= b, a >= ba == ba ~= bAND: a && b
OR: a || b
XOR: xor(a,b)NOT: ~a
a < b, a > b, a <= b, a >= ba == ba != bAND: a && b (short-circuit) a & b (element-wise)OR: a || b a | bXOR: xor(a,b)NOT: !a

Working with data structures
Task
Build a structure v of length n, capable of containing different data types in different elements.MATLAB: cell arrayR: list
v=cell(1,n) In general, cell(m,n) makes an m × n cellarray. Then you can do e.g.:v{1}=12v{2}=’hi there’v{3}=rand(3)
v<-vector(’list’,n) Then you can do e.g.:v[[1]]<-12v[[2]]<-’hi there’v[[3]]<-matrix(runif(9),3)
Create a matrix-like object with different named columns.MATLAB: struct arrayR: data.frame
avals=2*ones(1,6);yvals=6:-1:1; v=[1 5 3 2 3 7];d=struct(’a’, avals,’yy’, yyvals, ’fac’, v);
v<-c(1,5,3,2,3,7)d<-data.frame(cbind(a=2, yy=6:1), v)

Conditionals, control structures, loops
Task
for loops over values in vector v
for i=vcommand1command2
end
If only one command:for (i in v)
command
If multiple commands:for (i in v) {
command1command2
}
If/else statement if condcommand1command2
elsecommand3command4
end
MATLAB also has the elseif statement.
if (cond) {command1command2
} else {command3command4
}
R uses chained “else if” statements.
ifelse() function > print(ifelse(c(T,F), 2, 3))[1] 2 3
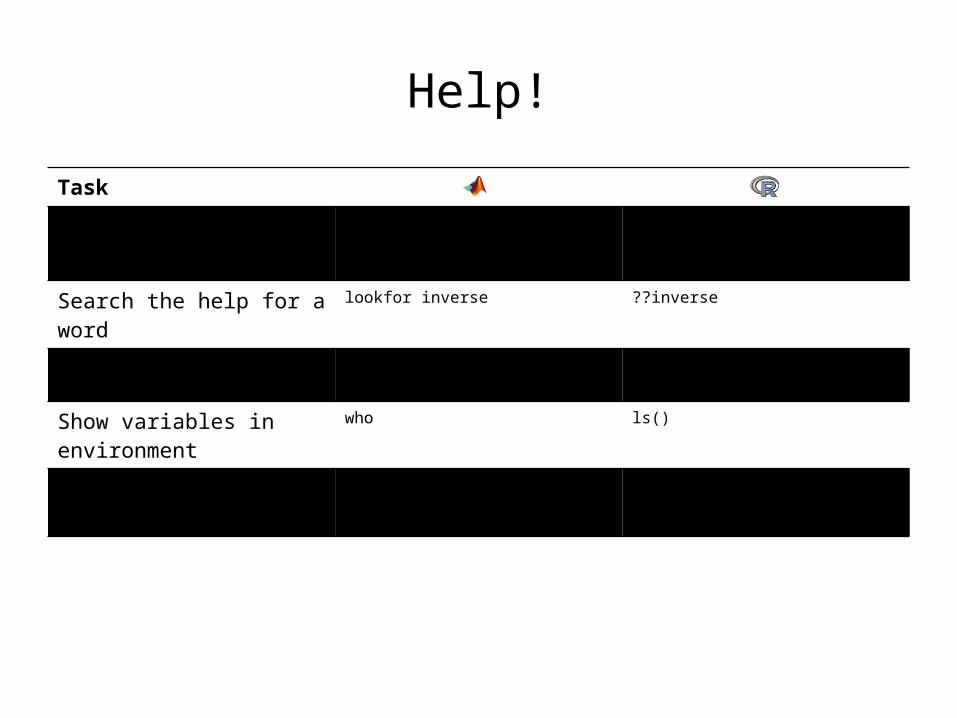
Help!
Task
Get help on a function help fminsearch help(pmin) or?pmin
Search the help for a word lookfor inverse ??inverse
Describe a variable class(a) class(a)str(a)
Show variables in environment who ls()
Underlying type of variable whos(‘a’) typeof(a)
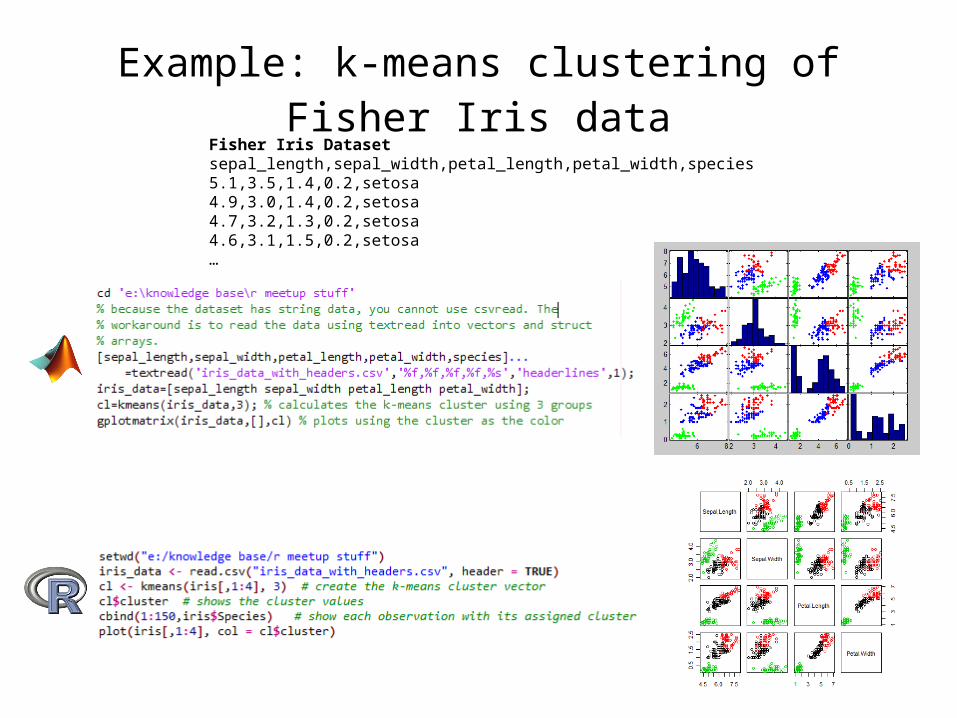
Example: k-means clustering of Fisher Iris data
Fisher Iris Datasetsepal_length,sepal_width,petal_length,petal_width,species5.1,3.5,1.4,0.2,setosa4.9,3.0,1.4,0.2,setosa4.7,3.2,1.3,0.2,setosa4.6,3.1,1.5,0.2,setosa…
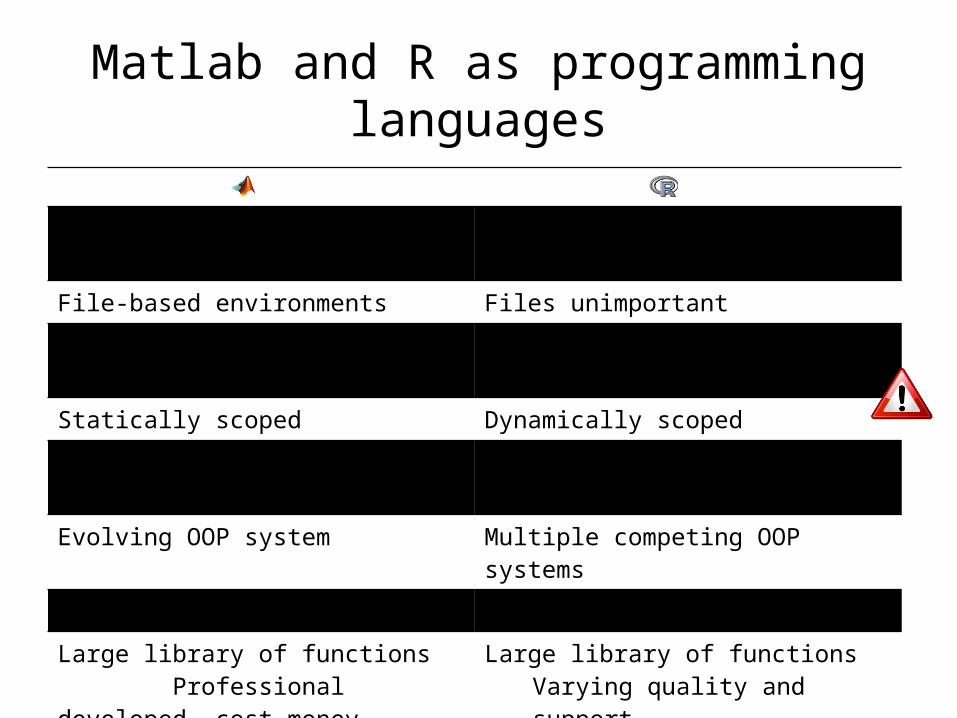
Matlab and R as programming languages
Scripting, real-time analysis Scripting, real-time analysis
File-based environments Files unimportant
Imperative programming style Functional programming style (impure)
Statically scoped Dynamically scoped
Functions with multiple return values Functions with named arguments, lazy evaluation
Evolving OOP system Multiple competing OOP systems
Can be compiled Cannot be compiled
Large library of functions Professional developed, cost money
Large library of functionsVarying quality and support
Can embed (in) many other languages Can embed (in) many other languages
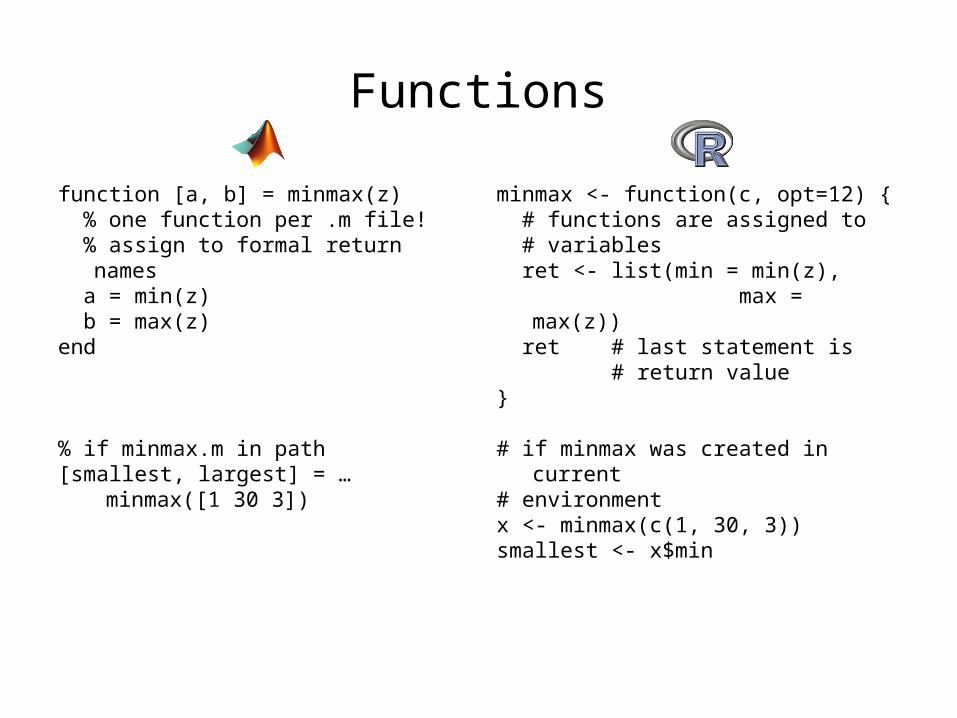
Functions
function [a, b] = minmax(z) % one function per .m file! % assign to formal return
names a = min(z) b = max(z)end
% if minmax.m in path[smallest, largest] = …
minmax([1 30 3])
minmax <- function(c, opt=12) { # functions are assigned to # variables ret <- list(min = min(z), max =
max(z)) ret # last statement is # return value}
# if minmax was created in current
# environmentx <- minmax(c(1, 30, 3))smallest <- x$min
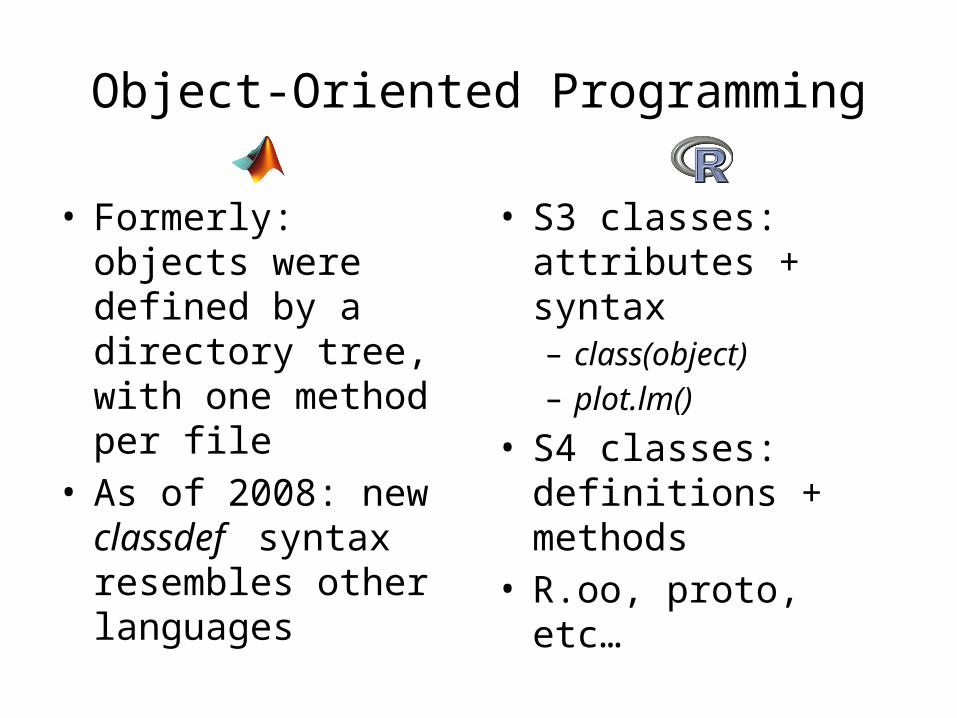
Object-Oriented Programming
• Formerly: objects were defined by a directory tree, with one method per file
• As of 2008: new classdef syntax resembles other languages
• S3 classes: attributes + syntax– class(object)– plot.lm()
• S4 classes: definitions + methods
• R.oo, proto, etc…

Other notes
• r.matlab package• Graphics– Matlab has much better 3-d/interactive graphics support– R has ggplot2 and much better statistical graphics

Additional Resources
• Will Dwinell, Data Mining in MATLAB• Computerworld article on Cleve Moler• Mathworks• Matlabcentral• Comparison of Data Analysis packages (
http://anyall.org/blog/2009/02/comparison-of-data-analysis-packages-r-matlab-scipy-excel-sas-spss-stata/)
• R.matlab package• stackoverflow
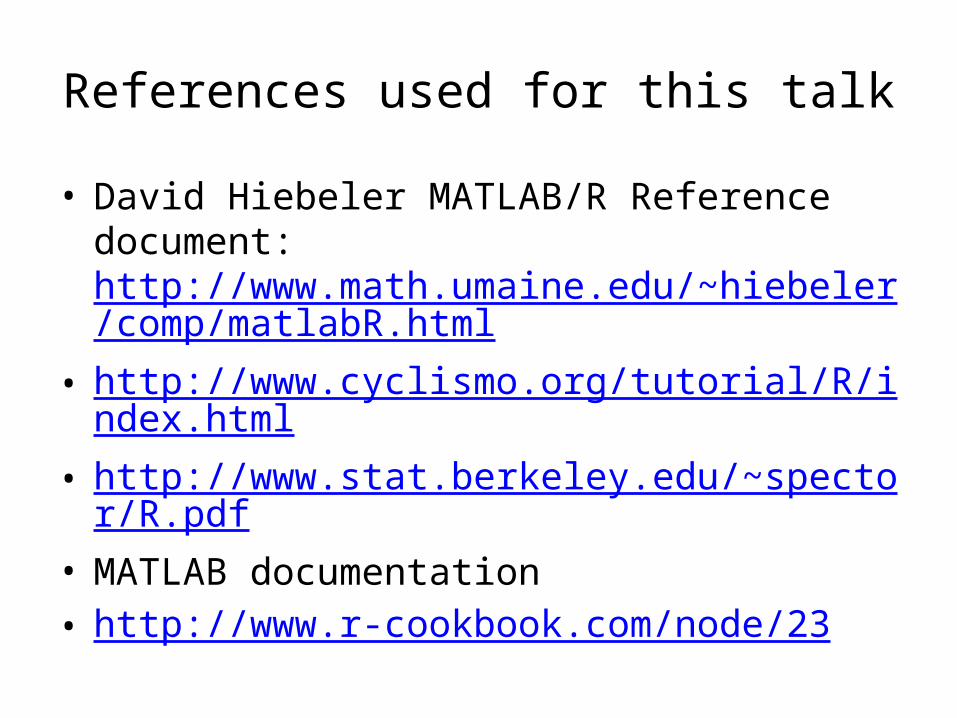
References used for this talk
• David Hiebeler MATLAB/R Reference document: http://www.math.umaine.edu/~hiebeler/comp/matlabR.html
• http://www.cyclismo.org/tutorial/R/index.html• http://www.stat.berkeley.edu/~spector/R.pdf• MATLAB documentation• http://www.r-cookbook.com/node/23

Thank You!