matteo bellucci, federico agostini, marianela masin … methods predicting protein associations with...
TRANSCRIPT

Nature Methods Predicting protein associations with long noncoding
RNAs Matteo Bellucci, Federico Agostini, Marianela Masin & Gian Gaetano Tartaglia
Supplementary Figure 1 Predictions of interactions in the human MRP complex
Supplementary Figure 2 Predictions of interactions in the human RNase P complex
Supplementary Figure 3 Predictions of interactions between PRC2 protein
components and Xist regions
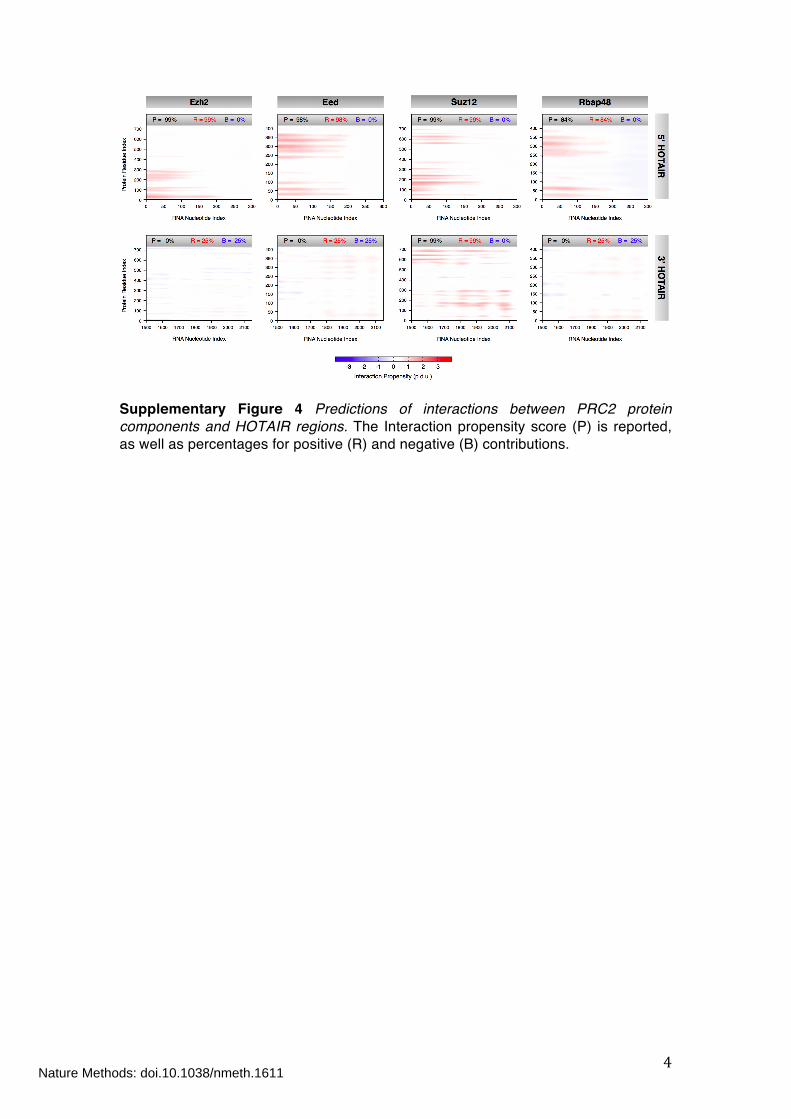
Supplementary Figure 4 Predictions of interactions between PRC2 protein
components and HOTAIR regions
Supplementary Table 1 PDB IDs of non-redundant protein-RNA complexes used to
train catRAPID
Supplementary Table 2 Coefficients associated with protein and RNA properties
Supplementary Table 3 Parameters of the interaction matrix I
Supplementary Table 4 Composition of the NPInter dataset
Supplementary Table 5 Composition of the Protein-binding (Protein BP), DNA-
binding, RNA-binding (RNA BP) datasets
Supplementary Table 6 Human MRP complex: Comparison between catRAPID
predictions and experimental data
Supplementary Methods
Nature Methods: doi.10.1038/nmeth.1611

1
Supplementary Figure 1 Predictions of interactions in the human MRP complex. The Interaction propensity score (P) is reported, as well as percentages for positive (R) and negative (B) contributions. See also Supplementary Table 6.
Nature Methods: doi.10.1038/nmeth.1611

2
Supplementary Figure 2 Prediction of interactions in the human RNase P complex. The Interaction propensity score (P) is reported, as well as percentages for positive (R) and negative (B) contributions. Please refer to the relative section for the interpretation of data.
Nature Methods: doi.10.1038/nmeth.1611

3
Supplementary Figure 3 Predictions of interactions between PRC2 protein components and Xist regions. The Interaction propensity score (P) is reported, as well as percentages for positive (R) and negative (B) contributions.
Nature Methods: doi.10.1038/nmeth.1611
4
Supplementary Figure 4 Predictions of interactions between PRC2 protein components and HOTAIR regions. The Interaction propensity score (P) is reported, as well as percentages for positive (R) and negative (B) contributions.
Nature Methods: doi.10.1038/nmeth.1611
5
2ZKR 3CW1 3I8I 2GYA 3BBO 1JJ2 2ZJP 1FFK 1GIY 1P85 3JYV 2GTT 3HUW 3BBN 1C9S 2FTC 2ZKQ 2RKJ 2CZJ 2D6F 3A2K 2ZNI 2WW9 1UN6 1J2B 2NQP 1J5A 3KTW 3EPH 2R8S 2DER 2CT8 1SER 1G59 1ASY 2ZZM 2ZUE 2DU3 1U0B 1J1U 1H3E 1F7U 1EIY 1C0A
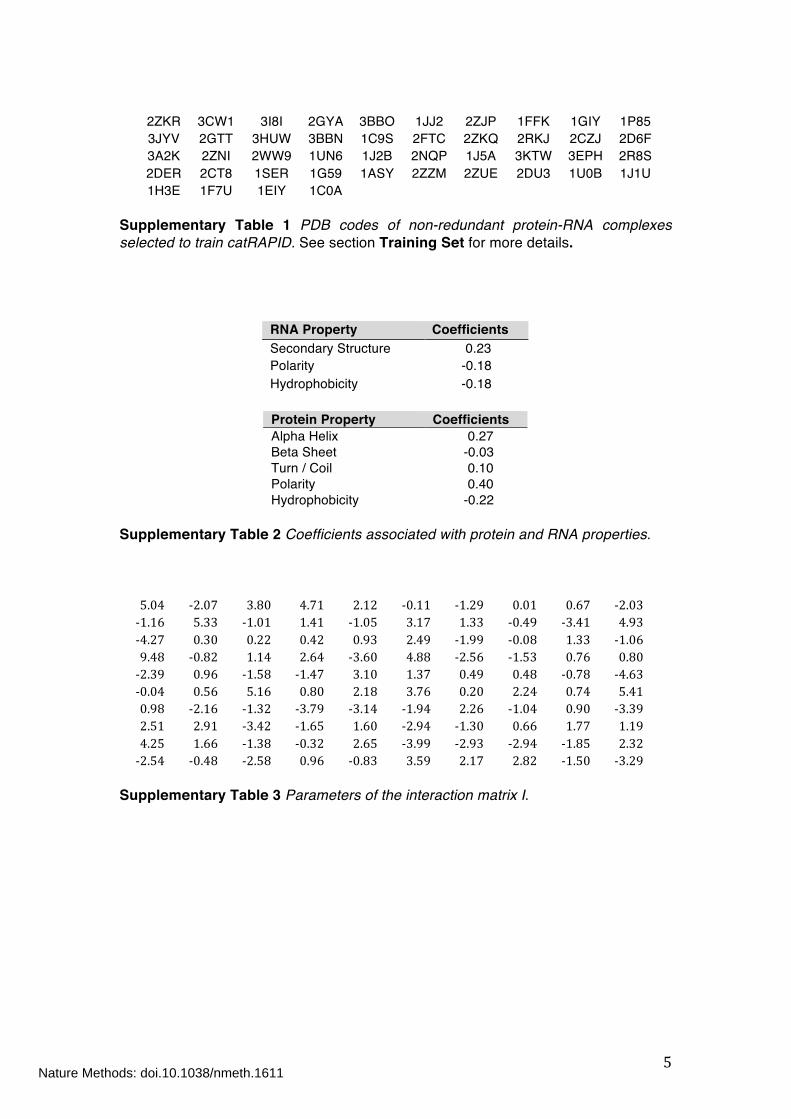
Supplementary Table 1 PDB codes of non-redundant protein-RNA complexes selected to train catRAPID. See section Training Set for more details.
RNA Property Coefficients Secondary Structure 0.23 Polarity -0.18 Hydrophobicity -0.18
Protein Property Coefficients Alpha Helix 0.27 Beta Sheet -0.03 Turn / Coil 0.10 Polarity 0.40 Hydrophobicity -0.22
Supplementary Table 2 Coefficients associated with protein and RNA properties.
5.04 -‐2.07 3.80 4.71 2.12 -‐0.11 -‐1.29 0.01 0.67 -‐2.03 -‐1.16 5.33 -‐1.01 1.41 -‐1.05 3.17 1.33 -‐0.49 -‐3.41 4.93 -‐4.27 0.30 0.22 0.42 0.93 2.49 -‐1.99 -‐0.08 1.33 -‐1.06 9.48 -‐0.82 1.14 2.64 -‐3.60 4.88 -‐2.56 -‐1.53 0.76 0.80 -‐2.39 0.96 -‐1.58 -‐1.47 3.10 1.37 0.49 0.48 -‐0.78 -‐4.63 -‐0.04 0.56 5.16 0.80 2.18 3.76 0.20 2.24 0.74 5.41 0.98 -‐2.16 -‐1.32 -‐3.79 -‐3.14 -‐1.94 2.26 -‐1.04 0.90 -‐3.39 2.51 2.91 -‐3.42 -‐1.65 1.60 -‐2.94 -‐1.30 0.66 1.77 1.19 4.25 1.66 -‐1.38 -‐0.32 2.65 -‐3.99 -‐2.93 -‐2.94 -‐1.85 2.32 -‐2.54 -‐0.48 -‐2.58 0.96 -‐0.83 3.59 2.17 2.82 -‐1.50 -‐3.29
Supplementary Table 3 Parameters of the interaction matrix I.
Nature Methods: doi.10.1038/nmeth.1611

6
NPInter Class # Interactions The ncRNA binds the protein 239
The protein as a factor affects the ncRNA's function 88
The ncRNA is regulated by the protein 22
Special linkages between the ncRNA and the Protein 8
Genetic interaction between the ncRNA gene and the protein 13
The ncRNA regulates the mRNA 24
The ncRNA indirectly regulates a gene (DNA) 9
The ncRNA as a factor affects the protein's function 2 Supplementary Table 4 Composition of the NPInter dataset. Indirect evidences of protein-RNA interactions are associated with the following classes: “The ncRNA is regulated by the protein”, “Special linkages between the ncRNA and the Protein”, “Genetic interaction between the ncRNA gene and the protein”, “The ncRNA regulates the mRNA” and “The ncRNA indirectly regulates a gene (DNA)”. See section Test Set for more details.
Supplementary Table 5 Composition of the Protein-binding (Protein BP), DNA-binding, RNA-binding (RNA BP) datasets. For each test set, we generated random associations with RNA molecules present in the training set. See also section Test Set.
Dataset # Proteins # Interactions Protein BP 62 12000 RNA BP 65 12000 DNA BP 5410 130000
Nature Methods: doi.10.1038/nmeth.1611

7
Supplementary Table 6 Human MRP complex: Comparison between experimental data and catRAPID predictions. The strength of interactions is represented as “++”, strong; “+”, weak; “-”, absent; “NA”, not available. Experimental evidences can be found in the work by Welting and collaborators20, except where differently indicated. *No comparison is possible with experimental data due to lack of information. **Predictions support what shown for the archeal homolog PhoPop521.
catRAPID Predictions Experimental Evidences Protein subunits P3 stem P12 stem P3 stem P12 stem
Accordance References
Rpp14 - - - - YES
Rpp20 ++ + ++ + YES 13,14
Rpp21 + + + + YES
Rpp25 + + ++ + YES 13,14
Rpp29 ++ ++ ++ ++ YES
Rpp30 - - NA NA YES 15
Rpp38 ++ ++ + ++ YES
Rpp40 - - NA NA *
hPop5 + - - - YES ** 15
Nature Methods: doi.10.1038/nmeth.1611

8
Supplementary Methods
Training Set
Structural data were collected in March 2010 and consisted of 858 RNA-protein
complexes (8367 protein-RNA pairs) available from the RCSB databank
(http://www.pdb.org/). A cutoff of 7 Å for physical contacts was employed to
discriminate between interacting and non-interacting protein-RNA pairs. The cutoff
was decided according to the average resolution of structural complexes and led to
define a positive dataset containing 7409 interacting protein-RNA pairs and a
negative set containing 958 non-interacting protein-RNA pairs. The CD-HIT tool
(http://weizhong-lab.ucsd.edu/cdhit_suite/cgi-bin/index.cgi) was used to filter out RNA
and protein sequences with identities higher than 80% and 60%, respectively. After
redundancy removal, the database contained 410 interacting (“Positive set”) and 182
non-interacting (“Negative set”) protein-RNA pairs. With regards to the composition of
the Positive and Negative sets, protein-RNA associations were grouped into five
functional classes: “Ribosome and protein synthesis”, “Splicing”, “Transcription”,
“tRNA synthesis and Viral RNA assemblies”, which account for 70%, 10%, 8%, 12%
and 10% of the entire training set. Performances were estimated using a ten-fold
cross-validation approach, in which a representative set of each functional class was
sampled. In the analysis, the data set of interactions was randomly partitioned into
ten subsamples requiring the condition that all the partitions carry the same
distribution of functional classes. One subsample was retained for testing, and the
remaining nine were used for training the algorithm. The cross-validation process
was repeated ten times with each of the ten subsamples used exactly once as the
validation data. The significance of our predictions was evaluated by calculating p-
values (two-tail t-test). See also section Discriminative Power.
We tested catRAPIDʼs performance on the identification of binding regions. For each
protein-RNA complex in the redundant set, we calculated interaction propensities of
all possible associations between amino acid and nucleotide chains and ranked their
scores from lowest to highest. Protein binding sites were top-ranked in 87% of cases
while RNA binding sites were ranked in 75% of cases. Simultaneous identification of
Nature Methods: doi.10.1038/nmeth.1611

9
both protein and RNA binding regions was top-ranked in 62% of cases. Indeed, these
results underline the extreme accuracy in identifying interaction sites (Fig. 1a).
Physico-chemical Properties
Secondary Structure Propensities. The secondary structure of the RNA molecule
is predicted from its nucleotide sequence using the Vienna package1 (including the
algorithms RNAfold, RNAsubopt and RNAplot). Although the average predictive
power of the RNAfold algorithm is 70%, lower performances are expected for long
non-coding RNAs because these transcripts are poorly characterized. To increase
the amount of information that can be extracted from secondary structure predictions,
we adopted a strategy that exploits the generation of ensembles produced with the
RNAsubopt algorithm. The sampling of structures was performed with probabilities
estimated through Boltzmann weighting and stochastic backtracking in the partition
function. Six model structures, ranked by energy, are used as input for catRAPID. For
each model structure, the RNAplot algorithm was employed to generate secondary
structure coordinates. Using the coordinates we defined the “secondary structure
occupancy” by counting the number of contacts made by each nucleotide within the
different regions of the chain. High values of secondary structure occupancy indicate
that base pairing occurs in regions with high propensity to form hairpin-loops, while
low values are associated with junctions or multi-loops. The secondary structure of
proteins was taken into account in our model by calculating the Chou-Fasman2 and
Deleage-Roux3 propensities for turn, β-strand and α-helical elements. As the
average predictive power of these models is around 60%, we preferred to combine
together the individual propensities to have better performances. The correlation
between interaction propensities and secondary structure contributions is 73%
(Interaction Propensities).
Hydrogen-Bonding Propensities. The structural information on purine and
pyrimidine contacts was extracted from a set of 41 non-redundant protein-RNA
complexes4. Both the number and the frequency of hydrogen-bond contacts are used
in our method. With respect to proteins, we used Granthamʼs and Zimmermanʼs
scales5,6 to estimate the propensity of amino acids to form hydrogen bonds. Other
propensity scales were disregarded because they showed lower predictive power.
Nature Methods: doi.10.1038/nmeth.1611

10
The correlation between interaction propensities and hydrogen bonding contributions
is 58% (Interaction Propensities).
Van der Waalsʼ Propensities. The information on purine and pyrimidine contacts
was taken from a set of 41 protein-RNA complexes4. Both the number and the
frequency of van der Waalsʼ contacts were used in catRAPID. With respect to
proteins, we employed Kyte-Dolittle and Bull-Breese scales7,8 to estimate the
propensity to form van der Waalsʼ contacts. Other propensity scales were
disregarded because they showed lower predictive power. The correlation between
interaction propensities and Van der Waalsʼ contributions is 26% (estimated with a
ten-fold cross-validation).
Fitting coefficients for Secondary Structure, Hydrogen-Bonding and Van der Waalsʼ
Contributions are reported in Supplementary Table 2.
Interaction Propensity
Secondary structure, hydrogen bonding and van der Waals propensities were
combined together into the interaction profile:
€
Φx = αS Sx +αH Hx +αW Wx (1)
We used the symbol
€
to indicate the profile associated with a specific physico-
chemical property. For example, the van der Waalʼs profile of a protein is denoted by
€
Wp and contains the van der Waalʼs contributions of each amino acid:
€
Wp =Wp 1, Wp 2,..., Wp L (2)
Where
€
L is the proteinʼ s sequence length. Similarly,
€
H represents the hydrogen
bonding profile and
€
S the secondary structure profile. The variable
€
x is used to
distinguish between RNA (
€
x =
€
r ) and protein (
€
x =
€
p) profiles.
Nature Methods: doi.10.1038/nmeth.1611

11
In order to deal with molecules of different length, we approximated each propensity
profile using plane-waves:
€
˜ Φ xk =
2length
Φxn cos π
lengthn +
12
⎛
⎝ ⎜
⎞
⎠ ⎟ k +
12
⎛
⎝ ⎜
⎞
⎠ ⎟
⎡
⎣ ⎢
⎤
⎦ ⎥ k = 0,1,... L
n=0
length
∑ −1 (3)
The number of plane waves employed to approximate each profile is L = 50 as the
discriminative power does not improve by increasing L.
The following condition was employed to derive the interaction matrix
€
I:
€
I : max ˜ Φ r I ˜ Φ p for (r, p) ∈ {positive set} (4)
The interaction propensity score
€
π = ˜ Φ r I ˜ Φ p is defined as the inner product
between the protein profile
€
˜ Φ r and the RNA profile
€
˜ Φ p , weighted by the
interaction matrix
€
I:
€
π = ˜ Φ r I ˜ Φ p = ˜ Φ rl Il,m ˜ Φ p
ml ,m
∑ = ˜ Λ l,ml ,m∑ (5)
The interaction propensity matrix
€
Λ l,m is obtained by applying Eq. (3) to
€
˜ Λ l,m .
The interaction matrix
€
I is given by applying Eq. (3) to the parameters
€
˜ I n,k reported in
Supplementary Table 3.
Discriminative Power
In order to evaluate the ability of catRAPID to distinguish between interacting and
non-interacting RNA-protein associations, we introduced the concept of
discriminative power (dp):
Nature Methods: doi.10.1038/nmeth.1611

12
€
dp = ϑ(π i − π n )
n∑
i∑
ϑ(π i − π n )n∑
i∑ +ϑ(π n −π i)
=1− (I∩N) (6)
Where
€
π i indicates the interaction propensity of an interacting RNA-protein pairs,
€
πn
represents the interaction propensity of non-interacting molecules,
€
I is the score
distribution associated with the positive set and
€
N is the score distribution associated
with the negative set. The definition of
€
π is given in the section Interaction
Propensity. The function
€
ϑ(π i − π n ) is 1 if
€
π i −πn > 0 and 0 otherwise. According
to the definition given in Eq. (6), the discriminative power ranges from 0% to 100%.
The significance of predictions was evaluated by calculating p-values (two-tail t-test).
With regards to catRAPIDʼs performances, the discriminative power associated with
the non-redundant training dataset is 78%. The discriminative power associated with
the redundant training dataset is 90%. If a consistent number of protein or RNA
sequences are moved from the negative to the positive set (or vice-versa), the
distribution of interaction propensities associated with the positive and negative sets
tend to overlap. When the number of sequences transferred from the negative to the
positive set equals half the size of the positive set, dp is 42%. If Fourierʼs coefficients
associated with RNA or protein sequences are scrambled (i.e., their order is modified
in a random way), dp is < 50%. If we use the unitary matrix in Eq. 3, the algorithm
shows a dp of 65% on the training set, which increases up to 71% when the NPInter
dataset is also considered.
Interaction Propensity
Using the score distribution
€
fn associated with the negative training set, we
calculated the probability
€
p(v) = p(π ≤ v) that the score
€
π takes values less than or
equal to
€
v (interaction probability):
€
p(v) = fn (π)dπ−∞
v
∫ (7)
Nature Methods: doi.10.1038/nmeth.1611

13
Similarly, using the score distribution
€
f p of the positive training set, we estimated the
probability that the score
€
π takes values more than or equal to
€
v (non-interaction
probability):
€
n(v) = f p (π)dπv
∞
∫ (8)
The two probabilities
€
p(v) and
€
n(v) were then combined together to define the
interaction propensity
€
P(v) :
€
P(v,x) =x[1− n(v)]p(v)
[1− n(v)]p(v)[1− x]+ x[1− p(v)]n(n) (9)
where
€
x = 0.5
Test Sets
The NPInter database9 (http://www.bioinfo.org.cn/NPInter/) was used to evaluate the
ability of the algorithm to predict interactions between proteins and long non-coding
RNAs. RNA sequences were obtained from the fRNAdb database
(http://www.ncrna.org/frnadb/). We excluded micro-RNAs from our analysis because
their size significantly differs from that of molecules used for training. The long non-
coding database contains 405 interactions from 6 model organisms. Only for a
subset of the NPInter database direct physical evidence for protein-RNA interactions
is reported (Fig. 1b; class “The ncRNA binds the protein” accounting for 59% of the
NPInter dataset and class “The protein as a factor affects the ncRNA's function”
accounting for 22% of the NPInter dataset). We also estimated the significance of our
predictions on the entire database by calculating p-values (two-tail t-test): 0.04 for
class “The ncRNA is regulated by the protein”, 0.21 for class “Special linkage
between the ncRNA and the Protein” 0.11 for class “Genetic interaction between the
ncRNA gene and the protein”, 0.03 for class “The ncRNA regulates the mRNA”), 0.20
for class “The ncRNA indirectly regulates a gene” and 0.6 for class “The ncRNA as a
Nature Methods: doi.10.1038/nmeth.1611

14
factor affects the proteinʼs function”. The average discriminative power is 85% and
was evaluated by comparing the interaction propensities of the different NPInter
classes with the interaction propensities of the non-redundant negative set (and
increases up to 90% by comparing with the redundant negative set).
The Non-Nucleid-acid-Binding database NNBP10 was employed to evaluate the
ability of catRAPID to identify proteins that have little propensity to interact with RNA
molecules. The original set comprises 246 proteins, among which 62 were selected
after a search on the Uniprot database (http://www.uniprot.org/) for molecules that
are exclusively involved in protein-protein interactions. A total of 12000 random
associations were generated with RNA sequences of the positive set. The
discriminative power of the algorithm was evaluated by comparing the interaction
propensities of the negative set (Training Set) with those of the random list. The
significance of predictions was evaluated by calculating p-values (two-tail t-test)
(Supplementary Table 4).
DNA-binding (DNA BP) and RNA-binding (RNA BP) proteins were obtained from the
Uniprot database. DNA BP were collected by searching for molecules that bind “with
DNA and not with RNA” (7535 hits), while RNA BP were obtained by selecting
molecules that bind “with RNA and not with DNA” (84 hits). The CD-HIT tool was
used to filter out sequences with identities higher than 60%. After filtering we counted
a total of 5410 entries for DNA BP and 65 entries for RNA BP). Random associations
were generated with RNA sequences present in the positive training set (130000
associations for DNA-binding and 12000 for RNA-binding, respectively). The
discriminative power of the algorithm was evaluated by comparing interaction
propensities of the negative set (Training Set) with those of the random lists. The
significance of predictions was evaluated by calculating p-values (two-tail t-test)
(Supplementary Table 5).
The Human MRP and RNase P Complexes
The human MRP complex is comprised of ten protein subunits (hPop1, hPop5,
Rpp14, Rpp20, Rpp21, Rpp25, Rpp29, Rpp30, Rpp38 and Rpp40) and one RNA unit
(266 nucleotides). The RNA shows a catalytic core domain with evolutionary
Nature Methods: doi.10.1038/nmeth.1611

15
conserved structural features in domain I (P1-P3 helices), and a variable portion
named domain II (P8, P9, P12, eP19 helices) with unknown function. The human
RNase P complex shares protein components with the MRP system. It includes one
RNA unit (344 nucleotides) that possesses analogous structural features compared
to the MRP RNA, with a more extended P12 stem and additional P7, P10, P11
elements. The two complexes display different catalytic activities: MRP mediates the
processing of rRNA precursors while RNAse P is required for processing pre-tRNAs
in functional tRNAs molecules.
Several studies were carried out to identify protein-RNA interactions in human, yeast
and bacterial MRP complexes, using a wide variety of techniques11. The most
detailed picture of the human system was given by Welting and coworkers12 who
demonstrated, using GST pull-down data, that hPop1, Rpp20, Rpp21, Rpp25, Rpp29
and Rpp38 directly interact with RNA, whereas hPop5 and Rpp14 are part of the
assembly but do not contact the transcript. Interaction data for Rpp30 and Rpp40 are
missing because of the poor solubility of the proteins. It has been observed that
Rpp20 and Rpp25 bind strictly to the P3 helix, whereas Rpp29 mediate additional
contacts in the P12 stem by associating with more than one RNA region. The
interaction between RNA, Rpp20 and Rpp25 was confirmed by the very recent
release of the crystal structure of the MRP RNA P3 stem in complex with yeast
homologues of Rpp20 and Rpp2513.
Comparisons between our predictions and experimental evidences can be
summarized as follows (Supplementary Table 6, Supplementary Fig. 1): i) Rpp20
and Rpp21 binds the P3 stem that can be considered a nucleation center. The
predicted binding region for Rpp20 - MRP RNA corresponds to the one observed in
the crystal structure of yeast MRP RNA P3 portion in complex with the yeast
homolog POP713. ii) Rpp29 and Rpp38 mediate multiple interactions between P3
helix and P12 stem. These results are in complete agreement with the known
interaction map of Rpp29 which connects domain I and II12. iii) Rpp25 is predicted to
have lower propensity to interact with RNA. This finding can be explained by
considering that Rpp25 is able to recognize the P3 element of MRP RNA only after
association with Rpp2014. iv) Rpp14, Rpp30 and Rpp40 are predicted to be non-
interacting with MRP RNA, in agreement with what was reported in literature12. v)
hPop5 is predicted to mediate weak interactions with the MRP RNA in the P3 area.
Nature Methods: doi.10.1038/nmeth.1611

16
This finding is in accordance with activity assays conducted on the archeal homolog
PhoPop515.
With regards to the RNase P system, similar interaction propensities were found for
Rpp20, Rpp21, Rpp25, Rpp29 and Rpp38 (Supplementary Fig. 2). In general, an
increase in the intensity of signals is observed together with an enhanced binding
preference for the P3 stem region. This finding could be explained by considering the
different substrate specificity and catalytic activity of the two RNA-protein assemblies.
Association of the PRC-2 with Xist and HOTAIR The Polycomb Repressive Complex is comprised of four protein units: Ezh2, Eed,
Suz12 and Rbap48. Ezh2 and Eed are predicted by catRAPID to contact
approximately the same RNA regions (330-680 and 330-530 for Xist A Region; 1-240
and 1-220 for the 5ʼ domain of HOTAIR; Supplementary Fig. 3), which is well in
agreement with the ability of these proteins to heterodimerize16. Eed shows similar
binding propensities with both 2R (431-531; Supplementary Fig. 3) and 4R (371-
531; Supplementary Fig. 3) segments, as shown by immuno-precipitation assays17.
According to previous experimental evidences18 and in agreement with our
predictions on repeat regions, Ezh2 can be regarded as the main RNA-binding
subunit, representing the catalytic core of the PCR2 complex. Higher propensity to
bind 2R is found for Rbap48, which might arise from its involvement in mediating
protein-protein interactions in addition to RNA binding19.
Databases used for MRP, Xist and HOTAIR
RNA sequences (human MRP RNA, FR355912; human RNase P RNA, FR174566)
were downloaded from the fRNAdb database (http://www.ncrna.org/frnadb/). Protein
sequences were retrieved from Uniprot database (hPop5, Q969H6; Rpp14, O95059;
Rpp20, O75817; Rpp21, Q9H633; Rpp25, Q9BUL9; Rpp29, O95707; Rpp30,
P78346; Rpp38, P78345; Rpp40, O75818). The catRAPID algorithm was employed
to predict the interaction propensity of all protein subunits except for hPop1 whose
large size does not fit with our computational requirements. The three-dimensional
structure of the MRP P3 domain in complex with POP6-POP7 was displayed using
Nature Methods: doi.10.1038/nmeth.1611

17
the UCSF Chimera visualization tool (http://www.cgl.ucsf.edu/chimera/). The crystal
structure of the yeast MRP P3 domain in complex with the POP6-POP7 protein
heterodimer (PDB code: 3iab) was released in July 2010.
The RNA sequences of human Xist (M97168.1) and HOTAIR (DQ926657.1) were
downloaded from the NCBI database. Regions of interest were selected on the basis
of available experimental data (sequence numbering is reported): Xist A Region, 330-
796; Xist 4R, 371-531; 5ʼ HOTAIR, 1-300; 3ʼ HOTAIR, 1500-2146. The catRAPID
algorithm was used to predict the interaction propensity of the four PRC2 protein
subunits, whose Uniprot IDs are: Ezh2, Q15910; Eed, O75530; Suz12, Q15022;
Rbap48, Q09028.
Nature Methods: doi.10.1038/nmeth.1611
18
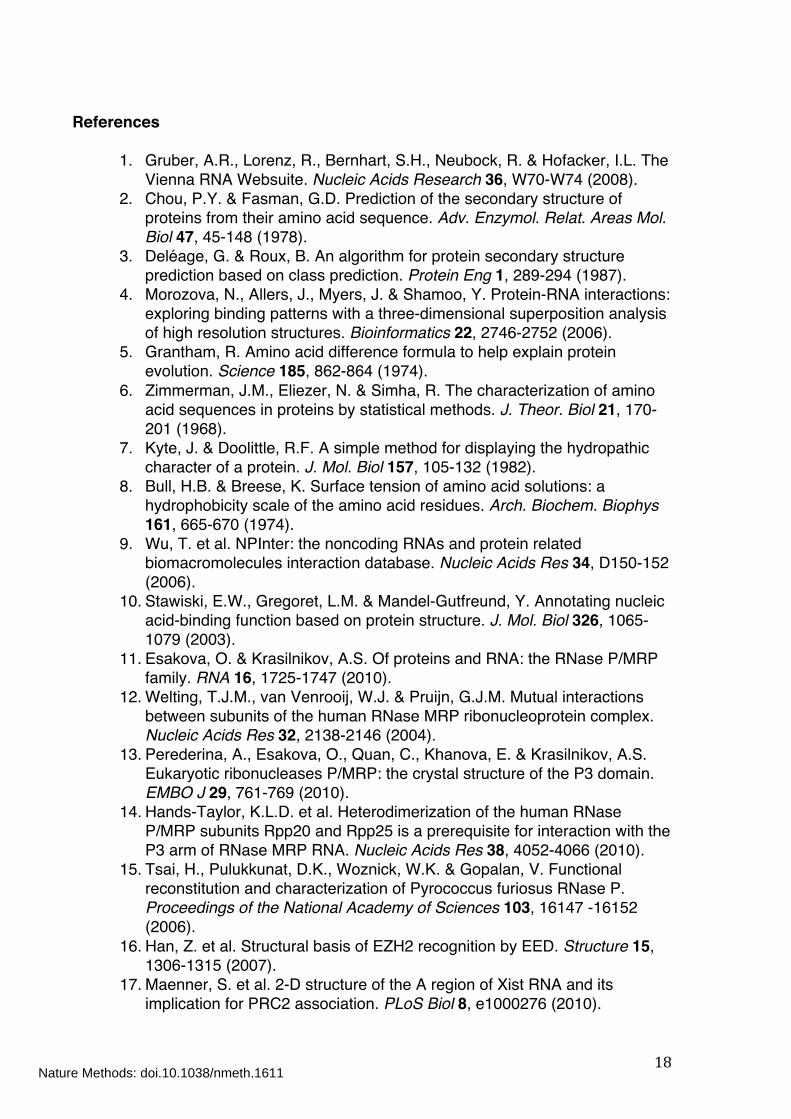
References
1. Gruber, A.R., Lorenz, R., Bernhart, S.H., Neubock, R. & Hofacker, I.L. The Vienna RNA Websuite. Nucleic Acids Research 36, W70-W74 (2008).
2. Chou, P.Y. & Fasman, G.D. Prediction of the secondary structure of proteins from their amino acid sequence. Adv. Enzymol. Relat. Areas Mol. Biol 47, 45-148 (1978).
3. Deléage, G. & Roux, B. An algorithm for protein secondary structure prediction based on class prediction. Protein Eng 1, 289-294 (1987).
4. Morozova, N., Allers, J., Myers, J. & Shamoo, Y. Protein-RNA interactions: exploring binding patterns with a three-dimensional superposition analysis of high resolution structures. Bioinformatics 22, 2746-2752 (2006).
5. Grantham, R. Amino acid difference formula to help explain protein evolution. Science 185, 862-864 (1974).
6. Zimmerman, J.M., Eliezer, N. & Simha, R. The characterization of amino acid sequences in proteins by statistical methods. J. Theor. Biol 21, 170-201 (1968).
7. Kyte, J. & Doolittle, R.F. A simple method for displaying the hydropathic character of a protein. J. Mol. Biol 157, 105-132 (1982).
8. Bull, H.B. & Breese, K. Surface tension of amino acid solutions: a hydrophobicity scale of the amino acid residues. Arch. Biochem. Biophys 161, 665-670 (1974).
9. Wu, T. et al. NPInter: the noncoding RNAs and protein related biomacromolecules interaction database. Nucleic Acids Res 34, D150-152 (2006).
10. Stawiski, E.W., Gregoret, L.M. & Mandel-Gutfreund, Y. Annotating nucleic acid-binding function based on protein structure. J. Mol. Biol 326, 1065-1079 (2003).
11. Esakova, O. & Krasilnikov, A.S. Of proteins and RNA: the RNase P/MRP family. RNA 16, 1725-1747 (2010).
12. Welting, T.J.M., van Venrooij, W.J. & Pruijn, G.J.M. Mutual interactions between subunits of the human RNase MRP ribonucleoprotein complex. Nucleic Acids Res 32, 2138-2146 (2004).
13. Perederina, A., Esakova, O., Quan, C., Khanova, E. & Krasilnikov, A.S. Eukaryotic ribonucleases P/MRP: the crystal structure of the P3 domain. EMBO J 29, 761-769 (2010).
14. Hands-Taylor, K.L.D. et al. Heterodimerization of the human RNase P/MRP subunits Rpp20 and Rpp25 is a prerequisite for interaction with the P3 arm of RNase MRP RNA. Nucleic Acids Res 38, 4052-4066 (2010).
15. Tsai, H., Pulukkunat, D.K., Woznick, W.K. & Gopalan, V. Functional reconstitution and characterization of Pyrococcus furiosus RNase P. Proceedings of the National Academy of Sciences 103, 16147 -16152 (2006).
16. Han, Z. et al. Structural basis of EZH2 recognition by EED. Structure 15, 1306-1315 (2007).
17. Maenner, S. et al. 2-D structure of the A region of Xist RNA and its implication for PRC2 association. PLoS Biol 8, e1000276 (2010).
Nature Methods: doi.10.1038/nmeth.1611

19
18. Zhao, J., Sun, B.K., Erwin, J.A., Song, J. & Lee, J.T. Polycomb proteins targeted by a short repeat RNA to the mouse X chromosome. Science 322, 750-756 (2008).
19. Qian, Y.W. et al. A retinoblastoma-binding protein related to a negative regulator of Ras in yeast. Nature 364, 648-652 (1993).
20. Welting, T.J., Kikkert, B.J., van Venrooij, W.J. & Pruijn, G.J. Differential association of protein subunits with the human RNase MRP and RNase P complexes. RNA 12, 1373-1382 (2006).
21. Honda, T., Hara, T., Nan, J., Zhang, X. & Kimura, M. Archaeal homologs of human RNase P protein pairs Pop5 with Rpp30 and Rpp21 with Rpp29 work on distinct functional domains of the RNA subunit. Biosci. Biotechnol. Biochem 74, 266-273 (2010).
Nature Methods: doi.10.1038/nmeth.1611