matthew boyle - cru - coal market outlook – tracking the trends
TRANSCRIPT

Coal market outlook – Tracking the
trends
Prepared for:
Mozambique Coal Conference,
Maputo, Mozambique
July 27, 2015
Matthew Boyle Principal Consultant - CRU Analysis

• This presentation is supplied on a private and confidential basis to the customer. It must not
be disclosed in whole or in part, directly or indirectly or in any other format to any other
company, organisation or individual without the prior written permission of CRU International
Limited.
• Permission is given for the disclosure of this report to a company’s majority owned
subsidiaries and its parent organisation. However, where the report is supplied to a client in
his capacity as a manager of a joint venture or partnership, it may not be disclosed to the
other participants without further permission.
• CRU International Limited’s responsibility is solely to its direct client. Its liability is limited to
the amount of the fees actually paid for the professional services involved in preparing this
presentation. We accept no liability to third parties, howsoever arising.
• Although reasonable care and diligence has been used in the preparation of this
presentation, we do not guarantee the accuracy of any data, assumptions, forecasts or other
forward-looking statements.
Disclaimer
2

The global presence of CRU
3
1. The opening of the Nacala Corridor and port, together with other infrastructure
improvements, will boost coal exports from Mozambique.
2. Chinese demand is still relevant, but the seaborne coal markets are now switching their
focus to India. India will be the dominant demand market for coal going forward.
3. Prices are expected to recover towards their equilibrium point, and therefore a balanced
market, in both metallurgical and thermal coal. However, the wait will be longer for thermal
coal.
Summary The future is brighter for Mozambican coal exports
4

Agenda
• Coal production in Mozambique – how does it fit in with global supply?
• Where are the demand markets for Mozambican metallurgical and thermal coal exports?
• How competitive are Mozambican costs compared to other supply markets?

Mozambique is not a Greenfield basin anymore
6
0
1
2
3
4
5
6
7
8
9
11 12 13 14 15
Metallurgical Thermal
Data: CRU.
Mozambique coal exports, Mt
0
1
2
3
4
5
6
7
8
9
11 12 13 14 15
Metallurgical Thermal
Data: CRU.
Mozambique coal production, Mt

Mozambique metallurgical coal is high ash, mid vol, high
CSR
7
0
10
20
30
40
50
60
70
80
Data: CRU.
CSR HCC
0%
2%
4%
6%
8%
10%
12%
Data: CRU.
Met. Coal Ash, % ad

New met. coal supply from Mozambique, Mongolia and
Russia will come online in the next five years
8
-4
-3
-2
-1
0
1
2
3
4
5
6
7
15 16 17 18 19
Mongolia Mozambique Russia
Met. coal exports change y/y, Mt
Data: CRU, GTIS, company reports.

Mozambique thermal coal has high CV, and a high ash
content
9
0
1,000
2,000
3,000
4,000
5,000
6,000
7,000
Data: CRU.
Thermal Coal Energy, Kcal/kg NAR
0%
5%
10%
15%
20%
25%
30%
Data: CRU.
Thermal Coal Ash, % ad

Mozambique, Russia to be the predominant growth markets
for seaborne thermal coal supply
10
0
2
4
6
8
10
12
14
12 13 14 15 16 17 18 19
Mozambique Russia
Data: CRU.
Changes in thermal coal exports, Mt y/y

Data: CRU
South African thermal coal production, exports static
through to 2019
11
0
50
100
150
200
250
300
2012 2013 2014 2015 2016 2017 2018 2019
Domestic Demand Exports
Total thermal coal production and exports, 2012-2019 (Mt)

Agenda
• Coal production in Mozambique – how does it fit in with global supply?
• Where are the demand markets for Mozambican metallurgical and thermal coal
exports?
• How competitive are Mozambican costs compared to other supply markets?

No matter where you look, it is India
13 Images courtesy of domdeen at FreeDigitalPhotos.net

Indian hot metal production is expected to grow strongly
this year; production rose by 11% y/y in Q1
14
11.0
11.5
12.0
12.5
13.0
13.5
14.0
14.5
15.0
13Q1
13Q2
13Q3
13Q4
14Q1
14Q2
14Q3
14Q4
15Q1
Indian hot metal production, Mt
Data: CRU.
0.0
1.0
2.0
3.0
4.0
5.0
6.0
Indian coking coal imports, Mt

Robust met. Coal import demand growth from other
markets, including India, will help to offset Chinese decline
15
-2%
0%
2%
4%
6%
8%
10%
15 16 17 18 19
JKT India Europe Latin America
Data: CRU.
Met. coal seaborne import demand growth y/y, %

16
-8%
-6%
-4%
-2%
0%
2%
4%
6%
8%
0
50
100
150
200
250
300
350
2014 2015 2016 2017 2018 2019
India seaborne demand South East Asia seaborne demand
Global seaborne imports excl. China Global seaborne imports
LHS: India and South East Asia seaborne imports, Mt
RHS: Growth, y/y %
Data: CRU.
Seaborne thermal coal supply to India and Southeast Asia
set to increase

Electricity generation demand to drive thermal coal
consumption in India
17
0
200
400
600
800
1,000
1,200Cement production coal demand
Other industrial coal demand
Electricity generation coal demand
Data: CRU.
Thermal coal demand by industry, Mt
0%
2%
4%
6%
8%
10%
12%
14%
16%
0
200
400
600
800
1,000
1,200
1,400
1,600
1,800
2,000Gross electricity generation
Electricity % of PE
Data: CRU.
LHS: Total gross electricity generation, TWh
RHS: Electricity percentage share of Primary Energy, %
18
0
200
400
600
800
1,000
1,200
10 11 12 13 14 15 16 17 18 19
Seaborne imports Domestic production Total demand
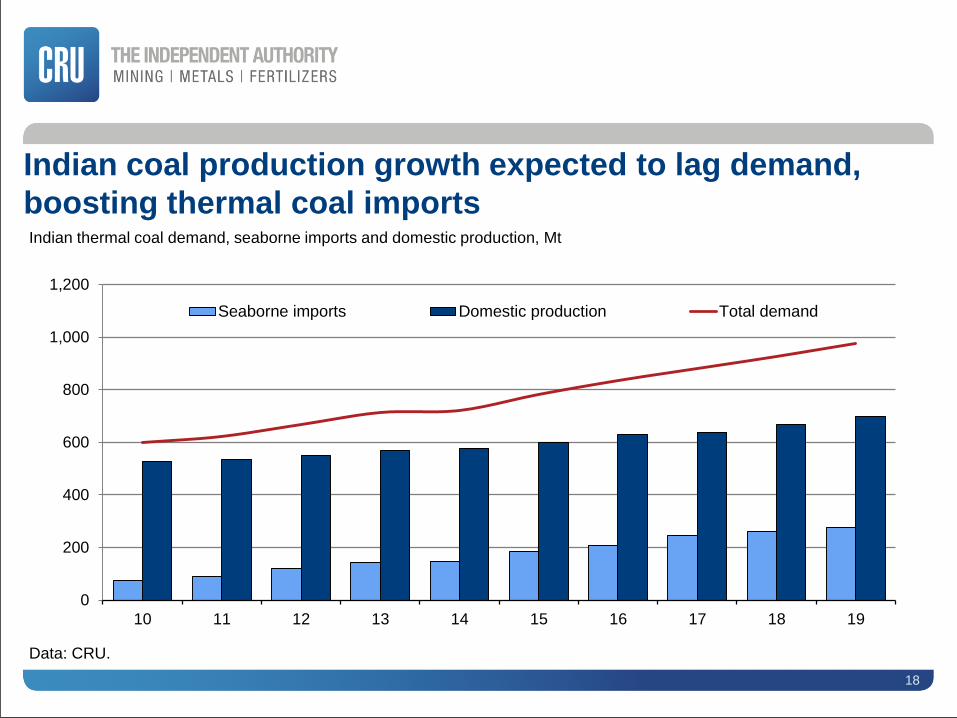
Indian thermal coal demand, seaborne imports and domestic production, Mt
Data: CRU.
Indian coal production growth expected to lag demand,
boosting thermal coal imports

India to overtake China as major thermal coal import
market in 2015
19
0
50
100
150
200
250
300
10 11 12 13 14 15 16 17 18 19
China India
Seaborne thermal coal imports, Mt
Data: CRU.

Speaking of China’s demand: underlying versus apparent Imports continue despite slower power generation growth
20 Data: NBS, CRU Thermal Coal Market Service
Underlying SE generation demand growth (% YoY RHS) vs.
apparent demand, imports (Mt LHS)
-20%
-10%
0%
10%
20%
30%
Domestic coastal Volume Change% YoY
QHD 5500Kcal Price % YoY
China domestic coastal volume changes & Price %
YoY
0.0%
2.0%
4.0%
6.0%
8.0%
10.0%
12.0%
14.0%
0
50
100
150
200
250
Seaborne Imports (Mt LHS)
Power generation in coastal area (% YoY RHS)
Data: CRU Analysis.

21
China has plenty of coal, in the wrong place China’s coal & power production surplus & deficits are expanding
XINJIANG
QINGHAI
INNER MONGOLIA
GANSU
NINGXIA
SHAANXI XIZANG
SICHUAN CHONGQING
YUNNAN GUIZHOU
GUANGXI
HAINAN
HUNAN JIANGXI ZHEJIANG
FUJIAN
GUANGDONG
MACAU
SHANGHAI
JIANGSU
ANHUI HUBEI
HENAN
SHANXI
SHANDONG
HEBEI LIAONING
JILIN
HEILONGJIANG
>350mt 100mt to 350mt 20mt to 100mt <20mt
XINJIANG
QINGHAI
INNER MONGOLIA
GANSU
NINGXIA
SHAANXI XIZANG
SICHUAN CHONGQING
YUNNAN
GUIZHOU
GUANGXI
HAINAN
HUNAN JIANGXI ZHEJIANG
FUJIAN
GUANGDONG
MACAU
SHANGHAI
JIANGSU
ANHUI HUBEI
HENAN
SHANXI
SHANDONG
HEBEI LIAONING
JILIN
HEILONGJIANG
Coal production in 2004 Coal production in 2014
Data: CRU Thermal Coal Market Service
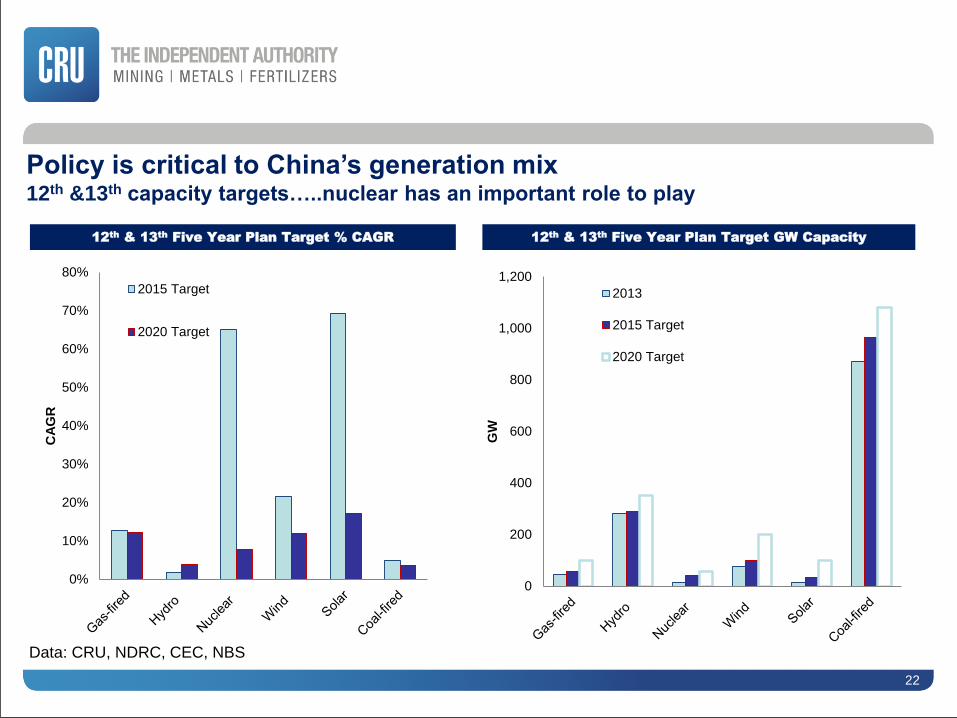
Data: CRU, NDRC, CEC, NBS
Policy is critical to China’s generation mix 12th &13th capacity targets…..nuclear has an important role to play
22
0
200
400
600
800
1,000
1,200
GW
2013
2015 Target
2020 Target
0%
10%
20%
30%
40%
50%
60%
70%
80%
CA
GR
2015 Target
2020 Target
12th
& 13th
Five Year Plan Target % CAGR 12th
& 13th
Five Year Plan Target GW Capacity

Power consumption growth has a long way to run But regional differences in intensity trajectory will impact growth rates.....
23
R² = 0.9643
0
0.002
0.004
0.006
0.008
0.01
0.012
0.014
0 10000 20000 30000 40000 50000 60000
Japan USA France
Germany China Average
Regression Line
Electricity demand / cap. vs GDP / cap. (1980-2011)
0
1
2
3
4
5
6
7
8
0 10000 20000 30000 40000 50000
MW
h/c
ap
ita
South-East Coastal South-East Coastal (f)
Rest of China Rest of China (f)
China electricity demand / cap. vs GDP / cap. (1995-
2035)
Rapid industrialisation
and increase in energy
consumption per capita…
Data: CRU Thermal Coal Market Service
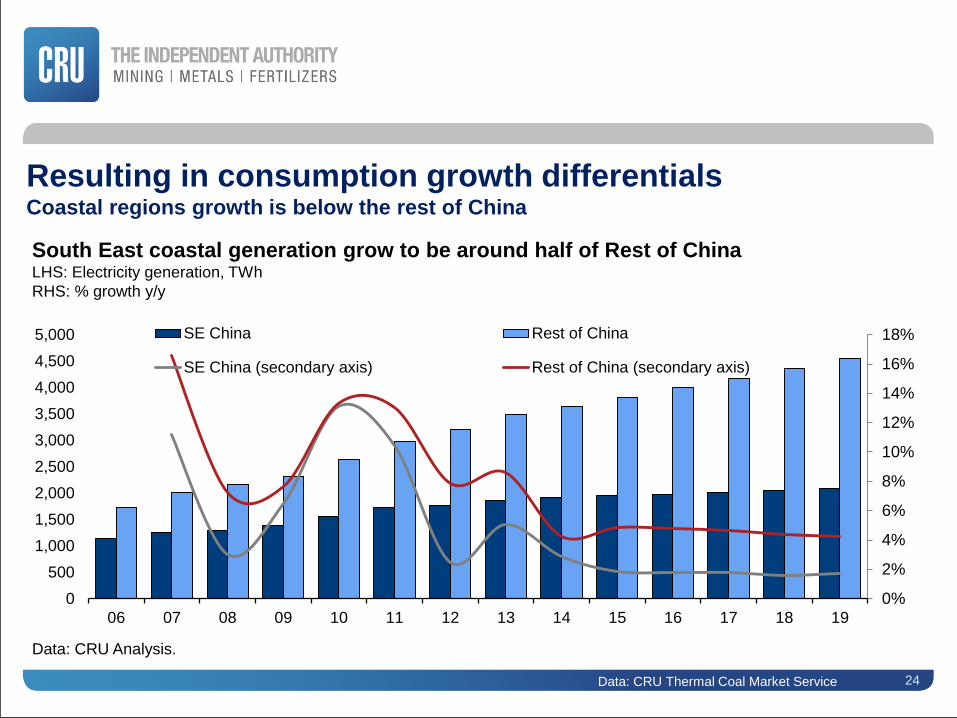
Resulting in consumption growth differentials Coastal regions growth is below the rest of China
24
0%
2%
4%
6%
8%
10%
12%
14%
16%
18%
0
500
1,000
1,500
2,000
2,500
3,000
3,500
4,000
4,500
5,000
06 07 08 09 10 11 12 13 14 15 16 17 18 19
SE China Rest of China
SE China (secondary axis) Rest of China (secondary axis)
South East coastal generation grow to be around half of Rest of China LHS: Electricity generation, TWh
RHS: % growth y/y
Data: CRU Analysis.
Data: CRU Thermal Coal Market Service

The Chinese steel industry has been flagging and domestic
steel prices tumbled in H1
25
-10%
-8%
-6%
-4%
-2%
0%
2%
4%
6%
8%
10%
-1.5
-1.0
-0.5
0.0
0.5
1.0
1.5
2.0
2.5
3.0
3.5Crude steel production change y/y EBITDA margin
Data: CRU.
LHS: China crude steel production change y/y, Mt
RHS: Average China steel mill EBITDA margin, %

The Chinese coal industry remains oversupplied; coke
exports continued to rise y/y in H1, while coal imports fell
26
China coke exports
rose by 25% y/y in
January-May
0
1
2
3
4
5
6
7
8
China met. coal imports, Mt
Data: CRU, GTIS.
0
200
400
600
800
1,000
1,200
1,400
China coke exports, '000 t

Agenda
• Coal production in Mozambique – how does it fit in with global supply?
• Where are the demand markets for Mozambican metallurgical and thermal coal exports?
• How competitive are Mozambican costs compared to other supply markets?

Supply regions have benefitted from depreciating local
currencies, aiding cost cutting efforts Hard coking coal business costs, y/y change, %
-40%
-35%
-30%
-25%
-20%
-15%
-10%
-5%
0%
Russia Ukraine Australia Mozambique United States
14 vs. 13 15 vs 14
Data: CRU.

Macro-shifts and company actions are pushing the
Business Cost curve lower in 2015
2014 2015
X-axis: Seaborne HCC supply, Mt
Y-axis: Business Costs(1), $/t, FOB, nominal
Key 2015 macro assumptions:
• Energy:
• Brent oil: $61/bbl
• Diesel: $71/bbl
• Currency:
• AUD: 76 cents
• CAD: 81 cents
• RUB: 0.0169 cents
Data: CRU Metallurgical Coal Cost Model 2014. Note: (1) Cash costs including royalties, sustaining capital and adjustments to benchmark HCC price for
freight and quality differentials.
29
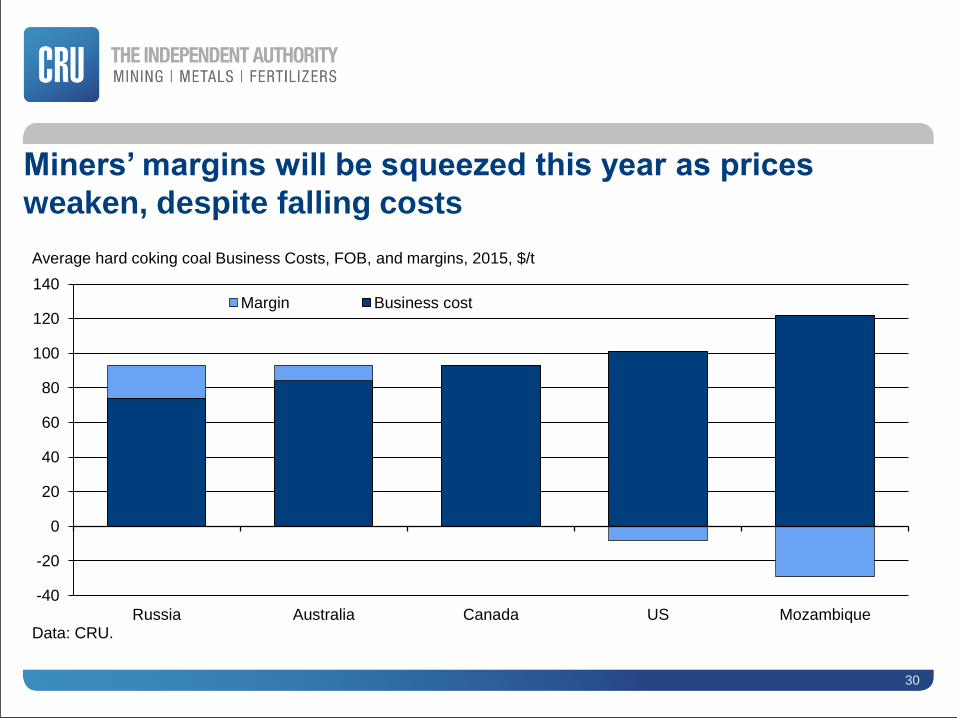
Miners’ margins will be squeezed this year as prices
weaken, despite falling costs
30
-40
-20
0
20
40
60
80
100
120
140
Russia Australia Canada US Mozambique
Margin Business cost
Average hard coking coal Business Costs, FOB, and margins, 2015, $/t
Data: CRU.

Further cost reductions will be very difficult in the years
ahead, as currencies and energy prices recover
50
75
100
125
60
80
100
120
14 15 16 17 18 19
Global average seaborne costs AUD CAD RUB Oil price
LHS: Global average seaborne HCC Business Costs, $/t, FOB, real 2014$
RHS: Key cost macro drivers, index 2014 = 100
Data: CRU Metallurgical Coal Cost Model. Note: (1) Cash costs including royalties, sustaining capital and adjustments to benchmark HCC price for
freight and quality differentials.
31

Data: CRU Thermal Coal Cost Model
Mixed operations are typically higher cost than either open
pit or underground mines Average Business Costs, 2014
0
20
40
60
80
100
120
Austr
alia
Ch
ile
Co
lom
bia
Ind
one
sia
Mo
za
mbiq
ue
Russia
Sou
th A
fric
a
Un
ited
Sta
tes
Ven
ezue
la
Vie
tna
m
Mixed Open Pit UndergroundLHS: Business Costs (US$/t)
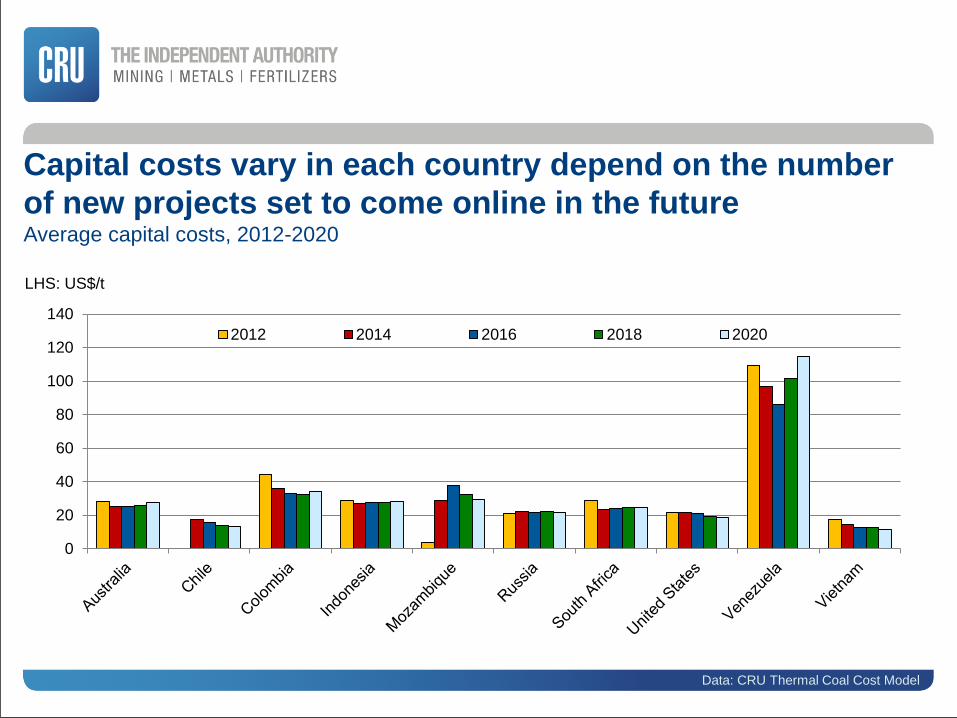
Capital costs vary in each country depend on the number
of new projects set to come online in the future Average capital costs, 2012-2020
Data: CRU Thermal Coal Cost Model
0
20
40
60
80
100
120
140
2012 2014 2016 2018 2020
LHS: US$/t
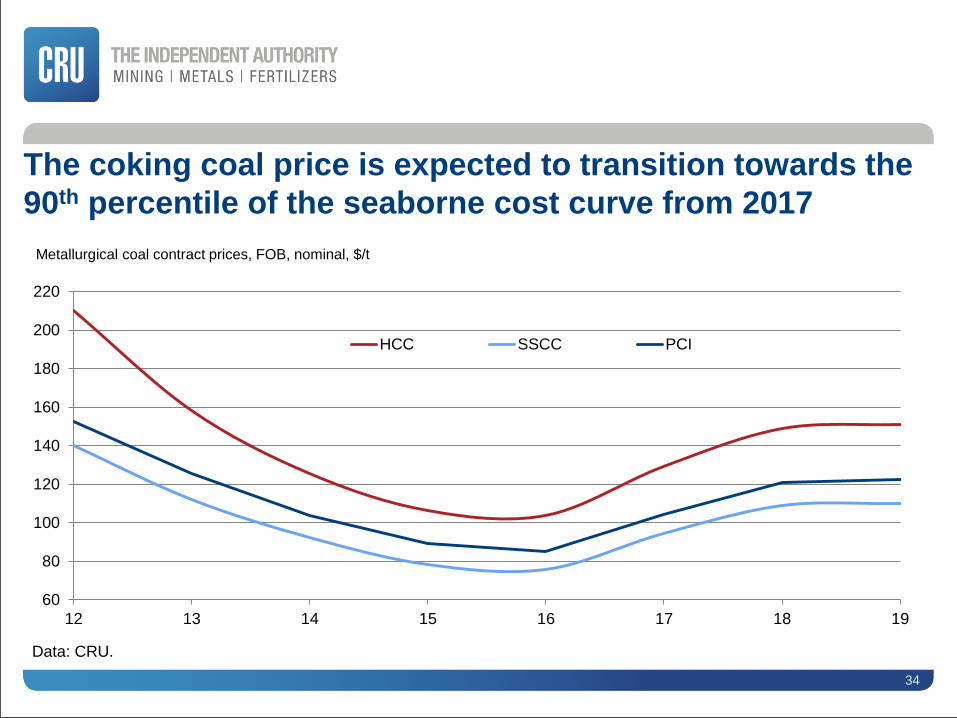
The coking coal price is expected to transition towards the
90th percentile of the seaborne cost curve from 2017
60
80
100
120
140
160
180
200
220
12 13 14 15 16 17 18 19
HCC SSCC PCI
Data: CRU.
Metallurgical coal contract prices, FOB, nominal, $/t
34

35
0
20
40
60
80
100
120
-40
-20
0
20
40
60
80
100
120
2014 2015 2016 2017 2018 2019
Change in domestic coastal trade CFR South China, 5,500 kg/kcal NAR
LHS: Change in Southeast China coastal trade, Mt
RHS: Benchmark thermal coal price, CFR China, 5,500 Kcal/kg NAR
Data: CRU.
Increased domestic coastal trade, costs, and stronger
demand excl.-China will support price rises going forward
1. The opening of the Nacala Corridor and port, together with other infrastructure
improvements, will boost coal exports from Mozambique.
2. Chinese demand is still relevant, but the seaborne coal markets are now switching their
focus to India. India will be the dominant demand market for coal going forward.
3. Prices are expected to recover towards their equilibrium point, and therefore a balanced
market, in both metallurgical and thermal coal. However, the wait will be longer for thermal
coal.
Conclusion The future is brighter for Mozambican coal exports
36

Thank you for listening www.crugroup.com
11
Matthew Boyle: Principal Consultant - Coal and Steel Raw Materials
Nick Collier: Business Development Manager
37
39