mature leader of the cee region - ey.com · everywhere and in all market segments are re-defining...
TRANSCRIPT

Mature leader of the CEE region EYrsquos Attractiveness SurveyPolandMay 2017
Contents1 Introduction
4 FDI global inflows
5 Investors vote ldquoremainrdquo in Europe
7 Europersquos return to steady economic growth deferred
8 Poland does need FDIs
10 Poland is one of the most attractive destinations in Europe for foreign direct investors
12 Poland attracts investors mainly from Western Europe and the USA
14 Polandrsquos Attractiveness Survey indicating improvement in foreign investment prospects
16 Polandrsquos key assetshellip not always recognized
19 The Czech Republic emerges as Polandrsquos main competitor for FDIs
20 Methodology
eycomattractiveness
Mature leader of the CEE region | EYrsquos Attractiveness Survey Poland 1
The current pace of technological development and disruption taking place everywhere and in all market segments are re-defining many sectors and industries The New Normal is a state when no one can be assured of its position In such an environment new investments are of essence in order to keep up with trends and competition It refers to companies themselves but also to whole economies
Being ready for a constantly changing and new market situation understand the needs of your clientsrsquo but also your people (not workers) being aware how tastes and expectations of generations vary being ready and adaptable to the requirements of Industry 40 ndash all those challenges are competing to be number 1 on the C-suite agenda In todayrsquos world investing in addressing that kind of issue is a requirement for any future success and will define the shape of the economy to come
At EY we experience this as well and respond accordingly EY Poland invested in our Global Talent Hub we are part of the Startberryreg initiative for start-ups in Warsaw and we are part of Wavespacetrade - our global network of growth and innovation centers to help clients achieve radical breakthroughs We are also transferring our service delivery model in order to adapt to a fast-moving and more digitalized world
Apart from analyzing companiesrsquo challenges and investment needs at EY we also identified factors that play a critical role in foreign investorsrsquo decision to establish or expand their activities in a given country Understanding those factors should be of particular importance for countries with such aspirations as Poland which to achieve its ambitions needs investments Polandrsquos investment needs are reinforced by a very limited space for further employment led-growth due to among others unfavourable demographic developments However its rate of investment (an average of 202 in the 2004-2016 period) has in recent years been well below the levels observed in other CEE economies (246) A significant increase in the level of investment in Poland requires both domestic and foreign capital outlays The latter should preferably take the form of foreign direct
investments (FDI) which not only generate employment but are often associated with technology transfer productivity spillovers transfer and development of skills
There is however strong competition between countries for FDIs Companies select the best locations in which they believe they will be successful ndash which means they will find the right talent and conditions to run business activities Countries and governments do all they can in order to attract investors and win their own rivalry for quality job creators and investors in modern technologies and RampD activities The list of factors that investors pay attention to and so should governments is provided and discussed in annual publications of EY European Attractiveness Survey
According to that survey Poland has for many years been among the top choices for foreign direct investments in Europe and a leader for Central and Eastern Europe In 2016 Poland was ranked 5th (an advance from the 6th position) among European countries in terms of the number of planned projects while the number of announced FDI-related jobs in Poland was the second highest only next to the UK
This year however we wanted to gain a deeper insight into how Poland is positioned and perceived by investors Our aim was especially to understand the assets of Poland that foreign investors value most and the risks (related to their presence on the market) that they point to Which sectors do they focus on And who is considered to be Polandrsquos main competitor for FDIs To answer those questions we have prepared the first edition of Polandrsquos Attractiveness Survey
Our report is based on factual and data analysis as well as on the feedback from investors who have been investing in Poland and other countries Thus we believe that this publication will be helpful for companies and investors in their considerations regarding site selection process and conditions to run business activity We believe the report will also be supportive to administration and other stakeholders in making Poland a valuable and attractive foreign investment destination
Introduction
Jacek KędziorPoland Managing PartnerEY Polska
2 Mature leader of the CEE region | EYrsquos Attractiveness Survey Poland
Introduction
2
3
Top 3 European destination countries by FDI job creation
Top 3 investors
Relative to other European countries the number of FDI-related jobs announced to be created in Poland in 2016 was the second highest 22 074 only next to the UK ndash 43 165 Germany on the 3rd place with 19 961 new jobs The position of Poland in this ranking has been relatively stable (in top 3 countries) since 2004 with only two exceptions in 2009 and 2011 when the country was beyond the podium
21of all projects
18of all projects
9of all projects
USA Germany and United Kingdom are the top three investors ndash 48 of all projects into Poland came from those three countries 64 of all FDI in 2016 came from Western Europe
USA
Germany
UK
1 Number of FDI projects in Europe
Europe CEE Poland
In 2016 the number of FDI projects directed to Europe increased by 15 in comparison to the previous year Overall 5845 new international investment projects were announced
In 2016 Central and Eastern Europe (CEE) maintained its appeal to international investors ndash the region received 23 of all the FDI projects announced FDI in CEE had a strong momentum in 2016
Poland leaped to fifth place in the national ranking attracting 256 projects a hefty 21 increase
256 projects
+15vs 2015
+21vs 2015
+16vs 2015
12vs 2015
2vs 2015
17vs 2015
GermanyPoland
UK
22 074 new jobs
43 165 new jobs
19 961 new jobs
2 Mature leader of the CEE region | EYrsquos Attractiveness Survey Poland
1 342 projects
5 845projects
eycomattractiveness
Mature leader of the CEE region | EYrsquos Attractiveness Survey Poland 3
eycomattractiveness
FDI projects located in Poland fall predominantly into three sectors manufacturing finance amp business services and transport amp communications On average these sectors accounted for 95 of all FDI projects in Poland in 2005-2016 However the share of manufacturing decreased from 81 of all FDI projects in 2005 to 62 in 2016 while finance amp business services attracts more and more projects ndash from 7 to 28 respectively
Poland and its neighbors including the Baltic States are also attracting a third wave of shared service centers (up 83 for CEE in 2016) and other activities supplying services to companies In 2016 Poland garnered 38 out of 161 (or 24) SSC projects announced by international investors ranking first among European countries
Over 70 of surveyed companiesrsquo representatives indicate that Polandrsquos labour skills level potential for productivity increase and labour costs are very or fairly attractive The same factors are also most frequently listed as Polandrsquos key assets in comparison to other European countries
Traditionally Central and Eastern European countries have been competing with Poland for foreign investment The results of the survey confirm this common knowledge additionally enumerating Germany among Polandrsquos main competitors While the position of the Czech Republic as Polandrsquos main competitor for FDIs may not be that surprising the margin by which it has been ranked ahead of other countries is striking The position of the Czech Republic as that of Polandrsquos main competitor for FDIs is shared by every group of investors considered
4
6
7
5
Number of FDI projects in Poland by activity
Polandrsquos key assets
Czech Republic ndash Polandrsquos main competitor for FDIs
FDI projects in shared services centers in Europe
119
Manufacturing
50
Sales ampMarketing
38
Shared ServicesCenters
19
Logistics
19
Research ampDevelopment
Local labourskills level
Potential forproductivity increase
Labour costs
81 78 74
1315
15
4410
Poland
1stin SSC
Mature leader of the CEE region | EYrsquos Attractiveness Survey Poland 3
4 Mature leader of the CEE region | EYrsquos Attractiveness Survey Poland
FDI global inflows
FDI global inflows
In recent years multinational investors activity has remained high Though down 13 yoy in 2016 global foreign direct investment (FDI) inflows1 reached $1525 bn2 (in nominal terms) ndash one of the highest levels recorded over the 2005-2016 period Last year ca frac14 of global FDI inflows came to Europe
One may notice that FDI trend has not been smooth over time In particular in the aftermath of the global financial crisis of 2007-2009 the FDI fell sharply and until now has not yet reached the pre-crisis level (see figure 1) This gap should largely be reduced if United Nations Conference on Trade and Development
1 UNCTAD gathers data for virtually all the countries in the world (ca 200 countries depending on data availability for a given year)
2 Preliminary estimates
(UNCTAD) expectations materialize and FDI flows will increase by 10 in 2017 on accelerating global economic growth and international trade
One of the most important types of activity of international investors are greenfield projects which contribute directly to the creation of new facilities and jobs The annual value of greenfield investment in 2005-2016 averaged about $830 bn3 remaining relatively stable since the global financial crisis One may notice that in contrast to FDI inflows the value of announced greenfield projects increased in 2016
3 Preliminary estimates
Figure 1 Global FDI inflows and the value of announced greenfield FDIs
Source UNCTAD
eycomattractiveness
Mature leader of the CEE region | EYrsquos Attractiveness Survey Poland 5
Investors vote ldquoremainrdquo in Europe
EY European Attractiveness Survey (EAS) examines new investment projects mainly greenfield projects announced by international investors The study is based on interviews with high-level executives from around the world and foreign direct investment announcements by companies The latter part is linked to EY European Investment Monitor (EIM) powered by Oxford Intelligence which is the leading database of direct investment across Europe The database tracks those FDI projects that have resulted in the creation of new facilities and new jobs Therefore portfolio investment joint ventures mergers and acquisitions and other investment that do not entail the creation of new jobs (eg replacing old machinery without creating new employment) are excluded
Despite the uncertainty in 2016 Europe attracted a new record high number of FDI projects
For several years Europe has experienced many challenges (incl uncertainty on the future of the EU and the Eurozone in particular) caused by public debt crisis population aging conflicts in the Middle East and migration inflows into Europe tensions between Russia and Ukraine Brexit and populist parties garnering significant minority support in many European countries Despite such an uncertain
1048666business environment and geopolitical risksinvestors continue to see Europe as an attractive investment destination
In 2016 the number of FDI projects directed to Europe increased by 15 in comparison to the previous year Overall 584510486661048666 new internationalinvestment projects were announced According to information gathered for 62 of these announcements the projects located in Europe should create at least 260 thousand10486661048666 new job1048666s4 The majority of FDI in Europe arises from intra-European FDI flows
In 2016 Central and Eastern Europe (CEE)5 maintained its appeal to international investors - the region received 23 of all the FDI projects announced in Europe and 52 in terms of the announced new jobs
4 Information on the number of new jobs is not available for all of the announced investment projects As such the number of new jobs given above constitutes the lower bound of the actual number of new employment related to FDI projects announced in Europe Any conclusions based on the number of planned jobs must also be drawn with caution
5 Central and Eastern Europe encompasses 22 countries Albania Belarus Bosnia and Herzegovina Bulgaria Croatia Cyprus Czech Republic Estonia Hungary Latvia Lithuania Macedonia Moldova Montenegro Poland Romania Russia Serbia Slovakia Slovenia Turkey and Ukraine
Mature leader of the CEE region | EYrsquos Attractiveness Survey Poland 5
6 Mature leader of the CEE region | EYrsquos Attractiveness Survey Poland
Figure 2 Number of FDI projects announced in Europe
Source EY (2017) European Investment Monitor
Europersquos perception in the eyes of international investors is improving Western Europe and CEE are among the worldrsquos top 3 most attractive regions for 53 and 37 of executives respectively This makes Western Europe the top performer while CEE ranks third behind Northern America and level-pegging with China While Western Europe gained 3 pp
compared to 2015 CEE improved by as many as 9 pp That was the biggest increase among all the regions considered in 2016 Interestingly since 2013 the perception of Western Europe and CEE among investors has significantly improved while the attractiveness of BRICS has faded
Figure 3 Perception of most attractive global regions6
Source EY (2017) European Attractiveness Survey
6 Answer to the question ldquoIn general which of the following regions do you think are currently the top 3 most attractive regions in which to establish operationsrdquo (3 answers possible)
Investors vote ldquoremainrdquo in Europe
eycomattractiveness
Mature leader of the CEE region | EYrsquos Attractiveness Survey Poland 7
Europersquos return to steady economic growth deferred
Despite positive developments in terms of the number of announced investment projects and improving perceptions of Europersquos attractiveness investors seem to see the prospect of strong European economic growth receding further into the future In 2015 53 respondents expected Europe to return to steady economic growth within the next three years In 2017 that proportion is down to 42 At the same time the proportion expecting a return to steady economic growth after at least five years increased to 56 (from 45 in 2015)
Also the share of international investors confident that Europe will ever return to stable economic growth decreased from 85 in 2015 to 65 in 2017
The British votersrsquo decision to leave the EU has contributed to investorsrsquo doubts regarding the future economic growth in Europe 20 of international investors declare to have plans to relocate operations if Britain leaves the European single market But many companies do not yet have a comprehensive view of the tax (VAT pre-financing and the exact scope of custom duty) administrative (customs and VAT requirements) and regulatory consequences and have only just started thinking about the possible consequences The impact of Britainrsquos planned exit from the European Union will probably be more visible in next yearrsquos survey
Figure 4 In your view given the current uncertainties in Europe how long before we see a return to steady economic growth and performance in Europe
Source EY (2017) European Attractiveness Survey Sample 332 respondents confident in Europersquos ability to return to a more dynamic economic growth
8 Mature leader of the CEE region | EYrsquos Attractiveness Survey Poland
Poland does need FDIs
Foreign companies play an important role in the Polish economy They contribute a lot to employment wage fund generated value added investments exports and general government revenues Companies with a majority share of foreign capital have in recent years often outperformed Polish public and private business entities thereby being an important driver of the economic growth In particular foreign companies accounted for a vast majority of employment growth in the enterprise
sector in Poland over the 2010-2015 period In 2016 at the time of economic slowdown foreign companies accelerated the growth of generated value added exports and employment significantly alleviating the adverse impact of other factors on the Polish economy Importantly in contrast to Polish private and public companies foreign entities continued to expand their investment activity in 2016 though at a lower rate than in 2015
Figure 5 Gross fixed capital formation in the enterprise sector in Poland by ownership7
Source EY based on Central Statistical Office data
7 Data for 2011-2015 refers to annual growth in gross fixed capital formation (GFCF) of small (10-49 employed persons) medium (49-249 employed persons) and large (over 249 employed persons) enterprises while data for 2016 compares GFCF of medium and large enterprises to their GFCF in 2015 Data excludes information for most companies with unlimited ownerrsquos liability
8 Companies (1) in which at least part of the capital share belongs to the public sector (2) state-owned enterprises or (3) entities without specific legal status (eg some state-owned entities)
9 Companies whose capital is predominantly owned by foreigners (gt50 of shares) and (2) branches of foreign enterprises10 Companies that were defined neither as ldquoforeign companiesrdquo nor as ldquoPolish public sector companiesrdquo
Poland does need FDIs
Polish public sector companies8
Polish private companies10
Foreign companies9
eycomattractiveness
Mature leader of the CEE region | EYrsquos Attractiveness Survey Poland 9
Poland was the only EU country that avoided recession during the global financial crisis in 2007-2009 In terms of cumulative GDP growth in 2008-2016 amounting to 324 Poland ranked 3rd among EU Member States The outstanding performance of the Polish economy has increased its attractiveness as an investment destination
Figure 6 Number of FDI projects and jobs announced in Poland
Source EY (2017) European Investment Monitor Note that the number of new jobs is available only for a certain part of announced investment projects In 2016 55 of announced projects were accompanied by information on planned employment This proportion might change from year to year Hence conclusions from the changes in announced number of FDI related jobs must be drawn with caution
To continue the catching-up process with more developed economies Poland requires a high rate of investment Investment needs are additionally reinforced by a very limited room for further employment led-growth due to among others unfavourable demographic developments However in the last decade the rate of investment in Poland was below the EU average and far below the levels observed in other CEE countries The key problem is a very low level of private investment in Poland Importantly for the majority of the last decade the
savings rate in Poland has been even lower than the investment rate This constitutes another challenge that should be addressed by the Polish government
The factors outlined above indicate that the Polish economy does need foreign capital inflows preferably in the form of direct investment leading to generating a significant value added This emphasizes the importance of Polandrsquos investment attractiveness and paying attention to factors influencing foreign investorsrsquo decisions
To continue the catching-up process with more developed economies Poland needs to increase its rate of investment which over the last decade has been
well below the level recorded for the majority of CEE countries Despite a low investment rate for the majority of that period the savings rate was even lower though in recent years it has improved somewhat Foreign capital is thus required to finance our countryrsquos investment needs Of particular importance should be foreign direct investments (FDIs) which have greatly contributed to the internationalization of Polish companies and their integration into global value chains since the 1990s Empirical evidence shows that this process
has been associated with an increase in exports transfer of skills and know-how and higher productivity of companies which on average invest more per employee and pay higher wages than non-internationalised enterprises Importantly other domestic firms also benefit from the activity of companies that are exposed to foreign markets which confirms the existence of significant spillover effects To understand the importance of the internationalization of Polish companies one should note that in 2000 ca 20 of value added generated in Poland was driven by external demand but this proportion increased to ca 35 in 2016 The message is even stronger if we realize that majority () of economic growth in Poland in this century has been driven by foreign demand The activity of foreign companies can also alleviate the consequences of economic slowdown For example in 2016 ndash the year
of significant investment contraction by the public and Polish private companies foreign companies continued to increase their capital outlays in Poland Benefits of FDIs make them much needed by countries particularly by catching-up economies which results in harsh competition for FDI inflows EY Polandrsquos Attractiveness Survey should help us to understand which assets foreign investors value most and what are their main concerns Reinforcing strengths and addressing weaknesses of the Polish economy would improve its perception which is one of the preconditions for winning valuable greenfield investment and thereby improving Polandrsquos long-term economic potential
Marek Rozkrut EY Poland Chief Economist Head of Economic Analysis Team
EY Viewpoint
10 Mature leader of the CEE region | EYrsquos Attractiveness Survey Poland
Poland is one of the most attractive destinations in Europe for foreign direct investors
The findings of the EY European Attractiveness Survey indicate that when approximated by the number of announced investment projects Poland seems to be one of the most attractive locations in Europe for foreign direct investors In 2016 international investors announced their intentions to carry out 256 investment projects in Poland compared to 211 projects in 2015 This ranked Poland 5th among European countries in terms of the number of planned projects ndash achieving an
advance from the 6th position (ex aequo with Belgium) in 2015 and the best result since 2008 when Poland also ranked 5th Naturally the number of planned investment projects depends on the local market capacity in particular the availability of labour11 However the fact that Poland regularly stays ahead of economies such as Russia and Turkey in terms of international investment projects proves that Polandrsquos appeal to foreign investors is high
11 It is thus no surprise that Poland ranks higher than smaller economies in the CEE region
Poland is one of the most attractive destinations in Europe for foreign direct investors
Source EY European Investment Monitor (EIM) 2017
2015 2016Percentage Change
(2016 vs 2015
United Kingdom 1065 1144 7
Germany 945 1063 12
France 598 779 30
Spain 248 308 24
Poland 211 256 21
Netherlands 219 207 -5
Russia 201 205 2
Belgium 211 200 -5
Ireland 127 141 11
Turkey 134 138 3
Finland 105 133 27
Romania 98 132 35
Czech Republic 70 110 57
Hungary 94 107 14
Sweden 51 90 76
Italy 55 89 62
Switzerland 90 88 -2
Denmark 63 72 14
Slovakia 54 70 30
Portugal 47 59 26Others 396 454 15Total 5083 5845 15
2015 2016Percentage Change
(2016 vs 2015
United Kingdom 42336 43165 2
Poland 19651 22074 12
Germany 17126 19961 17
Romania 12746 17545 38
France 13639 16980 24
Serbia 10631 16396 54
Russia 13672 15064 10
Czech Republic 9332 14292 53
Spain 7126 12969 82
Hungary 11741 12450 6
Ireland 10772 8535 -21
Slovakia 9564 8308 -13
Turkey 2971 7179 142
Austria 1357 4759 251
Ukraine 850 4547 435
Bulgaria 3598 3959 10
Switzerland 1391 3416 146
Belgium 3168 3309 4
Moldova 1000 3200 220
Italy 1383 2654 92
Others 23612 18911 -20Total 217666 259673 19
Top 20 destination countries by FDI projects Top 20 destination countries by FDI job creation
eycomattractiveness
Mature leader of the CEE region | EYrsquos Attractiveness Survey Poland 11
In 2016 the growth rate of the number of FDI projects located in Poland was higher than in Europe as a whole As a consequence in 2016 Poland was the location of 44 of all FDI projects announced in Europe which indicates the third consecutive year of increase in Polandrsquos share in the total number of foreign projects in Europe
Figure 7 Share of FDI projects in Poland in total FDI projects in Europe
Source EY (2017) European Investment Monitor
Based on data available for 55 of projects international investors planned to create at least 22 thousand new jobs in Poland While the exact counting of jobs is challenging (and the job data coverage is not complete) the increase in announced new jobs by foreign investors in Poland between 2011 and 2016 (over a twofold increase) provides additional evidence that the trend in international investorsrsquo activity in Poland continues to be positive
Relative to other European countries the number of FDI-related jobs announced to be created in Poland in 2016 was the second highest only next to the UK The position of Poland in this ranking has been relatively stable (among top 3 countries) since 2004 with only two exceptions in 2009 and 2011 when the country was beyond the podium
Poland is amongst the top 5 locations in Europe for FDI ndash that is quite an achievement It confirms the prediction of the last survey when investors indicated
that Poland would be the best place to invest just after Germany UK France and the Netherlands It is really promising since the perception has not always been supported by the figures and real investment projectsAt the same time there is a global rivalry and competition for innovative growth We do not measure it yet but in order to be ready for sustainable growth Polish economy needs to have the ability to interact with newest trends like Industry 40 Technological changes will decrease the weight of labor costs in the
site selection processes allowing some comebacks of production to the more expensive locationsWe observe it in a number of areas and Poland is getting ready for this Changes in the law regarding support for innovation enhanced RampD tax relief new support schemes for investments and comprehensive environment for start-ups are all good tools which should attract investors bringing more value added projects to the Polish economy There are many good examples of such projects in manufacturing automotive SSCBPO centers but constant change and benchmarking against other locations is requiredIt all derives from a great desire for growth and belief that FDI contributes to the development of societies and countries In this context Polandrsquos position as a CEE leader is worth underlining since the CEE region itself has improved a lot (+9 pp
vs last year) and regained third position among all regions worldwide ndash just behind Western Europe and North America One needs to remember that it all happens when investors say that only 28 of them are having plans to establish or expand operations in Europe next year It is a fall by 10 pp from 2013Global FDI inflows were down by 13 in 2016 compared to 2015 which means that competition for new projects will not be easier A constantly changing environment supported by technological revolution is creating an environment in which policy makers need to anticipate investorsrsquo expectations and propose solutions in a real time From this perspective challenges of the business and governments are becoming closer than ever
Paweł Tynel EY Poland Head of Grants and Incentives Advisory Services
EY Viewpoint
12 Mature leader of the CEE region | EYrsquos Attractiveness Survey Poland
FDI projects located in Poland fall predominantly into three sectors manufacturing finance amp business services and transport amp communications On average these sectors accounted for 95 of all FDI projects in Poland in 2005-2016 However the share of manufacturing decreased from 81 of all FDI projects in 2005 to 62 in 2016 while finance amp
business services attracts more and more projects ndash from 7 to 28 respectively The share of transport amp communications ranged between 3 and 10 in 2005-2016 Other sectors12 were of rather negligible interest to foreign investors
12 ie agriculture construction education amp health energy recreation retail amp hospitality
Poland attracts investors mainly from Western Europe and the USA
Poland attracts FDI projects mainly from Western Europe and the USA In 2005-2016 on average over 80 of all FDI projects came from these two regions While the importance of Western Europe for FDI in Poland increased in 2016 the share of the USA in total FDI projects launched in Poland fell However there are no clear trends in the origin structure of foreign investors in Poland
Figure 8 Share of FDI projects in Poland by region of origin
Source EY (2017) European Investment Monitor
Table 1 Number of FDI projects in Poland by sectors
2005 2006 2007 2008 2009 2010 2011 2012 2013 2014 2015 2016
Manufacturing 145 106 95 105 72 96 89 89 70 87 117 159
Finance amp Business Services 12 27 31 47 19 35 23 39 27 32 64 72
Transport amp Communications 15 15 11 15 5 8 7 12 4 4 22 15
Retail amp Hospitality 7 5 1 4 3 1 2 4 3 4 7
Construction 3 1 1 1 1 2
Other 1 1 4 7 1 1 3 5 1 6 4 1
Source EY (2017) European Investment Monitor
Poland attracts investors mainly from Western Europe and the USA
eycomattractiveness
Mature leader of the CEE region | EYrsquos Attractiveness Survey Poland 13
The decomposition of international investment projects by activity provides additional insights It reveals that while projects related to manufacturing clearly dominate the structure of foreign investment Poland is becoming a more and more attractive location for support and shared services centers (SSC) to large multinational companies (eg accounting or IT) Indeed in 2016 Poland garnered 38 out of 161 (or 24) SSC projects announced by international investors ranking first among European countries
The activity structure of investment projects announced in Poland is similar to that in the CEE region Two notable exceptions are manufacturing which captures somewhat larger part of investment projects in the CEE (564) than in Poland (465) and shared services centers which in turn attracts a significantly higher proportion of FDI in Poland (145) than in CEE as a whole (56) At the same time there are substantial discrepancies between the activity structure of projects announced in Poland and in Europe as a whole In particular investment
projects announced in Europe concentrated in sales and marketing (459 of all projects) while attracting only 195 projects in Poland By contrast manufacturing projects represented only 263 of the total number of projects in Europe which is much below 465 recorded in Poland
Differences in the sectorial structure of new projects between Poland and Europe as a whole are also reflected in labour-intensity of greenfield FDIs The number of jobs per project in Poland in 2016 (158) was over twice as high as in Europe (72)13 In other words Poland is a host to more labour intensive projects than on average Europe However one may notice that the above ratio in Poland has been in a declining trend suggesting that foreign investment in Poland become more and more capital intensive In addition the number of jobs per project in Poland is lower than the average for the CEE region (189)
13 Only the projects for which data on announced new jobs was available were taken into account in the calculation
Table 2 Number of FDI projects in Poland by activity
2005 2006 2007 2008 2009 2010 2011 2012 2013 2014 2015 2016
Manufacturing 123 79 71 82 59 70 70 65 56 74 86 119
Sales amp Marketing 15 33 41 47 21 29 25 48 18 30 65 50
Shared Services Centre 7 11 5 9 3 7 8 10 5 8 16 38
Logistics 18 14 10 14 8 7 6 7 10 8 20 19
Research amp Development 8 5 10 12 5 12 7 11 12 6 17 19
Headquarters 1 2 2 2 1 1 4
Contact Centre 4 3 3 3 3 1 4 2 4 4 3
Testing amp Servicing 5 7 4 9 1 13 6 3 2 1 2 2
Other 0 0 1 1 0 0 0 0 1 0 1 2
Source EY (2017) European Investment Monitor
14 Mature leader of the CEE region | EYrsquos Attractiveness Survey Poland
Polandrsquos Attractiveness Survey indicating improvement in foreign investment prospects
In 2017 EY for the first time conducted a deepened survey among international investors in order to gain additional insights into their motivations behind establishing operations in Poland As part of Polandrsquos Attractiveness Survey foreign companies both present and non-established in Poland responded to questions regarding their investment plans factors affecting their investment decisions and risks facing Poland
According to the surveyed companies Polandrsquos attractiveness as an investment destination improved slightly in 2016 ndash 29 of respondents indicated that it had improved while 24 of companies claimed that it had deteriorated last year
One may note large differences in the assessment of Polandrsquos attractiveness between representatives of companies which operate in Poland and companies not established in the country In the eyes of the latter the evolution of Polandrsquos attractiveness as an investment destination was better than in the opinion of the former Only 7 of companies which do not conduct operations in Poland indicated that its attractiveness had deteriorated while 32 claimed that it had improved compared to 37 and 26 respectively in the case of companies functioning in Poland
Polandrsquos Attractiveness Survey indicating improvement in foreign investment prospects
Figure 9 To what degree do you think Polandrsquos attractiveness evolved over the last yearwill evolve over the next three years
Source EY (2017) Polandrsquos Attractiveness Survey
eycomattractiveness
Mature leader of the CEE region | EYrsquos Attractiveness Survey Poland 15
Looking ahead 48 of foreign investors expect Polandrsquos attractiveness to improve over the next three years That share is only lower than the respective proportion for top performers Portugal and Netherlands while it exceeds the results obtained for other European countries analysed14
Investorsrsquo expectations regarding Polandrsquos attractiveness turn out to be very polarized While the share of respondents projecting improvement in Polandrsquos attractiveness over the next three years
14 Germany Italy UK France Belgium
is high it is accompanied by a relatively large proportion (20) of investors indicating that it will deteriorate
Irrespective of discrepancies between different groups of foreign investors one should note that expectations of every group considered point to a significant improvement of the investment attractiveness of the Polish economy over the next three years relative to their assessment of the previous year
Mature leader of the CEE region | EYrsquos Attractiveness Survey Poland 15
16 Mature leader of the CEE region | EYrsquos Attractiveness Survey Poland
Figure 10 From the point of view of your company Poland is very fairly little or not at all attractive as a foreign direct investment destination
Source EY (2017) Polandrsquos Attractiveness Survey
Polandrsquos key assetshellip not always recognized
When considering Poland as a potential investment destination foreign investors appreciate in particular the structural advantages of the labour market in Poland Over 70 of surveyed companiesrsquo representatives indicate that Polandrsquos labour skills level the potential for productivity increase and labour costs are very or fairly attractive The same factors are also most frequently listed as Polandrsquos key assets in comparison to other European countries
Foreign companies established in Poland distinguish Polish workersrsquo skills level and the potential for productivity increase as attractive much more frequently than companies not present in Poland indicating these two factors in 94 and 87 of cases respectively
Polandrsquos key assetshellip not always recognized
very attractive + fairly attractive
81
78
74
72
68
65
58
Both the companies which operate in Poland and the firms which have not yet established their presence in the country agree that labour costs are one of Polandrsquos major assets when compared to other European countries However we identified large discrepancies between those two types of investors when it comes to their assessment of Polish labour force skills level and the potential for productivity increase Foreign companies already operating in Poland consider those factors as key assets of Poland relative to other European countries However these advantages are much less frequently recognized by companies which do not function in Poland It may signal the need to put more emphasis on the communication of the strengths outlined above to the companies not yet established in Poland
That need seems to be further reinforced by the findings of EY European Attractiveness Survey indicating that labour skills are among the assets most valued by foreign investors CEE advantages related to low labour costs are depleting Tightening labour markets push international investors to alternative destinations In particular an increasing number of investors chasing their ideal skills and wages combinations have looked south to non-EU members such as Serbia As a consequence competition for foreign investment based on labour costs is becoming tighter and CEE countries must look for new advantages
eycomattractiveness
Mature leader of the CEE region | EYrsquos Attractiveness Survey Poland 17
Figure 11 What are the three key assets of Poland compared to other European Countries
Source EY (2017) Polandrsquos Attractiveness Survey
When asked about the key risks for Poland foreign investors most frequently point to unstable social and regulatory business environment as well as restrictive approach applied by tax authorities Again we find significant discrepancies between different types of investors The risk factors outlined above are much more frequently indicated by the representatives of companies established in Poland than by those that do not operate in the country
Figure 12 According to you what are the three key risks for Poland
Source EY (2017) Polandrsquos Attractiveness Survey
18 Mature leader of the CEE region | EYrsquos Attractiveness Survey Poland
Although the largest share of new investment projects planned in Poland come from the manufacturing sectors foreign investors indicate that the most prospective sectors which could drive Polandrsquos growth in the coming years are professional services including IT services BPO15 shared services as well as logistics Most attractive sectors related to manufacturing automotive industry and consumer goods are the fifth and seventh most frequently selected sectors respectively
Figure 13 In your opinion which business sectors will drive Polandrsquos growth in the coming years (three answers possible)
Source EY (2017) Polandrsquos Attractiveness Survey
15 Business Process Outsourcing including services such as finance accounting human resources contact center
Polandrsquos key assets hellip not always recognizedPolandrsquos key assetshellip not always recognized
eycomattractiveness
Mature leader of the CEE region | EYrsquos Attractiveness Survey Poland 19
The Czech Republic emerges as Polandrsquos main competitor for FDIs
Traditionally Central and Eastern European countries have been competing with Poland for foreign investment The results of the Polandrsquos Attractiveness Survey confirm this common knowledge additionally listing Germany among Polandrsquos main competitors
While the position of the Czech Republic as Polandrsquos main competitor for FDIs may not be that surprising the margin by which it has been ranked ahead of other countries is striking 44 of the surveyed foreign investors indicate the Czech Republic as Polandrsquos main competitor followed by Hungary (15) Germany (15) Romania (13) and Slovakia (10)
The position of the Czech Republic as that of Polandrsquos main competitor for FDIs is shared by every group of investors considered16 Still a higher share of companies established in Poland (50) is of such an opinion than in the case of enterprises not present in Poland (35) Significant differences between these types of investors have also been identified in their perception of Slovakia (15 and 3 respectively) Hungary in turn is indicated as Polandrsquos main competitor more frequently by investors from the USA (28) than by investors from Western Europe (7)
16 Investors were broken down by their establishednot established status region of origin size of their company and sector of their activity In every of the categories considered the Czech Republic was most frequently indicated as Polandrsquos main competitor
Map 1 In your opinion which is Polandrsquos main European competing country in terms of attractiveness
Source EY (2017) Polandrsquos Attractiveness Survey
20 Mature leader of the CEE region | EYrsquos Attractiveness Survey Poland
Methodology
European Attractiveness Survey
The ldquorealrdquo attractiveness of Europe for foreign investors
Our evaluation of the reality of FDI in Europe is based on the EY European Investment Monitor (EIM) EYrsquos proprietary database produced in collaboration with Oxford Intelligence This database tracks those FDI projects that result in the creation of new facilities and new jobs By excluding portfolio investments and MampA it shows the reality of investment in manufacturing and services by foreign companies across the continent
The EIM database focuses on investment announcements the number of new jobs created and where identifiable the associated capital investment Projects are identified through the daily monitoring of more than 10000 news sources To confirm the accuracy of the data collected the research team aims to directly contact more than 70 of the companies undertaking these investments
The following categories of investment projects are excluded from the EIM
bull MampA and joint ventures (unless these result in new facilities or new jobs being created)
bull License agreements
bull Retail and leisure facilities hotels and real estate
bull Utilities (including telecommunications networks airports ports and other fixed infrastructure)
bull Extraction activities (ores minerals and fuels)
bull Portfolio investments (pensions insurance and financial funds)
bull Factory and other production replacement investments (eg replacing old machinery without creating new employment)
bull Not-for-profit organizations (charitable foundations trade associations and government bodies)
The ldquoperceivedrdquo attractiveness of Europe and its competitors for foreign investors
We define the attractiveness of a country or area as the combination of its image investorsrsquo level of confidence in it as an investment destination and the perception of its ability to provide the most competitive benefits for FDI
The research regarding the perceptions of European investment attractiveness was conducted by the CSA Institute in March 2017 via telephone interviews with a representative group of 505 international decision makers
Our sample groups of businesses included representatives from
bull Europe 53
bull North America 29
bull Asia 12
bull Latin America 3
bull Middle East 2
bull Other regions 1
Overall 81 of the 505 companies surveyed have a presence in Europe And of the non-European companies 34 have established operations in Europe
Investment projects by companies in these categories are included in certain instances eg details of a specific new hotel investment or retail outlet would not be recorded but if the hotel or retail company were to establish a headquarters facility or a distribution center this project would qualify for inclusion in the database
Disclaimer FDI jobs data is available for 3596 projects out of 5845 projects (or 61) in 2016
Methodology
eycomattractiveness
Mature leader of the CEE region | EYrsquos Attractiveness Survey Poland 21
Polandrsquos Attractiveness SurveyPolandrsquos Attractiveness Survey was carried out for the first time in 2017 The research consisted of a survey conducted among international investors in which foreign companiesrsquo representatives responded to questions about their plans regarding establishing or expanding their operations in Poland factors shaping Polandrsquos attractiveness as an investment destination and risks that face Poland
The research was conducted by the CSA Institute in March-April 2017 via telephone interviews with a representative group of 208 international decision makers As a whole 58 of the surveyed companies have a presence in Poland
The companyrsquos country of origin in the sample is representative of the investments done in Poland In particular our sample groups of businesses included representatives from
bull Western Europe 48
bull North America 25
bull Asia 19
bull Northern Europe 6
bull Other regions 2
Disclaimer FDI jobs data is available for 140 projects out of 256 projects (or 55) announced in Poland in 2016
Mature leader of the CEE region | EYrsquos Attractiveness Survey Poland 21
EY | Assurance | Tax | Transactions | Advisory
About EY
EY is a global leader in assurance tax transaction and advisory services The insights and quality services we deliver help build trust and confidence in the capital markets and in economies the world over We develop outstanding leaders who team to deliver on our promises to all of our stakeholders In so doing we play a critical role in building a better working world for our people for our clients and for our communities
EY refers to the global organization andor one or more of the member firms of Ernst amp Young Global Limited each of which is a separate legal entity Ernst amp Young Global Limited a UK company limited by guarantee does not provide services to clients
For more information about our organization please visit eycom
copy 2017 EYGM Limited All Rights Reserved
SCORE 00068-162
eycompl

eycomattractiveness
Mature leader of the CEE region | EYrsquos Attractiveness Survey Poland 1
The current pace of technological development and disruption taking place everywhere and in all market segments are re-defining many sectors and industries The New Normal is a state when no one can be assured of its position In such an environment new investments are of essence in order to keep up with trends and competition It refers to companies themselves but also to whole economies
Being ready for a constantly changing and new market situation understand the needs of your clientsrsquo but also your people (not workers) being aware how tastes and expectations of generations vary being ready and adaptable to the requirements of Industry 40 ndash all those challenges are competing to be number 1 on the C-suite agenda In todayrsquos world investing in addressing that kind of issue is a requirement for any future success and will define the shape of the economy to come
At EY we experience this as well and respond accordingly EY Poland invested in our Global Talent Hub we are part of the Startberryreg initiative for start-ups in Warsaw and we are part of Wavespacetrade - our global network of growth and innovation centers to help clients achieve radical breakthroughs We are also transferring our service delivery model in order to adapt to a fast-moving and more digitalized world
Apart from analyzing companiesrsquo challenges and investment needs at EY we also identified factors that play a critical role in foreign investorsrsquo decision to establish or expand their activities in a given country Understanding those factors should be of particular importance for countries with such aspirations as Poland which to achieve its ambitions needs investments Polandrsquos investment needs are reinforced by a very limited space for further employment led-growth due to among others unfavourable demographic developments However its rate of investment (an average of 202 in the 2004-2016 period) has in recent years been well below the levels observed in other CEE economies (246) A significant increase in the level of investment in Poland requires both domestic and foreign capital outlays The latter should preferably take the form of foreign direct
investments (FDI) which not only generate employment but are often associated with technology transfer productivity spillovers transfer and development of skills
There is however strong competition between countries for FDIs Companies select the best locations in which they believe they will be successful ndash which means they will find the right talent and conditions to run business activities Countries and governments do all they can in order to attract investors and win their own rivalry for quality job creators and investors in modern technologies and RampD activities The list of factors that investors pay attention to and so should governments is provided and discussed in annual publications of EY European Attractiveness Survey
According to that survey Poland has for many years been among the top choices for foreign direct investments in Europe and a leader for Central and Eastern Europe In 2016 Poland was ranked 5th (an advance from the 6th position) among European countries in terms of the number of planned projects while the number of announced FDI-related jobs in Poland was the second highest only next to the UK
This year however we wanted to gain a deeper insight into how Poland is positioned and perceived by investors Our aim was especially to understand the assets of Poland that foreign investors value most and the risks (related to their presence on the market) that they point to Which sectors do they focus on And who is considered to be Polandrsquos main competitor for FDIs To answer those questions we have prepared the first edition of Polandrsquos Attractiveness Survey
Our report is based on factual and data analysis as well as on the feedback from investors who have been investing in Poland and other countries Thus we believe that this publication will be helpful for companies and investors in their considerations regarding site selection process and conditions to run business activity We believe the report will also be supportive to administration and other stakeholders in making Poland a valuable and attractive foreign investment destination
Introduction
Jacek KędziorPoland Managing PartnerEY Polska
2 Mature leader of the CEE region | EYrsquos Attractiveness Survey Poland
Introduction
2
3
Top 3 European destination countries by FDI job creation
Top 3 investors
Relative to other European countries the number of FDI-related jobs announced to be created in Poland in 2016 was the second highest 22 074 only next to the UK ndash 43 165 Germany on the 3rd place with 19 961 new jobs The position of Poland in this ranking has been relatively stable (in top 3 countries) since 2004 with only two exceptions in 2009 and 2011 when the country was beyond the podium
21of all projects
18of all projects
9of all projects
USA Germany and United Kingdom are the top three investors ndash 48 of all projects into Poland came from those three countries 64 of all FDI in 2016 came from Western Europe
USA
Germany
UK
1 Number of FDI projects in Europe
Europe CEE Poland
In 2016 the number of FDI projects directed to Europe increased by 15 in comparison to the previous year Overall 5845 new international investment projects were announced
In 2016 Central and Eastern Europe (CEE) maintained its appeal to international investors ndash the region received 23 of all the FDI projects announced FDI in CEE had a strong momentum in 2016
Poland leaped to fifth place in the national ranking attracting 256 projects a hefty 21 increase
256 projects
+15vs 2015
+21vs 2015
+16vs 2015
12vs 2015
2vs 2015
17vs 2015
GermanyPoland
UK
22 074 new jobs
43 165 new jobs
19 961 new jobs
2 Mature leader of the CEE region | EYrsquos Attractiveness Survey Poland
1 342 projects
5 845projects
eycomattractiveness
Mature leader of the CEE region | EYrsquos Attractiveness Survey Poland 3
eycomattractiveness
FDI projects located in Poland fall predominantly into three sectors manufacturing finance amp business services and transport amp communications On average these sectors accounted for 95 of all FDI projects in Poland in 2005-2016 However the share of manufacturing decreased from 81 of all FDI projects in 2005 to 62 in 2016 while finance amp business services attracts more and more projects ndash from 7 to 28 respectively
Poland and its neighbors including the Baltic States are also attracting a third wave of shared service centers (up 83 for CEE in 2016) and other activities supplying services to companies In 2016 Poland garnered 38 out of 161 (or 24) SSC projects announced by international investors ranking first among European countries
Over 70 of surveyed companiesrsquo representatives indicate that Polandrsquos labour skills level potential for productivity increase and labour costs are very or fairly attractive The same factors are also most frequently listed as Polandrsquos key assets in comparison to other European countries
Traditionally Central and Eastern European countries have been competing with Poland for foreign investment The results of the survey confirm this common knowledge additionally enumerating Germany among Polandrsquos main competitors While the position of the Czech Republic as Polandrsquos main competitor for FDIs may not be that surprising the margin by which it has been ranked ahead of other countries is striking The position of the Czech Republic as that of Polandrsquos main competitor for FDIs is shared by every group of investors considered
4
6
7
5
Number of FDI projects in Poland by activity
Polandrsquos key assets
Czech Republic ndash Polandrsquos main competitor for FDIs
FDI projects in shared services centers in Europe
119
Manufacturing
50
Sales ampMarketing
38
Shared ServicesCenters
19
Logistics
19
Research ampDevelopment
Local labourskills level
Potential forproductivity increase
Labour costs
81 78 74
1315
15
4410
Poland
1stin SSC
Mature leader of the CEE region | EYrsquos Attractiveness Survey Poland 3
4 Mature leader of the CEE region | EYrsquos Attractiveness Survey Poland
FDI global inflows
FDI global inflows
In recent years multinational investors activity has remained high Though down 13 yoy in 2016 global foreign direct investment (FDI) inflows1 reached $1525 bn2 (in nominal terms) ndash one of the highest levels recorded over the 2005-2016 period Last year ca frac14 of global FDI inflows came to Europe
One may notice that FDI trend has not been smooth over time In particular in the aftermath of the global financial crisis of 2007-2009 the FDI fell sharply and until now has not yet reached the pre-crisis level (see figure 1) This gap should largely be reduced if United Nations Conference on Trade and Development
1 UNCTAD gathers data for virtually all the countries in the world (ca 200 countries depending on data availability for a given year)
2 Preliminary estimates
(UNCTAD) expectations materialize and FDI flows will increase by 10 in 2017 on accelerating global economic growth and international trade
One of the most important types of activity of international investors are greenfield projects which contribute directly to the creation of new facilities and jobs The annual value of greenfield investment in 2005-2016 averaged about $830 bn3 remaining relatively stable since the global financial crisis One may notice that in contrast to FDI inflows the value of announced greenfield projects increased in 2016
3 Preliminary estimates
Figure 1 Global FDI inflows and the value of announced greenfield FDIs
Source UNCTAD
eycomattractiveness
Mature leader of the CEE region | EYrsquos Attractiveness Survey Poland 5
Investors vote ldquoremainrdquo in Europe
EY European Attractiveness Survey (EAS) examines new investment projects mainly greenfield projects announced by international investors The study is based on interviews with high-level executives from around the world and foreign direct investment announcements by companies The latter part is linked to EY European Investment Monitor (EIM) powered by Oxford Intelligence which is the leading database of direct investment across Europe The database tracks those FDI projects that have resulted in the creation of new facilities and new jobs Therefore portfolio investment joint ventures mergers and acquisitions and other investment that do not entail the creation of new jobs (eg replacing old machinery without creating new employment) are excluded
Despite the uncertainty in 2016 Europe attracted a new record high number of FDI projects
For several years Europe has experienced many challenges (incl uncertainty on the future of the EU and the Eurozone in particular) caused by public debt crisis population aging conflicts in the Middle East and migration inflows into Europe tensions between Russia and Ukraine Brexit and populist parties garnering significant minority support in many European countries Despite such an uncertain
1048666business environment and geopolitical risksinvestors continue to see Europe as an attractive investment destination
In 2016 the number of FDI projects directed to Europe increased by 15 in comparison to the previous year Overall 584510486661048666 new internationalinvestment projects were announced According to information gathered for 62 of these announcements the projects located in Europe should create at least 260 thousand10486661048666 new job1048666s4 The majority of FDI in Europe arises from intra-European FDI flows
In 2016 Central and Eastern Europe (CEE)5 maintained its appeal to international investors - the region received 23 of all the FDI projects announced in Europe and 52 in terms of the announced new jobs
4 Information on the number of new jobs is not available for all of the announced investment projects As such the number of new jobs given above constitutes the lower bound of the actual number of new employment related to FDI projects announced in Europe Any conclusions based on the number of planned jobs must also be drawn with caution
5 Central and Eastern Europe encompasses 22 countries Albania Belarus Bosnia and Herzegovina Bulgaria Croatia Cyprus Czech Republic Estonia Hungary Latvia Lithuania Macedonia Moldova Montenegro Poland Romania Russia Serbia Slovakia Slovenia Turkey and Ukraine
Mature leader of the CEE region | EYrsquos Attractiveness Survey Poland 5
6 Mature leader of the CEE region | EYrsquos Attractiveness Survey Poland
Figure 2 Number of FDI projects announced in Europe
Source EY (2017) European Investment Monitor
Europersquos perception in the eyes of international investors is improving Western Europe and CEE are among the worldrsquos top 3 most attractive regions for 53 and 37 of executives respectively This makes Western Europe the top performer while CEE ranks third behind Northern America and level-pegging with China While Western Europe gained 3 pp
compared to 2015 CEE improved by as many as 9 pp That was the biggest increase among all the regions considered in 2016 Interestingly since 2013 the perception of Western Europe and CEE among investors has significantly improved while the attractiveness of BRICS has faded
Figure 3 Perception of most attractive global regions6
Source EY (2017) European Attractiveness Survey
6 Answer to the question ldquoIn general which of the following regions do you think are currently the top 3 most attractive regions in which to establish operationsrdquo (3 answers possible)
Investors vote ldquoremainrdquo in Europe
eycomattractiveness
Mature leader of the CEE region | EYrsquos Attractiveness Survey Poland 7
Europersquos return to steady economic growth deferred
Despite positive developments in terms of the number of announced investment projects and improving perceptions of Europersquos attractiveness investors seem to see the prospect of strong European economic growth receding further into the future In 2015 53 respondents expected Europe to return to steady economic growth within the next three years In 2017 that proportion is down to 42 At the same time the proportion expecting a return to steady economic growth after at least five years increased to 56 (from 45 in 2015)
Also the share of international investors confident that Europe will ever return to stable economic growth decreased from 85 in 2015 to 65 in 2017
The British votersrsquo decision to leave the EU has contributed to investorsrsquo doubts regarding the future economic growth in Europe 20 of international investors declare to have plans to relocate operations if Britain leaves the European single market But many companies do not yet have a comprehensive view of the tax (VAT pre-financing and the exact scope of custom duty) administrative (customs and VAT requirements) and regulatory consequences and have only just started thinking about the possible consequences The impact of Britainrsquos planned exit from the European Union will probably be more visible in next yearrsquos survey
Figure 4 In your view given the current uncertainties in Europe how long before we see a return to steady economic growth and performance in Europe
Source EY (2017) European Attractiveness Survey Sample 332 respondents confident in Europersquos ability to return to a more dynamic economic growth
8 Mature leader of the CEE region | EYrsquos Attractiveness Survey Poland
Poland does need FDIs
Foreign companies play an important role in the Polish economy They contribute a lot to employment wage fund generated value added investments exports and general government revenues Companies with a majority share of foreign capital have in recent years often outperformed Polish public and private business entities thereby being an important driver of the economic growth In particular foreign companies accounted for a vast majority of employment growth in the enterprise
sector in Poland over the 2010-2015 period In 2016 at the time of economic slowdown foreign companies accelerated the growth of generated value added exports and employment significantly alleviating the adverse impact of other factors on the Polish economy Importantly in contrast to Polish private and public companies foreign entities continued to expand their investment activity in 2016 though at a lower rate than in 2015
Figure 5 Gross fixed capital formation in the enterprise sector in Poland by ownership7
Source EY based on Central Statistical Office data
7 Data for 2011-2015 refers to annual growth in gross fixed capital formation (GFCF) of small (10-49 employed persons) medium (49-249 employed persons) and large (over 249 employed persons) enterprises while data for 2016 compares GFCF of medium and large enterprises to their GFCF in 2015 Data excludes information for most companies with unlimited ownerrsquos liability
8 Companies (1) in which at least part of the capital share belongs to the public sector (2) state-owned enterprises or (3) entities without specific legal status (eg some state-owned entities)
9 Companies whose capital is predominantly owned by foreigners (gt50 of shares) and (2) branches of foreign enterprises10 Companies that were defined neither as ldquoforeign companiesrdquo nor as ldquoPolish public sector companiesrdquo
Poland does need FDIs
Polish public sector companies8
Polish private companies10
Foreign companies9
eycomattractiveness
Mature leader of the CEE region | EYrsquos Attractiveness Survey Poland 9
Poland was the only EU country that avoided recession during the global financial crisis in 2007-2009 In terms of cumulative GDP growth in 2008-2016 amounting to 324 Poland ranked 3rd among EU Member States The outstanding performance of the Polish economy has increased its attractiveness as an investment destination
Figure 6 Number of FDI projects and jobs announced in Poland
Source EY (2017) European Investment Monitor Note that the number of new jobs is available only for a certain part of announced investment projects In 2016 55 of announced projects were accompanied by information on planned employment This proportion might change from year to year Hence conclusions from the changes in announced number of FDI related jobs must be drawn with caution
To continue the catching-up process with more developed economies Poland requires a high rate of investment Investment needs are additionally reinforced by a very limited room for further employment led-growth due to among others unfavourable demographic developments However in the last decade the rate of investment in Poland was below the EU average and far below the levels observed in other CEE countries The key problem is a very low level of private investment in Poland Importantly for the majority of the last decade the
savings rate in Poland has been even lower than the investment rate This constitutes another challenge that should be addressed by the Polish government
The factors outlined above indicate that the Polish economy does need foreign capital inflows preferably in the form of direct investment leading to generating a significant value added This emphasizes the importance of Polandrsquos investment attractiveness and paying attention to factors influencing foreign investorsrsquo decisions
To continue the catching-up process with more developed economies Poland needs to increase its rate of investment which over the last decade has been
well below the level recorded for the majority of CEE countries Despite a low investment rate for the majority of that period the savings rate was even lower though in recent years it has improved somewhat Foreign capital is thus required to finance our countryrsquos investment needs Of particular importance should be foreign direct investments (FDIs) which have greatly contributed to the internationalization of Polish companies and their integration into global value chains since the 1990s Empirical evidence shows that this process
has been associated with an increase in exports transfer of skills and know-how and higher productivity of companies which on average invest more per employee and pay higher wages than non-internationalised enterprises Importantly other domestic firms also benefit from the activity of companies that are exposed to foreign markets which confirms the existence of significant spillover effects To understand the importance of the internationalization of Polish companies one should note that in 2000 ca 20 of value added generated in Poland was driven by external demand but this proportion increased to ca 35 in 2016 The message is even stronger if we realize that majority () of economic growth in Poland in this century has been driven by foreign demand The activity of foreign companies can also alleviate the consequences of economic slowdown For example in 2016 ndash the year
of significant investment contraction by the public and Polish private companies foreign companies continued to increase their capital outlays in Poland Benefits of FDIs make them much needed by countries particularly by catching-up economies which results in harsh competition for FDI inflows EY Polandrsquos Attractiveness Survey should help us to understand which assets foreign investors value most and what are their main concerns Reinforcing strengths and addressing weaknesses of the Polish economy would improve its perception which is one of the preconditions for winning valuable greenfield investment and thereby improving Polandrsquos long-term economic potential
Marek Rozkrut EY Poland Chief Economist Head of Economic Analysis Team
EY Viewpoint
10 Mature leader of the CEE region | EYrsquos Attractiveness Survey Poland
Poland is one of the most attractive destinations in Europe for foreign direct investors
The findings of the EY European Attractiveness Survey indicate that when approximated by the number of announced investment projects Poland seems to be one of the most attractive locations in Europe for foreign direct investors In 2016 international investors announced their intentions to carry out 256 investment projects in Poland compared to 211 projects in 2015 This ranked Poland 5th among European countries in terms of the number of planned projects ndash achieving an
advance from the 6th position (ex aequo with Belgium) in 2015 and the best result since 2008 when Poland also ranked 5th Naturally the number of planned investment projects depends on the local market capacity in particular the availability of labour11 However the fact that Poland regularly stays ahead of economies such as Russia and Turkey in terms of international investment projects proves that Polandrsquos appeal to foreign investors is high
11 It is thus no surprise that Poland ranks higher than smaller economies in the CEE region
Poland is one of the most attractive destinations in Europe for foreign direct investors
Source EY European Investment Monitor (EIM) 2017
2015 2016Percentage Change
(2016 vs 2015
United Kingdom 1065 1144 7
Germany 945 1063 12
France 598 779 30
Spain 248 308 24
Poland 211 256 21
Netherlands 219 207 -5
Russia 201 205 2
Belgium 211 200 -5
Ireland 127 141 11
Turkey 134 138 3
Finland 105 133 27
Romania 98 132 35
Czech Republic 70 110 57
Hungary 94 107 14
Sweden 51 90 76
Italy 55 89 62
Switzerland 90 88 -2
Denmark 63 72 14
Slovakia 54 70 30
Portugal 47 59 26Others 396 454 15Total 5083 5845 15
2015 2016Percentage Change
(2016 vs 2015
United Kingdom 42336 43165 2
Poland 19651 22074 12
Germany 17126 19961 17
Romania 12746 17545 38
France 13639 16980 24
Serbia 10631 16396 54
Russia 13672 15064 10
Czech Republic 9332 14292 53
Spain 7126 12969 82
Hungary 11741 12450 6
Ireland 10772 8535 -21
Slovakia 9564 8308 -13
Turkey 2971 7179 142
Austria 1357 4759 251
Ukraine 850 4547 435
Bulgaria 3598 3959 10
Switzerland 1391 3416 146
Belgium 3168 3309 4
Moldova 1000 3200 220
Italy 1383 2654 92
Others 23612 18911 -20Total 217666 259673 19
Top 20 destination countries by FDI projects Top 20 destination countries by FDI job creation
eycomattractiveness
Mature leader of the CEE region | EYrsquos Attractiveness Survey Poland 11
In 2016 the growth rate of the number of FDI projects located in Poland was higher than in Europe as a whole As a consequence in 2016 Poland was the location of 44 of all FDI projects announced in Europe which indicates the third consecutive year of increase in Polandrsquos share in the total number of foreign projects in Europe
Figure 7 Share of FDI projects in Poland in total FDI projects in Europe
Source EY (2017) European Investment Monitor
Based on data available for 55 of projects international investors planned to create at least 22 thousand new jobs in Poland While the exact counting of jobs is challenging (and the job data coverage is not complete) the increase in announced new jobs by foreign investors in Poland between 2011 and 2016 (over a twofold increase) provides additional evidence that the trend in international investorsrsquo activity in Poland continues to be positive
Relative to other European countries the number of FDI-related jobs announced to be created in Poland in 2016 was the second highest only next to the UK The position of Poland in this ranking has been relatively stable (among top 3 countries) since 2004 with only two exceptions in 2009 and 2011 when the country was beyond the podium
Poland is amongst the top 5 locations in Europe for FDI ndash that is quite an achievement It confirms the prediction of the last survey when investors indicated
that Poland would be the best place to invest just after Germany UK France and the Netherlands It is really promising since the perception has not always been supported by the figures and real investment projectsAt the same time there is a global rivalry and competition for innovative growth We do not measure it yet but in order to be ready for sustainable growth Polish economy needs to have the ability to interact with newest trends like Industry 40 Technological changes will decrease the weight of labor costs in the
site selection processes allowing some comebacks of production to the more expensive locationsWe observe it in a number of areas and Poland is getting ready for this Changes in the law regarding support for innovation enhanced RampD tax relief new support schemes for investments and comprehensive environment for start-ups are all good tools which should attract investors bringing more value added projects to the Polish economy There are many good examples of such projects in manufacturing automotive SSCBPO centers but constant change and benchmarking against other locations is requiredIt all derives from a great desire for growth and belief that FDI contributes to the development of societies and countries In this context Polandrsquos position as a CEE leader is worth underlining since the CEE region itself has improved a lot (+9 pp
vs last year) and regained third position among all regions worldwide ndash just behind Western Europe and North America One needs to remember that it all happens when investors say that only 28 of them are having plans to establish or expand operations in Europe next year It is a fall by 10 pp from 2013Global FDI inflows were down by 13 in 2016 compared to 2015 which means that competition for new projects will not be easier A constantly changing environment supported by technological revolution is creating an environment in which policy makers need to anticipate investorsrsquo expectations and propose solutions in a real time From this perspective challenges of the business and governments are becoming closer than ever
Paweł Tynel EY Poland Head of Grants and Incentives Advisory Services
EY Viewpoint
12 Mature leader of the CEE region | EYrsquos Attractiveness Survey Poland
FDI projects located in Poland fall predominantly into three sectors manufacturing finance amp business services and transport amp communications On average these sectors accounted for 95 of all FDI projects in Poland in 2005-2016 However the share of manufacturing decreased from 81 of all FDI projects in 2005 to 62 in 2016 while finance amp
business services attracts more and more projects ndash from 7 to 28 respectively The share of transport amp communications ranged between 3 and 10 in 2005-2016 Other sectors12 were of rather negligible interest to foreign investors
12 ie agriculture construction education amp health energy recreation retail amp hospitality
Poland attracts investors mainly from Western Europe and the USA
Poland attracts FDI projects mainly from Western Europe and the USA In 2005-2016 on average over 80 of all FDI projects came from these two regions While the importance of Western Europe for FDI in Poland increased in 2016 the share of the USA in total FDI projects launched in Poland fell However there are no clear trends in the origin structure of foreign investors in Poland
Figure 8 Share of FDI projects in Poland by region of origin
Source EY (2017) European Investment Monitor
Table 1 Number of FDI projects in Poland by sectors
2005 2006 2007 2008 2009 2010 2011 2012 2013 2014 2015 2016
Manufacturing 145 106 95 105 72 96 89 89 70 87 117 159
Finance amp Business Services 12 27 31 47 19 35 23 39 27 32 64 72
Transport amp Communications 15 15 11 15 5 8 7 12 4 4 22 15
Retail amp Hospitality 7 5 1 4 3 1 2 4 3 4 7
Construction 3 1 1 1 1 2
Other 1 1 4 7 1 1 3 5 1 6 4 1
Source EY (2017) European Investment Monitor
Poland attracts investors mainly from Western Europe and the USA
eycomattractiveness
Mature leader of the CEE region | EYrsquos Attractiveness Survey Poland 13
The decomposition of international investment projects by activity provides additional insights It reveals that while projects related to manufacturing clearly dominate the structure of foreign investment Poland is becoming a more and more attractive location for support and shared services centers (SSC) to large multinational companies (eg accounting or IT) Indeed in 2016 Poland garnered 38 out of 161 (or 24) SSC projects announced by international investors ranking first among European countries
The activity structure of investment projects announced in Poland is similar to that in the CEE region Two notable exceptions are manufacturing which captures somewhat larger part of investment projects in the CEE (564) than in Poland (465) and shared services centers which in turn attracts a significantly higher proportion of FDI in Poland (145) than in CEE as a whole (56) At the same time there are substantial discrepancies between the activity structure of projects announced in Poland and in Europe as a whole In particular investment
projects announced in Europe concentrated in sales and marketing (459 of all projects) while attracting only 195 projects in Poland By contrast manufacturing projects represented only 263 of the total number of projects in Europe which is much below 465 recorded in Poland
Differences in the sectorial structure of new projects between Poland and Europe as a whole are also reflected in labour-intensity of greenfield FDIs The number of jobs per project in Poland in 2016 (158) was over twice as high as in Europe (72)13 In other words Poland is a host to more labour intensive projects than on average Europe However one may notice that the above ratio in Poland has been in a declining trend suggesting that foreign investment in Poland become more and more capital intensive In addition the number of jobs per project in Poland is lower than the average for the CEE region (189)
13 Only the projects for which data on announced new jobs was available were taken into account in the calculation
Table 2 Number of FDI projects in Poland by activity
2005 2006 2007 2008 2009 2010 2011 2012 2013 2014 2015 2016
Manufacturing 123 79 71 82 59 70 70 65 56 74 86 119
Sales amp Marketing 15 33 41 47 21 29 25 48 18 30 65 50
Shared Services Centre 7 11 5 9 3 7 8 10 5 8 16 38
Logistics 18 14 10 14 8 7 6 7 10 8 20 19
Research amp Development 8 5 10 12 5 12 7 11 12 6 17 19
Headquarters 1 2 2 2 1 1 4
Contact Centre 4 3 3 3 3 1 4 2 4 4 3
Testing amp Servicing 5 7 4 9 1 13 6 3 2 1 2 2
Other 0 0 1 1 0 0 0 0 1 0 1 2
Source EY (2017) European Investment Monitor
14 Mature leader of the CEE region | EYrsquos Attractiveness Survey Poland
Polandrsquos Attractiveness Survey indicating improvement in foreign investment prospects
In 2017 EY for the first time conducted a deepened survey among international investors in order to gain additional insights into their motivations behind establishing operations in Poland As part of Polandrsquos Attractiveness Survey foreign companies both present and non-established in Poland responded to questions regarding their investment plans factors affecting their investment decisions and risks facing Poland
According to the surveyed companies Polandrsquos attractiveness as an investment destination improved slightly in 2016 ndash 29 of respondents indicated that it had improved while 24 of companies claimed that it had deteriorated last year
One may note large differences in the assessment of Polandrsquos attractiveness between representatives of companies which operate in Poland and companies not established in the country In the eyes of the latter the evolution of Polandrsquos attractiveness as an investment destination was better than in the opinion of the former Only 7 of companies which do not conduct operations in Poland indicated that its attractiveness had deteriorated while 32 claimed that it had improved compared to 37 and 26 respectively in the case of companies functioning in Poland
Polandrsquos Attractiveness Survey indicating improvement in foreign investment prospects
Figure 9 To what degree do you think Polandrsquos attractiveness evolved over the last yearwill evolve over the next three years
Source EY (2017) Polandrsquos Attractiveness Survey
eycomattractiveness
Mature leader of the CEE region | EYrsquos Attractiveness Survey Poland 15
Looking ahead 48 of foreign investors expect Polandrsquos attractiveness to improve over the next three years That share is only lower than the respective proportion for top performers Portugal and Netherlands while it exceeds the results obtained for other European countries analysed14
Investorsrsquo expectations regarding Polandrsquos attractiveness turn out to be very polarized While the share of respondents projecting improvement in Polandrsquos attractiveness over the next three years
14 Germany Italy UK France Belgium
is high it is accompanied by a relatively large proportion (20) of investors indicating that it will deteriorate
Irrespective of discrepancies between different groups of foreign investors one should note that expectations of every group considered point to a significant improvement of the investment attractiveness of the Polish economy over the next three years relative to their assessment of the previous year
Mature leader of the CEE region | EYrsquos Attractiveness Survey Poland 15
16 Mature leader of the CEE region | EYrsquos Attractiveness Survey Poland
Figure 10 From the point of view of your company Poland is very fairly little or not at all attractive as a foreign direct investment destination
Source EY (2017) Polandrsquos Attractiveness Survey
Polandrsquos key assetshellip not always recognized
When considering Poland as a potential investment destination foreign investors appreciate in particular the structural advantages of the labour market in Poland Over 70 of surveyed companiesrsquo representatives indicate that Polandrsquos labour skills level the potential for productivity increase and labour costs are very or fairly attractive The same factors are also most frequently listed as Polandrsquos key assets in comparison to other European countries
Foreign companies established in Poland distinguish Polish workersrsquo skills level and the potential for productivity increase as attractive much more frequently than companies not present in Poland indicating these two factors in 94 and 87 of cases respectively
Polandrsquos key assetshellip not always recognized
very attractive + fairly attractive
81
78
74
72
68
65
58
Both the companies which operate in Poland and the firms which have not yet established their presence in the country agree that labour costs are one of Polandrsquos major assets when compared to other European countries However we identified large discrepancies between those two types of investors when it comes to their assessment of Polish labour force skills level and the potential for productivity increase Foreign companies already operating in Poland consider those factors as key assets of Poland relative to other European countries However these advantages are much less frequently recognized by companies which do not function in Poland It may signal the need to put more emphasis on the communication of the strengths outlined above to the companies not yet established in Poland
That need seems to be further reinforced by the findings of EY European Attractiveness Survey indicating that labour skills are among the assets most valued by foreign investors CEE advantages related to low labour costs are depleting Tightening labour markets push international investors to alternative destinations In particular an increasing number of investors chasing their ideal skills and wages combinations have looked south to non-EU members such as Serbia As a consequence competition for foreign investment based on labour costs is becoming tighter and CEE countries must look for new advantages
eycomattractiveness
Mature leader of the CEE region | EYrsquos Attractiveness Survey Poland 17
Figure 11 What are the three key assets of Poland compared to other European Countries
Source EY (2017) Polandrsquos Attractiveness Survey
When asked about the key risks for Poland foreign investors most frequently point to unstable social and regulatory business environment as well as restrictive approach applied by tax authorities Again we find significant discrepancies between different types of investors The risk factors outlined above are much more frequently indicated by the representatives of companies established in Poland than by those that do not operate in the country
Figure 12 According to you what are the three key risks for Poland
Source EY (2017) Polandrsquos Attractiveness Survey
18 Mature leader of the CEE region | EYrsquos Attractiveness Survey Poland
Although the largest share of new investment projects planned in Poland come from the manufacturing sectors foreign investors indicate that the most prospective sectors which could drive Polandrsquos growth in the coming years are professional services including IT services BPO15 shared services as well as logistics Most attractive sectors related to manufacturing automotive industry and consumer goods are the fifth and seventh most frequently selected sectors respectively
Figure 13 In your opinion which business sectors will drive Polandrsquos growth in the coming years (three answers possible)
Source EY (2017) Polandrsquos Attractiveness Survey
15 Business Process Outsourcing including services such as finance accounting human resources contact center
Polandrsquos key assets hellip not always recognizedPolandrsquos key assetshellip not always recognized
eycomattractiveness
Mature leader of the CEE region | EYrsquos Attractiveness Survey Poland 19
The Czech Republic emerges as Polandrsquos main competitor for FDIs
Traditionally Central and Eastern European countries have been competing with Poland for foreign investment The results of the Polandrsquos Attractiveness Survey confirm this common knowledge additionally listing Germany among Polandrsquos main competitors
While the position of the Czech Republic as Polandrsquos main competitor for FDIs may not be that surprising the margin by which it has been ranked ahead of other countries is striking 44 of the surveyed foreign investors indicate the Czech Republic as Polandrsquos main competitor followed by Hungary (15) Germany (15) Romania (13) and Slovakia (10)
The position of the Czech Republic as that of Polandrsquos main competitor for FDIs is shared by every group of investors considered16 Still a higher share of companies established in Poland (50) is of such an opinion than in the case of enterprises not present in Poland (35) Significant differences between these types of investors have also been identified in their perception of Slovakia (15 and 3 respectively) Hungary in turn is indicated as Polandrsquos main competitor more frequently by investors from the USA (28) than by investors from Western Europe (7)
16 Investors were broken down by their establishednot established status region of origin size of their company and sector of their activity In every of the categories considered the Czech Republic was most frequently indicated as Polandrsquos main competitor
Map 1 In your opinion which is Polandrsquos main European competing country in terms of attractiveness
Source EY (2017) Polandrsquos Attractiveness Survey
20 Mature leader of the CEE region | EYrsquos Attractiveness Survey Poland
Methodology
European Attractiveness Survey
The ldquorealrdquo attractiveness of Europe for foreign investors
Our evaluation of the reality of FDI in Europe is based on the EY European Investment Monitor (EIM) EYrsquos proprietary database produced in collaboration with Oxford Intelligence This database tracks those FDI projects that result in the creation of new facilities and new jobs By excluding portfolio investments and MampA it shows the reality of investment in manufacturing and services by foreign companies across the continent
The EIM database focuses on investment announcements the number of new jobs created and where identifiable the associated capital investment Projects are identified through the daily monitoring of more than 10000 news sources To confirm the accuracy of the data collected the research team aims to directly contact more than 70 of the companies undertaking these investments
The following categories of investment projects are excluded from the EIM
bull MampA and joint ventures (unless these result in new facilities or new jobs being created)
bull License agreements
bull Retail and leisure facilities hotels and real estate
bull Utilities (including telecommunications networks airports ports and other fixed infrastructure)
bull Extraction activities (ores minerals and fuels)
bull Portfolio investments (pensions insurance and financial funds)
bull Factory and other production replacement investments (eg replacing old machinery without creating new employment)
bull Not-for-profit organizations (charitable foundations trade associations and government bodies)
The ldquoperceivedrdquo attractiveness of Europe and its competitors for foreign investors
We define the attractiveness of a country or area as the combination of its image investorsrsquo level of confidence in it as an investment destination and the perception of its ability to provide the most competitive benefits for FDI
The research regarding the perceptions of European investment attractiveness was conducted by the CSA Institute in March 2017 via telephone interviews with a representative group of 505 international decision makers
Our sample groups of businesses included representatives from
bull Europe 53
bull North America 29
bull Asia 12
bull Latin America 3
bull Middle East 2
bull Other regions 1
Overall 81 of the 505 companies surveyed have a presence in Europe And of the non-European companies 34 have established operations in Europe
Investment projects by companies in these categories are included in certain instances eg details of a specific new hotel investment or retail outlet would not be recorded but if the hotel or retail company were to establish a headquarters facility or a distribution center this project would qualify for inclusion in the database
Disclaimer FDI jobs data is available for 3596 projects out of 5845 projects (or 61) in 2016
Methodology
eycomattractiveness
Mature leader of the CEE region | EYrsquos Attractiveness Survey Poland 21
Polandrsquos Attractiveness SurveyPolandrsquos Attractiveness Survey was carried out for the first time in 2017 The research consisted of a survey conducted among international investors in which foreign companiesrsquo representatives responded to questions about their plans regarding establishing or expanding their operations in Poland factors shaping Polandrsquos attractiveness as an investment destination and risks that face Poland
The research was conducted by the CSA Institute in March-April 2017 via telephone interviews with a representative group of 208 international decision makers As a whole 58 of the surveyed companies have a presence in Poland
The companyrsquos country of origin in the sample is representative of the investments done in Poland In particular our sample groups of businesses included representatives from
bull Western Europe 48
bull North America 25
bull Asia 19
bull Northern Europe 6
bull Other regions 2
Disclaimer FDI jobs data is available for 140 projects out of 256 projects (or 55) announced in Poland in 2016
Mature leader of the CEE region | EYrsquos Attractiveness Survey Poland 21
EY | Assurance | Tax | Transactions | Advisory
About EY
EY is a global leader in assurance tax transaction and advisory services The insights and quality services we deliver help build trust and confidence in the capital markets and in economies the world over We develop outstanding leaders who team to deliver on our promises to all of our stakeholders In so doing we play a critical role in building a better working world for our people for our clients and for our communities
EY refers to the global organization andor one or more of the member firms of Ernst amp Young Global Limited each of which is a separate legal entity Ernst amp Young Global Limited a UK company limited by guarantee does not provide services to clients
For more information about our organization please visit eycom
copy 2017 EYGM Limited All Rights Reserved
SCORE 00068-162
eycompl

2 Mature leader of the CEE region | EYrsquos Attractiveness Survey Poland
Introduction
2
3
Top 3 European destination countries by FDI job creation
Top 3 investors
Relative to other European countries the number of FDI-related jobs announced to be created in Poland in 2016 was the second highest 22 074 only next to the UK ndash 43 165 Germany on the 3rd place with 19 961 new jobs The position of Poland in this ranking has been relatively stable (in top 3 countries) since 2004 with only two exceptions in 2009 and 2011 when the country was beyond the podium
21of all projects
18of all projects
9of all projects
USA Germany and United Kingdom are the top three investors ndash 48 of all projects into Poland came from those three countries 64 of all FDI in 2016 came from Western Europe
USA
Germany
UK
1 Number of FDI projects in Europe
Europe CEE Poland
In 2016 the number of FDI projects directed to Europe increased by 15 in comparison to the previous year Overall 5845 new international investment projects were announced
In 2016 Central and Eastern Europe (CEE) maintained its appeal to international investors ndash the region received 23 of all the FDI projects announced FDI in CEE had a strong momentum in 2016
Poland leaped to fifth place in the national ranking attracting 256 projects a hefty 21 increase
256 projects
+15vs 2015
+21vs 2015
+16vs 2015
12vs 2015
2vs 2015
17vs 2015
GermanyPoland
UK
22 074 new jobs
43 165 new jobs
19 961 new jobs
2 Mature leader of the CEE region | EYrsquos Attractiveness Survey Poland
1 342 projects
5 845projects
eycomattractiveness
Mature leader of the CEE region | EYrsquos Attractiveness Survey Poland 3
eycomattractiveness
FDI projects located in Poland fall predominantly into three sectors manufacturing finance amp business services and transport amp communications On average these sectors accounted for 95 of all FDI projects in Poland in 2005-2016 However the share of manufacturing decreased from 81 of all FDI projects in 2005 to 62 in 2016 while finance amp business services attracts more and more projects ndash from 7 to 28 respectively
Poland and its neighbors including the Baltic States are also attracting a third wave of shared service centers (up 83 for CEE in 2016) and other activities supplying services to companies In 2016 Poland garnered 38 out of 161 (or 24) SSC projects announced by international investors ranking first among European countries
Over 70 of surveyed companiesrsquo representatives indicate that Polandrsquos labour skills level potential for productivity increase and labour costs are very or fairly attractive The same factors are also most frequently listed as Polandrsquos key assets in comparison to other European countries
Traditionally Central and Eastern European countries have been competing with Poland for foreign investment The results of the survey confirm this common knowledge additionally enumerating Germany among Polandrsquos main competitors While the position of the Czech Republic as Polandrsquos main competitor for FDIs may not be that surprising the margin by which it has been ranked ahead of other countries is striking The position of the Czech Republic as that of Polandrsquos main competitor for FDIs is shared by every group of investors considered
4
6
7
5
Number of FDI projects in Poland by activity
Polandrsquos key assets
Czech Republic ndash Polandrsquos main competitor for FDIs
FDI projects in shared services centers in Europe
119
Manufacturing
50
Sales ampMarketing
38
Shared ServicesCenters
19
Logistics
19
Research ampDevelopment
Local labourskills level
Potential forproductivity increase
Labour costs
81 78 74
1315
15
4410
Poland
1stin SSC
Mature leader of the CEE region | EYrsquos Attractiveness Survey Poland 3
4 Mature leader of the CEE region | EYrsquos Attractiveness Survey Poland
FDI global inflows
FDI global inflows
In recent years multinational investors activity has remained high Though down 13 yoy in 2016 global foreign direct investment (FDI) inflows1 reached $1525 bn2 (in nominal terms) ndash one of the highest levels recorded over the 2005-2016 period Last year ca frac14 of global FDI inflows came to Europe
One may notice that FDI trend has not been smooth over time In particular in the aftermath of the global financial crisis of 2007-2009 the FDI fell sharply and until now has not yet reached the pre-crisis level (see figure 1) This gap should largely be reduced if United Nations Conference on Trade and Development
1 UNCTAD gathers data for virtually all the countries in the world (ca 200 countries depending on data availability for a given year)
2 Preliminary estimates
(UNCTAD) expectations materialize and FDI flows will increase by 10 in 2017 on accelerating global economic growth and international trade
One of the most important types of activity of international investors are greenfield projects which contribute directly to the creation of new facilities and jobs The annual value of greenfield investment in 2005-2016 averaged about $830 bn3 remaining relatively stable since the global financial crisis One may notice that in contrast to FDI inflows the value of announced greenfield projects increased in 2016
3 Preliminary estimates
Figure 1 Global FDI inflows and the value of announced greenfield FDIs
Source UNCTAD
eycomattractiveness
Mature leader of the CEE region | EYrsquos Attractiveness Survey Poland 5
Investors vote ldquoremainrdquo in Europe
EY European Attractiveness Survey (EAS) examines new investment projects mainly greenfield projects announced by international investors The study is based on interviews with high-level executives from around the world and foreign direct investment announcements by companies The latter part is linked to EY European Investment Monitor (EIM) powered by Oxford Intelligence which is the leading database of direct investment across Europe The database tracks those FDI projects that have resulted in the creation of new facilities and new jobs Therefore portfolio investment joint ventures mergers and acquisitions and other investment that do not entail the creation of new jobs (eg replacing old machinery without creating new employment) are excluded
Despite the uncertainty in 2016 Europe attracted a new record high number of FDI projects
For several years Europe has experienced many challenges (incl uncertainty on the future of the EU and the Eurozone in particular) caused by public debt crisis population aging conflicts in the Middle East and migration inflows into Europe tensions between Russia and Ukraine Brexit and populist parties garnering significant minority support in many European countries Despite such an uncertain
1048666business environment and geopolitical risksinvestors continue to see Europe as an attractive investment destination
In 2016 the number of FDI projects directed to Europe increased by 15 in comparison to the previous year Overall 584510486661048666 new internationalinvestment projects were announced According to information gathered for 62 of these announcements the projects located in Europe should create at least 260 thousand10486661048666 new job1048666s4 The majority of FDI in Europe arises from intra-European FDI flows
In 2016 Central and Eastern Europe (CEE)5 maintained its appeal to international investors - the region received 23 of all the FDI projects announced in Europe and 52 in terms of the announced new jobs
4 Information on the number of new jobs is not available for all of the announced investment projects As such the number of new jobs given above constitutes the lower bound of the actual number of new employment related to FDI projects announced in Europe Any conclusions based on the number of planned jobs must also be drawn with caution
5 Central and Eastern Europe encompasses 22 countries Albania Belarus Bosnia and Herzegovina Bulgaria Croatia Cyprus Czech Republic Estonia Hungary Latvia Lithuania Macedonia Moldova Montenegro Poland Romania Russia Serbia Slovakia Slovenia Turkey and Ukraine
Mature leader of the CEE region | EYrsquos Attractiveness Survey Poland 5
6 Mature leader of the CEE region | EYrsquos Attractiveness Survey Poland
Figure 2 Number of FDI projects announced in Europe
Source EY (2017) European Investment Monitor
Europersquos perception in the eyes of international investors is improving Western Europe and CEE are among the worldrsquos top 3 most attractive regions for 53 and 37 of executives respectively This makes Western Europe the top performer while CEE ranks third behind Northern America and level-pegging with China While Western Europe gained 3 pp
compared to 2015 CEE improved by as many as 9 pp That was the biggest increase among all the regions considered in 2016 Interestingly since 2013 the perception of Western Europe and CEE among investors has significantly improved while the attractiveness of BRICS has faded
Figure 3 Perception of most attractive global regions6
Source EY (2017) European Attractiveness Survey
6 Answer to the question ldquoIn general which of the following regions do you think are currently the top 3 most attractive regions in which to establish operationsrdquo (3 answers possible)
Investors vote ldquoremainrdquo in Europe
eycomattractiveness
Mature leader of the CEE region | EYrsquos Attractiveness Survey Poland 7
Europersquos return to steady economic growth deferred
Despite positive developments in terms of the number of announced investment projects and improving perceptions of Europersquos attractiveness investors seem to see the prospect of strong European economic growth receding further into the future In 2015 53 respondents expected Europe to return to steady economic growth within the next three years In 2017 that proportion is down to 42 At the same time the proportion expecting a return to steady economic growth after at least five years increased to 56 (from 45 in 2015)
Also the share of international investors confident that Europe will ever return to stable economic growth decreased from 85 in 2015 to 65 in 2017
The British votersrsquo decision to leave the EU has contributed to investorsrsquo doubts regarding the future economic growth in Europe 20 of international investors declare to have plans to relocate operations if Britain leaves the European single market But many companies do not yet have a comprehensive view of the tax (VAT pre-financing and the exact scope of custom duty) administrative (customs and VAT requirements) and regulatory consequences and have only just started thinking about the possible consequences The impact of Britainrsquos planned exit from the European Union will probably be more visible in next yearrsquos survey
Figure 4 In your view given the current uncertainties in Europe how long before we see a return to steady economic growth and performance in Europe
Source EY (2017) European Attractiveness Survey Sample 332 respondents confident in Europersquos ability to return to a more dynamic economic growth
8 Mature leader of the CEE region | EYrsquos Attractiveness Survey Poland
Poland does need FDIs
Foreign companies play an important role in the Polish economy They contribute a lot to employment wage fund generated value added investments exports and general government revenues Companies with a majority share of foreign capital have in recent years often outperformed Polish public and private business entities thereby being an important driver of the economic growth In particular foreign companies accounted for a vast majority of employment growth in the enterprise
sector in Poland over the 2010-2015 period In 2016 at the time of economic slowdown foreign companies accelerated the growth of generated value added exports and employment significantly alleviating the adverse impact of other factors on the Polish economy Importantly in contrast to Polish private and public companies foreign entities continued to expand their investment activity in 2016 though at a lower rate than in 2015
Figure 5 Gross fixed capital formation in the enterprise sector in Poland by ownership7
Source EY based on Central Statistical Office data
7 Data for 2011-2015 refers to annual growth in gross fixed capital formation (GFCF) of small (10-49 employed persons) medium (49-249 employed persons) and large (over 249 employed persons) enterprises while data for 2016 compares GFCF of medium and large enterprises to their GFCF in 2015 Data excludes information for most companies with unlimited ownerrsquos liability
8 Companies (1) in which at least part of the capital share belongs to the public sector (2) state-owned enterprises or (3) entities without specific legal status (eg some state-owned entities)
9 Companies whose capital is predominantly owned by foreigners (gt50 of shares) and (2) branches of foreign enterprises10 Companies that were defined neither as ldquoforeign companiesrdquo nor as ldquoPolish public sector companiesrdquo
Poland does need FDIs
Polish public sector companies8
Polish private companies10
Foreign companies9
eycomattractiveness
Mature leader of the CEE region | EYrsquos Attractiveness Survey Poland 9
Poland was the only EU country that avoided recession during the global financial crisis in 2007-2009 In terms of cumulative GDP growth in 2008-2016 amounting to 324 Poland ranked 3rd among EU Member States The outstanding performance of the Polish economy has increased its attractiveness as an investment destination
Figure 6 Number of FDI projects and jobs announced in Poland
Source EY (2017) European Investment Monitor Note that the number of new jobs is available only for a certain part of announced investment projects In 2016 55 of announced projects were accompanied by information on planned employment This proportion might change from year to year Hence conclusions from the changes in announced number of FDI related jobs must be drawn with caution
To continue the catching-up process with more developed economies Poland requires a high rate of investment Investment needs are additionally reinforced by a very limited room for further employment led-growth due to among others unfavourable demographic developments However in the last decade the rate of investment in Poland was below the EU average and far below the levels observed in other CEE countries The key problem is a very low level of private investment in Poland Importantly for the majority of the last decade the
savings rate in Poland has been even lower than the investment rate This constitutes another challenge that should be addressed by the Polish government
The factors outlined above indicate that the Polish economy does need foreign capital inflows preferably in the form of direct investment leading to generating a significant value added This emphasizes the importance of Polandrsquos investment attractiveness and paying attention to factors influencing foreign investorsrsquo decisions
To continue the catching-up process with more developed economies Poland needs to increase its rate of investment which over the last decade has been
well below the level recorded for the majority of CEE countries Despite a low investment rate for the majority of that period the savings rate was even lower though in recent years it has improved somewhat Foreign capital is thus required to finance our countryrsquos investment needs Of particular importance should be foreign direct investments (FDIs) which have greatly contributed to the internationalization of Polish companies and their integration into global value chains since the 1990s Empirical evidence shows that this process
has been associated with an increase in exports transfer of skills and know-how and higher productivity of companies which on average invest more per employee and pay higher wages than non-internationalised enterprises Importantly other domestic firms also benefit from the activity of companies that are exposed to foreign markets which confirms the existence of significant spillover effects To understand the importance of the internationalization of Polish companies one should note that in 2000 ca 20 of value added generated in Poland was driven by external demand but this proportion increased to ca 35 in 2016 The message is even stronger if we realize that majority () of economic growth in Poland in this century has been driven by foreign demand The activity of foreign companies can also alleviate the consequences of economic slowdown For example in 2016 ndash the year
of significant investment contraction by the public and Polish private companies foreign companies continued to increase their capital outlays in Poland Benefits of FDIs make them much needed by countries particularly by catching-up economies which results in harsh competition for FDI inflows EY Polandrsquos Attractiveness Survey should help us to understand which assets foreign investors value most and what are their main concerns Reinforcing strengths and addressing weaknesses of the Polish economy would improve its perception which is one of the preconditions for winning valuable greenfield investment and thereby improving Polandrsquos long-term economic potential
Marek Rozkrut EY Poland Chief Economist Head of Economic Analysis Team
EY Viewpoint
10 Mature leader of the CEE region | EYrsquos Attractiveness Survey Poland
Poland is one of the most attractive destinations in Europe for foreign direct investors
The findings of the EY European Attractiveness Survey indicate that when approximated by the number of announced investment projects Poland seems to be one of the most attractive locations in Europe for foreign direct investors In 2016 international investors announced their intentions to carry out 256 investment projects in Poland compared to 211 projects in 2015 This ranked Poland 5th among European countries in terms of the number of planned projects ndash achieving an
advance from the 6th position (ex aequo with Belgium) in 2015 and the best result since 2008 when Poland also ranked 5th Naturally the number of planned investment projects depends on the local market capacity in particular the availability of labour11 However the fact that Poland regularly stays ahead of economies such as Russia and Turkey in terms of international investment projects proves that Polandrsquos appeal to foreign investors is high
11 It is thus no surprise that Poland ranks higher than smaller economies in the CEE region
Poland is one of the most attractive destinations in Europe for foreign direct investors
Source EY European Investment Monitor (EIM) 2017
2015 2016Percentage Change
(2016 vs 2015
United Kingdom 1065 1144 7
Germany 945 1063 12
France 598 779 30
Spain 248 308 24
Poland 211 256 21
Netherlands 219 207 -5
Russia 201 205 2
Belgium 211 200 -5
Ireland 127 141 11
Turkey 134 138 3
Finland 105 133 27
Romania 98 132 35
Czech Republic 70 110 57
Hungary 94 107 14
Sweden 51 90 76
Italy 55 89 62
Switzerland 90 88 -2
Denmark 63 72 14
Slovakia 54 70 30
Portugal 47 59 26Others 396 454 15Total 5083 5845 15
2015 2016Percentage Change
(2016 vs 2015
United Kingdom 42336 43165 2
Poland 19651 22074 12
Germany 17126 19961 17
Romania 12746 17545 38
France 13639 16980 24
Serbia 10631 16396 54
Russia 13672 15064 10
Czech Republic 9332 14292 53
Spain 7126 12969 82
Hungary 11741 12450 6
Ireland 10772 8535 -21
Slovakia 9564 8308 -13
Turkey 2971 7179 142
Austria 1357 4759 251
Ukraine 850 4547 435
Bulgaria 3598 3959 10
Switzerland 1391 3416 146
Belgium 3168 3309 4
Moldova 1000 3200 220
Italy 1383 2654 92
Others 23612 18911 -20Total 217666 259673 19
Top 20 destination countries by FDI projects Top 20 destination countries by FDI job creation
eycomattractiveness
Mature leader of the CEE region | EYrsquos Attractiveness Survey Poland 11
In 2016 the growth rate of the number of FDI projects located in Poland was higher than in Europe as a whole As a consequence in 2016 Poland was the location of 44 of all FDI projects announced in Europe which indicates the third consecutive year of increase in Polandrsquos share in the total number of foreign projects in Europe
Figure 7 Share of FDI projects in Poland in total FDI projects in Europe
Source EY (2017) European Investment Monitor
Based on data available for 55 of projects international investors planned to create at least 22 thousand new jobs in Poland While the exact counting of jobs is challenging (and the job data coverage is not complete) the increase in announced new jobs by foreign investors in Poland between 2011 and 2016 (over a twofold increase) provides additional evidence that the trend in international investorsrsquo activity in Poland continues to be positive
Relative to other European countries the number of FDI-related jobs announced to be created in Poland in 2016 was the second highest only next to the UK The position of Poland in this ranking has been relatively stable (among top 3 countries) since 2004 with only two exceptions in 2009 and 2011 when the country was beyond the podium
Poland is amongst the top 5 locations in Europe for FDI ndash that is quite an achievement It confirms the prediction of the last survey when investors indicated
that Poland would be the best place to invest just after Germany UK France and the Netherlands It is really promising since the perception has not always been supported by the figures and real investment projectsAt the same time there is a global rivalry and competition for innovative growth We do not measure it yet but in order to be ready for sustainable growth Polish economy needs to have the ability to interact with newest trends like Industry 40 Technological changes will decrease the weight of labor costs in the
site selection processes allowing some comebacks of production to the more expensive locationsWe observe it in a number of areas and Poland is getting ready for this Changes in the law regarding support for innovation enhanced RampD tax relief new support schemes for investments and comprehensive environment for start-ups are all good tools which should attract investors bringing more value added projects to the Polish economy There are many good examples of such projects in manufacturing automotive SSCBPO centers but constant change and benchmarking against other locations is requiredIt all derives from a great desire for growth and belief that FDI contributes to the development of societies and countries In this context Polandrsquos position as a CEE leader is worth underlining since the CEE region itself has improved a lot (+9 pp
vs last year) and regained third position among all regions worldwide ndash just behind Western Europe and North America One needs to remember that it all happens when investors say that only 28 of them are having plans to establish or expand operations in Europe next year It is a fall by 10 pp from 2013Global FDI inflows were down by 13 in 2016 compared to 2015 which means that competition for new projects will not be easier A constantly changing environment supported by technological revolution is creating an environment in which policy makers need to anticipate investorsrsquo expectations and propose solutions in a real time From this perspective challenges of the business and governments are becoming closer than ever
Paweł Tynel EY Poland Head of Grants and Incentives Advisory Services
EY Viewpoint
12 Mature leader of the CEE region | EYrsquos Attractiveness Survey Poland
FDI projects located in Poland fall predominantly into three sectors manufacturing finance amp business services and transport amp communications On average these sectors accounted for 95 of all FDI projects in Poland in 2005-2016 However the share of manufacturing decreased from 81 of all FDI projects in 2005 to 62 in 2016 while finance amp
business services attracts more and more projects ndash from 7 to 28 respectively The share of transport amp communications ranged between 3 and 10 in 2005-2016 Other sectors12 were of rather negligible interest to foreign investors
12 ie agriculture construction education amp health energy recreation retail amp hospitality
Poland attracts investors mainly from Western Europe and the USA
Poland attracts FDI projects mainly from Western Europe and the USA In 2005-2016 on average over 80 of all FDI projects came from these two regions While the importance of Western Europe for FDI in Poland increased in 2016 the share of the USA in total FDI projects launched in Poland fell However there are no clear trends in the origin structure of foreign investors in Poland
Figure 8 Share of FDI projects in Poland by region of origin
Source EY (2017) European Investment Monitor
Table 1 Number of FDI projects in Poland by sectors
2005 2006 2007 2008 2009 2010 2011 2012 2013 2014 2015 2016
Manufacturing 145 106 95 105 72 96 89 89 70 87 117 159
Finance amp Business Services 12 27 31 47 19 35 23 39 27 32 64 72
Transport amp Communications 15 15 11 15 5 8 7 12 4 4 22 15
Retail amp Hospitality 7 5 1 4 3 1 2 4 3 4 7
Construction 3 1 1 1 1 2
Other 1 1 4 7 1 1 3 5 1 6 4 1
Source EY (2017) European Investment Monitor
Poland attracts investors mainly from Western Europe and the USA
eycomattractiveness
Mature leader of the CEE region | EYrsquos Attractiveness Survey Poland 13
The decomposition of international investment projects by activity provides additional insights It reveals that while projects related to manufacturing clearly dominate the structure of foreign investment Poland is becoming a more and more attractive location for support and shared services centers (SSC) to large multinational companies (eg accounting or IT) Indeed in 2016 Poland garnered 38 out of 161 (or 24) SSC projects announced by international investors ranking first among European countries
The activity structure of investment projects announced in Poland is similar to that in the CEE region Two notable exceptions are manufacturing which captures somewhat larger part of investment projects in the CEE (564) than in Poland (465) and shared services centers which in turn attracts a significantly higher proportion of FDI in Poland (145) than in CEE as a whole (56) At the same time there are substantial discrepancies between the activity structure of projects announced in Poland and in Europe as a whole In particular investment
projects announced in Europe concentrated in sales and marketing (459 of all projects) while attracting only 195 projects in Poland By contrast manufacturing projects represented only 263 of the total number of projects in Europe which is much below 465 recorded in Poland
Differences in the sectorial structure of new projects between Poland and Europe as a whole are also reflected in labour-intensity of greenfield FDIs The number of jobs per project in Poland in 2016 (158) was over twice as high as in Europe (72)13 In other words Poland is a host to more labour intensive projects than on average Europe However one may notice that the above ratio in Poland has been in a declining trend suggesting that foreign investment in Poland become more and more capital intensive In addition the number of jobs per project in Poland is lower than the average for the CEE region (189)
13 Only the projects for which data on announced new jobs was available were taken into account in the calculation
Table 2 Number of FDI projects in Poland by activity
2005 2006 2007 2008 2009 2010 2011 2012 2013 2014 2015 2016
Manufacturing 123 79 71 82 59 70 70 65 56 74 86 119
Sales amp Marketing 15 33 41 47 21 29 25 48 18 30 65 50
Shared Services Centre 7 11 5 9 3 7 8 10 5 8 16 38
Logistics 18 14 10 14 8 7 6 7 10 8 20 19
Research amp Development 8 5 10 12 5 12 7 11 12 6 17 19
Headquarters 1 2 2 2 1 1 4
Contact Centre 4 3 3 3 3 1 4 2 4 4 3
Testing amp Servicing 5 7 4 9 1 13 6 3 2 1 2 2
Other 0 0 1 1 0 0 0 0 1 0 1 2
Source EY (2017) European Investment Monitor
14 Mature leader of the CEE region | EYrsquos Attractiveness Survey Poland
Polandrsquos Attractiveness Survey indicating improvement in foreign investment prospects
In 2017 EY for the first time conducted a deepened survey among international investors in order to gain additional insights into their motivations behind establishing operations in Poland As part of Polandrsquos Attractiveness Survey foreign companies both present and non-established in Poland responded to questions regarding their investment plans factors affecting their investment decisions and risks facing Poland
According to the surveyed companies Polandrsquos attractiveness as an investment destination improved slightly in 2016 ndash 29 of respondents indicated that it had improved while 24 of companies claimed that it had deteriorated last year
One may note large differences in the assessment of Polandrsquos attractiveness between representatives of companies which operate in Poland and companies not established in the country In the eyes of the latter the evolution of Polandrsquos attractiveness as an investment destination was better than in the opinion of the former Only 7 of companies which do not conduct operations in Poland indicated that its attractiveness had deteriorated while 32 claimed that it had improved compared to 37 and 26 respectively in the case of companies functioning in Poland
Polandrsquos Attractiveness Survey indicating improvement in foreign investment prospects
Figure 9 To what degree do you think Polandrsquos attractiveness evolved over the last yearwill evolve over the next three years
Source EY (2017) Polandrsquos Attractiveness Survey
eycomattractiveness
Mature leader of the CEE region | EYrsquos Attractiveness Survey Poland 15
Looking ahead 48 of foreign investors expect Polandrsquos attractiveness to improve over the next three years That share is only lower than the respective proportion for top performers Portugal and Netherlands while it exceeds the results obtained for other European countries analysed14
Investorsrsquo expectations regarding Polandrsquos attractiveness turn out to be very polarized While the share of respondents projecting improvement in Polandrsquos attractiveness over the next three years
14 Germany Italy UK France Belgium
is high it is accompanied by a relatively large proportion (20) of investors indicating that it will deteriorate
Irrespective of discrepancies between different groups of foreign investors one should note that expectations of every group considered point to a significant improvement of the investment attractiveness of the Polish economy over the next three years relative to their assessment of the previous year
Mature leader of the CEE region | EYrsquos Attractiveness Survey Poland 15
16 Mature leader of the CEE region | EYrsquos Attractiveness Survey Poland
Figure 10 From the point of view of your company Poland is very fairly little or not at all attractive as a foreign direct investment destination
Source EY (2017) Polandrsquos Attractiveness Survey
Polandrsquos key assetshellip not always recognized
When considering Poland as a potential investment destination foreign investors appreciate in particular the structural advantages of the labour market in Poland Over 70 of surveyed companiesrsquo representatives indicate that Polandrsquos labour skills level the potential for productivity increase and labour costs are very or fairly attractive The same factors are also most frequently listed as Polandrsquos key assets in comparison to other European countries
Foreign companies established in Poland distinguish Polish workersrsquo skills level and the potential for productivity increase as attractive much more frequently than companies not present in Poland indicating these two factors in 94 and 87 of cases respectively
Polandrsquos key assetshellip not always recognized
very attractive + fairly attractive
81
78
74
72
68
65
58
Both the companies which operate in Poland and the firms which have not yet established their presence in the country agree that labour costs are one of Polandrsquos major assets when compared to other European countries However we identified large discrepancies between those two types of investors when it comes to their assessment of Polish labour force skills level and the potential for productivity increase Foreign companies already operating in Poland consider those factors as key assets of Poland relative to other European countries However these advantages are much less frequently recognized by companies which do not function in Poland It may signal the need to put more emphasis on the communication of the strengths outlined above to the companies not yet established in Poland
That need seems to be further reinforced by the findings of EY European Attractiveness Survey indicating that labour skills are among the assets most valued by foreign investors CEE advantages related to low labour costs are depleting Tightening labour markets push international investors to alternative destinations In particular an increasing number of investors chasing their ideal skills and wages combinations have looked south to non-EU members such as Serbia As a consequence competition for foreign investment based on labour costs is becoming tighter and CEE countries must look for new advantages
eycomattractiveness
Mature leader of the CEE region | EYrsquos Attractiveness Survey Poland 17
Figure 11 What are the three key assets of Poland compared to other European Countries
Source EY (2017) Polandrsquos Attractiveness Survey
When asked about the key risks for Poland foreign investors most frequently point to unstable social and regulatory business environment as well as restrictive approach applied by tax authorities Again we find significant discrepancies between different types of investors The risk factors outlined above are much more frequently indicated by the representatives of companies established in Poland than by those that do not operate in the country
Figure 12 According to you what are the three key risks for Poland
Source EY (2017) Polandrsquos Attractiveness Survey
18 Mature leader of the CEE region | EYrsquos Attractiveness Survey Poland
Although the largest share of new investment projects planned in Poland come from the manufacturing sectors foreign investors indicate that the most prospective sectors which could drive Polandrsquos growth in the coming years are professional services including IT services BPO15 shared services as well as logistics Most attractive sectors related to manufacturing automotive industry and consumer goods are the fifth and seventh most frequently selected sectors respectively
Figure 13 In your opinion which business sectors will drive Polandrsquos growth in the coming years (three answers possible)
Source EY (2017) Polandrsquos Attractiveness Survey
15 Business Process Outsourcing including services such as finance accounting human resources contact center
Polandrsquos key assets hellip not always recognizedPolandrsquos key assetshellip not always recognized
eycomattractiveness
Mature leader of the CEE region | EYrsquos Attractiveness Survey Poland 19
The Czech Republic emerges as Polandrsquos main competitor for FDIs
Traditionally Central and Eastern European countries have been competing with Poland for foreign investment The results of the Polandrsquos Attractiveness Survey confirm this common knowledge additionally listing Germany among Polandrsquos main competitors
While the position of the Czech Republic as Polandrsquos main competitor for FDIs may not be that surprising the margin by which it has been ranked ahead of other countries is striking 44 of the surveyed foreign investors indicate the Czech Republic as Polandrsquos main competitor followed by Hungary (15) Germany (15) Romania (13) and Slovakia (10)
The position of the Czech Republic as that of Polandrsquos main competitor for FDIs is shared by every group of investors considered16 Still a higher share of companies established in Poland (50) is of such an opinion than in the case of enterprises not present in Poland (35) Significant differences between these types of investors have also been identified in their perception of Slovakia (15 and 3 respectively) Hungary in turn is indicated as Polandrsquos main competitor more frequently by investors from the USA (28) than by investors from Western Europe (7)
16 Investors were broken down by their establishednot established status region of origin size of their company and sector of their activity In every of the categories considered the Czech Republic was most frequently indicated as Polandrsquos main competitor
Map 1 In your opinion which is Polandrsquos main European competing country in terms of attractiveness
Source EY (2017) Polandrsquos Attractiveness Survey
20 Mature leader of the CEE region | EYrsquos Attractiveness Survey Poland
Methodology
European Attractiveness Survey
The ldquorealrdquo attractiveness of Europe for foreign investors
Our evaluation of the reality of FDI in Europe is based on the EY European Investment Monitor (EIM) EYrsquos proprietary database produced in collaboration with Oxford Intelligence This database tracks those FDI projects that result in the creation of new facilities and new jobs By excluding portfolio investments and MampA it shows the reality of investment in manufacturing and services by foreign companies across the continent
The EIM database focuses on investment announcements the number of new jobs created and where identifiable the associated capital investment Projects are identified through the daily monitoring of more than 10000 news sources To confirm the accuracy of the data collected the research team aims to directly contact more than 70 of the companies undertaking these investments
The following categories of investment projects are excluded from the EIM
bull MampA and joint ventures (unless these result in new facilities or new jobs being created)
bull License agreements
bull Retail and leisure facilities hotels and real estate
bull Utilities (including telecommunications networks airports ports and other fixed infrastructure)
bull Extraction activities (ores minerals and fuels)
bull Portfolio investments (pensions insurance and financial funds)
bull Factory and other production replacement investments (eg replacing old machinery without creating new employment)
bull Not-for-profit organizations (charitable foundations trade associations and government bodies)
The ldquoperceivedrdquo attractiveness of Europe and its competitors for foreign investors
We define the attractiveness of a country or area as the combination of its image investorsrsquo level of confidence in it as an investment destination and the perception of its ability to provide the most competitive benefits for FDI
The research regarding the perceptions of European investment attractiveness was conducted by the CSA Institute in March 2017 via telephone interviews with a representative group of 505 international decision makers
Our sample groups of businesses included representatives from
bull Europe 53
bull North America 29
bull Asia 12
bull Latin America 3
bull Middle East 2
bull Other regions 1
Overall 81 of the 505 companies surveyed have a presence in Europe And of the non-European companies 34 have established operations in Europe
Investment projects by companies in these categories are included in certain instances eg details of a specific new hotel investment or retail outlet would not be recorded but if the hotel or retail company were to establish a headquarters facility or a distribution center this project would qualify for inclusion in the database
Disclaimer FDI jobs data is available for 3596 projects out of 5845 projects (or 61) in 2016
Methodology
eycomattractiveness
Mature leader of the CEE region | EYrsquos Attractiveness Survey Poland 21
Polandrsquos Attractiveness SurveyPolandrsquos Attractiveness Survey was carried out for the first time in 2017 The research consisted of a survey conducted among international investors in which foreign companiesrsquo representatives responded to questions about their plans regarding establishing or expanding their operations in Poland factors shaping Polandrsquos attractiveness as an investment destination and risks that face Poland
The research was conducted by the CSA Institute in March-April 2017 via telephone interviews with a representative group of 208 international decision makers As a whole 58 of the surveyed companies have a presence in Poland
The companyrsquos country of origin in the sample is representative of the investments done in Poland In particular our sample groups of businesses included representatives from
bull Western Europe 48
bull North America 25
bull Asia 19
bull Northern Europe 6
bull Other regions 2
Disclaimer FDI jobs data is available for 140 projects out of 256 projects (or 55) announced in Poland in 2016
Mature leader of the CEE region | EYrsquos Attractiveness Survey Poland 21
EY | Assurance | Tax | Transactions | Advisory
About EY
EY is a global leader in assurance tax transaction and advisory services The insights and quality services we deliver help build trust and confidence in the capital markets and in economies the world over We develop outstanding leaders who team to deliver on our promises to all of our stakeholders In so doing we play a critical role in building a better working world for our people for our clients and for our communities
EY refers to the global organization andor one or more of the member firms of Ernst amp Young Global Limited each of which is a separate legal entity Ernst amp Young Global Limited a UK company limited by guarantee does not provide services to clients
For more information about our organization please visit eycom
copy 2017 EYGM Limited All Rights Reserved
SCORE 00068-162
eycompl

eycomattractiveness
Mature leader of the CEE region | EYrsquos Attractiveness Survey Poland 3
eycomattractiveness
FDI projects located in Poland fall predominantly into three sectors manufacturing finance amp business services and transport amp communications On average these sectors accounted for 95 of all FDI projects in Poland in 2005-2016 However the share of manufacturing decreased from 81 of all FDI projects in 2005 to 62 in 2016 while finance amp business services attracts more and more projects ndash from 7 to 28 respectively
Poland and its neighbors including the Baltic States are also attracting a third wave of shared service centers (up 83 for CEE in 2016) and other activities supplying services to companies In 2016 Poland garnered 38 out of 161 (or 24) SSC projects announced by international investors ranking first among European countries
Over 70 of surveyed companiesrsquo representatives indicate that Polandrsquos labour skills level potential for productivity increase and labour costs are very or fairly attractive The same factors are also most frequently listed as Polandrsquos key assets in comparison to other European countries
Traditionally Central and Eastern European countries have been competing with Poland for foreign investment The results of the survey confirm this common knowledge additionally enumerating Germany among Polandrsquos main competitors While the position of the Czech Republic as Polandrsquos main competitor for FDIs may not be that surprising the margin by which it has been ranked ahead of other countries is striking The position of the Czech Republic as that of Polandrsquos main competitor for FDIs is shared by every group of investors considered
4
6
7
5
Number of FDI projects in Poland by activity
Polandrsquos key assets
Czech Republic ndash Polandrsquos main competitor for FDIs
FDI projects in shared services centers in Europe
119
Manufacturing
50
Sales ampMarketing
38
Shared ServicesCenters
19
Logistics
19
Research ampDevelopment
Local labourskills level
Potential forproductivity increase
Labour costs
81 78 74
1315
15
4410
Poland
1stin SSC
Mature leader of the CEE region | EYrsquos Attractiveness Survey Poland 3
4 Mature leader of the CEE region | EYrsquos Attractiveness Survey Poland
FDI global inflows
FDI global inflows
In recent years multinational investors activity has remained high Though down 13 yoy in 2016 global foreign direct investment (FDI) inflows1 reached $1525 bn2 (in nominal terms) ndash one of the highest levels recorded over the 2005-2016 period Last year ca frac14 of global FDI inflows came to Europe
One may notice that FDI trend has not been smooth over time In particular in the aftermath of the global financial crisis of 2007-2009 the FDI fell sharply and until now has not yet reached the pre-crisis level (see figure 1) This gap should largely be reduced if United Nations Conference on Trade and Development
1 UNCTAD gathers data for virtually all the countries in the world (ca 200 countries depending on data availability for a given year)
2 Preliminary estimates
(UNCTAD) expectations materialize and FDI flows will increase by 10 in 2017 on accelerating global economic growth and international trade
One of the most important types of activity of international investors are greenfield projects which contribute directly to the creation of new facilities and jobs The annual value of greenfield investment in 2005-2016 averaged about $830 bn3 remaining relatively stable since the global financial crisis One may notice that in contrast to FDI inflows the value of announced greenfield projects increased in 2016
3 Preliminary estimates
Figure 1 Global FDI inflows and the value of announced greenfield FDIs
Source UNCTAD
eycomattractiveness
Mature leader of the CEE region | EYrsquos Attractiveness Survey Poland 5
Investors vote ldquoremainrdquo in Europe
EY European Attractiveness Survey (EAS) examines new investment projects mainly greenfield projects announced by international investors The study is based on interviews with high-level executives from around the world and foreign direct investment announcements by companies The latter part is linked to EY European Investment Monitor (EIM) powered by Oxford Intelligence which is the leading database of direct investment across Europe The database tracks those FDI projects that have resulted in the creation of new facilities and new jobs Therefore portfolio investment joint ventures mergers and acquisitions and other investment that do not entail the creation of new jobs (eg replacing old machinery without creating new employment) are excluded
Despite the uncertainty in 2016 Europe attracted a new record high number of FDI projects
For several years Europe has experienced many challenges (incl uncertainty on the future of the EU and the Eurozone in particular) caused by public debt crisis population aging conflicts in the Middle East and migration inflows into Europe tensions between Russia and Ukraine Brexit and populist parties garnering significant minority support in many European countries Despite such an uncertain
1048666business environment and geopolitical risksinvestors continue to see Europe as an attractive investment destination
In 2016 the number of FDI projects directed to Europe increased by 15 in comparison to the previous year Overall 584510486661048666 new internationalinvestment projects were announced According to information gathered for 62 of these announcements the projects located in Europe should create at least 260 thousand10486661048666 new job1048666s4 The majority of FDI in Europe arises from intra-European FDI flows
In 2016 Central and Eastern Europe (CEE)5 maintained its appeal to international investors - the region received 23 of all the FDI projects announced in Europe and 52 in terms of the announced new jobs
4 Information on the number of new jobs is not available for all of the announced investment projects As such the number of new jobs given above constitutes the lower bound of the actual number of new employment related to FDI projects announced in Europe Any conclusions based on the number of planned jobs must also be drawn with caution
5 Central and Eastern Europe encompasses 22 countries Albania Belarus Bosnia and Herzegovina Bulgaria Croatia Cyprus Czech Republic Estonia Hungary Latvia Lithuania Macedonia Moldova Montenegro Poland Romania Russia Serbia Slovakia Slovenia Turkey and Ukraine
Mature leader of the CEE region | EYrsquos Attractiveness Survey Poland 5
6 Mature leader of the CEE region | EYrsquos Attractiveness Survey Poland
Figure 2 Number of FDI projects announced in Europe
Source EY (2017) European Investment Monitor
Europersquos perception in the eyes of international investors is improving Western Europe and CEE are among the worldrsquos top 3 most attractive regions for 53 and 37 of executives respectively This makes Western Europe the top performer while CEE ranks third behind Northern America and level-pegging with China While Western Europe gained 3 pp
compared to 2015 CEE improved by as many as 9 pp That was the biggest increase among all the regions considered in 2016 Interestingly since 2013 the perception of Western Europe and CEE among investors has significantly improved while the attractiveness of BRICS has faded
Figure 3 Perception of most attractive global regions6
Source EY (2017) European Attractiveness Survey
6 Answer to the question ldquoIn general which of the following regions do you think are currently the top 3 most attractive regions in which to establish operationsrdquo (3 answers possible)
Investors vote ldquoremainrdquo in Europe
eycomattractiveness
Mature leader of the CEE region | EYrsquos Attractiveness Survey Poland 7
Europersquos return to steady economic growth deferred
Despite positive developments in terms of the number of announced investment projects and improving perceptions of Europersquos attractiveness investors seem to see the prospect of strong European economic growth receding further into the future In 2015 53 respondents expected Europe to return to steady economic growth within the next three years In 2017 that proportion is down to 42 At the same time the proportion expecting a return to steady economic growth after at least five years increased to 56 (from 45 in 2015)
Also the share of international investors confident that Europe will ever return to stable economic growth decreased from 85 in 2015 to 65 in 2017
The British votersrsquo decision to leave the EU has contributed to investorsrsquo doubts regarding the future economic growth in Europe 20 of international investors declare to have plans to relocate operations if Britain leaves the European single market But many companies do not yet have a comprehensive view of the tax (VAT pre-financing and the exact scope of custom duty) administrative (customs and VAT requirements) and regulatory consequences and have only just started thinking about the possible consequences The impact of Britainrsquos planned exit from the European Union will probably be more visible in next yearrsquos survey
Figure 4 In your view given the current uncertainties in Europe how long before we see a return to steady economic growth and performance in Europe
Source EY (2017) European Attractiveness Survey Sample 332 respondents confident in Europersquos ability to return to a more dynamic economic growth
8 Mature leader of the CEE region | EYrsquos Attractiveness Survey Poland
Poland does need FDIs
Foreign companies play an important role in the Polish economy They contribute a lot to employment wage fund generated value added investments exports and general government revenues Companies with a majority share of foreign capital have in recent years often outperformed Polish public and private business entities thereby being an important driver of the economic growth In particular foreign companies accounted for a vast majority of employment growth in the enterprise
sector in Poland over the 2010-2015 period In 2016 at the time of economic slowdown foreign companies accelerated the growth of generated value added exports and employment significantly alleviating the adverse impact of other factors on the Polish economy Importantly in contrast to Polish private and public companies foreign entities continued to expand their investment activity in 2016 though at a lower rate than in 2015
Figure 5 Gross fixed capital formation in the enterprise sector in Poland by ownership7
Source EY based on Central Statistical Office data
7 Data for 2011-2015 refers to annual growth in gross fixed capital formation (GFCF) of small (10-49 employed persons) medium (49-249 employed persons) and large (over 249 employed persons) enterprises while data for 2016 compares GFCF of medium and large enterprises to their GFCF in 2015 Data excludes information for most companies with unlimited ownerrsquos liability
8 Companies (1) in which at least part of the capital share belongs to the public sector (2) state-owned enterprises or (3) entities without specific legal status (eg some state-owned entities)
9 Companies whose capital is predominantly owned by foreigners (gt50 of shares) and (2) branches of foreign enterprises10 Companies that were defined neither as ldquoforeign companiesrdquo nor as ldquoPolish public sector companiesrdquo
Poland does need FDIs
Polish public sector companies8
Polish private companies10
Foreign companies9
eycomattractiveness
Mature leader of the CEE region | EYrsquos Attractiveness Survey Poland 9
Poland was the only EU country that avoided recession during the global financial crisis in 2007-2009 In terms of cumulative GDP growth in 2008-2016 amounting to 324 Poland ranked 3rd among EU Member States The outstanding performance of the Polish economy has increased its attractiveness as an investment destination
Figure 6 Number of FDI projects and jobs announced in Poland
Source EY (2017) European Investment Monitor Note that the number of new jobs is available only for a certain part of announced investment projects In 2016 55 of announced projects were accompanied by information on planned employment This proportion might change from year to year Hence conclusions from the changes in announced number of FDI related jobs must be drawn with caution
To continue the catching-up process with more developed economies Poland requires a high rate of investment Investment needs are additionally reinforced by a very limited room for further employment led-growth due to among others unfavourable demographic developments However in the last decade the rate of investment in Poland was below the EU average and far below the levels observed in other CEE countries The key problem is a very low level of private investment in Poland Importantly for the majority of the last decade the
savings rate in Poland has been even lower than the investment rate This constitutes another challenge that should be addressed by the Polish government
The factors outlined above indicate that the Polish economy does need foreign capital inflows preferably in the form of direct investment leading to generating a significant value added This emphasizes the importance of Polandrsquos investment attractiveness and paying attention to factors influencing foreign investorsrsquo decisions
To continue the catching-up process with more developed economies Poland needs to increase its rate of investment which over the last decade has been
well below the level recorded for the majority of CEE countries Despite a low investment rate for the majority of that period the savings rate was even lower though in recent years it has improved somewhat Foreign capital is thus required to finance our countryrsquos investment needs Of particular importance should be foreign direct investments (FDIs) which have greatly contributed to the internationalization of Polish companies and their integration into global value chains since the 1990s Empirical evidence shows that this process
has been associated with an increase in exports transfer of skills and know-how and higher productivity of companies which on average invest more per employee and pay higher wages than non-internationalised enterprises Importantly other domestic firms also benefit from the activity of companies that are exposed to foreign markets which confirms the existence of significant spillover effects To understand the importance of the internationalization of Polish companies one should note that in 2000 ca 20 of value added generated in Poland was driven by external demand but this proportion increased to ca 35 in 2016 The message is even stronger if we realize that majority () of economic growth in Poland in this century has been driven by foreign demand The activity of foreign companies can also alleviate the consequences of economic slowdown For example in 2016 ndash the year
of significant investment contraction by the public and Polish private companies foreign companies continued to increase their capital outlays in Poland Benefits of FDIs make them much needed by countries particularly by catching-up economies which results in harsh competition for FDI inflows EY Polandrsquos Attractiveness Survey should help us to understand which assets foreign investors value most and what are their main concerns Reinforcing strengths and addressing weaknesses of the Polish economy would improve its perception which is one of the preconditions for winning valuable greenfield investment and thereby improving Polandrsquos long-term economic potential
Marek Rozkrut EY Poland Chief Economist Head of Economic Analysis Team
EY Viewpoint
10 Mature leader of the CEE region | EYrsquos Attractiveness Survey Poland
Poland is one of the most attractive destinations in Europe for foreign direct investors
The findings of the EY European Attractiveness Survey indicate that when approximated by the number of announced investment projects Poland seems to be one of the most attractive locations in Europe for foreign direct investors In 2016 international investors announced their intentions to carry out 256 investment projects in Poland compared to 211 projects in 2015 This ranked Poland 5th among European countries in terms of the number of planned projects ndash achieving an
advance from the 6th position (ex aequo with Belgium) in 2015 and the best result since 2008 when Poland also ranked 5th Naturally the number of planned investment projects depends on the local market capacity in particular the availability of labour11 However the fact that Poland regularly stays ahead of economies such as Russia and Turkey in terms of international investment projects proves that Polandrsquos appeal to foreign investors is high
11 It is thus no surprise that Poland ranks higher than smaller economies in the CEE region
Poland is one of the most attractive destinations in Europe for foreign direct investors
Source EY European Investment Monitor (EIM) 2017
2015 2016Percentage Change
(2016 vs 2015
United Kingdom 1065 1144 7
Germany 945 1063 12
France 598 779 30
Spain 248 308 24
Poland 211 256 21
Netherlands 219 207 -5
Russia 201 205 2
Belgium 211 200 -5
Ireland 127 141 11
Turkey 134 138 3
Finland 105 133 27
Romania 98 132 35
Czech Republic 70 110 57
Hungary 94 107 14
Sweden 51 90 76
Italy 55 89 62
Switzerland 90 88 -2
Denmark 63 72 14
Slovakia 54 70 30
Portugal 47 59 26Others 396 454 15Total 5083 5845 15
2015 2016Percentage Change
(2016 vs 2015
United Kingdom 42336 43165 2
Poland 19651 22074 12
Germany 17126 19961 17
Romania 12746 17545 38
France 13639 16980 24
Serbia 10631 16396 54
Russia 13672 15064 10
Czech Republic 9332 14292 53
Spain 7126 12969 82
Hungary 11741 12450 6
Ireland 10772 8535 -21
Slovakia 9564 8308 -13
Turkey 2971 7179 142
Austria 1357 4759 251
Ukraine 850 4547 435
Bulgaria 3598 3959 10
Switzerland 1391 3416 146
Belgium 3168 3309 4
Moldova 1000 3200 220
Italy 1383 2654 92
Others 23612 18911 -20Total 217666 259673 19
Top 20 destination countries by FDI projects Top 20 destination countries by FDI job creation
eycomattractiveness
Mature leader of the CEE region | EYrsquos Attractiveness Survey Poland 11
In 2016 the growth rate of the number of FDI projects located in Poland was higher than in Europe as a whole As a consequence in 2016 Poland was the location of 44 of all FDI projects announced in Europe which indicates the third consecutive year of increase in Polandrsquos share in the total number of foreign projects in Europe
Figure 7 Share of FDI projects in Poland in total FDI projects in Europe
Source EY (2017) European Investment Monitor
Based on data available for 55 of projects international investors planned to create at least 22 thousand new jobs in Poland While the exact counting of jobs is challenging (and the job data coverage is not complete) the increase in announced new jobs by foreign investors in Poland between 2011 and 2016 (over a twofold increase) provides additional evidence that the trend in international investorsrsquo activity in Poland continues to be positive
Relative to other European countries the number of FDI-related jobs announced to be created in Poland in 2016 was the second highest only next to the UK The position of Poland in this ranking has been relatively stable (among top 3 countries) since 2004 with only two exceptions in 2009 and 2011 when the country was beyond the podium
Poland is amongst the top 5 locations in Europe for FDI ndash that is quite an achievement It confirms the prediction of the last survey when investors indicated
that Poland would be the best place to invest just after Germany UK France and the Netherlands It is really promising since the perception has not always been supported by the figures and real investment projectsAt the same time there is a global rivalry and competition for innovative growth We do not measure it yet but in order to be ready for sustainable growth Polish economy needs to have the ability to interact with newest trends like Industry 40 Technological changes will decrease the weight of labor costs in the
site selection processes allowing some comebacks of production to the more expensive locationsWe observe it in a number of areas and Poland is getting ready for this Changes in the law regarding support for innovation enhanced RampD tax relief new support schemes for investments and comprehensive environment for start-ups are all good tools which should attract investors bringing more value added projects to the Polish economy There are many good examples of such projects in manufacturing automotive SSCBPO centers but constant change and benchmarking against other locations is requiredIt all derives from a great desire for growth and belief that FDI contributes to the development of societies and countries In this context Polandrsquos position as a CEE leader is worth underlining since the CEE region itself has improved a lot (+9 pp
vs last year) and regained third position among all regions worldwide ndash just behind Western Europe and North America One needs to remember that it all happens when investors say that only 28 of them are having plans to establish or expand operations in Europe next year It is a fall by 10 pp from 2013Global FDI inflows were down by 13 in 2016 compared to 2015 which means that competition for new projects will not be easier A constantly changing environment supported by technological revolution is creating an environment in which policy makers need to anticipate investorsrsquo expectations and propose solutions in a real time From this perspective challenges of the business and governments are becoming closer than ever
Paweł Tynel EY Poland Head of Grants and Incentives Advisory Services
EY Viewpoint
12 Mature leader of the CEE region | EYrsquos Attractiveness Survey Poland
FDI projects located in Poland fall predominantly into three sectors manufacturing finance amp business services and transport amp communications On average these sectors accounted for 95 of all FDI projects in Poland in 2005-2016 However the share of manufacturing decreased from 81 of all FDI projects in 2005 to 62 in 2016 while finance amp
business services attracts more and more projects ndash from 7 to 28 respectively The share of transport amp communications ranged between 3 and 10 in 2005-2016 Other sectors12 were of rather negligible interest to foreign investors
12 ie agriculture construction education amp health energy recreation retail amp hospitality
Poland attracts investors mainly from Western Europe and the USA
Poland attracts FDI projects mainly from Western Europe and the USA In 2005-2016 on average over 80 of all FDI projects came from these two regions While the importance of Western Europe for FDI in Poland increased in 2016 the share of the USA in total FDI projects launched in Poland fell However there are no clear trends in the origin structure of foreign investors in Poland
Figure 8 Share of FDI projects in Poland by region of origin
Source EY (2017) European Investment Monitor
Table 1 Number of FDI projects in Poland by sectors
2005 2006 2007 2008 2009 2010 2011 2012 2013 2014 2015 2016
Manufacturing 145 106 95 105 72 96 89 89 70 87 117 159
Finance amp Business Services 12 27 31 47 19 35 23 39 27 32 64 72
Transport amp Communications 15 15 11 15 5 8 7 12 4 4 22 15
Retail amp Hospitality 7 5 1 4 3 1 2 4 3 4 7
Construction 3 1 1 1 1 2
Other 1 1 4 7 1 1 3 5 1 6 4 1
Source EY (2017) European Investment Monitor
Poland attracts investors mainly from Western Europe and the USA
eycomattractiveness
Mature leader of the CEE region | EYrsquos Attractiveness Survey Poland 13
The decomposition of international investment projects by activity provides additional insights It reveals that while projects related to manufacturing clearly dominate the structure of foreign investment Poland is becoming a more and more attractive location for support and shared services centers (SSC) to large multinational companies (eg accounting or IT) Indeed in 2016 Poland garnered 38 out of 161 (or 24) SSC projects announced by international investors ranking first among European countries
The activity structure of investment projects announced in Poland is similar to that in the CEE region Two notable exceptions are manufacturing which captures somewhat larger part of investment projects in the CEE (564) than in Poland (465) and shared services centers which in turn attracts a significantly higher proportion of FDI in Poland (145) than in CEE as a whole (56) At the same time there are substantial discrepancies between the activity structure of projects announced in Poland and in Europe as a whole In particular investment
projects announced in Europe concentrated in sales and marketing (459 of all projects) while attracting only 195 projects in Poland By contrast manufacturing projects represented only 263 of the total number of projects in Europe which is much below 465 recorded in Poland
Differences in the sectorial structure of new projects between Poland and Europe as a whole are also reflected in labour-intensity of greenfield FDIs The number of jobs per project in Poland in 2016 (158) was over twice as high as in Europe (72)13 In other words Poland is a host to more labour intensive projects than on average Europe However one may notice that the above ratio in Poland has been in a declining trend suggesting that foreign investment in Poland become more and more capital intensive In addition the number of jobs per project in Poland is lower than the average for the CEE region (189)
13 Only the projects for which data on announced new jobs was available were taken into account in the calculation
Table 2 Number of FDI projects in Poland by activity
2005 2006 2007 2008 2009 2010 2011 2012 2013 2014 2015 2016
Manufacturing 123 79 71 82 59 70 70 65 56 74 86 119
Sales amp Marketing 15 33 41 47 21 29 25 48 18 30 65 50
Shared Services Centre 7 11 5 9 3 7 8 10 5 8 16 38
Logistics 18 14 10 14 8 7 6 7 10 8 20 19
Research amp Development 8 5 10 12 5 12 7 11 12 6 17 19
Headquarters 1 2 2 2 1 1 4
Contact Centre 4 3 3 3 3 1 4 2 4 4 3
Testing amp Servicing 5 7 4 9 1 13 6 3 2 1 2 2
Other 0 0 1 1 0 0 0 0 1 0 1 2
Source EY (2017) European Investment Monitor
14 Mature leader of the CEE region | EYrsquos Attractiveness Survey Poland
Polandrsquos Attractiveness Survey indicating improvement in foreign investment prospects
In 2017 EY for the first time conducted a deepened survey among international investors in order to gain additional insights into their motivations behind establishing operations in Poland As part of Polandrsquos Attractiveness Survey foreign companies both present and non-established in Poland responded to questions regarding their investment plans factors affecting their investment decisions and risks facing Poland
According to the surveyed companies Polandrsquos attractiveness as an investment destination improved slightly in 2016 ndash 29 of respondents indicated that it had improved while 24 of companies claimed that it had deteriorated last year
One may note large differences in the assessment of Polandrsquos attractiveness between representatives of companies which operate in Poland and companies not established in the country In the eyes of the latter the evolution of Polandrsquos attractiveness as an investment destination was better than in the opinion of the former Only 7 of companies which do not conduct operations in Poland indicated that its attractiveness had deteriorated while 32 claimed that it had improved compared to 37 and 26 respectively in the case of companies functioning in Poland
Polandrsquos Attractiveness Survey indicating improvement in foreign investment prospects
Figure 9 To what degree do you think Polandrsquos attractiveness evolved over the last yearwill evolve over the next three years
Source EY (2017) Polandrsquos Attractiveness Survey
eycomattractiveness
Mature leader of the CEE region | EYrsquos Attractiveness Survey Poland 15
Looking ahead 48 of foreign investors expect Polandrsquos attractiveness to improve over the next three years That share is only lower than the respective proportion for top performers Portugal and Netherlands while it exceeds the results obtained for other European countries analysed14
Investorsrsquo expectations regarding Polandrsquos attractiveness turn out to be very polarized While the share of respondents projecting improvement in Polandrsquos attractiveness over the next three years
14 Germany Italy UK France Belgium
is high it is accompanied by a relatively large proportion (20) of investors indicating that it will deteriorate
Irrespective of discrepancies between different groups of foreign investors one should note that expectations of every group considered point to a significant improvement of the investment attractiveness of the Polish economy over the next three years relative to their assessment of the previous year
Mature leader of the CEE region | EYrsquos Attractiveness Survey Poland 15
16 Mature leader of the CEE region | EYrsquos Attractiveness Survey Poland
Figure 10 From the point of view of your company Poland is very fairly little or not at all attractive as a foreign direct investment destination
Source EY (2017) Polandrsquos Attractiveness Survey
Polandrsquos key assetshellip not always recognized
When considering Poland as a potential investment destination foreign investors appreciate in particular the structural advantages of the labour market in Poland Over 70 of surveyed companiesrsquo representatives indicate that Polandrsquos labour skills level the potential for productivity increase and labour costs are very or fairly attractive The same factors are also most frequently listed as Polandrsquos key assets in comparison to other European countries
Foreign companies established in Poland distinguish Polish workersrsquo skills level and the potential for productivity increase as attractive much more frequently than companies not present in Poland indicating these two factors in 94 and 87 of cases respectively
Polandrsquos key assetshellip not always recognized
very attractive + fairly attractive
81
78
74
72
68
65
58
Both the companies which operate in Poland and the firms which have not yet established their presence in the country agree that labour costs are one of Polandrsquos major assets when compared to other European countries However we identified large discrepancies between those two types of investors when it comes to their assessment of Polish labour force skills level and the potential for productivity increase Foreign companies already operating in Poland consider those factors as key assets of Poland relative to other European countries However these advantages are much less frequently recognized by companies which do not function in Poland It may signal the need to put more emphasis on the communication of the strengths outlined above to the companies not yet established in Poland
That need seems to be further reinforced by the findings of EY European Attractiveness Survey indicating that labour skills are among the assets most valued by foreign investors CEE advantages related to low labour costs are depleting Tightening labour markets push international investors to alternative destinations In particular an increasing number of investors chasing their ideal skills and wages combinations have looked south to non-EU members such as Serbia As a consequence competition for foreign investment based on labour costs is becoming tighter and CEE countries must look for new advantages
eycomattractiveness
Mature leader of the CEE region | EYrsquos Attractiveness Survey Poland 17
Figure 11 What are the three key assets of Poland compared to other European Countries
Source EY (2017) Polandrsquos Attractiveness Survey
When asked about the key risks for Poland foreign investors most frequently point to unstable social and regulatory business environment as well as restrictive approach applied by tax authorities Again we find significant discrepancies between different types of investors The risk factors outlined above are much more frequently indicated by the representatives of companies established in Poland than by those that do not operate in the country
Figure 12 According to you what are the three key risks for Poland
Source EY (2017) Polandrsquos Attractiveness Survey
18 Mature leader of the CEE region | EYrsquos Attractiveness Survey Poland
Although the largest share of new investment projects planned in Poland come from the manufacturing sectors foreign investors indicate that the most prospective sectors which could drive Polandrsquos growth in the coming years are professional services including IT services BPO15 shared services as well as logistics Most attractive sectors related to manufacturing automotive industry and consumer goods are the fifth and seventh most frequently selected sectors respectively
Figure 13 In your opinion which business sectors will drive Polandrsquos growth in the coming years (three answers possible)
Source EY (2017) Polandrsquos Attractiveness Survey
15 Business Process Outsourcing including services such as finance accounting human resources contact center
Polandrsquos key assets hellip not always recognizedPolandrsquos key assetshellip not always recognized
eycomattractiveness
Mature leader of the CEE region | EYrsquos Attractiveness Survey Poland 19
The Czech Republic emerges as Polandrsquos main competitor for FDIs
Traditionally Central and Eastern European countries have been competing with Poland for foreign investment The results of the Polandrsquos Attractiveness Survey confirm this common knowledge additionally listing Germany among Polandrsquos main competitors
While the position of the Czech Republic as Polandrsquos main competitor for FDIs may not be that surprising the margin by which it has been ranked ahead of other countries is striking 44 of the surveyed foreign investors indicate the Czech Republic as Polandrsquos main competitor followed by Hungary (15) Germany (15) Romania (13) and Slovakia (10)
The position of the Czech Republic as that of Polandrsquos main competitor for FDIs is shared by every group of investors considered16 Still a higher share of companies established in Poland (50) is of such an opinion than in the case of enterprises not present in Poland (35) Significant differences between these types of investors have also been identified in their perception of Slovakia (15 and 3 respectively) Hungary in turn is indicated as Polandrsquos main competitor more frequently by investors from the USA (28) than by investors from Western Europe (7)
16 Investors were broken down by their establishednot established status region of origin size of their company and sector of their activity In every of the categories considered the Czech Republic was most frequently indicated as Polandrsquos main competitor
Map 1 In your opinion which is Polandrsquos main European competing country in terms of attractiveness
Source EY (2017) Polandrsquos Attractiveness Survey
20 Mature leader of the CEE region | EYrsquos Attractiveness Survey Poland
Methodology
European Attractiveness Survey
The ldquorealrdquo attractiveness of Europe for foreign investors
Our evaluation of the reality of FDI in Europe is based on the EY European Investment Monitor (EIM) EYrsquos proprietary database produced in collaboration with Oxford Intelligence This database tracks those FDI projects that result in the creation of new facilities and new jobs By excluding portfolio investments and MampA it shows the reality of investment in manufacturing and services by foreign companies across the continent
The EIM database focuses on investment announcements the number of new jobs created and where identifiable the associated capital investment Projects are identified through the daily monitoring of more than 10000 news sources To confirm the accuracy of the data collected the research team aims to directly contact more than 70 of the companies undertaking these investments
The following categories of investment projects are excluded from the EIM
bull MampA and joint ventures (unless these result in new facilities or new jobs being created)
bull License agreements
bull Retail and leisure facilities hotels and real estate
bull Utilities (including telecommunications networks airports ports and other fixed infrastructure)
bull Extraction activities (ores minerals and fuels)
bull Portfolio investments (pensions insurance and financial funds)
bull Factory and other production replacement investments (eg replacing old machinery without creating new employment)
bull Not-for-profit organizations (charitable foundations trade associations and government bodies)
The ldquoperceivedrdquo attractiveness of Europe and its competitors for foreign investors
We define the attractiveness of a country or area as the combination of its image investorsrsquo level of confidence in it as an investment destination and the perception of its ability to provide the most competitive benefits for FDI
The research regarding the perceptions of European investment attractiveness was conducted by the CSA Institute in March 2017 via telephone interviews with a representative group of 505 international decision makers
Our sample groups of businesses included representatives from
bull Europe 53
bull North America 29
bull Asia 12
bull Latin America 3
bull Middle East 2
bull Other regions 1
Overall 81 of the 505 companies surveyed have a presence in Europe And of the non-European companies 34 have established operations in Europe
Investment projects by companies in these categories are included in certain instances eg details of a specific new hotel investment or retail outlet would not be recorded but if the hotel or retail company were to establish a headquarters facility or a distribution center this project would qualify for inclusion in the database
Disclaimer FDI jobs data is available for 3596 projects out of 5845 projects (or 61) in 2016
Methodology
eycomattractiveness
Mature leader of the CEE region | EYrsquos Attractiveness Survey Poland 21
Polandrsquos Attractiveness SurveyPolandrsquos Attractiveness Survey was carried out for the first time in 2017 The research consisted of a survey conducted among international investors in which foreign companiesrsquo representatives responded to questions about their plans regarding establishing or expanding their operations in Poland factors shaping Polandrsquos attractiveness as an investment destination and risks that face Poland
The research was conducted by the CSA Institute in March-April 2017 via telephone interviews with a representative group of 208 international decision makers As a whole 58 of the surveyed companies have a presence in Poland
The companyrsquos country of origin in the sample is representative of the investments done in Poland In particular our sample groups of businesses included representatives from
bull Western Europe 48
bull North America 25
bull Asia 19
bull Northern Europe 6
bull Other regions 2
Disclaimer FDI jobs data is available for 140 projects out of 256 projects (or 55) announced in Poland in 2016
Mature leader of the CEE region | EYrsquos Attractiveness Survey Poland 21
EY | Assurance | Tax | Transactions | Advisory
About EY
EY is a global leader in assurance tax transaction and advisory services The insights and quality services we deliver help build trust and confidence in the capital markets and in economies the world over We develop outstanding leaders who team to deliver on our promises to all of our stakeholders In so doing we play a critical role in building a better working world for our people for our clients and for our communities
EY refers to the global organization andor one or more of the member firms of Ernst amp Young Global Limited each of which is a separate legal entity Ernst amp Young Global Limited a UK company limited by guarantee does not provide services to clients
For more information about our organization please visit eycom
copy 2017 EYGM Limited All Rights Reserved
SCORE 00068-162
eycompl

eycomattractiveness
Mature leader of the CEE region | EYrsquos Attractiveness Survey Poland 5
Investors vote ldquoremainrdquo in Europe
EY European Attractiveness Survey (EAS) examines new investment projects mainly greenfield projects announced by international investors The study is based on interviews with high-level executives from around the world and foreign direct investment announcements by companies The latter part is linked to EY European Investment Monitor (EIM) powered by Oxford Intelligence which is the leading database of direct investment across Europe The database tracks those FDI projects that have resulted in the creation of new facilities and new jobs Therefore portfolio investment joint ventures mergers and acquisitions and other investment that do not entail the creation of new jobs (eg replacing old machinery without creating new employment) are excluded
Despite the uncertainty in 2016 Europe attracted a new record high number of FDI projects
For several years Europe has experienced many challenges (incl uncertainty on the future of the EU and the Eurozone in particular) caused by public debt crisis population aging conflicts in the Middle East and migration inflows into Europe tensions between Russia and Ukraine Brexit and populist parties garnering significant minority support in many European countries Despite such an uncertain
1048666business environment and geopolitical risksinvestors continue to see Europe as an attractive investment destination
In 2016 the number of FDI projects directed to Europe increased by 15 in comparison to the previous year Overall 584510486661048666 new internationalinvestment projects were announced According to information gathered for 62 of these announcements the projects located in Europe should create at least 260 thousand10486661048666 new job1048666s4 The majority of FDI in Europe arises from intra-European FDI flows
In 2016 Central and Eastern Europe (CEE)5 maintained its appeal to international investors - the region received 23 of all the FDI projects announced in Europe and 52 in terms of the announced new jobs
4 Information on the number of new jobs is not available for all of the announced investment projects As such the number of new jobs given above constitutes the lower bound of the actual number of new employment related to FDI projects announced in Europe Any conclusions based on the number of planned jobs must also be drawn with caution
5 Central and Eastern Europe encompasses 22 countries Albania Belarus Bosnia and Herzegovina Bulgaria Croatia Cyprus Czech Republic Estonia Hungary Latvia Lithuania Macedonia Moldova Montenegro Poland Romania Russia Serbia Slovakia Slovenia Turkey and Ukraine
Mature leader of the CEE region | EYrsquos Attractiveness Survey Poland 5
6 Mature leader of the CEE region | EYrsquos Attractiveness Survey Poland
Figure 2 Number of FDI projects announced in Europe
Source EY (2017) European Investment Monitor
Europersquos perception in the eyes of international investors is improving Western Europe and CEE are among the worldrsquos top 3 most attractive regions for 53 and 37 of executives respectively This makes Western Europe the top performer while CEE ranks third behind Northern America and level-pegging with China While Western Europe gained 3 pp
compared to 2015 CEE improved by as many as 9 pp That was the biggest increase among all the regions considered in 2016 Interestingly since 2013 the perception of Western Europe and CEE among investors has significantly improved while the attractiveness of BRICS has faded
Figure 3 Perception of most attractive global regions6
Source EY (2017) European Attractiveness Survey
6 Answer to the question ldquoIn general which of the following regions do you think are currently the top 3 most attractive regions in which to establish operationsrdquo (3 answers possible)
Investors vote ldquoremainrdquo in Europe
eycomattractiveness
Mature leader of the CEE region | EYrsquos Attractiveness Survey Poland 7
Europersquos return to steady economic growth deferred
Despite positive developments in terms of the number of announced investment projects and improving perceptions of Europersquos attractiveness investors seem to see the prospect of strong European economic growth receding further into the future In 2015 53 respondents expected Europe to return to steady economic growth within the next three years In 2017 that proportion is down to 42 At the same time the proportion expecting a return to steady economic growth after at least five years increased to 56 (from 45 in 2015)
Also the share of international investors confident that Europe will ever return to stable economic growth decreased from 85 in 2015 to 65 in 2017
The British votersrsquo decision to leave the EU has contributed to investorsrsquo doubts regarding the future economic growth in Europe 20 of international investors declare to have plans to relocate operations if Britain leaves the European single market But many companies do not yet have a comprehensive view of the tax (VAT pre-financing and the exact scope of custom duty) administrative (customs and VAT requirements) and regulatory consequences and have only just started thinking about the possible consequences The impact of Britainrsquos planned exit from the European Union will probably be more visible in next yearrsquos survey
Figure 4 In your view given the current uncertainties in Europe how long before we see a return to steady economic growth and performance in Europe
Source EY (2017) European Attractiveness Survey Sample 332 respondents confident in Europersquos ability to return to a more dynamic economic growth
8 Mature leader of the CEE region | EYrsquos Attractiveness Survey Poland
Poland does need FDIs
Foreign companies play an important role in the Polish economy They contribute a lot to employment wage fund generated value added investments exports and general government revenues Companies with a majority share of foreign capital have in recent years often outperformed Polish public and private business entities thereby being an important driver of the economic growth In particular foreign companies accounted for a vast majority of employment growth in the enterprise
sector in Poland over the 2010-2015 period In 2016 at the time of economic slowdown foreign companies accelerated the growth of generated value added exports and employment significantly alleviating the adverse impact of other factors on the Polish economy Importantly in contrast to Polish private and public companies foreign entities continued to expand their investment activity in 2016 though at a lower rate than in 2015
Figure 5 Gross fixed capital formation in the enterprise sector in Poland by ownership7
Source EY based on Central Statistical Office data
7 Data for 2011-2015 refers to annual growth in gross fixed capital formation (GFCF) of small (10-49 employed persons) medium (49-249 employed persons) and large (over 249 employed persons) enterprises while data for 2016 compares GFCF of medium and large enterprises to their GFCF in 2015 Data excludes information for most companies with unlimited ownerrsquos liability
8 Companies (1) in which at least part of the capital share belongs to the public sector (2) state-owned enterprises or (3) entities without specific legal status (eg some state-owned entities)
9 Companies whose capital is predominantly owned by foreigners (gt50 of shares) and (2) branches of foreign enterprises10 Companies that were defined neither as ldquoforeign companiesrdquo nor as ldquoPolish public sector companiesrdquo
Poland does need FDIs
Polish public sector companies8
Polish private companies10
Foreign companies9
eycomattractiveness
Mature leader of the CEE region | EYrsquos Attractiveness Survey Poland 9
Poland was the only EU country that avoided recession during the global financial crisis in 2007-2009 In terms of cumulative GDP growth in 2008-2016 amounting to 324 Poland ranked 3rd among EU Member States The outstanding performance of the Polish economy has increased its attractiveness as an investment destination
Figure 6 Number of FDI projects and jobs announced in Poland
Source EY (2017) European Investment Monitor Note that the number of new jobs is available only for a certain part of announced investment projects In 2016 55 of announced projects were accompanied by information on planned employment This proportion might change from year to year Hence conclusions from the changes in announced number of FDI related jobs must be drawn with caution
To continue the catching-up process with more developed economies Poland requires a high rate of investment Investment needs are additionally reinforced by a very limited room for further employment led-growth due to among others unfavourable demographic developments However in the last decade the rate of investment in Poland was below the EU average and far below the levels observed in other CEE countries The key problem is a very low level of private investment in Poland Importantly for the majority of the last decade the
savings rate in Poland has been even lower than the investment rate This constitutes another challenge that should be addressed by the Polish government
The factors outlined above indicate that the Polish economy does need foreign capital inflows preferably in the form of direct investment leading to generating a significant value added This emphasizes the importance of Polandrsquos investment attractiveness and paying attention to factors influencing foreign investorsrsquo decisions
To continue the catching-up process with more developed economies Poland needs to increase its rate of investment which over the last decade has been
well below the level recorded for the majority of CEE countries Despite a low investment rate for the majority of that period the savings rate was even lower though in recent years it has improved somewhat Foreign capital is thus required to finance our countryrsquos investment needs Of particular importance should be foreign direct investments (FDIs) which have greatly contributed to the internationalization of Polish companies and their integration into global value chains since the 1990s Empirical evidence shows that this process
has been associated with an increase in exports transfer of skills and know-how and higher productivity of companies which on average invest more per employee and pay higher wages than non-internationalised enterprises Importantly other domestic firms also benefit from the activity of companies that are exposed to foreign markets which confirms the existence of significant spillover effects To understand the importance of the internationalization of Polish companies one should note that in 2000 ca 20 of value added generated in Poland was driven by external demand but this proportion increased to ca 35 in 2016 The message is even stronger if we realize that majority () of economic growth in Poland in this century has been driven by foreign demand The activity of foreign companies can also alleviate the consequences of economic slowdown For example in 2016 ndash the year
of significant investment contraction by the public and Polish private companies foreign companies continued to increase their capital outlays in Poland Benefits of FDIs make them much needed by countries particularly by catching-up economies which results in harsh competition for FDI inflows EY Polandrsquos Attractiveness Survey should help us to understand which assets foreign investors value most and what are their main concerns Reinforcing strengths and addressing weaknesses of the Polish economy would improve its perception which is one of the preconditions for winning valuable greenfield investment and thereby improving Polandrsquos long-term economic potential
Marek Rozkrut EY Poland Chief Economist Head of Economic Analysis Team
EY Viewpoint
10 Mature leader of the CEE region | EYrsquos Attractiveness Survey Poland
Poland is one of the most attractive destinations in Europe for foreign direct investors
The findings of the EY European Attractiveness Survey indicate that when approximated by the number of announced investment projects Poland seems to be one of the most attractive locations in Europe for foreign direct investors In 2016 international investors announced their intentions to carry out 256 investment projects in Poland compared to 211 projects in 2015 This ranked Poland 5th among European countries in terms of the number of planned projects ndash achieving an
advance from the 6th position (ex aequo with Belgium) in 2015 and the best result since 2008 when Poland also ranked 5th Naturally the number of planned investment projects depends on the local market capacity in particular the availability of labour11 However the fact that Poland regularly stays ahead of economies such as Russia and Turkey in terms of international investment projects proves that Polandrsquos appeal to foreign investors is high
11 It is thus no surprise that Poland ranks higher than smaller economies in the CEE region
Poland is one of the most attractive destinations in Europe for foreign direct investors
Source EY European Investment Monitor (EIM) 2017
2015 2016Percentage Change
(2016 vs 2015
United Kingdom 1065 1144 7
Germany 945 1063 12
France 598 779 30
Spain 248 308 24
Poland 211 256 21
Netherlands 219 207 -5
Russia 201 205 2
Belgium 211 200 -5
Ireland 127 141 11
Turkey 134 138 3
Finland 105 133 27
Romania 98 132 35
Czech Republic 70 110 57
Hungary 94 107 14
Sweden 51 90 76
Italy 55 89 62
Switzerland 90 88 -2
Denmark 63 72 14
Slovakia 54 70 30
Portugal 47 59 26Others 396 454 15Total 5083 5845 15
2015 2016Percentage Change
(2016 vs 2015
United Kingdom 42336 43165 2
Poland 19651 22074 12
Germany 17126 19961 17
Romania 12746 17545 38
France 13639 16980 24
Serbia 10631 16396 54
Russia 13672 15064 10
Czech Republic 9332 14292 53
Spain 7126 12969 82
Hungary 11741 12450 6
Ireland 10772 8535 -21
Slovakia 9564 8308 -13
Turkey 2971 7179 142
Austria 1357 4759 251
Ukraine 850 4547 435
Bulgaria 3598 3959 10
Switzerland 1391 3416 146
Belgium 3168 3309 4
Moldova 1000 3200 220
Italy 1383 2654 92
Others 23612 18911 -20Total 217666 259673 19
Top 20 destination countries by FDI projects Top 20 destination countries by FDI job creation
eycomattractiveness
Mature leader of the CEE region | EYrsquos Attractiveness Survey Poland 11
In 2016 the growth rate of the number of FDI projects located in Poland was higher than in Europe as a whole As a consequence in 2016 Poland was the location of 44 of all FDI projects announced in Europe which indicates the third consecutive year of increase in Polandrsquos share in the total number of foreign projects in Europe
Figure 7 Share of FDI projects in Poland in total FDI projects in Europe
Source EY (2017) European Investment Monitor
Based on data available for 55 of projects international investors planned to create at least 22 thousand new jobs in Poland While the exact counting of jobs is challenging (and the job data coverage is not complete) the increase in announced new jobs by foreign investors in Poland between 2011 and 2016 (over a twofold increase) provides additional evidence that the trend in international investorsrsquo activity in Poland continues to be positive
Relative to other European countries the number of FDI-related jobs announced to be created in Poland in 2016 was the second highest only next to the UK The position of Poland in this ranking has been relatively stable (among top 3 countries) since 2004 with only two exceptions in 2009 and 2011 when the country was beyond the podium
Poland is amongst the top 5 locations in Europe for FDI ndash that is quite an achievement It confirms the prediction of the last survey when investors indicated
that Poland would be the best place to invest just after Germany UK France and the Netherlands It is really promising since the perception has not always been supported by the figures and real investment projectsAt the same time there is a global rivalry and competition for innovative growth We do not measure it yet but in order to be ready for sustainable growth Polish economy needs to have the ability to interact with newest trends like Industry 40 Technological changes will decrease the weight of labor costs in the
site selection processes allowing some comebacks of production to the more expensive locationsWe observe it in a number of areas and Poland is getting ready for this Changes in the law regarding support for innovation enhanced RampD tax relief new support schemes for investments and comprehensive environment for start-ups are all good tools which should attract investors bringing more value added projects to the Polish economy There are many good examples of such projects in manufacturing automotive SSCBPO centers but constant change and benchmarking against other locations is requiredIt all derives from a great desire for growth and belief that FDI contributes to the development of societies and countries In this context Polandrsquos position as a CEE leader is worth underlining since the CEE region itself has improved a lot (+9 pp
vs last year) and regained third position among all regions worldwide ndash just behind Western Europe and North America One needs to remember that it all happens when investors say that only 28 of them are having plans to establish or expand operations in Europe next year It is a fall by 10 pp from 2013Global FDI inflows were down by 13 in 2016 compared to 2015 which means that competition for new projects will not be easier A constantly changing environment supported by technological revolution is creating an environment in which policy makers need to anticipate investorsrsquo expectations and propose solutions in a real time From this perspective challenges of the business and governments are becoming closer than ever
Paweł Tynel EY Poland Head of Grants and Incentives Advisory Services
EY Viewpoint
12 Mature leader of the CEE region | EYrsquos Attractiveness Survey Poland
FDI projects located in Poland fall predominantly into three sectors manufacturing finance amp business services and transport amp communications On average these sectors accounted for 95 of all FDI projects in Poland in 2005-2016 However the share of manufacturing decreased from 81 of all FDI projects in 2005 to 62 in 2016 while finance amp
business services attracts more and more projects ndash from 7 to 28 respectively The share of transport amp communications ranged between 3 and 10 in 2005-2016 Other sectors12 were of rather negligible interest to foreign investors
12 ie agriculture construction education amp health energy recreation retail amp hospitality
Poland attracts investors mainly from Western Europe and the USA
Poland attracts FDI projects mainly from Western Europe and the USA In 2005-2016 on average over 80 of all FDI projects came from these two regions While the importance of Western Europe for FDI in Poland increased in 2016 the share of the USA in total FDI projects launched in Poland fell However there are no clear trends in the origin structure of foreign investors in Poland
Figure 8 Share of FDI projects in Poland by region of origin
Source EY (2017) European Investment Monitor
Table 1 Number of FDI projects in Poland by sectors
2005 2006 2007 2008 2009 2010 2011 2012 2013 2014 2015 2016
Manufacturing 145 106 95 105 72 96 89 89 70 87 117 159
Finance amp Business Services 12 27 31 47 19 35 23 39 27 32 64 72
Transport amp Communications 15 15 11 15 5 8 7 12 4 4 22 15
Retail amp Hospitality 7 5 1 4 3 1 2 4 3 4 7
Construction 3 1 1 1 1 2
Other 1 1 4 7 1 1 3 5 1 6 4 1
Source EY (2017) European Investment Monitor
Poland attracts investors mainly from Western Europe and the USA
eycomattractiveness
Mature leader of the CEE region | EYrsquos Attractiveness Survey Poland 13
The decomposition of international investment projects by activity provides additional insights It reveals that while projects related to manufacturing clearly dominate the structure of foreign investment Poland is becoming a more and more attractive location for support and shared services centers (SSC) to large multinational companies (eg accounting or IT) Indeed in 2016 Poland garnered 38 out of 161 (or 24) SSC projects announced by international investors ranking first among European countries
The activity structure of investment projects announced in Poland is similar to that in the CEE region Two notable exceptions are manufacturing which captures somewhat larger part of investment projects in the CEE (564) than in Poland (465) and shared services centers which in turn attracts a significantly higher proportion of FDI in Poland (145) than in CEE as a whole (56) At the same time there are substantial discrepancies between the activity structure of projects announced in Poland and in Europe as a whole In particular investment
projects announced in Europe concentrated in sales and marketing (459 of all projects) while attracting only 195 projects in Poland By contrast manufacturing projects represented only 263 of the total number of projects in Europe which is much below 465 recorded in Poland
Differences in the sectorial structure of new projects between Poland and Europe as a whole are also reflected in labour-intensity of greenfield FDIs The number of jobs per project in Poland in 2016 (158) was over twice as high as in Europe (72)13 In other words Poland is a host to more labour intensive projects than on average Europe However one may notice that the above ratio in Poland has been in a declining trend suggesting that foreign investment in Poland become more and more capital intensive In addition the number of jobs per project in Poland is lower than the average for the CEE region (189)
13 Only the projects for which data on announced new jobs was available were taken into account in the calculation
Table 2 Number of FDI projects in Poland by activity
2005 2006 2007 2008 2009 2010 2011 2012 2013 2014 2015 2016
Manufacturing 123 79 71 82 59 70 70 65 56 74 86 119
Sales amp Marketing 15 33 41 47 21 29 25 48 18 30 65 50
Shared Services Centre 7 11 5 9 3 7 8 10 5 8 16 38
Logistics 18 14 10 14 8 7 6 7 10 8 20 19
Research amp Development 8 5 10 12 5 12 7 11 12 6 17 19
Headquarters 1 2 2 2 1 1 4
Contact Centre 4 3 3 3 3 1 4 2 4 4 3
Testing amp Servicing 5 7 4 9 1 13 6 3 2 1 2 2
Other 0 0 1 1 0 0 0 0 1 0 1 2
Source EY (2017) European Investment Monitor
14 Mature leader of the CEE region | EYrsquos Attractiveness Survey Poland
Polandrsquos Attractiveness Survey indicating improvement in foreign investment prospects
In 2017 EY for the first time conducted a deepened survey among international investors in order to gain additional insights into their motivations behind establishing operations in Poland As part of Polandrsquos Attractiveness Survey foreign companies both present and non-established in Poland responded to questions regarding their investment plans factors affecting their investment decisions and risks facing Poland
According to the surveyed companies Polandrsquos attractiveness as an investment destination improved slightly in 2016 ndash 29 of respondents indicated that it had improved while 24 of companies claimed that it had deteriorated last year
One may note large differences in the assessment of Polandrsquos attractiveness between representatives of companies which operate in Poland and companies not established in the country In the eyes of the latter the evolution of Polandrsquos attractiveness as an investment destination was better than in the opinion of the former Only 7 of companies which do not conduct operations in Poland indicated that its attractiveness had deteriorated while 32 claimed that it had improved compared to 37 and 26 respectively in the case of companies functioning in Poland
Polandrsquos Attractiveness Survey indicating improvement in foreign investment prospects
Figure 9 To what degree do you think Polandrsquos attractiveness evolved over the last yearwill evolve over the next three years
Source EY (2017) Polandrsquos Attractiveness Survey
eycomattractiveness
Mature leader of the CEE region | EYrsquos Attractiveness Survey Poland 15
Looking ahead 48 of foreign investors expect Polandrsquos attractiveness to improve over the next three years That share is only lower than the respective proportion for top performers Portugal and Netherlands while it exceeds the results obtained for other European countries analysed14
Investorsrsquo expectations regarding Polandrsquos attractiveness turn out to be very polarized While the share of respondents projecting improvement in Polandrsquos attractiveness over the next three years
14 Germany Italy UK France Belgium
is high it is accompanied by a relatively large proportion (20) of investors indicating that it will deteriorate
Irrespective of discrepancies between different groups of foreign investors one should note that expectations of every group considered point to a significant improvement of the investment attractiveness of the Polish economy over the next three years relative to their assessment of the previous year
Mature leader of the CEE region | EYrsquos Attractiveness Survey Poland 15
16 Mature leader of the CEE region | EYrsquos Attractiveness Survey Poland
Figure 10 From the point of view of your company Poland is very fairly little or not at all attractive as a foreign direct investment destination
Source EY (2017) Polandrsquos Attractiveness Survey
Polandrsquos key assetshellip not always recognized
When considering Poland as a potential investment destination foreign investors appreciate in particular the structural advantages of the labour market in Poland Over 70 of surveyed companiesrsquo representatives indicate that Polandrsquos labour skills level the potential for productivity increase and labour costs are very or fairly attractive The same factors are also most frequently listed as Polandrsquos key assets in comparison to other European countries
Foreign companies established in Poland distinguish Polish workersrsquo skills level and the potential for productivity increase as attractive much more frequently than companies not present in Poland indicating these two factors in 94 and 87 of cases respectively
Polandrsquos key assetshellip not always recognized
very attractive + fairly attractive
81
78
74
72
68
65
58
Both the companies which operate in Poland and the firms which have not yet established their presence in the country agree that labour costs are one of Polandrsquos major assets when compared to other European countries However we identified large discrepancies between those two types of investors when it comes to their assessment of Polish labour force skills level and the potential for productivity increase Foreign companies already operating in Poland consider those factors as key assets of Poland relative to other European countries However these advantages are much less frequently recognized by companies which do not function in Poland It may signal the need to put more emphasis on the communication of the strengths outlined above to the companies not yet established in Poland
That need seems to be further reinforced by the findings of EY European Attractiveness Survey indicating that labour skills are among the assets most valued by foreign investors CEE advantages related to low labour costs are depleting Tightening labour markets push international investors to alternative destinations In particular an increasing number of investors chasing their ideal skills and wages combinations have looked south to non-EU members such as Serbia As a consequence competition for foreign investment based on labour costs is becoming tighter and CEE countries must look for new advantages
eycomattractiveness
Mature leader of the CEE region | EYrsquos Attractiveness Survey Poland 17
Figure 11 What are the three key assets of Poland compared to other European Countries
Source EY (2017) Polandrsquos Attractiveness Survey
When asked about the key risks for Poland foreign investors most frequently point to unstable social and regulatory business environment as well as restrictive approach applied by tax authorities Again we find significant discrepancies between different types of investors The risk factors outlined above are much more frequently indicated by the representatives of companies established in Poland than by those that do not operate in the country
Figure 12 According to you what are the three key risks for Poland
Source EY (2017) Polandrsquos Attractiveness Survey
18 Mature leader of the CEE region | EYrsquos Attractiveness Survey Poland
Although the largest share of new investment projects planned in Poland come from the manufacturing sectors foreign investors indicate that the most prospective sectors which could drive Polandrsquos growth in the coming years are professional services including IT services BPO15 shared services as well as logistics Most attractive sectors related to manufacturing automotive industry and consumer goods are the fifth and seventh most frequently selected sectors respectively
Figure 13 In your opinion which business sectors will drive Polandrsquos growth in the coming years (three answers possible)
Source EY (2017) Polandrsquos Attractiveness Survey
15 Business Process Outsourcing including services such as finance accounting human resources contact center
Polandrsquos key assets hellip not always recognizedPolandrsquos key assetshellip not always recognized
eycomattractiveness
Mature leader of the CEE region | EYrsquos Attractiveness Survey Poland 19
The Czech Republic emerges as Polandrsquos main competitor for FDIs
Traditionally Central and Eastern European countries have been competing with Poland for foreign investment The results of the Polandrsquos Attractiveness Survey confirm this common knowledge additionally listing Germany among Polandrsquos main competitors
While the position of the Czech Republic as Polandrsquos main competitor for FDIs may not be that surprising the margin by which it has been ranked ahead of other countries is striking 44 of the surveyed foreign investors indicate the Czech Republic as Polandrsquos main competitor followed by Hungary (15) Germany (15) Romania (13) and Slovakia (10)
The position of the Czech Republic as that of Polandrsquos main competitor for FDIs is shared by every group of investors considered16 Still a higher share of companies established in Poland (50) is of such an opinion than in the case of enterprises not present in Poland (35) Significant differences between these types of investors have also been identified in their perception of Slovakia (15 and 3 respectively) Hungary in turn is indicated as Polandrsquos main competitor more frequently by investors from the USA (28) than by investors from Western Europe (7)
16 Investors were broken down by their establishednot established status region of origin size of their company and sector of their activity In every of the categories considered the Czech Republic was most frequently indicated as Polandrsquos main competitor
Map 1 In your opinion which is Polandrsquos main European competing country in terms of attractiveness
Source EY (2017) Polandrsquos Attractiveness Survey
20 Mature leader of the CEE region | EYrsquos Attractiveness Survey Poland
Methodology
European Attractiveness Survey
The ldquorealrdquo attractiveness of Europe for foreign investors
Our evaluation of the reality of FDI in Europe is based on the EY European Investment Monitor (EIM) EYrsquos proprietary database produced in collaboration with Oxford Intelligence This database tracks those FDI projects that result in the creation of new facilities and new jobs By excluding portfolio investments and MampA it shows the reality of investment in manufacturing and services by foreign companies across the continent
The EIM database focuses on investment announcements the number of new jobs created and where identifiable the associated capital investment Projects are identified through the daily monitoring of more than 10000 news sources To confirm the accuracy of the data collected the research team aims to directly contact more than 70 of the companies undertaking these investments
The following categories of investment projects are excluded from the EIM
bull MampA and joint ventures (unless these result in new facilities or new jobs being created)
bull License agreements
bull Retail and leisure facilities hotels and real estate
bull Utilities (including telecommunications networks airports ports and other fixed infrastructure)
bull Extraction activities (ores minerals and fuels)
bull Portfolio investments (pensions insurance and financial funds)
bull Factory and other production replacement investments (eg replacing old machinery without creating new employment)
bull Not-for-profit organizations (charitable foundations trade associations and government bodies)
The ldquoperceivedrdquo attractiveness of Europe and its competitors for foreign investors
We define the attractiveness of a country or area as the combination of its image investorsrsquo level of confidence in it as an investment destination and the perception of its ability to provide the most competitive benefits for FDI
The research regarding the perceptions of European investment attractiveness was conducted by the CSA Institute in March 2017 via telephone interviews with a representative group of 505 international decision makers
Our sample groups of businesses included representatives from
bull Europe 53
bull North America 29
bull Asia 12
bull Latin America 3
bull Middle East 2
bull Other regions 1
Overall 81 of the 505 companies surveyed have a presence in Europe And of the non-European companies 34 have established operations in Europe
Investment projects by companies in these categories are included in certain instances eg details of a specific new hotel investment or retail outlet would not be recorded but if the hotel or retail company were to establish a headquarters facility or a distribution center this project would qualify for inclusion in the database
Disclaimer FDI jobs data is available for 3596 projects out of 5845 projects (or 61) in 2016
Methodology
eycomattractiveness
Mature leader of the CEE region | EYrsquos Attractiveness Survey Poland 21
Polandrsquos Attractiveness SurveyPolandrsquos Attractiveness Survey was carried out for the first time in 2017 The research consisted of a survey conducted among international investors in which foreign companiesrsquo representatives responded to questions about their plans regarding establishing or expanding their operations in Poland factors shaping Polandrsquos attractiveness as an investment destination and risks that face Poland
The research was conducted by the CSA Institute in March-April 2017 via telephone interviews with a representative group of 208 international decision makers As a whole 58 of the surveyed companies have a presence in Poland
The companyrsquos country of origin in the sample is representative of the investments done in Poland In particular our sample groups of businesses included representatives from
bull Western Europe 48
bull North America 25
bull Asia 19
bull Northern Europe 6
bull Other regions 2
Disclaimer FDI jobs data is available for 140 projects out of 256 projects (or 55) announced in Poland in 2016
Mature leader of the CEE region | EYrsquos Attractiveness Survey Poland 21
EY | Assurance | Tax | Transactions | Advisory
About EY
EY is a global leader in assurance tax transaction and advisory services The insights and quality services we deliver help build trust and confidence in the capital markets and in economies the world over We develop outstanding leaders who team to deliver on our promises to all of our stakeholders In so doing we play a critical role in building a better working world for our people for our clients and for our communities
EY refers to the global organization andor one or more of the member firms of Ernst amp Young Global Limited each of which is a separate legal entity Ernst amp Young Global Limited a UK company limited by guarantee does not provide services to clients
For more information about our organization please visit eycom
copy 2017 EYGM Limited All Rights Reserved
SCORE 00068-162
eycompl

eycomattractiveness
Mature leader of the CEE region | EYrsquos Attractiveness Survey Poland 7
Europersquos return to steady economic growth deferred
Despite positive developments in terms of the number of announced investment projects and improving perceptions of Europersquos attractiveness investors seem to see the prospect of strong European economic growth receding further into the future In 2015 53 respondents expected Europe to return to steady economic growth within the next three years In 2017 that proportion is down to 42 At the same time the proportion expecting a return to steady economic growth after at least five years increased to 56 (from 45 in 2015)
Also the share of international investors confident that Europe will ever return to stable economic growth decreased from 85 in 2015 to 65 in 2017
The British votersrsquo decision to leave the EU has contributed to investorsrsquo doubts regarding the future economic growth in Europe 20 of international investors declare to have plans to relocate operations if Britain leaves the European single market But many companies do not yet have a comprehensive view of the tax (VAT pre-financing and the exact scope of custom duty) administrative (customs and VAT requirements) and regulatory consequences and have only just started thinking about the possible consequences The impact of Britainrsquos planned exit from the European Union will probably be more visible in next yearrsquos survey
Figure 4 In your view given the current uncertainties in Europe how long before we see a return to steady economic growth and performance in Europe
Source EY (2017) European Attractiveness Survey Sample 332 respondents confident in Europersquos ability to return to a more dynamic economic growth
8 Mature leader of the CEE region | EYrsquos Attractiveness Survey Poland
Poland does need FDIs
Foreign companies play an important role in the Polish economy They contribute a lot to employment wage fund generated value added investments exports and general government revenues Companies with a majority share of foreign capital have in recent years often outperformed Polish public and private business entities thereby being an important driver of the economic growth In particular foreign companies accounted for a vast majority of employment growth in the enterprise
sector in Poland over the 2010-2015 period In 2016 at the time of economic slowdown foreign companies accelerated the growth of generated value added exports and employment significantly alleviating the adverse impact of other factors on the Polish economy Importantly in contrast to Polish private and public companies foreign entities continued to expand their investment activity in 2016 though at a lower rate than in 2015
Figure 5 Gross fixed capital formation in the enterprise sector in Poland by ownership7
Source EY based on Central Statistical Office data
7 Data for 2011-2015 refers to annual growth in gross fixed capital formation (GFCF) of small (10-49 employed persons) medium (49-249 employed persons) and large (over 249 employed persons) enterprises while data for 2016 compares GFCF of medium and large enterprises to their GFCF in 2015 Data excludes information for most companies with unlimited ownerrsquos liability
8 Companies (1) in which at least part of the capital share belongs to the public sector (2) state-owned enterprises or (3) entities without specific legal status (eg some state-owned entities)
9 Companies whose capital is predominantly owned by foreigners (gt50 of shares) and (2) branches of foreign enterprises10 Companies that were defined neither as ldquoforeign companiesrdquo nor as ldquoPolish public sector companiesrdquo
Poland does need FDIs
Polish public sector companies8
Polish private companies10
Foreign companies9
eycomattractiveness
Mature leader of the CEE region | EYrsquos Attractiveness Survey Poland 9
Poland was the only EU country that avoided recession during the global financial crisis in 2007-2009 In terms of cumulative GDP growth in 2008-2016 amounting to 324 Poland ranked 3rd among EU Member States The outstanding performance of the Polish economy has increased its attractiveness as an investment destination
Figure 6 Number of FDI projects and jobs announced in Poland
Source EY (2017) European Investment Monitor Note that the number of new jobs is available only for a certain part of announced investment projects In 2016 55 of announced projects were accompanied by information on planned employment This proportion might change from year to year Hence conclusions from the changes in announced number of FDI related jobs must be drawn with caution
To continue the catching-up process with more developed economies Poland requires a high rate of investment Investment needs are additionally reinforced by a very limited room for further employment led-growth due to among others unfavourable demographic developments However in the last decade the rate of investment in Poland was below the EU average and far below the levels observed in other CEE countries The key problem is a very low level of private investment in Poland Importantly for the majority of the last decade the
savings rate in Poland has been even lower than the investment rate This constitutes another challenge that should be addressed by the Polish government
The factors outlined above indicate that the Polish economy does need foreign capital inflows preferably in the form of direct investment leading to generating a significant value added This emphasizes the importance of Polandrsquos investment attractiveness and paying attention to factors influencing foreign investorsrsquo decisions
To continue the catching-up process with more developed economies Poland needs to increase its rate of investment which over the last decade has been
well below the level recorded for the majority of CEE countries Despite a low investment rate for the majority of that period the savings rate was even lower though in recent years it has improved somewhat Foreign capital is thus required to finance our countryrsquos investment needs Of particular importance should be foreign direct investments (FDIs) which have greatly contributed to the internationalization of Polish companies and their integration into global value chains since the 1990s Empirical evidence shows that this process
has been associated with an increase in exports transfer of skills and know-how and higher productivity of companies which on average invest more per employee and pay higher wages than non-internationalised enterprises Importantly other domestic firms also benefit from the activity of companies that are exposed to foreign markets which confirms the existence of significant spillover effects To understand the importance of the internationalization of Polish companies one should note that in 2000 ca 20 of value added generated in Poland was driven by external demand but this proportion increased to ca 35 in 2016 The message is even stronger if we realize that majority () of economic growth in Poland in this century has been driven by foreign demand The activity of foreign companies can also alleviate the consequences of economic slowdown For example in 2016 ndash the year
of significant investment contraction by the public and Polish private companies foreign companies continued to increase their capital outlays in Poland Benefits of FDIs make them much needed by countries particularly by catching-up economies which results in harsh competition for FDI inflows EY Polandrsquos Attractiveness Survey should help us to understand which assets foreign investors value most and what are their main concerns Reinforcing strengths and addressing weaknesses of the Polish economy would improve its perception which is one of the preconditions for winning valuable greenfield investment and thereby improving Polandrsquos long-term economic potential
Marek Rozkrut EY Poland Chief Economist Head of Economic Analysis Team
EY Viewpoint
10 Mature leader of the CEE region | EYrsquos Attractiveness Survey Poland
Poland is one of the most attractive destinations in Europe for foreign direct investors
The findings of the EY European Attractiveness Survey indicate that when approximated by the number of announced investment projects Poland seems to be one of the most attractive locations in Europe for foreign direct investors In 2016 international investors announced their intentions to carry out 256 investment projects in Poland compared to 211 projects in 2015 This ranked Poland 5th among European countries in terms of the number of planned projects ndash achieving an
advance from the 6th position (ex aequo with Belgium) in 2015 and the best result since 2008 when Poland also ranked 5th Naturally the number of planned investment projects depends on the local market capacity in particular the availability of labour11 However the fact that Poland regularly stays ahead of economies such as Russia and Turkey in terms of international investment projects proves that Polandrsquos appeal to foreign investors is high
11 It is thus no surprise that Poland ranks higher than smaller economies in the CEE region
Poland is one of the most attractive destinations in Europe for foreign direct investors
Source EY European Investment Monitor (EIM) 2017
2015 2016Percentage Change
(2016 vs 2015
United Kingdom 1065 1144 7
Germany 945 1063 12
France 598 779 30
Spain 248 308 24
Poland 211 256 21
Netherlands 219 207 -5
Russia 201 205 2
Belgium 211 200 -5
Ireland 127 141 11
Turkey 134 138 3
Finland 105 133 27
Romania 98 132 35
Czech Republic 70 110 57
Hungary 94 107 14
Sweden 51 90 76
Italy 55 89 62
Switzerland 90 88 -2
Denmark 63 72 14
Slovakia 54 70 30
Portugal 47 59 26Others 396 454 15Total 5083 5845 15
2015 2016Percentage Change
(2016 vs 2015
United Kingdom 42336 43165 2
Poland 19651 22074 12
Germany 17126 19961 17
Romania 12746 17545 38
France 13639 16980 24
Serbia 10631 16396 54
Russia 13672 15064 10
Czech Republic 9332 14292 53
Spain 7126 12969 82
Hungary 11741 12450 6
Ireland 10772 8535 -21
Slovakia 9564 8308 -13
Turkey 2971 7179 142
Austria 1357 4759 251
Ukraine 850 4547 435
Bulgaria 3598 3959 10
Switzerland 1391 3416 146
Belgium 3168 3309 4
Moldova 1000 3200 220
Italy 1383 2654 92
Others 23612 18911 -20Total 217666 259673 19
Top 20 destination countries by FDI projects Top 20 destination countries by FDI job creation
eycomattractiveness
Mature leader of the CEE region | EYrsquos Attractiveness Survey Poland 11
In 2016 the growth rate of the number of FDI projects located in Poland was higher than in Europe as a whole As a consequence in 2016 Poland was the location of 44 of all FDI projects announced in Europe which indicates the third consecutive year of increase in Polandrsquos share in the total number of foreign projects in Europe
Figure 7 Share of FDI projects in Poland in total FDI projects in Europe
Source EY (2017) European Investment Monitor
Based on data available for 55 of projects international investors planned to create at least 22 thousand new jobs in Poland While the exact counting of jobs is challenging (and the job data coverage is not complete) the increase in announced new jobs by foreign investors in Poland between 2011 and 2016 (over a twofold increase) provides additional evidence that the trend in international investorsrsquo activity in Poland continues to be positive
Relative to other European countries the number of FDI-related jobs announced to be created in Poland in 2016 was the second highest only next to the UK The position of Poland in this ranking has been relatively stable (among top 3 countries) since 2004 with only two exceptions in 2009 and 2011 when the country was beyond the podium
Poland is amongst the top 5 locations in Europe for FDI ndash that is quite an achievement It confirms the prediction of the last survey when investors indicated
that Poland would be the best place to invest just after Germany UK France and the Netherlands It is really promising since the perception has not always been supported by the figures and real investment projectsAt the same time there is a global rivalry and competition for innovative growth We do not measure it yet but in order to be ready for sustainable growth Polish economy needs to have the ability to interact with newest trends like Industry 40 Technological changes will decrease the weight of labor costs in the
site selection processes allowing some comebacks of production to the more expensive locationsWe observe it in a number of areas and Poland is getting ready for this Changes in the law regarding support for innovation enhanced RampD tax relief new support schemes for investments and comprehensive environment for start-ups are all good tools which should attract investors bringing more value added projects to the Polish economy There are many good examples of such projects in manufacturing automotive SSCBPO centers but constant change and benchmarking against other locations is requiredIt all derives from a great desire for growth and belief that FDI contributes to the development of societies and countries In this context Polandrsquos position as a CEE leader is worth underlining since the CEE region itself has improved a lot (+9 pp
vs last year) and regained third position among all regions worldwide ndash just behind Western Europe and North America One needs to remember that it all happens when investors say that only 28 of them are having plans to establish or expand operations in Europe next year It is a fall by 10 pp from 2013Global FDI inflows were down by 13 in 2016 compared to 2015 which means that competition for new projects will not be easier A constantly changing environment supported by technological revolution is creating an environment in which policy makers need to anticipate investorsrsquo expectations and propose solutions in a real time From this perspective challenges of the business and governments are becoming closer than ever
Paweł Tynel EY Poland Head of Grants and Incentives Advisory Services
EY Viewpoint
12 Mature leader of the CEE region | EYrsquos Attractiveness Survey Poland
FDI projects located in Poland fall predominantly into three sectors manufacturing finance amp business services and transport amp communications On average these sectors accounted for 95 of all FDI projects in Poland in 2005-2016 However the share of manufacturing decreased from 81 of all FDI projects in 2005 to 62 in 2016 while finance amp
business services attracts more and more projects ndash from 7 to 28 respectively The share of transport amp communications ranged between 3 and 10 in 2005-2016 Other sectors12 were of rather negligible interest to foreign investors
12 ie agriculture construction education amp health energy recreation retail amp hospitality
Poland attracts investors mainly from Western Europe and the USA
Poland attracts FDI projects mainly from Western Europe and the USA In 2005-2016 on average over 80 of all FDI projects came from these two regions While the importance of Western Europe for FDI in Poland increased in 2016 the share of the USA in total FDI projects launched in Poland fell However there are no clear trends in the origin structure of foreign investors in Poland
Figure 8 Share of FDI projects in Poland by region of origin
Source EY (2017) European Investment Monitor
Table 1 Number of FDI projects in Poland by sectors
2005 2006 2007 2008 2009 2010 2011 2012 2013 2014 2015 2016
Manufacturing 145 106 95 105 72 96 89 89 70 87 117 159
Finance amp Business Services 12 27 31 47 19 35 23 39 27 32 64 72
Transport amp Communications 15 15 11 15 5 8 7 12 4 4 22 15
Retail amp Hospitality 7 5 1 4 3 1 2 4 3 4 7
Construction 3 1 1 1 1 2
Other 1 1 4 7 1 1 3 5 1 6 4 1
Source EY (2017) European Investment Monitor
Poland attracts investors mainly from Western Europe and the USA
eycomattractiveness
Mature leader of the CEE region | EYrsquos Attractiveness Survey Poland 13
The decomposition of international investment projects by activity provides additional insights It reveals that while projects related to manufacturing clearly dominate the structure of foreign investment Poland is becoming a more and more attractive location for support and shared services centers (SSC) to large multinational companies (eg accounting or IT) Indeed in 2016 Poland garnered 38 out of 161 (or 24) SSC projects announced by international investors ranking first among European countries
The activity structure of investment projects announced in Poland is similar to that in the CEE region Two notable exceptions are manufacturing which captures somewhat larger part of investment projects in the CEE (564) than in Poland (465) and shared services centers which in turn attracts a significantly higher proportion of FDI in Poland (145) than in CEE as a whole (56) At the same time there are substantial discrepancies between the activity structure of projects announced in Poland and in Europe as a whole In particular investment
projects announced in Europe concentrated in sales and marketing (459 of all projects) while attracting only 195 projects in Poland By contrast manufacturing projects represented only 263 of the total number of projects in Europe which is much below 465 recorded in Poland
Differences in the sectorial structure of new projects between Poland and Europe as a whole are also reflected in labour-intensity of greenfield FDIs The number of jobs per project in Poland in 2016 (158) was over twice as high as in Europe (72)13 In other words Poland is a host to more labour intensive projects than on average Europe However one may notice that the above ratio in Poland has been in a declining trend suggesting that foreign investment in Poland become more and more capital intensive In addition the number of jobs per project in Poland is lower than the average for the CEE region (189)
13 Only the projects for which data on announced new jobs was available were taken into account in the calculation
Table 2 Number of FDI projects in Poland by activity
2005 2006 2007 2008 2009 2010 2011 2012 2013 2014 2015 2016
Manufacturing 123 79 71 82 59 70 70 65 56 74 86 119
Sales amp Marketing 15 33 41 47 21 29 25 48 18 30 65 50
Shared Services Centre 7 11 5 9 3 7 8 10 5 8 16 38
Logistics 18 14 10 14 8 7 6 7 10 8 20 19
Research amp Development 8 5 10 12 5 12 7 11 12 6 17 19
Headquarters 1 2 2 2 1 1 4
Contact Centre 4 3 3 3 3 1 4 2 4 4 3
Testing amp Servicing 5 7 4 9 1 13 6 3 2 1 2 2
Other 0 0 1 1 0 0 0 0 1 0 1 2
Source EY (2017) European Investment Monitor
14 Mature leader of the CEE region | EYrsquos Attractiveness Survey Poland
Polandrsquos Attractiveness Survey indicating improvement in foreign investment prospects
In 2017 EY for the first time conducted a deepened survey among international investors in order to gain additional insights into their motivations behind establishing operations in Poland As part of Polandrsquos Attractiveness Survey foreign companies both present and non-established in Poland responded to questions regarding their investment plans factors affecting their investment decisions and risks facing Poland
According to the surveyed companies Polandrsquos attractiveness as an investment destination improved slightly in 2016 ndash 29 of respondents indicated that it had improved while 24 of companies claimed that it had deteriorated last year
One may note large differences in the assessment of Polandrsquos attractiveness between representatives of companies which operate in Poland and companies not established in the country In the eyes of the latter the evolution of Polandrsquos attractiveness as an investment destination was better than in the opinion of the former Only 7 of companies which do not conduct operations in Poland indicated that its attractiveness had deteriorated while 32 claimed that it had improved compared to 37 and 26 respectively in the case of companies functioning in Poland
Polandrsquos Attractiveness Survey indicating improvement in foreign investment prospects
Figure 9 To what degree do you think Polandrsquos attractiveness evolved over the last yearwill evolve over the next three years
Source EY (2017) Polandrsquos Attractiveness Survey
eycomattractiveness
Mature leader of the CEE region | EYrsquos Attractiveness Survey Poland 15
Looking ahead 48 of foreign investors expect Polandrsquos attractiveness to improve over the next three years That share is only lower than the respective proportion for top performers Portugal and Netherlands while it exceeds the results obtained for other European countries analysed14
Investorsrsquo expectations regarding Polandrsquos attractiveness turn out to be very polarized While the share of respondents projecting improvement in Polandrsquos attractiveness over the next three years
14 Germany Italy UK France Belgium
is high it is accompanied by a relatively large proportion (20) of investors indicating that it will deteriorate
Irrespective of discrepancies between different groups of foreign investors one should note that expectations of every group considered point to a significant improvement of the investment attractiveness of the Polish economy over the next three years relative to their assessment of the previous year
Mature leader of the CEE region | EYrsquos Attractiveness Survey Poland 15
16 Mature leader of the CEE region | EYrsquos Attractiveness Survey Poland
Figure 10 From the point of view of your company Poland is very fairly little or not at all attractive as a foreign direct investment destination
Source EY (2017) Polandrsquos Attractiveness Survey
Polandrsquos key assetshellip not always recognized
When considering Poland as a potential investment destination foreign investors appreciate in particular the structural advantages of the labour market in Poland Over 70 of surveyed companiesrsquo representatives indicate that Polandrsquos labour skills level the potential for productivity increase and labour costs are very or fairly attractive The same factors are also most frequently listed as Polandrsquos key assets in comparison to other European countries
Foreign companies established in Poland distinguish Polish workersrsquo skills level and the potential for productivity increase as attractive much more frequently than companies not present in Poland indicating these two factors in 94 and 87 of cases respectively
Polandrsquos key assetshellip not always recognized
very attractive + fairly attractive
81
78
74
72
68
65
58
Both the companies which operate in Poland and the firms which have not yet established their presence in the country agree that labour costs are one of Polandrsquos major assets when compared to other European countries However we identified large discrepancies between those two types of investors when it comes to their assessment of Polish labour force skills level and the potential for productivity increase Foreign companies already operating in Poland consider those factors as key assets of Poland relative to other European countries However these advantages are much less frequently recognized by companies which do not function in Poland It may signal the need to put more emphasis on the communication of the strengths outlined above to the companies not yet established in Poland
That need seems to be further reinforced by the findings of EY European Attractiveness Survey indicating that labour skills are among the assets most valued by foreign investors CEE advantages related to low labour costs are depleting Tightening labour markets push international investors to alternative destinations In particular an increasing number of investors chasing their ideal skills and wages combinations have looked south to non-EU members such as Serbia As a consequence competition for foreign investment based on labour costs is becoming tighter and CEE countries must look for new advantages
eycomattractiveness
Mature leader of the CEE region | EYrsquos Attractiveness Survey Poland 17
Figure 11 What are the three key assets of Poland compared to other European Countries
Source EY (2017) Polandrsquos Attractiveness Survey
When asked about the key risks for Poland foreign investors most frequently point to unstable social and regulatory business environment as well as restrictive approach applied by tax authorities Again we find significant discrepancies between different types of investors The risk factors outlined above are much more frequently indicated by the representatives of companies established in Poland than by those that do not operate in the country
Figure 12 According to you what are the three key risks for Poland
Source EY (2017) Polandrsquos Attractiveness Survey
18 Mature leader of the CEE region | EYrsquos Attractiveness Survey Poland
Although the largest share of new investment projects planned in Poland come from the manufacturing sectors foreign investors indicate that the most prospective sectors which could drive Polandrsquos growth in the coming years are professional services including IT services BPO15 shared services as well as logistics Most attractive sectors related to manufacturing automotive industry and consumer goods are the fifth and seventh most frequently selected sectors respectively
Figure 13 In your opinion which business sectors will drive Polandrsquos growth in the coming years (three answers possible)
Source EY (2017) Polandrsquos Attractiveness Survey
15 Business Process Outsourcing including services such as finance accounting human resources contact center
Polandrsquos key assets hellip not always recognizedPolandrsquos key assetshellip not always recognized
eycomattractiveness
Mature leader of the CEE region | EYrsquos Attractiveness Survey Poland 19
The Czech Republic emerges as Polandrsquos main competitor for FDIs
Traditionally Central and Eastern European countries have been competing with Poland for foreign investment The results of the Polandrsquos Attractiveness Survey confirm this common knowledge additionally listing Germany among Polandrsquos main competitors
While the position of the Czech Republic as Polandrsquos main competitor for FDIs may not be that surprising the margin by which it has been ranked ahead of other countries is striking 44 of the surveyed foreign investors indicate the Czech Republic as Polandrsquos main competitor followed by Hungary (15) Germany (15) Romania (13) and Slovakia (10)
The position of the Czech Republic as that of Polandrsquos main competitor for FDIs is shared by every group of investors considered16 Still a higher share of companies established in Poland (50) is of such an opinion than in the case of enterprises not present in Poland (35) Significant differences between these types of investors have also been identified in their perception of Slovakia (15 and 3 respectively) Hungary in turn is indicated as Polandrsquos main competitor more frequently by investors from the USA (28) than by investors from Western Europe (7)
16 Investors were broken down by their establishednot established status region of origin size of their company and sector of their activity In every of the categories considered the Czech Republic was most frequently indicated as Polandrsquos main competitor
Map 1 In your opinion which is Polandrsquos main European competing country in terms of attractiveness
Source EY (2017) Polandrsquos Attractiveness Survey
20 Mature leader of the CEE region | EYrsquos Attractiveness Survey Poland
Methodology
European Attractiveness Survey
The ldquorealrdquo attractiveness of Europe for foreign investors
Our evaluation of the reality of FDI in Europe is based on the EY European Investment Monitor (EIM) EYrsquos proprietary database produced in collaboration with Oxford Intelligence This database tracks those FDI projects that result in the creation of new facilities and new jobs By excluding portfolio investments and MampA it shows the reality of investment in manufacturing and services by foreign companies across the continent
The EIM database focuses on investment announcements the number of new jobs created and where identifiable the associated capital investment Projects are identified through the daily monitoring of more than 10000 news sources To confirm the accuracy of the data collected the research team aims to directly contact more than 70 of the companies undertaking these investments
The following categories of investment projects are excluded from the EIM
bull MampA and joint ventures (unless these result in new facilities or new jobs being created)
bull License agreements
bull Retail and leisure facilities hotels and real estate
bull Utilities (including telecommunications networks airports ports and other fixed infrastructure)
bull Extraction activities (ores minerals and fuels)
bull Portfolio investments (pensions insurance and financial funds)
bull Factory and other production replacement investments (eg replacing old machinery without creating new employment)
bull Not-for-profit organizations (charitable foundations trade associations and government bodies)
The ldquoperceivedrdquo attractiveness of Europe and its competitors for foreign investors
We define the attractiveness of a country or area as the combination of its image investorsrsquo level of confidence in it as an investment destination and the perception of its ability to provide the most competitive benefits for FDI
The research regarding the perceptions of European investment attractiveness was conducted by the CSA Institute in March 2017 via telephone interviews with a representative group of 505 international decision makers
Our sample groups of businesses included representatives from
bull Europe 53
bull North America 29
bull Asia 12
bull Latin America 3
bull Middle East 2
bull Other regions 1
Overall 81 of the 505 companies surveyed have a presence in Europe And of the non-European companies 34 have established operations in Europe
Investment projects by companies in these categories are included in certain instances eg details of a specific new hotel investment or retail outlet would not be recorded but if the hotel or retail company were to establish a headquarters facility or a distribution center this project would qualify for inclusion in the database
Disclaimer FDI jobs data is available for 3596 projects out of 5845 projects (or 61) in 2016
Methodology
eycomattractiveness
Mature leader of the CEE region | EYrsquos Attractiveness Survey Poland 21
Polandrsquos Attractiveness SurveyPolandrsquos Attractiveness Survey was carried out for the first time in 2017 The research consisted of a survey conducted among international investors in which foreign companiesrsquo representatives responded to questions about their plans regarding establishing or expanding their operations in Poland factors shaping Polandrsquos attractiveness as an investment destination and risks that face Poland
The research was conducted by the CSA Institute in March-April 2017 via telephone interviews with a representative group of 208 international decision makers As a whole 58 of the surveyed companies have a presence in Poland
The companyrsquos country of origin in the sample is representative of the investments done in Poland In particular our sample groups of businesses included representatives from
bull Western Europe 48
bull North America 25
bull Asia 19
bull Northern Europe 6
bull Other regions 2
Disclaimer FDI jobs data is available for 140 projects out of 256 projects (or 55) announced in Poland in 2016
Mature leader of the CEE region | EYrsquos Attractiveness Survey Poland 21
EY | Assurance | Tax | Transactions | Advisory
About EY
EY is a global leader in assurance tax transaction and advisory services The insights and quality services we deliver help build trust and confidence in the capital markets and in economies the world over We develop outstanding leaders who team to deliver on our promises to all of our stakeholders In so doing we play a critical role in building a better working world for our people for our clients and for our communities
EY refers to the global organization andor one or more of the member firms of Ernst amp Young Global Limited each of which is a separate legal entity Ernst amp Young Global Limited a UK company limited by guarantee does not provide services to clients
For more information about our organization please visit eycom
copy 2017 EYGM Limited All Rights Reserved
SCORE 00068-162
eycompl

eycomattractiveness
Mature leader of the CEE region | EYrsquos Attractiveness Survey Poland 9
Poland was the only EU country that avoided recession during the global financial crisis in 2007-2009 In terms of cumulative GDP growth in 2008-2016 amounting to 324 Poland ranked 3rd among EU Member States The outstanding performance of the Polish economy has increased its attractiveness as an investment destination
Figure 6 Number of FDI projects and jobs announced in Poland
Source EY (2017) European Investment Monitor Note that the number of new jobs is available only for a certain part of announced investment projects In 2016 55 of announced projects were accompanied by information on planned employment This proportion might change from year to year Hence conclusions from the changes in announced number of FDI related jobs must be drawn with caution
To continue the catching-up process with more developed economies Poland requires a high rate of investment Investment needs are additionally reinforced by a very limited room for further employment led-growth due to among others unfavourable demographic developments However in the last decade the rate of investment in Poland was below the EU average and far below the levels observed in other CEE countries The key problem is a very low level of private investment in Poland Importantly for the majority of the last decade the
savings rate in Poland has been even lower than the investment rate This constitutes another challenge that should be addressed by the Polish government
The factors outlined above indicate that the Polish economy does need foreign capital inflows preferably in the form of direct investment leading to generating a significant value added This emphasizes the importance of Polandrsquos investment attractiveness and paying attention to factors influencing foreign investorsrsquo decisions
To continue the catching-up process with more developed economies Poland needs to increase its rate of investment which over the last decade has been
well below the level recorded for the majority of CEE countries Despite a low investment rate for the majority of that period the savings rate was even lower though in recent years it has improved somewhat Foreign capital is thus required to finance our countryrsquos investment needs Of particular importance should be foreign direct investments (FDIs) which have greatly contributed to the internationalization of Polish companies and their integration into global value chains since the 1990s Empirical evidence shows that this process
has been associated with an increase in exports transfer of skills and know-how and higher productivity of companies which on average invest more per employee and pay higher wages than non-internationalised enterprises Importantly other domestic firms also benefit from the activity of companies that are exposed to foreign markets which confirms the existence of significant spillover effects To understand the importance of the internationalization of Polish companies one should note that in 2000 ca 20 of value added generated in Poland was driven by external demand but this proportion increased to ca 35 in 2016 The message is even stronger if we realize that majority () of economic growth in Poland in this century has been driven by foreign demand The activity of foreign companies can also alleviate the consequences of economic slowdown For example in 2016 ndash the year
of significant investment contraction by the public and Polish private companies foreign companies continued to increase their capital outlays in Poland Benefits of FDIs make them much needed by countries particularly by catching-up economies which results in harsh competition for FDI inflows EY Polandrsquos Attractiveness Survey should help us to understand which assets foreign investors value most and what are their main concerns Reinforcing strengths and addressing weaknesses of the Polish economy would improve its perception which is one of the preconditions for winning valuable greenfield investment and thereby improving Polandrsquos long-term economic potential
Marek Rozkrut EY Poland Chief Economist Head of Economic Analysis Team
EY Viewpoint
10 Mature leader of the CEE region | EYrsquos Attractiveness Survey Poland
Poland is one of the most attractive destinations in Europe for foreign direct investors
The findings of the EY European Attractiveness Survey indicate that when approximated by the number of announced investment projects Poland seems to be one of the most attractive locations in Europe for foreign direct investors In 2016 international investors announced their intentions to carry out 256 investment projects in Poland compared to 211 projects in 2015 This ranked Poland 5th among European countries in terms of the number of planned projects ndash achieving an
advance from the 6th position (ex aequo with Belgium) in 2015 and the best result since 2008 when Poland also ranked 5th Naturally the number of planned investment projects depends on the local market capacity in particular the availability of labour11 However the fact that Poland regularly stays ahead of economies such as Russia and Turkey in terms of international investment projects proves that Polandrsquos appeal to foreign investors is high
11 It is thus no surprise that Poland ranks higher than smaller economies in the CEE region
Poland is one of the most attractive destinations in Europe for foreign direct investors
Source EY European Investment Monitor (EIM) 2017
2015 2016Percentage Change
(2016 vs 2015
United Kingdom 1065 1144 7
Germany 945 1063 12
France 598 779 30
Spain 248 308 24
Poland 211 256 21
Netherlands 219 207 -5
Russia 201 205 2
Belgium 211 200 -5
Ireland 127 141 11
Turkey 134 138 3
Finland 105 133 27
Romania 98 132 35
Czech Republic 70 110 57
Hungary 94 107 14
Sweden 51 90 76
Italy 55 89 62
Switzerland 90 88 -2
Denmark 63 72 14
Slovakia 54 70 30
Portugal 47 59 26Others 396 454 15Total 5083 5845 15
2015 2016Percentage Change
(2016 vs 2015
United Kingdom 42336 43165 2
Poland 19651 22074 12
Germany 17126 19961 17
Romania 12746 17545 38
France 13639 16980 24
Serbia 10631 16396 54
Russia 13672 15064 10
Czech Republic 9332 14292 53
Spain 7126 12969 82
Hungary 11741 12450 6
Ireland 10772 8535 -21
Slovakia 9564 8308 -13
Turkey 2971 7179 142
Austria 1357 4759 251
Ukraine 850 4547 435
Bulgaria 3598 3959 10
Switzerland 1391 3416 146
Belgium 3168 3309 4
Moldova 1000 3200 220
Italy 1383 2654 92
Others 23612 18911 -20Total 217666 259673 19
Top 20 destination countries by FDI projects Top 20 destination countries by FDI job creation
eycomattractiveness
Mature leader of the CEE region | EYrsquos Attractiveness Survey Poland 11
In 2016 the growth rate of the number of FDI projects located in Poland was higher than in Europe as a whole As a consequence in 2016 Poland was the location of 44 of all FDI projects announced in Europe which indicates the third consecutive year of increase in Polandrsquos share in the total number of foreign projects in Europe
Figure 7 Share of FDI projects in Poland in total FDI projects in Europe
Source EY (2017) European Investment Monitor
Based on data available for 55 of projects international investors planned to create at least 22 thousand new jobs in Poland While the exact counting of jobs is challenging (and the job data coverage is not complete) the increase in announced new jobs by foreign investors in Poland between 2011 and 2016 (over a twofold increase) provides additional evidence that the trend in international investorsrsquo activity in Poland continues to be positive
Relative to other European countries the number of FDI-related jobs announced to be created in Poland in 2016 was the second highest only next to the UK The position of Poland in this ranking has been relatively stable (among top 3 countries) since 2004 with only two exceptions in 2009 and 2011 when the country was beyond the podium
Poland is amongst the top 5 locations in Europe for FDI ndash that is quite an achievement It confirms the prediction of the last survey when investors indicated
that Poland would be the best place to invest just after Germany UK France and the Netherlands It is really promising since the perception has not always been supported by the figures and real investment projectsAt the same time there is a global rivalry and competition for innovative growth We do not measure it yet but in order to be ready for sustainable growth Polish economy needs to have the ability to interact with newest trends like Industry 40 Technological changes will decrease the weight of labor costs in the
site selection processes allowing some comebacks of production to the more expensive locationsWe observe it in a number of areas and Poland is getting ready for this Changes in the law regarding support for innovation enhanced RampD tax relief new support schemes for investments and comprehensive environment for start-ups are all good tools which should attract investors bringing more value added projects to the Polish economy There are many good examples of such projects in manufacturing automotive SSCBPO centers but constant change and benchmarking against other locations is requiredIt all derives from a great desire for growth and belief that FDI contributes to the development of societies and countries In this context Polandrsquos position as a CEE leader is worth underlining since the CEE region itself has improved a lot (+9 pp
vs last year) and regained third position among all regions worldwide ndash just behind Western Europe and North America One needs to remember that it all happens when investors say that only 28 of them are having plans to establish or expand operations in Europe next year It is a fall by 10 pp from 2013Global FDI inflows were down by 13 in 2016 compared to 2015 which means that competition for new projects will not be easier A constantly changing environment supported by technological revolution is creating an environment in which policy makers need to anticipate investorsrsquo expectations and propose solutions in a real time From this perspective challenges of the business and governments are becoming closer than ever
Paweł Tynel EY Poland Head of Grants and Incentives Advisory Services
EY Viewpoint
12 Mature leader of the CEE region | EYrsquos Attractiveness Survey Poland
FDI projects located in Poland fall predominantly into three sectors manufacturing finance amp business services and transport amp communications On average these sectors accounted for 95 of all FDI projects in Poland in 2005-2016 However the share of manufacturing decreased from 81 of all FDI projects in 2005 to 62 in 2016 while finance amp
business services attracts more and more projects ndash from 7 to 28 respectively The share of transport amp communications ranged between 3 and 10 in 2005-2016 Other sectors12 were of rather negligible interest to foreign investors
12 ie agriculture construction education amp health energy recreation retail amp hospitality
Poland attracts investors mainly from Western Europe and the USA
Poland attracts FDI projects mainly from Western Europe and the USA In 2005-2016 on average over 80 of all FDI projects came from these two regions While the importance of Western Europe for FDI in Poland increased in 2016 the share of the USA in total FDI projects launched in Poland fell However there are no clear trends in the origin structure of foreign investors in Poland
Figure 8 Share of FDI projects in Poland by region of origin
Source EY (2017) European Investment Monitor
Table 1 Number of FDI projects in Poland by sectors
2005 2006 2007 2008 2009 2010 2011 2012 2013 2014 2015 2016
Manufacturing 145 106 95 105 72 96 89 89 70 87 117 159
Finance amp Business Services 12 27 31 47 19 35 23 39 27 32 64 72
Transport amp Communications 15 15 11 15 5 8 7 12 4 4 22 15
Retail amp Hospitality 7 5 1 4 3 1 2 4 3 4 7
Construction 3 1 1 1 1 2
Other 1 1 4 7 1 1 3 5 1 6 4 1
Source EY (2017) European Investment Monitor
Poland attracts investors mainly from Western Europe and the USA
eycomattractiveness
Mature leader of the CEE region | EYrsquos Attractiveness Survey Poland 13
The decomposition of international investment projects by activity provides additional insights It reveals that while projects related to manufacturing clearly dominate the structure of foreign investment Poland is becoming a more and more attractive location for support and shared services centers (SSC) to large multinational companies (eg accounting or IT) Indeed in 2016 Poland garnered 38 out of 161 (or 24) SSC projects announced by international investors ranking first among European countries
The activity structure of investment projects announced in Poland is similar to that in the CEE region Two notable exceptions are manufacturing which captures somewhat larger part of investment projects in the CEE (564) than in Poland (465) and shared services centers which in turn attracts a significantly higher proportion of FDI in Poland (145) than in CEE as a whole (56) At the same time there are substantial discrepancies between the activity structure of projects announced in Poland and in Europe as a whole In particular investment
projects announced in Europe concentrated in sales and marketing (459 of all projects) while attracting only 195 projects in Poland By contrast manufacturing projects represented only 263 of the total number of projects in Europe which is much below 465 recorded in Poland
Differences in the sectorial structure of new projects between Poland and Europe as a whole are also reflected in labour-intensity of greenfield FDIs The number of jobs per project in Poland in 2016 (158) was over twice as high as in Europe (72)13 In other words Poland is a host to more labour intensive projects than on average Europe However one may notice that the above ratio in Poland has been in a declining trend suggesting that foreign investment in Poland become more and more capital intensive In addition the number of jobs per project in Poland is lower than the average for the CEE region (189)
13 Only the projects for which data on announced new jobs was available were taken into account in the calculation
Table 2 Number of FDI projects in Poland by activity
2005 2006 2007 2008 2009 2010 2011 2012 2013 2014 2015 2016
Manufacturing 123 79 71 82 59 70 70 65 56 74 86 119
Sales amp Marketing 15 33 41 47 21 29 25 48 18 30 65 50
Shared Services Centre 7 11 5 9 3 7 8 10 5 8 16 38
Logistics 18 14 10 14 8 7 6 7 10 8 20 19
Research amp Development 8 5 10 12 5 12 7 11 12 6 17 19
Headquarters 1 2 2 2 1 1 4
Contact Centre 4 3 3 3 3 1 4 2 4 4 3
Testing amp Servicing 5 7 4 9 1 13 6 3 2 1 2 2
Other 0 0 1 1 0 0 0 0 1 0 1 2
Source EY (2017) European Investment Monitor
14 Mature leader of the CEE region | EYrsquos Attractiveness Survey Poland
Polandrsquos Attractiveness Survey indicating improvement in foreign investment prospects
In 2017 EY for the first time conducted a deepened survey among international investors in order to gain additional insights into their motivations behind establishing operations in Poland As part of Polandrsquos Attractiveness Survey foreign companies both present and non-established in Poland responded to questions regarding their investment plans factors affecting their investment decisions and risks facing Poland
According to the surveyed companies Polandrsquos attractiveness as an investment destination improved slightly in 2016 ndash 29 of respondents indicated that it had improved while 24 of companies claimed that it had deteriorated last year
One may note large differences in the assessment of Polandrsquos attractiveness between representatives of companies which operate in Poland and companies not established in the country In the eyes of the latter the evolution of Polandrsquos attractiveness as an investment destination was better than in the opinion of the former Only 7 of companies which do not conduct operations in Poland indicated that its attractiveness had deteriorated while 32 claimed that it had improved compared to 37 and 26 respectively in the case of companies functioning in Poland
Polandrsquos Attractiveness Survey indicating improvement in foreign investment prospects
Figure 9 To what degree do you think Polandrsquos attractiveness evolved over the last yearwill evolve over the next three years
Source EY (2017) Polandrsquos Attractiveness Survey
eycomattractiveness
Mature leader of the CEE region | EYrsquos Attractiveness Survey Poland 15
Looking ahead 48 of foreign investors expect Polandrsquos attractiveness to improve over the next three years That share is only lower than the respective proportion for top performers Portugal and Netherlands while it exceeds the results obtained for other European countries analysed14
Investorsrsquo expectations regarding Polandrsquos attractiveness turn out to be very polarized While the share of respondents projecting improvement in Polandrsquos attractiveness over the next three years
14 Germany Italy UK France Belgium
is high it is accompanied by a relatively large proportion (20) of investors indicating that it will deteriorate
Irrespective of discrepancies between different groups of foreign investors one should note that expectations of every group considered point to a significant improvement of the investment attractiveness of the Polish economy over the next three years relative to their assessment of the previous year
Mature leader of the CEE region | EYrsquos Attractiveness Survey Poland 15
16 Mature leader of the CEE region | EYrsquos Attractiveness Survey Poland
Figure 10 From the point of view of your company Poland is very fairly little or not at all attractive as a foreign direct investment destination
Source EY (2017) Polandrsquos Attractiveness Survey
Polandrsquos key assetshellip not always recognized
When considering Poland as a potential investment destination foreign investors appreciate in particular the structural advantages of the labour market in Poland Over 70 of surveyed companiesrsquo representatives indicate that Polandrsquos labour skills level the potential for productivity increase and labour costs are very or fairly attractive The same factors are also most frequently listed as Polandrsquos key assets in comparison to other European countries
Foreign companies established in Poland distinguish Polish workersrsquo skills level and the potential for productivity increase as attractive much more frequently than companies not present in Poland indicating these two factors in 94 and 87 of cases respectively
Polandrsquos key assetshellip not always recognized
very attractive + fairly attractive
81
78
74
72
68
65
58
Both the companies which operate in Poland and the firms which have not yet established their presence in the country agree that labour costs are one of Polandrsquos major assets when compared to other European countries However we identified large discrepancies between those two types of investors when it comes to their assessment of Polish labour force skills level and the potential for productivity increase Foreign companies already operating in Poland consider those factors as key assets of Poland relative to other European countries However these advantages are much less frequently recognized by companies which do not function in Poland It may signal the need to put more emphasis on the communication of the strengths outlined above to the companies not yet established in Poland
That need seems to be further reinforced by the findings of EY European Attractiveness Survey indicating that labour skills are among the assets most valued by foreign investors CEE advantages related to low labour costs are depleting Tightening labour markets push international investors to alternative destinations In particular an increasing number of investors chasing their ideal skills and wages combinations have looked south to non-EU members such as Serbia As a consequence competition for foreign investment based on labour costs is becoming tighter and CEE countries must look for new advantages
eycomattractiveness
Mature leader of the CEE region | EYrsquos Attractiveness Survey Poland 17
Figure 11 What are the three key assets of Poland compared to other European Countries
Source EY (2017) Polandrsquos Attractiveness Survey
When asked about the key risks for Poland foreign investors most frequently point to unstable social and regulatory business environment as well as restrictive approach applied by tax authorities Again we find significant discrepancies between different types of investors The risk factors outlined above are much more frequently indicated by the representatives of companies established in Poland than by those that do not operate in the country
Figure 12 According to you what are the three key risks for Poland
Source EY (2017) Polandrsquos Attractiveness Survey
18 Mature leader of the CEE region | EYrsquos Attractiveness Survey Poland
Although the largest share of new investment projects planned in Poland come from the manufacturing sectors foreign investors indicate that the most prospective sectors which could drive Polandrsquos growth in the coming years are professional services including IT services BPO15 shared services as well as logistics Most attractive sectors related to manufacturing automotive industry and consumer goods are the fifth and seventh most frequently selected sectors respectively
Figure 13 In your opinion which business sectors will drive Polandrsquos growth in the coming years (three answers possible)
Source EY (2017) Polandrsquos Attractiveness Survey
15 Business Process Outsourcing including services such as finance accounting human resources contact center
Polandrsquos key assets hellip not always recognizedPolandrsquos key assetshellip not always recognized
eycomattractiveness
Mature leader of the CEE region | EYrsquos Attractiveness Survey Poland 19
The Czech Republic emerges as Polandrsquos main competitor for FDIs
Traditionally Central and Eastern European countries have been competing with Poland for foreign investment The results of the Polandrsquos Attractiveness Survey confirm this common knowledge additionally listing Germany among Polandrsquos main competitors
While the position of the Czech Republic as Polandrsquos main competitor for FDIs may not be that surprising the margin by which it has been ranked ahead of other countries is striking 44 of the surveyed foreign investors indicate the Czech Republic as Polandrsquos main competitor followed by Hungary (15) Germany (15) Romania (13) and Slovakia (10)
The position of the Czech Republic as that of Polandrsquos main competitor for FDIs is shared by every group of investors considered16 Still a higher share of companies established in Poland (50) is of such an opinion than in the case of enterprises not present in Poland (35) Significant differences between these types of investors have also been identified in their perception of Slovakia (15 and 3 respectively) Hungary in turn is indicated as Polandrsquos main competitor more frequently by investors from the USA (28) than by investors from Western Europe (7)
16 Investors were broken down by their establishednot established status region of origin size of their company and sector of their activity In every of the categories considered the Czech Republic was most frequently indicated as Polandrsquos main competitor
Map 1 In your opinion which is Polandrsquos main European competing country in terms of attractiveness
Source EY (2017) Polandrsquos Attractiveness Survey
20 Mature leader of the CEE region | EYrsquos Attractiveness Survey Poland
Methodology
European Attractiveness Survey
The ldquorealrdquo attractiveness of Europe for foreign investors
Our evaluation of the reality of FDI in Europe is based on the EY European Investment Monitor (EIM) EYrsquos proprietary database produced in collaboration with Oxford Intelligence This database tracks those FDI projects that result in the creation of new facilities and new jobs By excluding portfolio investments and MampA it shows the reality of investment in manufacturing and services by foreign companies across the continent
The EIM database focuses on investment announcements the number of new jobs created and where identifiable the associated capital investment Projects are identified through the daily monitoring of more than 10000 news sources To confirm the accuracy of the data collected the research team aims to directly contact more than 70 of the companies undertaking these investments
The following categories of investment projects are excluded from the EIM
bull MampA and joint ventures (unless these result in new facilities or new jobs being created)
bull License agreements
bull Retail and leisure facilities hotels and real estate
bull Utilities (including telecommunications networks airports ports and other fixed infrastructure)
bull Extraction activities (ores minerals and fuels)
bull Portfolio investments (pensions insurance and financial funds)
bull Factory and other production replacement investments (eg replacing old machinery without creating new employment)
bull Not-for-profit organizations (charitable foundations trade associations and government bodies)
The ldquoperceivedrdquo attractiveness of Europe and its competitors for foreign investors
We define the attractiveness of a country or area as the combination of its image investorsrsquo level of confidence in it as an investment destination and the perception of its ability to provide the most competitive benefits for FDI
The research regarding the perceptions of European investment attractiveness was conducted by the CSA Institute in March 2017 via telephone interviews with a representative group of 505 international decision makers
Our sample groups of businesses included representatives from
bull Europe 53
bull North America 29
bull Asia 12
bull Latin America 3
bull Middle East 2
bull Other regions 1
Overall 81 of the 505 companies surveyed have a presence in Europe And of the non-European companies 34 have established operations in Europe
Investment projects by companies in these categories are included in certain instances eg details of a specific new hotel investment or retail outlet would not be recorded but if the hotel or retail company were to establish a headquarters facility or a distribution center this project would qualify for inclusion in the database
Disclaimer FDI jobs data is available for 3596 projects out of 5845 projects (or 61) in 2016
Methodology
eycomattractiveness
Mature leader of the CEE region | EYrsquos Attractiveness Survey Poland 21
Polandrsquos Attractiveness SurveyPolandrsquos Attractiveness Survey was carried out for the first time in 2017 The research consisted of a survey conducted among international investors in which foreign companiesrsquo representatives responded to questions about their plans regarding establishing or expanding their operations in Poland factors shaping Polandrsquos attractiveness as an investment destination and risks that face Poland
The research was conducted by the CSA Institute in March-April 2017 via telephone interviews with a representative group of 208 international decision makers As a whole 58 of the surveyed companies have a presence in Poland
The companyrsquos country of origin in the sample is representative of the investments done in Poland In particular our sample groups of businesses included representatives from
bull Western Europe 48
bull North America 25
bull Asia 19
bull Northern Europe 6
bull Other regions 2
Disclaimer FDI jobs data is available for 140 projects out of 256 projects (or 55) announced in Poland in 2016
Mature leader of the CEE region | EYrsquos Attractiveness Survey Poland 21
EY | Assurance | Tax | Transactions | Advisory
About EY
EY is a global leader in assurance tax transaction and advisory services The insights and quality services we deliver help build trust and confidence in the capital markets and in economies the world over We develop outstanding leaders who team to deliver on our promises to all of our stakeholders In so doing we play a critical role in building a better working world for our people for our clients and for our communities
EY refers to the global organization andor one or more of the member firms of Ernst amp Young Global Limited each of which is a separate legal entity Ernst amp Young Global Limited a UK company limited by guarantee does not provide services to clients
For more information about our organization please visit eycom
copy 2017 EYGM Limited All Rights Reserved
SCORE 00068-162
eycompl
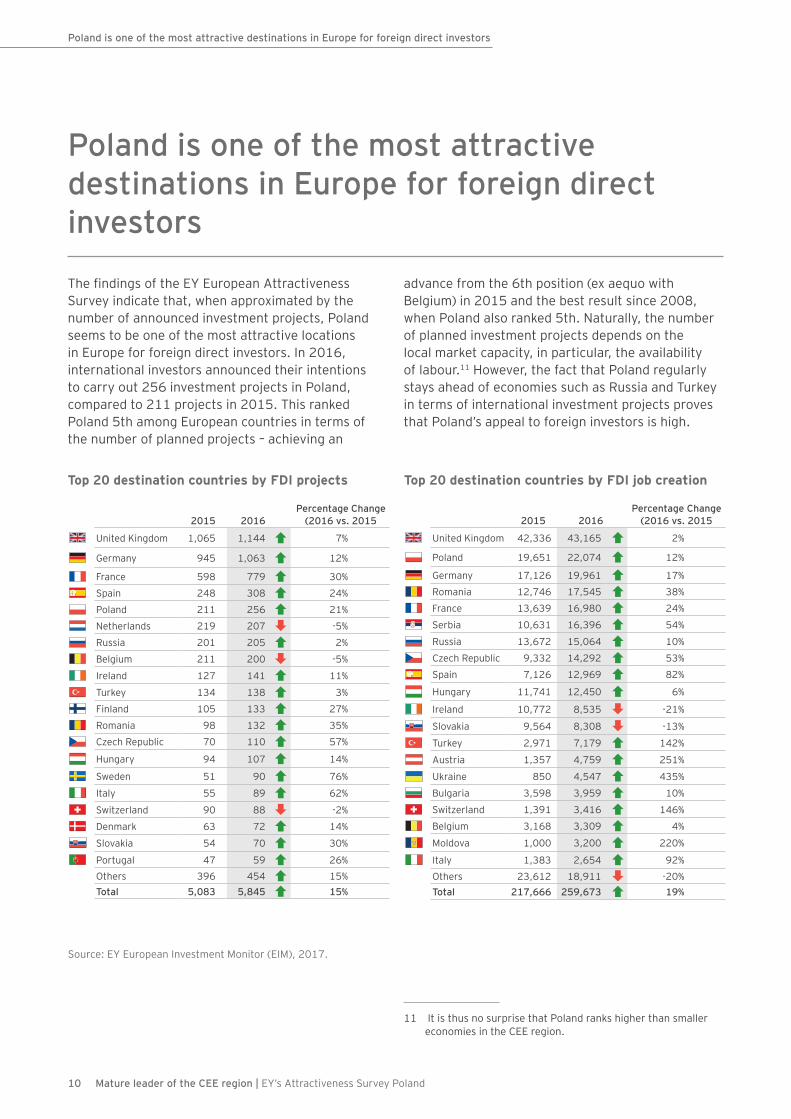

eycomattractiveness
Mature leader of the CEE region | EYrsquos Attractiveness Survey Poland 11
In 2016 the growth rate of the number of FDI projects located in Poland was higher than in Europe as a whole As a consequence in 2016 Poland was the location of 44 of all FDI projects announced in Europe which indicates the third consecutive year of increase in Polandrsquos share in the total number of foreign projects in Europe
Figure 7 Share of FDI projects in Poland in total FDI projects in Europe
Source EY (2017) European Investment Monitor
Based on data available for 55 of projects international investors planned to create at least 22 thousand new jobs in Poland While the exact counting of jobs is challenging (and the job data coverage is not complete) the increase in announced new jobs by foreign investors in Poland between 2011 and 2016 (over a twofold increase) provides additional evidence that the trend in international investorsrsquo activity in Poland continues to be positive
Relative to other European countries the number of FDI-related jobs announced to be created in Poland in 2016 was the second highest only next to the UK The position of Poland in this ranking has been relatively stable (among top 3 countries) since 2004 with only two exceptions in 2009 and 2011 when the country was beyond the podium
Poland is amongst the top 5 locations in Europe for FDI ndash that is quite an achievement It confirms the prediction of the last survey when investors indicated
that Poland would be the best place to invest just after Germany UK France and the Netherlands It is really promising since the perception has not always been supported by the figures and real investment projectsAt the same time there is a global rivalry and competition for innovative growth We do not measure it yet but in order to be ready for sustainable growth Polish economy needs to have the ability to interact with newest trends like Industry 40 Technological changes will decrease the weight of labor costs in the
site selection processes allowing some comebacks of production to the more expensive locationsWe observe it in a number of areas and Poland is getting ready for this Changes in the law regarding support for innovation enhanced RampD tax relief new support schemes for investments and comprehensive environment for start-ups are all good tools which should attract investors bringing more value added projects to the Polish economy There are many good examples of such projects in manufacturing automotive SSCBPO centers but constant change and benchmarking against other locations is requiredIt all derives from a great desire for growth and belief that FDI contributes to the development of societies and countries In this context Polandrsquos position as a CEE leader is worth underlining since the CEE region itself has improved a lot (+9 pp
vs last year) and regained third position among all regions worldwide ndash just behind Western Europe and North America One needs to remember that it all happens when investors say that only 28 of them are having plans to establish or expand operations in Europe next year It is a fall by 10 pp from 2013Global FDI inflows were down by 13 in 2016 compared to 2015 which means that competition for new projects will not be easier A constantly changing environment supported by technological revolution is creating an environment in which policy makers need to anticipate investorsrsquo expectations and propose solutions in a real time From this perspective challenges of the business and governments are becoming closer than ever
Paweł Tynel EY Poland Head of Grants and Incentives Advisory Services
EY Viewpoint
12 Mature leader of the CEE region | EYrsquos Attractiveness Survey Poland
FDI projects located in Poland fall predominantly into three sectors manufacturing finance amp business services and transport amp communications On average these sectors accounted for 95 of all FDI projects in Poland in 2005-2016 However the share of manufacturing decreased from 81 of all FDI projects in 2005 to 62 in 2016 while finance amp
business services attracts more and more projects ndash from 7 to 28 respectively The share of transport amp communications ranged between 3 and 10 in 2005-2016 Other sectors12 were of rather negligible interest to foreign investors
12 ie agriculture construction education amp health energy recreation retail amp hospitality
Poland attracts investors mainly from Western Europe and the USA
Poland attracts FDI projects mainly from Western Europe and the USA In 2005-2016 on average over 80 of all FDI projects came from these two regions While the importance of Western Europe for FDI in Poland increased in 2016 the share of the USA in total FDI projects launched in Poland fell However there are no clear trends in the origin structure of foreign investors in Poland
Figure 8 Share of FDI projects in Poland by region of origin
Source EY (2017) European Investment Monitor
Table 1 Number of FDI projects in Poland by sectors
2005 2006 2007 2008 2009 2010 2011 2012 2013 2014 2015 2016
Manufacturing 145 106 95 105 72 96 89 89 70 87 117 159
Finance amp Business Services 12 27 31 47 19 35 23 39 27 32 64 72
Transport amp Communications 15 15 11 15 5 8 7 12 4 4 22 15
Retail amp Hospitality 7 5 1 4 3 1 2 4 3 4 7
Construction 3 1 1 1 1 2
Other 1 1 4 7 1 1 3 5 1 6 4 1
Source EY (2017) European Investment Monitor
Poland attracts investors mainly from Western Europe and the USA
eycomattractiveness
Mature leader of the CEE region | EYrsquos Attractiveness Survey Poland 13
The decomposition of international investment projects by activity provides additional insights It reveals that while projects related to manufacturing clearly dominate the structure of foreign investment Poland is becoming a more and more attractive location for support and shared services centers (SSC) to large multinational companies (eg accounting or IT) Indeed in 2016 Poland garnered 38 out of 161 (or 24) SSC projects announced by international investors ranking first among European countries
The activity structure of investment projects announced in Poland is similar to that in the CEE region Two notable exceptions are manufacturing which captures somewhat larger part of investment projects in the CEE (564) than in Poland (465) and shared services centers which in turn attracts a significantly higher proportion of FDI in Poland (145) than in CEE as a whole (56) At the same time there are substantial discrepancies between the activity structure of projects announced in Poland and in Europe as a whole In particular investment
projects announced in Europe concentrated in sales and marketing (459 of all projects) while attracting only 195 projects in Poland By contrast manufacturing projects represented only 263 of the total number of projects in Europe which is much below 465 recorded in Poland
Differences in the sectorial structure of new projects between Poland and Europe as a whole are also reflected in labour-intensity of greenfield FDIs The number of jobs per project in Poland in 2016 (158) was over twice as high as in Europe (72)13 In other words Poland is a host to more labour intensive projects than on average Europe However one may notice that the above ratio in Poland has been in a declining trend suggesting that foreign investment in Poland become more and more capital intensive In addition the number of jobs per project in Poland is lower than the average for the CEE region (189)
13 Only the projects for which data on announced new jobs was available were taken into account in the calculation
Table 2 Number of FDI projects in Poland by activity
2005 2006 2007 2008 2009 2010 2011 2012 2013 2014 2015 2016
Manufacturing 123 79 71 82 59 70 70 65 56 74 86 119
Sales amp Marketing 15 33 41 47 21 29 25 48 18 30 65 50
Shared Services Centre 7 11 5 9 3 7 8 10 5 8 16 38
Logistics 18 14 10 14 8 7 6 7 10 8 20 19
Research amp Development 8 5 10 12 5 12 7 11 12 6 17 19
Headquarters 1 2 2 2 1 1 4
Contact Centre 4 3 3 3 3 1 4 2 4 4 3
Testing amp Servicing 5 7 4 9 1 13 6 3 2 1 2 2
Other 0 0 1 1 0 0 0 0 1 0 1 2
Source EY (2017) European Investment Monitor
14 Mature leader of the CEE region | EYrsquos Attractiveness Survey Poland
Polandrsquos Attractiveness Survey indicating improvement in foreign investment prospects
In 2017 EY for the first time conducted a deepened survey among international investors in order to gain additional insights into their motivations behind establishing operations in Poland As part of Polandrsquos Attractiveness Survey foreign companies both present and non-established in Poland responded to questions regarding their investment plans factors affecting their investment decisions and risks facing Poland
According to the surveyed companies Polandrsquos attractiveness as an investment destination improved slightly in 2016 ndash 29 of respondents indicated that it had improved while 24 of companies claimed that it had deteriorated last year
One may note large differences in the assessment of Polandrsquos attractiveness between representatives of companies which operate in Poland and companies not established in the country In the eyes of the latter the evolution of Polandrsquos attractiveness as an investment destination was better than in the opinion of the former Only 7 of companies which do not conduct operations in Poland indicated that its attractiveness had deteriorated while 32 claimed that it had improved compared to 37 and 26 respectively in the case of companies functioning in Poland
Polandrsquos Attractiveness Survey indicating improvement in foreign investment prospects
Figure 9 To what degree do you think Polandrsquos attractiveness evolved over the last yearwill evolve over the next three years
Source EY (2017) Polandrsquos Attractiveness Survey
eycomattractiveness
Mature leader of the CEE region | EYrsquos Attractiveness Survey Poland 15
Looking ahead 48 of foreign investors expect Polandrsquos attractiveness to improve over the next three years That share is only lower than the respective proportion for top performers Portugal and Netherlands while it exceeds the results obtained for other European countries analysed14
Investorsrsquo expectations regarding Polandrsquos attractiveness turn out to be very polarized While the share of respondents projecting improvement in Polandrsquos attractiveness over the next three years
14 Germany Italy UK France Belgium
is high it is accompanied by a relatively large proportion (20) of investors indicating that it will deteriorate
Irrespective of discrepancies between different groups of foreign investors one should note that expectations of every group considered point to a significant improvement of the investment attractiveness of the Polish economy over the next three years relative to their assessment of the previous year
Mature leader of the CEE region | EYrsquos Attractiveness Survey Poland 15
16 Mature leader of the CEE region | EYrsquos Attractiveness Survey Poland
Figure 10 From the point of view of your company Poland is very fairly little or not at all attractive as a foreign direct investment destination
Source EY (2017) Polandrsquos Attractiveness Survey
Polandrsquos key assetshellip not always recognized
When considering Poland as a potential investment destination foreign investors appreciate in particular the structural advantages of the labour market in Poland Over 70 of surveyed companiesrsquo representatives indicate that Polandrsquos labour skills level the potential for productivity increase and labour costs are very or fairly attractive The same factors are also most frequently listed as Polandrsquos key assets in comparison to other European countries
Foreign companies established in Poland distinguish Polish workersrsquo skills level and the potential for productivity increase as attractive much more frequently than companies not present in Poland indicating these two factors in 94 and 87 of cases respectively
Polandrsquos key assetshellip not always recognized
very attractive + fairly attractive
81
78
74
72
68
65
58
Both the companies which operate in Poland and the firms which have not yet established their presence in the country agree that labour costs are one of Polandrsquos major assets when compared to other European countries However we identified large discrepancies between those two types of investors when it comes to their assessment of Polish labour force skills level and the potential for productivity increase Foreign companies already operating in Poland consider those factors as key assets of Poland relative to other European countries However these advantages are much less frequently recognized by companies which do not function in Poland It may signal the need to put more emphasis on the communication of the strengths outlined above to the companies not yet established in Poland
That need seems to be further reinforced by the findings of EY European Attractiveness Survey indicating that labour skills are among the assets most valued by foreign investors CEE advantages related to low labour costs are depleting Tightening labour markets push international investors to alternative destinations In particular an increasing number of investors chasing their ideal skills and wages combinations have looked south to non-EU members such as Serbia As a consequence competition for foreign investment based on labour costs is becoming tighter and CEE countries must look for new advantages
eycomattractiveness
Mature leader of the CEE region | EYrsquos Attractiveness Survey Poland 17
Figure 11 What are the three key assets of Poland compared to other European Countries
Source EY (2017) Polandrsquos Attractiveness Survey
When asked about the key risks for Poland foreign investors most frequently point to unstable social and regulatory business environment as well as restrictive approach applied by tax authorities Again we find significant discrepancies between different types of investors The risk factors outlined above are much more frequently indicated by the representatives of companies established in Poland than by those that do not operate in the country
Figure 12 According to you what are the three key risks for Poland
Source EY (2017) Polandrsquos Attractiveness Survey
18 Mature leader of the CEE region | EYrsquos Attractiveness Survey Poland
Although the largest share of new investment projects planned in Poland come from the manufacturing sectors foreign investors indicate that the most prospective sectors which could drive Polandrsquos growth in the coming years are professional services including IT services BPO15 shared services as well as logistics Most attractive sectors related to manufacturing automotive industry and consumer goods are the fifth and seventh most frequently selected sectors respectively
Figure 13 In your opinion which business sectors will drive Polandrsquos growth in the coming years (three answers possible)
Source EY (2017) Polandrsquos Attractiveness Survey
15 Business Process Outsourcing including services such as finance accounting human resources contact center
Polandrsquos key assets hellip not always recognizedPolandrsquos key assetshellip not always recognized
eycomattractiveness
Mature leader of the CEE region | EYrsquos Attractiveness Survey Poland 19
The Czech Republic emerges as Polandrsquos main competitor for FDIs
Traditionally Central and Eastern European countries have been competing with Poland for foreign investment The results of the Polandrsquos Attractiveness Survey confirm this common knowledge additionally listing Germany among Polandrsquos main competitors
While the position of the Czech Republic as Polandrsquos main competitor for FDIs may not be that surprising the margin by which it has been ranked ahead of other countries is striking 44 of the surveyed foreign investors indicate the Czech Republic as Polandrsquos main competitor followed by Hungary (15) Germany (15) Romania (13) and Slovakia (10)
The position of the Czech Republic as that of Polandrsquos main competitor for FDIs is shared by every group of investors considered16 Still a higher share of companies established in Poland (50) is of such an opinion than in the case of enterprises not present in Poland (35) Significant differences between these types of investors have also been identified in their perception of Slovakia (15 and 3 respectively) Hungary in turn is indicated as Polandrsquos main competitor more frequently by investors from the USA (28) than by investors from Western Europe (7)
16 Investors were broken down by their establishednot established status region of origin size of their company and sector of their activity In every of the categories considered the Czech Republic was most frequently indicated as Polandrsquos main competitor
Map 1 In your opinion which is Polandrsquos main European competing country in terms of attractiveness
Source EY (2017) Polandrsquos Attractiveness Survey
20 Mature leader of the CEE region | EYrsquos Attractiveness Survey Poland
Methodology
European Attractiveness Survey
The ldquorealrdquo attractiveness of Europe for foreign investors
Our evaluation of the reality of FDI in Europe is based on the EY European Investment Monitor (EIM) EYrsquos proprietary database produced in collaboration with Oxford Intelligence This database tracks those FDI projects that result in the creation of new facilities and new jobs By excluding portfolio investments and MampA it shows the reality of investment in manufacturing and services by foreign companies across the continent
The EIM database focuses on investment announcements the number of new jobs created and where identifiable the associated capital investment Projects are identified through the daily monitoring of more than 10000 news sources To confirm the accuracy of the data collected the research team aims to directly contact more than 70 of the companies undertaking these investments
The following categories of investment projects are excluded from the EIM
bull MampA and joint ventures (unless these result in new facilities or new jobs being created)
bull License agreements
bull Retail and leisure facilities hotels and real estate
bull Utilities (including telecommunications networks airports ports and other fixed infrastructure)
bull Extraction activities (ores minerals and fuels)
bull Portfolio investments (pensions insurance and financial funds)
bull Factory and other production replacement investments (eg replacing old machinery without creating new employment)
bull Not-for-profit organizations (charitable foundations trade associations and government bodies)
The ldquoperceivedrdquo attractiveness of Europe and its competitors for foreign investors
We define the attractiveness of a country or area as the combination of its image investorsrsquo level of confidence in it as an investment destination and the perception of its ability to provide the most competitive benefits for FDI
The research regarding the perceptions of European investment attractiveness was conducted by the CSA Institute in March 2017 via telephone interviews with a representative group of 505 international decision makers
Our sample groups of businesses included representatives from
bull Europe 53
bull North America 29
bull Asia 12
bull Latin America 3
bull Middle East 2
bull Other regions 1
Overall 81 of the 505 companies surveyed have a presence in Europe And of the non-European companies 34 have established operations in Europe
Investment projects by companies in these categories are included in certain instances eg details of a specific new hotel investment or retail outlet would not be recorded but if the hotel or retail company were to establish a headquarters facility or a distribution center this project would qualify for inclusion in the database
Disclaimer FDI jobs data is available for 3596 projects out of 5845 projects (or 61) in 2016
Methodology
eycomattractiveness
Mature leader of the CEE region | EYrsquos Attractiveness Survey Poland 21
Polandrsquos Attractiveness SurveyPolandrsquos Attractiveness Survey was carried out for the first time in 2017 The research consisted of a survey conducted among international investors in which foreign companiesrsquo representatives responded to questions about their plans regarding establishing or expanding their operations in Poland factors shaping Polandrsquos attractiveness as an investment destination and risks that face Poland
The research was conducted by the CSA Institute in March-April 2017 via telephone interviews with a representative group of 208 international decision makers As a whole 58 of the surveyed companies have a presence in Poland
The companyrsquos country of origin in the sample is representative of the investments done in Poland In particular our sample groups of businesses included representatives from
bull Western Europe 48
bull North America 25
bull Asia 19
bull Northern Europe 6
bull Other regions 2
Disclaimer FDI jobs data is available for 140 projects out of 256 projects (or 55) announced in Poland in 2016
Mature leader of the CEE region | EYrsquos Attractiveness Survey Poland 21
EY | Assurance | Tax | Transactions | Advisory
About EY
EY is a global leader in assurance tax transaction and advisory services The insights and quality services we deliver help build trust and confidence in the capital markets and in economies the world over We develop outstanding leaders who team to deliver on our promises to all of our stakeholders In so doing we play a critical role in building a better working world for our people for our clients and for our communities
EY refers to the global organization andor one or more of the member firms of Ernst amp Young Global Limited each of which is a separate legal entity Ernst amp Young Global Limited a UK company limited by guarantee does not provide services to clients
For more information about our organization please visit eycom
copy 2017 EYGM Limited All Rights Reserved
SCORE 00068-162
eycompl

eycomattractiveness
Mature leader of the CEE region | EYrsquos Attractiveness Survey Poland 13
The decomposition of international investment projects by activity provides additional insights It reveals that while projects related to manufacturing clearly dominate the structure of foreign investment Poland is becoming a more and more attractive location for support and shared services centers (SSC) to large multinational companies (eg accounting or IT) Indeed in 2016 Poland garnered 38 out of 161 (or 24) SSC projects announced by international investors ranking first among European countries
The activity structure of investment projects announced in Poland is similar to that in the CEE region Two notable exceptions are manufacturing which captures somewhat larger part of investment projects in the CEE (564) than in Poland (465) and shared services centers which in turn attracts a significantly higher proportion of FDI in Poland (145) than in CEE as a whole (56) At the same time there are substantial discrepancies between the activity structure of projects announced in Poland and in Europe as a whole In particular investment
projects announced in Europe concentrated in sales and marketing (459 of all projects) while attracting only 195 projects in Poland By contrast manufacturing projects represented only 263 of the total number of projects in Europe which is much below 465 recorded in Poland
Differences in the sectorial structure of new projects between Poland and Europe as a whole are also reflected in labour-intensity of greenfield FDIs The number of jobs per project in Poland in 2016 (158) was over twice as high as in Europe (72)13 In other words Poland is a host to more labour intensive projects than on average Europe However one may notice that the above ratio in Poland has been in a declining trend suggesting that foreign investment in Poland become more and more capital intensive In addition the number of jobs per project in Poland is lower than the average for the CEE region (189)
13 Only the projects for which data on announced new jobs was available were taken into account in the calculation
Table 2 Number of FDI projects in Poland by activity
2005 2006 2007 2008 2009 2010 2011 2012 2013 2014 2015 2016
Manufacturing 123 79 71 82 59 70 70 65 56 74 86 119
Sales amp Marketing 15 33 41 47 21 29 25 48 18 30 65 50
Shared Services Centre 7 11 5 9 3 7 8 10 5 8 16 38
Logistics 18 14 10 14 8 7 6 7 10 8 20 19
Research amp Development 8 5 10 12 5 12 7 11 12 6 17 19
Headquarters 1 2 2 2 1 1 4
Contact Centre 4 3 3 3 3 1 4 2 4 4 3
Testing amp Servicing 5 7 4 9 1 13 6 3 2 1 2 2
Other 0 0 1 1 0 0 0 0 1 0 1 2
Source EY (2017) European Investment Monitor
14 Mature leader of the CEE region | EYrsquos Attractiveness Survey Poland
Polandrsquos Attractiveness Survey indicating improvement in foreign investment prospects
In 2017 EY for the first time conducted a deepened survey among international investors in order to gain additional insights into their motivations behind establishing operations in Poland As part of Polandrsquos Attractiveness Survey foreign companies both present and non-established in Poland responded to questions regarding their investment plans factors affecting their investment decisions and risks facing Poland
According to the surveyed companies Polandrsquos attractiveness as an investment destination improved slightly in 2016 ndash 29 of respondents indicated that it had improved while 24 of companies claimed that it had deteriorated last year
One may note large differences in the assessment of Polandrsquos attractiveness between representatives of companies which operate in Poland and companies not established in the country In the eyes of the latter the evolution of Polandrsquos attractiveness as an investment destination was better than in the opinion of the former Only 7 of companies which do not conduct operations in Poland indicated that its attractiveness had deteriorated while 32 claimed that it had improved compared to 37 and 26 respectively in the case of companies functioning in Poland
Polandrsquos Attractiveness Survey indicating improvement in foreign investment prospects
Figure 9 To what degree do you think Polandrsquos attractiveness evolved over the last yearwill evolve over the next three years
Source EY (2017) Polandrsquos Attractiveness Survey
eycomattractiveness
Mature leader of the CEE region | EYrsquos Attractiveness Survey Poland 15
Looking ahead 48 of foreign investors expect Polandrsquos attractiveness to improve over the next three years That share is only lower than the respective proportion for top performers Portugal and Netherlands while it exceeds the results obtained for other European countries analysed14
Investorsrsquo expectations regarding Polandrsquos attractiveness turn out to be very polarized While the share of respondents projecting improvement in Polandrsquos attractiveness over the next three years
14 Germany Italy UK France Belgium
is high it is accompanied by a relatively large proportion (20) of investors indicating that it will deteriorate
Irrespective of discrepancies between different groups of foreign investors one should note that expectations of every group considered point to a significant improvement of the investment attractiveness of the Polish economy over the next three years relative to their assessment of the previous year
Mature leader of the CEE region | EYrsquos Attractiveness Survey Poland 15
16 Mature leader of the CEE region | EYrsquos Attractiveness Survey Poland
Figure 10 From the point of view of your company Poland is very fairly little or not at all attractive as a foreign direct investment destination
Source EY (2017) Polandrsquos Attractiveness Survey
Polandrsquos key assetshellip not always recognized
When considering Poland as a potential investment destination foreign investors appreciate in particular the structural advantages of the labour market in Poland Over 70 of surveyed companiesrsquo representatives indicate that Polandrsquos labour skills level the potential for productivity increase and labour costs are very or fairly attractive The same factors are also most frequently listed as Polandrsquos key assets in comparison to other European countries
Foreign companies established in Poland distinguish Polish workersrsquo skills level and the potential for productivity increase as attractive much more frequently than companies not present in Poland indicating these two factors in 94 and 87 of cases respectively
Polandrsquos key assetshellip not always recognized
very attractive + fairly attractive
81
78
74
72
68
65
58
Both the companies which operate in Poland and the firms which have not yet established their presence in the country agree that labour costs are one of Polandrsquos major assets when compared to other European countries However we identified large discrepancies between those two types of investors when it comes to their assessment of Polish labour force skills level and the potential for productivity increase Foreign companies already operating in Poland consider those factors as key assets of Poland relative to other European countries However these advantages are much less frequently recognized by companies which do not function in Poland It may signal the need to put more emphasis on the communication of the strengths outlined above to the companies not yet established in Poland
That need seems to be further reinforced by the findings of EY European Attractiveness Survey indicating that labour skills are among the assets most valued by foreign investors CEE advantages related to low labour costs are depleting Tightening labour markets push international investors to alternative destinations In particular an increasing number of investors chasing their ideal skills and wages combinations have looked south to non-EU members such as Serbia As a consequence competition for foreign investment based on labour costs is becoming tighter and CEE countries must look for new advantages
eycomattractiveness
Mature leader of the CEE region | EYrsquos Attractiveness Survey Poland 17
Figure 11 What are the three key assets of Poland compared to other European Countries
Source EY (2017) Polandrsquos Attractiveness Survey
When asked about the key risks for Poland foreign investors most frequently point to unstable social and regulatory business environment as well as restrictive approach applied by tax authorities Again we find significant discrepancies between different types of investors The risk factors outlined above are much more frequently indicated by the representatives of companies established in Poland than by those that do not operate in the country
Figure 12 According to you what are the three key risks for Poland
Source EY (2017) Polandrsquos Attractiveness Survey
18 Mature leader of the CEE region | EYrsquos Attractiveness Survey Poland
Although the largest share of new investment projects planned in Poland come from the manufacturing sectors foreign investors indicate that the most prospective sectors which could drive Polandrsquos growth in the coming years are professional services including IT services BPO15 shared services as well as logistics Most attractive sectors related to manufacturing automotive industry and consumer goods are the fifth and seventh most frequently selected sectors respectively
Figure 13 In your opinion which business sectors will drive Polandrsquos growth in the coming years (three answers possible)
Source EY (2017) Polandrsquos Attractiveness Survey
15 Business Process Outsourcing including services such as finance accounting human resources contact center
Polandrsquos key assets hellip not always recognizedPolandrsquos key assetshellip not always recognized
eycomattractiveness
Mature leader of the CEE region | EYrsquos Attractiveness Survey Poland 19
The Czech Republic emerges as Polandrsquos main competitor for FDIs
Traditionally Central and Eastern European countries have been competing with Poland for foreign investment The results of the Polandrsquos Attractiveness Survey confirm this common knowledge additionally listing Germany among Polandrsquos main competitors
While the position of the Czech Republic as Polandrsquos main competitor for FDIs may not be that surprising the margin by which it has been ranked ahead of other countries is striking 44 of the surveyed foreign investors indicate the Czech Republic as Polandrsquos main competitor followed by Hungary (15) Germany (15) Romania (13) and Slovakia (10)
The position of the Czech Republic as that of Polandrsquos main competitor for FDIs is shared by every group of investors considered16 Still a higher share of companies established in Poland (50) is of such an opinion than in the case of enterprises not present in Poland (35) Significant differences between these types of investors have also been identified in their perception of Slovakia (15 and 3 respectively) Hungary in turn is indicated as Polandrsquos main competitor more frequently by investors from the USA (28) than by investors from Western Europe (7)
16 Investors were broken down by their establishednot established status region of origin size of their company and sector of their activity In every of the categories considered the Czech Republic was most frequently indicated as Polandrsquos main competitor
Map 1 In your opinion which is Polandrsquos main European competing country in terms of attractiveness
Source EY (2017) Polandrsquos Attractiveness Survey
20 Mature leader of the CEE region | EYrsquos Attractiveness Survey Poland
Methodology
European Attractiveness Survey
The ldquorealrdquo attractiveness of Europe for foreign investors
Our evaluation of the reality of FDI in Europe is based on the EY European Investment Monitor (EIM) EYrsquos proprietary database produced in collaboration with Oxford Intelligence This database tracks those FDI projects that result in the creation of new facilities and new jobs By excluding portfolio investments and MampA it shows the reality of investment in manufacturing and services by foreign companies across the continent
The EIM database focuses on investment announcements the number of new jobs created and where identifiable the associated capital investment Projects are identified through the daily monitoring of more than 10000 news sources To confirm the accuracy of the data collected the research team aims to directly contact more than 70 of the companies undertaking these investments
The following categories of investment projects are excluded from the EIM
bull MampA and joint ventures (unless these result in new facilities or new jobs being created)
bull License agreements
bull Retail and leisure facilities hotels and real estate
bull Utilities (including telecommunications networks airports ports and other fixed infrastructure)
bull Extraction activities (ores minerals and fuels)
bull Portfolio investments (pensions insurance and financial funds)
bull Factory and other production replacement investments (eg replacing old machinery without creating new employment)
bull Not-for-profit organizations (charitable foundations trade associations and government bodies)
The ldquoperceivedrdquo attractiveness of Europe and its competitors for foreign investors
We define the attractiveness of a country or area as the combination of its image investorsrsquo level of confidence in it as an investment destination and the perception of its ability to provide the most competitive benefits for FDI
The research regarding the perceptions of European investment attractiveness was conducted by the CSA Institute in March 2017 via telephone interviews with a representative group of 505 international decision makers
Our sample groups of businesses included representatives from
bull Europe 53
bull North America 29
bull Asia 12
bull Latin America 3
bull Middle East 2
bull Other regions 1
Overall 81 of the 505 companies surveyed have a presence in Europe And of the non-European companies 34 have established operations in Europe
Investment projects by companies in these categories are included in certain instances eg details of a specific new hotel investment or retail outlet would not be recorded but if the hotel or retail company were to establish a headquarters facility or a distribution center this project would qualify for inclusion in the database
Disclaimer FDI jobs data is available for 3596 projects out of 5845 projects (or 61) in 2016
Methodology
eycomattractiveness
Mature leader of the CEE region | EYrsquos Attractiveness Survey Poland 21
Polandrsquos Attractiveness SurveyPolandrsquos Attractiveness Survey was carried out for the first time in 2017 The research consisted of a survey conducted among international investors in which foreign companiesrsquo representatives responded to questions about their plans regarding establishing or expanding their operations in Poland factors shaping Polandrsquos attractiveness as an investment destination and risks that face Poland
The research was conducted by the CSA Institute in March-April 2017 via telephone interviews with a representative group of 208 international decision makers As a whole 58 of the surveyed companies have a presence in Poland
The companyrsquos country of origin in the sample is representative of the investments done in Poland In particular our sample groups of businesses included representatives from
bull Western Europe 48
bull North America 25
bull Asia 19
bull Northern Europe 6
bull Other regions 2
Disclaimer FDI jobs data is available for 140 projects out of 256 projects (or 55) announced in Poland in 2016
Mature leader of the CEE region | EYrsquos Attractiveness Survey Poland 21
EY | Assurance | Tax | Transactions | Advisory
About EY
EY is a global leader in assurance tax transaction and advisory services The insights and quality services we deliver help build trust and confidence in the capital markets and in economies the world over We develop outstanding leaders who team to deliver on our promises to all of our stakeholders In so doing we play a critical role in building a better working world for our people for our clients and for our communities
EY refers to the global organization andor one or more of the member firms of Ernst amp Young Global Limited each of which is a separate legal entity Ernst amp Young Global Limited a UK company limited by guarantee does not provide services to clients
For more information about our organization please visit eycom
copy 2017 EYGM Limited All Rights Reserved
SCORE 00068-162
eycompl

eycomattractiveness
Mature leader of the CEE region | EYrsquos Attractiveness Survey Poland 15
Looking ahead 48 of foreign investors expect Polandrsquos attractiveness to improve over the next three years That share is only lower than the respective proportion for top performers Portugal and Netherlands while it exceeds the results obtained for other European countries analysed14
Investorsrsquo expectations regarding Polandrsquos attractiveness turn out to be very polarized While the share of respondents projecting improvement in Polandrsquos attractiveness over the next three years
14 Germany Italy UK France Belgium
is high it is accompanied by a relatively large proportion (20) of investors indicating that it will deteriorate
Irrespective of discrepancies between different groups of foreign investors one should note that expectations of every group considered point to a significant improvement of the investment attractiveness of the Polish economy over the next three years relative to their assessment of the previous year
Mature leader of the CEE region | EYrsquos Attractiveness Survey Poland 15
16 Mature leader of the CEE region | EYrsquos Attractiveness Survey Poland
Figure 10 From the point of view of your company Poland is very fairly little or not at all attractive as a foreign direct investment destination
Source EY (2017) Polandrsquos Attractiveness Survey
Polandrsquos key assetshellip not always recognized
When considering Poland as a potential investment destination foreign investors appreciate in particular the structural advantages of the labour market in Poland Over 70 of surveyed companiesrsquo representatives indicate that Polandrsquos labour skills level the potential for productivity increase and labour costs are very or fairly attractive The same factors are also most frequently listed as Polandrsquos key assets in comparison to other European countries
Foreign companies established in Poland distinguish Polish workersrsquo skills level and the potential for productivity increase as attractive much more frequently than companies not present in Poland indicating these two factors in 94 and 87 of cases respectively
Polandrsquos key assetshellip not always recognized
very attractive + fairly attractive
81
78
74
72
68
65
58
Both the companies which operate in Poland and the firms which have not yet established their presence in the country agree that labour costs are one of Polandrsquos major assets when compared to other European countries However we identified large discrepancies between those two types of investors when it comes to their assessment of Polish labour force skills level and the potential for productivity increase Foreign companies already operating in Poland consider those factors as key assets of Poland relative to other European countries However these advantages are much less frequently recognized by companies which do not function in Poland It may signal the need to put more emphasis on the communication of the strengths outlined above to the companies not yet established in Poland
That need seems to be further reinforced by the findings of EY European Attractiveness Survey indicating that labour skills are among the assets most valued by foreign investors CEE advantages related to low labour costs are depleting Tightening labour markets push international investors to alternative destinations In particular an increasing number of investors chasing their ideal skills and wages combinations have looked south to non-EU members such as Serbia As a consequence competition for foreign investment based on labour costs is becoming tighter and CEE countries must look for new advantages
eycomattractiveness
Mature leader of the CEE region | EYrsquos Attractiveness Survey Poland 17
Figure 11 What are the three key assets of Poland compared to other European Countries
Source EY (2017) Polandrsquos Attractiveness Survey
When asked about the key risks for Poland foreign investors most frequently point to unstable social and regulatory business environment as well as restrictive approach applied by tax authorities Again we find significant discrepancies between different types of investors The risk factors outlined above are much more frequently indicated by the representatives of companies established in Poland than by those that do not operate in the country
Figure 12 According to you what are the three key risks for Poland
Source EY (2017) Polandrsquos Attractiveness Survey
18 Mature leader of the CEE region | EYrsquos Attractiveness Survey Poland
Although the largest share of new investment projects planned in Poland come from the manufacturing sectors foreign investors indicate that the most prospective sectors which could drive Polandrsquos growth in the coming years are professional services including IT services BPO15 shared services as well as logistics Most attractive sectors related to manufacturing automotive industry and consumer goods are the fifth and seventh most frequently selected sectors respectively
Figure 13 In your opinion which business sectors will drive Polandrsquos growth in the coming years (three answers possible)
Source EY (2017) Polandrsquos Attractiveness Survey
15 Business Process Outsourcing including services such as finance accounting human resources contact center
Polandrsquos key assets hellip not always recognizedPolandrsquos key assetshellip not always recognized
eycomattractiveness
Mature leader of the CEE region | EYrsquos Attractiveness Survey Poland 19
The Czech Republic emerges as Polandrsquos main competitor for FDIs
Traditionally Central and Eastern European countries have been competing with Poland for foreign investment The results of the Polandrsquos Attractiveness Survey confirm this common knowledge additionally listing Germany among Polandrsquos main competitors
While the position of the Czech Republic as Polandrsquos main competitor for FDIs may not be that surprising the margin by which it has been ranked ahead of other countries is striking 44 of the surveyed foreign investors indicate the Czech Republic as Polandrsquos main competitor followed by Hungary (15) Germany (15) Romania (13) and Slovakia (10)
The position of the Czech Republic as that of Polandrsquos main competitor for FDIs is shared by every group of investors considered16 Still a higher share of companies established in Poland (50) is of such an opinion than in the case of enterprises not present in Poland (35) Significant differences between these types of investors have also been identified in their perception of Slovakia (15 and 3 respectively) Hungary in turn is indicated as Polandrsquos main competitor more frequently by investors from the USA (28) than by investors from Western Europe (7)
16 Investors were broken down by their establishednot established status region of origin size of their company and sector of their activity In every of the categories considered the Czech Republic was most frequently indicated as Polandrsquos main competitor
Map 1 In your opinion which is Polandrsquos main European competing country in terms of attractiveness
Source EY (2017) Polandrsquos Attractiveness Survey
20 Mature leader of the CEE region | EYrsquos Attractiveness Survey Poland
Methodology
European Attractiveness Survey
The ldquorealrdquo attractiveness of Europe for foreign investors
Our evaluation of the reality of FDI in Europe is based on the EY European Investment Monitor (EIM) EYrsquos proprietary database produced in collaboration with Oxford Intelligence This database tracks those FDI projects that result in the creation of new facilities and new jobs By excluding portfolio investments and MampA it shows the reality of investment in manufacturing and services by foreign companies across the continent
The EIM database focuses on investment announcements the number of new jobs created and where identifiable the associated capital investment Projects are identified through the daily monitoring of more than 10000 news sources To confirm the accuracy of the data collected the research team aims to directly contact more than 70 of the companies undertaking these investments
The following categories of investment projects are excluded from the EIM
bull MampA and joint ventures (unless these result in new facilities or new jobs being created)
bull License agreements
bull Retail and leisure facilities hotels and real estate
bull Utilities (including telecommunications networks airports ports and other fixed infrastructure)
bull Extraction activities (ores minerals and fuels)
bull Portfolio investments (pensions insurance and financial funds)
bull Factory and other production replacement investments (eg replacing old machinery without creating new employment)
bull Not-for-profit organizations (charitable foundations trade associations and government bodies)
The ldquoperceivedrdquo attractiveness of Europe and its competitors for foreign investors
We define the attractiveness of a country or area as the combination of its image investorsrsquo level of confidence in it as an investment destination and the perception of its ability to provide the most competitive benefits for FDI
The research regarding the perceptions of European investment attractiveness was conducted by the CSA Institute in March 2017 via telephone interviews with a representative group of 505 international decision makers
Our sample groups of businesses included representatives from
bull Europe 53
bull North America 29
bull Asia 12
bull Latin America 3
bull Middle East 2
bull Other regions 1
Overall 81 of the 505 companies surveyed have a presence in Europe And of the non-European companies 34 have established operations in Europe
Investment projects by companies in these categories are included in certain instances eg details of a specific new hotel investment or retail outlet would not be recorded but if the hotel or retail company were to establish a headquarters facility or a distribution center this project would qualify for inclusion in the database
Disclaimer FDI jobs data is available for 3596 projects out of 5845 projects (or 61) in 2016
Methodology
eycomattractiveness
Mature leader of the CEE region | EYrsquos Attractiveness Survey Poland 21
Polandrsquos Attractiveness SurveyPolandrsquos Attractiveness Survey was carried out for the first time in 2017 The research consisted of a survey conducted among international investors in which foreign companiesrsquo representatives responded to questions about their plans regarding establishing or expanding their operations in Poland factors shaping Polandrsquos attractiveness as an investment destination and risks that face Poland
The research was conducted by the CSA Institute in March-April 2017 via telephone interviews with a representative group of 208 international decision makers As a whole 58 of the surveyed companies have a presence in Poland
The companyrsquos country of origin in the sample is representative of the investments done in Poland In particular our sample groups of businesses included representatives from
bull Western Europe 48
bull North America 25
bull Asia 19
bull Northern Europe 6
bull Other regions 2
Disclaimer FDI jobs data is available for 140 projects out of 256 projects (or 55) announced in Poland in 2016
Mature leader of the CEE region | EYrsquos Attractiveness Survey Poland 21
EY | Assurance | Tax | Transactions | Advisory
About EY
EY is a global leader in assurance tax transaction and advisory services The insights and quality services we deliver help build trust and confidence in the capital markets and in economies the world over We develop outstanding leaders who team to deliver on our promises to all of our stakeholders In so doing we play a critical role in building a better working world for our people for our clients and for our communities
EY refers to the global organization andor one or more of the member firms of Ernst amp Young Global Limited each of which is a separate legal entity Ernst amp Young Global Limited a UK company limited by guarantee does not provide services to clients
For more information about our organization please visit eycom
copy 2017 EYGM Limited All Rights Reserved
SCORE 00068-162
eycompl

eycomattractiveness
Mature leader of the CEE region | EYrsquos Attractiveness Survey Poland 17
Figure 11 What are the three key assets of Poland compared to other European Countries
Source EY (2017) Polandrsquos Attractiveness Survey
When asked about the key risks for Poland foreign investors most frequently point to unstable social and regulatory business environment as well as restrictive approach applied by tax authorities Again we find significant discrepancies between different types of investors The risk factors outlined above are much more frequently indicated by the representatives of companies established in Poland than by those that do not operate in the country
Figure 12 According to you what are the three key risks for Poland
Source EY (2017) Polandrsquos Attractiveness Survey
18 Mature leader of the CEE region | EYrsquos Attractiveness Survey Poland
Although the largest share of new investment projects planned in Poland come from the manufacturing sectors foreign investors indicate that the most prospective sectors which could drive Polandrsquos growth in the coming years are professional services including IT services BPO15 shared services as well as logistics Most attractive sectors related to manufacturing automotive industry and consumer goods are the fifth and seventh most frequently selected sectors respectively
Figure 13 In your opinion which business sectors will drive Polandrsquos growth in the coming years (three answers possible)
Source EY (2017) Polandrsquos Attractiveness Survey
15 Business Process Outsourcing including services such as finance accounting human resources contact center
Polandrsquos key assets hellip not always recognizedPolandrsquos key assetshellip not always recognized
eycomattractiveness
Mature leader of the CEE region | EYrsquos Attractiveness Survey Poland 19
The Czech Republic emerges as Polandrsquos main competitor for FDIs
Traditionally Central and Eastern European countries have been competing with Poland for foreign investment The results of the Polandrsquos Attractiveness Survey confirm this common knowledge additionally listing Germany among Polandrsquos main competitors
While the position of the Czech Republic as Polandrsquos main competitor for FDIs may not be that surprising the margin by which it has been ranked ahead of other countries is striking 44 of the surveyed foreign investors indicate the Czech Republic as Polandrsquos main competitor followed by Hungary (15) Germany (15) Romania (13) and Slovakia (10)
The position of the Czech Republic as that of Polandrsquos main competitor for FDIs is shared by every group of investors considered16 Still a higher share of companies established in Poland (50) is of such an opinion than in the case of enterprises not present in Poland (35) Significant differences between these types of investors have also been identified in their perception of Slovakia (15 and 3 respectively) Hungary in turn is indicated as Polandrsquos main competitor more frequently by investors from the USA (28) than by investors from Western Europe (7)
16 Investors were broken down by their establishednot established status region of origin size of their company and sector of their activity In every of the categories considered the Czech Republic was most frequently indicated as Polandrsquos main competitor
Map 1 In your opinion which is Polandrsquos main European competing country in terms of attractiveness
Source EY (2017) Polandrsquos Attractiveness Survey
20 Mature leader of the CEE region | EYrsquos Attractiveness Survey Poland
Methodology
European Attractiveness Survey
The ldquorealrdquo attractiveness of Europe for foreign investors
Our evaluation of the reality of FDI in Europe is based on the EY European Investment Monitor (EIM) EYrsquos proprietary database produced in collaboration with Oxford Intelligence This database tracks those FDI projects that result in the creation of new facilities and new jobs By excluding portfolio investments and MampA it shows the reality of investment in manufacturing and services by foreign companies across the continent
The EIM database focuses on investment announcements the number of new jobs created and where identifiable the associated capital investment Projects are identified through the daily monitoring of more than 10000 news sources To confirm the accuracy of the data collected the research team aims to directly contact more than 70 of the companies undertaking these investments
The following categories of investment projects are excluded from the EIM
bull MampA and joint ventures (unless these result in new facilities or new jobs being created)
bull License agreements
bull Retail and leisure facilities hotels and real estate
bull Utilities (including telecommunications networks airports ports and other fixed infrastructure)
bull Extraction activities (ores minerals and fuels)
bull Portfolio investments (pensions insurance and financial funds)
bull Factory and other production replacement investments (eg replacing old machinery without creating new employment)
bull Not-for-profit organizations (charitable foundations trade associations and government bodies)
The ldquoperceivedrdquo attractiveness of Europe and its competitors for foreign investors
We define the attractiveness of a country or area as the combination of its image investorsrsquo level of confidence in it as an investment destination and the perception of its ability to provide the most competitive benefits for FDI
The research regarding the perceptions of European investment attractiveness was conducted by the CSA Institute in March 2017 via telephone interviews with a representative group of 505 international decision makers
Our sample groups of businesses included representatives from
bull Europe 53
bull North America 29
bull Asia 12
bull Latin America 3
bull Middle East 2
bull Other regions 1
Overall 81 of the 505 companies surveyed have a presence in Europe And of the non-European companies 34 have established operations in Europe
Investment projects by companies in these categories are included in certain instances eg details of a specific new hotel investment or retail outlet would not be recorded but if the hotel or retail company were to establish a headquarters facility or a distribution center this project would qualify for inclusion in the database
Disclaimer FDI jobs data is available for 3596 projects out of 5845 projects (or 61) in 2016
Methodology
eycomattractiveness
Mature leader of the CEE region | EYrsquos Attractiveness Survey Poland 21
Polandrsquos Attractiveness SurveyPolandrsquos Attractiveness Survey was carried out for the first time in 2017 The research consisted of a survey conducted among international investors in which foreign companiesrsquo representatives responded to questions about their plans regarding establishing or expanding their operations in Poland factors shaping Polandrsquos attractiveness as an investment destination and risks that face Poland
The research was conducted by the CSA Institute in March-April 2017 via telephone interviews with a representative group of 208 international decision makers As a whole 58 of the surveyed companies have a presence in Poland
The companyrsquos country of origin in the sample is representative of the investments done in Poland In particular our sample groups of businesses included representatives from
bull Western Europe 48
bull North America 25
bull Asia 19
bull Northern Europe 6
bull Other regions 2
Disclaimer FDI jobs data is available for 140 projects out of 256 projects (or 55) announced in Poland in 2016
Mature leader of the CEE region | EYrsquos Attractiveness Survey Poland 21
EY | Assurance | Tax | Transactions | Advisory
About EY
EY is a global leader in assurance tax transaction and advisory services The insights and quality services we deliver help build trust and confidence in the capital markets and in economies the world over We develop outstanding leaders who team to deliver on our promises to all of our stakeholders In so doing we play a critical role in building a better working world for our people for our clients and for our communities
EY refers to the global organization andor one or more of the member firms of Ernst amp Young Global Limited each of which is a separate legal entity Ernst amp Young Global Limited a UK company limited by guarantee does not provide services to clients
For more information about our organization please visit eycom
copy 2017 EYGM Limited All Rights Reserved
SCORE 00068-162
eycompl

eycomattractiveness
Mature leader of the CEE region | EYrsquos Attractiveness Survey Poland 19
The Czech Republic emerges as Polandrsquos main competitor for FDIs
Traditionally Central and Eastern European countries have been competing with Poland for foreign investment The results of the Polandrsquos Attractiveness Survey confirm this common knowledge additionally listing Germany among Polandrsquos main competitors
While the position of the Czech Republic as Polandrsquos main competitor for FDIs may not be that surprising the margin by which it has been ranked ahead of other countries is striking 44 of the surveyed foreign investors indicate the Czech Republic as Polandrsquos main competitor followed by Hungary (15) Germany (15) Romania (13) and Slovakia (10)
The position of the Czech Republic as that of Polandrsquos main competitor for FDIs is shared by every group of investors considered16 Still a higher share of companies established in Poland (50) is of such an opinion than in the case of enterprises not present in Poland (35) Significant differences between these types of investors have also been identified in their perception of Slovakia (15 and 3 respectively) Hungary in turn is indicated as Polandrsquos main competitor more frequently by investors from the USA (28) than by investors from Western Europe (7)
16 Investors were broken down by their establishednot established status region of origin size of their company and sector of their activity In every of the categories considered the Czech Republic was most frequently indicated as Polandrsquos main competitor
Map 1 In your opinion which is Polandrsquos main European competing country in terms of attractiveness
Source EY (2017) Polandrsquos Attractiveness Survey
20 Mature leader of the CEE region | EYrsquos Attractiveness Survey Poland
Methodology
European Attractiveness Survey
The ldquorealrdquo attractiveness of Europe for foreign investors
Our evaluation of the reality of FDI in Europe is based on the EY European Investment Monitor (EIM) EYrsquos proprietary database produced in collaboration with Oxford Intelligence This database tracks those FDI projects that result in the creation of new facilities and new jobs By excluding portfolio investments and MampA it shows the reality of investment in manufacturing and services by foreign companies across the continent
The EIM database focuses on investment announcements the number of new jobs created and where identifiable the associated capital investment Projects are identified through the daily monitoring of more than 10000 news sources To confirm the accuracy of the data collected the research team aims to directly contact more than 70 of the companies undertaking these investments
The following categories of investment projects are excluded from the EIM
bull MampA and joint ventures (unless these result in new facilities or new jobs being created)
bull License agreements
bull Retail and leisure facilities hotels and real estate
bull Utilities (including telecommunications networks airports ports and other fixed infrastructure)
bull Extraction activities (ores minerals and fuels)
bull Portfolio investments (pensions insurance and financial funds)
bull Factory and other production replacement investments (eg replacing old machinery without creating new employment)
bull Not-for-profit organizations (charitable foundations trade associations and government bodies)
The ldquoperceivedrdquo attractiveness of Europe and its competitors for foreign investors
We define the attractiveness of a country or area as the combination of its image investorsrsquo level of confidence in it as an investment destination and the perception of its ability to provide the most competitive benefits for FDI
The research regarding the perceptions of European investment attractiveness was conducted by the CSA Institute in March 2017 via telephone interviews with a representative group of 505 international decision makers
Our sample groups of businesses included representatives from
bull Europe 53
bull North America 29
bull Asia 12
bull Latin America 3
bull Middle East 2
bull Other regions 1
Overall 81 of the 505 companies surveyed have a presence in Europe And of the non-European companies 34 have established operations in Europe
Investment projects by companies in these categories are included in certain instances eg details of a specific new hotel investment or retail outlet would not be recorded but if the hotel or retail company were to establish a headquarters facility or a distribution center this project would qualify for inclusion in the database
Disclaimer FDI jobs data is available for 3596 projects out of 5845 projects (or 61) in 2016
Methodology
eycomattractiveness
Mature leader of the CEE region | EYrsquos Attractiveness Survey Poland 21
Polandrsquos Attractiveness SurveyPolandrsquos Attractiveness Survey was carried out for the first time in 2017 The research consisted of a survey conducted among international investors in which foreign companiesrsquo representatives responded to questions about their plans regarding establishing or expanding their operations in Poland factors shaping Polandrsquos attractiveness as an investment destination and risks that face Poland
The research was conducted by the CSA Institute in March-April 2017 via telephone interviews with a representative group of 208 international decision makers As a whole 58 of the surveyed companies have a presence in Poland
The companyrsquos country of origin in the sample is representative of the investments done in Poland In particular our sample groups of businesses included representatives from
bull Western Europe 48
bull North America 25
bull Asia 19
bull Northern Europe 6
bull Other regions 2
Disclaimer FDI jobs data is available for 140 projects out of 256 projects (or 55) announced in Poland in 2016
Mature leader of the CEE region | EYrsquos Attractiveness Survey Poland 21
EY | Assurance | Tax | Transactions | Advisory
About EY
EY is a global leader in assurance tax transaction and advisory services The insights and quality services we deliver help build trust and confidence in the capital markets and in economies the world over We develop outstanding leaders who team to deliver on our promises to all of our stakeholders In so doing we play a critical role in building a better working world for our people for our clients and for our communities
EY refers to the global organization andor one or more of the member firms of Ernst amp Young Global Limited each of which is a separate legal entity Ernst amp Young Global Limited a UK company limited by guarantee does not provide services to clients
For more information about our organization please visit eycom
copy 2017 EYGM Limited All Rights Reserved
SCORE 00068-162
eycompl