maturity method for quality control of concrete - washington state
TRANSCRIPT

April 2009Keith W. Anderson, Jeff S. Uhlmeyer, Chuck Kinne, Linda M. Pierce and Steve Muench
WA-RD 698.1
Office of Research & Library Services
WSDOT Research Report
Use of the Maturity Method InAccelerated PCCP Construction

Experimental Feature Report __________________________________________________________
Final Report Experimental Feature 04-02
Use of the Maturity Method In Accelerated PCCP Construction Contract 6473, I-5, 36th St. Vic. to SR-542 PCCP Rehab. Contract 6886, I-5, James Street Vicinity to Olive Way Contract 6916, I-205, SR-500 to I-5 PCCP Rehab. and Dowel Bar Retrofit
0
1000
2000
3000
4000
5000
6000
0 100 200 300 400 500 600 700 800 900 1000
Maturity (C-Hrs)
Com
pres
sive
Str
engt
h (p
si)

Experimental Feature Report __________________________________________________________
April 2009 ii
1. REPORT NO. 2. GOVERNMENT ACCESSION NO. 3. RECIPIENT'S CATALOG NO.
WA-RD 698.1
4. TITLE AND SUBTITLE 5. REPORT DATE
Use of the Maturity Method In Accelerated PCCP Construction April 2009 6. PERFORMING ORGANIZATION CODE WA 04-02 7. AUTHOR(S) 8. PERFORMING ORGANIZATION REPORT NO.
Keith W. Anderson, Jeff S. Uhlmeyer, Chuck Kinne, Linda M. Pierce* and Steve Muench**
. PERFORMING ORGANIZATION NAME AND ADDRESS 10. WORK UNIT NO.
Washington State Department of Transportation Materials Laboratory, MS-47365 11. CONTRACT OR GRANT NO.
Olympia, WA 98504-7365 12. SPONSORING AGENCY NAME AND ADDRESS 13. TYPE OF REPORT AND PERIOD COVERED
Washington State Department of Transportation Transportation Building, MS 47372
Final Report
Olympia, Washington 98504-7372 14. SPONSORING AGENCY CODE
Project Manager: Kim Willoughby, 360-705-7978 15. SUPPLEMENTARY NOTES
This study was conducted in cooperation with the U.S. Department of Transportation, Federal Highway Administration. * Linda Pierce, Applied Pavement Technology, ** Steve Muench, Dept. of Civil and Environmental Engineer, University of Washington 16. ABSTRACT
This report describes the maturity concept and its application on three case studies on actual construction projects. The
three were all paving projects in the state of Washington, one a complete rebuild of a section of I-5 in downtown Seattle, and the other two panel replacements, one on I-5 in Bellingham and the other on I-205 in Vancouver.
The study found that maturity is a useful tool for determining the strength of the pavement and allowing early opening of the roadway to traffic. The use of all of the principles of the maturity concept such as the development of the calibration curve, the use of the verification method to assure compliance of the mix with the original mix, and systematic recording keeping and reporting were not evenly applied on each case study. As a result of the uneven application, additional case studies with strict compliance to all principles of the maturity concept are recommended prior to the full implementation of this tool on future accelerated paving projects.
17. KEY WORDS 18. DISTRIBUTION STATEMENT
Portland cement concrete, PCCP, concrete maturity method, accelerated construction
No restrictions. This document is available to the public through the National Technical Information Service, Springfield, VA 22616
19. SECURITY CLASSIF. (of this report) 20. SECURITY CLASSIF. (of this page) 21. NO. OF PAGES 22. PRICE
None None 102

Experimental Feature Report __________________________________________________________
April 2009 iii
DISCLAIMER
The contents of this report reflect the views of the authors, who are responsible for the
facts and the accuracy of the data presented herein. The contents do not necessarily reflect the
official views or policies of the Washington State Department of Transportation or the Federal
Highway Administration. This report does not constitute a standard, specification, or regulation.

Experimental Feature Report __________________________________________________________
April 2009 iv
TABLE OF CONTENTS Introduction..................................................................................................................................... 1
Current Concrete Acceptance Practices...................................................................................... 1 Maturity....................................................................................................................................... 2 Concrete Fundamentals............................................................................................................... 3 Maturity Principles...................................................................................................................... 5 Calibration Curve Development ................................................................................................. 7 Verification ................................................................................................................................. 9 Field Procedures........................................................................................................................ 10 Maturity Equipment .................................................................................................................. 11 Benefits of Maturity.................................................................................................................. 13 Weaknesses of Maturity............................................................................................................ 13
Use of the Maturity Concept......................................................................................................... 14 Case Studies .................................................................................................................................. 15 Bellingham.................................................................................................................................... 16
Introduction............................................................................................................................... 16 Calibration................................................................................................................................. 16 Field Measurements .................................................................................................................. 18
Week One.............................................................................................................................. 18 Week Two............................................................................................................................. 21 Week Three........................................................................................................................... 22 Week Four............................................................................................................................. 23
Verification ............................................................................................................................... 23 Special Provisions..................................................................................................................... 24 Special Provisions Compliance................................................................................................. 25 Primary Questions Addressed................................................................................................... 25 Problems ................................................................................................................................... 26
James to Olive............................................................................................................................... 27 Introduction............................................................................................................................... 27 Calibration................................................................................................................................. 27 Field Measurements .................................................................................................................. 28
Stage 1................................................................................................................................... 28 Stage 2................................................................................................................................... 29 Stage 3................................................................................................................................... 30 Stage 4................................................................................................................................... 31 Summary of Maturity Data ................................................................................................... 31
Verification ............................................................................................................................... 33 Special Provisions..................................................................................................................... 33 Special Provisions Compliance................................................................................................. 34 Primary Questions Addressed................................................................................................... 34
Vancouver Vicinity....................................................................................................................... 36 Introduction............................................................................................................................... 36

Experimental Feature Report __________________________________________________________
April 2009 v
Calibration................................................................................................................................. 36 12-Hour Mix Design ............................................................................................................. 36 24-Hour Mix Design ............................................................................................................. 39
Field Measurements .................................................................................................................. 41 12-Hour Mix Design ............................................................................................................. 41 24-Hour Mix Design ............................................................................................................. 42
Verification ............................................................................................................................... 43 12-Hour Mix Design ............................................................................................................. 43 24-Hour Mix Design ............................................................................................................. 43
Special Provisions..................................................................................................................... 43 Special Provisions Compliance................................................................................................. 44 Primary Questions Addressed................................................................................................... 44
Case Study Summary.................................................................................................................... 46 Calibration Curves .................................................................................................................... 46 Verification ............................................................................................................................... 46 Opening to Traffic..................................................................................................................... 46 Record Keeping ........................................................................................................................ 46
Discussion..................................................................................................................................... 48 Survey ........................................................................................................................................... 49 Recommendations......................................................................................................................... 52 References..................................................................................................................................... 53 Appendix A Bellingham Special Provisions................................................................................. 54 Appendix B Bellingham Maturity Worksheet and Sample .......................................................... 57 Appendix C Bellingham Debriefing Report ................................................................................. 60 Appendix D James to Olive Maturity Worksheet and Sample ..................................................... 65 Appendix E James to Olive Special Provisions............................................................................ 68 Appendix F Vancouver Vicinity Special Provisions .................................................................... 78 Appendix G 1007 West Virginia Division of Highways Maturity Survey................................... 89
Experimental Feature Report __________________________________________________________
April 2009 vi
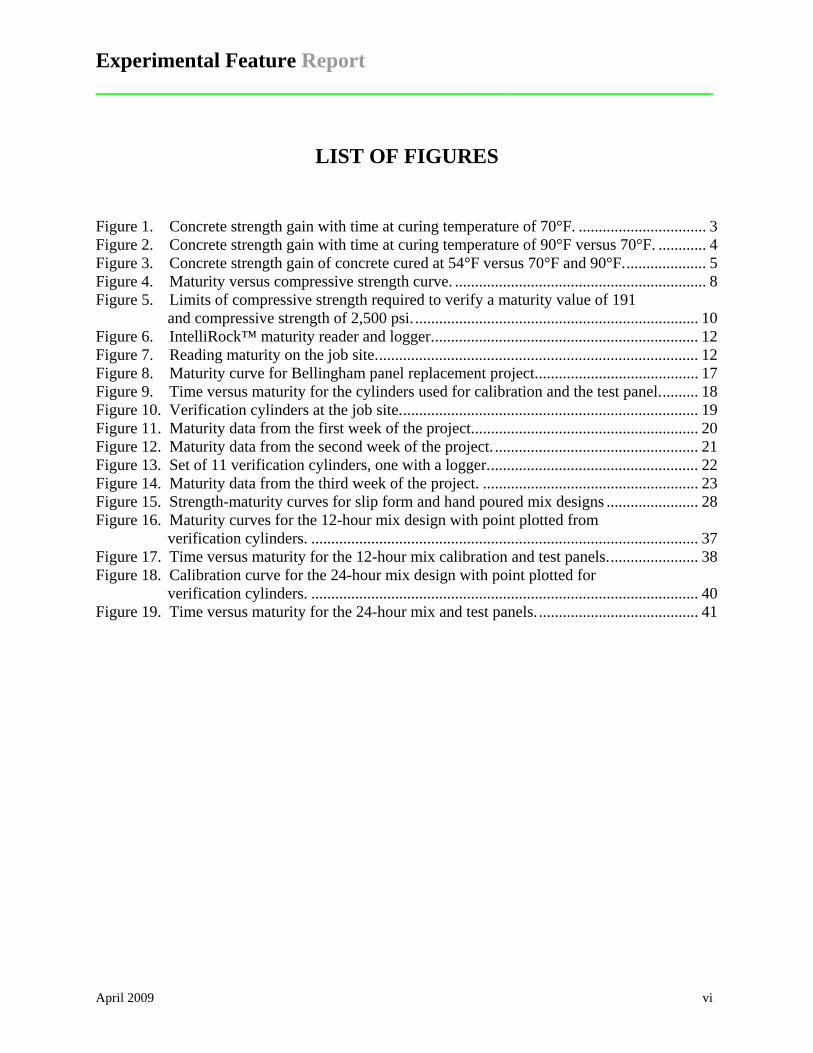
LIST OF FIGURES
Figure 1. Concrete strength gain with time at curing temperature of 70°F. ................................ 3 Figure 2. Concrete strength gain with time at curing temperature of 90°F versus 70°F. ............ 4 Figure 3. Concrete strength gain of concrete cured at 54°F versus 70°F and 90°F..................... 5 Figure 4. Maturity versus compressive strength curve. ............................................................... 8 Figure 5. Limits of compressive strength required to verify a maturity value of 191
and compressive strength of 2,500 psi. ....................................................................... 10 Figure 6. IntelliRock™ maturity reader and logger................................................................... 12 Figure 7. Reading maturity on the job site................................................................................. 12 Figure 8. Maturity curve for Bellingham panel replacement project......................................... 17 Figure 9. Time versus maturity for the cylinders used for calibration and the test panel.......... 18 Figure 10. Verification cylinders at the job site........................................................................... 19 Figure 11. Maturity data from the first week of the project......................................................... 20 Figure 12. Maturity data from the second week of the project. ................................................... 21 Figure 13. Set of 11 verification cylinders, one with a logger..................................................... 22 Figure 14. Maturity data from the third week of the project. ...................................................... 23 Figure 15. Strength-maturity curves for slip form and hand poured mix designs ....................... 28 Figure 16. Maturity curves for the 12-hour mix design with point plotted from
verification cylinders. ................................................................................................. 37 Figure 17. Time versus maturity for the 12-hour mix calibration and test panels....................... 38 Figure 18. Calibration curve for the 24-hour mix design with point plotted for
verification cylinders. ................................................................................................. 40 Figure 19. Time versus maturity for the 24-hour mix and test panels. ........................................ 41
Experimental Feature Report __________________________________________________________
April 2009 vii
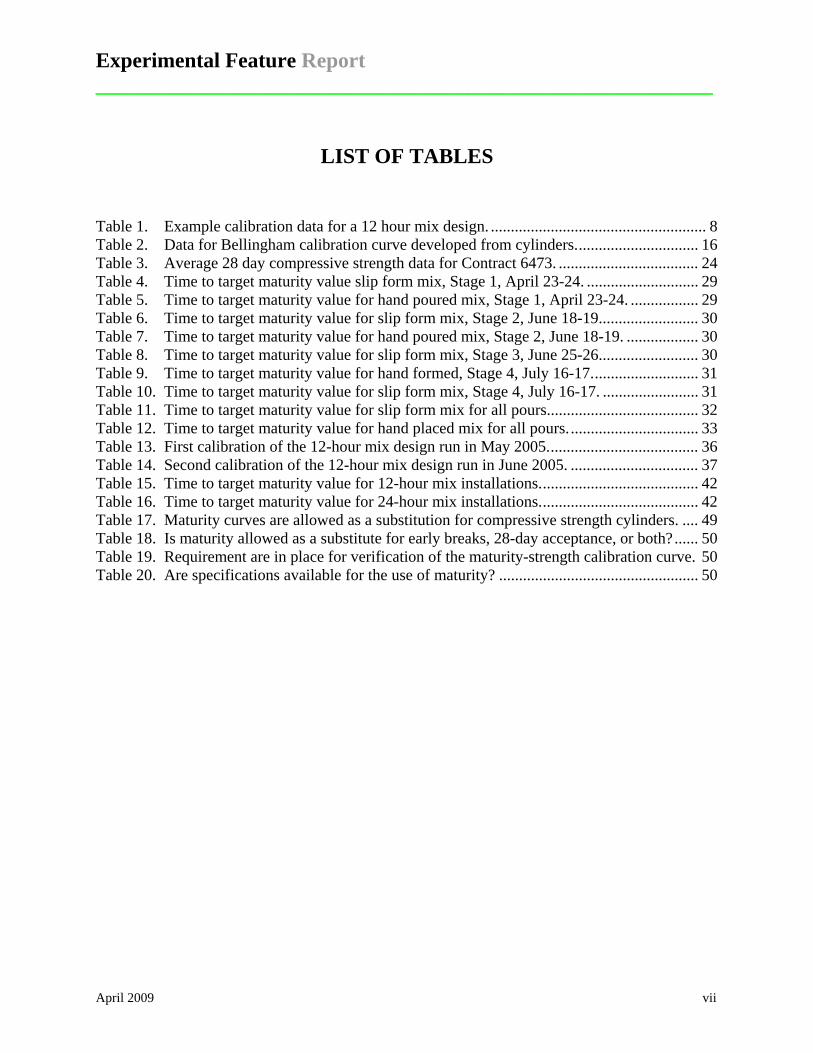
LIST OF TABLES
Table 1. Example calibration data for a 12 hour mix design. ...................................................... 8 Table 2. Data for Bellingham calibration curve developed from cylinders............................... 16 Table 3. Average 28 day compressive strength data for Contract 6473. ................................... 24 Table 4. Time to target maturity value slip form mix, Stage 1, April 23-24. ............................ 29 Table 5. Time to target maturity value for hand poured mix, Stage 1, April 23-24. ................. 29 Table 6. Time to target maturity value for slip form mix, Stage 2, June 18-19......................... 30 Table 7. Time to target maturity value for hand poured mix, Stage 2, June 18-19. .................. 30 Table 8. Time to target maturity value for slip form mix, Stage 3, June 25-26......................... 30 Table 9. Time to target maturity value for hand formed, Stage 4, July 16-17........................... 31 Table 10. Time to target maturity value for slip form mix, Stage 4, July 16-17. ........................ 31 Table 11. Time to target maturity value for slip form mix for all pours...................................... 32 Table 12. Time to target maturity value for hand placed mix for all pours................................. 33 Table 13. First calibration of the 12-hour mix design run in May 2005...................................... 36 Table 14. Second calibration of the 12-hour mix design run in June 2005. ................................ 37 Table 15. Time to target maturity value for 12-hour mix installations........................................ 42 Table 16. Time to target maturity value for 24-hour mix installations........................................ 42 Table 17. Maturity curves are allowed as a substitution for compressive strength cylinders. .... 49 Table 18. Is maturity allowed as a substitute for early breaks, 28-day acceptance, or both?...... 50 Table 19. Requirement are in place for verification of the maturity-strength calibration curve. 50 Table 20. Are specifications available for the use of maturity? .................................................. 50

Experimental Feature Report __________________________________________________________
April 2009 1
Introduction This study is the result of a continued effort by the Washington State Department of
Transportation (WSDOT) to pursue and implement new technologies into the construction
process to better serve the public. One of these new technologies is concrete maturity. Maturity
is an approach to quality control that predicts the strength of the in-place concrete based on its
internal temperature. It is a quality control technique for concrete that is firmly grounded in
basic concrete fundamentals such as cement hydration and concrete’s response to field
conditions such as temperature and moisture. These basic fundamentals include the knowledge
that concrete will gain strength faster when cured at higher temperatures and will gain little or no
strength when exposed to very cold temperatures. Maturity takes these varying curing conditions
in the field into account by measuring and recording the internal temperature of the concrete with
special sensors or loggers embedded in the concrete at the time of placement.
WSDOT’s current quality control procedures are based primarily on determining the
strength at 28 days for samples cured in the laboratory under very controlled conditions. It does
not take into account the environmental conditions experienced by the concrete placed on the job
site. A concrete cylinder being cured under moist room conditions at 73°F will perform the same
way during winter and summer construction months. Concrete placed in a structure or on a
roadway at varying conditions of temperature and moisture will develop strength very differently
than the cylinders in the laboratory.
Knowing the actual strength of the in-place concrete is especially important for projects
where the stripping of forms on structures or opening to traffic for pavements is a critical factor
in maintaining accelerated construction schedules. This report provides information on the
maturity concept and describes the experience of using this technology on three pavement
construction projects built between 2003 and 2005.
Current Concrete Acceptance Practices Current practices for the acceptance of concrete involve the sampling of the concrete as it
is delivered to the job site. The sampled concrete is cast into cylinders that are cured at the job
site for 24 hours before being transported to a laboratory facility where they are cured under
Experimental Feature Report __________________________________________________________
April 2009 2
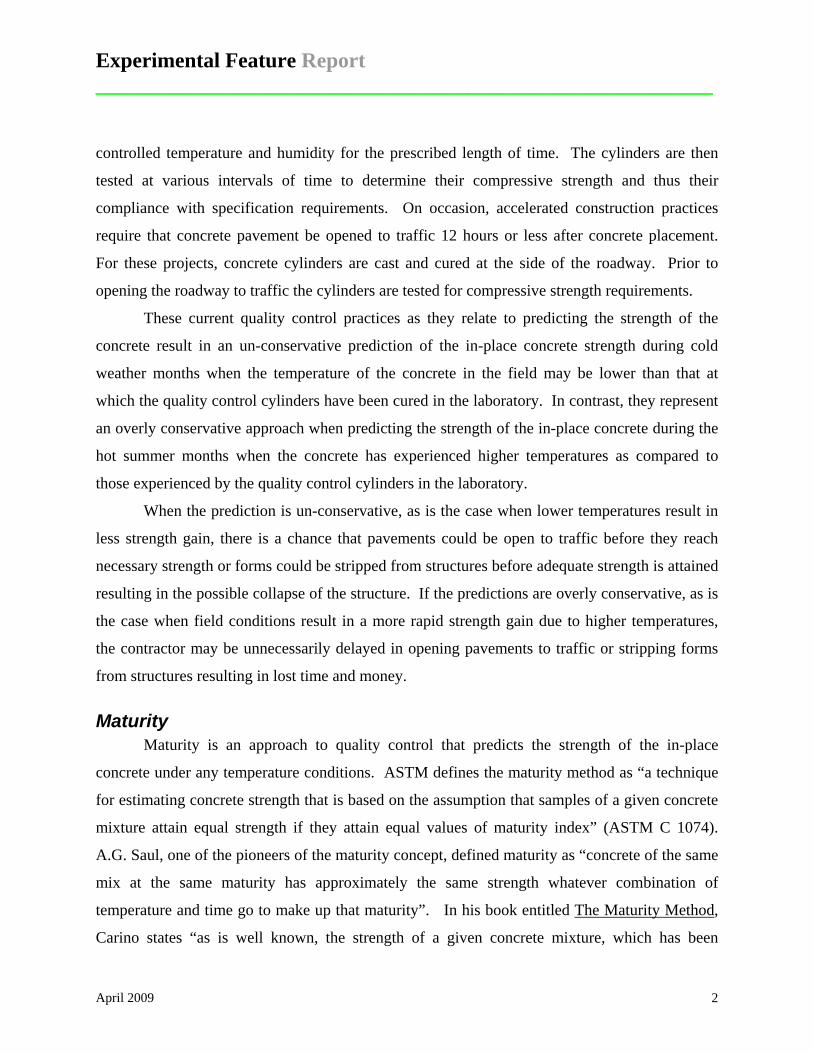
controlled temperature and humidity for the prescribed length of time. The cylinders are then
tested at various intervals of time to determine their compressive strength and thus their
compliance with specification requirements. On occasion, accelerated construction practices
require that concrete pavement be opened to traffic 12 hours or less after concrete placement.
For these projects, concrete cylinders are cast and cured at the side of the roadway. Prior to
opening the roadway to traffic the cylinders are tested for compressive strength requirements.
These current quality control practices as they relate to predicting the strength of the
concrete result in an un-conservative prediction of the in-place concrete strength during cold
weather months when the temperature of the concrete in the field may be lower than that at
which the quality control cylinders have been cured in the laboratory. In contrast, they represent
an overly conservative approach when predicting the strength of the in-place concrete during the
hot summer months when the concrete has experienced higher temperatures as compared to
those experienced by the quality control cylinders in the laboratory.
When the prediction is un-conservative, as is the case when lower temperatures result in
less strength gain, there is a chance that pavements could be open to traffic before they reach
necessary strength or forms could be stripped from structures before adequate strength is attained
resulting in the possible collapse of the structure. If the predictions are overly conservative, as is
the case when field conditions result in a more rapid strength gain due to higher temperatures,
the contractor may be unnecessarily delayed in opening pavements to traffic or stripping forms
from structures resulting in lost time and money.
Maturity Maturity is an approach to quality control that predicts the strength of the in-place
concrete under any temperature conditions. ASTM defines the maturity method as “a technique
for estimating concrete strength that is based on the assumption that samples of a given concrete
mixture attain equal strength if they attain equal values of maturity index” (ASTM C 1074).
A.G. Saul, one of the pioneers of the maturity concept, defined maturity as “concrete of the same
mix at the same maturity has approximately the same strength whatever combination of
temperature and time go to make up that maturity”. In his book entitled The Maturity Method,
Carino states “as is well known, the strength of a given concrete mixture, which has been

Experimental Feature Report __________________________________________________________
April 2009 3
properly placed, consolidated, and cured, is a function of its age and temperature
history.”(Carino, 1991) Before describing the maturity method, some basic fundamentals
concerning concrete must be understood.
Concrete Fundamentals Concrete strength gain is a function of time and temperature as shown in the following
examples. Figure 1 shows a typical concrete mix with a strength gain and time plot when cured
at 100 percent relative humidity at 70°F. Under these curing conditions the concrete will achieve
a compressive strength (S) of approximately 3,500 psi at four days (4) of age.
0
1000
2000
3000
4000
5000
6000
0 5 10 15 20 25 30
Age (Days)
Com
pres
sive
Str
engt
h (p
si)
70°F (21°C)
Temperature
S4
Figure 1. Concrete strength gain with time at curing temperature of 70°F.

Experimental Feature Report __________________________________________________________
April 2009 4
If the same concrete is cured at 90°F and 100 percent humidity, it will exhibit a different strength
gain with time behavior as shown in Figure 2. At the same age of four days, the concrete will
have a higher compressive strength, S4 (approximately 3,900 psi).
0
1000
2000
3000
4000
5000
6000
0 5 10 15 20 25 30
Age (Days)
Com
pres
sive
Str
engt
h (p
si)
70°F (21°C)
90°F (32°C)
Temperature
S4S4
Figure 2. Concrete strength gain with time at curing temperature of 90°F versus 70°F.
Going in the other direction, if the concrete is cured at a lower temperature, say 54°F, the
concrete will have a lower compressive strength at an age of four days, S4 (approximately 3,250
psi) as shown in Figure 3.

Experimental Feature Report __________________________________________________________
April 2009 5
0
1000
2000
3000
4000
5000
6000
0 5 10 15 20 25 30
Age (Days)
Com
pres
sive
Str
engt
h (p
si)
54°F (12°C)70°F (21°C)
90°F (32°C)
S4
Temperature
S4
S4S4@54 < S4@70 < S4@90
Figure 3. Concrete strength gain of concrete cured at 54°F versus 70°F and 90°F.
It should be noted that the concrete cured at higher temperatures will most likely exhibit a lower
ultimate strength than the concrete cured at the lower temperature as shown in Figure 3.
The following are the basic concrete fundamentals on which the maturity concept is
based.
• Strength gain is the result of cement reactions with water, also referred to as cement
hydration
• Cement hydration results in the generation of heat
• Generation of heat results in a temperature rise in the concrete
• Maturity is related to the strength gain in the concrete as a function of time and
temperature
Maturity Principles In order to use the maturity concept, a mathematical function that can accurately relate
time and temperature to strength must be used. The one most commonly used is called the
Nurse-Saul maturity function. It assumes that the chemical reaction rate in concrete increases

Experimental Feature Report __________________________________________________________
April 2009 6
linearly with temperature. The equation that describes this relationship is commonly referred to
as the Nurse-Saul maturity function, shown as Equation 1.
Equation 1
M = Maturity (a.k.a. Temperature-Time Factor) at age t
T = Average Temperature of the concrete during time interval Δt
To = Datum Temperature
The index computed by the equation is known by many different terms, such as the
maturity index value; the temperature-time factor (TTF), or simply the “maturity” of the concrete
(Trost, 2006). The Nurse-Saul function is a mathematical means of calculating the area under
the temperature-time curve for a given concrete above a datum temperature. Various datum
temperatures have been used, but the most common are between -10° C and -20° C with -10° C
being the typical one used. The most common way of expressing the maturity index is in metric
units of °C-hours (usually shown by the shorthand notation “C-Hrs”).
The Arrhenius equation is the most commonly used alternative to the Nurse-Saul
equation (Carino, 1991). It was derived empirically from observations of homogeneous
chemical systems undergoing a single reaction. Roy and Idorn (1982) note that researchers “…
cautioned that since cement is a multiphase material and also the process of cement hydration is
not a simple reaction, homogeneous reaction kinetics cannot be applied.” The Nurse-Saul
equation assumes that the chemical reaction rate of concrete increases linearly with temperature
whereas the Arrhenius equation assumes that the relationship is an exponential function. Trost,
(2006) states that, “Whereas real-world chemical reactions do in fact follow an exponential rate
law, the Arrhenius method is considered theoretically more “correct” than Nurse-Saul.
( )∑ Δ⋅−=t
0o tTTM

Experimental Feature Report __________________________________________________________
April 2009 7
However, the exponential nature of the Arrhenius equation can cause extreme over prediction of
concrete strength under certain unpredictable and uncontrollable conditions.” It thus is not as
widely used as the Nurse-Saul equation.
The datum temperature is the temperature for a given concrete mix below which all
hydration reactions cease. When the temperature of the concrete falls below this temperature no
additional strength gain occurs and no net gain in maturity is recorded. ASTM C 1074
recommends that 0°C (32°F) be used as the datum temperature for Type I cement used without
admixtures when the expected curing temperature is within 0°C and 40°C (32°F and 104°F).
Calibration Curve Development In order to use maturity the relationship between time, temperature and strength must be
determined for each of the mix designs to be used on a given project. This involves making
cylinders from a test batch of each mix design and breaking them at prescribed intervals.
Additional cylinders are cast into which devices that measure maturity are placed and these
devices are read and recorded as the other cylinders are broken at the prescribed intervals. The
prescribed intervals are chosen so that maturity readings bracket the strength needed to open the
roadway to traffic or strip the forms on a structure. A minimum of two cylinders are broken and
averaged to arrive at the compressive strength for each time interval. The cylinders with the
maturity devices imbedded in them can be broken for compressive strength measurement, but
they should be the last in the series. It is desirable that enough points are established for the
curve to break over, that is, change from the steep initial phase to the leveling off phase of
strength gain. This can be attained in as little as three points, however, five points is more ideal.
For example, a panel replacement project on I-5 in the Bellingham developed a mix that
was designed to reach 2,500 psi in 12 to 24 hours. The interval for taking readings and breaking
cylinders began at hour five and progressed hourly until the 2,500 psi target had been exceeded.
The readings where then spaced out to 9 hours, 12 hours and 24 hours as shown in Table 1. This
provided a maturity curve that broke over and provided a very good relationship between
maturity index and compressive strength as shown in Figure 4. For this example a maturity
reading of 191 was obtained at the required opening to traffic strength of 2,500 psi (see WSDOT
Standard Specifications, Section 5-05.3(17) Opening to Traffic).

Experimental Feature Report __________________________________________________________
April 2009 8
Table 1. Example calibration data for a 12 hour mix design.
Time (Hours)
Temperature (°C)
Maturity Reading (C-Hrs)
Compressive Strength (psi)
0 22 0 0 5 38 140 1,400 6 43 176 2,200 7 47 221 3,060 9 50 325 3,490 12 45 474 4,050 24 33 938 5,140
0
1000
2000
3000
4000
5000
6000
0 100 200 300 400 500 600 700 800 900 1000
Maturity (C-Hrs)
Com
pres
sive
Str
engt
h (p
si)
Figure 4. Maturity versus compressive strength curve. Note: The desired 2,500 psi compressive strength is reached at a maturity reading of 191.
Once the strength versus maturity calibration curve has been established in the
laboratory, the monitoring of the concrete placed in the field can begin. This involves the
placement of maturity loggers in the pavement, panels, or structures that are being built. The

Experimental Feature Report __________________________________________________________
April 2009 9
maturity loggers are read at the appropriate time intervals to determine if the in-place concrete
has reached the maturity value required for opening to traffic or form stripping.
The major caveat to the use of the maturity method is that the concrete mixing
proportions and materials being monitored must not deviate from the ones used to develop the
strength-maturity relationship. This would include changes in the brand of cement, the source
and type of fly ash, the sources of aggregates and the water to cement ratio, or the use of
accelerators or other admixtures that would affect the set time of the concrete. If any of these
items change a new strength-maturity curve must be developed.
Verification In order to assure that the concrete being placed in the field has not deviated from the
original mix design, a process called verification is employed. Sets of two or three cylinders are
cast from the concrete being placed in the field. A maturity logger is cast into one of the
cylinders. The cylinders are cured in the laboratory under the same controlled conditions used to
develop the original calibration curve. Maturity readings are taken periodically until the
cylinders reach the target maturity value. Two or all three of the cylinders are broken and the
average compressive strength is compared with the predicted compressive strength
corresponding to the target maturity value. If the compressive strengths of the verification
cylinders are within ±10 percent of the predicted strength, verification is confirmed. Figure 5 is
an example of the required limits for a set of verification cylinder compressive strengths when
the target maturity value was 191 for a required opening to traffic compressive strength of 2,500
psi. If the average is not within the ±10 percent the verification criteria is not met and
verification is not confirmed. When this condition occurs, the contractor is normally directed to
switch to traditional inspection testing techniques until a new strength-maturity relationship can
be developed for the changed conditions of the mix design.

Experimental Feature Report __________________________________________________________
April 2009 10
0
1000
2000
3000
4000
5000
6000
0 100 200 300 400 500 600 700 800 900 1000
Maturity (C-Hrs)
Com
pres
sive
Str
engt
h (p
si)
2,5002,250
2,750 +10%
-10%
Figure 5. Limits of compressive strength required to verify a maturity value of 191 and compressive strength of 2,500 psi.
Field Procedures In summary, a calibration curve is developed to establish at what level of maturity the
desired strength is reached. For WSDOT paving projects, this desired strength is the 2,500 psi
required before the pavement can be opened to traffic. After the calibration curve is developed it
is desirable that the contractor have an estimate of the time necessary to achieve that maturity
level for concrete used on the job site. For this reason test panels are often poured with
embedded loggers. The time to reach maturity is often quicker for the test panels than the
cylinders that are cured in the laboratory because there is more mass of concrete in the panel.
This increases the heat in the concrete which accelerates the hydration process.
During the production of the concrete on the project, the loggers embedded in the panels
for any particular pour are monitored until the maturity value reaches the target for opening to
traffic. This time to reach the target maturity value should be fairly consistent throughout the
Experimental Feature Report __________________________________________________________
April 2009 11
course of the project unless the ambient temperatures are fluctuating wildly. If consistency is not
observed then it should be suspected that the concrete being delivered to the job site has
changed. If it is suspected that the concrete mix has changed, then verification cylinders should
be cast and checked against the original strength-maturity curve. If the original calibration curve
cannot be verified a new calibration curve should be developed.
Maturity Equipment The equipment used to measure maturity has evolved over time from manual methods
using temperature probes and hand held calculators to the current systems that, at the high end,
use a wireless identification tag placed in the concrete that can be read remotely from a vehicle
parked next to the structure or roadway. The type used by WSDOT and many contractors uses a
wired sensor (comprising of a temperature sensor, microprocessor, and data logger) that is
embedded in the concrete. The sensor continuously records the temperature of the concrete and
converts it to a maturity reading. A handheld reader is temporarily connected to the logger to
download the continuously measured temperature and maturity values. This information can
then be downloaded from the reader to a PC.
A 2003 Innovative Pavement Research Foundation report on using maturity for airfield
pavement construction compares the performance of a number of devices used to measure
maturity (Rasmussen and Cable 2003). The devices compared in this report were:
1. T-Type Thermocouples
2. Dallas Semiconductor Thermocron iButton®
3. Engius intelliRockTM Maturity, Temperature and prototype Strength Loggers
4. Identec Solutions i-Q Tags
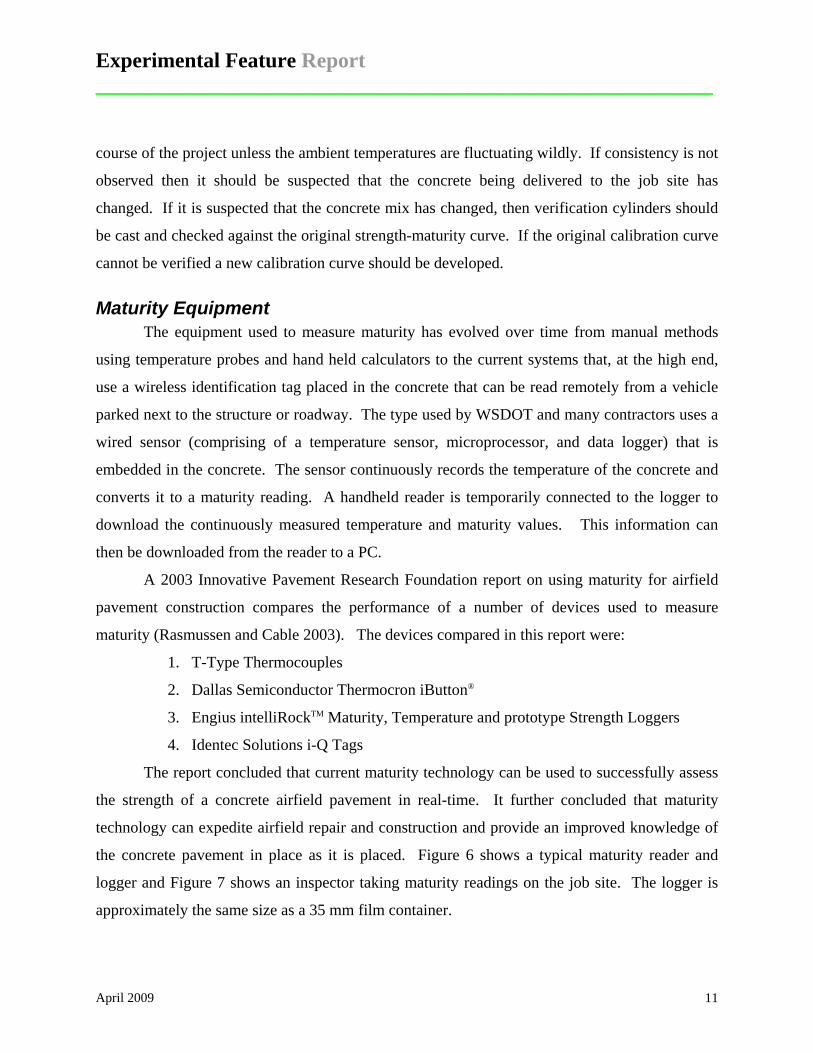
The report concluded that current maturity technology can be used to successfully assess
the strength of a concrete airfield pavement in real-time. It further concluded that maturity
technology can expedite airfield repair and construction and provide an improved knowledge of
the concrete pavement in place as it is placed. Figure 6 shows a typical maturity reader and
logger and Figure 7 shows an inspector taking maturity readings on the job site. The logger is
approximately the same size as a 35 mm film container.

Experimental Feature Report __________________________________________________________
April 2009 12
Figure 6. IntelliRock™ maturity reader and logger.
Figure 7. Reading maturity on the job site.

Experimental Feature Report __________________________________________________________
April 2009 13
Benefits of Maturity The benefits of using maturity as contrasted with traditional quality control procedures
are:
• It provides a real-time, in-place indication of the strength of the concrete.
• It is a non-destructive testing method as contrasted to breaking cylinders in the laboratory.
• It provides early quality verification of the in-place concrete, often within hours of its
placement.
• It accelerates the construction process by allowing the pavement to be opened to traffic or formwork stripped from structures.
• It reduces the quantity and cost of sampling and testing by reducing the number of
cylinders that need to be cast and broken to determine strength.
• The maturity method is readily assessable to most materials laboratories because it is based on traditional cylinder compressive strength tests for its development.
Weaknesses of Maturity The maturity method also has its weaknesses. Changes in the brand of cement, the
source and type of fly ash, the source of the aggregate or the water to cement ratio can result in a
change in the strength-maturity relationship and require a new calibration curve. The method
also cannot account for humidity conditions during curing, that is, if there is not enough moisture
present for hydration to occur the strength gain will not be realized as predicted by the maturity
curve. It is not accurate when there are large temperature swings during the curing process. The
method also cannot account for concreting practices that result in inadequate consolidation, poor
placement techniques, inadequate curing, lack of protection during early ages, or fluctuations in
air content.

Experimental Feature Report __________________________________________________________
April 2009 14
Use of the Maturity Concept WSDOT has allowed the use of maturity on its projects since the early 1990’s. The first
use was documented in a report by Goller and Bharil on a project that built the Albro and
Spokane Street exit ramps from I-5 into downtown Seattle (Goller and Bharil 1992). Maturity
was used to provide assurance that the opening to traffic flexural strength was achieved prior to
the opening of these two major structures. Maturity has also been used on a number of fast track
concrete intersection construction projects in the state. A report by Nemati, et. al. documented
the use of maturity in the construction of three intersections in the Kennewick, Washington
urban area (Nemati, et. al. 2003). Maturity has also been employed on a number of other state
projects by Contractors, independent of WSDOT specification requirements.

Experimental Feature Report __________________________________________________________
April 2009 15
Case Studies WSDOT has used the maturity concept on three major projects beginning in 2003. Two
of the projects involved panel replacements, one on I-5 in Bellingham and the other on I-205 in
Vancouver. The third project involved the replacement of a short section of I-5 in downtown
Seattle. On each of these projects the work was done under an accelerated schedule with respect
to opening the finished pavement to traffic. As with any new process, there is a learning curve
for both State and Contractor personnel on how the maturity process works in real situations.
The questions that should be asked for each case study are as follows:
• Were valid calibration curves developed for each mix design used on the project?
• Were verification procedures used to make sure the mix design used on the project
matched the original mix design used for calibration?
• Were the times to the target maturity value consistent throughout the project,
indicating that the concrete delivered to the job site was consistent?
• Were target maturity values used to open the pavement to traffic?
• Was the maturity data collected and reported in a clear and understandable format?
It should be noted that not all of these questions can be answered for each case study because of
variations in the requirements contained in the contract Special Provisions, which were different
for each project.
The information from each case study is organized to look first at the development of the
calibration curves for each mix design followed by data from the loggers installed on the project.
Next, any verification testing is described, followed by a discussion of the Special Provisions
contained in the project’s contract plans and how the Contractor did or did not comply with
them. This is followed by a discussion of any special problems that were encountered with the
use of maturity on the project. Finally, the questions presented above are discussed to determine
how well the maturity concept was implemented.

Experimental Feature Report __________________________________________________________
April 2009 16
Bellingham
Introduction Contract 6473, 36th St Vicinity to SR 542 Vicinity PCCP Rehabilitation and Seismic,
included the replacement of approximately 500 concrete panels between Milepost 252.14 and
255.44 on both north and southbound I-5 through Bellingham. The contract plans called for six
Monday morning to Friday morning closures to accomplish the work. The Contractor, however,
used only four of the six planned closures and thereby earned nearly $100,000 in incentives. All
of the panel replacement work took place in August and September of 2003.
Calibration The Contractor developed a calibration curve for his single mix design using cylinders
and beams as directed in the Special Provisions (Appendix A) for the contract. The calibration
curve was developed from the cylinder compressive strength data (Table 2) and the data from the
beams, as it turns out, was not used. The curve developed from the cylinder information was
excellent with two points on the curve before the target strength and four points after that
strength was achieved. This provided a curve that broke over, indicating that the hydration of the
concrete had reached its peak and was slowing down (Figure 8). For this mix the 2,500 psi
compressive strength was achieved at a maturity reading of 191 in approximately 6.2 hours.
According to the Inspector’s Daily Report (IDR) of August 19, 2003, the concrete supplier had
intended the mix would cure to the opening to traffic strength in approximately seven hours.
Table 2. Data for Bellingham calibration curve developed from cylinders.
Age (Hours)
Maturity (C-Hrs)
Compressive Strength (psi)
5 140 1,400 6 176 2,200 7 221 3,060 9 325 3,490 12 474 4,050 24 938 5,140

Experimental Feature Report __________________________________________________________
April 2009 17
0
1000
2000
3000
4000
5000
6000
0 100 200 300 400 500 600 700 800 900 1000
Maturity (C-Hrs)
Com
pres
sive
Str
engt
h (p
si)
2,500
Figure 8. Maturity curve for Bellingham panel replacement project.
The Contractor also cast a test panel to see how long a larger mass of concrete would
take to reach the target maturity value determined by the calibration curve. The maturity
readings from the loggers installed in the test panel showed a slower rate of strength gain than
the cylinders cured in the laboratory, reaching the target maturity value in approximately 6.6
hours (see Figure 9). This is contrary to what is expected given that the test panel has a greater
mass of concrete than the cylinders and should reach the target maturity more rapidly due to the
larger amount of heat generated by the cement hydration process. The project office reported
that the difference was likely the result of allowing the cylinders used to develop the calibration
curve to be exposed to direct sunlight during the initial curing prior to being placed in the moist
room. This extra heating accelerated the curing of the concrete in the cylinders more than the
mass of concrete accelerated the curing of the panels.

Experimental Feature Report __________________________________________________________
April 2009 18
0
100
200
300
400
500
600
700
0 2 4 6 8 10 12 14
Time (hours)
Mat
urity
(C-H
rs)
Cyl. Calibration 7/7 Slab Data
Figure 9. Time versus maturity for the cylinders used for calibration and the test panel.
Field Measurements
Week One The Region and Headquarters’ Materials Laboratory personnel visited the project during
the first three of the four weeks of the project to make sets of cylinders which were cured in the
laboratory to verify the calibration curve developed by the Contractor. Two such sets were cast
on the first day with a logger embedded in one of the cylinders to monitor the maturity value.
The first logger was read at 5, 6 and 24 hours and the second logger was read at 4, 5, 7, 8 and 23
hours. Cylinders were broken at 6 hours and 24 hours for the first set and 6 hours and 23 hours
for the second set. Figure 10 shows one of the sets of five cylinders, one with a logger, placed
on the shoulder where they remained for 24 hour prior to being transported to the laboratory for
moist curing and testing.

Experimental Feature Report __________________________________________________________
April 2009 19
Figure 10. Verification cylinders at the job site.
The logger embedded in the first set of cylinders indicated that the target maturity value
of 191 was reached at 5.3 hours. The logger embedded in the second set of cylinders indicated a
more reasonable time of 7.5 hours to the target maturity value of 191. The cylinders broken for
the first set had compressive strengths of 2,040 psi at 6 hours and 4,650 psi at 24 hours. The
cylinders broken for the second set had compressive strengths of 1,010 at 6 hours and 5,300 psi
at 23 hours. The results from the two sets of cylinders are compared to the calibration curve in
Figure 11.

Experimental Feature Report __________________________________________________________
April 2009 20
The four data points from the two sets of cylinders were checked to see if they verify that
the mix used to make the cylinders matched the mix used to make the calibration curve. Simple
linear equations were derived to describe the straight line portions of the calibration curve in the
vicinity of the four points. These equations were used to calculate the compressive strength of
the calibration curve at the maturity value from the sets of points. Only one of the points was
found to verify the calibration curve, and it was, as expected, the one that actually fell on the
calibration curve at a maturity value of 760 and compressive strength of 4,650 for the first set of
cylinders.
0
1000
2000
3000
4000
5000
6000
7000
0 100 200 300 400 500 600 700 800 900 1000
Maturity (C-Hrs)
Com
pres
sive
Str
engt
h (p
si)
Cyl. Calibration 7/7 1st Cyl. Set on 8/20 2nd Cyl. Set on 8/20
2500
Figure 11. Maturity data from the first week of the project.
During the first week of the project the maturity meter broke and the Contractor was
forced to use cylinder breaks to determine when the roadway could be opened to traffic. A
cylinder tested at seven hours from the last pour on August 21 reached only 500 psi. Another
cylinder tested at 15 hours broke at 3,000 psi allowing the opening to traffic to begin at 15 hours

Experimental Feature Report __________________________________________________________
April 2009 21
from the last pour. The IDR’s have a note that a panel poured with the mix that had only reached
500 psi in seven hours could easily be chipped with a fingernail.
Week Two The second week of the project a third set of cylinders was cast to see if the mix in the field
matched the calibration curve. A sufficient number of cylinders were cast so that compressive
strength data could be collected at five, six, seven, eight, and 12 hours. The curve developed
from these cylinders is shown in Figure 12 along with the original calibration curve. The second
curve predicted that 2,500 psi would be reached at a maturity value of 319, which is well beyond
the 191 target value from the original calibration curve. Once again the data from the third set of
cylinders does not match the original calibration curve. Figure 13 shows the cylinders on the
grade, one with a logger, waiting for transport to the laboratory.
0
1000
2000
3000
4000
5000
6000
7000
0 100 200 300 400 500 600 700 800 900 1000
Maturity (C-Hrs)
Com
pres
sive
Str
engt
h (p
si)
Cyl. Calibration 7/7 Cyl. Calibration on. 8/27
2500
Figure 12. Maturity data from the second week of the project.

Experimental Feature Report __________________________________________________________
April 2009 22
Figure 13. Set of 11 verification cylinders, one with a logger.
Week Three On the third week of the project a fourth set of cylinders was cast to check on the mix
placed in the field. Sufficient cylinders were cast to develop a calibration curve and it is shown
in Figure 14 along with the original calibration curve. The data from the third week’s maturity
versus compressive strength almost exactly match the original calibration curve with a maturity
value of 192 at 2,500 psi compressive strength.

Experimental Feature Report __________________________________________________________
April 2009 23
0
1000
2000
3000
4000
5000
6000
7000
0 100 200 300 400 500 600 700 800 900 1000
Maturity (C-Hrs)
Com
pres
sive
Str
engt
h (p
si)
Cyl. Calibration 7/7 Cyl. Calibration on 9/10
250
Figure 14. Maturity data from the third week of the project.
Week Four There was no data collected for the fourth and final week of closure.
Verification The calibration curve developed by the Contractor was checked on three of the four
weeks that construction took place. The typical verification procedures described at the
beginning of this report were not followed, but the process that was followed did point out some
problems with the mix on the first two weeks of concrete placement. As standard procedure for
all WSDOT projects, cylinders were cast on each day’s pour and broken at 28 days to provide
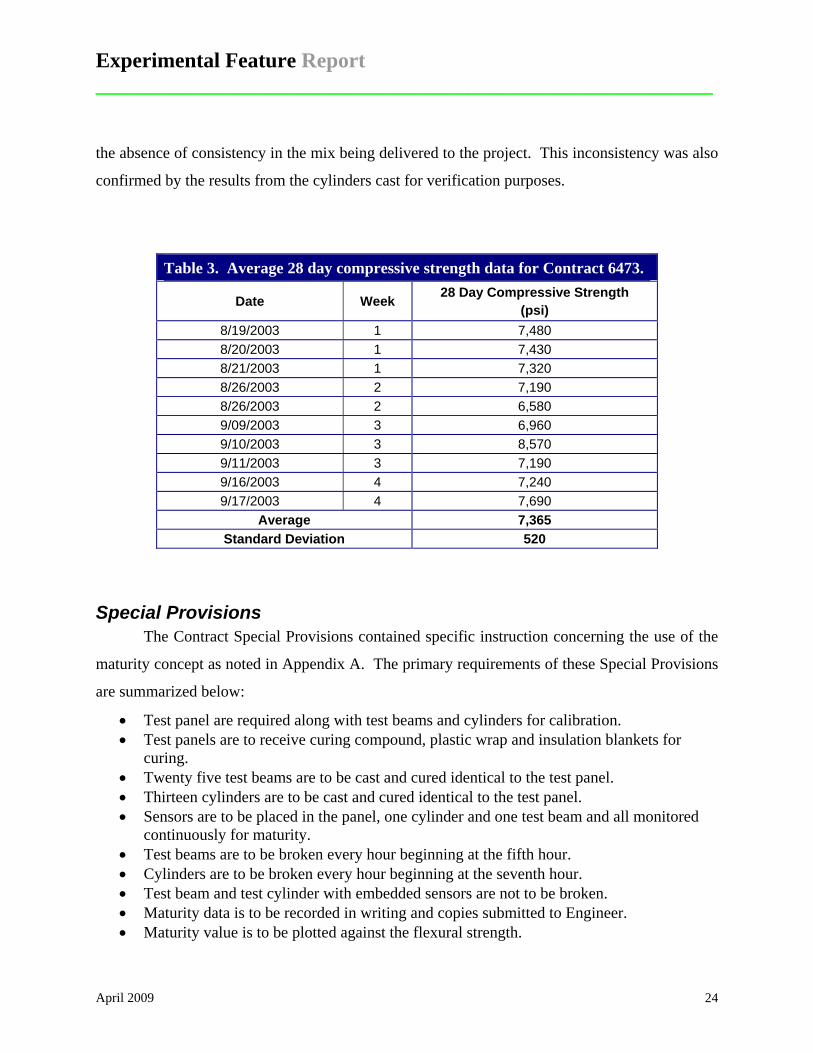
additional assurance that the concert used on the project met strength requirements. The results
from these cylinders (Table 3) show that the project’s average compressive strength from each
set of two cylinders broken for each day was 7,365 psi with a range of 6,580 to 8,570 and a
standard deviation of 520 psi. The almost 2,000 psi range and high standard deviation confirm
Experimental Feature Report __________________________________________________________
April 2009 24
the absence of consistency in the mix being delivered to the project. This inconsistency was also
confirmed by the results from the cylinders cast for verification purposes.
Table 3. Average 28 day compressive strength data for Contract 6473.
Date Week 28 Day Compressive Strength (psi)
8/19/2003 1 7,480 8/20/2003 1 7,430 8/21/2003 1 7,320 8/26/2003 2 7,190 8/26/2003 2 6,580 9/09/2003 3 6,960 9/10/2003 3 8,570 9/11/2003 3 7,190 9/16/2003 4 7,240 9/17/2003 4 7,690
Average 7,365 Standard Deviation 520
Special Provisions The Contract Special Provisions contained specific instruction concerning the use of the
maturity concept as noted in Appendix A. The primary requirements of these Special Provisions
are summarized below:
• Test panel are required along with test beams and cylinders for calibration. • Test panels are to receive curing compound, plastic wrap and insulation blankets for
curing. • Twenty five test beams are to be cast and cured identical to the test panel. • Thirteen cylinders are to be cast and cured identical to the test panel. • Sensors are to be placed in the panel, one cylinder and one test beam and all monitored
continuously for maturity. • Test beams are to be broken every hour beginning at the fifth hour. • Cylinders are to be broken every hour beginning at the seventh hour. • Test beam and test cylinder with embedded sensors are not to be broken. • Maturity data is to be recorded in writing and copies submitted to Engineer. • Maturity value is to be plotted against the flexural strength.

Experimental Feature Report __________________________________________________________
April 2009 25
• Minimum maturity value for opening pavement to traffic is the maturity value at 2.8 Mpa (2,500 psi)
Special Provisions Compliance The Special Provisions concerning maturity were very minimal for this project. They
did not specify the frequency that loggers should be placed in panels and or that verification
testing was to be performed. They did specify the casting of test beams which apparently were
not used to develop the strength-maturity value. No standard data collection sheets were
specified, however, one data sheet developed by WSDOT was used throughout the project to
record data from the maturity meters (see Appendix B). The number of cylinders required at 13
was an absolute minimum given the six points that were established on the strength-maturity
curve. The validation of the strength-maturity relationships throughout the course of the project
was done by the Region and HQ Materials Laboratory for information purposes as it was not a
requirement of the Special Provisions.
Primary Questions Addressed A review of the primary questions will provide an idea of how the maturity concept was
implemented on the Bellingham panel replacement project.
Were valid calibration curves developed for each mix design used on the project? The calibration curve for this project was excellent with two points on the curve before and four points after the break over point in the curve. Were verification procedures used to make sure the mix designs used on the project matching the original mix design used for calibration? No validation testing was required in the Special Provision; however, the Region and Headquarters Materials Laboratory staff sampled the job mix and did testing to verify that the mix being used matched the original mix design. The results indicated that the mix used during the first two weeks of the project did not match the original maturity curve. The samples tested the third week of the project duplicated the original maturity curve. Were the times to the target maturity value consistent throughout the project indicating that the concrete delivered to the job site was consistent?

Experimental Feature Report __________________________________________________________
April 2009 26
The record keeping on the project did not capture the maturity data in a manner that could be analyzed to determine if there was any consistency in the time to reach the target maturity value. Listed below are the three values recorded in the IDR’s:
1. August 28, 2003 entry “We read the Maturity Meter on the NB Lt Lane. Reading was 356.”
2. September 11, 2003 entry “Bill Lingenfelder of Landel Construction read the Maturity Meter at 6.5 hours the reading was 243 CH. Wilder was told that they could reopen the NB Rt. Lane to traffic at 9:45 p.m.”
3. September 18, 2003 entry “Bill Lingenfelder read Maturity Meter on panels placed yesterday. Reading was 710 degrees at 9:10 am.”
Did the use of the maturity method have any affect on opening the pavement to traffic in a timely manner? It was impossible to determine if the maturity values were being relied upon to determine the opening to traffic time due to the lack of documentation for the project as noted above. That does not mean that they were not used, just that there is no record indicating this happened. Were the forms for recording and reporting data used throughout the project? The Special Provisions did not provide any standard forms for reporting. The Region Materials Laboratory did use one form for collecting maturity meter readings throughout the project. The data from the loggers installed in the field was erratically reported in the IDR’s as noted previously.
Problems The sets of cylinders tested during the first two weeks of closure indicated that the mix being
delivered to the job site was different than the mix used to develop the calibration curve. This
irregularity combined with the fact that the maturity meter broke the first week of the project
eliminated the use of the maturity concept until the third week of closure. An overall lack of
familiarity with the maturity concept by both Contractor and State personnel, the lack of
direction provided by the Special Provisions, and the newness of the methodology worked
against this being a successful implementation of the maturity method. However, the project
office was generally supportive of the using maturity as evidences in the comments found in the
debriefing following the conclusion of the project, see Appendix C
Experimental Feature Report __________________________________________________________
April 2009 27
James to Olive
Introduction The second case study was also located on I-5. Contract 6886, James Street Vicinity to
Olive Way Vicinity Pavement Rehabilitation – PCCP, replaced 1,800 lineal feet of damaged
PCCP pavement with approximately 6,000 cubic yards of new PCCP between Milepost 164.41
and 166.36. Although the project was only 0.34 miles in length it was complicated by having to
pave under the Washington State Convention Center that spans I-5 at this location. The
construction took place on four 55-hour non-consecutive weekend closures between April and
July of 2005. This project had a very high risk factor because of the high traffic volumes, the
short construction windows, the confined spaces, and the high impact to the public, making it an
ideal project for the use of maturity.
Calibration Two types of concrete paving were used, slip formed and hand placed. Two mix designs
and two strength-maturity calibration curves were developed, one for each placement process.
Figure 15 shows the two maturity curves developed by the concrete supplier. The curve for the
mix to use with the slip form placement method was excellent with one point before the break
over in the curve and three after the break. Although the curve for the hand placed mix design
had only three data points the break in the curve was well defined and its similarity to the curve
for the slip form mix provided assurance of its applicability. The target maturity values at the
2,500 psi compressive strength opening to traffic requirement were 292 for the mix used for the
slip form placement method and 322 for the mix used for the hand placed mix.

Experimental Feature Report __________________________________________________________
April 2009 28
0
500
1,000
1,500
2,000
2,500
3,000
3,500
4,000
4,500
5,000
0 100 200 300 400 500 600 700 800 900 1000
Maturity Value (C-Hrs)
Com
pres
sive
Str
engt
h (p
si)
Hand Pour 8049-H Slipform 8049-P
Figure 15. Strength-maturity curves for slip form and hand poured mix designs
Field Measurements
Stage 1 The four weekend construction periods were designated Stages 1-4. In Stage 1, that took
place on the weekend of April 23 and 24, there were 16 loggers embedded for the mix used in
the slip form pavement method. Ten of the sensors survived to provide maturity data. Table 4
summarizes the time to reach the target maturity value of 292 for the 10 loggers. The results
were very consistent with a range between seven hours and nine hours and an average of 7.9
hours. There was one logger placed in the mix designed for the hand placed method and it had a
time to maturity of seven hours as shown in Table 5.

Experimental Feature Report __________________________________________________________
April 2009 29
Table 4. Time to target maturity value slip form mix, Stage 1, April 23-24.
Sensor Number Time to Maturity Value
of 292 (Hours)
1 8.0 2 8.0 3 8.7 4 8.0 5 7.8 6 7.5 7 7.7 8 7.6 9 7.4
10 8.8 Average 8.0
Table 5. Time to target maturity value for hand poured mix, Stage 1, April 23-24.
Sensor Number Time to Maturity Value of 322
1 7.0
Stage 2 The maturity information for Stage 1 was provided by the Contractor using the
monitoring equipment and loggers installed by his personnel. The results from Stages 2-4 were
from loggers installed by the WSDOT and read with a WSDOT maturity meter. A Maturity
Worksheet was provided to the Project Engineer by the Headquarters Pavement Division to
record the information. Appendix D contains a blank maturity worksheet and completed sample
worksheet. Both slip form and hand placed mixes were used on this second weekend closure on
June 18th and 19th. The times to reach the target maturity value for the two loggers embedded in
the slip form mix are shown in Table 6. The time to reach maturity for the logger in the one
hand poured mix is shown in Table 7. The slip form mix was slower in reaching maturity than

Experimental Feature Report __________________________________________________________
April 2009 30
the mix used for the Stage 1 pours with target maturity values being reached in the 9.3 to 10.4.
The hand placed mix was also slower to reach the target value than the first Stage hand pour mix.
Table 6. Time to target maturity value for slip form mix, Stage 2, June 18-19.
Sensor Number Time to Maturity Value of 292
1 10.4 2 9.3
Average 9.9
Table 7. Time to target maturity value for hand poured mix, Stage 2, June 18-19.
Sensor Number Time to Maturity Value of 322
1 9.6
Stage 3 All of the concrete placed on June 25 and 26 in Stage 3 of the project was slip formed.
Four loggers were embedded and the time to the target maturity values are listed in Table 8.
Three of the four loggers reached the target maturity value at a time between 9.2 and 10.1 hours.
The fourth was much faster at 7.8 hours which may indicate a possible mix variation.
Table 8. Time to target maturity value for slip form mix, Stage 3, June 25-26.
Sensor Number Time to Maturity Value of 292
1 7.8 2 10.1 3 9.2 4 9.5
Average 9.2

Experimental Feature Report __________________________________________________________
April 2009 31
Stage 4 Two hand placed mixes and two slip form mixes were placed on July 17-18. The time to
maturity readings are summarized in Table 9 and 10. The time to reach the target maturity value
ranged from 7.5 to 11.6 hours for the hand formed mix and from 7.2 to 9.9 for the slip form mix,
indicating some inconsistency for both mixes.
Table 9. Time to target maturity value for hand formed, Stage 4, July 16-17.
Sensor Number Time to Maturity Value of 322
1 7.5 2 11.6
Average 9.6
Table 10. Time to target maturity value for slip form mix, Stage 4, July 16-17.
Sensor Number Time to Maturity Value of 292
1 9.9 2 7.2
Average 8.6
Summary of Maturity Data The only data available from this project was the time to the target maturity values for the
loggers embedded in the various pours. The average time to the target maturity value for the slip
form pavement for all stages of the project was 8.5 hours with a range of from 7.1 to 10.4 hours
with a standard deviation of 1.05 hours (Table 11). The average for the hand placed mix was 8.9
hours with a range of 7.0 to 11.6 hours and a standard deviation of 2.11 hours (Table 12). In the
absence of verification tests, there is no proof that the mix delivered to the job site was the same
as the mix used to develop the calibration curve. The consistency of the maturity values are an

Experimental Feature Report __________________________________________________________
April 2009 32
indirect measure of the consistency of the mix but not its quality. For this project, the slip form
mix was more consistent than the hand placed mix.
Table 11. Time to target maturity value for slip form mix for all pours.
Stage Sensor Number
Time to Maturity Value of 292
Cut Off Maturity Value*
Time Beyond Cut Off (Hours)
Cut Off Maturity
Value minus Target Value
1 1 8.0 423 2.0 131 1 2 8.0 391 1.5 99 1 3 8.7 361 1.0 69 1 4 8.0 373 1.5 81 1 5 7.8 413 2.0 121 1 6 7.5 436 3.5 144 1 7 7.7 370 1.0 78 1 8 7.6 393 1.5 101 1 9 7.4 382 1.5 90 1 10 8.8 311 0.0 19 2 1 10.4 244 0.0 -48 2 2 9.3 1049 15.0 757 3 1 7.8 491 13.0 199 3 2 10.1 661 9.0 369 3 3 9.2 1057 17.0 765 3 4 9.5 302 0.0 10 4 1 9.9 1062 9.0 770 4 2 7.2 765 10.0 473
Average 8.5 527 4.9 235 Standard Deviation 1.01 272.1 5.6 272.1
* The cut off value is the maturity last reading recorded before the wires were cut or readings were discontinued.

Experimental Feature Report __________________________________________________________
April 2009 33
Table 12. Time to target maturity value for hand placed mix for all pours.
Stage Sensor Number
Time to Maturity Value of 322
Cut Off Maturity Value
Time Beyond Cut Off (Hours)
Cut Off Maturity
Value minus Target Value
1 1 7.0 1030 10.0 708 2 1 9.6 226 0.0 -96 4 1 7.5 1001 13.0 679 4 2 11.6 352 0.0 30
Average 8.9 652 5.8 330 Standard Deviation 2.11 422.8 6.8 422.8
Verification No verification tests were performed on this project.
Special Provisions The complete Contract Special Provisions are shown in Appendix E. The highlights of
the special provisions are summarized below:
• Maturity loggers are to be installed at the frequency of one every 500 cubic yards or
fraction thereof. • Verification testing is required on days 1 and 2 of concrete placement. • A Quality Control Plan based on the strength-maturity relationship is required to monitor
and provide remedial action to ensure the concrete meets design strengths. • Twenty cylinders are required for each mix design and must be cured in accordance with
FOP for AASHTO T 23. Three cylinders are to be tested at each age to develop the strength-maturity relationship.
• Individual and average values are to be recorded at each age for the strength and maturity value.
• Average maturities are to be plotted against average strengths for each age. The plot is to produce a curve which is the strength-maturity relationship
• Loggers/sensors are to be installed in the field a minimum of 2 feet from a panel edge and 4-5 inches from any panel surface
• The Contractor is to supply to the Engineer encrypted data files of the maturity data from the loggers/sensors prior to opening the pavement to traffic.
• Verification procedure is to make a minimum of two cylinders with a logger/sensor embedded in one of the cylinders with cylinders cured in accordance with FOP for

Experimental Feature Report __________________________________________________________
April 2009 34
AASHTO T 23. Compression strength tests are to be performed to verify the strength and time to reach 2,500 psi for opening to traffic. The average strength of the cylinders at each test age (average of 2 cylinders at a time, not the average of additional cylinders) is to be used. Maturity values at the time of compression testing and individual and average strengths of the cylinders are to be recorded on a data sheet. The predicted strength based on the strength-maturity relationship and the percent difference between the predicted strength and the average strength from the cylinder breaks is to be recorded. The strength maturity relationship is verified when the predicted strength established from the strength maturity relationship and the average strength from the cylinder breaks are within 10%.
• A copy of WSDOT Table 3 and an encrypted file for the maturity data shall be provided to the Engineer on a daily basis.
Special Provisions Compliance It appears that the Contractor complied with the number of logger/sensors and the testing
interval requirements, but either did not do the required verification testing, or did not report the
results to the Engineer. If a Quality Control Plan was developed using maturity, it was not
apparent from the records examined for this contract. The maturity data provided by the
Contractor consisted of printouts from the maturity meters which were required, but the data was
not summarized on the forms provided in the Special Provisions.
Primary Questions Addressed Were valid calibration curves developed for each mix design used on the project? The calibration curves were just adequate to define the break over point in the curve for both mix designs used on the project. The curve for the hand poured mix had only three points with one before and two after the break over point. The curve for the slip formed mix has four points, one before and three after the break. It is desirable to have more than three or four points defining the strength-maturity curve. A third mix design was used at the end of the project for hand pours and the calibration data provided was not in a format suitable for the determination of the target maturity value. Were verification procedures used to make sure the mix designs used on the project matched the original mix design used for calibration? There were no verification tests performed during the course of the project.

Experimental Feature Report __________________________________________________________
April 2009 35
Were the times to the target maturity value consistent throughout the project indicating that the concrete delivered to the job site was consistent? The times to the target maturity value were fairly consistent for the slip form mix with a standard deviation of 1.05. The hand placed mix had a standard deviation of 2.11, however, there were only four loggers in this group as contrasted with the slip form mix group that had 18 loggers. Were target maturity values used to open the pavements to traffic? There was no information available that indicated if the Contactor relied upon the maturity data for his opening to traffic requests to the State. The maturity value at which the loggers were disconnected may be a secondary source of information on whether maturity was used to allow the pavement to be open to traffic. If the logger was read well beyond the target maturity value it might be assumed that opening the pavement to traffic was not a critical issue. If, however, the logger was turned off immediately after the target maturity value was reached, then it might be assumed that there was an urgency to get the pavement open to traffic. This assumes, however, that the loggers were placed in the mix that was poured at the end of the pours done for that particular weekend, as per the instructions from WSDOT. Tables 11 and 12, which summarize the maturity reading data for both slip form and hand placed pours includes the maturity value when the logger was disconnected and compares that to the target maturity value. The data indicates that for the slip form pours all of the Stage 1 loggers were disconnected within 3.5 hours of the target maturity value. For the slip form pours there was one logger in Stage 2 and one in Stage 3 that were disconnected when at or before the target maturity was reached indicating that opening to traffic was critical. For the hand poured areas, two out of the four were disconnected at or before the target maturity value was reached. In summary, 14 our of the total of 22 (64 percent) of the loggers were disconnected at or before the target maturity value was reached indicating that for the majority of the concrete placed the maturity value may have played a critical role in allowing the Contractor to open the pavement to traffic. The maturity value at the time the loggers were disconnected may also be a secondary indication of the possible urgency to open the pavement to traffic. If the cut off maturity value exceeds the target maturity value by a large margin, then it probably was not critical to open that particular portion of the pavement to traffic. The cut off maturity value and the extent to which it exceeded the target maturity value are also listed in Tables 11 and 12. The data mimics the previous data on cut off time with most of the maturity values did not exceed the target value by a large margin. Were the forms provided in the Special Provisions used for recording and reporting maturity data on the project? The Contractor used one of the forms to develop calibration curves. The Stage 1 maturity data was provided as required in the Special Provisions. A form provided by the Headquarters Pavements Division was used to collect maturity data from loggers installed by WSDOT for Stages 2-4.

Experimental Feature Report __________________________________________________________
April 2009 36
Vancouver Vicinity
Introduction The final case study is another panel replacement project. Contract 6916, SR-500 to I-5 PCCP
Rehabilitation and Dowel Bar Retrofit, was located on I-205 in the vicinity of Vancouver. The
work entailed the replacement of approximately 110 full and 60 half panels over a distance of
approximately 6.5 miles between Mileposts 31.36 and 37.73. Construction took place on six
weekend closures from May to July of 2005. The Contractor developed both a 12-hour and a 24-
hour mix that was used depending upon the constraints of time. The Contractor also obtained the
services of a consultant to do the maturity calibration curve development and logger monitoring
on the project.
Calibration
12-Hour Mix Design Two calibration runs were made for the 12-hour mix, one in May and another in June.
The raw data from these two runs is shown in Tables 13 and 14. In both cases the first cylinder
breaks came after the target 2,500 psi compressive strength had been exceeded. On the first
calibration run the initial cylinder break was made at a little over 10 hours and the maturity value
was 323 and the compressive strength 2,637 psi, 137 psi over the 2,500 target. On the second
calibration run the first break was made at seven hours. Even though the break was made three
hours earlier then the first run, the maturity value was 350 and the compressive strength 2,981,
481 psi over the target. The maturity curves developed from both calibrations are shown in
Figure 16.
Table 13. First calibration of the 12-hour mix design run in May 2005.
Time (Hrs) Day Temperature (°C)
Maturity ([0 C] °C-Hrs)
Compressive Strength
10:13 0.43 29 323 2,637 12:00 0.50 27 365 3,170 18:00 0.75 23 513 4,363
48:00:00 2.00 21 1147 5,327 72:00:00 3.00 20 1627 6,037 168:00:00 7.00 26 3728 7,533

Experimental Feature Report __________________________________________________________
April 2009 37
Table 14. Second calibration of the 12-hour mix design run in June 2005.
Time (Hrs) Day Temperature (°C)
Maturity ([0 C] °C-Hrs)
Compressive Strength
5:00 0.21 63 222 0 6:00 0.25 65 286 0 7:00 0.29 64 350 2,981 8:00 0.33 63 413 3.557 9:00 0.38 61 476 4.065 10:00 0.42 58 535 4.397 12:00 0.50 53 648 4.564
0
1,000
2,000
3,000
4,000
5,000
6,000
7,000
0 100 200 300 400 500 600 700
Maturity (C-Hrs)
Com
pres
sive
Str
engt
h (p
si)
Calibration 5/21 Calib. 6/19 Verification
2,500
Figure 16. Maturity curves for the 12-hour mix design with point plotted from verification cylinders.
Missing the 2,500 psi target on the first calibration attempt is probably understandable if
the mix was supposed to reach that strength in 12 hours, although, the conservative approach
would have been to start breaking cylinders even sooner than 10 hours. The second calibration

Experimental Feature Report __________________________________________________________
April 2009 38
run could have been prompted by that very reason, that is, the failure to have readings before the
target compressive strength of 2,500 psi. On the second run the maturity meter readings start at
hour five and progressed hourly through 12 hours. The hour five maturity reading at 222 should
have prompted those running the calibration to begin testing cylinders based on the fact that the
first calibration resulted in a target maturity value around 300. However, no cylinders were
tested until hour seven when the compressive strength reached 2,981 psi, 481 psi over the 2,500
psi target. The second calibration thus also failed to produce a curve that intersected the 2,500
psi compressive strength line.
An explanation for what happened on the second calibration run can be found in an
examination of the temperatures recorded for the cylinders used on the second run, Tables 13 and
14. The temperatures on the second run are more than double those of the first run. Knowing
that maturity is a function of time and temperature, the consultant doing the testing should have
realized that the cylinders for the second calibration run were going to reach the target maturity
value much faster than the first run, and should have begun breaking cylinders much earlier. The
time versus maturity relationship for each of the calibration runs is shown in Figure 17.
12 Hour Mix
0
100
200
300
400
500
600
0 2 4 6 8 10 12 14 16 18 20
Time (Hours)
Mat
urity
(C-h
rs)
Calibration 5/21 Calib. 6/19
Figure 17. Time versus maturity for the 12-hour mix calibration and test panels.
Experimental Feature Report __________________________________________________________
April 2009 39
The elevated temperatures noted in the cylinders for the second calibration run raises two
questions; (1) was the mix design used for the second calibration run identical to the mix design
used for the first calibration run, and (2) if the mix designs were identical, then what curing
conditions existed for the cylinders from the second calibration run that would greatly increase
the internal temperature of the cylinders and thus accelerate the maturing of the concrete.
Cylinders are normally cured in the laboratory either in a moist room or in a water bath kept at a
constant temperature of 73° F. It is difficult to understand how the breakdown of either type of
curing method could result in internal temperatures of between 53 and 64 °C (127 and 148°F for
those metrically challenged). The evidence points to a change in the mix design for the second
calibration run.
The Consultant chose 323 as the target maturity value which probably errs on the
conservative side. This conservatism provided additional assurance that the opening strength
was reached prior to opening to traffic.
24-Hour Mix Design The calibration curve for the 24-hour mix design is shown in Figure 18. Only three
points define the curve with maturity readings at 12, 18 and 24 hours. The curve does not break
over and form a knee as desired, but there is one point prior to the 2,500 psi compressive strength
level and two after, therefore it is a valid maturity curve. The target maturity value of 433 was
determined from this maturity/compressive strength plot.

Experimental Feature Report __________________________________________________________
April 2009 40
24-Hr Mix Design
0
1000
2000
3000
4000
5000
6000
0 100 200 300 400 500 600 700
Maturity (C-Hrs)
Com
pres
sive
Str
engt
h (p
si)
Calibration 5/10 Verification
2,500
Figure 18. Calibration curve for the 24-hour mix design with point plotted for verification cylinders.
Test panels were also cast with loggers to get an idea of how a larger mass of the mix
would mature as contrasted with the cylinders. One panel was insulated with plastic and the
other was left open to the elements. The time versus maturity data for both of the panels is
plotted against the time versus maturity data for the 12-hour calibration curve in Figure 19. As
expected the greater mass of concrete resulted in curves that achieved maturity at a faster rate
then the cylinders, with the insulated panel being quicker than the non-insulated panel.

Experimental Feature Report __________________________________________________________
April 2009 41
-100
100
300
500
700
900
1100
0 5 10 15 20 25
Time (Hours)
Mat
urity
(C-H
rs)
Calibration 5/10 Set #1 Insulated Panel Set #1 Non Insulated Panel
Figure 19. Time versus maturity for the 24-hour mix and test panels.
Field Measurements
12-Hour Mix Design The 12-hour mix design was only used twice during the course of the project, once on the
second weekend and once on the third weekend. The results from both uses are summarized in
Table 15. The information on the project indicated that the 12-hour mix design was the same as
the 24-hour mix design with double the amount of accelerator.

Experimental Feature Report __________________________________________________________
April 2009 42
Table 15. Time to target maturity value for 12-hour mix installations.
Logger Number
Date of
Installation
Time to Maturity Value of
323 (Hours)
Cut Off Maturity Value
Time Beyond Cut Off (Hours)
Cut Off Maturity
Value minus Target Value
4034635 6/5 8.2 583 10.5 260 4034634 6/19 6.4 705 7.0 382
Average 7.3 644 8.8 321 Standard Deviation 1.27 86.3 2.47 86.3
24-Hour Mix Design The majority of the project was built using the 24-hour mix design. The time to target
maturity data is shown in Table 16. It is interesting to note that the time to the target maturity
value for the first weekend is significantly longer than times to maturity for the loggers used on
the weekends that followed. It could have been suspected that something had changed in the
concrete being delivered to the job based on this marked change in the time to maturity,
however; apparently no red flags were raised by the consulting firm monitoring the results.
Table 16. Time to target maturity value for 24-hour mix installations.
Logger Number
Date of Installation
Time to Maturity Value of 433
(Hours)
Cut Off Maturity
Value
Time Beyond Cut Off (Hours)
Cut Off Maturity
Value minus Target Value
4034658 5/21 16.9 785 12.0 352 4034641 5/21 17.5 615 3.5 182 4034643 6/4 13.5 572 19.5 139 4034545 6/5 13.2 564 14.0 131 4034642 6/19 12.2 715 6.0 282 4041452 6/26 13.5 574 3.5 141 4042193 7/10 12.5 593 3.5 160
Average 14.2 631 8.9 198 Standard Deviation 2.12 85.3 6.37 85.3

Experimental Feature Report __________________________________________________________
April 2009 43
Verification
12-Hour Mix Design Verification of the mix design maturity versus compressive strength curve was not
conducted during the course of the project as per the instruction in the Special Provisions.
However, the Consultant did on two occasions cast two test cylinders, one of which had an
embedded logger, for both the 12-hour and 24-hour mixes. The cylinders were not placed in
curing boxes, but cured in the open air. The logger for the 12-hour mix design was monitored
for 19 hours at which time both cylinders were broken. The average compressive strength was
5,470 psi. The maturity value at this time was 595. This point is plotted on Figure 16. Although
the recommended method for verification was not followed, it is interesting to see if the average
compressive strength of the two cylinders falls within ±10 percent of the compressive strength at
the same maturity value as the calibration curve. The compressive strength from the calibration
curve at a maturity value of 595 is 5,105 psi. The average compressive strength of the two
verification cylinders was 5470. This falls within ±10 percent of the value from the calibration
curve (±10 percent is 4595 to 5616 psi). The special cylinders did verify that they were made
from the 12-hour mix design used to develop the calibration curve.
24-Hour Mix Design The maturity of the two test cylinders of the 24-hour mix were monitored for 38 hours at
which time both cylinders were broken resulting in an average compressive strength of 3,335 psi.
The maturity value at this point was 612. The single point from the two test cylinders is plotted
in Figure 18. The average compressive strength of the verification cylinders, 3,335 psi does not
fall within ±10 percent of the value from the calibration curve (±10 percent equals 3364 to 4112
psi) and thus the mix was not verified.
Special Provisions The complete Contract Special Provisions are shown in Appendix F. The highlights of
the special provisions are summarized below:

Experimental Feature Report __________________________________________________________
April 2009 44
• The same Special Provisions used for the James to Olive project were used on this project except that the number of cylinders for the calibration testing was increased from 20 to 23 for each mix design.
Special Provisions Compliance A lack of written data from the project makes it difficult to assess whether the Special
Provisions were followed. Data from nine loggers for a project that extended over four weekend
closures would seem to indicate that one logger per 500 cubic yards or fraction thereof was not
followed. Project correspondence indicates that the testing firm hired to do the maturity testing
was running out of money at the end of the project which may be the reason why there is no data
from the pours on the last weekend. Verification testing was attempted, but not on the first and
second days of concrete placement as specified in the Special Provisions and the testing was not
performed according to these guidelines. One of the two tests did fall within the ±10 percent
requirement at the maturity value that it was tested at and one failed. The verification tests,
because they were not performed at the target maturity value, did not provide any assurance that
the target maturity value established by the calibration curves was valid for the mix used on the
project. Maturity data was reported on forms produced by the maturity meter as required, but the
forms provided in the Special Provisions were not used as required. The reports from the
consultant doing the maturity testing were in letter format and were not consistent in the
information reported, did not always identify the mix design used for each logger installation,
and were, in general, very difficult to decipher.
Primary Questions Addressed Were valid calibration curves developed for each mix design used on the project? Neither of the two trial runs for the 12-hour mix design produced a valid calibration curve. The curve for the 24-hour mix design was straight line with no break over point, and is therefore also somewhat suspect although it did bracket the target compressive strength. Were verification procedures used to make sure the mix designs used on the project matched the original mix design used for calibration?

Experimental Feature Report __________________________________________________________
April 2009 45
A form of verification was performed that used only two cylinders. The breaks did not occur at the target maturity value as required. The maturity/compressive strength point was within the ±10 percent requirement for the 12-hour mix design, but was not for the cylinders cast for the 24-hour mix. Were the times to the target maturity value consistent throughout the project indicating that the concrete delivered to the job site was consistent? The standard deviation for the 24-hour mix design was 2.12 as contrasted with the 1.27 for the 12-hour mix design. The large change in the time to maturity from the pours in the first week as compared to the shorter times to maturity for the following weeks pours accounts for the larger standard deviation for the 24-hour mix design. Were target maturity values used to open the pavement to traffic? Tables 15 and 16 shown that the maturity value reported to the Contractor by the consultant doing the maturity testing were always in excess of the target maturity value. The maturity value recorded minus the target maturity value average for the 12-hour mix was 321 and for the 24-hour mix was 198. The time that the loggers were read beyond the target maturity value is noted in Tables 15 and 16. The two loggers for the 12-hour mix averaged 8.8 hours beyond the target maturity value which does not seem to indicate any urgency to discontinue the readings because of opening to traffic issues. Three out of seven of the 24-hour mix loggers were cut off at 3.5 hours after the target maturity value was reached indicating some urgency and may therefore indicate that opening to traffic was an issue. The bottom line is that it is difficult to tell without other evidence that the maturity readings were used to permit the Contractor to open the pavement to traffic. Were the forms provided in the Special Provisions used for recording and reporting maturity data on the project? None of the forms included in the Special Provisions were used by the testing consultant. The encrypted maturity data from the loggers was transmitted to the state for most of the loggers.

Experimental Feature Report __________________________________________________________
April 2009 46
Case Study Summary
Calibration Curves The first two projects, Bellingham and James to Olive, had valid calibration curves
developed for all of the mix designs used on the project. The Vancouver Vicinity project had
one barely adequate calibration curve with only three points and no break over point and one
invalid curve that did not bracket the target compressive strength for opening to traffic. The
curve developed for the Bellingham project was the only one that had more than two points
defining the curve before the break point. This raises a concern that the Special Provisions do
not adequately define the need to bracket the target compressive strength. It may also point to a
lack of understanding of the maturity concept when, in the case of the Vancouver Vicinity
project, the curve developed for one of the mix designs was not valid.
Verification There were no verification tests run on the James to Olive project. Attempts at
verification were performed on the Bellingham and Vancouver projects, but they provided no
definitive proof that the mix being used on the projects matched the mix design used to develop
the strength/maturity curve. It is apparent that there is a lack of understanding of the need to
verify the mix designs used on the project by either the Contractor or the Project Engineer.
Opening to Traffic The only project that appeared to use the target maturity value as a means to open the
pavement to traffic was James to Olive. The record keeping on the Bellingham project did not
provide information on the issue of opening to traffic. The same can be said for the Vancouver
project, that is, maturity may or may not have been used as the trigger to allow opening to traffic,
but the records do not provide any evidence of either case. Perhaps the newness of the
technology or a lack of understanding of how it can be used did not enable Contractors to adjust
their schedules to take advantage of knowing the in-place strength.
Record Keeping None of the three case studies had adequate recording keeping. Forms provided for the
last two case studies were not, for the most part, used. The result is the records from a project do

Experimental Feature Report __________________________________________________________
April 2009 47
not adequately document what happened on the project. For example, on all three case studies
there is no easy way to find out if the loggers were installed in the first or last concrete poured of
the day or closure period, which is vital piece of information if that logger is being used for the
target maturity value for opening to traffic. Perhaps this is known by the Contractor or even the
street inspectors, but it has not been recorded in any of the contract documentation, at least on
these three case studies.

Experimental Feature Report __________________________________________________________
April 2009 48
Discussion Maturity is a very good tool for predicting the in-place strength of concrete. Proper
understanding and use of maturity can allow contractors to increase their productivity on projects
with accelerated schedules. In only one of the three cast studies, James to Olive, was it clear that
the contractor understood maturity and was able to use it to his advantage. On all of the case
studies there was a lack of compliance with the Special Provision, no verification testing,
inadequate recording keeping, and in one case a calibration curve that was not valid. This
indicates an overall lack of understanding of maturity perhaps on both the Contractor side and
the Project Engineer side of the process. Training, therefore, seems to be one of the key
components missing, or inadequate in its present format.

Experimental Feature Report __________________________________________________________
April 2009 49
Survey In late 2007 a survey on the use of the maturity concept was conducted by the West
Virginia Division of Highways in which 34 states, one Canadian province and Washington D.C.
responded. The questions and a summary of the responses are provided below. The agencies
responding were: Alabama, Arizona, Arkansas, California, Colorado, Connecticut, Florida,
Georgia, Idaho, Illinois, Iowa, Kansas, Kentucky, Louisiana, Maine, Michigan, Minnesota,
Mississippi, Missouri, New Hampshire, New Jersey, New Mexico, North Carolina, Ohio,
Oklahoma, Ontario, South Carolina, South Dakota, Tennessee, Texas, Virginia, Washington
D.C., Washington, West Virginia, Wisconsin, and Wyoming. The complete survey can be found
in Appendix E.
Question #1. Are you familiar with the concrete maturity concept (strength gain based on time and temperature)? One hundred percent answered in the affirmative. Question #2. Do you allow the use of concrete maturity curves (equations) as a substitution for compressive strength cylinders?
Table 17. Are maturity curves allowed as a substitution for compressive strength cylinders?
Category Number of Responses Yes 15 No 10 Allowed On An Experimental Basis 5 Allowed On A Conditional Basis 6 Total 36
Question #3. If so, do you allow this substitution for early break cylinders (field control specimens for form removal, etc.), 28-day acceptance cylinders (standard cured cylinders), or both?

Experimental Feature Report __________________________________________________________
April 2009 50
Table 18. Is maturity allowed as a substitute for early breaks, 28-day acceptance, or both?
Category Number of Responses Allowed 24 Not Allowed 10 Both Early and 28-Day 2 Total 36
Question #4. If you allow the use of maturity concept as a substitute for cylinders, do you still require some cylinders be fabricated and tested during the course of the construction to verify the accuracy of the maturity curves? If so, how often do you require cylinders to be tested in order to verity the curve?
Table 19. Requirement are in place for verification of the maturity-strength calibration curve.
Category of Use Number of Responses Yes 19 No 2 Not Applicable 15 Totals 36
Question #5. If you permit the use of the maturity concept, would you please attach a copy of or a link to, your specifications regarding its use?
Table 20. Are specifications available for the use of maturity?
Yes 15 No 15
In Draft Form 6 Total 36
Seventy-two percent of the responders (25) used the maturity concept either on a regular,
experimental or conditional basis while the remaining 28 percent (11) were not currently using
maturity. Of the 72 percent using maturity, 92 percent were using it as a substitute for early
strength cylinder breaks to allow forms to be stripped or pavements to be opened to traffic. The
Experimental Feature Report __________________________________________________________
April 2009 51
other eight percent indicated they also allowed maturity to be substituted for both early cylinder
breaks and or 28-day acceptance testing. A majority of the states that used maturity required
some form of verification testing usually in the early stages of the project and then periodically
throughout its course. A little over one half of the responders (58 percent) had specifications
either in place or in draft form. In summary, a high percentage of the agencies are using the
maturity concept, most as an early strength indicator to allow forms to be stripped or pavements
to be opened to traffic, and most require some type of verification to assure that the mix being
placed in the field matches the mix used to develop the strength-maturity calibration curve.
Specification for maturity are currently in place in many agencies (15) and in draft form in
several others (6).

Experimental Feature Report __________________________________________________________
April 2009 52
Recommendations The following recommendations are made on the future use of the maturity concept for
determining early opening of concrete pavements.
• A training course should be developed that covers all aspects of the maturity concept
from its theory to its day-to-day application on a project. The Texas Department of
Transportation has such a course and it would provide a good model.
• A consistent method of reporting information should be developed an implemented.
• Maturity calibration curves should be developed with a minimum of five points defining
the curve with at least one point before the target compressive strength is attained.
• Future implementation of the maturity concept should include additional trial projects
that are closely monitored to assure that the processes and record keeping are functioning
as designed.

Experimental Feature Report __________________________________________________________
April 2009 53
References Carino, N. J. (1991). The Maturity Method. CRC Handbook on Nondestructive Testing of
Concrete Second Edition, V.M. Malhotra and N. J. Carino eds., Chap. 5, CRC, Boca Raton, Fla., 101-146.
Goller, I, and Bharil, K. (1992). “Maturity Value Determination for Fast Track Paving”,
WSDOT Research Report, WA-RD 291.1, November 1992.
Nemati, K.M., Uhlmeyer, J.S., Pierce, L.M., and Powell, J.R., (2003). “Accelerated Construction of Urban Intersections with Portland Cement Concrete Pavement (PCCP)”, Final Report, Federal Highway Administration, April 2003.
Rasmussen, R.O., and Cable, J.K. (2003). Strength Measurements Using Maturity for Portland
Cement Concrete Construction at Airfields. IPRF Research Report, DOT/FAA-01-G-002-4, Programs Management Office, Washington D.C.
Roy, D.M. and Idorn, G.M., 1982, “Hydration, Structure, and Properties of Blast Furnace Slag
Cements, Mortars and Concrete, “ Journal of the American Concrete Institute, Vol. 79, No. 6, November-December, pp. 444-457.
Saul, A.G. A (1951). “Principles Underlying the Steam Curing of Concrete at Atmospheric
Pressure,” Magazine of Concrete Research, Vol. 2, No. 5, pp. 127-140. Trost, S. (2006). Using Maturity Testing for Airfield Concrete Pavement and Repair. IPRF
Research Report, IPRF-01-G-002-03-6, Programs Management Office, Skokie, IL.

Experimental Feature Report __________________________________________________________
April 2009 54
Appendix A
Bellingham Special Provisions

Experimental Feature Report __________________________________________________________
April 2009 55
Concrete Maturity Value The Contractor shall establish a Maturity Value on the approved concrete mix through the use of a testing program. The testing program shall establish the Maturity Value through test specimen correlation. The procedure of the test specimen correlation is as follows: construct a test panel comprised of the approved concrete mix design and sufficient standard size test beams and cylinders to adequately determine the maturity/flexural strength relationship. The test panel shall measure 4m x 4m x0.3m and shall be at a site provided by the Contractor. The test panel placement methods shall match those that the Contractor intends to use on this contract. One test panel shall be constructed for each mix design proposed. The test panel shall receive an application of curing compound, then covered with a moisture retention covering (plastic wrap) and an insulating curing blanket (R-value=3). The Contractor hall make a minimum of 25 standard size beams and a minimum of 13 standard concrete cylinders at the same time that the concrete is being placed in the test panel and shall cure them in a manner identical to the test panel. Temperature probes shall be placed in the test panel, in a single test beam, and in a single concrete cylinder. The temperature of the test panel, test beam, and test cylinder shall be monitored by the maturity meter and by recording thermometers continuously during the testing period and the temperatures recorded. In the presence of the Engineer, the Contractor shall begin breaking test beams every hour starting at the 5th hour after beginning concrete placement. The Contractor shall break the concrete cylinders every hour starting at the 7th hour after beginning concrete placement. The test beam and test cylinder that have the temperature probes shall not be broken. Add data shall be recorded in writing and copies submitted to the Engineer. Calculation of the Maturity Value is as follows: Maturity Value (MV) = (Temperature Avg. – Temperature datum) X
(Time interval) Temperature = Degrees centigrade
Temperature Avg = Temperature at the beginning of the interval +Temperature at the end of the interval divided by two.
Temperature datum = Datum temperature which is a function of
the meter used Time interval = Time between temperature readings. The Maturity Value is the sum of all the incremental maturity value readings with the temperature recorded at the time of the test beam and cylinder breaks. MV 1-x = MV1+…+MV x

Experimental Feature Report __________________________________________________________
April 2009 56
The Maturity Value is plotted against the corresponding flexural strength (Mpa) obtained when the test beam is broken. The Maturity Value that corresponds to 2.8 Mpa using WSDOT test Method 802 shall be the minimum Maturity value used for opening the replacement panels to traffic. For calculation of the Maturity Value the Contractor shall follow ASTM C 1074 test procedures.

Experimental Feature Report __________________________________________________________
April 2009 57
Appendix B
Bellingham Maturity Worksheet and Sample

Experimental Feature Report __________________________________________________________
April 2009 58
Maturity Worksheet
# TIME HR MIN CH C COMP. STR.
SERIAL #: TECHNICIAN:
JOB NAME: DATE:
SAMPLE TYPE: START TIME:

Experimental Feature Report __________________________________________________________
April 2009 59
Sample Worksheet
7/7/2003
8:19AM
CHRIS JOHNS
# TIME HR MIN CH C COMP. STR.1 8:38 0 0 0 23 -2 1:38 5 0 145 38 1400 psi3 2:38 5 57 176 43 2200 psi4 3:38 6 59 221 47 3060 psi5 4:38 8 1 281 50 -6 5:38 9 0 331 50 3490 psi7 6:38 9 59 369 49 -8 7:38 10 59 417 47 -9 8:38 12 2 474 45 4050 psi
10 9:38 13 1 518 43 -11 10:38 13 59 550 42 -12 11:38 15 0 602 41 -13 12:44 16 7 643 40 -14 1:46 17 8 683 39 -15 2:39 18 2 721 38 -16 3:39 18 59 750 37 -17 4:39 19 58 787 36 -18 5:40 21 0 831 35 -19 6:40 22 0 866 34 -20 7:40 22 58 892 34 -21 8:53 24 12 933 32 5140 psi22 9:40 24 59 957 32 -23 8:40 48 0 7450 psi
SERIAL #: 3503 TECHNICIAN:
BELLINGHAM MATURITYJOB NAME: DATE:
SAMPLE TYPE: CYLINDER START TIME:

Experimental Feature Report __________________________________________________________
April 2009 60
Appendix C
Bellingham Debriefing Report
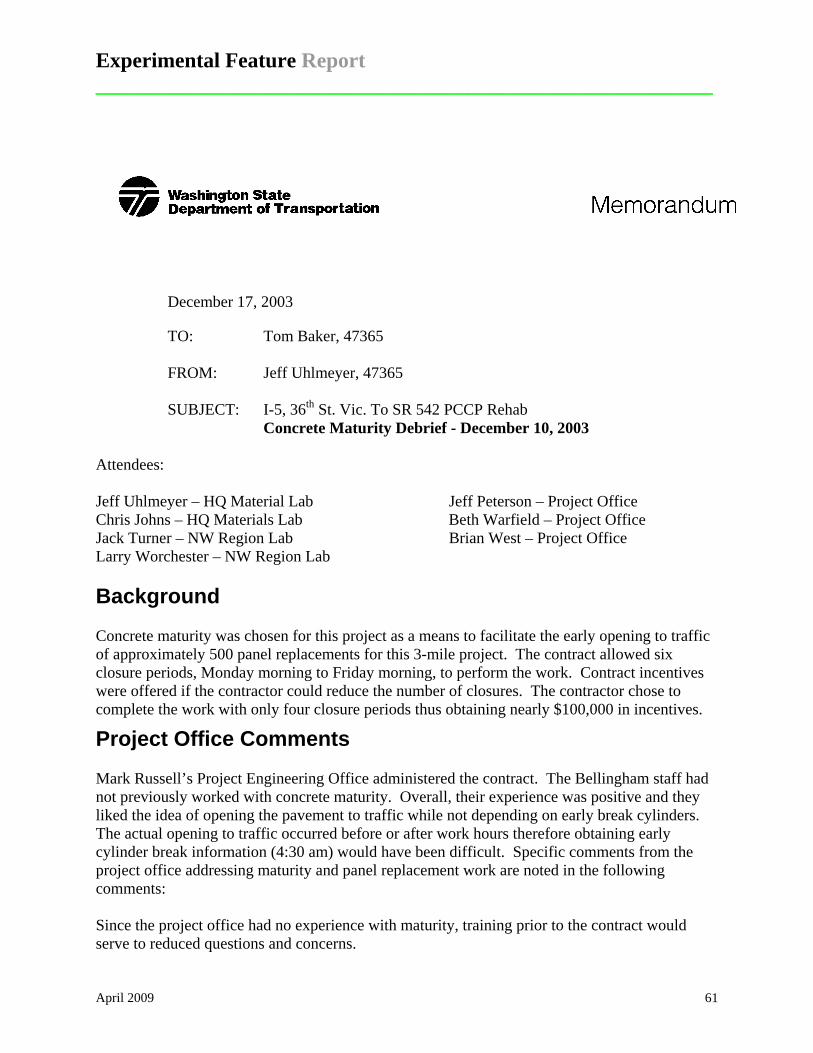
Experimental Feature Report __________________________________________________________
April 2009 61
December 17, 2003
TO: Tom Baker, 47365 FROM: Jeff Uhlmeyer, 47365 SUBJECT: I-5, 36th St. Vic. To SR 542 PCCP Rehab Concrete Maturity Debrief - December 10, 2003
Attendees: Jeff Uhlmeyer – HQ Material Lab Jeff Peterson – Project Office Chris Johns – HQ Materials Lab Beth Warfield – Project Office Jack Turner – NW Region Lab Brian West – Project Office Larry Worchester – NW Region Lab Background Concrete maturity was chosen for this project as a means to facilitate the early opening to traffic of approximately 500 panel replacements for this 3-mile project. The contract allowed six closure periods, Monday morning to Friday morning, to perform the work. Contract incentives were offered if the contractor could reduce the number of closures. The contractor chose to complete the work with only four closure periods thus obtaining nearly $100,000 in incentives.
Project Office Comments Mark Russell’s Project Engineering Office administered the contract. The Bellingham staff had not previously worked with concrete maturity. Overall, their experience was positive and they liked the idea of opening the pavement to traffic while not depending on early break cylinders. The actual opening to traffic occurred before or after work hours therefore obtaining early cylinder break information (4:30 am) would have been difficult. Specific comments from the project office addressing maturity and panel replacement work are noted in the following comments: Since the project office had no experience with maturity, training prior to the contract would serve to reduced questions and concerns.

Experimental Feature Report __________________________________________________________
April 2009 62
The maturity specification must clarify that maturity does not replace 28-day cylinder breaks.
The project office questioned the use of only one maturity logger placed during the last pour prior to opening to traffic. The project office recommended placing two loggers to avoid problems if one malfunctions.
A procedure needs to be in place, should a maturity reader fail. On the first lane closure, the contractor’s maturity reader broke leaving the project office in a scramble to determine a way to open the roadway to traffic.
The project office recommended a contractor verification procedure to ensure the mix placed is the same as was used for the maturity calibration. This recommendation came as a result of observed differences in the consistency of the contractor’s mix.
Variations in mix consistency were observed in the concrete delivered to the project. Some loads were soupy and some loads were very stiff. Since the whole premise with maturity is that mix proportions do not change, project inspectors sometimes questioned the proportions of aggregates, water, or admixtures being added to the mix. Some of the consistency problems could be explained based on the amount of water added at the plant, however, the project inspector noted that the contractor did not appear to exceed the maximum water content. Consistency in the concrete was observed towards the end of the contract work.
The mix used on the project appeared to be very temperature sensitive. Often, the concrete became unworkable after 45 minutes. With delivery delays and an unworkable mix, cold joints became an issue. The inspectors feel our specifications are not strong enough to stop cold joints. Standard Specification 5-05.3(8)C only says, “that when placing concrete is discontinued for more than 45 minutes, a transverse construction joint shall be installed.” The project office recommends stronger language within our specifications to eliminate cold joints when working with panel replacements and fast setting mixes.
The project office had difficulty convincing the contractor that panel replacements need to be saw cut as soon as possible rather than waiting up to 24 hours. After the first pour mid-panel cracks appeared. The contractor began sawing as soon as possible on the remaining pours to avoid cracks.
The panel replacement contractor chose to pour panel replacements up to ½ inch high. The diamond-grinding contractor had to provide bump grinding prior to the final profile grinding. While on this contract this was a problem for the two subs to work out, specifying to what grade (flush with the existing panels or a maximum of ¼ inch high?) may provide some clarification.
Note: Under the Special Provision “Replace Cement Concrete Panel” - There is a line that says, “Grade control shall be the responsibility of the contractor”. The next paragraph says, “Surface smoothness shall be measured by the Engineer…in accordance with Section 5-05.3(12).” Since PCCP grinding is performed after panel replacement – This should be modified to say, “Grade control and surface smoothness shall be the responsibility of the contractor. The contractor shall

Experimental Feature Report __________________________________________________________
April 2009 63
measure surface smoothness with a 3 meter straight edge in accordance with Section 5-05.3(12)”. Make the contractor totally responsible for this since it is not the final product.
Headquarters Comments The Headquarters Materials Lab worked closely with the contractor to develop the calibration curve for the mix. The cylinder and beams for the calibration curve and test slab were poured at the contractor’s yard in Bellingham. After 4 hours of cure, the cylinders and beams were hauled to a private test lab in Everett. The cylinder and beams were monitored for maturity and broken for compression strength for a 24-hour period. The contractor monitored the test slab for maturity values for a 15-hour period. Fortunately, the contractor purchased the same Intellirock™ Maturity Meter as WSDOT. The availability of two meters allowed the monitoring of cylinders and the test slab, each at different locations.
The purpose of monitoring the test slab for maturity values in addition to the cylinders was to determine a shift in strength from the cylinder specimens to the slab. Typically, the slab will gain strength at a faster rate due to the mass pour/heat of hydration effects. WSDOT’s analysis showed that the maturity of the slab did not catch up to the maturity of the cylinders until the 10th hour. Both the cylinders and slab were covered with plastic and blankets. After considering all factors, it was reasoned that the cylinders may have “cooked” more than the slab. In future calibration scenarios when a test slab is used, care should be given to cure the calibration cylinders as close as possible to the same manner used for the slab. This will give a more “accurate” shift in strength gain when comparing cylinders and slabs.
The maturity value needed to open the panel replacements to traffic at 2,500-psi compression was 191 Celsius-Hours (°CH). The calibration curve obtained the desired maturity in 6.5 hours. The assumption used by the project office was that the mix proportions used during construction would be identical to the proportions used to develop the calibration curve. For maturity to be valid, this assumption must be true. A verification procedure will ensure that the calibration curve and the contract mix is the same.
The Headquarters Materials Lab was able to visit the Bellingham project for three of the four lane closures in order to perform verification testing of the calibration curve. On each visit, cylinders were cast and broken and maturity was monitored. The maturity results measured, when the compressive strength reached 2,500 psi, was similar to the calibration curve for two of the three closures. At this time, it is not clear why the one test failed to match the calibration curve. The project inspector or the Headquarters material tester did not report anything unusual about the concrete used for this test. The maturity number of 191 °CH for the verification testing was obtained within 7.5 hours. For all closures, the time of the last pour to the opening to traffic was 9 to 10 hours, leading to actual maturity values of about 360 °CH.

Experimental Feature Report __________________________________________________________
April 2009 64
The maturity meter purchased by WSDOT and used on this project has limited use. The primary dissatisfaction is that previous readings, recorded during maturity monitoring, cannot be saved without generating a new file. Therefore, numerous files are needed to capture the history of a specific maturity logger. Managing the many files stored in the Intellirock Maturity Meter can be time consuming. A newer model is now available for about $3,000. WSDOT’s meter cost $1,000.
The Headquarters Material Lab will be providing a more complete summary of the Bellingham Maturity Experience via a Technote.

Experimental Feature Report __________________________________________________________
April 2009 65
Appendix D
James to Olive Maturity Worksheet and Sample

Experimental Feature Report __________________________________________________________
April 2009 66
James to Olive Maturity Worksheet
Contract Closure Period:
Panel Replacement Location: Mix Design Used: Lane: ( INSIDE / OUTSIDE )
Direction: ( NB / SB ) ºC-Hrs Required to Open to Traffic: Station: Offset: Technician:
Logger Start Date/Time:
Elapsed Time Logger Readings
Logger # Real Time Elapsed Hour Elapsed Minutes Temperature ºC-Hrs
Instructions: For IntelliRock™ maturity readers. 1) For initial startup of logger, connect colored wires to corresponding color terminal. Push "3" to turn on READER. Record logger #. Then either quick-start logger: Press and hold "ENTER" and "F2" at the same time. OR: Start the logger with Job Name & Location: Press "ENTER" Press "F2" ; Press "F1" ; Enter Job Name; Press "ENTER" Press "F1" ; Enter Location; Press "ENTER" Leave Data Temperature at 0; Press "ENTER" Push "3" and "6" at the same time to turnoff READER. Logger will continue recording. 2) Fill Form with startup data. Check that "ºC-Hrs Needed to Open" is from the same mix design. 3) Read hourly. Connect logger, then turn on.Confirm logger # and record real time. Push "F1" and record elapsed time, Temperature, & ºC-Hrs. Turnoff. (NOTE) Logger should be placed in the last pour to represent ºC-Hrs needed to open to traffic. Activate the logger ASAP following concrete placement. Additional loggers should be placed throughout the pour for informational purposes.

Experimental Feature Report __________________________________________________________
April 2009 67
James to Olive Sample Worksheet
Contract 6886 Closure Period: July 16, 2005 - July 17, 2005
Panel Replacement Location: Mix Design Used: 8049-H Lane: ( INSIDE / OUTSIDE )
Direction: ( NB / SB ) ºC-Hrs Required to Open to Traffic: 275 Station: CD 2158+82.6* Offset: Technician: Janette Carciller
Logger Start Date/Time: July 16, 2005 - 3:02 PM
Elapsed Time Logger Readings
Logger # Real Time Elapsed Hour Elapsed Minutes Temperature ºC-Hrs 2068297 3:02pm 0 0 28 0 2068297 4:22pm 1 20 29 35 2068297 5:17pm 2 15 31 65 2068297 6:21pm 3 19 34 97 2068297 8:16pm 5 17 50 177 2068297 10:20pm 7 21 60 291
Instructions: For IntelliRock™ maturity readers. 1) For initial startup of logger, connect colored wires to corresponding color terminal. Push "3" to turn on READER. Record logger #. Then either quick-start logger: Press and hold "ENTER" and "F2" at the same time. OR: Start the logger with Job Name & Location: Press "ENTER" Press "F2" ; Press "F1" ; Enter Job Name; Press "ENTER" Press "F1" ; Enter Location; Press "ENTER" Leave Data Temperature at 0; Press "ENTER" Push "3" and "6" at the same time to turnoff READER. Logger will continue recording. 2) Fill Form with startup data. Check that "ºC-Hrs Needed to Open" is from the same mix design. 3) Read hourly. Connect logger, then turn on.Confirm logger # and record real time. Push "F1" and record elapsed time, Temperature, & ºC-Hrs. Turnoff. (NOTE) Logger should be placed in the last pour to represent ºC-Hrs needed to open to traffic. Activate the logger ASAP following concrete placement. Additional loggers should be placed throughout the pour for informational purposes.

Experimental Feature Report __________________________________________________________
April 2009 68
Appendix E
James to Olive Special Provisions

Experimental Feature Report __________________________________________________________
April 2009 69
Opening to Traffic Section 5-05.3(17) is supplemented with the following:
Maturity Testing for Concrete Pavement The Contractor shall establish a Maturity Value on the approved concrete mix through the use of a testing program following the WSDOT test procedure for estimating concrete strength.
The Contractor shall establish the strength maturity relationship at least 14 days prior to the production pours.
The Contractor shall be responsible for the installation of the maturity logger/sensor within the concrete pavement pour area. Place two loggers/sensors within the concrete pour area at a frequency of 500 cubic yards or fraction thereof. The Contractor shall maintain the integrity of the logger/sensor and wires during concrete pouring, finishing and curing operations or until the maturity information is no longer needed.
The Contractor shall perform the Quality Control Procedure to Verify the Strength-Maturity Relationship on days 1 and 2 of concrete placement as indicated in the test procedure.
The Contractor shall develop a Quality Control Plan based on the Strength-Maturity Relationship to monitor and provide remedial action to ensure the concrete meets design strengths.
Any alteration in mix proportions or source or type of any material, in excess of those tolerable by batching variability, requires the development of a new strength-maturity relationship prior to its use at the Contractors time and expense. This includes a change in type, source, or proportion of cement, fly ash, coarse aggregate, fine aggregate, or admixtures. A change in water-to-cementitious material ratio greater than 0.05 requires the development of a new strength-maturity relationship.
Maturity Method Test Procedure
This test method provides a procedure for estimating concrete strength by means of the maturity method. The maturity method is based on strength gain as a function of temperature and time. This method is a modification of ASTM C1074 covering the procedures for estimating concrete strength by means of the maturity method.
The maturity method consists of three steps:
• Develop strength-maturity relationship
• Estimate in-place strength
• Verify strength-maturity relationship.
The Nurse-Saul “temperature-time factor (TTF)” maturity index shall be used in this test method, with a datum temperature of 0 oC (32 oF).

Experimental Feature Report __________________________________________________________
April 2009 70
Apparatus • If the maturity meter has input capability for datum temperature, verify that
the proper value of the datum temperature has been selected prior to each use.
• Intellirock maturity system (or approved equivalent). This system shall include the logger/sensor, handheld reader, and software.
• The data obtained from the maturity meter shall be unalterable and un-interruptible.
• The same brand and type of maturity meters shall be used in the field as those used to develop and verify the strength-maturity relationship.
• Logger/sensor wire grade shall be larger than or equal to 20 awg.
Contractors Procedure to Develop Strength-Maturity Relationship
Step Action 1. For every concrete design that will be evaluated by the maturity method, prepare
a minimum of 20 cylinders in accordance with FOP for ASSHTO T 23. Additional cylinders should be cast to avoid having to repeat the procedure. The mixture proportions and constituents of the concrete shall be the same as those of the job concrete whose strength will be estimated using this practice. The minimum size of each batch shall be approximately 3 m3 (4 yd3).
2. Fresh concrete testing for each batch shall include concrete placement
temperature, slump, air content in accordance with FOP for AASHTO T 309, FOP for AASHTO T 119, and FOP for AASHTO T 152.
3. Embed loggers/sensors in at least two cylinders. Loggers/sensors shall be
placed 2-4 inches from any surface. Activate the loggers/sensors.
4. Cure the cylinders in accordance with FOP for AASHTO T 23.
5. Perform compression strength tests in accordance with FOP for AASHTO T 22 to target 2,500 psi for opening to traffic. Additional cylinders and test ages may be evaluated at the discretion of the Contractor. Test three cylinders at each age and compute the average strength. The cylinders with logger/sensors may be tested if additional cylinders are needed.
6. At each test age, record the individual and average values of maturity and
strength for each batch on a permanent data sheet (see Appendix A – Table 1 for sample record log).
7. Plot the average strengths as a function of the average maturity values, with data
points shown. Using a computer spreadsheet program such as Microsoft Excel, calculate a point-to-point interpolation through the data. The resulting curve is the strength-maturity relationship to be used for estimating the strength of the concrete mixture placed in the field.

Experimental Feature Report __________________________________________________________
April 2009 71
When developing the strength-maturity relationship, the spreadsheet software allows the Engineer to develop the corresponding maturity equation, which defines the strength-maturity relationship. The Engineer should carefully examine the data for “outliners”, faulty cylinder breaks, or faulty maturity readings. The Engineer should use judgment to determine if certain points should be discarded, or retested, or whether the entire strength-maturity relationship should be regenerated.
Contractors Procedure to Estimate In-Place Strength
Step Action 1. Prior to or at the time of concrete placement, install logger/sensors at the
frequency specified. Loggers/sensors shall be placed a minimum of 2 ft. from a panel edge and 4 to 5 inches from the panel surface. Loggers/sensors may be tied to reinforcing steel, but should not be in direct contact with the reinforcing steel or formwork.
2. As soon as practical after concrete placement, connect and activate the maturity
meter(s).
3. The Contractor shall provide to the Engineer, prior to the opening the pavement to traffic, encrypted data files (with software to read the files) of the maturity data from the logger/sensors. Data shall be provided until the maturity is at a value that is equal to or greater than the required strength for that concrete mixture, as determined by the strength-maturity relationship. Additionally, data shall be provided on a record log (See Appendix B – Table 2 for sample record log).
Contractors Quality Control Procedure to Verity Strength-Maturity Relationship
Step Action 1. At the specified verification interval make a minimum of two cylinders in
accordance with FOP for AASHTO T 23.
2. Embed a logger/sensor in one cylinder. Loggers/sensors shall be placed 2-4 inches from any surface. Activate the logger/sensor as soon as possible.
3. Cure the cylinders in accordance with FOP for AASHTO T 23
4. Perform compression strength tests on two cylinders in accordance with FOP for
AASHTO T 22 to verity strength and time to reach 2,500 psi for opening to traffic. Compute the average strength of the cylinders at each test age (average of 2 cylinders at a time, not the average of additional cylinders).
5. Record on a permanent data sheet the maturity value at the time of compression
testing and individual and average strengths established from the cylinder breaks. Also record the predicted strength based on the strength-maturity relationship established for that particular concrete design, and the percent
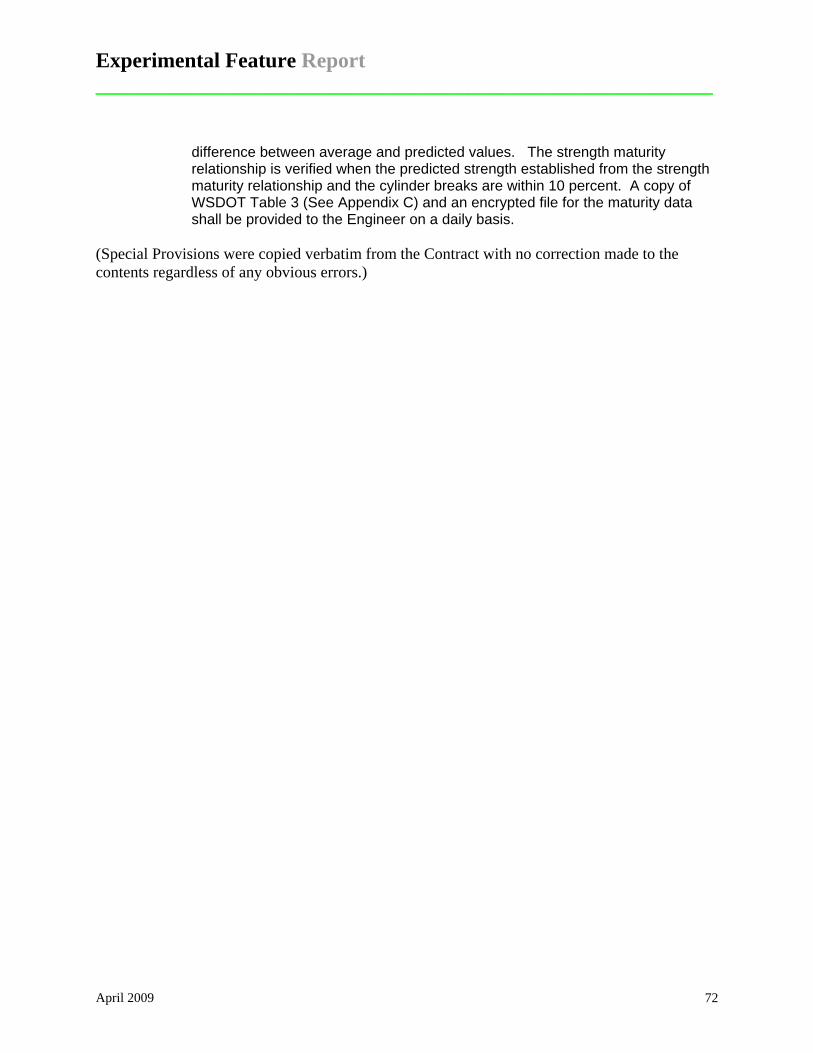
Experimental Feature Report __________________________________________________________
April 2009 72
difference between average and predicted values. The strength maturity relationship is verified when the predicted strength established from the strength maturity relationship and the cylinder breaks are within 10 percent. A copy of WSDOT Table 3 (See Appendix C) and an encrypted file for the maturity data shall be provided to the Engineer on a daily basis.
(Special Provisions were copied verbatim from the Contract with no correction made to the contents regardless of any obvious errors.)

Experimental Features Report _________________________________________________________________________________
April 2009 73
Table 1. Record Log to Develop Strength-Maturity Relationship(1) Control: Lab Technician: Project: Member: Highway: Item No.: Structure: Conc. Class / Mix No.: Engineer: . Date / Time Batch: Producer: Required TTF / Action: Meter No.: Specimen 1: Specimen 2: Batch No.: Air Temp. at Placement: °F °C Slump: inches mm Air Content: %
Instrumented Specimens for Monitoring Maturity
Specimen 1 Specimen 2 Average Value Strength Test Results (psi)
Date
Time (hr:min)
Tank Temp (°C)
Conc. Temp (°C)
TTF (°C·hr)
Conc. Temp (°C)
TTF (°C·hr)
Conc. Temp (°C)
TTF (°C·hr) 1 2 3 Average
Comments:
Note (1): Attach copy of batch ticket

Experimental Feature Report _________________________________________________________________________________
April 2009 74
y = 885.96Ln(x) - 3371.45R2 = 0.99
0
1000
2000
3000
4000
5000
6000
0 2000 4000 6000 8000 10000 12000 14000 16000
MATURITY INDEX, TTF (ºC·HR)
CO
MPR
ESSI
VE S
TREN
GTH
(PSI
)
STRENGTH-MATURITY RELATIONSHIP

Experimental Feature Report _________________________________________________________________________________
April 2009 75
0
1000
2000
3000
4000
5000
6000
0 2000 4000 6000 8000 10000 12000 14000 16000
MATURITY INDEX, TTF (ºC·HR)
CO
MPR
ESSI
VE S
TREN
GTH
(PSI
)PREDICTED STRENGTH FROM MATURITY DATA COLLECTED IN THE FIELD
y = 885.96Ln(x) - 3371.45R2 = 0.99
Required Strength: 3,600 PSI
Req
uire
d TT
F: 2
,615
ºC·H
R
Strength-Maturity Relationship:
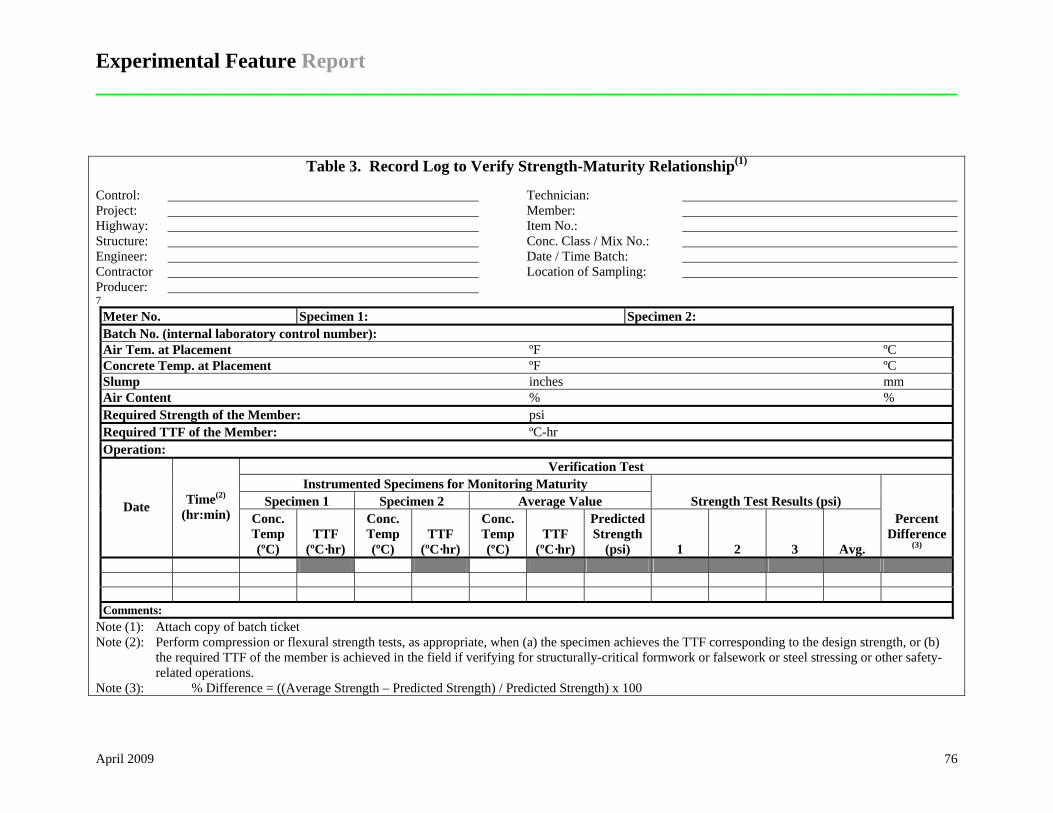
Experimental Feature Report _________________________________________________________________________________
April 2009 76
Table 3. Record Log to Verify Strength-Maturity Relationship(1) Control: Technician: Project: Member: Highway: Item No.: Structure: Conc. Class / Mix No.: Engineer: Date / Time Batch: Contractor Location of Sampling: Producer: 7
Meter No. Specimen 1: Specimen 2: Batch No. (internal laboratory control number): Air Tem. at Placement ºF ºC Concrete Temp. at Placement ºF ºC Slump inches mm Air Content % % Required Strength of the Member: psi Required TTF of the Member: ºC-hr Operation:
Verification Test Instrumented Specimens for Monitoring Maturity
Specimen 1 Specimen 2 Average Value Strength Test Results (psi) Date Time(2) (hr:min) Conc.
Temp (ºC)
TTF (ºC·hr)
Conc. Temp (ºC)
TTF (ºC·hr)
Conc. Temp (ºC)
TTF (ºC·hr)
Predicted Strength
(psi) 1 2 3 Avg.
Percent Difference
(3)
Comments:
Note (1): Attach copy of batch ticket Note (2): Perform compression or flexural strength tests, as appropriate, when (a) the specimen achieves the TTF corresponding to the design strength, or (b)
the required TTF of the member is achieved in the field if verifying for structurally-critical formwork or falsework or steel stressing or other safety-related operations.
Note (3): % Difference = ((Average Strength – Predicted Strength) / Predicted Strength) x 100

Experimental Feature Report _________________________________________________________________________________
April 2009 77
0
1000
2000
3000
4000
5000
6000
0 2000 4000 6000 8000 10000 12000 14000 16000
MATURITY INDEX, TTF (ºC·HR)
CO
MPR
ESSI
VE S
TREN
GTH
(PSI
)
VERIFICATION OF STRENGTH-MATURITY RELATIONSHIP
y = 885.96Ln(x) - 3371.45R2 = 0.99
Required Strength: 3,600 PSI
Test Specimens at Established Required TTF ±10%: 2350 to 2880 ºC·HR
Strength-Maturity Relationship:

Experimental Feature Report __________________________________________________________
April 2009 78
Appendix F
Vancouver Vicinity Special Provisions

Experimental Feature Report __________________________________________________________
April 2009 79
Opening to Traffic Section 5-05.3(17) is supplemented with the following:
Maturity Testing for Concrete Pavement The Contractor shall establish a Maturity Value on the approved concrete mix through the use of a testing program following the WSDOT test procedure for estimating concrete strength.
The Contractor shall establish the strength maturity relationship at least 14 days prior to the production pours.
The Contractor shall be responsible for the installation of the maturity logger/sensor within the concrete pavement pour area. Place two loggers/sensors within the concrete pour area at a frequency of 500 cubic yards or fraction thereof. The Contractor shall maintain the integrity of the logger/sensor and wires during concrete pouring, finishing and curing operations or until the maturity information is no longer needed.
The Contractor shall perform the Quality Control Procedure to Verify the Strength-Maturity Relationship on days 1 and 2 of concrete placement as indicated in the test procedure.
The Contractor shall develop a Quality Control Plan based on the Strength-Maturity Relationship to monitor and provide remedial action to ensure the concrete meets design strengths.
Any alteration in mix proportions or source or type of any material, in excess of those tolerable by batching variability, requires the development of a new strength-maturity relationship prior to its use at the Contractors time and expense. This includes a change in type, source, or proportion of cement, fly ash, coarse aggregate, fine aggregate, or admixtures. A change in water-to-cementitious material ratio greater than 0.05 requires the development of a new strength-maturity relationship.
Maturity Method Test Procedure This test method provides a procedure for estimating concrete strength by means of the maturity method. The maturity method is based on strength gain as a function of temperature and time. This method is a modification of ASTM C1074 covering the procedures for estimating concrete strength by means of the maturity method.
The maturity method consists of three steps:
• Develop strength-maturity relationship
• Estimate in-place strength
• Verify strength-maturity relationship.
The Nurse-Saul “temperature-time factor (TTF)” maturity index shall be used in this test method, with a datum temperature of 0 oC (32 oF).
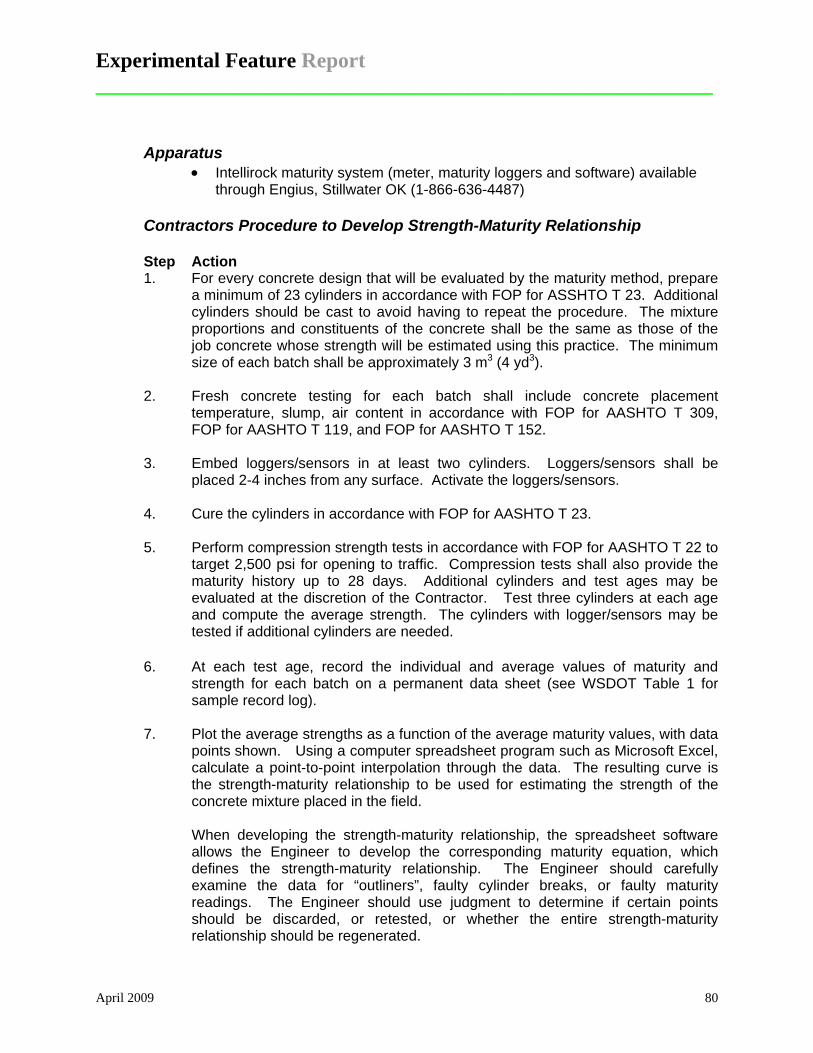
Experimental Feature Report __________________________________________________________
April 2009 80
Apparatus • Intellirock maturity system (meter, maturity loggers and software) available
through Engius, Stillwater OK (1-866-636-4487)
Contractors Procedure to Develop Strength-Maturity Relationship
Step Action 1. For every concrete design that will be evaluated by the maturity method, prepare
a minimum of 23 cylinders in accordance with FOP for ASSHTO T 23. Additional cylinders should be cast to avoid having to repeat the procedure. The mixture proportions and constituents of the concrete shall be the same as those of the job concrete whose strength will be estimated using this practice. The minimum size of each batch shall be approximately 3 m3 (4 yd3).
2. Fresh concrete testing for each batch shall include concrete placement
temperature, slump, air content in accordance with FOP for AASHTO T 309, FOP for AASHTO T 119, and FOP for AASHTO T 152.
3. Embed loggers/sensors in at least two cylinders. Loggers/sensors shall be
placed 2-4 inches from any surface. Activate the loggers/sensors.
4. Cure the cylinders in accordance with FOP for AASHTO T 23.
5. Perform compression strength tests in accordance with FOP for AASHTO T 22 to target 2,500 psi for opening to traffic. Compression tests shall also provide the maturity history up to 28 days. Additional cylinders and test ages may be evaluated at the discretion of the Contractor. Test three cylinders at each age and compute the average strength. The cylinders with logger/sensors may be tested if additional cylinders are needed.
6. At each test age, record the individual and average values of maturity and
strength for each batch on a permanent data sheet (see WSDOT Table 1 for sample record log).
7. Plot the average strengths as a function of the average maturity values, with data
points shown. Using a computer spreadsheet program such as Microsoft Excel, calculate a point-to-point interpolation through the data. The resulting curve is the strength-maturity relationship to be used for estimating the strength of the concrete mixture placed in the field.
When developing the strength-maturity relationship, the spreadsheet software
allows the Engineer to develop the corresponding maturity equation, which defines the strength-maturity relationship. The Engineer should carefully examine the data for “outliners”, faulty cylinder breaks, or faulty maturity readings. The Engineer should use judgment to determine if certain points should be discarded, or retested, or whether the entire strength-maturity relationship should be regenerated.

Experimental Feature Report __________________________________________________________
April 2009 81
Contractors Procedure to Estimate In-Place Strength
Step Action 1. Prior to or at the time of concrete placement, install logger/sensors at the
frequency specified. Loggers/sensors shall be placed a minimum of 2 ft. from a panel edge and 4 to 5 inches from the panel surface. Loggers/sensors may be tied to reinforcing steel, but should not be in direct contact with the reinforcing steel or formwork.
2. As soon as practical after concrete placement, connect and activate the maturity
meter(s).
3. The Contractor shall provide to the Engineer, prior to the opening the pavement to traffic, encrypted data files (with software to read the files) of the maturity data from the logger/sensors. Data shall be provided until the maturity is at a value that is equal to or greater than the required strength for that concrete mixture, as determined by the strength-maturity relationship. Additionally, data shall be provided on a record log (See WSDOT Table 2 for sample record log).
Contractors Quality Control Procedure to Verity Strength-Maturity Relationship
Step Action 1. At the specified verification interval make a minimum of two cylinders in
accordance with FOP for AASHTO T 23.
2. Embed a logger/sensor in one cylinder. Loggers/sensors shall be placed 2-4 inches from any surface. Activate the logger/sensor as soon as possible.
3. Cure the cylinders in accordance with FOP for AASHTO T 23
4. Perform compression strength tests on two cylinders in accordance with FOP for
AASHTO T 22 to verity strength and time to reach 2,500 psi for opening to traffic. Compute the average strength of the cylinders at each test age (average of 2 cylinders at a time, not the average of additional cylinders).
5. Record on a permanent data sheet the maturity value at the time of compression
testing and individual and average strengths established from the cylinder breaks. Also record the predicted strength based on the strength-maturity relationship established for that particular concrete design, and the percent difference between average and predicted values. The strength maturity relationship is verified when the predicted strength established from the strength maturity relationship and the cylinder breaks are within 10 percent. A copy of WSDOT Table 3 and an encrypted file for the maturity data shall be provided to the Engineer on a daily basis.

Experimental Feature Report __________________________________________________________
April 2009 82
(Special Provisions were copied verbatim from the Contract with no correction made to the contents regardless of any obvious errors. Red indicates changes from the James to Olive project.)

Experimental Feature Report _________________________________________________________________________________
April 2009 83
Table 1. Record Log to Develop Strength-Maturity Relationship(1) Control: Lab Technician: Project: Member: Highway: Item No.: Structure: Conc. Class / Mix No.: Engineer: . Date / Time Batch: Producer: Required TTF / Action: Meter No.: Specimen 1: Specimen 2: Batch No.: Air Temp. at Placement: °F °C Slump: inches mm Air Content: %
Instrumented Specimens for Monitoring Maturity
Specimen 1 Specimen 2 Average Value Strength Test Results (psi)
Date
Time (hr:min)
Tank Temp (°C)
Conc. Temp (°C)
TTF (°C·hr)
Conc. Temp (°C)
TTF (°C·hr)
Conc. Temp (°C)
TTF (°C·hr) 1 2 3 Average
Comments:
Note (1): Attach copy of batch ticket

Experimental Feature Report _________________________________________________________________________________
April 2009 84
y = 885.96Ln(x) - 3371.45R2 = 0.99
0
1000
2000
3000
4000
5000
6000
0 2000 4000 6000 8000 10000 12000 14000 16000
MATURITY INDEX, TTF (ºC·HR)
CO
MPR
ESSI
VE S
TREN
GTH
(PSI
)
STRENGTH-MATURITY RELATIONSHIP

Experimental Feature Report _________________________________________________________________________________
April 2009 85
Table 2. Record Log for Field Maturity Data(1) with Sample Data Structure
Member
Meter No.
Meter Location
Spec. Item No.
Conc. Class & Mix No.
Date/Time Batch
Air. Temp. Placed ºF ºC ºF ºC ºF ºC
Conc. Temp. Placed ºF ºC ºF ºC ºF ºC
Slump inches mm inches mm inches mm
Air Content % % %
Required Strength psi psi psi
Required TTF ºC·hr ºC·hr ºC·hr
Operation
Inspector Reading No.(2) Date Time
(hh:min)
Air Temp. (°C)
Conc. Temp. (°C)
TTF (°C·hr) Date Time
(hh:min)
Air Temp. (°C)
Conc. Temp. (°C)
TTF (°C·hr) Date Time
(hh:min)
Air Temp. (°C)
Conc. Temp. (°C)
TTF (°C·hr)
Comments
Note (1): Attach copy of batch ticket(s) Note (2): When each reading is taken, verify that the specified curing procedures are being followed.

Experimental Feature Report _________________________________________________________________________________
April 2009 86
0
1000
2000
3000
4000
5000
6000
0 2000 4000 6000 8000 10000 12000 14000 16000
MATURITY INDEX, TTF (ºC·HR)
CO
MPR
ESSI
VE S
TREN
GTH
(PSI
)
PREDICTED STRENGTH FROM MATURITY DATA COLLECTED IN THE FIELD
y = 885.96Ln(x) - 3371.45R2 = 0.99
Required Strength: 3,600 PSI
Req
uire
d TT
F: 2
,615
ºC·H
R
Strength-Maturity Relationship:

Experimental Feature Report _________________________________________________________________________________
April 2009 87
Table 3. Record Log to Verify Strength-Maturity Relationship(1) Control: Technician: Project: Member: Highway: Item No.: Structure: Conc. Class / Mix No.: Engineer: Date / Time Batch: Contractor Location of Sampling: Producer: 7
Meter No. Specimen 1: Specimen 2: Batch No. (internal laboratory control number): Air Temp. at Placement ºF ºC Concrete Temp. at Placement ºF ºC Slump inches mm Air Content % % Required Strength of the Member: psi Required TTF of the Member: ºC-hr Operation:
Verification Test Instrumented Specimens for Monitoring Maturity
Specimen 1 Specimen 2 Average Value Strength Test Results (psi) Date Time(2) (hr:min) Conc.
Temp (ºC)
TTF (ºC·hr)
Conc. Temp (ºC)
TTF (ºC·hr)
Conc. Temp (ºC)
TTF (ºC·hr)
Predicted Strength
(psi) 1 2 3 Avg.
Percent Difference
(3)
Comments:
Note (1): Attach copy of batch ticket Note (2): Perform compression or flexural strength tests, as appropriate, when (a) the specimen achieves the TTF corresponding to the design strength, or (b)
the required TTF of the member is achieved in the field if verifying for structurally-critical formwork or falsework or steel stressing or other safety-related operations.
Note (3): % Difference = ((Average Strength – Predicted Strength) / Predicted Strength) x 100

Experimental Feature Report _________________________________________________________________________________
April 2009 88
0
1000
2000
3000
4000
5000
6000
0 2000 4000 6000 8000 10000 12000 14000 16000
MATURITY INDEX, TTF (ºC·HR)
CO
MPR
ESSI
VE S
TREN
GTH
(PSI
)
VERIFICATION OF STRENGTH-MATURITY RELATIONSHIP
y = 885.96Ln(x) - 3371.45R2 = 0.99
Required Strength: 3,600 PSI
Test Specimens at Established Required TTF ±10%: 2350 to 2880 ºC·HR
Strength-Maturity Relationship:

Experimental Feature Report __________________________________________________________
April 2009 89
Appendix G
2007 West Virginia Division of Highways Maturity Survey

Experimental Feature Report __________________________________________________________
April 2009 90
State Are you familiar with the concrete maturity concept (strength gain based on time and temperature)?
Do you allow the use of concrete maturity curves (equations) as a substitution for compressive strength cylinders?
If so, do you allow this substitution for early break cylinders (field cured specimens for form removal, etc.), 28-day acceptance cylinders (standard cured cylinders), or both?
If you allow the use of the maturity concept as a substitution for cylinders, do you still require that some cylinders be fabricated and tested during the course of construction to verify the accuracy of the maturity curve? If so, how often do you require cylinders to be tested in order to verify the curve?
If you permit the use of the maturity concept, would you please attach a copy of, or a link to, your specifications regarding its use?
Alabama Yes Yes Early break cylinders only (form removal, early opening to traffic, etc.)
Verification cylinders are required to verify the strength estimated by the maturity method. Perform compression testing on a set of cylinders (3 cylinders tested at the same age) when the maturity of the cylinder is more than 90% of the required maturity, or when the maturity of the structure is more than 90% of the required maturity, whichever occurs first.
Our maturity procedure is in the final review process. I am attaching a draft copy for your reference.
Arizona Yes. I have used the technology in two projects. The first was at Little Colorado River Bridge on I-40 (around 2001 / 2002). We utilized the maturity meter to check if the bridge deck that was replaced was ready for opening to the traffic. The other time it was at Super Red Tan Interchange Phase II (2005), where it was with a different brand name called ‘IntelliRock’. We were trying to use it for checking if the Reinforced Concrete Box Culvert, where a traveler forming system was used was ready for partially removing the forms.
We have tried maturity meter use on a couple projects but as a general statement we do not allow it. I do not think we allowed the maturity meter as a complete substitution for the compressive strength of the cylinders. I do not think we have that level of confidence yet on the maturity meters. On I-40, ADOT used the maturity meter for its own information (the contractor was not involved) to make decision on the opening of the deck to the traffic. Whereas on Super Red Tan, the contractor and ADOT both prepared the correlation curves for the IntelliRock.
We tired it for both. The feedback from the projects was that sometimes it seemed to be correlating well with actual compressive strengths and other times not so well. I do not think we allowed the maturity meter as a complete substitution for the compressive strength of the cylinders. I do not think we have that level of confidence yet on the maturity meters. On I-40, ADOT used the maturity meter for its own information (the contractor was not involved) to make decision on the opening of the deck to the traffic. Whereas on Super Red Tan, the contractor and ADOT both prepared the correlation curves for the IntelliRock.
Not that far along yet. One issue we had with the maturity meter was while using the admixtures. As I remember correctly, our mix had accelerator in the design. When breaking the cylinders, the strength from the cylinders was not matching with the value obtained from the maturity curve. I was told afterwards that mistakenly retarder was put in the mix during production instead of the accelerator, and the curve was not designed for it.
N/A
Arkansas Yes, we are familiar with the maturity concept
No, we do not allow it as a substitution
N/A N/A N/A
California Yes. Not as a standard practice. It was used on a couple of projects (Bay Bridge, Carquinez Bridge) for form removal and early strength development determination. I understand that an ASTM method was used for these projects.
Only in a few projects and only for form removal and early strength development determination.
The use of maturity meters as substitution for compressive or flexural strength determination is always based on a correlation curve between the cylinders and/or beams and the meters. As this is not a standard practice we do not have a standard specification. We do not have a procedure for the time of testing of cylinders for the correlation.
We have attached a draft California Test Method for you. This was never approved for use.

Experimental Feature Report _________________________________________________________________________________________
April 2009 91
Colorado Yes Yes We do not accept maturity meter data for removing forms on structural concrete. We do allow maturity meter data to open fast track PCCP. Acceptance is still based on 28/56-day cylinder breaks. We also use maturity meter to monitor strength gain for cold weather placement & removal of curing.
No. www.dot.state.co.us/DesignSupport/Construction/2005SpecsBook/2005Book/2005SpecBookWhole.pdf Section 412.15 (page 274) Cold weather PCCP. Section 601.13 (page 408) Cold weather for structural concrete & removal of curing.
Connecticut Yes No, not at his time, however the Department is in the process of developing language to allow the use of this method as an alternative to cylinders. We do not anticipate that all concrete producers or contractors will be willing to commit themselves exclusively to the maturity method.
That would come with our own experience and that of the producer and contractor.
In general, the curve will have to be well established for that producer/mix design for the method to be effective. The curve will also have to be verified on a regular basis, what that is right now, I don't know. I can see instances where the Dept. would absolutely require verification cylinders based on the application and/or the producer.
The development of a specification is in the early stages. Nothing to share at the present time.
Florida Yes we have allowed its use with supporting data.
Yes. We do allow for opening traffic onto new pavement and for stripping forms.
We allow for stripping forms and early opening to traffic on pavement. We do not allow for acceptance of concrete. We require that cylinders be broken to determine the acceptance compressive strength.
In the acceptance letter we tell the contractor that the maturity data is only good for the specific mix used to develop the maturity data. If any component of the mix changes the maturity data is re-run to establish the new curves based on the changes made to the mix. So we do not require the contractor to make cylinders other than those used to accept the lot of concrete. This provides a good check on the mix consistency and the original approval with the maturity data.
It has been attached to this response.
Georgia Yes Not at this time, we are in the process of including the use of maturity for concrete pavements to determine early opening to traffic.
The use of maturity for 28 day acceptance has not been considered at this time.
Will require cylinders for QA, but have not determined the frequency.
Idaho Yes Yes, for field cure. Allowed for field cure used for form release, release to traffic, etc. If there is a minimum time requirement for curing (deck concrete) maturity does not replace that.
We currently do not have a verification requirement but we are looking at adding one to our maturity specifications. I would highly recommend including verification starting with the initial placement and following a minimum frequency
http://www.itd.idaho.gov/manuals/Online_Manuals/spec_03/index.htm pages 827, 828 and 832
Illinois Yes. Yes, for pavement patching and bridge deck patching.
Both. The engineer has the option to verify the curve, but there is no set frequency.
Our specifications state “With the approval of the Engineer, concrete strength may be determined according to Illinois Modified T 325”. A scan of the Illinois Modified test method is above, and the maturity concept can be used only for pavement patching and bridge deck patching.
Iowa Yes. We use flexural beams, but could be used for cylinders.
Early breaks. It has been used since 1997 in Iowa for opening strength or form removal.
Flexural specimens to verify curve monthly. www.erl.dot.state.ia.us Article 2301.31 2403.19 and Materials IM 383

Experimental Feature Report _________________________________________________________________________________________
April 2009 92
Kansas Yes No, flexural strength only N/A N/A KsDOT Spec (see page 11/19, (3) (a)): www.ksdot.org/burConsMain/specprov/2007/501.pdf
Kentucky Yes, Kentucky has used the maturity meter on a limited number of projects. We have a note posted on our Division of Construction website that covers paving concrete and we also, have a draft note for structural concrete. We have had good luck and not so good luck with this technology.
When we have used this method, we have only utilized the meter for early opening to traffic or form removal. Kentucky still required cylinders for 28 day acceptance tests.
See previous answer. Yes, please see the following link http://transportation.ky.gov/materials/download/KYMethods/KM32202.pdf
See previous answer.
Louisiana Yes. We allowed on high performance pre-stressed concrete girders for one project to indicate strength development for form removal, but not as a substitution for cylinders.
We allow for contractor information only, but still require cylinders for early breaks. We are not aware of any contractor in Louisiana who is presently using the maturity meters.
Maine Yes (used experimentally on one project in 2007).
No N/A N/A N/A---No specs at this time.
Michigan Yes Sort of. The current spec is for flexural strength, but I have no problems with using maturity testing for compressive strengths. We have to change the tolerances for the fingerprint validation in order to apply it to compressive strengths.
Exclusively early break (open-to-traffic, etc)
Destructive testing is required at the beginning of a project to create, or verify the accuracy of, a strength-maturity correlation. It's also required once every month, or whenever there's a change in the mix constituents or a substantial change in the weather.
Please see attached.
Minnesota Yes Yes, we have done it on specific projects
We don't have penalties for strength unless their is a requirement in the contract, so in most cases our 28 day cylinders are for information only. In some cases I believe people are considering maturity for removing forms. It has also been used for concrete pavement rehabilitation projects. The biggest thing it is being used for is just to monitor the temperature.
Not applicable We are in the process of developing a specification for use of maturity.
Mississippi Yes Yes. For use in lieu of field cured test cylinders.
Validation of the maturity curves shall be made every 500 cubic yards produced for each concrete mix used. Validation strength tests shall be within 10% of the predicted value determined by the maturity curve. If the 10% requirement is not met, a new maturity curve shall be developed.

Experimental Feature Report _________________________________________________________________________________________
April 2009 93
Missouri MoDOT is familiar with the concrete maturity concept.
MoDOT does allow the use of concrete maturity curves.
For structures, MoDOT allows the maturity method to be used for determining early age strength and 28-day acceptance strength. For PCCP, the maturity method is used to determine when the pavement can be opened to traffic, when cores can be extracted and when the pavement can be exposed to freezing weather without protection. Pavement acceptance is based on cores extracted from the pavement. Compressive strength and thickness are determined from the cores. A pay factor is determined based an these test results using Percent Within Limits.
MoDOT does require that the maturity curve be verified. The maturity curve is to be verified every 7 days of production. The maturity curve is also to be verified whenever the following changes are made to the mix design or to the concrete production: Mix constitutes changed by more than 5% Water/cement ratio changed by more than 0.02 Mixing operation changed
MoDOT requirements pertaining with the use of the maturity method are outlined in Section 507 of the Standard Specifications. A link to the online specification is shown below: www.modot.mo.gov/business/standards_and_specs/Sec0507.pdf
New Hampshire Yes NH uses only cylinder strength testing for both early strength and 28 day acceptance. No one has proposed doing anything else at this time.
N/A N/A N/A
New Jersey Yes We would allow it to be used in some cases but no Contractor has used it to date.
We would allow it to be used for early breaks - for form removal, detensioning, early loading, etc.; but not for 28-day acceptance. We would want cylinders for the acceptance testing.
This would be established on a case by case basis.
We do not have a specification. Following is a link to our research webpage. If you select in "Maturity Method" from the keywords list and submit. There are two reports on research done for NJDOT on the maturity method. http://www.state.nj.us/transportation/refdata/research/ReportsDB.shtm
New Mexico Yes. Yes, if properly calibrated to the specific mix.
Yes. In fact, field cured cylinders are prohibited for use in early strength measurements for structurally significant applications. However, they are not acceptable for compliance documentation at the specified age.
Yes. Although at this time, our specifications do not include specific detail, they do require participation from the State Materials Bureau. As such, early strength corroborations are required before the maturity method can be accepted without cylinders.
Our specifications can be accessed in Section 509 of the Standard Specifications. It can be reached at our website or nmshtd.state.nm.us
North Carolina Yes Not for acceptance cylinders. We allow the use for early strength events such as opening item up to construction traffic, stripping forms, etc.
See previous answer. The start and randomly after that. The department also establishes a curve, and we verify what the Contractor gets along with our results.
We have two uses. We also allow them to be used for concrete pavement. It is attached. We have a draft of it for case by case on ready mix concrete. I do not have an electronic version, so I will have to e-mail it to you.
Ohio Yes We haven't used it directly for cylinders but have used for flexural strength early opening of concrete pavement
We have proposed this in some of our concrete strength specifications and would support it but have yet to see a Contractor take advantage.
Yes See attachment
Oklahoma Yes. Not formally, but it has happened.
When we have it was for early entry. Yes. All 28-day cylinders and enough early cylinders to establish the curves.
We do not have a specification that I am aware of as it has only been used on a couple of projects at the contractor’s request.
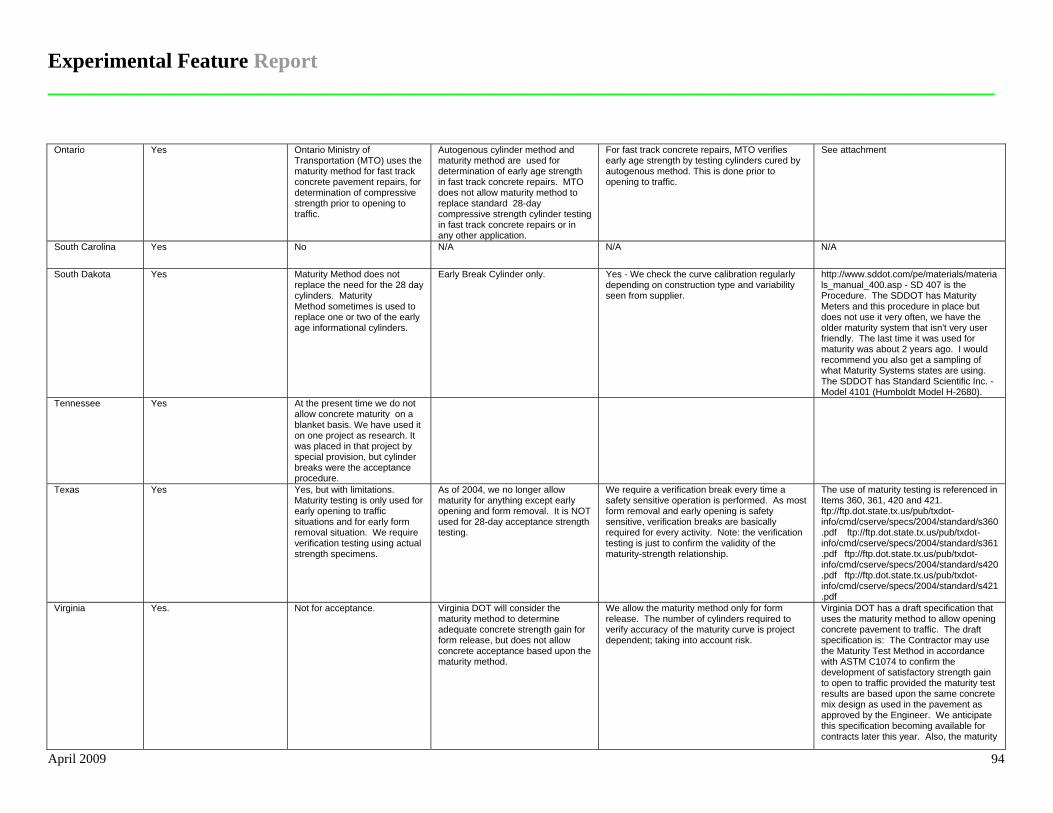
Experimental Feature Report _________________________________________________________________________________________
April 2009 94
Ontario Yes Ontario Ministry of Transportation (MTO) uses the maturity method for fast track concrete pavement repairs, for determination of compressive strength prior to opening to traffic.
Autogenous cylinder method and maturity method are used for determination of early age strength in fast track concrete repairs. MTO does not allow maturity method to replace standard 28-day compressive strength cylinder testing in fast track concrete repairs or in any other application.
For fast track concrete repairs, MTO verifies early age strength by testing cylinders cured by autogenous method. This is done prior to opening to traffic.
See attachment
South Carolina Yes No N/A N/A N/A
South Dakota Yes Maturity Method does not replace the need for the 28 day cylinders. Maturity Method sometimes is used to replace one or two of the early age informational cylinders.
Early Break Cylinder only. Yes - We check the curve calibration regularly depending on construction type and variability seen from supplier.
http://www.sddot.com/pe/materials/materials_manual_400.asp - SD 407 is the Procedure. The SDDOT has Maturity Meters and this procedure in place but does not use it very often, we have the older maturity system that isn't very user friendly. The last time it was used for maturity was about 2 years ago. I would recommend you also get a sampling of what Maturity Systems states are using. The SDDOT has Standard Scientific Inc. - Model 4101 (Humboldt Model H-2680).
Tennessee Yes At the present time we do not allow concrete maturity on a blanket basis. We have used it on one project as research. It was placed in that project by special provision, but cylinder breaks were the acceptance procedure.
Texas Yes Yes, but with limitations. Maturity testing is only used for early opening to traffic situations and for early form removal situation. We require verification testing using actual strength specimens.
As of 2004, we no longer allow maturity for anything except early opening and form removal. It is NOT used for 28-day acceptance strength testing.
We require a verification break every time a safety sensitive operation is performed. As most form removal and early opening is safety sensitive, verification breaks are basically required for every activity. Note: the verification testing is just to confirm the validity of the maturity-strength relationship.
The use of maturity testing is referenced in Items 360, 361, 420 and 421. ftp://ftp.dot.state.tx.us/pub/txdot-info/cmd/cserve/specs/2004/standard/s360.pdf ftp://ftp.dot.state.tx.us/pub/txdot-info/cmd/cserve/specs/2004/standard/s361.pdf ftp://ftp.dot.state.tx.us/pub/txdot-info/cmd/cserve/specs/2004/standard/s420.pdf ftp://ftp.dot.state.tx.us/pub/txdot-info/cmd/cserve/specs/2004/standard/s421.pdf
Virginia Yes. Not for acceptance. Virginia DOT will consider the maturity method to determine adequate concrete strength gain for form release, but does not allow concrete acceptance based upon the maturity method.
We allow the maturity method only for form release. The number of cylinders required to verify accuracy of the maturity curve is project dependent; taking into account risk.
Virginia DOT has a draft specification that uses the maturity method to allow opening concrete pavement to traffic. The draft specification is: The Contractor may use the Maturity Test Method in accordance with ASTM C1074 to confirm the development of satisfactory strength gain to open to traffic provided the maturity test results are based upon the same concrete mix design as used in the pavement as approved by the Engineer. We anticipate this specification becoming available for contracts later this year. Also, the maturity

Experimental Feature Report _________________________________________________________________________________________
April 2009 95
concept has been used with drilled shafts. It is important that concrete reached a minimum strength in a drilled shaft before work on an adjacent shaft is begun; thereby, preventing damage to the newly placed drilled shaft concrete. VDOT and Contractors like using the maturity method for this application.
Washington DC Yes No N/A N/A N/A
Washington Yes Yes - for opening to traffic, typically on panel replacement projects.
Early break cylinders only Yes - We require some cylinders to be fabricated and tested during the course of construction. We require the contractor to verify the calibration curve on days 1 and 2 of the project.
See attached. WSDOT has allowed maturity under the requirements of ASTM 1074 since the mid 1990's. Within the past 5 years we have required maturity on 4 projects. This allowed WSDOT to collect sufficient data to evaluate its use. We are currently summarizing our experience and hope to have a report out in a few months. A sample special provision from these projects is attached.
West Virginia Yes We are going to allow it for form removal on a current project.
This will be for form removal only. 28-day acceptance cylinders will still be required.
We will require cylinders to verify the maturity curve. Several sets of validation cylinders will be made initially until everyone agrees that the maturity curve correlates well enough to reduce the frequency down to 10%. If, during the work, the curve tends to differ from these validation cylinders, a new curve will be required.
N/A
Wisconsin Yes We allow use of maturity on PCC pavement and bridge projects as a substitute for concrete cylinders for job control functions such as opening to traffic or stripping formwork. We do NOT allow use of maturity as a substitute for 28-day acceptance (pay) cylinders.
See previous response. We require that a set of verification cylinders be cast and broken once weekly during construction when the mix is in use.
See attachments. Section 415.3.17 contains maturity specs for pavement. Section 502.3.10 contains maturity specs for structures. Section 4-25-70 of the Construction & Materials Manual contains general guidance for use of maturity.
Wyoming Yes No N/A N/A N/A