maumee bay and western lake erie water …lakeerie.ohio.gov/portals/0/closed grants/small...
TRANSCRIPT

ASSESSING THE ROLE OF TURBID RIVER PLUMES IN THE DEVELOPMENT OF MICROCYSTIS BLOOMS IN LAKE ERIE WITH MOLECULAR
TECHNIQUES
A Final Report to the Lake Erie Protection Fund (Project LEPF 00‐08)
Investigators Thomas B. Bridgeman (lead PI), Christine M. Mayer Scott A. Heckathorn,
and W. Von Sigler Department of Environmental Sciences and
Lake Erie Center, University of Toledo, Oregon, Ohio
February, 2010 Abstract Lake monitoring activities based at the University of Toledo Lake Erie Center since 2002 have identified blooms of the cyanobacterium Microcystis aeruginosa as a recurring, persistent ecological problem in Maumee Bay and western Lake Erie. Based on observations of water quality conditions leading up to blooms, we hypothesized that low-light and high-nutrient conditions in the Maumee River plume may potentially explain why outer Maumee Bay, the epicenter of most blooms, is especially prone to bloom formation. We tested our hypotheses using a combination of field measurements and laboratory experiments, measuring photosynthetic efficiency, photo-damage, proteins, pigments, and nutrient ratios to determine the physiological state of Lake Erie phytoplankton under a variety of natural and controlled conditions. Our findings supported our hypotheses, showing that turbidity interacts with vertical mixing of the water column to create a light climate that is advantageous to species, such as Microcystis, that can regulate their buoyancy. High turbidity protected Microcystis from damage to photosynthetic apparatus due to intense sunlight while also causing low-light limitation in non-buoyant phytoplankton species. Total N:P ratios indicated that phosphorus was most often the limiting nutrient. Future reductions in turbidity (suspended sediment) would alter the light climate and may reduce the advantage Microcystis currently enjoys. Reductions in phosphorus loading would likely reduce the overall biomass of algal blooms. This project was funded jointly by the Lake Erie Protection Fund and Ohio Sea Grant.

Technical Report Project Activities and Timeline In addition to the primary objectives, LEPF funding for this project also helped to provide vessel time, supplies and support for graduate and undergraduate students to complete ancillary projects related to harmful algal blooms in western Lake Erie, such as surveys of the newly invasive Lyngbya wollei and improved HAB monitoring techniques 2006: Project proposal approved, funding delayed to spring 2007. 2007: First field season (June-October). Measurements of Lake Erie Water
Quality, Microcystis bloom formation, photosynthesis measurements. 2008: Second field season (June-October). Measurements of Lake Erie Water
Quality, Microcystis bloom formation, photosynthesis measurements, laboratory experiments.
2009: Completion of sample analyses, data analyses, compilation of results, manuscript preparation. Third field season (Lake Erie water quality and Microcystis bloom measurements).
Products Presentations: 2008 Ohio Academy of Science 17th Annual Meeting/ Ohio Science Symposium
(T. Bridgeman) Chronology of Harmful Algal Blooms in Western Lake Erie 2002-2007 (invited)
2008 Ohio Academy of Science 17th Annual Meeting (J. Filbrun*, J. Chaffin**, T. Bridgeman) Quantifying Microcystis sp. in Western Lake Erie and Maumee Bay Using Density Separation and Microscopy 2002-2006.
2008 International Association of Great Lakes Research, Annual Conference (Bridgeman, T.B., and W.V. Sigler) Lyngbya wollei blooms in Western Lake Erie 2006-2007.
2008 International Association of Great Lakes Research, Annual Conference (Chaffin, J.D.** Bridgeman, T.B., and J.E. Filbrun*) Quantification of Microcystis sp. blooms in Western Lake Erie (2002-2007) and Relation to Tributary Flow.
2008 Western Lake Erie Waterkeeper Association (T. Bridgeman) Harmful Algal Blooms in Western Lake Erie 2002-2007. (invited)
2008 International Joint Commission – Council of Great Lakes Researcher Managers (T.Bridgeman) Correlations Between Maumee River Flow and Microcystis blooms (invited)
2008 Lake Erie Millenium Network, 5th Biennial Conference (T. Bridgeman and J. Chaffin**) Microcystis blooms in Western Lake Erie 2002-2007 (invited)
2009 Western Lake Erie Basin Conference, “Maumee Bay/Lake Erie Algal Bloom Overview” Maumee Bay State Park 3/11/09 (Invited)
2009 International Association of Great Lakes Research, 52nd Annual

Conference (Chaffin, J.D.** Bridgeman, T.B., and S.E. Heckathorn) The effects of light and mixing on photosynthesis physiology of Microcystis in western Lake Erie. May 2009. (V)
2009 Lake Erie Commission Fall Quarterly Meeting (T. Bridgeman) Harmful Algal Blooms in western Lake Erie. September 28 (invited)
2009 Ohio Sea Grant. (S. Brannan) Cause and Effect: Sediment Plume creates perfect incubator for Microcystis bloom. Twineline. 31(3):3-5.
Publications and Manuscripts: (*Indicates graduate students) Wang, H.* C, Gruden, T. Bridgeman, and J. Chaffin.* 2009. Detection and
Quantification of Microcystis Spp. and Microcystin-LR in Western Lake Erie during the Summer of 2007. Water Science and Technology. 60:1837-1846
Bridgeman, T. and W. Penamon*. 2009. Lyngbya wollei in western Lake Erie, Journal of Great Lakes Research, (in press).
Chaffin, J.* 2009. Physiological Ecology of Microcystis Blooms in Turbid Waters of Western Lake Erie. M.S. Thesis, University of Toledo.
Chaffin, J*. T. Bridgeman, T.B., Heckathorn, S.A., and Krause, A.E. A physiological assessment of Microcystis blooms in turbid water using chlorophyll fluorescence and photosynthetic pigments as indicators of high-light stress. (in review, Limnology and Oceanography, Jan 2010).
Chaffin, J*. T. Bridgeman, T.B., Heckathorn, S.A., and Mishra, S. Physiological health measurements of Microcystis in western Lake Erie indicate high growth rates adjacent to Maumee Bay. (in prep. for submission to Journal of Great Lakes Research, Jan. 2010).
Project Outcome The main objective of our project, as stated in our proposal, was “to determine whether light and nutrient conditions inside the Maumee River plume act as an incubator of Microcystis blooms.” Using a combination of lake measurements and laboratory experiments and applying several techniques to measure algal health, we were able to provide evidence that
1) High turbidity favors the growth of Microcystis. Turbidity interacts with vertical mixing of the water column to create a light climate that is advantageous to species, such as Microcystis, that can regulate their buoyancy. High turbidity helps protect Microcystis from damage to photosynthetic apparatus due to intense sunlight while also causing low-light limitation in non-buoyant phytoplankton species.
2) Moderate mixing favors the growth of Microcystis. Under calm conditions, Microcystis may be trapped at the water surface in scums where it is damaged by intense sunlight. Under vigorous vertical mixing, Microcystis may not be able to maintain a higher average position in the water column than non-buoyant species.
3) Microcystis was phosphorus limited. Although, ambient nitrogen concentrations typically decline greatly in late summer in western Lake

Erie, N:P ratios indicated that Microcystis was not nitrogen limited for most of its growing season. Phosphorus was most often the more limiting nutrient.
Techniques used in this research included photosynthetic efficiency and capacity, macro- and micro-nutrient analyses, total protein content, stress proteins, and algal pigment ratios. The measurements and experiments are described in detail in the 2009 Master of Science Thesis entitled “Physiological Ecology of Microcystis Blooms in Turbid Waters of Western Lake Erie” by Justin Chaffin, the U. Toledo graduate student who was supported by this project, and in upcoming technical publications. An excellent user-friendly synopsis of the some of the results for a general readership was produced by Ohio Sea Grant’s Twineline magazine: “Cause and Effect: Sediment Plume creates perfect incubator for Microcystis bloom” (S. Brannan, 2009 Twineline 31(3):3 Lessons Learned While most of the measurements of algal physiological status provided useful results that added to the overall picture, we were unable to complete the RNA-based molecular analyses that we had proposed. These analyses would have provided a more direct measure of Microcystis metabolic activity and relative growth rates. We were unable to locate the necessary primers and sequences needed for these analyses. Although we may surmise that environmental conditions that produce a high state of physiological health in algae also promote rapid growth of algae, we were unable to measure growth directly. Direct measures of algal growth rates under conditions of varying turbidity, nutrients, and mixing would be a logical next stage in this research. Implications of Project The results of the project suggest that the problem of Microcystis blooms in western Lake Erie could be reduced if turbidity (mainly caused by suspended sediments) in western Lake could be reduced. It has been suggested by some that the open-lake disposal of dredged materials contributes to lake turbidity and therefore contributes to Microcystis blooms. However, our research did not investigate the causes of turbidity, or the contribution of dredging disposal to turbidity. Without further data on the importance of open lake dredging disposal in causing turbid conditions in western Lake Erie, our results should not be applied to dredging policy. Analyses of nitrogen, carbon, and phosphorus content in Microcystis suggests that although phosphorus deficiencies were only moderate, Microcystis growth is more limited by phosphorus than by nitrogen, therefore nutrient abatement efforts aimed at reducing phosphorus loading may provide a beneficial effect in reducing Microcystis blooms.

Summary Figures: All figures are from Justin Chaffin’s MS thesis. See attached. Copyright 2009, Justin D. Chaffin.
Figure 1: Sampling sites in Western Lake Erie

Figure 2: Experimental chambers for manipulation of turbidity, mixing, and nutrients.
Figure 3: Summary figure showing effect of turbidity (Kpar), depth (surface,1,3, 5 m), and vertical mixing (weak, strong) on photosynthetic efficiency of Microcystis in Lake Erie 2008. High turbidity, increased depth, and strong vertical mixing all improve photosynthetic efficiency

Figure 4: Results from Lake Erie indicating A) mixed waters result in improved photosynthetic efficiency of Microcystis over calm waters B) calm waters result in damage to photosynthetic apparatus of Microcystis (black bar) due to exposure of surface scum to full sunlight
Figure 5: Results of laboratory experiment showing agreement with lake observations

Figure 6: Total phosphorus (TP) and soluble reactive phosphorus (SRP), nitrate-N and ammonium-N in western Lake Erie, 2008. Sites MB 20 through 4P are arranged from closest to furthest from Maumee River mouth. TN:TP ratios below 29 (dashed line) indicate potential nitrogen limitation.

Attached Documents: Chaffin, J. 2009. Physiological Ecology of Microcystis Blooms in Turbid Waters of
Western Lake Erie. M.S. Thesis, University of Toledo. Due to size, this document is included in the report as a PDF file only. It can also be downloaded in full from the University of Toledo Library at http://utmost.cl.utoledo.edu/
Bridgeman, T. and W. Penamon*. 2009. Lyngbya wollei in western Lake Erie,
Journal of Great Lakes Research, (in press). This document is attached here in paper form. It may also be downloaded from the Journal of Great Lake Research website: http://www.sciencedirect.com/science?_ob=PublicationURL&_tockey=%23TOC%2359068%239999%23999999999%2399999%23FLA%23&_cdi=59068&_pubType=J&_auth=y&_acct=C000062866&_version=1&_urlVersion=0&_userid=7778205&md5=bd0843c9d9996a20b08f9c4b9745a2ed
Brannan, S. 2009. Cause and Effect: Sediment Plume creates perfect incubator
for Microcystis bloom. Twineline. 31(3):3-5. This document is attached in paper form and may be downloaded from the Ohio Sea Grant office at http://www.ohioseagrant.osu.edu/_documents/twineline/v31i3.pdf

NA
TIO
NA
L O
CEAN
IC AND ATMOSPHERIC ADMIN
ISTRA
TION
U.S. DEPARTMENT OF COMMER
CE
T W I N E L I N E2 0 0 9 S U M M E R / F A L L E D I T I O N V O L . 3 1 / N O . 3
Sediment plume creates perfect incubator for Microcystis bloom
and EffEctCausE

3T W I N E L I N E 2009 SUMMER/FALL EDITION 3
P ea soup. Green Kool-Aid™. Spinach soufflé. No matter which food item comes to mind when you
see harmful algal blooms (HABs) in Lake Erie’s Western Basin or washed up along its shorelines, their existence is certainly unwelcomed. Blooms of blue-green algae called Microcystis—a common species of cyanobacteria that can produce toxins harmful to animals and people—have shut down beaches, negatively affected sport fishing and boating, and created a headache for water treatment companies. Some scientists believe that the blooms also contribute to the Dead Zone, floating out to the Central Basin where they sink and decompose, consuming the limited oxygen near the lake bottom. The blooms had disappeared in the 1980s, when Lake Erie seemed to be on the road to recovery, but the last 10 years have seen their resurgence.
In his work at the Lake Erie Center at the University of Toledo, Ohio Sea Grant researcher Dr. Tom Bridgeman was on the scene to witness one of the first large Microcystis blooms that formed in Maumee Bay in 2003. In the next few years, he began to see a pattern.
“We noticed from satellite photos that the blooms overlapped almost exactly with this
big, muddy river plume coming from the Maumee River,” he recalls. “We started to think there might be a connection between the plume and the bloom.”
So in the summers of 2007 and 2008, Bridgeman’s graduate student Justin Chaffin set out to see if there was indeed a connection between the two. It turns out that sediment plumes are the perfect incubator for the HABs, and limiting the mud that gets swept downriver and into Lake Erie’s Western Basin could go a long way toward reducing their occurrence.
In Full BloomChaffin’s data collection endeavors didn’t
start out successfully. The summer of 2007 was unusually dry, which meant fewer, smaller blooms. “I only found Microcystis the first and last days I went out to sample,” he says. The next year, however, was a different story. Microcystis levels were moderate all summer, and then, in August, a strong storm swept through the Western Lake Erie region, stirring up a lot of sediment that poured from the Maumee River and into the
T W I N E L I N E 2009 SUMMER/FALL EDITION
by Stacy Brannan, Ohio Sea Grant Communications
Sediment plume creates perfect incubator for Microcystis bloomand EffEctCausE
Turbid or muddy water acts as the perfect incubator for Microcystis blooms. The picture on the left shows the plume of sediment coming from the Maumee River on August 26, 2008—a breezy day when the water column was mixing. On the right, in a picture taken on September 3, 2008, you can see that the bloom had grown over the plume.

4 T W I N E L I N E 2009 SUMMER/FALL EDITION
Maumee Bay. As Bridgeman and Chaffin had predicted, by September a massive bloom spread over the muddy plume, starting from the river and extending nearly 75 miles to Avon Point.
“Justin found that the summer of 2008 had the largest, most extensive Microcystis bloom since we started keeping track in 2002,” Bridgeman explains. “It was 20 times larger than what we’d seen in 2002 and six times larger than 2007.”
Bridgeman and Chaffin boarded their 25-foot research vessel to collect samples six times, starting in late July 2008 before the large bloom and continuing through September, from six different sites: two near shore at the mouth of the Maumee River, two at mid-range, and two off shore, toward the center of Lake Erie’s Western Basin. The mid-range points, it turned out, had the perfect characteristics of a Microcystis incubator.
“Near shore is too shallow, so light is able to penetrate down to the lake floor, giving all species of algae more than enough light to thrive. Microcystis doesn’t have an advantage there,” Chaffin says. “Further out, the
sediment and nutrients from the river plume are too dispersed. Those points in the middle have the right combination of turbidity, or muddiness, and depth.”
All things being equal, beneficial phytoplankton like green algae and diatoms will outgrow Microcystis, but the harmful cyanobacterium has one ability the others don’t: it can regulate its buoyancy. In a typical 24-hour period, a Microcystis alga gathers carbon in its cells via photosynthesis. The process causes it to grow heavier, and it eventually sinks toward the bottom of the lake. As it respires, or uses up its carbon stores, bubble-like structures called gas vacuoles are formed internally, causing it to rise to the surface again. Given enough time, Microcystis can adjust to conditions that might keep it from gathering light at the surface of the water. Very choppy water that would cause strong mixing of the water column, for instance, is too strong for it to overcome.
When waters are calm, 90% of all Microcystis cyanobacteria can be found at the surface. This can further shade other varieties of algae that don’t have the buoyancy benefit.
But there is a downside to Microcystis’ floating ability. In testing the samples, Chaffin found that bright, direct sunlight in calm water can actually damage the blue-green algae, regardless of the amount of mud in the water, as illustrated in Figure A. “On calm, sunny days, Microcystis floating on the surface became damaged quickly, showing loss of up to 50% of photosynthetic capacity in samples collected between 10 a.m. and 2 p.m.,” he explains. “Even after 2 to 5 hours of recovery time in the dark, traveling to the lab for testing, much of this damage was still unrepaired.” So the longer Microcystis is stuck in the sun’s direct rays, the more likely it is to be damaged significantly.
However, when the water is filled with sediment and breezes help to mix the water column, muddiness acts as a protective shield, as illustrated in Figure B. “On sunny days when the water was turbid and winds were blowing above 7 miles per hour, Microcystis was mixed more evenly throughout the water column, and no significant damage to its photosynthetic machinery was observed,” Chaffin relays. In having the opportunity to float just below the surface of the muddy water, the Microcystis can gather all the light it needs without sustaining ill effects.
Its responses even adapt to maximize its light-collecting efforts. “Any photosynthesizer will become more efficient at photosynthesis when it’s kept in low light conditions, whether it’s a small tree growing in a shaded forest or Microcystis growing in murky water,” Chaffin says. To prove that the cyanobacteria had made such an adjustment, Chaffin extracted the photosynthetic pigments from his Microcystis samples and tested them to determine how much chlorophyll and phycocyanin were present per gram of blue-green algae, knowing that both pigments are responsible for harvesting light energy. He found that Microcystis will produce double the amount of chlorophyll and six times the amount of phycocyanin, a pigment unique to cyanobacteria, when it’s in muddy water compared to when it’s in clear water.
4 T W I N E L I N E 2009 SUMMER/FALL EDITION
In 2008, Ohio Sea Grant researcher Dr. Tom Bridgeman and his graduate student Justin Chaffin collected samples at six different sites a total of six times from July through September. Chaffin determined that the Microcystis had plenty of nitrogen but were still phosphorus deprived, indicating that phosphorus levels determine how much the blue-green algae will grow.

5T W I N E L I N E 2009 SUMMER/FALL EDITION 5T W I N E L I N E 2009 SUMMER/FALL EDITION
But the turbidity of the Maumee River plume is not the only thing contributing to the massive Microcystis blooms. The river also washes high levels of nutrients into Lake Erie from agricultural runoff in the region. Chaffin tested his samples for the nutrients most commonly blamed for increased HAB growth: phosphorus and nitrogen.
“It’s typically thought that Microcystis does well when nitrogen is very low and phosphorus is high,” he explains. “Sure enough, when I tested the samples, the cyanobacteria had plenty of nitrogen but were still phosphorus deprived. So, the hypothesis still holds true: Microcystis is phosphorus limited in Lake Erie. The amount of phosphorus in the water is going to determine how much the cyanobacteria can grow.”
This result underscores the importance of determining the source of the phosphorus that has plagued Lake Erie for decades. Following the passage of the Great Lakes Water Quality Agreement and the Clean Water Act, phosphorus loading was limited in the 1970s, resulting in a cleaner, clearer lake. But even though the amount
of phosphorus being dumped into the lake has remained below the amount recommended by management agencies, the level of soluble reactive phosphorus in the lake water has increased since the mid-1990s. Researchers believe this may be attributable to a shift in the kind of phosphorus being flushed into the lake via runoff. Phosphonates—a kind of phosphorus commonly found in chemical weed killers—might be more biologically available to harmful varieties of blue-green algae, such as Microcystis, than to beneficial algae. Scientists at Ohio Sea Grant and other agencies are currently working to solve this puzzle.
Clearing the Water As for clearing up the turbid plume
that originates at the Maumee River, any management practice that would limit erosion would improve the situation. “Impermeable surfaces, such as roads, parking lots, and even hard-packed land, do not allow water to infiltrate the ground,” Chaffin relates. “Instead, the water is forced into storm drains and streams, taking soil
particles along with it. The key is to create barriers that slow down the water’s flow, allowing it to be absorbed. This applies to any watershed, not only Lake Erie.”
Plants are very good at capturing water in their root systems, so placing them in an area where water tends to flow is recommended. For instance, farmers can install buffer strips of vegetation around plowed fields and along rivers, and regional land managers can design drainage ditches with a number of turns to give rain water a chance to be absorbed. Wetlands also slow the flow of water and are natural contaminant filters, so restoring or creating them will reduce both sediment and nutrient loading.
People who are interested in doing their own part to limit soil runoff can catch rain from their home’s gutters in a rain barrel, the water from which can be reused for garden irrigation. Rain gardens—a planted strip along the edges of driveways, walkways, and any other impervious surface—will absorb storm water as well. Native plants, such as wild flowers, are particularly well suited to this task.
Storms will always stir up a certain amount of sediment that already exists in the Maumee River and Lake Erie, simply because they mix the water column. However, implementing some of these land use practices could make a real difference.
“If we can limit the amount of sediment that gets into the river,” Bridgeman explains, “it would decrease the amount of sediment that gets kicked up during storms over time.”
For more information about this research, which was jointly funded by Ohio Sea Grant and the Lake Erie Protection Fund, contact Dr. Tom Bridgeman at [email protected]. TL
Figure A – Microcystis is damaged on calm, sunny days when they float on the surface of the water
Microcystis’ Response to Light
Figure B – Sediment protects Microcystis when the lake is mixing
Increased levels of sediment in the water Increased levels of sediment in the water
“If we can limit the amount of sediment that gets into the river,” Bridgeman explains, “it would decrease the amount of sediment that gets kicked up during storms over time.”
Bright, direct sunlight in calm water can actually damage Microcystis, even if the water is muddy, because of its tendency to float on the water’s surface (Figure A). However, when the water is filled with sediment and breezes mix the water column, muddiness acts as a protective shield, helping the Microcystis to thrive (Figure B).

Journal of Great Lakes Research xxx (2010) xxx–xxx
JGLR-00126; No. of pages: 5; 4C:
Contents lists available at ScienceDirect
Journal of Great Lakes Research
j ourna l homepage: www.e lsev ie r.com/ locate / jg l r
ARTICLE IN PRESS
Lyngbya wollei in Western Lake Erie
Thomas B. Bridgeman a,⁎, Wanda A. Penamon b,1
a Department of Environmental Sciences and Lake Erie Center, University of Toledo, 6200 Bayshore Rd., Oregon, OH 43616, USAb Department of Curriculum and Instruction, Secondary Education, Science, University of Toledo, 2801 W. Bancroft, MS 958, Toledo, OH 43606, USA
⁎ Corresponding author. Tel.: +1 419 530 8373.E-mail addresses: [email protected] (
[email protected] (W.A. Penamon).1 Tel.: +1 419 530 2060.
0380-1330/$ – see front matter © 2009 Elsevier Inc. Adoi:10.1016/j.jglr.2009.12.003
Please cite this article as: Bridgeman, T.B.,jglr.2009.12.003
a b s t r a c t
a r t i c l e i n f oArticle history:Received 22 July 2009Accepted 25 November 2009Available online xxxx
Communicated by Gary L. Fahnenstiel
Index words:Lyngbya wolleiPlectonema wolleiGreat LakesLake ErieHarmful Algal BloomCyanobacteria
We report on the emergence of the potentially toxic filamentous cyanobacterium, Lyngbya wollei as anuisance species in western Lake Erie. The first indication of heavy L. wollei growth along the lake bottomoccurred in September 2006, when a storm deposited large mats of L. wollei in coves along the south shore ofMaumee Bay. These mats remained intact over winter and new growth was observed along the margins inApril 2007. Mats ranged in thickness from 0.2 to 1.2 m and we estimated that one 100-m stretch of shorelinealong the southern shore of Maumee Bay was covered with approximately 200 metric tons of L. wollei.Nearshore surveys conducted in July 2008 revealed greatest benthic L. wollei biomass (591 g/m2±361 g/m2
fresh weight) in Maumee Bay at depth contours between 1.5 and 3.5 m corresponding to benthic irradianceof approximately 4.0–0.05% of surface irradiance and sand/crushed dreissenid mussel shell-type substrate. Ashoreline survey indicated a generally decreasing prevalence of shoreline L. wollei mats with distance fromMaumee Bay. Surveys of nearshore benthic areas outside of Maumee Bay revealed substantial L. wollei bedsnorth along the Michigan shoreline, but very little L wollei growth to the east along the Ohio shoreline.
© 2009 Elsevier Inc. All rights reserved.
Introduction
The filamentous cyanobacterium Lyngbya wollei (Farlow exGomont) Speziale and Dyck is a freshwater nuisance alga in thesoutheastern United States (Speziale and Dyck, 1992). L. wollei iscommonly found from North Carolina to northern Florida where it isusually described as growing in mats along the bottom of ponds andreservoirs or, in larger water bodies, in shallow, protected embay-ments (Speziale and Dyck, 1992; Cowell and Botts, 1994; Stevenson etal., 2004). Recently, molecular phylogenetic analysis of southernpopulations indicates that L. wollei encompasses at least two species(Joyner et al., 2008). In southern states, L. wollei mats may becomeperennial (Speziale and Dyck, 1991) and typically become apparent insummer when mats float to the surface where they may become anuisance by clogging waterways (Beer et al., 1986). Reports of L.wollei are not limited to the south. Descriptions of floating Lyngbyamats (probably L. wollei) in New England ponds date to thenineteenth century (Speziale and Dyck, 1992). Recently, L. wolleiinfestations have been reported in two shallow lakes in WhiteshellProvincial Park near Winnipeg, Manitoba (Winnipeg Free Press 2003)where it is believed that the cyanobacterium was accidentallyintroduced by boats and trailers that are transported to southernstates during winter. In the Great Lakes region, L. wollei has recently
T.B. Bridgeman),
ll rights reserved.
Penamon, W.A., Lyngbya wo
been found to dominate the benthic macroalgae in a section of the St.Lawrence River that is influenced by the discharge of nearby nutrient-rich tributaries (Vis et al., 2008). In addition to the nuisance caused bylarge mats, North American blooms of L. wollei have been found toproduce paralytic shellfish toxins (PSTs) (Carmichael et al., 1997;Onodera et al., 1997), but to date the Lake Erie strain has not beenreported to contain PSTs.
In 2006, large shoreline mats of a filamentous cyanobacteriumfitting the description of L. wollei appeared in western Lake Erie.Genetic and morphological analyses of this material indicated thatLake Erie L. wollei could be grouped with one of the distinct L. wolleisubclusters (OTU3) found in the Florida panhandle region (J. Joyner,personal communication). While it remains uncertain whether thenuisance strain is an introduced form of L. wollei from southeastern U.S.A., or a strain previously recorded in Lake Erie, Plectonema wollei(Taft, 1942), the sudden appearance, size and endurance of the matshas caused great concern among shoreline property owners, beachmanagers, and public officials. In this report, we provide observationson the location, size, and biomass of shoreline mats and nearshoregrowing regions.
Materials and methods
Samples of the cyanobacterial mats along the shoreline andbottom of Maumee Bay were collected between April 2007 and July2008 (Fig. 1). Identification of L. wollei in Lake Erie was made usingthe description by Speziale and Dyck (1992). Cell and filamentdimensions were measured using a Leica compound microscope at400×. Initial assistance in identification was provided by R. Lowe at
llei in Western Lake Erie, J. Great Lakes Res. (2010), doi:10.1016/j.

Fig. 1. Locations of shoreline survey (squares) and benthic samples (circles) in western Lake Erie in 2008. Closed symbols represent presence of L. wollei and open symbols representabsence. Lines represent transects with several additional samples collected across depth contours. Sites counterclockwise along the shore: Stony Pont (SP), Sterling State Park (SSP),Bolles Harbor (BH), North Shore (NS), Luna Pier (LP), Erie Beach (EB), Bayshore Plant (BP), Lake Erie Center (LEC), Maumee Bay State Park (MBSP), Reno Beach (RB), Crane Creek(CC), Locust Point (LP), Camp Perry (CP). Additional lake sites: Grassy Island (GI), Turtle Island (TI), Offshore (OS 1–3).
2 T.B. Bridgeman, W.A. Penamon / Journal of Great Lakes Research xxx (2010) xxx–xxx
ARTICLE IN PRESS
Bowling Green State University and later confirmed by preservedsamples sent to B. Speziale (B. Speziale, Clemson University, personalcommunication).
A survey for the presence of L. wollei along the shoreline ofsouthwestern Lake Erie was conducted in June and July 2008 along an87 km stretch of shoreline from Stony Point, Michigan to Port Clinton,Ohio (Fig. 1). Beaches and other publicly accessible locations weresurveyed visually and if filamentous algaewere present, sampleswerecollected for later identification. Benthic surveys for submerged L.wollei mats were conducted from small boats in July 2008 at 12locations in or adjacent to Maumee Bay (Fig. 1). At several nearshorelocations, a series of bottom samples were collected in transectsperpendicular to the shoreline (indicated by lines in Fig. 1) along arange of bottom contours ranging from 0.5 m to 5 m in depth. Thepresence of L. wollei mats was detected using a benthic rake, and anEkman grab sampler. The benthic rake was used to identify thepresence of L. wollei beds at depths up to 3.5 m. If L. wollei wasdetected, 5 grab samples were collected at the location. L. wollei fromeach grab sample was separated from sediments using a sieve bucket(Wildco, 500 um mesh) for later biomass determination. At depthsN3.5 m, grab samples only were collected. At the location thatprobably had the densest growth of L. wollei (Bolles Harbor 2), thethickness of the L. wollei bed prevented penetration by either anEkman or a petite Ponar dredge. Samples from each location wereexamined using a compound microscope to identify algal filaments. L.wollei fresh wet was determined by pressing extraneous water fromsamples and then weighing. Dry weight was determined by dryingsamples at 65 °C to a constant weight.
Subsurface irradiance measurements, which are used here tocalculate typical benthic irradiance in Maumee Bay were made atvarious locations in Maumee Bay and western Lake Erie between Mayand October of 2002–2005 as part of a water quality monitoringprogram. Measurements were made using an integrating quantumradiometer (LI-188B, Li-Cor, Inc.) equipped with a spherical sensor.The average irradiance just beneath the water surface (0 m) wascalculated from all measurements (N=112) and the averageextinction coefficient for photosynthetically active radiation (KPAR)
Please cite this article as: Bridgeman, T.B., Penamon, W.A., Lyngbya wojglr.2009.12.003
for nearshore areas was calculated using only measurements takenwithin Maumee Bay or adjacent regions that are frequently subject tothe turbid conditions of the Maumee River plume (N=61).
The size and volume of the L. wollei mat along a 100 m relativelysheltered section of shoreline near the University of Toledo Lake ErieCenter (Fig. 1, LEC) was estimated using a 60-m tape measure andgraduated 1.3 m dowel rods to probe the thickness of the mat. A gridpattern was established along the shore with the thickness of the matprobed every 2 m. A post-hole digger was used in several locations toverify that the dowel rods accurately gauged mat thickness. Volumewas calculated by dividing the mat into sections (ridges and lowareas), multiplying mat thickness by surface area of the sections, thensumming over the sections. Fresh biomass of the mat was estimatedby weighing 12 L buckets full of cyanobacteria to determine L. wolleibiomass per liter.
Results
Shoreline mats
Shoreline residents along southern Maumee Bay reported thatmats of filamentous algae first appeared on their property followingan unusual period from August 28 to September 2, 2006 whenstrong winds blew from the northeast for 6 consecutive days.During this period, wind speeds averaged 23 km/h (NOAADatabuoy Station SBI01)). The strong northeasterly winds tempo-rarily elevated water levels in Maumee Bay to 50–100 cm above theseason average (NOAA Station 9063085, Toledo) and causedextensive wave action along the shoreline. When the lake calmedand the water receded on September 2, mats of L. wollei were leftbehind on the shore. Shoreline areas protruding into the lake werenot affected, while coves received large mats. We calculated thatthe 100 m shoreline in a small cove (sheltered on three sides) nearthe Lake Erie Center (Fig. 1, LEC) received approximately 200 metrictons of L. wollei.
The appearance of this large biomass over the course of a few dayssuggests that L. wollei had been growing unnoticed inMaumee Bay for
llei in Western Lake Erie, J. Great Lakes Res. (2010), doi:10.1016/j.

Table 1Location, water depths, and substrate types of sampling sites including wet and dryweights of L. wollei from 5 replicate benthic grabs plus or minus standard error. Wherequantitative measurements could not be taken, + indicates trace amounts of L. wollei,++ moderate, +++ heavy, and ++++ indicates L. wollei mat too dense forsampling with dredges. Samples were collected June–July 2008.
Location Depth(m)
Wet wt.(g/m2)
Dry wt.(g/m2)
Substrate
Bolles HarborBH1 1.6 156±122 23±18 Sand, dreissenidsBH2 2.6 ++++ Sand, dreissenidsBH3 3.3 115±41 25±8 Sand, dreissenids
Luna PierLP1 2.0 2±2 0.8±0.7 Sand, dreissenidsLP2 3.5 53±25 9±4 Sand, dreissenidsLP3 4.1 1±1 0.2±0.2 Sand, dreissenids
Erie BeachEB1 2.7 0 0 SiltEB2 5.0 0 0 Silt
Turtle Is. (TI) 2.0 + Compacted sedimentGrassy Is. (GI) 1.5 0 0 SoftBayshore Plant
BP1 2.0 0 0 compacted, cobbleBP2 2.4 0 0 compacted, cobbleBP3 2.8 0 0 compacted, cobble
L. Erie CenterLE1 1.9 + Sand, dreissenidsLE2 2.3 ++ Sand, dreissenidsLE3 2.7 +++ Sand, dreissenidsLE4 3.1 0 0 Sand, dreissenidsLE5 3.4 0 0 Sand, dreissenids
Maumee Bay SPMBSP1 0.5 0 0 SandMBSP2 1.5 + SandMBSP3 2.0 591±361 75±45 Sand, dreissenidsMBSP4 2.8 501±167 70±23 Sand, dreissenidsMBSP5 3.1 186±122 27±16 Sand, dreissenidsMBSP6 3.4 164±164 22±22 Sand, dreissenidsMBSP7 3.5 2±2 0.5±0.5 Sand, dreissenids
Reno BeachRB1 1.0 0 0 Sand, dreissenidsRB2 2.0 0 0 Sand, dreissenidsRB3 3.1 0 0 Sand, dreissenidsRB4 4.1 2±2 0.5±0.5 Sand, dreissenidsRB5 5.3 1±1 0.2±0.2 Sand, dreissenids
Offshore SitesOS1 5.2 0 0 CompactedOS2 5.8 0 0 SiltOS3 6.5 0 0 Silt
3T.B. Bridgeman, W.A. Penamon / Journal of Great Lakes Research xxx (2010) xxx–xxx
ARTICLE IN PRESS
most of the summer before being dislodged by the storm. Planktontows collected in Maumee Bay between May and August 16, 2006 aspart of a monitoring program did not contain filaments, indicatingthat L. wollei was not present in the water column during most of thesummer. Shoreline mats were resistant to decay over the winter of2006–2007, with green, potentially viable filaments found a fewcentimeters below the dried crust formed by the mat surface. In April2007, substantial fresh material was added to the mats. Throughoutthe summer of 2007, terrestrial plants colonized the shoreline matsuntil in some places the mats were no longer visible beneath thevegetation. In early October, 2007, submergedmats growing at depthsof 1-2 m at Maumee Bay State Park (Fig. 1, MBSP) were observed inthe process of separating from the bottom and floating to the surface.On October 8, floating mats estimated in size from 3 to 150 m2 wereobserved floating as far as 15 km from shore. Fragments of dreissenidmussels were often found entangled on the underside of floatingmats. During this period, prevailing winds were from the south andwest, therefore there was little addition to the shoreline mats. In April2008 and again in April 2009, fresh material was observed eithergrowing at the margin of the shoreline mats, or being washed ashore.
Shoreline survey
In July of 2008, a survey of L. wollei presence was conducted at 12locations along the Lake Erie Shoreline between Stony Point, Michigan(SP) and Port Clinton, Ohio. L. wolleiwas found at 9 of the 12 locations(Fig. 1). In general, the prevalence of L. wollei on the shorelinedecreased with increasing distance from Maumee Bay. Along theMichigan shoreline, L. wollei was scarce at locations (Fig. 1: SSP, SP)north of Bolles Harbor (Fig. 1, BH), where most of the filamentousalgae found on the shore was Cladophora sp. Likewise, on the Ohioshoreline, L. wollei became increasing scarce east of Maumee Bay(Fig. 1: RB, SC, LP, CP). The material washed ashore in Maumee Bayand along the Michigan shoreline adjacent to the bay appeared to befresh, suggesting transport from nearby growing areas. L. wolleimasses that were found on the shoreline east of Maumee Bay nearSwan Creek (SC) and Camp Perry (CP) had filaments that werefragmented and upon microscopic examination, found to be largelydead or senescent, suggesting transport from a more distant location.
Benthic mats
In order to determine areas of active growth, benthic surveys forsubmerged L. wollei mats were conducted in July 2008 at 12 mainlocations in or adjacent to Maumee Bay (Fig. 1). The greatest biomassof benthic mats was observed at two locations, Bolles Harbor (BH) andMaumee Bay State Park (MBSP), at distances of about 250–500m fromthe shore at water depths from 1.5 to 3.5 m (Table 1). Mats of lowerbiomass were found over a similar range of depths near Luna Pier, MI.Very little benthic L. wollei was detected at sites east of Maumee Bay(Table 1: RB) or at offshore sites (Table 1: OS1, OS2, OS3).
Measurements of PAR were used to determine irradiance levels inbenthic areas where L. wollei was prevalent. The average sub-surface(0 m) light level measured from 2002 to 2004 was 1638 μE/m2 s, andthe average of nearshore PAR extinction coefficients (KPAR) was 2.19.Applying the average KPAR value to the average 0 m light levelproduced average mid-day benthic irradiance values of 61.3 μE/m2 s(about 4% of subsurface light) at a depth of 1.5 m and 0.8 μE/m2 s(about 0.05% surface light) at a depth of 3.5 m. In transects conductedperpendicular to shore from bottom depths between 0.5 m to 5.0 m,little L. wolleiwas found at depths shallower than 1m, presumably dueto wave action. L. wollei biomass increased with increasing depth to amaximum at depths between 1.6 m (BH1) and 3.5 m (LP2). At depthsdeeper than 3.0–3.5 m, L wollei density tended to decrease. At mostlocations, substrate type did not change markedly with increasingdepth. Although dissolved nutrient concentrations (N and P) were not
Please cite this article as: Bridgeman, T.B., Penamon, W.A., Lyngbya wojglr.2009.12.003
measured for this study, a previous study indicates that nutrientconcentrations decline over a span of several kilometers withincreasing distance from the mouth of the Maumee River (Moorheadet al., 2003). Also, summer nutrient concentrations are usuallysufficient to grow large blooms of nuisance algae (Microcystis sp.)throughout the bay. We would not expect a steep nutrient gradientover the range of the few hundredmeters in which L. wollei beds weremost prevalent. Therefore we suspect that the decrease in L. wolleidensity with depth was due more to light limitation than change insubstrate type or nutrient concentrations.
Although no quantitative data were collected on substrate type,we observed some general associations between L. wollei andsubstrate type. In most cases where L. wollei appeared to be growingin place, the substrate consisted of sand, dreissenid clusters,fragmented dreissenid shells, or a mixture of the three. L. wolleimats were not found growing on very soft, silt sediments (Table 1:EB1–2, OS2–3), and only trace amounts were detected on hard,compacted clay bottom (Table 1: RB 1–5, OS1, TI).
Discussion
The recent blooms of Lyngbya wollei in western Lake Erie are partof a trend towards increased coverage and biomass of filamentous
llei in Western Lake Erie, J. Great Lakes Res. (2010), doi:10.1016/j.

4 T.B. Bridgeman, W.A. Penamon / Journal of Great Lakes Research xxx (2010) xxx–xxx
ARTICLE IN PRESS
benthic algae in the Laurentian Great Lakes exemplified by the re-emergence of Cladophora sp. in eastern Lake Erie (Higgins et al., 2005)and Lake Michigan (Bootsma et al., 2005). The shift toward benthicmacroalgae has been attributed in large part to the colonization ofnearshore regions by dreissenid mussels which provide habitat forCladophora by improving water clarity thereby increasing light tothe benthos, recycling nutrients for algal growth, and providingsurfaces for algal attachment (Hecky et al., 2004). In many ways,Maumee Bay would seem to be highly suitable for benthic macro-algae; it is rich in nutrients, shallow, and warm. However, whileCladophora has returned to nuisance levels in other nearshore areasof Lake Erie, Maumee Bay has remained relatively Cladophora-free.
The scarcity of Cladophora in Maumee Bay in Maumee Bay canlikely be attributed to two resources: light and substrate. Theminimum mid-day irradiance for Cladophora growth in Lake Eriehas been reported to be about 50 μE/m2 s (Lorenz et al., 1991). Giventhe high levels of suspended sediments and high average KPAR inMaumee Bay, Cladophora would be restricted to a narrow bandaround the shoreline at depths less than about 1.6 m. In addition tolight levels, Cladophora is limited by the availability of suitablesubstrate for attachment. The rocky substrates preferred by Clado-phora are uncommon in the Maumee Bay region, where typicalbottom types are sand, silt, and consolidated sediments. Althoughdreissenid shells provide attachment for Cladophora, the shallowerregions where there is enough light for Cladophora growth generallyhave few intact dreissenid clusters. More common in this high-energyenvironment is a layer of crushed dreissenid shells that is not suitablefor Cladophora attachment (Higgins et al., 2005).
In contrast to Cladophora, southern U.S. strains of L. wollei requiremuch less light (Pinowska et al., 2007), and therefore can grow atgreater depths or under more turbid conditions. If the Lake Erie strainis similar to the southern strains in its low light requirements, thiscould help to explain the distribution of L. wollei in turbid MaumeeBay where peak biomass of L. wollei usually occurred at depthsbetween 2.0 and 2.8 m, corresponding to average benthic irradiancesbetween 18 and 53 μE/m2 s. Pinowska et al., 2007 reported optimumlight levels of 50 μE/m2 s for southern L. wollei strains. Also, L. wolleidoes not require an attachment to hard substrates. Observations bydivers in Maumee Bay indicate that L. wollei filaments form a looseassociation with the substrate by becoming partially buried in thetypes of sandy or crushed dreissenid shell substrates that are commonin Maumee Bay. Gentle water currents were not seen to dislodge L.wollei, but divers could dislodge the mats with a light tug. Based onthe prevailing light and substrate characteristics, much of theMaumee Bay area could be expected to be better habitat for L. wolleithan for Cladophora sp. In most locations sampled, the type ofsubstrate that supported the greatest density of L. wollei was amixture of fragmented dreissenid shells and sand, therefore it ispossible that by providing improved substrate, the colonization ofwestern Lake Erie by zebra and quagga mussels may have assisted L.wollei in becoming established.
The nearshore areas beyond Maumee Bay have not been fullyexplored for benthic L. wollei mats, but the lack of fresh materialwashing ashore in 2008 suggests that benthicmatsmay not have beenpresent east of Maumee Bay at that time. More recent observationsindicate that the biomass of L. wollei washing ashore east of MaumeeBay has increased, however it is unknown whether this materialrepresents an eastward expansion of benthic mats or washout fromMaumee Bay. There could be several factors that affect the expansionof L. wollei east along the Lake Erie shoreline. These factors includenutrient concentrations (N, P), which are high in Maumee Bay, butdecrease sharply with distance from the bay (Moorhead et al., 2008),greater bottom slope, which narrows the suitable depth contours forL. wollei growth, and less protection from wave energy.
Because of the difficulty of sampling year-round in western LakeErie, the annual growth patterns of L. wollei in Lake Erie remain poorly
Please cite this article as: Bridgeman, T.B., Penamon, W.A., Lyngbya wojglr.2009.12.003
understood. The appearance of substantial fresh L. wollei growth onthe Lake Erie shoreline each April is especially intriguing becausewater temperatures at that time are much lower than the summertemperatures usually associated with cyanobacterial blooms. Follow-ing the brief period in April when fresh biomass is deposited on theshoreline, L. wollei grows unobtrusively on the bottom during thesummer months until late summer when mats begin to separate fromthe bottom and float to the surface. This pattern suggests that benthicmats are growing during the summer months until they reachsufficient thickness to trap gas bubbles underneath, which thencauses the mats to become buoyant. This pattern of bubbleaccumulation and mat separation has been observed frequently inthe southeastern U.S. strains of L. wollei (Speziale et al., 1991) with thedifference that in the warmer climate, mats are benthic throughoutthe winter and become buoyant earlier in the spring or summer.
The maximum biomass/m2 observed in western Lake Erie in 2008was nearly 3 times higher than that observed in the St. Lawrence Riverin 2005 (27 g dry wt./m2, Vis et al., 2008), but about 11 times lowerthan what has been recorded for L. wollei in the southeastern U.S.(6.6 kg/m2 fresh weight, Speziale et al., 1991; 1 kg/m2 dry wt., Cowelland Botts, 1994). However, it is likely that benthic biomass in Lake Eriefrequently exceeds the maximum reported here because mats mayhave continued to accumulate biomass for a month or more after oursampling in July. Also in some of the areas of densest growth, benthicmats were too thick for penetration by Ekman or petite Ponar dredges.
In summary, since 2006, L. wollei has become established as areoccurring nuisance algal species in the Maumee Bay region ofwestern Lake Erie, with benthic mats growing throughout thesummer and surface mats appearing in late summer. Patterns ofbiomass on the lake bottom suggest that L. wollei grows best at depthsbetween about 1.5 and 3.5 m in a substrate of mixed sand andfragmented dreissenid shells, which would mean that a large portionof Maumee Bay may be potential habitat for L. wollei. The generaldecrease in L. wollei prevalence with increasing distance fromMaumee Bay suggests that conditions outside of the bay are lesssuitable for L. wollei growth. However, the great mobility of floating L.wollei mats in late summer suggests that L. wollei will be able todisperse along the shoreline and eventually inhabit most shorelineareas having local conditions that are suitable for its growth.
Acknowledgments
We would like to thank the students and technicians who helpedwith this research: David Hartson, Steven Timmons, and CatherineWukusick. This research was supported by the Ohio Sea Grant CollegeProgram, Project R/ER-72, under Grant NA16RG2252 from theNational Sea Grant College Program, National Oceanic and Atmo-spheric Administration and by funds provided by the Lake ErieCommission, Lake Erie Protection Fund Project #0-08. This iscontribution 2009-15 from the Lake Erie Center.
References
Beer, S., Spencer, W., Bowes, G., 1986. Photosynthesis and growth of the filamentousblue-green alga Lyngbya birgei in relation to its environment. J. Aquat. PlantManage. 24, 61–65.
Bootsma, H.A., Young, E.B., Berges, J.A., 2005. Temporal and spatial patterns ofCladophora biomass and nutrient stoichiometry in Lake Michigan, p. 81-88.Cladophora Research and Management in the Great Lakes. Great Lakes WaterInstitute Special Report No. 2005-01, Milwaukee, Wisconsin.
Carmichael, W.W., Evans, W.R., Yin, Q.Q., Bell, P., Moczydlowski, E., 1997. Evidence forparalytic shellfish poisons in the freshwater cyanobacterium Lyngbya wollei(Farlow ex Gomont) comb. nov. Appl. Environ. Microbiol. 63, 3104–3110.
Cowell, B.C., Botts, P.S., 1994. Factors influencing the distribution, abundance andgrowth of Lyngbya wollei in central Florida. Aquat. Bot. 49, 1–17.
Hecky, R.E., Smith, R.E.H., Barton, D.R., Guildford, S.J., Taylor, W.D., Charlton, M.N.,Howell, T., 2004. The nearshore phosphorus shunt: a consequence of ecosystemengineering by dreissenids in the Laurentian Great Lakes. Can. J. Fish. Aquat. Sci. 61,1285–1293.
Higgins, S.N., Howell, E.T., Hecky, R.E., Guildford, S.J., Smith, R.E., 2005. The Wall of
llei in Western Lake Erie, J. Great Lakes Res. (2010), doi:10.1016/j.

5T.B. Bridgeman, W.A. Penamon / Journal of Great Lakes Research xxx (2010) xxx–xxx
ARTICLE IN PRESS
Green: The Status of Cladophora glomerata on the Northern Shores of Lake Erie'sEastern Basin, 1995–2002. J. Great Lakes Res. 31, 547–563.
Joyner, J.J., Litaker, R.W., Paerl, H.W., 2008. Morphological and genetic evidence that thecyanobacterium Lyngbya wollei (Farlow ex Gomont) Speziale and Dyck encom-passes at least two species. Appl. Environ. Microbiol. 74, 3710–3717.
Lorenz, R.C., Monaco, M.E., Herdendorf, C.E., 1991. Minimum light require-ments for substrate colonization by Cladophora glomerata. J. Great Lakes Res.JGLRDE 17.
Moorhead, D.L., Bridgeman, T.B., Morris, J., 2003. Changes in Water Quality of MaumeeBay, Lake Erie: 1974–2002, p. 129–130. Global Threats to Large Lakes: Managing inan Environment of Instability and Unpredictability. Ecovision World MonographSeries, Burlington, Ontario.
Onodera, H., Satake, M., Oshima, Y., Yasumoto, T., Carmichael, W.W., 1997. Newsaxitoxin analogues from the freshwater filamentous cyanobacterium Lyngbyawollei. Nat. Toxins 5, 146–151.
Please cite this article as: Bridgeman, T.B., Penamon, W.A., Lyngbya wojglr.2009.12.003
Pinowska, A., Stevenson, R.J., Sickman, J.O., Albertin, A., Anderson, M., 2007. Integratedinterpretation of survey for determining nutrient thresholds for macroalgae inFlorida springs. Laboratory experiments and disturbance study. Repot to FloridaDept. of Environmental Protection. 97 pp.
Speziale, B.J., Dyck, L.A., 1992. Lyngbya infestations: comparative taxonomy of Lyngbyawollei comb. nov. (cyanobacteria). J. Phycol. 28, 693–706.
Speziale, B.J., Turner, E.G., Dyck, L.A., 1991. Physiological characteristics of vertically-stratified Lyngbya wollei mats. Lake Reserv. Manage. 7, 107–114.
Stevenson, R.J., Pinowska, A., Wang, Y.K., 2004. Ecological condition of algae andnutrients in Florida springs. Final Report to the Florida Department of Environ-mental Protection. Tallahassee, FL. 101 pp.
Taft, C.E., 1942. Additions to the algae of the west end of Lake Erie. Ohio J. Sci. (OhioAcademy of Science) 42, 251–256.
Vis, C., Cattaneo, A., Hudon, C., 2008. Shift from chlorophytes to cyanobacteria inbenthic macroalgae along a gradient of nitrate depletion. J. Phycol. 44, 38–44.
llei in Western Lake Erie, J. Great Lakes Res. (2010), doi:10.1016/j.

LAKE ERIE PROTECTION FUNDSMALL GRANT - FINAL ACCOUNTING
Grant Number:lSP 00-08 I v20O8Current Matching
E~udget Categories Balance Funds~. Salaries & Wages
; 15148,00 $15,187.37 $ - 39.37 $10,269.35
£. Fringe Benefits$ 4,303.00 $ 3,485,31 $ 817.69 $ 3,271,98
3. Total Salaries & Benefits (A+B)3~ Non-expendable Equipment
--. Expendable Materials & Supplies{ 12529.60 $ 2248.40
--. Travel3600.00 $ -999.52
$. Services or Consultants ~~~ ~ ~’ ~"; 2000.00 $ 2,800.00 $ -800.00
Publications/Presentations
.I. All other direct costs ,
K. Total Direct Costs (C thru J) $47,829.00 $46,601.80 $1,227.20 $13,541.33L. Indirect Costs
; 4805.00 $ 4660.16 $144.84 ~ 21802.80
Total Costs (K + L)Ohio Lake Erie CommissionOne Maritime Plaza, 4th FloorToledo, OH 43604p 419-245-2514f. 419-245-2519www,epa.state.oh.ustoleo
$52,634.00 $51~261. ~6 $1,372.04 $35,344.13
DateProject Director IAuthorizing Agent 1Fiscal Agent I

A Thesis
Entitled
Physiological Ecology of Microcystis Blooms in Turbid Waters of Western Lake Erie
By
Justin D. Chaffin
Submitted as partial fulfillment of the requirements for
The Master of Science degree in Biology
______________________________
Advisor: Dr. Thomas B. Bridgeman
______________________________
Dr. Scott A. Heckathorn
______________________________
Dr. Ann E. Krause
______________________________
College of Graduate Studies
The University of Toledo
August 2009

ii
Copyright 2009
This document is copyrighted material. Under copyright law, no parts of this document
maybe reproduced without the expressed permission of the author.
______________________________________________________________________

iii
An Abstract of
Physiological Ecology of Microcystis Blooms in Turbid Waters of Western Lake Erie
Justin D. Chaffin
Submitted as partial fulfillment of the requirements for
The Master of Science degree in Biology
The University of Toledo
August 2009
Microcystis blooms are annual occurrences in western Lake Erie. Field
measurements of Microcystis biovolumes from 2002- 2008 show that blooms are most
dense in waters adjacent to the Maumee Bay. This suggests that conditions within these
waters support rapid Microcystis growth. Field measurements and a laboratory
experiment showed that the high turbidity of the bay and adjacent waters alleviated high-
light stress which results in less photo-inhibition, while Microcystis in less turbid water
had more photo-inhibition. Damage occurs to Microcystis during a surface bloom as a
result of prolonged time in high-intensity light. Further, Microcystis from nearshore
water had higher protein content then that of offshore which indicates greater cellular
health. This is likely a function of turbidity and high soluble nutrients in turbid waters.
Therefore, reduced sediment loading would presumably increase growth stress for
Microcystis and would lessen the magnitude of blooms seen in western Lake Erie.

iv
Dedication
This thesis is dedicated to my family for getting me interested in Lake Erie very early in
my life.

v
Acknowledgements
I would like to thank my advisor Dr. Thomas Bridgeman for just the right amount
of help and guidance with my research. Also, I would like to thank my committee- Dr.
Scott Heckathorn for teaching photosynthesis physiology and use of his laboratory
instruments and Dr. Ann Krause for statistical help with my data and office space in her
laboratory on campus. Further I need to thank several other researchers, faculty, and
students who have helped me tremendously: Dr. Sasmita Mirsha for her assistance with
biochemistry techniques, Dr. Daryl Dwyer for help while I was the teacher‟s assistant for
his biodiversity class, Dr. Cyndee Gruden and Olga Mileyeva-Biebesheimer for use of
their lab‟s sonicator, Dr. Jonathan Franz for analyzing my samples for nutrient content
via ICP-OES, Kristi Mock for training me how to use the CHN auto-analyzer, Dr. Mike
McKay for giving me a phycocyanin protocol, and my team of undergraduates for field
assistance: Jesse Filbrun, Jill Reighard, Steve Timmons, Catie Wukusick, and Janine
Cannell. I would also like to thank the Lake Erie Center for use of their boat and the
Plant Research Science Center for green-house space.

vi
Table of Contents
Abstract iii
Dedication iv
Acknowledgements v
Table of Contents vi
List of Tables viii
List of Figures ix
I. Chapter 1 - Review of Microcystis Blooms in Western Lake Erie and Overview of
Thesis 1
General Background 1
Environmental Factors Associated with a Microcystis Bloom 4
Goals of this Thesis 10
Overview of Subsequent Chapters in this Thesis 11
Literature Cited 14
II. Chapter 2 - An Eco-physiological trade-off of Microcystis: Buoyancy results in
photosynthetic damage. 25
Abstract 25
Introduction 26
Methods 30
Results 40
Discussion 43
Literature Cited 51
Tables 61

vii
Figures 65
III. Chapter 3 - Measurements of Microcystis cellular health in western Lake Erie during
the 2008 bloom indicate the high turbidity and nutrients support rapid growth. 77
Abstract 77
Introduction 78
Methods 81
Results 84
Discussion 87
Literature Cited 92
Tables 97
Figures 101
IV. Chapter 4 - Conclusions 109
V. Chapter 5 - Detailed Methods and Supplemental Data 111
Experiment to Determine Photosynthetic Pigment Concentration 111
Phytoplankton Community of Western Lake Erie 2007-2008 115
Complete Methods for Laboratory Experiment 116
Complete Methods for Protein Extraction and Quantification 119
Literature Cited 121
Tables 124
Figures 126

viii
List of Tables
Table 2-1. Equations used to calculate pigment concentration 61
Table 2-2. ANCOVA table for photosynthetic efficiency 62
Table 2-3. ANCOVA table for pigment content 63
Table 2-4. P values of photosynthetic efficiency experiment 64
Table 3-1. Criterion for nutrient deficiency 97
Table 3-2. Spatial pattern of Microcystis in western Lake Erie 98
Table 3-3. Concentration of pigments in the laboratory experiment 99
Table 3-4. P values for pigment concentrations 100
Table 5-1. Macronutrients of Microcystis 124
Table 5-2. Micronutrients of Microcystis 125

ix
List of Figures
Figure 2-1. Map of six sample sites in western Lake Erie 65
Figure 2-2. Diagram of experiment 66
Figure 2-3. In situ photosynthetic efficiency 67
Figure 2-4. Light-response curve 68
Figure 2-5. Photosynthetic efficiency as function of turbidity 69
Figure 2-6. Km of the light-response curves on strongly mixed dates 70
Figure 2-7. Pigment content of Microcystis 71
Figure 2-8. Stained protein gels of Microcystis 72
Figure 2-9. Rubisco content of Microcystis 73
Figure 2-10. Photosynthetic efficiency of experiment 74
Figure 2-11. Total carotenoids of experiment 75
Figure 2-12. Microcystis abundance in western Lake Erie in 2008 76
Figure 3-1. Map of six sample sites in western Lake Erie 101
Figure 3-2. Diagram of experiment 102
Figure 3-3. Nutrient concentrations of western Lake Erie in 2008 103
Figure 3-4. Total protein content of Microcystis 105
Figure 3-5. Nutrient deficiency of Microcystis 106
Figure 3-6. Phosphorus deficiency of Microcystis 107
Figure 3-7. Chorophyll (chl) a and phycocyanin (PC) concentration of experiment 108
Figure 5-1. PC fluorescence after grinding 126
Figure 5-2. Comparison of PC fluorescence of various sonication lengths 127
Figure 5-3. Absorbance spectra of PC extracted 128

x
Figure 5-4. Comparison of chl a extraction methods 129
Figure 5-5. Chl a isopleths of western Lake Erie 130
Figure 5-6. PC isopleths of western Lake Erie 131

1
Chapter One
Review of Microcystis Blooms in Western Lake Erie and Overview of Thesis
General background
History of Lake Erie Eutrophication
Lake Erie experienced eutrophication during the mid-1900s. Yearly average
density of phytoplankton increased by 30 times from 1929 to 1963 (Davis 1964). During
this period there was a shift in species composition that indicated oligotrophic conditions
to a species composition that indicated eutrophic conditions. For example, the diatom
Asterionella (previously Melosira) was dominant during spring in the first half of the
century, then was replaced by Fragilaria and Aulacoseira in later years (Davis 1964).
Diatoms such as Asterionella, Synedra, and Aulacoseira that were dominant during the
autumn of earlier years were later replaced by Fragilaria, green algae, and cyanobacteria
species (Davis 1964). Extensive eutrophication and poor overall water quality were
observed in the western basin with the loss of the burrowing mayfly (Hexagenia spp.) in
the mid 1950s (Britt 1955), fish kills due to anoxia (Matisoff and Ciborowski 2005), and
heavy surface blooms of cyanobacteria in the 1960s and 1970s (Matisoff and Ciborowski
2005).
In response to eutrophication, the United States and Canada passed the Great
Lakes Water Quality Agreement in 1972 with the goal of decreasing phosphorus loads
2
into the lake (DePinto et al. 1986). Following pollution control programs of the 1970s,
lake phosphorus concentrations declined (DePinto et al. 1986; Matisoff and Ciborowski
2005), which resulted in a reduction of total phytoplankton biomass (Makarewicz 1993).
Furthermore, cyanobacteria were a relatively small composition of the phytoplankton
community (Makarewicz 1993). Since the mid 1990s, however, in spite of nutrient
control programs, total phytoplankton biomass has increased (Conroy et al. 2005b) and
cyanobacteria blooms have reoccurred in western Lake Erie (Brittain et al. 2000). Unlike
cyanobacteria blooms prior to nutrient controls, which were dominated by Anabaena spp.
and Aphanizomenon spp. (nitrogen fixers), Microcystis aeruginosa (non-nitrogen fixer)
dominates the currents blooms of western Lake Erie (Brittain et al. 2000; Rinta-Kanto et
al. 2005). The Microcystis bloom of 2003 was perhaps the most severe in recent years,
but of a greater concern is that blooms have become yearly occurrences in western Lake
Erie over the last decade (Chaffin et al. 2008). The reoccurrence of Microcystis blooms,
presence of large algal mats of the cyanobacteria Lyngbya wollei (personal observation),
and discovery of the non-native cyanobacteria Cylindrospermopsis (Conroy et al. 2007)
suggest that Lake Erie may be moving towards a more eutrophic state.
Microcystis as a concern
Microcystis is able to completely exclude other phytoplankton via buoyancy
regulation under light-limiting conditions (Reynolds et al. 1987; Downing et al. 2001)
and allelopathic mechanisms (Sukenik et al. 2002), allowing it to reach a high density and
forming surface blooms. During a bloom, the aesthetic value of lakes is dramatically
reduced. These algal blooms wash ashore, resulting in foul-smelling rotting algal mats,
decreasing the quality of recreational boating and beaches. Microcystis is capable of

3
producing microcystin, a hepatotoxin that has raised many human health concerns world-
wide (Ouellette and Wilhelm 2003; Falconer 2007). Fish mortality can be high (Rodger
et al. 1994), and livestock can be poisoned, during cyanobacteria blooms (Falconer
2007). The microcystin concentration limit of 1 µg L-1
, established by the World Health
Organization, is often surpassed during blooms in western Lake Erie and may have an
impact on drinking water for millions of people (Brittian et al. 2000; Rinta-Kanto et al.
2005; Dyble et al. 2008).
Microcystis annual cycle
Microcystis is found in many eutrophic lakes world-wide (Visser et al. 2005).
During the winter and spring months, Microcystis cells overwinter on the surface of lake
sediments (Preston et al. 1980). Summer Microcystis blooms may be attributed to
benthic recruitment of colonies that re-inoculate the water column during the spring
(Verspagen et al. 2005). Microcystis remains photochemically active on sediments
throughout the year, but no difference in internal buoyancy was seen, suggesting that
passive processes (wind suspension, bioturbation) release colonies into the water column
(Verspagen et al. 2004). Increasing water clarity, which allows light to reach the
sediments, may also play a role in Microcystis recruitment (Reynolds and Bellinger
1992). Once in the water column, and water temperature exceeds 15 °C (Reynolds 1973),
Microcystis takes advantage of high nutrients (Steinberg and Hartmann1988; Downing et
al. 2001) and water column stability (Reynolds et al. 1984, Huisman et al. 2004) to form
scums on the surface of lakes. A wide range of maximum growths rates for Microcystis
has been reported, ranging from less than 0.17 (Ibelings et al. 1994), 0.50 divisions day-1
(Reynolds et al. 1984), 0.67 (Baldia et al. 2007), to 1.6 divisions day-1
(Nalewajko and

4
Murphy 2001). In the fall, cooler water temperatures prevent Microcystis from
metabolizing accumulated carbohydrate, preventing it from regaining positive buoyancy
(Thomas and Walsby 1986; Visser et al. 1995). The rate that Microcystis colonies settle
to the lake bottom is highest during and after blooms (Verspagen et al. 2005), where they
overwinter until the following summer (Preston et al. 1980).
The re-occurrence of Microcystis blooms were first documented in western Lake
Erie in 1995 (Brittain et al. 2000), and have been observed nearly every year since
(Vincent et al. 2004; Chaffin et al. 2008). The timing of these blooms varies greatly
among years; blooms may be first seen in early July or not until September (Chaffin et al.
2008). Chaffin et al. (2008) quantified the magnitude of the annual blooms in western
Lake Erie from 2002 to 2008 and found that the Microcystis biomass is highly correlated
with annual summer Maumee River discharge. It is suspected that the source of
Microcystis is the lake sediments (Rinta-Kanto et al. 2009) or that tributaries are loading
Microcystis into the lake (Conroy 2008). It has been observed that the spatial pattern of
Microcystis blooms in western Lake Erie is very similar to the suspended sediment plume
of the Maumee River (personal observation).
Environmental factors associated with a Microcystis bloom
Role of nutrients in Microcystis blooms
Nutrients, especially phosphorus, typically limit freshwater offshore productivity.
Traditionally, low total nitrogen (TN) to total phosphorus (TP) ratio is a predictor of
cyanobacteria (Smith 1983). However, high TP may be more sufficient in predicting
cyanobacteria blooms. Phosphate added experimentally to water from all three basins of

5
Lake Erie resulted in an increase of all types of phytoplankton, indicting phosphorus
limitation (Wilhelm et al. 2003). In nutrient-poor waters, Microcystis is generally out-
competed for P, due to higher P uptake kinetics of green algae and diatoms (Baldia et al.
2007; Tilman et al. 1986). Cyanobacteria have a TP threshold of 10 µg L-1
(Steinberg
and Hartmann 1988) and potential for bloom formation increases with increasing TP
(Downing et al. 2001). The likelihood of a bloom plateaus at about 80% when lake TP
reach 100 µg L-1
(Downing et al. 2001). Laboratory experiments show that Microcystis
growth increases linearly with TP and plateaus at 220 µg L-1
TP (Baldia et al. 2007).
Above this concentration, Microcystis accumulates enough P (Baldia et al. 2007) to
sustain a constant rate of cell growth for five (Tsukada et al 2006) to nine days
(Nalewajko and Murphy 2001).
Maumee Bay and western Lake Erie have very high phosphorus concentrations
compared to other regions of the Great Lakes. The Maumee River watershed is
predominantly agricultural, which results in a high amount of run-off that discharges a
large TP loading into western Lake Erie (Baker and Richards 2002). TP in Maumee Bay
and western Lake Erie often exceed 150 µg L-1
, and TP decreases with increasing
distance from the mouth of the Maumee River (Moorhead et al. 2008). Annual
phytoplankton biomass has increased in western Lake Erie, while total phosphorus loads
have remained constant over the past 15 years (Conroy et al. 2005b). This increase in
biomass could be a result of the soluble phosphorus fraction of the total load, which has
been increasing in recent years (Baker et al. 2008). Or it could be from alternative
phosphorus sources such as glyphosate (Ilikchyan et al. 2009), which is the active

6
ingredient in herbicides, or from internal phosphorus loading from benthic invertebrate
bioturbation (Chaffin and Kane 2009).
Non-nitrogen-fixing algae (diatoms, green algae) and cyanobacteria (Microcystis,
Oscillatoria) need inorganic nitrogen to thrive. Anabaena and Aphanizomenon are able
to fix atmospheric nitrogen. Supplies of nitrogen tend to be depleted quicker than
phosphorus at periods of high algal growth, which may result in nitrogen limitation (Kim
et al. 2007). Thus, under nitrogen-limiting conditions, nitrogen-fixing cyanobacteria will
have an advantage over Microcystis and other non-nitrogen fixers (Steinberg and
Hartmann 1988). Microcystis favors NH4 over NO3 as an N source, and it would be out-
competed for N at high NO3 concentrations (Kim et al. 2007). Differences in NH4 and
NO3 were observed in Steilacoom Lake, Washington, between years of Microcystis
bloom and non-bloom years (Jacoby et al. 2000). During the bloom year, NO3 was very
low (< 20 µg L-1
) and very high in the non-bloom year (> 100µg L-1
) (Jacoby et al. 2000).
Sufficient NH4 when NO3 is depleted would allow Microcystis to persist (Jacoby et al.
2000). Unlike P, Microcystis is unable to store N to maintain a constant growth rate
(Baldia et al. 2007).
During the 1960s and 1970s, cyanobacteria blooms consisted of mostly Anabaena
and Aphanizomenon, species able to fix atmospheric nitrogen. The GLWQA, which
targeted phosphorus, was not passed until 1972. The nutrient load from the Maumee
River would have had a lower TN:TP before the agreement as compared to after its
passage. Rapid algal growth would have been stimulated by high TP that then would
have depleted available nitrogen, favoring the nitrogen fixers. The current Microcystis
blooms suggest that the current ratio of TN to TP loading would be greater than ratios

7
that lead to blooms of nitrogen-fixing species. Large blooms of Microcystis could give
away to nitrogen-fixing species once nitrogen becomes limiting.
Role of turbidity and mixing in Microcystis blooms
Light may become limiting to algae in highly turbid waters. Light is attenuated
exponentially with water depth and attenuation is greater in turbid or highly productive
waters (Kirk 1994). The photic zone is the area of the water column that is illuminated
by > 1% of surface light intensity. The depth of 1% light marks the approximate lower
margin of the photic zone depth and is also commonly referred to as the compensation
point between algal photosynthesis and respiration (Wetzel 2001). In clear and/or
shallow waters where 1% of surface light is able to reach the lake bottom, phytoplankton
and benthic algal growth is stimulated (Lowe and Pillsbury 1995). Further, light does not
need to reach the lake bottom to achieve net phytoplankton photosynthesis because
vertical mixing of the water column will continually mix phytoplankton in and out of the
photic zone. However, light limitation may occur in highly turbid waters generated from
river sediment plumes and/or resuspension of lake sediments. In general, light is
considered limiting when the photic zone is less than 16% of the mixing depth (Alpine
and Cloern 1988). However, the compensation point is species specific and the depth at
which it occurs is called the „critical depth‟ for each species (Huisman et al. 1999a,b,c).
Phytoplankton that remain below their critical depth will experience losses (Huisman et
al. 1999b,c; 2002). Phytoplankton are dependent on either vertical mixing or buoyancy
regulation if the critical depth exceeds the lake depth (Huisman et al. 1999b,c; 2002;
2004).

8
Cyanobacteria are able to regulate buoyancy via colony size (Brooks et al. 2003),
regulation of gas vacuole synthesis, turgor pressure applied to gas vacuoles, and the
accumulation of carbohydrate (Reynolds et al 1987; Konpka et al. 1987; Kromkamp and
Walsby 1990). In weakly mixed waters, Microcystis (and other buoyant phytoplankton)
are able to escape vertical mixing once their upwards migration rate exceeds the turbulent
diffusion rate (Huisman et al. 1999c, 2004). On the other hand, in strongly mixed waters,
the turbulent diffusion rate exceeds Microcystis‟ upward migration rate, thus keeping
Microcystis and other phytoplankton entrained in mixing (Huisman et al. 1999c, 2002,
2004). This usually occurs once wind speeds above the water‟s surface exceed 3 m s-1
(Webster and Hutchinson 1994; Visser et al. 2005). The rate of turbulent diffusion that is
equal to the rate of Microcystis migration is termed „critical turbulence‟ (Huisman et al.
1999a). If vertical mixing is less than the critical turbulence, Microcystis will float
towards the surface accessing light needed for photosynthesis. If weak mixing continues,
Microcystis will increase in biomass, developing surface scums that are capable of
absorbing 90% of surface light after 1 cm (Ibelings 1996), which in turn further shades
sinking species (Huisman et al. 2004). Microcystis surface scums can be very dynamic
throughout the day. This gives Microcystis an ecological advantage over sinking species
and is the reason why it is believed that warmer summers with less violent storms will
result in more cyanobacteria blooms (Jöhnk et al. 2008; Paerl and Huisman 2008).
Colonies may become negatively buoyant and descend after accumulating enough
carbohydrate, while accessing nutrients at deeper depths (Kromkamp and Walsby 1990;
Visser et al. 1997). Descending colonies will regain positive buoyancy at deeper depth

9
once accumulated carbohydrate is respired (Kromkamp and Walsby 1990; Visser et al.
1997).
Turbidity may play a role in promoting Microcystis blooms in western Lake Erie.
The main source of turbidity into western Lake Erie is the Maumee River (Richards et al.
2008). Turbidity is usually highest in the bay (secchi depths > 30 cm) and water clarity
increases with distance into the lake (Moorhead et al. 2008). The depth and turbidity
gradients into the lake may favor buoyant Microcystis in the competition for light in
waters that are still highly turbid but where depth has increased. In computer simulations
Huisman et al. (1999c) found that background turbidity (i.e. suspended sediments) did
not change the competitive outcome between buoyant and sinking phytoplankton.
However, if the water column is weakly mixed, background turbidity is high, and depth is
great enough so that light does not reach the lake bottom, heavily dense phytoplankton
will sink out of the photic zone, and thus fail to grow (Huisman et al. 2002). These
conditions would favor a buoyant phytoplankton species such as Microcystis. Further,
suspended sediments may play a key role in fostering algal growth by reducing high light
stress.
Role of Dreissena mussels in Microcystis blooms
Many recent studies have attributed cyanobacteria dominance to exotic dreissenid
mussels. In Saginaw Bay (Lake Huron), total phytoplankton was directly proportional to
TP and inversely proportional to dreissenid density, but cyanobacteria is directly
proportional to both TP and dreissenid density (Bierman et al. 2005). Raikow et al.
(2004) found a positive influence of Dreissena on Microcystis in lakes with < 25 µg L-1
TP, but no influence in lakes with > 25 µg L-1
TP. The reoccurrence of cyanobacteria

10
blooms in western Lake Erie was correlated with the arrival of dreissenid mussels in the
1990s. Dreissenids decreased the resilience and resistance of Lake Erie (Conroy and
Culver 2005) and favor dominance of nitrogen-fixing cyanobacteria by excreting at low
nitrogen to phosphorus ratios (Arnott and Vanni 1996; Conroy et al. 2005a), slowing
sediment uptake of phosphorus (Bykova et al. 2006), and selective rejection of toxic
species (Vanderploeg et al 2001). In western Lake Erie, however, Microcystis bloom
intensity is highly variable among years (Chaffin et al. 2008). It is likely that dreissenid
population fluctuations alone cannot explain the high variability of Microcystis bloom
intensity among years.
Goals of this thesis
The goal of this research is to gain a better understanding of the environmental
factors that promote Microcystis growth in western Lake Erie. Observations of
Microcystis blooms in western Lake Erie over the past decade lead to the general
hypothesis that the Maumee River has a large influence on bloom formation because the
spatial pattern of the blooms correlates with the pattern of the sediment plume generated
by the river. The Maumee River loads a high amount of nutrients into the lake that may
fertilize Microcystis blooms and suspended sediments that might reduce light stress
and/or reduce light to limiting levels in deeper waters of the lake. Calm light-limiting
waters would favor buoyant phytoplankton. Therefore, the general hypothesis of this
research is that Microcystis growth is greatest in the sediment plume of the nearshore
waters because of the high concentration of nutrients and suspended sediments. If, as
hypothesized, high nutrient and low-light conditions in river plumes are important in the

11
role of Microcystis blooms, the results of this research can help to inform efforts in
preventing or lessening the intensity of blooms. Results of this study can inform those
who develop recommendations to suppress sediment loading into the lake and shift
timing of shipping channel dredging, therefore increasing water clarity. Because
phosphorus is mostly bound to sediments, reducing sediments would also reduce the
amount of nutrients entering the lake. Results of this study can also be applied by
managers of other areas of the Great Lakes with frequent cyanobacteria blooms generated
from favorable conditions from river discharge, i.e. Saginaw River of Lake Huron and
Sandusky River of Lake Erie.
Overview of subsequent chapters in this thesis
Chapter 2. An Eco-physiological trade-off of Microcystis: Buoyancy results in
photosynthetic damage.
Surface scums allow Microcystis to exclude sinking phytoplankton. However,
these scums are exposed to high light intensities that can be damaging to photosynthesis.
This chapter presents data that suggests that these surface scums are highly damaged by
sunlight, but have the advantage of excluding other phytoplankton through shading.
In this chapter, chlorophyll fluorescence measurements were used to determine
algal photosynthetic efficiency. Photosynthesis is an important part of algal metabolism
that leads to carbon fixation and growth, and chlorophyll fluorescence is used to monitor
net photosynthesis. A brief review of chlorophyll fluorescence is needed to acquaint
unfamiliar readers to these measurements. Photosynthesis is greatly affected by light
intensity and changes in photosynthetic efficiency will be reflected by changes in

12
chlorophyll fluorescence, which is easily measureable (Schreiber et al. 1994). Photons
absorbed by chlorophyll have one of three fates. The majority of energy absorbed is used
to drive photochemistry (photochemical quenching, PQ) or dissipated as heat (non-
photochemical quenching, NPQ). Chlorophyll fluorescence is the small fraction of
energy absorbed that is then re-emitted as light, and analysis of chlorophyll fluorescence
can used to determine the state of photosynthesis physiology. For example, decreasing
efficiency of electron transport, most notably photosystem II (PSII), results in a decrease
of Fv/Fm ((Fm-Fo)/Fm; where Fm is the maximum fluorescence after a saturating light
pulse, and Fo is basal fluorescence before the saturating light pulse; Schreiber et al.
1994). PSII is often the weak link of photosynthetic electron transport, as it is most
vulnerable to light-induced damage, i.e. photoinhibition (Maxwell and Johnson 2000).
PSII absorbs light energy, causing the donation of an electron to QA. PSII does not
accept another photon until it passes one electron onto the subsequent electron acceptors
of the electron transport chain (Maxwell and Johnson 2000). During this time, the
reaction centers are „closed,‟ and a greater percentage of closed reaction centers results in
decreased photosynthetic efficiency and an increase in PSII fluorescence (Maxwell and
Johnson 2000). Two measurements of chlorophyll fluorescence were used to determine
PSII efficiency. Quantum yield of PSII electron transport (Φet) is a measure of the
relative rate of electron transport of PSII, which is dependent on (1) the photosynthetic
efficiency of open PSII reaction centers of light adapted samples to capture light energy
and utilize it to drive photochemical reactions, and (2) the relative efficiency with which
post PSII electron transfer keeps PSII open (Genty et al. 1989). Φet decreases with an
increased proportion of closed PSII reaction centers (Genty et al. 1989) and Φet decreases

13
with increasing light intensity (Schreiber et al. 1994; Maxwell and Johnson 2000).
Electron transport correlates well with carbon fixation at a given light intensity (Genty et
al. 1989). Decreases in Φet indicate damage to, or protective down-regulation of electron
transport (Krause 1988). Pre-adapting samples to dark conditions allows all reaction
centers to open and the ratio of variable-to-maximum chlorophyll fluorescence (Fv/Fm)
can be determined, which measures maximum PSII efficiency (or capacity) (Schreiber et
al. 1994; Maxwell and Johnson 2000). Decreases in Fv/Fm indicate damage to PSII. In
healthy higher plants and green algae, Fv/Fm typically ranges from 0.80 to 0.83 and less
than 0.60 for other phytoplankton (Schreiber et al. 1994; Büchel and Wilhelm 1993),
however 0.40 to 0.50 are typical values for phytoplankton collected from a lake
(Marwood et al. 2000).
Chapter 3. Measurements of Microcystis cellular health in western Lake Erie
during the 2008 bloom indicate the high turbidity and nutrients support rapid
growth.
Microcystis is most abundant in waters adjacent to the Maumee Bay. These
waters are high in nutrients and maybe become light-limited. Also, Microcystis from
these waters have higher cellular health than in the offshore.
Chapter 4. Conclusion.
This summarizes the work of chapters two and three and offers recommendations
to mitigate the intensity of the Microcystis blooms in western Lake Erie.
Chapter 5. Detailed Methods and Supplemental Data.
This chapter contains detailed descriptions of methodology that are more briefly
summarized in chapters two and three. This chapter also describes trials and experiments

14
for determining algal pigment concentrations, including phycocyanin and chlorophyll a,
and pigment results form western Lake Erie. Also, complete methods for the laboratory
experiment and protein extractions are presented. Macro and micronutrients
concentrations of Microcystis are given here.
Literature Cited
Alpine, A. E., and J. E. Cloern. 1988. Phytoplankton growth-rates in a light-limited
environment, San Francisco bay. Marine Ecology-Progress Series 44: 167-173.
Arnott, D.L., and Vanni, M.J. 1996. Nitrogen and phosphorus recycling by the zebra
mussel (Dreissena polymorpha) in the western basin of Lake Erie. Canadian
Journal of Fisheries and Aquatic Sciences 53(3): 646-659.
Baker, D.B., Crumrine, J.P., Richards, R.P., and Kramer, J.W. 2008. Increasing trends in
dissolved phosphorus loading to Lake Erie from Northwestern Ohio watersheds.
In Declining water quality in the western Lake Erie basin: Increasing invasion of
blue-green algae (Cyanobacteria), and increasing levels of soluble reactive
phosphorus. Ohio Journal of Science. 108: A-9.
Baker, D.B., and Richards, R.P. 2002. Phosphorus budgets and riverine phosphorus
export in northwestern Ohio watersheds. Journal of Environmental Quality 31(1):
96-108.

15
Baldia, S.F., Evangelista, A.D., Aralar, E.V., and Santiago, A.E. 2007. Nitrogen and
phosphorus utilization in the cyanobacterium Microcystis aeruginosa isolated
from Laguna de Bay, Philippines. Journal of Applied Ecology. 19(6): 607-613.
Bierman, V.J., Kaur, J., DePinto, J.V., Feist, T.J., and Dilks, D.W. 2005. Modeling the
role of zebra mussels in the proliferation of blue-green algae in Saginaw Bay,
Lake Huron. Journal of Great Lakes Research 31(1): 32-55.
Britt. N. W. 1955. Stratification in Western Lake Erie in Summer of 1953: Effects on the
Hexagenia (Ephemeroptera) Population. Ecology 36: 239-244.
Brittain, S.M., Wang, J., Babcock-Jackson, L., Carmichael, W.W., Rinehart, K.L., and
Culver, D.A. 2000. Isolation and characterization of microcystins, cyclic
heptapeptide hepatotoxins from a Lake Erie strain of Microcystis aeruginosa.
Journal of Great Lakes Research 26(3): 241-249.
Brookes, J.D., Regel, R.H., and Ganf, G.G. 2003. Changes in the photo-chemistry of
Microcystis aeruginosa in response to light and mixing. New Phytologist 158(1):
151-164.
Büchel, C., and Wilhelm, C. 1993. In-vivo analysis of slow chlorophyll fluorescence
induction kinetics in algae - progress, problems and perspectives. Photochemistry
and Photobiology 58: 137-148.

16
Bykova, O., Laursen, A., Bostan, V., Bautista, J., and McCarthy, L. 2006. Do zebra
mussels (Dreissena polymorpha) alter lake water chemistry in a way that favours
Microcystis growth? Science of the Total Environment 371(1-3): 362-372.
Chaffin, J. D., Bridgeman, T. B. and Filbrun, J. F. 2008. Quantification of Microcystis sp.
blooms in western Lake Erie (2002-2007) and relation to tributary flow.
Conference presentation. International Association of Great Lakes Research.
Petersburg Ontario, Canada.
Chaffin J. D. and D. D. Kane 2009. Burrowing mayfly (Hexagenia spp.) bioturbation and
bioirrigation: A neglected source of internal phosphorus loads to lakes. Journal of
Great Lakes Research. In revision
Conroy, J. D. 2008. Testing the algal loading hypothesis: the importance of Sandusky
River phytoplankton inputs to offshore Lake Erie processes. PhD. Thesis. The
Ohio State University.
Conroy, J.D., and Culver, D.A. 2005. Do dreissenid mussels affect Lake Erie ecosystem
stability processes? American Midland Naturalist. 153: 20-32.
Conroy, J.D., Edwards, W.J., Pontius, R.A., Kane, D.D., Zhang, H.Y., Shea, J.F., Richey,
J.N., and Culver, D.A. 2005a. Soluble nitrogen and phosphorus excretion of
exotic freshwater mussels (Dreissena spp.): potential impacts for nutrient
remineralisation in western Lake Erie. Freshwater Biology 50(7): 1146-1162.

17
Conroy, J.D., Kane, D.D., Dolan, D.M., Edwards, W.J., Charlton, M.N., and Culver,
D.A. 2005b. Temporal trends in Lake Erie plankton biomass: Roles of external
phosphorus loading and dreissenid mussels. Journal of Great Lakes Research 31:
89-110.
Conroy, J.D., Quinlan, E.L., Kane, D.D., and Culver, D.A. 2007. Cylindrospermopsis in
Lake Erie: Testing its association with other cyanobacterial genera and major
linmological parameters. Journal of Great Lakes Research 33(3): 519-535.
Depinto, J.V., Young, T.C., and McIlroy, L.M. 1986. Great-lakes water-quality
improvement - The strategy of phosphorus discharge control is evaluated.
Environmental Science & Technology 20(8): 752-759.
Downing, J.A., Watson, S.B., and McCauley, E. 2001. Predicting Cyanobacteria
dominance in lakes. Canadian Journal of Fisheries and Aquatic Sciences 58(10):
1905-1908.
Dyble, J., Fahnenstiel, G.L., Litaker, R.W., Millie, D.F., and Tester, P.A. 2008.
Microcystin concentrations and genetic diversity of Microcystis in the lower Great
Lakes. Environmental Toxicology 23(4): 507-516.
Falconer, I.R. 2007. Cyanobacterial toxins present in Microcystis aeruginosa extracts -
More than microcystins! Toxicon 50(4): 585-588.

18
Genty, B., Briantais, J.M., and Baker, N.R. 1989. The relationship between the quantum
yield of photosynthetic electron-transport and quenching of chlorophyll
fluorescence. Biochimica Et Biophysica Acta 990(1): 87-92.
Huisman, J., Arrayas, M., Ebert, U., and Sommeijer, B. 2002. How do sinking
Phytoplankton species manage to persist? American Naturalist 159(3): 245-254.
Huisman, J., Jonker, R.R., Zonneveld, C., and Weissing, F.J. 1999a. Competition for light
between phytoplankton species: Experimental tests of mechanistic theory.
Ecology 80(1): 211-222.
Huisman, J., Sharples, J., Stroom, J.M., Visser, P.M., Kardinaal, W.E.A., Verspagen,
J.M.H., and Sommeijer, B. 2004. Changes in turbulent mixing shift competition
for light between phytoplankton species. Ecology 85(11): 2960-2970.
Huisman, J., van Oostveen, P., and Weissing, F.J. 1999b. Critical depth and critical
turbulence: Two different mechanisms for the development of phytoplankton
blooms. Limnology and Oceanography 44(7): 1781-1787.
Huisman, J., van Oostveen, P., and Weissing, F.J. 1999c. Species dynamics in
phytoplankton blooms: Incomplete mixing and competition for light. American
Naturalist 154(1): 46-68.
Ibelings, B.W. 1996. Changes in photosynthesis in response to combined irradiance and
temperature stress in cyanobacterial surface waterblooms. Journal of Phycology
32(4): 549-557.

19
Ilikchyan, I.N., McKay, R.M.L., Zehr, J.P., Dyhrman, S.T., and Bullerjahn, G.S. 2009.
Detection and expression of the phosphonate transporter gene phnD in marine and
freshwater picocyanobacteria. Environmental Microbiology 11(5): 1314-1324.
Jacoby, J.M., Collier, D.C., Welch, E.B., Hardy, F.J., and Crayton, M. 2000.
Environmental factors associated with a toxic bloom of Microcystis aeruginosa.
Canadian Journal of Fisheries and Aquatic Sciences 57(1): 231-240.
Jöhnk, K.D., Huisman, J., Sharples, J., Sommeijer, B., Visser, P.M., and Stroom, J.M.
2008. Summer heatwaves promote blooms of harmful cyanobacteria. Global
Change Biology 14(3): 495-512.
Kim, H.S., Hwang, S.J., Shin, J.K., An, K.G., and Yoon, C.G. 2007. Effects of limiting
nutrients and N : P ratios on the phytoplankton growth in a shallow hypertrophic
reservoir. Hydrobiologia 581: 255-267.
Kirk, J. T. O. 1994. Light and photosynthesis in aquatic ecosystems: second edition.
Cambridge University Press.
Konopka, A., Kromkamp, J., and Mur, L.R. 1987. Regulation of gas vesicle content and
buoyancy in light-limited or phosphate-limited cultures of Aphanizomenon flos-
aquae (cyanophyta). Journal of Phycology 23(1): 70-78.
Kromkamp, J., and Walsby, A.E. 1990. A computer-model of buoyancy and vertical
migration in cyanobacteria. Journal of Plankton Research 12(1): 161-183.

20
Lowe, R.L., and Pillsbury, R.W. 1995. Shifts in benthic algal community structure and
function following the appearance of zebra mussels (Dreissena polymorpha) in
Saginaw Bay, Lake Huron. Journal of Great Lakes Research 21(4): 558-566.
Makarewicz, J.C. 1993. Phytoplankton biomass and species composition in Lake Erie,
1970 to 1987. Journal of Great Lakes Research 19(2): 258-274.
Marwood, C.A., Smith, R.E.H., Furgal, J.A., Charlton, M.N., Solomon, K.R., and
Greenberg, B.M. 2000. Photoinhibition of natural phytoplankton assemblages in
Lake Erie exposed to solar ultraviolet radiation. Canadian Journal of Fisheries and
Aquatic Sciences 57(2): 371-379.
Matisoff, G., and Ciborowski, J.J.H. 2005. Lake Erie trophic status collaborative study.
Journal of Great Lakes Research 31: 1-10.
Maxwell, K., and Johnson, G.N. 2000. Chlorophyll fluorescence - a practical guide.
Journal of Experimental Botany 51(345): 659-668.
Moorhead, D., T. B. Bridgeman, and J. Morris. 2008. Changes in water quality of
Maumee Bay 1928 – 2003. In: Checking the pulse of Lake Erie. Editors
Munawar, M and Heath, R. Goodword Books.
Nalewajko, C. and T. P. Murphy. 2001. Effects of temperature, and availability of
nitrogen and phosphorus on the abundance of Anabaena and Microcystis in Lake
Biwa, Japan: an experimental approach. Limnology 2:45-48.

21
Ouellette, A.J.A., and Wilhelm, S.W. 2003. Toxic cyanobacteria: the evolving molecular
toolbox. Frontiers in Ecology and the Environment 1(7): 359-366.
Paerl, H.W., and Huisman, J. 2008. Climate - Blooms like it hot. Science 320(5872): 57-
58.
Preston, T., Stewart, W.D.P., and Reynolds, C.S. 1980. Bloom-forming cyanobacterium
Microcystis aeruginosa overwinters on sediment surface. Nature 288(5789): 365-
367.
Raikow, D.F., Sarnelle, O., Wilson, A.E., and Hamilton, S.K. 2004. Dominance of the
noxious cyanobacterium Microcystis aeruginosa in low-nutrient lakes is
associated with exotic zebra mussels. Limnology and Oceanography 49(2): 482-
487.
Reynolds, C.S., and Bellinger, E.G. 1992. Patterns of abundance and dominance of the
phytoplankton of Rostherne Mere, England - evidence from an 18-year data set.
Aquatic Sciences 54(1): 10-36.
Reynolds, C.S., Oliver, R.L., and Walsby, A.E. 1987. Cyanobacterial dominance - The
role of buoyancy regulation in dynamic lake environments. New Zealand Journal
of Marine and Freshwater Research 21(3): 379-390.
Reynolds, C.S., Wiseman, S.W., and Clarke, M.J.O. 1984. Growth-rate and loss-rate
responses of phytoplankton to intermittent artificial mixing and their potential

22
application to the control of planktonic algal biomass. Journal of Applied Ecology
21(1): 11-39.
Richards, R.P., Baker, D.B., Crumirine, J.P., Kramer, J.W., Ewing, D.E., and Merryfield,
B.J. 2008. Thirty-year trends in suspended sediment in seven Lake Erie
tributaries. Journal of Environmental Quality 37(5): 1894-1908.
Rinta-Kanto, J.M., Ouellette, A.J.A., Boyer, G.L., Twiss, M.R., Bridgeman, T.B., and
Wilhelm, S.W. 2005. Quantification of toxic Microcystis spp. during the 2003 and
2004 blooms in western Lake Erie using quantitative real-time PCR.
Environmental Science & Technology 39(11): 4198-4205.
Smith, V.H. 1983. Low nitrogen to phosphorus ratios favor dominance by blue-green-
algae in lake phytoplankton. Science 221(4611): 669-671.
Steinberg, C.E.W., and Hartmann, H.M. 1988. Planktonic bloom-forming cyanobacteria
and the eutrophication of lakes and rivers. Freshwater Biology 20(2): 279-287.
Sukenik, A., Eshkol, R., Livne, A., Hadas, O., Rom, M., Tchernov, D., Vardi, A., and
Kaplan, A. 2002. Inhibition of growth and photosynthesis of the dinoflagellate
Peridinium gatunense by Microcystis sp (cyanobacteria): A novel allelopathic
mechanism. Limnology and Oceanography 47(6): 1656-1663.
Thomas, R.H., and Walsby, A.E. 1986. The effect of temperature on recovery of
buoyancy by Microcystis. Journal of General Microbiology 132: 1665-1672.

23
Tilman, D., Kiesling, R., Sterner, R., Kilham, S.S., and Johnson, F.A. 1986. Green,
bluegreen and diatom algae - Taxonomic differences in competitive ability for
phosphorus, silicon and nitrogen. Archiv Fur Hydrobiologie 106(4): 473-485.
Tsukada, H., Tsujimura, S., and Nakahara, H. 2006. Effect of nutrient availability on the
C, N, and P elemental ratios in the cyanobacterium Microcystis aeruginosa.
Limnology 7(3): 185-192.
Verspagen, J.M.H., Snelder, E., Visser, P.M., Huisman, J., Mur, L.R., and Ibelings, B.W.
2004. Recruitment of benthic Microcystis (Cyanophyceae) to the water column:
Internal buoyancy changes or resuspension? Journal of Phycology 40(2): 260-270.
Verspagen, J.M.H., Snelder, E., Visser, P.M., Johnk, K.D., Ibelings, B.W., Mur, L.R.,
and Huisman, J. 2005. Benthic-pelagic coupling in the population dynamics of the
harmful cyanobacterium Microcystis. Freshwater Biology 50(5): 854-867.
Vincent, R.K., Qin, X.M., McKay, R.M.L., Miner, J., Czajkowski, K., Savino, J., and
Bridgeman, T. 2004. Phycocyanin detection from LANDSAT TM data for
mapping cyanobacterial blooms in Lake Erie. Remote Sensing of Environment
89(3): 381-392.
Visser, P. M., Ibelings, B. W., Mur, L. R., and Walsby, A. E. 2005. Ecophysiology of
Microcystis. In Harmful Cyanobacteria. Editors Huisman, J., Matthijs, H. C. P.,
and Visser, P. M. Springer Press. Netherlands

24
Visser, P.M., Ibelings, B.W., and Mur, L.R. 1995. Autumnal sedimentation of
Microcystis spp as result of an increase in carbohydrate ballast at reduced
temperature. Journal of Plankton Research 17(5): 919-933.
Visser, P.M., Passarge, J., and Mur, L.R. 1997. Modelling vertical migration of the
cyanobacterium Microcystis. Hydrobiologia. 349: 99-109.
Webster, I.T., and Hutchinson, P.A. 1994. Effect of wind on the distribution of
phytoplankton cells in lakes revisited. Limnology and Oceanography 39(2): 365-
373.
Wetzel R. G. 2001. Limnology Lake and River Ecosystems: Third Edition. Academic
Press. San Diego, California, USA.
Wilhelm, S.W., DeBruyn, J.M., Gillor, O., Twiss, M.R., Livingston, K., Bourbonniere,
R.A., Pickell, L.D., Trick, C.G., Dean, A.L., and McKay, R.M.L. 2003. Effect of
phosphorus amendments on present day plankton communities in pelagic Lake
Erie. Aquatic Microbial Ecology 32(3): 275-285.

25
Chapter Two.
An Eco-physiological trade-off of Microcystis: Buoyancy results in photosynthetic
damage.
Abstract
Microcystis is generally predicted to have an ecological advantage over sinking
phytoplankton in calm turbid waters because buoyancy regulation allows access to more
light and surface scums further shade non-buoyant phytoplankton. However, exposure to
full sunlight may have negative effects on Microcystis physiology, particularly
photosynthesis. Field sampling of the 2008 bloom in western Lake Erie and laboratory
experiments were used to study the photosynthetic status of Microcystis in relation to
turbidity, vertical mixing, and nutrients. Photosynthetic efficiency (quantum yield of
photosystem II electron transport) (Φet) of Microcystis from the lake was measured
throughout the summer. Φet was greatest under vertical mixing conditions and lower in
calm waters. Under both mixing and calm conditions, Φet increased with turbidity at all
depths. Light-response curves revealed that strong vertical mixing combined with high
turbidity offered Microcystis more protection from photosynthetic damage than did high
turbidity alone. Because turbidity often co-varies with nutrients in Lake Erie, laboratory
experiments were used to separate the effects of turbidity and nutrients (P, N). Φet was
highest in the mixed turbid treatment and lowest in the calm clear treatment. A range of
nutrient concentrations typical of western Lake Erie did not affect Φet. Thus, an eco-
26
physiological trade-off exists between being highly competitive for light and decreased
photosynthetic efficiency in calm turbid waters.
Introduction
Dense Microcystis blooms are an annual occurrence in western Lake Erie
(Chaffin et al. 2008). Western Lake Erie is generally highly turbid and nutrient-rich
because of suspended sediment and nutrient loading from the Maumee River (Richards et
al. 2008; Baker and Richards 2002). Sediment resuspension from the lake bottom is also
a likely source of turbidity and nutrients because of the shallowness (Søndergaard et al.
2003). Microcystis blooms appear to originate in the sediment plume, which suggests
that conditions in the turbidity support rapid growth. The effect of high nutrients on the
development of Microcystis blooms has been studied in depth, however the effect that the
sediments have on Microcystis photosynthesis has been neglected. This study uses an
eco-physiological approach to study how Microcystis photosynthetic efficiency is
affected by turbidity.
High turbidity may cause light limitation in phytoplankton due to the rapid
attenuation of light by suspended particles (Alpine and Cloern 1988); however, very
shallow bays may not be light limited despite the high turbidity (Conroy 2008). If water
depth increases while high turbidity is maintained, this may bring about light limitation as
algal cells spend an increasing proportion of the time at low light levels. These conditions
would favor buoyant species that can remain in the photic zone, such as the highly-
buoyant cyanobacterium Microcystis. Cyanobacteria are able to regulate their buoyancy
via colony size (Brookes et al. 2003), gas vacuole synthesis, turgor pressure, and
27
accumulation/ depletion of carbohydrate produced by photosynthesis (Reynolds et al.
1987; Konpka et al. 1987; Kromkamp and Walsby 1990). Microcystis will accumulate
carbohydrate while in the light near the surface, then become negatively buoyant and sink
(Kromkamp and Walsby 1990; Visser et al. 1997). In deeper darker depths, Microcystis
will respire accumulated carbohydrate becoming less dense, and float up towards the
surface (Kromkamp and Walsby 1990; Visser et al. 1997). Thus, in light-limited waters,
buoyancy gives Microcystis an advantage in the competition for light.
Water column mixing plays a large role in determining the outcome of the
competition for light among buoyant and sinking phytoplankton (Huisman et al 1999b;
2004). Buoyancy only allows Microcystis to gain an advantage in relatively stable water
columns. Microcystis will be able to migrate towards the surface if the turbulent mixing
of the water column is less than the upward migration rate of Microcystis (Huisman et al.
1999a). Dense surface blooms absorb a high amount of light (Ibelings 1996) that will
further decrease light intensities for sinking phytoplankton (Huisman et al. 2004).
Sinking phytoplankton species depend on vertical mixing of the water column for access
to light in light-limited waters (Huisman et al. 2002). Wind speeds of greater than 3 m s-1
are needed to break up surface blooms (Webster and Hutchinson 1994; Visser et al. 2005)
and would also circulate sinking phytoplankton species up into the photic zone, thus
negating the advantage of buoyancy regulating species (Huisman et al. 2002, 2004). After
mixing, Microcystis is able to return to the surface.
Positive buoyancy of Microcystis near the surface, however, may result in
exposure to very high light intensities that can be damaging to photosynthetic machinery.
High light is a stressor to many photosynthetic organisms. Phytoplankton, in general, are
28
low-light adapted. Microcystis, on the other hand, is relatively high-light adapted
compared to other phytoplankton. Microcystis has a high light-saturation point (Ik), and
wide ranges of Ik have been reported for this species [135-323 (Ganf 1975); 253 82
(Köhler 1992); 357- 487 µmol m-2
s-1
(Wu and Song 2008)]. Diatoms and green algae
normally have an Ik of less than 100 µmol m-2
s-1
(Kirk 1994). Further, Microcystis has a
relatively high amount of photo-protective carotenoids ,which are involved in non-
photochemical quenching, compared to green algae and diatoms (Paerl et al. 1983;
Ibelings et al. 1994). Microcystis also increases production of superoxide dismutase
(SOD) enzymes when grown under higher-intensity light (Canini et al. 2001).
Carotenoids and SOD aid in protection from photooxidation by absorbing free radicals
and oxide anions (Gotz et al. 1999; Scandalios 1993), which are produced by
photosynthesis in high intensity light (Hopkins 1999). Despite these adaptations,
Microcystis photosynthesis physiology may be damaged at the surface of calm waters
where it is exposed to the extremely high light intensity of full sunlight, which exceeds
2000 µmol m-2
s-1
.
Light is exponentially attenuated with depth in lakes and greater turbidity
increases the rate of attenuation (Kirk 1994). Photosynthetic efficiency, measured here as
the quantum yield of photosystem II (PSII) electron transport (Φet), generally increases
with decreasing light intensity (Schreiber et al. 1994). Φet is proportional to carbon
fixation at a given light level (Genty et al. 1989), and decreases in Φet indicate either
damage to PSII or post PSII electron transport, or photo-protective down-regulation of
electron transport (Krause 1988). Thus, phytoplankton cells at lower light intensities
have greater efficiency than those in higher light. High turbidity, due to a high

29
concentration of suspended sediments that absorb and reflect light, may mitigate high-
light stress in algae. Phytoplankton in Lake Erie‟s western basin had a greater
photosynthetic efficiency than the central and eastern basins because of higher turbidity
in the west (Marwood et al. 2000). River-generated sediment plumes increased Lake
Michigan phytoplankton primary production (Johengen et al. 2008). Others studies have
shown that mixing provides phytoplankton relief from high-light intensities by circulating
phytoplankton vertically, thereby lowing the average light exposure (Brookes et al. 2003;
Ibelings et al. 1994). However, the interaction between turbidity and mixing at various
depths of the water column is poorly understood.
In addition to affecting the photosynthetic efficiency of phytoplankton, turbidity
may also influence the production of photosynthetic pigments and proteins. Low light
induces an increase of phycobilins in cyanobacteria relative to chlorophyll a (Raps et al
1985; Post 1986) and increases the number of photosynthetic units per cell (Raps et al.
1983). Excess light reduces total chlorophyll (Post 1986; Ibelings et al. 1994) and
phycobilins (Post 1986; Bhandari and Sharma 2006) and increases protective carotenoids
(Paerl et al. 1983; Bhandari and Sharma 2006). Light also affects the amount of ribulose-
1,5-bisphosphate carboxylase/oxygenase (rubisco). Rubisco is the enzyme that catalyzes
the carboxylation of ribulose-1,5-bisphosphate with carbon dioxide during the first step
of the Calvin cycle. Rubisco is highly abundant in photosynthetic cells and its activity
decreases at low light (Hopkins 1999).
Another widely used measurement of general cellular stress is level of heat shock
proteins (Hsps). Hsps are ubiquitous in both prokaryotes and eukaryotes and function as
chaperones to protect proteins from unfolding or from forming an improper conformation
30
or facilitate repair of degradation of damaged proteins (Schlesinger 1990). Certain small
Hsps (15-30 kDa; sHsps) are associated with the chloroplasts of higher plants and algae
(Kloppstech et al. 1985; Preczewski et al. 2000; Heckathorn et al. 2002), and also
associate with phycobiliproteins of cyanobacteria (Nakamoto and Honma 2006).
Production of sHsps is increased in response to stress to protect PSII and light harvesting
structures (Preczewski et al. 2000; Heckathorn et al. 2002; Nakamoto and Honma 2006).
The combination of being highly competitive for light and reduced light stress in
highly turbid waters may explain why Microcystis is able to reach high biomasses in
western Lake Erie and other highly turbid lakes. I hypothesized that Microcystis will
experience less light stress in turbid waters. Therefore, I expected that the photosynthetic
efficiency of phytoplankton will increase with depth and turbidity because of the
decreased light intensities, and that strong mixing of the water may provide surface
phytoplankton protection from the high-light intensities by reducing the length of time
exposed to the high-light intensity of the sun. A laboratory experiment was performed to
isolate effects that often covary in lakes; i.e. turbidity and nutrient concentration.
Additionally, I hypothesized that Microcystis collected from western Lake Erie in turbid
waters will be able to adjust photosynthetic pigment and protein content, thus,
chlorophyll a and phycocyanin content will be greater while carotenoids and rubsico will
be less in turbid water than Microcystis in clear water. Further, I hypothesize that sHsps
will be greatest in the most photo-inhibited samples.
Methods
Limnological Measurements

31
Collections and measurements were made aboard the Lake Erie Center boat at six
sites along an approximately 80 km route in western Lake Erie and in Maumee Bay (Fig.
2-1) during the summer of 2008. At each sampling site, temperature, dissolved oxygen,
and chlorophyll (chl) a fluorescence were recorded using a YSI #6600 (Yellow Springs
Instruments) multi-probe at two-meter intervals from surface to bottom. The multi-probe
was calibrated before each sampling trip. Wind speed and direction were measured
(Kestrel #1000). The water column was classified as “strongly mixed” if wind speeds
exceeded 3 m s-1
(Webster and Hutchinson 1994; Visser et al. 2005). This classification
was supported by correlations of wind speed with vertical profiles of chl a, temperature,
and dissolved oxygen that indicated that the water column was uniformly mixed above 3
m s-1
. Wind speeds below 3 m s-1
allow Microcystis to escape the turbulent motion of the
water column (Webster and Hutchinson 1994; Huisman et al. 1999b) and were classified
in my study as “weakly mixed.” This was associated with stratification of chlorophyll
profiles and presence of surface scums. Underwater profiles of photosynthetically active
radiation (PAR, Li-Cor # LI-188B) were recorded and used to calculate the light
extinction coefficient (KPAR), which was used as an index of turbidity. Microcystis
biomass was estimated by colonies retained in quantitative plankton tows (Chaffin et al.
2008). All collections and measurements were recorded between 10:00 am to 3:00 pm on
full sun days.
For laboratory measurements of photosynthesis, Microcystis was collected from
the entire water column from five sites in western Lake Erie, using a 64 μm mesh
plankton net on six dates between July 24 and September 25, 2008 (Fig. 2-1). An
additional site (MB20) was sampled for the in situ photosynthetic efficiency study, but

32
Microcystis at this site was not abundant enough to provide physiological measurements.
Microcystis colonies retained in the net were concentrated and stored in dark
polyethylene bottles during transportation back to the laboratory. Depending on sample
location, two to six hours passed between collection on the lake and laboratory analysis.
Upon arriving at the laboratory, the Microcystis samples were added to 1L imhoff cones
and diluted to 1,000 ml with tap water. This allowed the Microcystis colonies to separate
from the sinking diatoms and green algae via floatation (Chaffin et al. 2008). After 30
minutes, the settled phytoplankton consisting mainly of diatoms was drawn off through
the bottom of the cone and discarded. The sample was then diluted again to 1,000 ml
with tap water and process repeated. At this time, Microcystis was sucked off the surface
for light-response curves and to determine the ratio of variable-to-maximum
fluorescence. After light-response curves were complete, Microcystis colonies were
drawn out of the bottom of the cone and concentrated on a 35 μm mesh, transferred to 1.5
ml tubes, and stored at -80 ° C until further analysis. Samples were also checked for the
presence of other cyanobacteria by microscopy. Anabaena was very sparse relative to
Microcystis colonies on July 24 and August 6, and Aphanizomenon was not seen in
samples.
Photosynthetic Efficiency
To determine the effects of turbidity and mixing on the in situ photosynthetic
efficiency of Microcystis present in the lake, the quantum yield of photosystem II (PSII)
electron transport (Φet) was recorded for surface and 1 m for all sites, and 3 m and 5 m
for the deeper sites 8M, 7M, GR1, and 4P, respectively. Water was collected using a
von-dorn bottle, transferred to dark polyethylene bottles, and immediately filtered

33
through Whatman GF/C filters or Fisher Brand G4 filters (1.2 µm pore sizes) (Marwood
et al. 2000). This larger pore size allowed water to pass through the filter more quickly
than using GF/F filter, giving a more accurate measurement of in situ conditions.
Approximately 20 to 50 ml of water was used per filter. Filtering and measuring of Φet
took place in the boat‟s cabin to avoid direct sun light. The Φet of algae was determined
within 60 seconds from collection using an OS1-FL Opti-Sciences modulated
fluorometer. Briefly, steady-state fluorescence of these light-adapted samples (Fs‟) was
read with a low-intensity (<0.1µmol m-2
s-1
) far-red light. Maximum fluorescence of the
light-adapted sample (Fm‟) was recorded following a high-intensity (> 5,000 µmol m-2
s-
1) saturating white-light pulse with a duration of 0.8 seconds. Φet is calculated as follows
(Genty et al. 1989):
Equation 1. Φet = (Fm‟ - Fs‟)/Fm‟
Water was also collected from these depths to determine phycocyanin concentration,
which is used to gauge the amount of Microcystis present for each Φet measurement (see
method below).
In order to determine if damage occurred to PSII, light-response curves and the
ratio of variable to maximum fluorescence (Fv/Fm) were determined on Microcystis
collected from the lake on the same dates as the in situ sampling. After Microcystis was
separated from other phytoplankton, a small amount of colonies was filtered onto a GF/C
or G4 filter. The filters were kept moist with lake water to prevent desiccation.
Photosynthetic light-response were generated using a Pulse Amplitude Modulation
(PAM) fluorometer measuring Φet (equation 1) at nine light intensities from 20 to 1640
µmol m-2
s-1
, at two minute intervals. Fv/Fm was determined on separate samples which

34
had been dark adapted for 30 minutes. Fv/Fm is calculated as follows (Schreiber et al.
1994);
Equation 2: Fv/Fm = (Fm – Fo)/Fm
where Fm is the maximum fluorescence of dark-adapted samples and Fo is the minimum
fluorescence of dark-adapted samples. Light-response and Fv/Fm was measured using a
Walz fluorometer (model PAM 101/103) and light pulse provided by a Schott flash lamp
(model KL1500) as in Heckathorn et al. (2002).
Pigment Concentration
For the in situ photosynthetic-efficiency measurement, it was not possible to
separate Microcystis from other phytoplankton species; therefore, in order to determine if
Microcystis was present in samples of the in situ Φet study, water from each sample was
brought back to the laboratory to determine the concentration of phycocyanin (PC), the
accessory light-harvesting pigment of Microcystis. Water was stored in polyethylene
bottles and stored on ice while transported back to the laboratory. Between 20 ml and
300 ml (depending on amount of sediments and plankton) were filtered through GF/F
(0.45 um) filters and stored on silica gel at -20° C (within six hours of collection). The
following day, silica gel was replaced with fresh gel and stored at -80° C until pigment
content was determined. PC was extracted in 0.1 M phosphate buffer pH 6.8 (Furuki et
al. 2003; Sampath-Wiley and Neefus. 2007). Filters were placed in plastic tubes with 5
ml of buffer and cells were broken by sonication (Bransonic #1510) for 15 minutes.
Samples were then filled to 10 ml, then incubated at 4° C for 60 minutes. Samples were
then centrifuged for 10 minutes at 3,800 rpm. PC fluorescence was recorded in a 10-AU

35
Turner Design fluorometer with P/N 103-80 filters. PC was quantified using a standard
curve of C-PC standards.
Photosynthetic pigments were extracted from Microcystis separated in the imhoff
cones to determine if Microcystis is able to adjust pigment content over a range of
turbidity. Chlorophyll (chl) a and carotenoids were extracted from approximately 0.2 g
of fresh weight tissue in 100% dimethylsulphoxide (DMSO). Tissue was added to 5 ml
DMSO, then heated to 70° C for 45 minutes. One ml was taken from the sample and
centrifuged at 21,000 g for 10 minutes. An absorption spectrum (400 – 700 nm at 1 nm
intervals) was determined using the UV-1650 PC Shimadzu spectrophotometer and
concentrations of chl a and total carotenoids were calculated from the spectra using
equations shown in Table 2-1 (Wellburn 1994). Negative values calculated for chl b for
all samples indicate that samples did not contain green algae. PC was extracted from
approximately 0.05 g of fresh tissue by sonication as above. Pigment content was then
corrected for dry weight determined by drying tissue until a constant weight at 70° C.
Dry weight was constant after 24 hours.
Protein Content
To determine the effects turbidity had on rubisco and sHsps, Microcystis was
ground to a powder in liquid nitrogen using a mortar and pestle, then transfered to a
protein extraction buffer containing 0.1 M Tris buffer (pH = 8.0), SDS detergent,
glycerol, bromophenol-blue, sucrose, protease inhibitors, a phenolic inhibitor, and
reductants (Mishra et al. 2008). Samples were then centrifuged at 15,000 g for 10
minutes at 4 ° C. Supernatant containing soluble proteins was collected and total protein
content was determined using the method of Peterson (1977), and quantified using a

36
standard curve of Bovine Serum Albumin. Samples in extraction buffer were kept at -80°
C until further analysises.
To prepare protein for gel separation and quantification of rubisco and sHsp,
proteins were precipitated in 10x volume acetone for 60 minutes at -20° C, centrifuged at
15,000 g at 4° C, then resuspended overnight at 4° C in a sample buffer containing 1%
SDS, 100 mM Tris buffer (pH = 6.8), 10% glycerol, 0.1% bromophenol-blue, and 0.4%
β-mercaptoethanol. Protein samples were boiled for 4 minutes to denature protein then
centrifuged at 21,000 g for 30 seconds to remove debris. Then proteins were separated in
12.5% SDS-PAGE, using 30 µg of protein in each well. For rubisco, gels were stained
using Coomassie blue R-250. After de-staining, the gel was scanned and the relative
content of rubisco large subunit band (52 kDa) was quantified by color densitometry. For
sHsps, proteins were transferred to nitro-cellulose membranes by electroblotting, and
sHsps were detected using protein specific antibodies (Heckathorn et al. 2002). Also,
Microcystis grown in culture was heat-shocked at 40°C for 45 minutes to induce
expression of sHsp and used as a positive control. A heat-shocked tomato plant was also
used as a positive control.
Laboratory Experiment
A 2x2x2x2 factorial experiment was used to test the effects of nutrient
concentration (low and high nutrients), turbidity (low and high), mixing (mixed or non-
mixing), and sample depth (surface and at depth) on photosynthetic efficiency and
pigments. All eight treatments combination (nutrient x turbidity x mixing) were
randomized between trials. Experiment was replicated by three independent trials, with
each treatment combination in each trial. Experimental tanks were constructed out of

37
61x76x90 cm (228 L) polyethylene (PE) bins. Bins were divided into six 61x9x90 cm
(36.5 L) chambers using black sheets of Acrylonitrile-Butadiene-Styrene (ABS) board
with PE foam inserted along the edges of the ABS board to fill the space created by the
expanding walls upon adding water (Fig. 2-2). Experiments were conducted in a
greenhouse and exposed to natural sunlight (up to 1,500 µmol m-2
s-1
) at ambient
temperature (25 – 28 °C).
Mixing of the chamber was achieved using powerhead pumps (Aquagardens
#601), so that the intake hose was placed at the bottom of the chamber and outflow just
beneath the surface (Fig. 2-2). Sieved Lake Erie sediments (400 µm) were added to
create turbidity. High turbidity was achieved by adding 0.55 ml L-1
sediments (~30 NTU)
and 0.02 ml L-1
for low turbidity (~1 NTU). High nutrient level was 3.0 mg L-1
nitrogen
(N) and 0.15 mg L-1
P, and low level was 0.6 mg L-1
N and 0.03 mg L-1
P. The N:P was
45 in both levels and all other nutrient concentration were the same in each level. All
other nutrients were half concentration of the WC media (Guillard and Lorenzen 1972).
Twiss et al. (2005) enriched Lake Erie water with micro-nutrients to a final concentration
similar to WC growth media and observed no additional phytoplankton growth. Equal
amounts of Chlamydomonas and Microcystis were used in this experiment, based on
content of chl a. Chlamydomonas and Microcystis were added so that they each had a
initial chl a of 2.5 µg L-1
, making the total initial concentration 5.0 µg L-1
.
Chlamydomonas and Microcystis that were intended for the experiment were grown in
separate liquid cultures with the nutrient concentration of the low treatment level for two
weeks before used in the experiment to insure that internal phosphorus storage did not
take place.

38
Once treatments were set up and phytoplankton added, 96 hours were allowed for
growth. This duration was decided upon following an initial trial ran for 168 hours using
twice as much initial algae, which resulted in light levels that were too similar between
the high and low turbidity treatments. Following the 96 hours, samples were collected at
the surface and at a depth of 70 cm. At 70 cm, light levels in the low-turbidity treatment
were 20% of surface light. In the high-turbidity treatment, light levels at 70 cm were <
0.5% of the surface irradiance. At the end of the incubation period, phytoplankton (100
ml) was filtered onto GF/F filters and Φet was measured within 60 seconds after
collection. Separate samples were dark-adapted for 30 minutes and Fv/Fm was
determined. Φet and Fv/Fm were determined in triplicate (three samples from each
treatment of each trial) using an OS1-FL Opti-Sciences modulated fluorometer.
Additional samples of algae for the determination of chl a and total carotenoids
concentration were filtered and stored on silica gel at -80 ° C. Pigments were extracted in
DMSO and calculated with published equations (Table 2-1). Chambers 1 and 6 were not
analyzed because the white outside wall resulted in higher light intensity than chambers 2
through 5, which had black walls. Light levels in the tanks were recorded after all
samples were collected. Photosynthetic measurements and light levels were recorded
between 12:00 pm and 2:00 pm on sunny days.
Data Analysis
In situ Φet data were analyzed for samples that had PC greater than 0.5 µg L-1
(n =
78). A two-factor ANCOVA [depth (0 m, 1 m, pooled 3 m and 5 m) and mixing
(strongly mixed or weakly mixed)] was performed using PROC REG of the statistical
software SAS (v. 9.1) using KPAR as a covariate and dummy variables were used for the

39
depth and mixing effects. Test for parallel slopes showed that these slopes where parallel
to each other (F(2,68) = 3.14, F* = 0.315; p = 0.7309).
Repeated measure ANOVA was done for light-response curves with light
intensity as the repeated variable and with site and mixing as fixed effects. Compound
symmetry was assumed because unstructured and spatial power failed to meet
requirements. To test for the effect that turbidity had on Φet within light intensities that
approximate Microcystis‟ light saturation (Ik) (261 µmol m-2
s-1
), 2x Ik (522 µmol m-2
s-1
)
and 4x Ik (about half full sunlight; 1044 µmol m-2
s-1
), ANCOVAs were used with KPAR
as covariate and dummy variables were used for the mixing effects. Tests for parallel
slopes were then performed for all light intensities. Because many of the slopes between
mixing and calm dates were not parallel, regressions were performed on each treatment
separately. Linear regressions were used for weakly mixed dates, while non-linear
regressions were used for strongly mixed dates and the maximum Φet (Φet max) value and
half-saturation coefficient (Km) for Φet max at each light intensity were calculated in Sigma
Plot. PROC MIXED of SAS was used for repeated measures, while PROC REG was
used for ANCOVAs and regressions.
ANCOVA tests were done to test for the effects of turbidity and site on the
pigment and protein content of Microcystis. KPAR was used as the covariate. Because
ANCOVA assumes all treatments (the five sites) have a similar distribution on the
covariate, and scatter plots of data suggest that this may not be the case, a single factor
ANOVA (Quinn and Keough 2002) test was done on the centered KPAR values by site.
This showed that there was no significant difference among sites (p = 0.30) and, thus
appropriate for the ANCOVA. Dummy variables were used for the five sites.

40
Differences among sites were tested for with a reduced model that excluded dummy
variables. This showed that site had no significant effect on pigment content (see
results); therefore regressions by KPAR were done to see the effect of turbidity on pigment
content. PROC REG of SAS was used for ANCOVAs and regressions, while PROC
ANOVA was used for ANOVA.
Four-way ANOVA was performed to test for the effect of mixing (mixed or
calm), turbidity (high or low), nutrients (high or low), and sample depth (surface and at
depth) on Φet, Fv/Fm, and pigment composition. Tukey test was performed for multiple
comparisons. PROC GLM of SAS was used.
Results
Photosynthetic Efficiency
In situ photosynthetic efficiency was greatest in higher turbidity and at depth (Fig.
2-3). Φet increased with turbidity (F(1,71) = 3.98; F*= 156.6; p < 0.0001) and with depth
(F(2,71) = 3.13; F* = 15.87; p < 0.0001) (Fig. 2-3). Mixing did not affect Φet (F(1,71) = 3.98;
F* = 0.0828; p = 0.7754). For surface samples, mixing increased Φet at higher KPAR
values, in contrast to 3 and 5 m where mixing decreased Φet at higher KPAR (Fig. 2-3).
The regression lines for mixing and calm at one meter were identical and values were
intermediate between those from the surface and 3 or 5 m depth (Fig. 2-3). There was no
interaction between factors (F(2,71) = 3.13; F* = 0.750; p = 0.476).
Light-response curves of Microcystis showed the typical response of any
photosynthetic organism of PSII Φet with increasing light intensities. The light-response
curves also show that Microcystis becomes damaged on calm dates. Across all light

41
intensities, Φet was greater on vertically strongly mixed days than weakly mixed days (p
= 0.0335; Fig. 2-4a). Fv/Fm was also greater on strongly mixed days (t-test, p = 0.0021;
Fig. 2-4b). For every light-response curve, F‟s increased with increasing light intensity.
F‟m was more or less stable over all light intensities for Microcystis collected from
weakly mixed water, while F‟m decreased with light intensity for strongly mixed dates,
indicating greater non-photochemical quenching. Collection location did not affect the
light-response curve (p = 0.9743). To analyze the effect turbidity had on photosynthetic
efficiency at Ik, 2x Ik, and 4x Ik, and Fv/Fm, ANCOVA‟s were performed within each light
intensity using KPAR as the covariate. For these light intensities, the ANCOVA slopes for
weakly and strongly mixed conditions were not parallel (Table 2-2). Because of non-
parallel slopes, separate regressions were performed to analyze the effect of turbidity on
Φet. Under weakly mixed conditions, Φet was unaffected by turbidity (a non-significant
slope) (Table 2-2; Fig. 2-5). For strongly mixed conditions, non-linear regressions were
used because of the hyperbolic function, and the maximum Φet (Φet max) value and half-
saturation coefficient (Km) for Φet max at each light intensity were calculated (Table 2-2;
Figs. 2-5,6). At low light levels, Km was very low and increased at greater light
intensities (Fig. 2-6). For example, at Ik (261 µmol m-2
s-1
), Km was 0.91, and at 4x Ik
(1044 µmol m-2
s-1
), Km was equal to 4.66. Slopes for Fv/Fm were parallel between strong
and weak mixing, and non-significant when regressed against KPAR (Table 2-2).
Pigments
Chlorophyll (chl) a and phycocyanin (PC), the light-harvesting pigments in
Microcystis, had higher content in turbid water as compared to less turbid water.
Reduced ANCOVA models excluding site effect variables were not significantly

42
different from full models that included the site effects (Table 2-3); therefore, site alone
does not have an effect on pigment content. Chl a content of Microcystis increased over
the sampling season from 4.84 ± 0.20 mg g-1
(dry weight) (mean ± SE) on August 6 to
6.71 ± 0.44 on September 1. Further, the difference between the minimum (4.35 mg g-1
)
and maximum (7.90 mg g-1
) values nearly doubled over the sampling period. When
pigment content was regressed vs. KPAR, Chl a content was found to increase linearly
with turbidity (Table 2-3; Fig. 2-7a). Total carotenoids content also increased with
turbidity; however, more importantly, the total carotenoids/ chl a ratio decreased with
increasing KPAR (Table 2-3; Fig. 2-7b). PC content of Microcystis also increased with
turbidity (Table 2-3; Fig. 2-7c), but to a much greater extent than chl a. PC was 20.24 ±
2.52 mg g-1
August 6 and PC more than doubled to 48.35 ± 6.22 mg g-1
on August 21.
Further, there was nearly a six-fold increase between the minimum (10.83 mg g-1
) and
maximum (62. 33 mg g-1
) values. The PC/ chl a ratio increased significantly with
increasing KPAR (Table 2-3; Fig. 2-7d).
Protein Content
Total proteins separated by SDS-PAGE are shown in figure 2-8. Relative density
of rubisco large subunit (52 kDa) was not affected by turbidity, but rather it increased
with increasing average PAR (Table 2-3; Fig. 2-9). Small Hsp were only detected from
samples collected on August 21 and were found at all sites in same quantity.
Laboratory Experiment
The laboratory photosynthetic efficiency experiment gave similar results as the in
situ study. Φet ranged from 0.334 to 0.568 (Fig. 2-10a), and was significantly affected by
the depth*mixing interaction (F* = 38.80; p < 0.001) and turbidity (F* = 26.49; p <

43
0.001) (Table 2-4). Nutrients did not have a significant effect on Φet (F* = 0.2238; p =
0.2238). Turbidity increased Φet for each treatment combination of mixing and depth. Φet
was statistically (Tukey test, p < 0.05) greater at depth than surface for the calm treatment
among both turbidity levels. Within the mixed treatment, Φet was greater at depth than at
the surface, but this difference was not statistically significant (Tukey test, p > 0.05).
The ratio of variable to maximum fluorescence (Fv/Fm) ranged from 0.567 to
0.604, and was only significantly affected by turbidity (F* = 15.65; p = 0.0004). Fv/Fm
was greatest in the high turbidity treatment (Fig. 2-10b). Fv/Fm was greater at 70 cm, but
this was not significant (F* = 3.21; p = 0.08). Neither mixing, nutrients, nor any
interactions significantly affected Fv/Fm (Table 2-4).
Only total carotenoids/ chl a was significantly affected (p = 0.0007) by turbidity
and was greater in the low turbidity treatment (Fig. 2-11). Total carotenoids/ chl a was
not affected by any other factors or interactions (Table 2-4).
Discussion
Most research on Microcystis bloom-development is focused on nutrient effects.
This study of photosynthetic efficiency and pigment content of Microcystis provides
insights on how turbidity and vertical mixing can decrease high light stress. The in situ
Φet lake study (Fig. 2-3) and laboratory experiments (Fig. 2-10a) showed that Φet
increased with both increasing turbidity and depth. Mixing added an interesting effect to
Φet. The lack of mixing allowed phytoplankton to remain at a constant light level, where
it either became photo-inhibited if at the surface exposed to full sunlight, or became
adapted to low light if it were sitting at a deeper depth in turbid water. The average light

44
exposure would have been very high for surface Microcystis, while average light was
very low at depth. Mixing would transport surface algae downward providing relief from
high-intensities light, while upward-mixing exposes algae that were adapted to low light
levels at depth to high light intensities near the surface. The difference between the
photosynthetic efficiency of phytoplankton collected at the surface and at depth under
mixing conditions indicates that phytoplankton were able to recover/photo-inhibit
between upward/downward transportation. In lakes, turbidity and nutrient concentration
co-vary. Nutrient concentration did not affect Φet in the laboratory experiment. Very low
nutrient concentration would most certainly decrease Φet (Stehfest et al. 2005), but
nutrients in the low treatment were still high enough to prevent decreases in Φet. This
indicates that the photo-inhibition observed in the lake in clear water were not due to low
nutrients, but from lack of protective suspended sediments.
Microcystis becomes damaged on weakly mixed dates as evidence of lower
values of Φet across the light-response curve and lower Fv/Fm (Fig. 2-4). Further, the
stable F‟m of the light-response curve of the weakly mixed samples indicates less photo-
protection of PSII via non-photochemical quenching (Schofield et al. 1998). Microcystis
on weakly mixed dates floats near the surface where it is exposed to high light intensities
for extended lengths of time that results in damage to the photosynthetic machinery and
induction of photo-protective mechanisms. Damage to PSII was not repaired during
transportation back to laboratory, which was 4 to 6 hours from collection time to time of
analysis. Marwood et al. (2000) exposed Lake Erie phytoplankton to similar light
intensities as surface light for 30 minutes and saw complete recovery of Fv/Fm following
a two-hour recovery period. Microcystis collected from western Lake Erie in weakly

45
mixed water would have been exposed to full sunlight for several hours before I sampled.
Köhler (1992) suggested that it takes Microcystis two days to adjust to high light
intensities. On the other hand, strong mixing circulates Microcystis through out the water
column which decreases exposure to high light intensities, preventing damage to the
photosynthetic machinery, but Microcystis growth stops in mixed waters (Reynolds et al.
1984; Köhler 1992) and the competitive edge is shifted towards sinking phytoplankton
(Huisman et al. 2004).
Microcystis itself can bring about photo-inhibitory conditions that result in
damage, because surface blooms can increase the lake surface temperatures by 5 C
through non-photochemical quenching (Ibelings et al. 2003). High light intensities and
high temperatures act synergistically together to damage cyanobacteria photosynthetic
machinery (Ibelings 1996). However, the addition of 5 C would still have been in the
tolerable temperature range for Microcystis (lake surface temperature < 25 C, Fig. 2-12)
(Ibelings 1996); likewise, sHsps were not detected in photo-inhibited Microcystis.
Therefore, damage seen in this study must have been a result of high light intensities
rather than heat or a combination of the two.
Turbidity offered no protection for Microcystis on weakly mixed dates. Fv/Fm and
Φet at Ik, 2x Ik and 4x Ik were not affected by water column turbidity in which the
Microcystis was collected when the water column was weakly mixed. Microcystis floats
on top of the water on extremely calm dates, therefore on top of any suspended sediment,
which would offer protection. During strong mixing, however, Microcystis’
photosynthetic efficiency benefited from increased turbidity because photosynthetic
efficiency at high light intensities was greater with higher turbidity (Fig. 2-6). This
46
indicates that turbidity has a larger role in photo-protection at greater light intensities,
such as those seen near the surface. However, turbidity increased photosynthetic
efficiency in the in situ study, even at the surface of weakly mixed days (Fig. 2-3). This
may suggest that there are additional intra-cellular protective mechanisms present in situ
that are not showing up in the laboratory light-response curves.
Damage was seen in Microcystis collected from the lake; however, very little
damage was seen in the laboratory experiment (Fig. 2-10b). In the laboratory
experiment, the slight decreases Fv/Fm indicate that the large decreases in Φet were due to
photo-protective down-regulation of electron transport through non-photochemical
quenching rather than damage to PSII. While the large decreases in Fv/Fm of Microcystis
collected from the lake indicate that the decreases in Φet were due to damage to PSII.
This could due to differences in light levels. In the lake, Microcystis would be exposed to
full sunlight that exceeded 2,000 μmol m-2
s-1
on the lake, while the maximum light
intensity of the laboratory experiment was around 1,500 μmol m-2
s-1
. This suggests that
Microcystis becomes light damaged at intensities between 1,500 and 2,000 μmol m-2
s-1
.
Carotenoids have a several function acting as light-harvesting pigments and also
are photo-protective molecules that absorb free radicals and are involved in non-
photochemical quenching (Gotz et al. 1999; Bhandari and Sharma 2006). The total
carotenoids/ chl a ratio was highest in less turbid water for both Microcystis collected
from the lake and in the laboratory experiment (Figs. 2-7b; 2-11). Paerl et al. (1983)
observed a steady increase of total carotenoids/ chl a of Microcystis over a summer. I
found that Microcystis‟ carotenoids/ chl a decreased through out the summer of 2008.
This is because Microcystis first appeared in clear water, which resulted in the need for

47
more of the photo-protective pigments. Then, as the lake became more turbid, the
carotenoids/ chl a ratio dropped. The increase in total carotenoids during my sampling is
most likely a function of increasing turbidity to aid in light harvest that suggests they are
having more of a role in light harvest than photo-protection in turbid water. If
carotenoids role was solely photo-protective, then it would be expected that the high total
carotenoids/ chl a seen on August 6 and 12 in clear water would have been maintained as
the lake became turbid.
Buoyancy gives Microcystis an advantage in weakly mixed waters for
competition of light (Huisman et al. 2004; Jöhnk et al. 2008). However, my research
indicates that this ecological advantage comes at a physiological price, because
Microcystis collected on weakly mixed dates had more damage to photosynthetic
machinery than did Microcystis collected on strongly mixed dates. In situ photosynthetic
efficiency and carotenoids/ chl a data suggests that turbidity did alleviate this stress but
could not compensate for damage due to very high light intensities. The ideal situation
for Microcystis would be to regulate buoyancy to maintain an ideal position in the water
column through out the day, preventing photo-inhibition and accessing nutrients while
maintaining a net photosynthesis and a surface scum (Kromkamp and Walsby 1990;
Visser et al. 1997). This may not be the case in western Lake Erie, because of the very
large size of Microcystis colonies, which often exceed 2 cm in length (personal
observation). Large Microcystis colonies are more prone to photo-inhibition because of
increased buoyancy (Brookes et al. 2003). Further, Microcystis is unable to accumulate
carbohydrate needed to become negatively buoyant at very high light intensities (Visser
et al. 1997). The highest light intensity of the light-response curve I studied was 1680

48
µmol m-2
s-1
(84% of surface light), and samples collected on weakly mixed dates had an
efficiency of 0.0014, while samples from mixed dates had an efficiency of 0.014 at the
highest light intensity (Fig 2-4a). This indicates that Microcystis at the surface on calm
dates has very low efficiency in the high intensity as compared to strongly mixed days.
Large colonies of western Lake Erie Microcystis would become damaged when at the
surface, resulting in the loss of the ability to produce carbohydrate needed to become
negatively buoyant, thus the colonies become trapped on the surface. For that reason,
there is an eco-physiological trade-off between being highly competitive for light under
low-light in weakly mixed conditions and being highly prone to photosynthetic damage.
Damage that occurs at the surface would explain why Microcystis appears to
increase in biomass at the surface throughout a calm day. Microcystis will float to the
surface where it becomes damaged in the high intensity sunlight and unable to become
negatively buoyant. Colonies will continually float upwards throughout the day,
becoming damaged. Therefore Microcystis accumulates at the surface throughout the
day. I have observed that Microcystis biomass continues to increase over time despite
very low Φet. This suggests that Microcystis must be recovering during the night, or that
Microcystis on the underside of the surface scum is protected and remains healthy.
Microcystis had the highest photosynthetic efficiency in waters that were turbid
and strongly mixed. The bloom of 2008 first appeared in relatively clear water (Fig. 2-
12). During the clear water phase, low biovolumes of Microcystis were recorded.
Microcystis photosynthetic efficiency was low and total carotenoids/ chl a was high
during this time. This would indicate stressful conditions and explain (in part) low
biomass. Large biovolumes of Microcystis were seen after August 21 once the lake

49
became highly turbid. Photosynthetic efficiency was highest and carotenoids decreased
during this time. The turbid waters resulted in increased Φet, which is proportional to
carbon fixation (Genty et al. 1989). Highly turbid water provides a more favorable
growth condition for Microcystis than clearer water. Thus, if nutrient loading is held
constant but suspended sediment loading is reduced, Microcystis biomass would be
reduced because of higher light stress and no competitive advantage.
Chl a content of Microcystis nearly doubled with increasing turbidity (Fig. 2-7a).
Most photosynthetic organisms increase the relative amount of chl when grown under
low light conditions to catch more photons (Kirk 1994; Hopkins 1999). Cyanobacteria
increase chl a content by producing more light-harvesting complex with constant chl a
per unit, rather than increasing chl a per complex (Raps et al. 1983). Phycocyanin (PC)
is the major light-harvesting pigment in the antennae of cyanobacteria (Adir 2005) and its
content increased nearly six-fold as the lake transitioned from very clear to highly turbid
(Fig. 2-7c). Rubisco was unaffected by KPAR, but did significantly increase with average
PAR (Table 2-3). This would be expected because Rubisco activity decreases with less
light (Hopkins 1999) and the calculation of average PAR factors in lake depth. Average
PAR can be quite high in turbid, shallow water. Although significant, these regressions
of pigment vs. KPAR were not very tight (Table 2-3). This may be due to the high to low
turbidity gradient from the mouth of the Maumee River into the lake. When transitioned
from low to high light, chl a and PC content of cyanobacteria reached a steady state after
250 hours (Post 1986), while pigments reached a steady state after only 50-60 hours
when transitioned from high to low light (Post 1986). Small Hsp were only detected
from samples collected on Aug. 21. Small Hsp have been shown to protect PSII and

50
phycobilins during stressful conditions (Heckathorn et al. 2002; Nakamoto and Honma
2006). It is likely that sHsp where associated with PC rather than PSII, because Φet
values were high (non photo-inhibited) and PC content was greatest on this day.
These field findings of dramatic shifts in pigment content of Microcystis would
have implications for remote sensing of blooms. Researchers rely on satellites to detect
concentrations of chl a or PC to map the spatial coverage of these blooms (Vincent et al.
2004; Simis et al. 2007; Wynne et al. 2008). Further, concentrations of these pigments in
lake water are used to gauge the intensity of these blooms. Flawed conclusions might be
made when comparing PC or chl a concentration of clear water to highly turbid water.
For example, if a researcher observes a lake wide PC of 5 µg L-1
, this may lead to the
conclusion that Microcystis biomass is constant through out the lake. However, if there is
a strong turbidity gradient from bay to offshore (which is usually the case in western
Lake Erie), the Microcystis biomass of the bay would most likely be much less than that
of the offshore. The low biomass in the turbid bay would need to produce more pigments
in order to capture light. The scenario would be similar when comparing pigments
between data collected on two different dates that had different turbidity. Chl a would
give remote sensing researchers a more accurate estimate of algal biomass rather then PC,
because chl a content of Microcystis only double over the range of turbidity while PC
content increased nearly six-fold.
In conclusion, surface Microcystis had the lowest photosynthetic efficiencies in
calm water as a result of damage due to long-term exposure to full sunlight. Increased
turbidity did not mitigate damage but did increase in situ photosynthetic efficiency. Less
damage was observed when the water column was vertically mixed. However,

51
Microcystis requires stable water to allow it to competitively exclude other phytoplankton
through the formation of surface scums that shade diatoms and green algae as they settle
out of the photic zone. Thus, there is an eco-physiological trade-off in calm waters
between being highly competitive for light but also being more susceptible to damage to
photosynthetic machinery.
Literature Cited
Adir, N. 2005. Elucidation of the molecular structures of components of the
phycobilisome: reconstructing a giant. Photosynthesis Research. 85(1): 15-32.
Alpine, A. E., and J. E. Cloern. 1988. Phytoplankton growth-rates in a light-limited
environment, San Francisco bay. Marine Ecology-Progress Series 44: 167-173.
Baker, D.B., and Richards, R.P. 2002. Phosphorus budgets and riverine phosphorus
export in northwestern Ohio watersheds. Journal of Environmental Quality 31(1):
96-108.
Bhandari, R., and Sharma, P.K. 2006. High-light-induced changes on photosynthesis,
pigments, sugars, lipids and antioxidant enzymes in freshwater (Nostoc
spongiaeforme) and marine (Phormidium corium) cyanobacteria. Photochemistry
and Photobiology 82(3): 702-710.
Brookes, J.D., Regel, R.H., and Ganf, G.G. 2003. Changes in the photo-chemistry of
Microcystis aeruginosa in response to light and mixing. New Phytologist 158(1):
151-164.

52
Canini, A., Leonardi, D., and Caiola, M.G. 2001. Superoxide dismutase activity in the
cyanobacterium Microcystis aeruginosa after surface bloom formation. New
Phytologist 152(1): 107-116.
Chaffin, J. D., Bridgeman, T. B. and Filbrun, J. F. 2008. Quantification of Microcystis sp.
blooms in western Lake Erie (2002-2007) and relation to tributary flow.
Conference presentation. International Association of Great Lakes Research.
Petersburg Ontario, Canada.
Conroy, J. D. 2008. Testing the algal loading hypothesis: the importance of Sandusky
River phytoplankton inputs to offshore Lake Erie processes. PhD. Thesis. The
Ohio State University.
Furuki, T., Maeda, S., Imajo, S., Hiroi, T., Amaya, T., Hirokawa, T., Ito, K., and
Nozawa, H. 2003. Rapid and selective extraction of phycocyanin from Spirulina
platensis with ultrasonic cell disruption. Journal of Applied Phycology 15(4):
319-324.
Ganf. G. G. 1975. Photosynthetic production and irriadiance-photosynthesis relationships
of the phytoplankton from a shallow equatorial lake (Lake George, Uganda).
Oecologia. 18:165-183.
Genty, B., Briantais, J.M., and Baker, N.R. 1989. The relationship between the quantum
yield of photosynthetic electron-transport and quenching of chlorophyll
fluorescence. Biochimica Et Biophysica Acta 990(1): 87-92.

53
Gotz, T., Windhovel, U., Boger, P., and Sandmann, G. 1999. Protection of photosynthesis
against ultraviolet-B radiation by carotenoids in transformants of the
cyanobacterium Synechococcus PCC7942. Plant Physiology 120(2): 599-604.
Guillard, R. R. L. and Lorenzen, C. J. 1972. Yellow-green algae with chlorophyllide c.
Journal of Phycology. 8:10-14
Heckathorn, S.A., Ryan, S.L., Baylis, J.A., Wang, D.F., Hamilton, E.W., Cundiff, L., and
Luthe, D.S. 2002. In vivo evidence from an Agrostis stolonifera selection
genotype that chloroplast small heat-shock proteins can protect photosystem II
during heat stress. Functional Plant Biology 29(8): 933-944.
Hopkins, G. 1999. Introduction to Plant Physiology: 2nd Edition. Wiley Publishers. New
York, New York.
Huisman, J., Arrayas, M., Ebert, U., and Sommeijer, B. 2002. How do sinking
Phytoplankton species manage to persist? American Naturalist 159(3): 245-254.
Huisman, J., Sharples, J., Stroom, J.M., Visser, P.M., Kardinaal, W.E.A., Verspagen,
J.M.H., and Sommeijer, B. 2004. Changes in turbulent mixing shift competition
for light between phytoplankton species. Ecology 85(11): 2960-2970.
Huisman, J., van Oostveen, P., and Weissing, F.J. 1999a. Critical depth and critical
turbulence: Two different mechanisms for the development of phytoplankton
blooms. Limnology and Oceanography 44(7): 1781-1787.

54
Huisman, J., van Oostveen, P., and Weissing, F.J. 1999b. Species dynamics in
phytoplankton blooms: Incomplete mixing and competition for light. American
Naturalist 154(1): 46-68.
Ibelings, B.W., Vonk, M., Los, H.F.J., van der Molen, D.T., and Mooij, W.M. 2003.
Fuzzy modeling of cyanobacterial surface waterblooms: Validation with NOAA-
AVHRR satellite images. Ecological Applications 13(5): 1456-1472.
Ibelings, B.W. 1996. Changes in photosynthesis in response to combined irradiance and
temperature stress in cyanobacterial surface waterblooms. Journal of Phycology
32(4): 549-557.
Ibelings, B.W., Kroon, B.M.A., and Mur, L.R. 1994. Acclimation of photosystem II in a
cyanobacterium and a eukaryotic green-alga to high and fluctuating
photosynthetic photon flux densities, simulating light regimes induced by mixing
in lakes. New Phytologist 128(3): 407-424.
Johengen, T.H., Biddanda, B.A., and Cotner, J.B. 2008. Stimulation of Lake Michigan
plankton metabolism by sediment resuspension and river runoff. Journal of Great
Lakes Research 34(2): 213-227.
Jöhnk, K.D., Huisman, J., Sharples, J., Sommeijer, B., Visser, P.M., and Stroom, J.M.
2008. Summer heatwaves promote blooms of harmful cyanobacteria. Global
Change Biology 14(3): 495-512.

55
Kirk, J. T. O. 1994. Light and photosynthesis in aquatic ecosystems: second edition.
Cambridge University Press.
Kloppstech, K., Meyer, G., Schuster, G., and Ohad, I. 1985. Synthesis, transport and
localization of a nuclear coded 22-kd heat-shock protein in the chloroplast
membranes of peas and Chlamydomonas-reinhardi. Embo Journal 4(8): 1901-
1909.
Köhler, J. 1992. Influence of turbulent mixing on growth and primary production of
Microcystis aeruginosa in the hypertrophic Bautzen Reservoir. Archiv Fur
Hydrobiologie 123(4): 413-429
Konopka, A., Kromkamp, J., and Mur, L.R. 1987. Regulation of gas vesicle content and
buoyancy in light-limited or phosphate-limited cultures of Aphanizomenon flos-
aquae (cyanophyta). Journal of Phycology 23(1): 70-78.
Krause, G.H. 1988. Photoinhibition of photosynthesis - an evaluation of damaging and
protective mechanisms. Physiologia Plantarum 74(3): 566-574.
Kromkamp, J., and Walsby, A.E. 1990. A computer-model of buoyancy and vertical
migration in cyanobacteria. Journal of Plankton Research 12(1): 161-183.
Marwood, C.A., Smith, R.E.H., Furgal, J.A., Charlton, M.N., Solomon, K.R., and
Greenberg, B.M. 2000. Photoinhibition of natural phytoplankton assemblages in
Lake Erie exposed to solar ultraviolet radiation. Canadian Journal of Fisheries and
Aquatic Sciences 57(2): 371-379.

56
Mishra, S., Heckathorn, S.A., Barua, D., Wang, D., Joshi, P., Hamilton, E.W., and Frantz,
J. 2008. Interactive Effects of Elevated CO2 and Ozone on Leaf Thermotolerance
in Field-Grown Glycine max. Journal of Integrative Plant Biology 50(11): 1396-
1405.
Moorhead, D., T. B. Bridgeman, and J. Morris. 2008. Changes in water quality of
Maumee Bay 1928 – 2003. In: Checking the pulse of Lake Erie. Editors
Munawar, M and Heath, R. Goodword Books.
Nalewajko, C. and T. P. Murphy. 2001. Effects of temperature, and availability of
nitrogen and phosphorus on the abundance of Anabaena and Microcystis in Lake
Biwa, Japan: an experimental approach. Limnology 2:45-48.
Paerl, H.W., Tucker, J., and Bland, P.T. 1983. Carotenoid enhancement and its role in
maintaining blue-green-algal (Microcystis aeruginosa) surface blooms.
Limnology and Oceanography 28(5): 847-857.
Peterson, G.L. 1977. A simplification of the protein assay of Lowry et al. which is
generally applicable. Analytical Biochemistry. 83(2): 346-356.
Post. A.F. 1986. Transient state characteristics of adaptation to changes in light
conditions for the cyanobacterium Oscillatoria agardhii. Arch Microbiol.
145:353-357
Preczewski, P.J., Heckathorn, S.A., Downs, C.A., and Coleman, J.S. 2000.
Photosynthetic thermotolerance is quantitatively and positively correlated with

57
production of specific heat-shock proteins among nine genotypes of Lycopersicon
(tomato). Photosynthetica 38(1): 127-134.
Quinn, G.P. and Keough, M.J. 2002. Experimental design and data analysis for
biologists. Cambridge University Press.
Raps, S., Kycia, J.H., Ledbetter, M.C., and Siegelman, H.W. 1985. Light-intensity
adaptation and phycobilisome composition of Microcystis aeruginosa. Plant
Physiology 79(4): 983-987.
Raps, S., Wyman, K., Siegelman, H.W., and Falkowski, P.G. 1983. Adaptation of the
cyanobacterium Microcystis aeruginosa to light-intensity. Plant Physiology 72(3):
829-832.
Reynolds, C.S., Oliver, R.L., and Walsby, A.E. 1987. Cyanobacterial dominance - The
role of buoyancy regulation in dynamic lake environments. New Zealand Journal
of Marine and Freshwater Research 21(3): 379-390.
Reynolds, C.S., Wiseman, S.W., and Clarke, M.J.O. 1984. Growth-rate and loss-rate
responses of phytoplankton to intermittent artificial mixing and their potential
application to the control of planktonic algal biomass. Journal of Applied Ecology
21(1): 11-39.
Richards, R.P., Baker, D.B., Crumirine, J.P., Kramer, J.W., Ewing, D.E., and Merryfield,
B.J. 2008. Thirty-year trends in suspended sediment in seven Lake Erie
tributaries. Journal of Environmental Quality 37(5): 1894-1908.

58
Sampath-Wiley, P., and Neefus, C.D. 2007. An improved method for estimating R-
phycoerythrin and R-phycocyanin contents from crude aqueous extracts of
Porphyra (Bangiales, Rhodophyta). Journal of Applied Phycology 19(2): 123-
129.
Scandalios, J.G. 1993. Oxygen stress and superoxide dismutases. Plant Physiology
101(1): 7-12.
Schlesinger, M.J. 1990. Heat-shock proteins. Journal of Biological Chemistry 265(21):
12111-12114.
Schreiber, U., Bilger, W., and Neubauer, C. 1994. Chlorophyll fluorescence as a
nonintrusive indicator for rapid assessment on in vivo photosynthesis. In.
Ecophysiology of photosynthesis. Editors: Schulze, E. and Caldwell, M.M.
Springer-Verlag Press
Schofield, O., Evens, T.J., and Millie, D.F. 1998. Photosystem II quantum yields and
Xanthophyll-cycle pigments of the macroalga Sargassum natans (Phaeophyceae):
Responses under natural sunlight. Journal of Phycology 34(1): 104-112.
Simis, S.G.H., Ruiz-Verdu, A., Dominguez-Gomez, J.A., Pena-Martinez, R., Peters,
S.W.M., and Gons, H.J. 2007. Influence of phytoplankton pigment composition
on remote sensing of cyanobacterial biomass. Remote Sensing of Environment
106(4): 414-427.
59
Søndergaard, M., Jensen, J.P., and Jeppesen, E. 2003. Role of sediment and internal
loading of phosphorus in shallow lakes. Hydrobiologia 506(1-3): 135-145.
Stehfest, K., Toepel, J., and Wilhelm, C. 2005. The application of micro-FTIR
spectroscopy to analyze nutrient stress-related changes in biomass composition of
phytoplankton algae. Plant Physiology and Biochemistry 43(7): 717-726.
Twiss, M.R., Gouvea, S.P., Bourbonniere, R.A., McKay, R.M.L., and Wilhelm, S.W.
2005. Field investigations of trace metal effects on Lake Erie phytoplankton
productivity. Journal of Great Lakes Research 31: 168-179.
Vincent, R.K., Qin, X.M., McKay, R.M.L., Miner, J., Czajkowski, K., Savino, J., and
Bridgeman, T. 2004. Phycocyanin detection from LANDSAT TM data for
mapping cyanobacterial blooms in Lake Erie. Remote Sensing of Environment
89(3): 381-392.
Visser, P. M., Ibelings, B. W., Mur, L. R., and Walsby, A. E. 2005. Ecophysiology of
Microcystis. In Harmful Cyanobacteria. Editors Huisman, J., Matthijs, H. C. P.,
and Visser, P. M. Springer Press. Netherlands
Visser, P.M., Passarge, J., and Mur, L.R. 1997. Modelling vertical migration of the
cyanobacterium Microcystis. Hydrobiologia. 349: 99-109.
Webster, I.T., and Hutchinson, P.A. 1994. Effect of wind on the distribution of
phytoplankton cells in lakes revisited. Limnology and Oceanography 39(2): 365-
373.

60
Wellburn, A.R. 1994. The spectral determination of chlorophyll a and chlorophyll b, as
well as total carotenoids, using various solvents with spectrophotometers of
different resolution. Journal of Plant Physiology 144(3): 307-313.
Wu, Z.X., and Song, L.R. 2008. Physiological comparison between colonial and
unicellular forms of Microcystis aeruginosa Kutz. (Cyanobacteria). Phycologia
47(1): 98-104.
Wynne, T.T., Stumpf, R.P., Tomlinson, M.C., Warner, R.A., Tester, P.A., Dyble, J., and
Fahnenstiel, G.L. 2008. Relating spectral shape to cyanobacterial blooms in the
Laurentian Great Lakes. International Journal of Remote Sensing 29(12): 3665-
3672.

61
Tables
Table 2-1. Equations used to calculate chlorophyll a and b and total caroteniods in
DMSO from filtered lake water or Microcystis (Wellburn 1994). X is L for filtered water
for pigment per volume or g for Microcystis pigment per mass. v is the volume (ml) of
DMSO used for extraction.
Pigment Unit Equation
Chlorophyll a μg X-1
[(12.47*A666)-(3.62*A649)] x v / X
Chlorophyll b μg X-1
[(25.06*A649)-(6.5*A665)] x v / X
Total Carotenoids μg X-1
{[(1000*A480)-(1.29*Chl a)-(53.78*Chl b)]/220} x v /X

62
Table 2-2. ANCOVA and regression table of Microcystis Φet at light saturation (Ik), 2x Ik, and 4x Ik and the light
intensities used to represent these reading (μmol m-2
s-1
PAR). Because slopes are not parallel (α = 0.05; F(1,25) = 4.26),
regressions were used to test the effect turbidity had on Φet. P values, slope and r2 are from linear or non-linear
regressions of KPAR vs. Φet in a given light intensity. The half-saturation coefficient (Km) and maximum Φet (Φet max) for
the KPAR-Φet curve are given for non-linear function.
Sample
Light ANCOVA Slope Test
Mixing p value Function r2
Intensity F* Result Km Φet max
Fv/Fm
Dark
0.05 Parallel
Calm 0.5544 Linear 0.0275 NA NA
Adapted Mixed 0.1121 Linear 0.1967 NA NA
Ik 261 9.45 Not Parallel
Calm 0.2356 Linear 0.1063 NA NA
Mixed 0.0006 Non-linear 0.6361 0.9126 0.2999
2x Ik 521 12.98 Not Parallel
Calm 0.2662 Linear 0.0942 NA NA
Mixed <.0001 Non-linear 0.7413 1.4979 0.2417
4x Ik 1044 11.3 Not Parallel
Calm 0.7701 Linear 0.0068 NA NA
Mixed 0.0003 Non-linear 0.6757 4.6623 0.1808
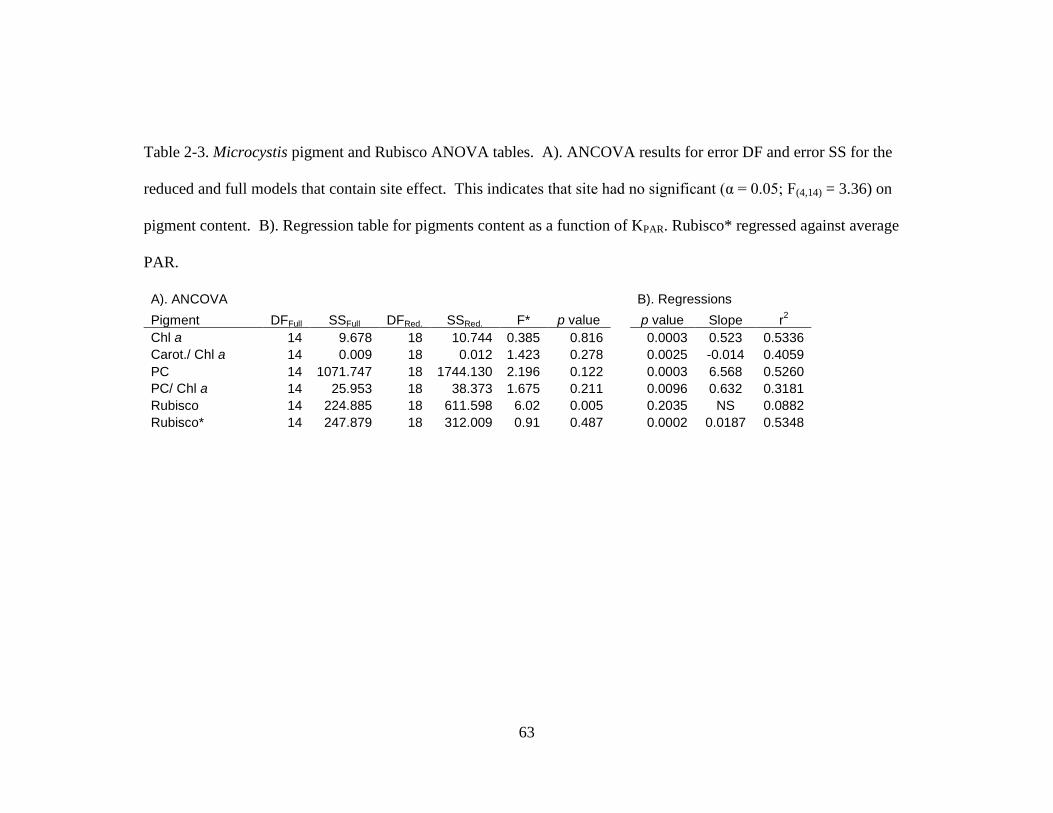
63
Table 2-3. Microcystis pigment and Rubisco ANOVA tables. A). ANCOVA results for error DF and error SS for the
reduced and full models that contain site effect. This indicates that site had no significant (α = 0.05; F(4,14) = 3.36) on
pigment content. B). Regression table for pigments content as a function of KPAR. Rubisco* regressed against average
PAR.
A). ANCOVA B). Regressions
Pigment DFFull SSFull DFRed. SSRed. F* p value p value Slope r2
Chl a 14 9.678 18 10.744 0.385 0.816 0.0003 0.523 0.5336
Carot./ Chl a 14 0.009 18 0.012 1.423 0.278 0.0025 -0.014 0.4059
PC 14 1071.747 18 1744.130 2.196 0.122 0.0003 6.568 0.5260
PC/ Chl a 14 25.953 18 38.373 1.675 0.211 0.0096 0.632 0.3181
Rubisco 14 224.885 18 611.598 6.02 0.005 0.2035 NS 0.0882
Rubisco* 14 247.879 18 312.009 0.91 0.487 0.0002 0.0187 0.5348

64
Table 2-4. P values for the quantum yield of PSII electron transport (Фet), the ratio of
variable to maximum fluorescence (Fv/Fm), and total carotenoids/ chl a. Bold values
indicate significance at α = 0.05 after bonferroni adjustment.
Source Фet Fv/Fm Carot./ Chl a
Depth (D) <.0001 0.0825 0.5864
Turbidity (T) <.0001 0.0004 0.0007
Mixing (M) 0.0838 0.1790 0.4071
Nutrients (N) 0.2238 0.1333 0.9778
D*T 0.7584 0.9958 0.9726
D*M <.0001 0.6323 0.4182
D*N 0.9042 0.4484 0.5149
T*M 0.6557 0.3282 0.4427
T*N 0.6878 0.7415 0.4922
M*N 0.8796 0.9279 0.7746
D*T*M 0.5749 0.8522 0.9700
D*T*N 0.7698 0.3519 0.7031
D*M*N 0.8263 0.6211 0.8353
T*M*N 0.7569 0.8066 0.9543
D*T*M*N 0.6971 0.0679 0.4182

65
Figures
Figure 2-1. Six sample sites in western Lake Erie

66
Figure 2-2. Diagram of experimental chambers of the 2x2x2x2 PSII efficiency
experiment. Arrows depict the flow of circulating water of mixed chambers.

67
Figure 2-3. In situ quantum yield of photosystem II electron transport for samples with a
phycocyanin concentration of greater than 0.5 μg L-1
from western Lake Erie measured at
the surface (bold black lines; circles), 1 meter (gray lines; triangles) and 3 and 5 meters
(thin black lines; squares) as a function of turbidity, as KPAR. Filled symbols and solid
lines are weakly mixed dates. Open symbols and dashed lines are strong mixing dates.

68
Figure 2-4. Light-response curves (A) and Fv/Fm (B) of Microcystis collected in western
Lake Erie on weakly mixed dates (filled symbols; solid lines) and strongly mixed dates
(open symbols; dashed lines). Values are mean ± SE of n = 15 for both mixing levels.

69
Figure 2-5. Photosynthetic efficiency of Microcystis from western Lake Erie at a given
light intensity of the light-response curve as a function of KPAR. Weakly mixed dates –
filled circles and solid lines; Strongly mixed dates – open circles and dashed lines. A).
Fv/Fm (dark adapted); B). 261 µmol m-2
s-1
(light saturation; Ik); C). 522 µmol m-2
s-1
(2x
Ik); D). 1044 µmol m-2
s-1
(4x Ik; half full sunlight).

70
Figure 2-6. KPAR half-saturation coefficient (Km) of the light-response curves for
Microcystis collected on strongly mixed days increases at higher light intensity, which
indicates turbidity has a larger effect on Фet at high light levels.

71
Figure 2-7. Pigment content of Microcystis collected from western Lake Erie as a
function of KPAR. A). Chlorophyll (chl) a; B). Phycocyanin; C). Total Caroteniods/ Chl
a; D). Phycocyanin / Chl a.

72
Figure 2-8. Total protein profile of Microcystis that had been separated from other
phytoplankton collected in western Lake Erie from five sample sites and on four dates
during 2008. Rubisco large sub-unit (52 kDa) is marked with an arrow.

73
Figure 2-9. Rubisco content of Microcystis increases with average PAR over the water
column.

74
Figure 2-10. In situ quantum yield of photosystem II electron transport (et) (A) and the
ratio of variable to maximum fluorescence (Fv/Fm) of Lake Erie phytoplankton grown in
laboratory conditions under natural sunlight intensities, high or low turbidity, and mixing
or calm water.

75
Figure 2-11. Total carotenoids/ Chl a of Lake Erie phytoplankton grown in the laboratory
experiment in low or high turbidity.

76
Figure 2-12. Turbidity (dashed line; filled circles), temperature (dotted line; open
triangles) and Microcystis biovolume (bold line; open squares) in western Lake Erie
during 2008. Arrows on represents dates sample that were strongly mixed. Dashed line
with no symbols corresponds to 0.16, the value that indicated light limitation (Alpine and
Cloern 1988). Values are the mean (± SE) of six sites.

77
Chapter Three
Measurements of Microcystis cellular health in western Lake Erie during the 2008 bloom
indicate the high turbidity and nutrients support rapid growth.
Abstract
Measurements of Microcystis biovolume collected from 2002 through 2008 show
that blooms are most dense in waters just outside of the Maumee Bay. The waters
adjacent to the bay are generally high in nutrients and suspended sediments. Light-
limitation may occur in these waters due to the combination of high turbidity and
increasing depth, providing a potential ecological advantage for buoyant phytoplankton
species, such as Microcystis over non-buoyant species. Microcystis was collected from
western Lake Erie during the 2008 bloom for measurements of total protein content and
nutrient content to determine physiological health. The results of lake sampling indicates
that Microcystis cellular health is greater in the highly turbid, light-limiting conditions
adjacent to Maumee Bay waters compared to clearer offshore waters. Nutrient content of
Microcystis suggest that Microcystis was nitrogen replete and phosphorus limited, but not
extremely deficient. Further, in a laboratory experiment, Microcystis growth was greatest
in the high nutrient, high turbidity treatment. Other combinations of nutrients and
turbidity resulted in less Microcystis growth. The combination of high nutrients and high
turbidity of the waters adjacent of the Maumee Bay provide Microcystis not only an

78
ecological advantage in light competition, but also, offers condition that favors rapid
growth and cellular health.
Introduction
Microcystis blooms were a relatively small proportion of the Lake Erie
phytoplankton community prior to the 1990s (Makarewicz 1993). Since the mid 1990s,
total phytoplankton biomass has increased and Microcystis blooms have returned to
western Lake Erie, despite an increase in annual nutrient loading (Conroy et al. 2005;
Brittian et al. 2000). Microcystis blooms in western Lake Erie are a concern because of
their ability to produce a hepatotoxin (Microcystin) in concentrations that frequently
surpasses the World Health Organization‟s safety limit of 1 μg L-1
in western Lake Erie
(Brittian et al. 2000; Rinta-Kanto et al. 2005; Dyble et al. 2008).
Western Lake Erie is an ideal location for Microcystis growth because of high
nutrients and high turbidity (Moorhead et al. 2008). Total phosphorus concentration of
Maumee Bay is usually greater than 0.100 mg L-1
and concentration decreases with
distance into the lake (Moorhead et al. 2008). The potential for bloom formation
increases with increasing TP and plateaus at about 80% once TP reaches 0.100 mg L-1
(Downing et al. 2001). High concentrations of suspended sediments may bring about
phytoplankton light-limitation (Alpine and Cloern 1988) favoring buoyant Microcystis in
light-limited calm waters (Huisman et al. 2004). The Maumee River is a source of
nutrients and suspended sediments to Maumee Bay and western Lake Erie because of its
highly agricultural watershed (Baker and Richards 2002; Richards et al. 2008). Shallow
lakes allow sediments and nutrients to be resuspended from the lake bottom by wind-

79
driven currents (Søndergaard et al. 2003). Thus, due to the shallow depth of Maumee
Bay and western Lake Erie, internal loads of sediments may also generate turbidity.
Field sampling of previous Microcystis blooms in western Lake Erie lead to observations
that suggest that the spatial extent of a bloom follows the spatial pattern of the suspended
sediment plume. Conditions in the sediment plume include high nutrients that fertilize
Microcystis and high turbidity that protects Microcystis from high light and light-limit the
water column (see Chapter 2), while waters outside the sediment plume have lower
nutrient concentrations and less turbidity. Based on nutrient and light conditions, I
hypothesized that Microcystis in the sediment plume would have a better cellular health
compared to Microcystis in waters outside of the sediment plume.
Cyanobacteria are poor competitors for nutrients compared to green algae and
diatoms (Tilman et al. 1986). Thus, Microcystis should be out-competed for nutrients in
nutrient-limited lakes. However, Microcystis is able to store excess phosphorus in waters
that have total phosphorus concentrations greater than 0.220 mg L-1
(Baldia et al. 2007),
to sustain a constant rate of cell growth for five (Tsukada et al. 2006) to nine days
(Nalewajko and Murphy 2001). Likewise, eukaryotic algae are also capable of luxury
uptake in nutrient rich waters and phosphorus can make up 11% of total dry weight
(Ducobu et al. 1998). If nitrogen is depleted in waters, cyanobacteria are able to break
down phycobiliproteins and allocate nitrogen to other compounds (Post 2005); however,
Microcystis can only sustain growth for one day following nitrogen deprivation (Baldia et
al. 2007). In the case of western Lake Erie, I hypothesized that Microcystis accumulates
phosphorus in the nutrient rich bay before currents carry the cells into the relatively
nutrient-poor offshore water. This hypothesis would be supported if Microcystis is found

80
to have a similar internal phosphorus content in the nearshore vs. offshore despite large
differences in ambient dissolved phosphorus concentrations. I further hypothesized that
Microcystis’ inability to store nitrogen would result in lower internal nitrogen content in
the relatively low total nitrogen offshore region.
Plankton samples were collected from six sites in western Lake Erie as a part of
an on-going monitoring program established during 2002 at the Lake Erie Center
(University of Toledo, Toledo, Ohio, USA). Microcystis colonies retained in those
samples were measured to determine if there was a spatial pattern to Microcystis blooms
in western Lake Erie. During the summer of 2008, I sampled of the annual Microcystis
bloom to measure physiological parameters (i.e. nutrient content, and total protein
content) that would help explain any spatial pattern observed in the seven years of
sampling. If any spatial pattern of Microcystis density was observed, my hypothesis was
that Microcystis collected during 2008 would have higher cellular health in regions that
Microcystis is most abundant. The null hypothesis would be that cellular health
parameters would not show differences among sites.
Further, this chapter presents a factorial Microcystis growth laboratory experiment
with four treatments and two levels in each treatment. Turbidity and nutrients (high and
low) were used to study the effect of suspended sediments and nutrient concentrations
typical of the bay and offshore. Mixing (mixed or calm) and sample depth (surface or at
depth) were used to study the effect of water column turbulence on the buoyancy
capabilities of Microcystis. It was hypothesized that Microcystis biomass would be
greatest at the surface in the high nutrient and high turbidity treatment, while Microcystis
biomass would be lowest in the clear, low nutrients, and mixed treatment.

81
Methods
Spatial Pattern of Microcystis
To determine if there was a spatial pattern of Microcystis, plankton tow samples
were analyzed that were collected from 2002 to 2008 from six sites in western Lake Erie
(Fig. 3-1). Microcystis and other plankton were collected using a 112 µm mesh plankton
net over the entire water column. Plankton retained in the net was preserved in buffered-
sugar formalin. Microcystis was separated from other phytoplankton using Imhoff cones
and biovolume of Microcystis was used as an estimate of biomass (as in Chaffin et al.
2008).
Health Status of Microcystis
For physiological measurements to be made in the laboratory, Microcystis was
collected over the entire water column from five sites in western Lake Erie using a 64 μm
mesh plankton net on four dates between August 6 and September 1 2008 (Fig. 3-1).
During these dates, Microcystis biomass steadily increased. An additional site (MB20)
was sampled for nutrients, but Microcystis was not abundant enough there to collect for
physiological measurements. Water from all six sites was collected at 1 m to determine
nutrient concentration of lake water. Water was filtered through a 0.45 μm Millipore
filter for soluble nutrients (nitrate, nitrite, ammonium, soluble reactive phosphorus) while
unfiltered water was used for total phosphorus and total kjeldahl nitrogen analyses.
Filtered and unfiltered samples were sent to the National Center for Water Quality
Research at Heidelberg University for analysis. Microcystis colonies retained in the net
were concentrated and stored in dark polyethylene bottles on ice during transportation
back to the laboratory. Upon arrival at the laboratory, the Microcystis samples were
82
separated from other phytoplankton using Imhoff cones and stored at -80 °C as in chapter
two of this thesis.
Total protein content is an indicator of cellular health. Protein of Microcystis was
extracted by grinding approximately 1 g of fresh weight tissue to a powder in liquid
nitrogen using mortar and pestle, then transfering to a protein extraction buffer containing
0.1 M Tris buffer (pH = 8.0), SDS detergent, glycerol, bromophenol-blue, sucrose,
protease inhibitors, a phenolic inhibitor, and reductants (Mishra et al. 2008). Samples
were then centrifuged at 15,000 g for 10 minutes at 4 ° C. Supernatant containing soluble
proteins was collected and total protein content was determined using the method of
Peterson (1977), and quantified using a standard curve of Bovine Serum Albumin and
corrected for dry mass.
Carbon (C) and nitrogen (N) content was determined on 3.1- 3.7 mg of dried
Microcystis tissue. Tissue was placed in foil and percentage of C and N were measured
by gas-chromatography following combustion (HCNO/S analyzer Perkin-Elmer 2400
series II). Acetanilide was used as a standard, with errors of -0.27% and 0.01 % for C
and N respectively. Phosphorus (P) and other macronutrients and micronutrients content
were determined by ICP-OES on 100 to 200 mg of dried tissue. Nutrient deficiencies
were indicated by atomic ratios shown in Table 3-1 (Healey and Hendzel 1975).
Laboratory Experiment
A 2x2x2x2 factorial experiment was used to test the effects of nutrient
concentration [low (0.6 mg L-1
N, 0.03 mg L-1
P) and high (3.0 mg L-1
N, 0.15 mg L-1
P)],
turbidity [low (~ 1 NTU) and high (~30 NTU)], mixing (vertically mixed or non-mixing)
and sample depth (surface and at depth) on Microcystis growth. Mixing of the chamber

83
was achieved using powerhead pumps (Aquagardens #601) so that the intake hose was
placed at the bottom of the chamber and outflow just beneath the surface (Fig. 3-2).
Sieved Lake Erie sediments (400 µm) were added to create turbidity. All other nutrients
were half concentration of the WC media (Guillard and Lorenzen 1972). Twiss et al.
(2005) enriched Lake Erie water with micronutrients to a final concentration similar of
the WC growth media and observed no additional phytoplankton growth.
Chlamydomonas (a common unicellular green alga) and Microcystis were grown
separately in WC liquid medium (Guillard and Lorenzen 1972) under illumination of ~50
µmol m-2
s-1
on 12:12 hour light/dark cycles. Chlamydomonas was aerated while
Microcystis was not. Chlamydomonas and Microcystis were initially collected from Lake
Erie. Equal amounts of Chlamydomonas and Microcystis were used in this experiment,
based on content of chl a. Chlamydomonas and Microcystis were added so that they each
had an initial level chlorophyll (chl) a of 2.5 µg L-1
, making the total initial concentration
5.0 µg L-1
. Phytoplankton intended for experiment was grown in liquid culture with the
nutrient concentration that of the low treatment level for two weeks before use in the
experiment, to insure that internal phosphorus storage did not occur.
Once treatments were set up and phytoplankton added, 96 hours were allowed for
growth. Following the 96 hours, samples were collected at the surface and 70 cm. The 70
cm sample represents the 20% of surface light in the low turbidity level and < 0.5 % in
the highly turbid treatment. Phytoplankton (100 ml) was filtered onto GF/F filters and
stored on silica gel at -80 °C until pigment concentration was measured. Chl a was used
as a surrogate for total algal biomass, phycocyanin (PC) as an index of Microcystis

84
abundance, and chl b for green algae. Chl a and b were extracted in DMSO and PC
extracted by sonication following methods in chapter two.
Data Analysis
Total protein and nutrient content were analyzed using repeated measures
ANOVA with PROC MIXED of SAS with sample date as repeated variable and sample
site as fixed effect. Tukey test was performed for difference among sites. A four-way
ANOVA was performed for the laboratory experiment. PROC GLM of SAS was used
and Tukey was used to compare differences between treatments.
Results
Spatial Pattern of Microcystis
Microcystis biovolume was highly temporally and spatially variable between
2002 and 2008 (Table 3-2). On the temporal scale, lowest biovolumes were recorded
during 2002 and highest average biovolumes during 2008, while the greatest value was
recorded during 2003 at 7M. Spatially, across all years, MB20 had the lowest biovolume,
while 7M and 8M had the highest. 4P had more Microcystis biovolume than GR1, and
4P biovolumes are correlated with 7M.
Lake Nutrient Concentration
Total phosphorus (TP) ranged from 0.50 to 0.90 mg L-1
and decreased with
distance from the river (Fig. 3-3a,b). Soluble reactive phosphorus (SRP) concentrations
were 13% to 33% of the TP concentration and show similar patterns over space and time
as did TP. Nitrate (NO3-N) was high during May through early July (lake mean about 2.0
mg L-1
), then was nearly depleted by the end of the sampling season and also showed the

85
same spatial pattern of decreasing with increasing distance from river mouth (Fig. 3-
3c,d). Ammonium (NH4-N) was more or less constant throughout the season (0.025 mg
L-1
) and did not have a spatial pattern (Fig. 3-3c,d). The ratio of total N: total P (TN:TP)
was around 35 (mass) during the first half of the season then dropped as NO3 became
depleted during August (Fig. 3-3e,). TN:TP was similar at all sites (Fig. 3-3f).
Health Status of Microcystis
Total protein content (TPC) was used as a measure of cellular health. TPC was
significantly affected by sample site (F(4,12) = 3.26; F* = 5.01, p = 0.0131) and sample
date (F(3,12) = 3.49; F* = 4.66, p = 0.0222). Microcystis collected from 8M and 7M had
significantly greater TPC than Microcystis from GR1 and 4P (Fig. 3-4). The bay site had
mean protein content slightly less than the middle sites, but Tukey test indicated that
MB18 was similar to all other sites (Fig. 3-4). The significant date effect can be
attributed to the variation observed in the bay and two middle sites, and resulted in a
general increase of TPC over the summer. There was while little variation in TPC in the
offshore waters over the summer sampling.
Carbon (C) content of Microcystis ranged from 45.65% to 49.91% and nitrogen
(N) ranged from 6.31% to 9.16%. Phosphorus (P) was more variable ranging from
0.52% to 1.25%. The atomic ratios of C to N (C:N) and C to P (C:P) were used indicate
nutrient deficiencies. Sample date had a statistically significant effect on both C:N and
C:P (F(3,12) = 3.49; F* = 8.29, 3.15, respectively; p = 0.0030, 0.0494, respectively), while
sample location did not have an effect (F(4,12) = 3.26; F* = 2.22, 0.88, respectively; p =
0.1285, 0.5033, respectively). Figure 3-5 shows the plot of C:N vs. C:P. The thin dashed
lines represent the boundary between no deficiency and moderate deficiency, while the

86
bold lines indicate the boundary between moderate and extreme deficiency. In terms of
N, 19 of 20 samples were N-replete, only once did Microcystis have a slight moderate N-
deficiency (August 12 at 8M). Moderate P-deficiency was measured in a majority of the
Microcystis samples. Further, Microcystis collected from the middle sites (8M and 7M)
had the lowest C:P on most sampling trip (Fig. 3-6).
Laboratory Experiment
Chl a in the laboratory experiments ranged from 15.58 to 33.22 µg L-1
(Table 3-
3). Chl a was significantly affected by the three-way interaction of
depth*mixing*nutrients (F* = 5.09; p = 0.0311) and by turbidity (F* = 4.88; p = 0.0344)
(Table 3-4). PC ranged from 0.49 to 9.89 µg L-1
(Table 3-3) and was significantly
affected by depth*mixing (F* = 41.23; p <.0001) and nutrients (F* = 4.61; p = 0.0395)
(Table 3-4). The interaction between turbidity and nutrients was nearly statistically
significant (F* = 3.99; p = 0.0543). Chl b varied little among treatments (Table 3-3) and
no factors had significant effects (Table 3-4).
Mixing had the greatest effect on chl a and PC. At the surface of the calm
treatment, chl a and PC was statistically greater than all other combinations of depth and
mixing (Tukey test, p < 0.0001 for all pair-wise comparisons of surface*calm to other
combinations). In the calm treatments, the concentrations of chl a and PC were much
higher at the surface than at depth, as result of Microcystis concentrating at the surface
(Table 3-3). Within the calm*surface treatment, chl a was greater in the high nutrient
treatment (Tukey test, p = 0.0053). All other combinations of comparison (excluding
calm*surface) were nearly identical (Tukey test, p > 0.89). In the mixing treatment, the
surface and 70 cm sample had nearly identical concentrations of chl a and PC (Table 3-

87
3). The mixed treatments had much less PC and more chl b, and chl b was greater in the
low turbidity treatment than the high turbidity treatment across turbidity levels of the
mixed treatments (Table 3-3).
The interaction between turbidity and nutrients is evident within the calm
treatment, at the surface (although not statistically significant when considering the
mixed treatments and depth samples). At low turbidity, nutrients did not have an effect
on either chl a or PC (Fig. 3-7). At high turbidity, concentrations of chl a and PC were
greater in the high nutrient treatment (Fig. 3-7).
Discussion
Microcystis biomass was highly variable among the seven years of data collection
(Table 3-2). Microcystis did show a distinct spatial pattern in western Lake Erie, with
low biomass of Microcystis found in the bay, highest biomass at the middle sites and
slightly less or similar biomass in the offshore (Table 3-2). This pattern can be explained
by several observations. First, the region that is intermediate between Maumee Bay and
the open waters of the western basin of Lake Erie (designated here as “Middle”), often
has the lowest photic depth to lake depth ratio. In the Middle region, Microcystis would
have an advantage in the competition for light over sinking phytoplankton (Huisman et
al. 2004). The shallow bay would have a higher photic depth to lake depth ratio; also
shallow waters are more likely to be mixed, which prevent Microcystis blooms (Huisman
et al. 1999). However, Microcystis might actually have very rapid growth in the bay
sites, but the short retention time of the bay may be simply pushing Microcystis to the
offshore before high biomasses can be accumulated.

88
Total protein content (TPC) was greatest at the two middle sites (Fig. 3-4), which
suggests that Microcystis from these sites have a higher overall cellular health compared
to offshore waters. The trend of higher TPC in the bay and middle waters can be
explained by two factors. First, nutrient concentration is very high in the bay and
adjacent waters and decreases with distance into the lake (Fig 3-3; Moorhead et al. 2008).
High concentrations of soluble nutrients in the bay and middle region would result in
healthier Microcystis and more growth. Secondly, Microcystis from turbid waters has
less light stress compared to Microcystis in clear water (chapter 2). The combination of
high nutrient and high turbidity in the bay and adjacent waters would have provided
favorable conditions for Microcystis growth. There was also a general increasing of
TPC, which resulted in the statistically significant date effect. Microcystis from the
second half of sampling dates was collected when the water column was strongly mixed.
In an effort to try to maintain position in the upper layer of the mixed water, Microcystis
will produce more gas vacuoles as a response to lower average light intensities (Walsby
1994). When Anabaena was grown at low light, gas vacuoles proteins can make up
nearly 10% of all cellular proteins (Oliver and Walsby 1984).
No N-deficiency was seen in Microcystis during 2008, despite the low TN:TP
ratios. The NO3 supply decreased nearly 50-fold throughout the summer, but NH4
remained more or less stable and was above 0.025 mg L-1
for the entire summer. This
would suggest that NH4 of 0.025 mg L-1
would be adequate to support an intense
Microcystis bloom. This would follow the observations of Jacoby et al. (2000) who
reported that NH4 of 0.007 mg L-1
was able to support a Microcystis bloom in Steilacoom
Lake (Washington, USA), while NO3 had became depleted. Microcystis is not a nitrogen

89
fixer. Therefore, according to traditional TN:TP models, Microcystis should not be able
to persist at low TN:TP because N-fixing cyanobacteria would out-compete non-N fixers
(Smith 1983). During 2008, the NH4 proportion was 2.4% to 4.7% of the TN. Thus,
TN:TP ratios may not apply in lakes with adequate NH4, or because a high propitiation of
the TP might actually be stored in the algae.
Microcystis was generally moderately P-deficient (Fig. 3-5). However,
Microcystis from the middle sites was less P-deficient than the offshore sites on each
sample date (Fig. 3-6), although this was not statistically supported. Lake total
phosphorus concentrations decreased with distance from the river mouth and increased
from July to September (Fig. 3-3a,b). Microcystis is capable of luxury uptake when
grown in phosphorus-rich waters (Baldia et al. 2007; Tsukada et al. 2006; Nalewajko and
Murphy 2001). Because P was higher at the middle sites than the offshore, this did not
support my hypothesis that phosphorus accumulated in the nearshore sustains Microcystis
growth in the lower nutrient, offshore waters. Microcystis growth is linear with
phosphorus concentrations up to 220 g L-1
(Baldia et al. 2007), which is greater than
phosphorus concentrations of the bay. Therefore, Microcystis remains phosphorus limited
in western Lake Erie and reduction in phosphorus loading would further increase the
phosphorus deficiency and slow growth.
In the laboratory experiment, mixing of the chambers resulted in much less
Microcystis and more green algae (Table 3-3). Highly turbid, mixed treatments had less
chl a than did low turbidity, mixed treatments. This would indicate light limitation in the
mixed and turbid treatments. In the high turbidity treatments, the lack of mixing allowed
Microcystis to float to the surface access light and preventing light-limitation. These

90
findings agree with the modeling work of Huisman et al. (1999, 2004) who showed that
buoyant phytoplankton will dominate calm waters, while mixed waters will result in less
of the buoyant species and more of the sinking species. Microcystis growth is prevented
in mixing waters (Reynolds et al. 1984).
Chl a and PC were greatest at the surface of the calm treatments. This would
indicate a Microcystis surface bloom. Within these surface blooms, Microcystis was
most abundant in the high turbidity and high nutrient treatments (Fig. 3-7). While other
combinations of nutrients and turbidity resulted in lower Microcystis growth. This would
suggest that turbidity and nutrients are equally important in determining the magnitude of
a Microcystis surface bloom, because high nutrients alone did not increase Microcystis.
The high turbidity in the calm treatments allowed Microcystis to float to the surface to
access light, while the green algae would have remained light-limited. Microcystis is a
poor competitor for nutrients, and therefore would be expected to be out-competed for
limiting nutrients (Tilman et al. 1986). Microcystis compensates for this by being highly
competitive for light in calm light-limited waters. In this experiment, Microcystis was
able to use the nutrients in the high turbidity treatment because green algal growth was
prevented.
In western Lake Erie, the combination of high nutrients and high turbidity allows
Microcystis to reach great biomasses. Microcystis is most abundant at middle sites where
the ratio of photic depth to lake depth is lowest. Here, buoyant Microcystis has an
advantage in the competition for light when the water column is calm. The hypothesis
that the Middle region is best-suited for Microcystis growth is supported by results
indicating that Microcystis in the Middle region had greater total protein content and less

91
phosphorus deficiency than Microcystis in the offshore, and that high turbidity in the
Middle region is photo-protective (Chapter 2). These measurements show that
Microcystis at the middle sites are healthier than that of the offshore and explain why
Microcystis is most dense in these regions of western Lake Erie.
Management efforts that seek to suppress Microcystis blooms could potentially
take the approach of changing the conditions of the middle regions of western Lake Erie
need to be more like that of the offshore, where light and nutrient stress is the greatest.
Best-management land-use practices for agriculture in the Maumee River watershed can
target the loading of suspended sediments and nutrients for terrestrial sources. These
would include no-tillage and conservation tillage, buffer strips along ditches, and
remediation of wetlands. Although these practices will be beneficial in the long term for
reducing Microcystis blooms, there may be a lag-time before improvements are observed
because there may be a high rate of internal loading of suspended sediments and nutrients
from the lake sediments (Visser et al. 2005).
The bloom of 2008 started in clear water during late July (Chapter 2). TP
concentrations in western Lake Erie were high in early July (Fig. 3-3), while the water
column was still clear. Microcystis biomass increased with turbidity (Chapter 2) that also
corresponded to an increase of TP (Fig. 3-3). Therefore, because Microcystis first
appeared in clear water with high TP, then TP might be a better predictor to when a
bloom will occur. The magnitude of the bloom might be best predicted based on the
combination of turbidity and TP, because in the laboratory experiment, Microcystis
biomass was greatest in the high turbidity and high nutrient treatment. Hence, if
sediment loads are reduced, Microcystis may not be able to take advantage of the high

92
concentration of nutrients because sinking phytoplankton would have access to light in
clear water and out-compete Microcystis for phosphorus.
Literature Cited
Alpine, A. E., and J. E. Cloern. 1988. Phytoplankton growth-rates in a light-limited
environment, San Francisco bay. Marine Ecology-Progress Series 44: 167-173.
Baker, D.B., and Richards, R.P. 2002. Phosphorus budgets and riverine phosphorus
export in northwestern Ohio watersheds. Journal of Environmental Quality 31(1):
96-108.
Baldia, S.F., Evangelista, A.D., Aralar, E.V., and Santiago, A.E. 2007. Nitrogen and
phosphorus utilization in the cyanobacterium Microcystis aeruginosa isolated
from Laguna de Bay, Philippines. Journal of Applied Ecology. 19(6): 607-613.
Brittain, S.M., Wang, J., Babcock-Jackson, L., Carmichael, W.W., Rinehart, K.L., and
Culver, D.A. 2000. Isolation and characterization of microcystins, cyclic
heptapeptide hepatotoxins from a Lake Erie strain of Microcystis aeruginosa.
Journal of Great Lakes Research 26(3): 241-249.
Chaffin, J. D., Bridgeman, T. B. and Filbrun, J. E. 2008. Quantification of Microcystis sp.
blooms in western Lake Erie (2002-2007) and relation to tributary flow.
Conference presentation. International Association of Great Lakes Research.
Petersburg Ontario, Canada.

93
Conroy, J.D., Kane, D.D., Dolan, D.M., Edwards, W.J., Charlton, M.N., and Culver,
D.A. 2005. Temporal trends in Lake Erie plankton biomass: Roles of external
phosphorus loading and dreissenid mussels. Journal of Great Lakes Research 31:
89-110.
Downing, J.A., Watson, S.B., and McCauley, E. 2001. Predicting Cyanobacteria
dominance in lakes. Canadian Journal of Fisheries and Aquatic Sciences 58(10):
1905-1908.
Ducobu, H., Huisman, J., Jonker, R.R., and Mur, L.R. 1998. Competition between a
prochlorophyte and a cyanobacterium under various phosphorus regimes:
Comparison with the Droop model. Journal of Phycology 34(3): 467-476.
Dyble, J., Fahnenstiel, G.L., Litaker, R.W., Millie, D.F., and Tester, P.A. 2008.
Microcystin concentrations and genetic diversity of Microcystis in the lower
Great Lakes. Environmental Toxicology 23(4): 507-516.
Guillard, R. R. L. and Lorenzen, C. J. 1972. Yellow-green algae with chlorophyllide c.
Journal of Phycology. 8:10-14
Healey, F.P. and Hendzel, L.L. 1975. Indicators of phosphorus and nitrogen deficiency in
five algae cultures. Canadian Journal of Fisheries and Aquatic Sciences 36: 1364-
1369.

94
Huisman, J., Sharples, J., Stroom, J.M., Visser, P.M., Kardinaal, W.E.A., Verspagen,
J.M.H., and Sommeijer, B. 2004. Changes in turbulent mixing shift competition
for light between phytoplankton species. Ecology 85(11): 2960-2970.
Huisman, J., van Oostveen, P., and Weissing, F.J. 1999. Species dynamics in
phytoplankton blooms: Incomplete mixing and competition for light. American
Naturalist 154(1): 46-68.
Jacoby, J.M., Collier, D.C., Welch, E.B., Hardy, F.J., and Crayton, M. 2000.
Environmental factors associated with a toxic bloom of Microcystis aeruginosa.
Canadian Journal of Fisheries and Aquatic Sciences 57(1): 231-240.
Makarewicz, J.C. 1993. Phytoplankton biomass and species composition in Lake Erie,
1970 to 1987. Journal of Great Lakes Research 19(2): 258-274.
Mishra, S., Heckathorn, S.A., Barua, D., Wang, D., Joshi, P., Hamilton, E.W., and Frantz,
J. 2008. Interactive Effects of Elevated CO2 and Ozone on Leaf Thermotolerance
in Field-Grown Glycine max. Journal of Integrative Plant Biology 50(11): 1396-
1405.
Moorhead, D., T. B. Bridgeman, and J. Morris. 2008. Changes in water quality of
Maumee Bay 1928 – 2003. In: Checking the pulse of Lake Erie. Editors
Munawar, M and Heath, R. Goodword Books.

95
Nalewajko, C. and T. P. Murphy. 2001. Effects of temperature, and availability of
nitrogen and phosphorus on the abundance of Anabaena and Microcystis in Lake
Biwa, Japan: an experimental approach. Limnology 2:45-48.
Oliver, R.L., and Walsby, A.E. 1984. Direct evidence for the role of light-mediated gas
vesicle collapse in the buoyancy regulation of Anabaena flos-aqua
(Cyanobacteria). Limnology and Oceanography 29(4): 879-886.
Peterson, G.L. 1977. A simplification of the protein assay of Lowry et al. which is
generally applicable. Analytical Biochemistry. 83(2): 346-356.
Post. A. F. 2005. Nitrogen limitation in cyanobacteria. In Harmful Cyanobacteria. Editors
Huisman, J., Matthijs, H. C. P., and Visser, P. M. Springer Press. Netherlands.
Reynolds, C.S., Wiseman, S.W., and Clarke, M.J.O. 1984. Growth-rate and loss-rate
responses of phytoplankton to intermittent artificial mixing and their potential
application to the control of planktonic algal biomass. Journal of Applied Ecology
21(1): 11-39.
Richards, R.P., Baker, D.B., Crumirine, J.P., Kramer, J.W., Ewing, D.E., and Merryfield,
B.J. 2008. Thirty-year trends in suspended sediment in seven Lake Erie
tributaries. Journal of Environmental Quality 37(5): 1894-1908.
Rinta-Kanto, J.M., Ouellette, A.J.A., Boyer, G.L., Twiss, M.R., Bridgeman, T.B., and
Wilhelm, S.W. 2005. Quantification of toxic Microcystis spp. during the 2003 and

96
2004 blooms in western Lake Erie using quantitative real-time PCR.
Environmental Science & Technology 39(11): 4198-4205.
Smith, V.H. 1983. Low nitrogen to phosphorus ratios favor dominance by blue-green-
algae in lake phytoplankton. Science 221(4611): 669-671.
Søndergaard, M., Jensen, J.P., and Jeppesen, E. 2003. Role of sediment and internal
loading of phosphorus in shallow lakes. Hydrobiologia 506(1-3): 135-145.
Tilman, D., Kiesling, R., Sterner, R., Kilham, S.S., and Johnson, F.A. 1986. Green,
bluegreen and diatom algae - Taxonomic differences in competitive ability for
phosphorus, silicon and nitrogen. Archiv Fur Hydrobiologie 106(4): 473-485.
Tsukada, H., Tsujimura, S., and Nakahara, H. 2006. Effect of nutrient availability on the
C, N, and P elemental ratios in the cyanobacterium Microcystis aeruginosa.
Limnology 7(3): 185-192.
Twiss, M.R., Gouvea, S.P., Bourbonniere, R.A., McKay, R.M.L., and Wilhelm, S.W.
2005. Field investigations of trace metal effects on Lake Erie phytoplankton
productivity. Journal of Great Lakes Research 31: 168-179.
Visser, P. M., Ibelings, B. W., Mur, L. R., and Walsby, A. E. 2005. Ecophysiology of
Microcystis. In Harmful Cyanobacteria. Editors Huisman, J., Matthijs, H. C. P.,
and Visser, P. M. Springer Press. Netherlands
Walsby, A.E. 1994. Gas vesicles. Microbiological Reviews 58(1): 94-144.

97
Tables
Table 3-1. Criterion for algal nutrient deficiency based on atomic ratios (Healey and
Hendzel 1975).
Nutrient Atomic Ratio
No Deficiency
Moderate Deficiency
Extreme Deficiency
Nitrogen C:N < 8.3 8.3-14.6 > 14.6
Phosphorus C:P < 129 129-258 > 258

98
Table 3-2. Average and maximum values of Microcystis biovolume (ml m-2
) recorded at
six sites in western Lake Erie from 2002- 2008. Number of plankton samples collected
from July 1 to October 15 is in parenthesis next to the mean. * “Too much Microcystis to
collect” was recorded on data sheets for 8M during 2003.
Year Site MB20 MB18 8M 7M GR1 4P
2002
Mean 1.5 (1) 10.7 (3) 16.6 (4) 28.6 (7) 6.3 (4) 9.0 (6)
Max. 1.5 16.6 63.3 67.3 19.1 20.4
2003
Mean 20.4 (1) 0.0 (2) 58.7 (3) 218.8 (7) 53.8 (5) 185.4 (7)
Max. 20.4 0.0 173.5* 892.9 119.9 632.7
2004
Mean 10.4 (7) 35.2 (7) 177.9 (7) 126.5 (7) 49.5 (7) 22.8 (7)
Max. 23.0 58.7 332.1 311.2 105.9 74.0
2005
Mean 4.7 (6) 11.4 (6) 87.5 (5) 59.2 (7) 9.1 (5) 6.4 (7)
Max. 10.2 25.5 324.0 188.8 21.7 20.4
2006
Mean 3.2 (5) 17.6 (5) 57.3 (5) 42.6 (5) 54.0 (5) 63.5 (5)
Max. 7.7 40.8 149.2 125.0 118.6 176.0
2007
Mean 12.6 (5) 38.1 (5) 99.0 (5) 17.9 (5) 26.4 (5) 11.2 (6)
Max. 51.8 135.2 267.9 42.1 89.3 16.6
2008
Mean 104.1 (6) 122.2 (7) 224.6 (7) 206.2 (7) 157.9 (7) 252.3 (7)
Max. 295.9 229.6 591.8 413.3 359.7 665.8

99
Table 3-3. Pigment concentration (g L-1
) of the experiment. Values are mean ( SE) n=3.
Depth Mixing Turbidity Nutrients Chlorophyll a Phycocyanin Chlorophyll b
Surface No High High 33.22 (2.43) 9.89 (0.60) 3.73 (1.98)
Surface No High Low 23.46 (1.62) 4.55 (2.67) 4.10 (0.99)
Surface No Low High 27.81 (0.15) 5.97 (0.29) 3.08 (0.48)
Surface No Low Low 26.17 (3.63) 5.48 (1.03) 2.90 (0.70)
Surface Yes High High 15.42 (0.12) 1.47 (0.55) 3.68 (0.49)
Surface Yes High Low 15.56 (0.71) 1.04 (0.36) 3.61 (0.38)
Surface Yes Low High 17.76 (1.18) 1.19 (0.30) 3.87 (0.23)
Surface Yes Low Low 17.18 (0.68) 1.37 (0.40) 3.88 (0.34)
70 cm No High High 16.12 (0.76) 0.73 (0.19) 2.80 (1.29)
70 cm No High Low 16.97 (0.88) 0.41 (0.07) 3.13 (0.54)
70 cm No Low High 18.92 (0.96) 1.27 (0.61) 3.85 (0.72)
70 cm No Low Low 19.08 (0.77) 1.38 (0.56) 3.83 (0.71)
70 cm Yes High High 16.52 (0.46) 1.01 (0.37) 2.72 (0.93)
70 cm Yes High Low 15.58 (0.77) 0.49 (0.04) 2.56 (0.95)
70 cm Yes Low High 18.85 (0.99) 0.99 (0.15) 3.63 (0.33)
70 cm Yes Low Low 19.30 (1.33) 0.96 (0.10) 4.10 (0.82)

100
Table 3-4. P values for pigment concentration. Bold values indicate significance at α =
0.05.
Source Chl a PC Chl b
Depth (D) <.0001 <.0001 0.5174
Turbidity (T) 0.0344 0.7613 0.4137
Mixing (M) <.0001 <.0001 0.8518
Nutrients (N) 0.0488 0.0395 0.8216
D*T 0.0885 0.1338 0.1125
D*M <.0001 <.0001 0.6000
D*N 0.0324 0.1051 0.8853
T*M 0.1660 0.5369 0.3839
T*N 0.1525 0.0543 0.9606
M*N 0.0966 0.1089 0.9421
D*T*M 0.3237 0.2073 0.6380
D*T*N 0.2333 0.1644 0.8277
D*M*N 0.0311 0.0739 0.9375
T*M*N 0.2293 0.1988 0.6421
D*T*M*N 0.0568 0.1872 0.9160

101
Figures
Figure 3-1. Six sample sites in western Lake Erie

102
Figure 3-2. Diagram of experimental chambers of the 2x2x2x2 Microcystis growth
experiment. Arrows depict the flow of circulating water of mixed chambers.

103
Figure 3-3. Phosphorus and nitrogen concentrations of western Lake Erie during 2008. A,
C, and E are mean ± s.e for date from all sample sites. B, D, and F are sample site mean ±
s.e for all sampling dates during 2008. Error bars of A and C are off-set for ease in
viewing. A & B) Total Phosphorus (TP; filled circles, filled bars) and soluble reactive
phosphorus (SRP; open circle, open bars). C & D) Nitrate (NO3-N; filled squares, filled

104
bars) and Ammonium (NH4-N; open triangles, open bars). Note NH4-N values on D are
x10. E & F) Total nitrogen: Total phosphorus ratio (by mass), dashed line represents 29,
the value below which nitrogen-fixing species become favored (Smith 1983).

105
Figure 3-4. Higher total protein content (dry mass basis) of Microcystis collected from
nearshore waters of western Lake Erie indicates greater cellular health than the offshore.
Letters represent groups of significant difference based on Tukey test (α = 0.05). Sites
are arranged with increasing distance from the Maumee River.

106
Figure 3-5. Nutrient content of Microcystis as atomic ratios of carbon to nitrogen and
carbon to phosphorus. Bold line corresponds to the boundary of no deficiency and
moderate deficiency and dotted lines the boundary of moderate and extreme deficiency.
Vertical lines represent nitrogen and horizontal lines for phosphorus. Only one
Microcystis sample was slightly nitrogen deficient, while phosphorus deficiency was seen
frequently. Criterion for deficiency is given in Table 3-1.

107
Figure 3-6. Phosphorus deficiency in Microcystis in western Lake Erie.

108
Figure 3-7. Chlorophyll a (A) and phycocyanin (B) concentration at the surface of the
calm treatment. At low turbidity, nutrient concentration did not have an effect, but high
turbidity increased Microcystis growth.

109
Chapter Four
Conclusions
Buoyancy gives Microcystis an ecological advantage in calm turbid water because
it is able to access light and shade sinking phytoplankton. However, this ecological
advantage comes at a physiological price because Microcystis collected from calm water
had more photosynthetic damage than Microcystis collected from mixed water. Thus,
there is an eco-physiological trade-off for being highly competitive for light and
photosynthetic damage. My field measurements suggest that sediment plumes, generated
by rivers or lake bottom resuspension, mitigate photo-inhibitation. Further, Microcystis
also had a lower content of carotenoids in turbid water, which further supports that
turbidity creates a favorable light environment. Microcystis was also able to adjust light
harvesting pigments in turbid water.
Microcystis blooms of western Lake Erie are an annual occurrence. The spatial
pattern of these blooms closely follows the extant of the sediment plume of the Maumee
Bay and adjacent waters. This suggests that conditions with in these plumes favors rapid
Microcystis growth. Total protein content was highest in regions of the lake that are
often in the sediment plume and indicates greater health in these turbid waters. Turbidity
of the plume gives Microcystis a competitive edge over sinking phytoplankton and
increases the photosynthetic efficiency. Also, nutrient concentrations of the sediment

110
plumes are very high. No nitrogen deficiency was observed in Microcystis while
frequent phosphorus deficiencies were measured.
Goal of management should be to lessen the magnitude of Microcystis blooms.
Efforts to reduce sediment loading into lakes would increase light stress for Microcystis
and slow its growth. In the laboratory experiment, Microcystis growth was similar
among nutrient concentrations at low turbidity- Microcystis only took advantage of high
nutrients in high turbidity treatment. Further reducing sediment loading would
concomitantly reduce nutrient loading and would increase the severity of phosphorus
deficiency of Microcystis. Best-management land-use practices and lessening summer
dredging of shipping channels could be tools used to reach this goal.

111
Chapter Five
Detailed Methods and Supplemental Data
Experiment to Determine Photosynthetic Pigment Concentration
Introduction
There is no standard method for extraction of pigments from phytoplankton. For
phycocyanin (PC), most methods rely on mechanical grinding with a mortar and pestle
(Sampath-Wiley and Neefus 2007; Simis et al. 2007), sonication (Furuki et al. 2003;
Patel et al. 2004; Downes and Hall. 1998), or freeze/ thaw cycles (Simis et al. 2007)
using either tris or phosphate buffer. For chlorophyll, the method of Lorenzen (1967)
uses grinding in acetone and reading absorbance at 665 nm. Other methods use strong
organic solvents such as dimethylsulphoxide (DMSO) (Wellburn 1994; Seely et al. 1972)
or N-N dimethylformamide (DMF) (Speziale et al. 1984). After extraction, then
absorbance spectra are read and chlorophyll concentration is calculated from equations
that use several wavelengths, or chlorophyll fluorescence is read and concentration
calculated using a standard curve. Absorbance allows for calculation of all chlorophylls
and carotenoids from one extraction, while fluorescence only allows for calculation of
one pigment at a time. Because of the ambiguities for phycocyanin extractions and
potential differences between the chlorophyll quantification, I examined different
methods to quantify phycocyanin and compared our laboratory‟s method of chlorophyll

112
quantification which uses DMF and fluorescence (Speziale et al. 1984) to a method that
uses DMSO and absorbance.
Phycocyanin
There is a wide variety of published methods for the extraction of PC from
cyanobacteria and red algae. Most methods rely on freeze/thaw cycles, grinding with
mortar and pestle, or sonication in Tris or Sodium phosphate buffers. Michael McKay of
Bowling Green State University provided me with their lab protocol that uses sonication
to break cells walls. However, there is uncertainty as to the duration needed to sonicate
samples. One study (Furuki et al. 2003) stated that more PC is extracted with increased
length of sonication, while another (Downes and Hall 1998) showed that PC is damaged
by prolonged sonication. To address this, an experiment using cultured Microcystis was
done using two buffers (0.05 M Tris pH 7.0 or 0.1 M Sodium phosphate pH 6.8) and two
types of extraction (mortar and pestle or sonication of several lengths (1, 5, 10, 15, 20,
and 40 minutes)) to determine the best protocol for extracting PC from my samples.
Microcystis was grown in WC liquid medium (Guillard and Lorenzen 1972) under ~50
µmol m-2
s-1
on 12:12 hour light/dark cycles in 2 L jars. One culture jar was selected for
this experiment. The jar was capped and Microcystis mixed thoroughly by turning it over
several times before each aliquot was taken. 100 ml were filtered onto 25 cm GF/F filters.
This process would insure that all filters contained the same amount of Microcystis and
therefore PC. Filters were then stored at -80° C as above. Half of the samples would be
used for Tris buffer and the other half for phosphate. Each buffer x sonication length
combination length was replicated with 3 separate filters. For grinding with mortar and
pestle, 12 filters were ground in one of the two buffers, transferred to plastic screw-top

113
tubes, and filled to 10 ml with buffer and incubated at 4° C for 60 minutes. Samples
where then centrifuged for 10 minutes at 3,800 rpm and PC fluorescence was recorded in
a 10-AU Turner Design fluorometer with P/N 103-80 filters. For sonication, filters were
placed in 5 ml of buffer in polystyrene screw-top tubes and sonicated for the length of
time. After sonication, samples were then filled to 10 ml and incubated at 4° C for 60
minutes (Michael McKay, BGSU). Samples were then centrifuged for 10 minutes at
3,800 rpm and then PC fluorescence was recorded. Further, the absorbance spectrum was
read for these samples to determine pureness of extract.
Grinding filtered sample by mortar and pestle gave higher fluorescence values
than sonication (Fig. 5-1), but this was a result of the cloudiness of the solution.
Therefore, grinding was eliminated as a choice for PC extraction. For sonication, Tris
gave higher fluorescence readings (Fig. 5-2), but calculated concentration of PC was
similar between the two types of buffer. PC fluorescence increased with sonication
length up to 10 minutes and was similar at 15 and 20 minutes, and then fluorescence was
less at 40 minutes (Fig. 5-2). Because fluorescence was constant between 10 and 20
minutes, 15 minutes was selected. The absorbance spectra for Tris had peaks at 619 nm
(PC) and 665 nm (Chl a), whilst phosphate buffer only had the 619 nm peak (Fig. 5-3).
This indicates that phosphate buffer had a high purity of PC than Tris. Both buffers
contained caroteniods. The phosphate buffer was selected because of the PC purity and
because the 10 mg ml-1
C-PC standard was in a solution of sodium phosphate. Standard
curve of known concentration vs. PC fluorescence was linear through the range of the
machine.
Chlorophyll a

114
Because chl a is extracted in N-N dimethylformamide (DMF) as a part of an on-
going lake monitoring program, I compared DMF to DMSO extractions (as above
chapters; Wellburn 1994) for 60 samples. Same method of collecting, filtering, and
storage of was used between the two extraction types. Filters were placed in
polyethylene screw-top tubes with 4 ml of DMF and stored at -20° C overnight. The
following day, samples were heated to 70° C for 15 minutes then filled to 10 ml (Speziale
et al. 1984). Samples were then centrifuged at 2,000 rpm for 10 minutes (Speziale et al.
1984). Chl a fluorescence was read using the Turner Design fluorometer with P/N 10-
037R. An acid adjustment was used with two drops of 2 N HCl and fluorescence read.
Chl a was quantified using a standard curve.
Chl a extractions from 60 samples were compared by using a DMSO with
absorbance and DMF with fluorescence measured. No difference was seen between the
two methods for extracting chl a from phytoplankton on filters (Fig. 5-4). The two
methods were highly correlated when concentrations measured are plotted vs. each other
(r2 = 0.93).
In this experiment, I determined the best method of extraction of phycocyanin
from Microcystis collected from Lake Erie. This method relies on sonication that is less
labor-intensive than mechanical grinding with mortar and pestle, also sonication is less
time consuming as compared to freeze/ thaw cycles. This method was used to extract PC
from Microcystis taken from Lake Erie. For chl a, the two methods gave very similar
results. I used the DMSO method because it allows for determination of several
pigments from one extraction. The DMF method was an establish protocol as part of an
115
on-going monitoring method. Therefore, the similar between the two methods gives
confidence that the chl a values obtained from DMSO are correct.
Phytoplankton Community of Western Lake Erie 2007-2008
The 2007 sampling season began in early July during a Microcystis bloom. Chl a
and PC were 18.73 and 51.93 µg L-1
respectively at site 8M surface. Microcystis and
other phytoplankton decreased throughout the summer. August and September had low
chl a and low PC. A second Microcystis bloom was seen in October. Chl a and PC were
101.8 and 178.7 µg L-1
respectively at site 8M surface. The left side of Figure 5-5 gives
chl a isopleths for sites 8M and MB20 during 2007. PC isopleths for sites 8M and MB20
are shown in Figure 5-6.
2008 sampling started with high chl a concentration on May 29 at sites MB20
(107.9 µg L-1
) and 7M (32.2 µg L-1
). Chl c to chl b ratios greater than 7.0 would indicate
that this algal bloom was diatoms (Aulacoseira sp). By mid June, for all sites except
MB20, chl a dropped to less than 12 µg L-1
, and further dropped to values less 4.0 µg L-
1on June 24. Phycocyanin (PC) values were less than 0.1 µg L
-1 through June. A second
Aulacoseira bloom was seen on July 10 with highest chl a at 7M (47.7 µg L-1
). Sparse
Microcystis was first collected in plankton tow on July 24, but PC was low ranging from
0.07 to 0.38 µg L-1
. Diatoms were still most abundant taxon but chl a decreased to less
than 10 µg L-1
. Microcystis was present in the lake and it was concentrated at the surface
on August 6 and 12. Greatest surface values of chl a and PC were 112.5 and 245.6 µg L-
1, respectively, during these two dates. Microcystis biomass collected in plankton tows
was very high on August 21 and remained high for the rest of sampling season, but strong

116
mixing of water column evenly distributed Microcystis. Strong mixing resulted in much
lower concentrations of chl a and PC at the surface. Highest chl a and PC at the surface
was 35.7 and 33.2 µg L-1
, respectively, during strong mixing. Calmness was restored
September 25 and Microcystis concentrated on the surface. Highest chl a was 1100.9 µg
L-1
and PC was 418.2 µg L-1
on the surface at 8M. The right half of Figure 5-5 show the
chl a isopleths for sites 8M and MB20 for 2008. Phycocyanin isopleths for sites 8M and
MB20 are shown in Figure 5-6 respectively.
Complete Methods for Laboratory Experiment
Chlamydomonas (a common unicellular green alga) and Microcystis were grown
separately in WC liquid medium (Guillard and Lorenzen 1972) under ~50 µmol m-2
s-1
on
12:12 hour light/dark cycles. Chlamydomonas was aerated while Microcystis was not.
Chlamydomonas and Microcystis were initially collected from Lake Erie. Equal amounts
of Chlamydomonas and Microcystis were used in this experiment, based on content of chl
a. Chlamydomonas and Microcystis were added so that they each had a initial chlorophyll
chl a of 2.5 µg L-1
, making the total initial concentration 5.0 µg L-1
(determined in
DMSO). Phytoplankton intended for the experiment was grown in liquid culture with the
nutrient concentration of the low treatment level for two weeks before used in the
experiment to insure that internal phosphorus (P) storage was not accumulated.
A 2x2x2x2 factorial experiment was used to test the effects of nutrient
concentration (low and high nutrients), turbidity (low and high), mixing (mixed or non-
mixing) and sample depth (surface and at depth) on photosynthetic efficiency and
pigments. Experimental tanks were constructed out of 61x76x90 cm (228 L)

117
polyethylene (PE) bins. Bins were divided into six 61x9x90 cm (36.5 L) chambers using
black sheets of Acrylonitrile-Butadiene-Styrene (ABS) board (Fig. 3-1). PE foam was
inserted along the edges of the ABS board to fill the space created by the expanding walls
upon adding water. Outside walls of the PE bins were supported in a wooden frame to
minimize expansion. Experiments were conducted in a greenhouse and exposed to
natural sunlight (~1,500 µmol m-2
s-1
) at ambient temperature (25 – 28 °C).
Tap water enriched with nutrient was used to replicate lake water. Because tap
water P concentration was greater than what was intended for the low nutrient level,
excess P was precipitated with 30 mg L-1
Alum (Aluminum sulfate, Toledo Pools,
Toledo, Ohio). Water intended for experimental use was held in 121 L bins. Water was
aerated for at least 24 hours then alum was added and aeration was turned off to allow
precipitation. The following day, flock was siphoned from the bottom of the bins.
Treatment of tap water with alum decreased P to 0.01 mg L-1
. Alum treated water and
non-treated water grew algae equally in culture.
Mixing of the chamber was achieved using powerhead pumps (Aquagardens
#601) so that the intake hose was placed at the bottom of the chamber and outflow just
beneath the surface (Fig. 1). Sieved Lake Erie sediments (400 µm) were added to create
turbidity. High turbidity was achieved by adding 0.55 ml L-1
sediments (~30 NTU) and
0.02 ml L-1
for low turbidity (~1 NTU). High nutrient level included 3.0 mg L-1
nitrogen
(N) and 0.15 mg L-1
P, and low level was 0.6 mg L-1
N and 0.03 mg L-1
P. The N:P was
45 in both levels and all other nutrient concentration were the same in each level. All
other nutrients were half concentration of the WC media. Twiss et al. (2005) enriched

118
Lake Erie water with micro-nutrients to a final concentration similar of the WC growth
media and observed no additional phytoplankton growth.
Once treatments were set up and phytoplankton added, 96 hours were allowed for
growth. (An initial trial ran for 168 hours and twice as much initial alga resulted in
similar light levels between the high and low turbidity treatments.) Following the 96
hours, samples were collected at the surface and 70 cm. The 70 cm sample represents the
20% of surface light in the low turbidity level and < 0.5 % in the highly turbid treatment.
Phytoplankton (100ml) was filtered onto GF/F filters and Φet was measured. Samples
were dark adapted for 30 minutes then used to determine Fv/Fm. Φet and Fv/Fm were
determined using an OS1-FL Opti-Sciences modulated fluorometer in triplicate. Filters
were stored on silica gel at -80 ° C for pigment concentration analysizes. Chambers 1
and 6 were not analysized because of white outside wall resulted in higher light intensity
than chambers 2 through 5 that had black walls. Light was recorded after all samples
were collected. Photosynthetic measurements and light was recorded between 12:00 pm
and 2:00 pm on sunny days.
Chrolophyll (chl) a was used as a surrogate for total algal biomass. Chls a and b
and carotenoids were extracted in DMSO following methods in chapter 2 and
concentration of pigments calculated using Wellburn 1994. Phycocyanin (PC) was
extracted in sodium phosphate buffer using sonication and fluorescence following the
methods of chapter 2.
Four-way ANOVA was performed to test for the effect of mixing (mixed or
calm), turbidity (high or low), nutrients (high or low), and sample depth (surface and at
depth) on Φet, Fv/Fm, and pigment composition. PROC ANOVA of SAS was used.

119
Complete Methods for Protein Extraction and Quantification
Collection and Separation
Microcystis was collected from five sites over the entire water column from five
sites in western Lake Erie using a 64 μm mesh plankton net in western Lake Erie during
July through September 2008 (Fig. 2-1). An additional site (MB20) was sampled for
nutrients but Microcystis was not abundant enough to collect for physiological
measurements. Microcystis colonies retained in the net were concentrated and stored in
dark polyethylene bottles during transportation back to the laboratory. Depending on
sample location, two to six hours passed between collection on the lake and laboratory
analysis. Upon arriving to the laboratory, the Microcystis sample was added to a 1L
imhoff cone and diluted to 1,000 ml with tap water. This allows the Microcystis colonies
to separate from the sinking diatoms and green algae via floatation (Chaffin et al. 2008).
After 30 minutes, the settled phytoplankton was drawn out through the bottom of the
cone and discarded. The sample was then diluted again to 1,000 ml with tap water and
process repeated. Microcystis colonies were drawn out of the bottom of the cone and
concentrated on a 35 μm mesh, transferred to 1.5 ml tubes and stored at -80 ° C until
further analysis. Samples were also checked for the presence of other cyanobacteria by
microscopy. Anabaena was very sparse relative to Microcystis colonies on July 24 and
Aug. 6, and Aphanizomenon was not seen in samples.
Biochemistry
Proteins of Microcystis were extracted by grinding approximately 1 g of fresh
weight tissue to a powder in liquid nitrogen using mortar and pestle then transfer to an
extraction buffer containing 1% sodium dodecyl sulfate (SDS) detergent, 0.1 M Tris
120
buffer (pH = 8.0), 10% glycerol, 0.1% bromophenol-blue, 1% sucrose, protease inhibitors
(1 mM pheynlmethylsulfonylfluoride (PMSF), 1 mM EDTA, 1 mM benzamidine, 10 mM
leupeptin), a phenolic inhibitor (0.5% polyvinylpolypyrrolidone (PVPP)), and reductants
(10 mM dithiothreitol (DTT), 0.1 M ascorbic acid) (Mishra et al. 2008). Sample was
then centrifuged at 15,000 g for 10 minutes at 4 ° C. Supernatant containing soluble
proteins was collected and total protein content was determined using the method of
Peterson (1977). Breifly, proteins from a 20µl sample were precipitated with 20µl
chilled trichloroacetic acid and incubated for 60 minutes at 4°. Sample was then
centrifuged at 12,000 g for 10 minutes at 4° then supernatant decanted. 150µl of BioRads
reagent A‟ was added to the protein pellet, votrexed and left for 5 minutes. Then 1,200µl
of reagent B was mixed and incubated in the dark for 15 minutes at room temperature.
Absorbance was measured at 750nm using the Shimadzu spectrophotometer and
quantified using a standard curve of Bovine Serum Albumin and corrected for dry mass.
Samples in extraction buffer were kept at -80° C until further analysises.
To prepare protein for gel separation and quantification of rubisco and sHsp,
proteins were precipitated in 10x volume acetone for 60 minutes at -20° C, centrifuged at
15,000 g at 4° C, then resuspended over night at 4° C in a sample buffer containing 1%
SDS, 100 mM Tris buffer (pH = 6.8), 10% glycerol, 0.1% bromophenol-blue, and 0.4%
β-mercaptoethanol. Protein samples were boiled for 4 minutes to denature protein then
centrifuged at 21,000 g for 30 seconds to remove debris. Then proteins were separated in
12.5% SDS-PAGE using 30 µg of protein in each well. For rubisco, gel was stained
using Coomassie blue R-250. After de-staining, the gel was scanned and relative content
of rubisco large subunit band (52 kDa) was quantified by color density determined using

121
computer software (Hewlett Packer Scanjet 8200). For sHsps, proteins were transferred
to nitro-cellulose membranes by electroblotting, and sHsp were detected using protein
specific antibodies (Heckathorn et al. 2002) following the protocol in Dumbroff and
Gepstein (1993) then relative content was quantified. Also, Microcystis grown in culture
was heat-shocked at 40°C for 45 minutes to induce expression of sHsp and used a
positive control. A heat-shocked tomato plant was also used as a positive control.
Literature Cited
Chaffin, J. D., Bridgeman, T. B. and Filbrun, J. F. 2008. Quantification of Microcystis sp.
blooms in western Lake Erie (2002-2007) and relation to tributary flow.
Conference presentation. International Association of Great Lakes Research.
Petersburg Ontario, Canada.
Downes, M.T., and Hall, J.A. 1998. A sensitive fluorometric technique for the
measurement of phycobilin pigments and its application to the study of marine
and freshwater picophytoplankton in oligotrophic environments. Journal of
Applied Phycology 10(4): 357-363.
Dumbroff, E.B. and Gepstein. S. 1993. Immunological methods for assessing protein
expression in plants. In: Methods in plant molecular biology and biotechnology.
Editors Glick, B.R. and Thompson, J.E. CRC Press.
Furuki, T., Maeda, S., Imajo, S., Hiroi, T., Amaya, T., Hirokawa, T., Ito, K., and
Nozawa, H. 2003. Rapid and selective extraction of phycocyanin from Spirulina

122
platensis with ultrasonic cell disruption. Journal of Applied Phycology 15(4):
319-324.
Guillard, R. R. L. and Lorenzen, C. J. 1972. Yellow-green algae with chlorophyllide c.
Journal of Phycology. 8:10-14
Heckathorn, S.A., Ryan, S.L., Baylis, J.A., Wang, D.F., Hamilton, E.W., Cundiff, L., and
Luthe, D.S. 2002. In vivo evidence from an Agrostis stolonifera selection
genotype that chloroplast small heat-shock proteins can protect photosystem II
during heat stress. Functional Plant Biology 29(8): 933-944.
Lorenzen. C. J. 1967. Determination of chlorophyll and pheo-pigments:
Spectrophotometric equation. Limnology and Oceanography. 12(2): 343-346
Mishra, S., Heckathorn, S.A., Barua, D., Wang, D., Joshi, P., Hamilton, E.W., and Frantz,
J. 2008. Interactive Effects of Elevated CO2 and Ozone on Leaf Thermotolerance
in Field-Grown Glycine max. Journal of Integrative Plant Biology 50(11): 1396-
1405.
Patel, A., Mishra, S., Pawar, R., and Ghosh, P.K. 2005. Purification and characterization
of C-Phycocyanin from cyanobacterial species of marine and freshwater habitat.
Protein Expression and Purification 40(2): 248-255.
Peterson, G.L. 1977. A simplification of the protein assay of Lowry et al. which is
generally applicable. Analytical Biochemistry. 83(2): 346-356.

123
Sampath-Wiley, P., and Neefus, C.D. 2007. An improved method for estimating R-
phycoerythrin and R-phycocyanin contents from crude aqueous extracts of
Porphyra (Bangiales, Rhodophyta). Journal of Applied Phycology 19(2): 123-
129.
Seely, G.R., Ducan, M.J., and Vidaver, W.E. 1972. Preparation and analytical extraction
of pigments from brown algae with dimethyl sulfoxide. Marine Biology 12(2):
184-188
Simis, S.G.H., Ruiz-Verdu, A., Dominguez-Gomez, J.A., Pena-Martinez, R., Peters,
S.W.M., and Gons, H.J. 2007. Influence of phytoplankton pigment composition
on remote sensing of cyanobacterial biomass. Remote Sensing of Environment
106(4): 414-427.
Speziale, B.J., Schreiner, S.P., Giammatteo, P.A., and Schindler, J.E. 1984. Comparison
of n,n-dimethylformamide, dimethylsulfoxide, and acetone for extraction of
phytoplankton chlorophyll. Canadian Journal of Fisheries and Aquatic Sciences
41(10): 1519-1522.
Twiss, M.R., Gouvea, S.P., Bourbonniere, R.A., McKay, R.M.L., and Wilhelm, S.W.
2005. Field investigations of trace metal effects on Lake Erie phytoplankton
productivity. Journal of Great Lakes Research 31: 168-179.
Wellburn, A.R. 1994. The spectral determination of chlorophyll a and chlorophyll b, as
well as total carotenoids, using various solvents with spectrophotometers of
different resolution. Journal of Plant Physiology 144(3): 307-313.

124
Tables
Table 5-1. Complete results of CHN auto-analyzer and ICP-OES for macronutrients of Microcystis. X is no sample.
Units are mmol kg-1
dry weight.
Site Date C H N P K Ca Mg S
MB18 8/6/08 40199.83 64484.13 4875.089 187.3762 204.0086 180.6329 96.8559 125.8127
8M 8/6/08 39400.50 65277.78 5074.946 190.5069 X X X X
7M 8/6/08 40116.57 65674.60 4967.880 198.0701 187.9484 165.2320 87.2759 121.0384
GR1 8/6/08 38676.10 64781.75 5010.707 239.0595 207.2756 221.9695 98.6896 132.6011
4P 8/6/08 38193.17 64980.16 5353.319 171.1334 X X X X
MB18 8/12/08 38984.18 64384.92 4503.926 187.6604 207.6130 209.4622 92.6090 127.7757
8M 8/12/08 38351.37 64087.30 5481.799 300.8221 223.8157 230.5105 115.5598 140.2096
7M 8/12/08 37993.34 64682.54 4760.885 298.8731 214.4505 192.5611 115.7123 125.6625
GR1 8/12/08 39883.43 66865.08 5017.844 169.0337 189.4191 230.6634 80.0826 132.3651
4P 8/12/08 40599.50 67658.73 5267.666 271.1472 203.9010 233.8579 107.0743 128.7941
MB18 8/21/08 39258.95 65376.98 5852.962 327.4039 251.3395 303.9398 143.3159 159.5722
8M 8/21/08 39883.43 67559.52 6538.187 403.5042 243.9975 297.4818 167.7147 164.2322
7M 8/21/08 38009.99 63392.86 5988.580 364.7349 239.2672 214.0160 143.7085 156.5344
GR1 8/21/08 40316.40 67857.14 5638.829 375.9265 262.6589 258.0593 150.6054 151.1651
4P 8/21/08 39641.97 67162.70 5274.804 192.9084 193.9238 216.2289 83.7546 128.5794
MB18 9/1/08 41557.04 67658.73 5617.416 251.5390 219.4427 168.4701 105.9121 139.3146
8M 9/1/08 41024.15 68055.56 6145.610 287.7663 218.0435 193.2873 121.9224 155.5820
7M 9/1/08 41407.16 68154.76 6009.993 266.3152 200.9868 177.2617 112.4765 149.7937
GR1 9/1/08 41290.59 67757.94 5738.758 226.4551 196.7534 196.4399 92.5325 143.1167
4P 9/1/08 40807.66 68353.17 5910.064 280.4537 214.3098 209.1951 123.2805 159.3954

125
Table 5-2. Complete results of ICP-OES for micronutrients of Microcystis. X is no sample, ND is not detected. Units
are mmol kg-1
dry weight.
Site Date B Cu Fe Mn Zn Mo Ni Si Na
MB18 8/6/08 ND 0.182929 2.47391 ND 0.395610 0.012415 0.221543 8.41615 41.73772
8M 8/6/08 X X X X X X X X X
7M 8/6/08 ND 0.125030 2.83011 0.208328 0.230040 ND 0.186089 3.71091 X
GR1 8/6/08 ND 0.202007 4.92874 0.237495 1.089595 ND 0.292144 5.84379 X
4P 8/6/08 X X X X X ND X X X
MB18 8/12/08 0.133766 0.220538 3.24832 ND 0.433680 0.022608 0.239666 6.98909 29.15047
8M 8/12/08 0.166700 0.194015 4.04506 0.243409 1.275844 ND 0.203547 5.88170 X
7M 8/12/08 ND 0.213488 3.03084 0.249253 0.609931 ND 0.212730 3.41703 X
GR1 8/12/08 ND 0.251381 3.74728 0.244321 0.765566 ND 0.408157 3.30462 X
4P 8/12/08 ND 0.164166 3.62222 0.208883 0.443173 ND 0.311783 4.03143 X
MB18 8/21/08 ND 0.184300 4.29485 ND 0.362618 0.008952 0.260672 3.96385 38.96957
8M 8/21/08 ND 0.220981 6.16410 0.250055 0.458386 ND 0.300731 4.64075 X
7M 8/21/08 ND 0.168644 4.12658 0.252041 0.467108 ND 0.304513 4.05507 X
GR1 8/21/08 ND 0.171286 3.15061 0.062023 1.003227 0.006906 0.326477 7.67274 51.38244
4P 8/21/08 ND 0.227733 3.72437 0.278918 0.729182 0.014789 0.487375 5.41819 X
MB18 9/1/08 ND 0.166154 3.40311 ND 0.273489 0.005896 0.261749 4.03424 30.19428
8M 9/1/08 ND 0.205270 5.19271 0.251204 0.385313 ND 0.305917 6.59578 X
7M 9/1/08 ND 0.184323 3.81245 0.211490 0.438517 ND 0.267902 3.73625 X
GR1 9/1/08 ND 0.182473 3.50946 0.157873 0.514071 ND 0.283427 4.75584 X
4P 9/1/08 ND 0.317674 4.35632 0.191492 0.532758 ND 0.396330 5.26706 X

126
Figures
0
50
100
150
200
250
Tris Phosphate
Buffer Type
PC
Flu
ore
sc
en
ce
(re
l. u
nit
s)
Figure 5-1. Comparison of 0.05 M Tris buffer pH 7.0 to 0.1M Sodium phosphate buffer
pH 6.8 after grinding a filter by mortar and pestle. High fluorescence values are due to
cloudiness of sample. Values are average of six filters ± SE.

127
0
10
20
30
40
50
60
0 5 10 15 20 25 30 35 40 45
Length of sonication (minutes)
PC
flu
ore
scen
ce (
rel.
un
its)
Tris
Phosphate
Figure 5-2. Comparison of phycocyanin (PC) fluorescence after sonication of various
lengths in 0.05 M Tris buffer pH 7.0 and 0.1 M Sodium phosphate pH 6.8. Values are
the average of three filters.

128
0
0.01
0.02
0.03
0.04
0.05
0.06
400 450 500 550 600 650 700
Wavelength (nm)
Ab
so
rba
nc
e
Tris
Phosphate
Figure 5-3. Absorbance spectra of Microcystis filtered and PC extracted by sonication for
15 minutes in 0.05 M Tris buffer pH 7.0 and 0.1 M Sodium phosphate pH 6.8.

129
y = 1.0663x - 0.2915
R2 = 0.9278
0
25
50
75
100
125
0 25 50 75 100 125
Chl a ug/L DMSO Absorbance
Ch
l a
ug
/L D
MF
flu
ore
sc
en
ce
Figure 5-4. Comparison of chl a extractions and quantification using DMSO with
absorbance quantification and DMF with fluorescence quantification. Bold line is
regression between the two methods and dashed line is a one to one line.
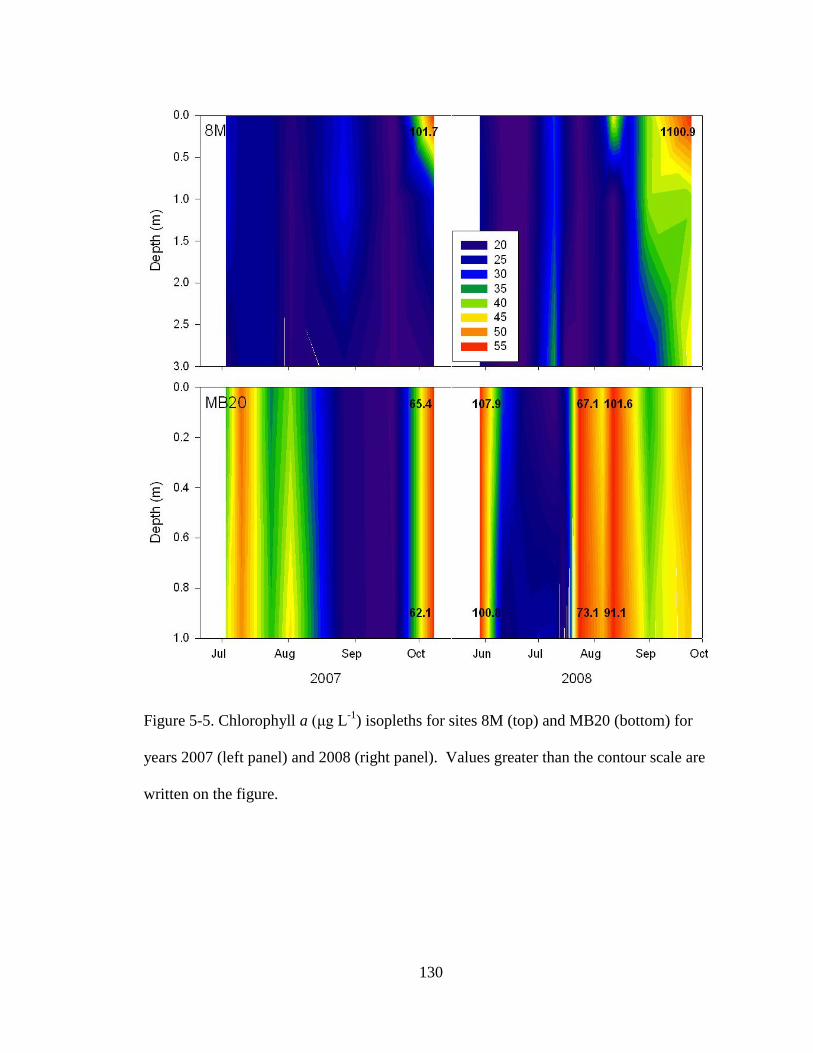
130
Figure 5-5. Chlorophyll a (μg L-1
) isopleths for sites 8M (top) and MB20 (bottom) for
years 2007 (left panel) and 2008 (right panel). Values greater than the contour scale are
written on the figure.

131
Figure 5-6. Phycocyanin (μg L-1
) isopleths for sites 8M (top) and MB20 (bottom) for
years 2007 (left panel) and 2008 (right panel). Values greater than the contour scale are
written on the figure.