maunsell australia pty ltd - planning · coastal processes investigation ... width of the beach...
TRANSCRIPT

Maunsell Australia Pty Ltd Portarlington Safe Harbour Coastal Processes Investigation
Report No. J538/R01
February 2007
ISO 9001:2000 QEC22878

Maunsell Australia Pty Ltd
Portarlington Safe Harbour Coastal Processes Investigation
Report No. J538/R01 February 2007
15 Business Park Drive Notting Hill VIC 3168 Telephone (03) 9558 9366 Fax (03) 9558 9365 ACN No. 093 377 283 ABN No. 60 093 377 283

Portarlington Safe Harbour – Coastal Processes Investigation
J538/R01, May 2007, Rev 5 Page i
DOCUMENT STATUS
Issue Revision Date Issued
To Prepared By
Reviewed By
ApprovedBy
DRAFT
0
19/01/2007
Maunsell TJW AMC AMC
DRAFT
1
24/01/2007
Maunsell TJW AMC AMC
DRAFT
3 14/02/2007
Maunsell TJW AMC AMC
DRAFT
4 15/02/2007
Maunsell TJW AMC AMC
DRAFT
5 30/05/07 Maunsell TJW/AMC AMC AMC
FINAL
5 31/05/07 Maunsell TJW/AMC AMC AMC
QFORM-AD-18 REV 5 It is the responsibility of the reader to verify the currency of revision of this report.
Copyright
Water Technology Pty Ltd has produced this document in accordance with instructions from Maunsell Australia Pty Ltd for their use only. The concepts and information contained in this document are the copyright of Water Technology Pty Ltd. Use or copying of this document in whole or in part without written permission of Water Technology Pty Ltd constitutes an infringement of copyright. Water Technology Pty Ltd does not warrant this document is definitive nor free from error and does not accept liability for any loss caused, or arising from, reliance upon the information provided herein. s:\j538_port_bellarine\docs\report\j538r01da_tjw.doc
Portarlington Safe Harbour – Coastal Processes Investigation
J538/R01, May 2007, Rev 5 Page ii
EXECUTIVE SUMMARY
A coastal processes study was undertaken at Portarlington to inform the development of options for the safe harbour development on the Bellarine Peninsula currently being undertaken for Parks Victoria by Maunsell Australia Pty Ltd.
Tidal and wind driven current information has been extracted from a hydraulic model of Port Phillip Bay offshore of Portarlington. The results indicated the circulation at Portarlington is dominated by the influence of tidal currents with wind driven currents considered to have minor impact on the circulation at Portarlington. The model results show that the flood tide currents are generally stronger than the ebb tide currents.
Water levels experienced at Portarlington Harbour have been adopted from available long term information at Williamstown in northern Port Phillip Bay. Operational tidal levels at Williamstown are considered an appropriate representation of levels at Portarlington as the spatial variation in tides within Port Phillip is limited. Extreme tide levels in Port Phillip Bay are generated as a combination of high tides with storm surge and wind set up.
A wind climate at Portarlington was adopted from eight years of record at Point Wilson . The wind climate at Point Wilson was processed through a wave model of Port Phillip Bay to develop a wave climate at Portarlington. The north facing location and limited westerly fetch exposed at Portarlington provides significant protection from waves generated from the dominant southerly summer winds and winter westerly winds. For these reasons the wave climate at Portarlington is considered rather subdued when compared with other locations on western and south facing locations around Port Philip Bay.
An analysis of the wave climate indicates that a wave driven net westward sediment transport regime is likely to occur over the summer months at Portarlington. During winter however, the wave driven net sediment transport may be close to neutral. It is considered a net westerly sediment transport may be super imposed over the wave driven sediment transport due to the dominant westerly flood tide current at Portarlington
Parks Victoria undertake maintenance dredging of the harbour and have estimated that up to approximately 21,000 m3 of material is required to be removed every 2 to 4 years on average. This would imply an average gross transport of between 5–10,000 m3/year. The net westerly transport is likely to be significantly lower than the gross sediment transport. Further investigations would be required to quantify the actual net transport rate; however, it may be in the order of 1-2,000 m3/year.
A review of the available historical aerial photography was undertaken to assess the status of shoreline evolution and dynamics in the vicinity of Portarlington. In general it was observed that the coastline in the immediate lee of the breakwater has been gradually advancing and the width of the beach between Portarlington Harbour and Point Richards appears to have reduced and there is some evidence to suggest a small but gradual retreat of the coastline. The coastline at Point Richards is dynamic with accretion and erosional features apparent throughout the photographic record.
The combination of sheltering and wave diffraction around the ends of the offshore breakwater at Portarlington Harbour has caused an accumulation of sand in the lee of the breakwater. This mechanism traps most of the sand transported into the harbour from both the west and the east. That is, the existing harbour acts as a trap for most of the gross longshore transport of sand in the area.
The concept plan for the harbour development shows an almost fully enclosed harbour with the offshore breakwater extended to both the east and west, a wave screen along the western

Portarlington Safe Harbour – Coastal Processes Investigation
J538/R01, May 2007, Rev 5 Page iii
side of the existing jetty alignment, and an reclamation area constructed out from the shore at the eastern end of the harbour. A harbour of this type would be expected to provide a complete barrier to the alongshore transport of sand.
Creating a navigable depth of -3.5m AHD (i.e., -3.0m to Chart Datum) will require dredging of approximately 69,000 m3 of bed material. The dredging method to be used will be very dependent upon the properties of the material to be dredged. For sand, silty sand, silts and clays, a cutter suction dredge is likely to be the most effective plant, while the excavation of harder rock may require a pneumatic/hammer type system to break up the rock, with subsequent removal by grab or excavator.
Sand and silty sand material may be suitable for beach nourishment or for reclamation work. Silt and clay material may also be suitable for the reclamation works, but is likely to require a significant period of time for dewatering and consolidation. Alternatively, disposal to sea may be an option.
More recent detailed hydrographic survey of the entire harbour area will be required before a more accurate estimate of the dredge volume can be made. More detailed geotechnical and sediment quality investigations will be required to determine the most appropriate method for dredging and spoil disposal.
A build up of sand to the east of the proposed harbour would be expected at the net alongshore transport rate, which may be in the order of 1-2,000 m3/year. This is significantly lower than the gross transport rate of 5-10,000 m3/year that is currently trapped by the existing harbour.
Regular by-passing of sand from the east of the harbour to the beaches in the west would help reinstate the natural westward sediment transport rates in the area.
Overall, it is expected that the proposed new harbour will have less impact on the longshore sediment transport regime in the area, and will require less maintenance dredging than the existing harbour.
Considerable uncertainty exists in predicting the impact of climate induced sea level rises on coastal processes. On coastlines such as Portarlington, where the potential transport is in excess of the littoral supply, it is considered reasonable to conclude that a degree of landward retreat will occur until a new quasi-equilibrium is achieved.
Measures that could be used to mitigate any effects of sea-level rise or increased storminess that may occur could include the design of breakwaters and associated infrastructure to allow for a mean sea level rise of up to 0.4m. Incorporating contingency plans for protection works along the adjacent sections of coast, which in the short to medium-term may include beach renourishment and groyne construction should also be considered.
Additional investigations will be required provide a more detailed assessment of the likely impacts of the proposed harbour (similar to what might be required to obtain Coastal Management Act consent), and to optimise its final design parameters.

Portarlington Safe Harbour – Coastal Processes Investigation
J538/R01, May 2007, Rev 5 Page iv
TABLE OF CONTENTS
EXECUTIVE SUMMARY...................................................................................................... ii 1 Introduction ...................................................................................................................... 1
1.1 Scope of Works .......................................................................................................... 1 1.2 Review of Previous Studies........................................................................................ 1
1.2.1 Geelong Coastal Processes Study ...................................................................... 1 1.2.2 Beaches at Risk .................................................................................................. 2 1.2.3 Port Bellarine Coastal Processes Study.............................................................. 2 1.2.4 Port of Geelong Channel Improvement Program EES – Appendix G, Hydrodynamic and Coastal Processes................................................................................ 3
2 Coastal Processes.............................................................................................................. 4 2.1 Tides and Circulation ................................................................................................. 4 2.2 Sea Level .................................................................................................................... 6 2.3 Wave Climate............................................................................................................. 6
2.3.1 Wind ................................................................................................................... 6 2.3.2 Waves ................................................................................................................. 7
2.4 Sediment Transport .................................................................................................... 8 2.5 Historical Coastline Changes ..................................................................................... 9 2.6 Water Quality ........................................................................................................... 11 2.7 Site Inspection .......................................................................................................... 11
2.7.1 Coastal Cliffs and Rock Platforms East of Portarlington Harbour .................. 11 2.7.2 Portarlington Harbour ...................................................................................... 12 2.7.3 Portarlington Beach West of Portarlington Harbour........................................ 14 2.7.4 Point Richards .................................................................................................. 14
3 Impact of Existing Harbour on Coastal Processes...................................................... 15
4 Impact of Proposed Harbour Development on Coastal Processes ............................ 16 4.1 Coastal Processes ..................................................................................................... 16 4.2 Capital and Maintenance Dredging Requirements................................................... 18 4.3 Water Quality ........................................................................................................... 19 4.4 Mitigation Options ................................................................................................... 20
5 Implications of Climate Change and Sea Level Rise on Coastal Processes .............. 21
6 Recommendations .......................................................................................................... 23
7 References ....................................................................................................................... 24
Portarlington Safe Harbour – Coastal Processes Investigation
J538/R01, May 2007, Rev 5 Page v
LIST OF FIGURES
Figure 2-1 Typical Flood Tide Current Speed and Direction
Figure 2-2 Typical Ebb Tide Current Speed and Direction
Figure 2-3 Summer Figure 2-4 Winter
Figure 2-5 Annual
Figure 2-6 Summer Figure 2-7 Winter
Figure 2-8 Annual
Figure 2-9 Historical Coastline Mapping
Figure 2-10 Recent Erosion and Undermining of Stormwater Drain Outfall
Figure 2-11 Cuspate Spit Behind Portarlington Harbour Breakwater
Figure 2-12 Impact of Groyne Alongside Portarlington Harbour Pier
Figure 2-13 Recent Erosion of the Beach along Point Richards
Figure 5-1 IPCC Greenhouse Sea-level Predictions
LIST OF TABLES
Table 2-1 Tidal Levels - Williamstown
Portarlington Safe Harbour – Coastal Processes Investigation
J538/R01, May 2007, Rev 5 Page 1
1 INTRODUCTION
Water Technology Pty Ltd was commissioned by Maunsell Australia Pty Ltd to undertake a study of the coastal processes affecting the coastline in the vicinity of the Portarlington Harbour. The purpose of the study was to define the coastal processes occurring at Portarlington Harbour to inform the development of options for the safe harbour development on the Bellarine Peninsula currently being undertaken for Parks Victoria.
1.1 Scope of Works The study was commissioned with the following scope of works:
x A review of previous studies relating to coastal processes in the area
x Examination of historical aerial photos of the immediate coastline to identify coastal evolution and dynamics
x Collection of sediment samples
x Review of coastal processes occurring in the area based on previous work and additional analysis undertaken as part of this study
x Assessment of the likely impact of the proposed harbour development, and of possible mitigation options
x Assessment of the implications of climate change and sea level rise
1.2 Review of Previous Studies
1.2.1 Geelong Coastal Processes Study Report Prepared for City of Greater Geelong by Lawson & Treloar Pty Ltd (2004) The City of Greater Geelong commissioned Lawson & Treloar to undertake a coastal processes study along the northern edge of the Bellarine Peninsula between Edwards Point and Limeburners Point. The aim of the study was to define the coastal processes shaping the coastal environment to provide a basis for management of the coastal zone in the future. The scope of the study included analysis of historical aerial photography to identify areas of significant coastline evolution, review of historical literature describing the events of coastal and marine significance such as the construction of ports, groynes, channel dredging and coastal erosion events, beach profile survey and development of wave climates and subsequent modelling to estimate longshore sediment transport rates.
With respect to Portarlington area, the following major coastal processes were identified:
x Point Richards is a meeting place of sand drift, with sand travelling from Portarlington to Point Richards in a westward direction and sand travelling from Clifton Springs to Point Richards in an eastward direction.
x The offshore sand bars at Point Richards are considered to have generally increased since the 1960’s, however they are subject to periodic fluctuations in size.

Portarlington Safe Harbour – Coastal Processes Investigation
J538/R01, May 2007, Rev 5 Page 2
x The net longshore transport at Portarlington is westward. This was based on the observations of the build up of sand on the eastern side of the pier and accumulation of sand on the eastern side of the Pt Richards boat ramp.
x A large deposit of sand is locked up behind the breakwater that would otherwise move westward and renourish the beach to the west.
1.2.2 Beaches at Risk Report prepared for Department of Natural Resources and Environment by Vantree Pty Ltd
The Department of Natural Resources and Environment (DNRE) commissioned Vantree Pty Ltd to undertake a review of the condition of Port Phillip Bay beaches that had undergone renourishment over the last 20 to 25 years.
With respect to Portarlington the following points are noted from the report:
x Portarlington beach west of the harbour was renourished from offshore sand deposits in 1986. A total of 35,300 m3 of delivered to approximately 1300 m of beach.
x Wave action west of the harbour is transporting sand alongshore towards Point Richards. The coast west of the harbour is prone to erosion due to the accretion of sand in the lee of the harbour breakwater that would have naturally nourished the beaches further west along Portarlington.
x The option to bypass sand past the harbour was recognised as a means to nourish the beaches to the west of the harbour and improve their condition.
1.2.3 Port Bellarine Coastal Processes Study
File Note prepared for Watsons Pty Ltd by Water Technology Pty Ltd Port Bellarine was a canal estate and marina development that was proposed for the west coast of Point Richards, between Spray Farm Road and Point Richards Road. Coastal process investigations for the development proposal included a review of aerial photography from the area and a wave climate analysis.
The wave analysis showed waves coming predominantly from the west, north and southwest during summer, and from the west-northwest and north during winter. The northerly waves would be expected to generate a westward alongshore transport of sand, while the west and southwest waves would be expected to generate an easterly transport.
Aerial photography from 1952, 1962, 1969, 1974, 1984, 1990 and 2000 was scanned and geo-referenced. The results showed that there had been a build up of sand along the central section of this coastline between 1952 and 1974. This build up was to the east, and is consistent with a net eastward longshore transport of sand in this area.
There has been little change to the coastline since 1974. This was thought to have been due to the on-going removal of sand from Point Richards to maintain access to the boat ramp.
At Point Richards there was a build up of sand to the west, from 1952 to 1974. Apart from some transient build-up in 1984, there has been little net change at Point Richards since 1974.
Portarlington Safe Harbour – Coastal Processes Investigation
J538/R01, May 2007, Rev 5 Page 3
1.2.4 Port of Geelong Channel Improvement Program EES – Appendix G, Hydrodynamic and Coastal Processes Report prepared by Maunsell Pty Ltd, 1993
This report included the results of wave modelling, littoral transport modelling and aerial photography comparisons for Portarlington and the coastline westward to Point Richards.
The results showed a net westerly sand transport rate of about 600 m3/year along the coastline between Portarlington and Point Richards. Comparisons of aerial photography from 1947 and 1990 showed a gradual build up of sand against the east side of the jetty at Portarlington, a tendency for erosion of the beach in front of the caravan park to the west, and a build up of sand to the west of Point Richards.
It was noted that there is on-going extraction of sand from the west of Point Richards, and that the beach in front of the caravan park was renourished in 1986.

Portarlington Safe Harbour – Coastal Processes Investigation
J538/R01, May 2007, Rev 5 Page 4
2 COASTAL PROCESSES
2.1 Tides and Circulation Tides in Bass Strait are predominantly semi-diurnal with a diurnal inequality. That is, there are two tides per day with one tide typically having a larger range than the other. In the area offshore from Port Phillip Heads, the mean spring tidal range of approximately 1.6m. As the ocean tide propagates through The Rip, it is significantly attenuated and results in a mean spring tidal range in Port Phillip Bay of approximately 0.8m. Strong tidal currents exist at The Rip and the entrance channels to Port Phillip, but are generally low elsewhere in the bay. Circulation in the northern section of Port Phillip Bay is mainly wind driven.
The predicted magnitude and direction of tidal and wind driven currents at Portarlington have been modelled using Water Technology’s numerical hydraulic model of Port Phillip Bay. The two dimensional model has been developed using DHI Software's MIKE21 Flow modelling system. MIKE21 Flow is a comprehensive modelling package for simulating two-dimensional free-surface flows. It is applicable for modelling hydrodynamic and related phenomena in lakes, bays, estuaries and coastal areas where the effects of stratification can be neglected. MIKE21 Flow is a proven and accepted numerical modelling tool for coastal applications.
The hydraulic model of Port Phillip Bay was simulated using typical summer and winter wind conditions and spring/neap tidal cycles. The resulting circulation patterns at Portarlington produced by the model have then been analysed. The current information has been extracted at an approximate depth of 5.5 metres.
The results of the hydraulic model indicate that circulation at Portarlington is dominated by the influence of tidal currents associated with the flood and ebb of the tide in Corio Bay. Wind driven currents related to seasonal wind patterns are considered to have a relatively minor impact on both the magnitude and direction of the prevailing tidal current driven circulation at Portarlington.
Under typical flood tide conditions at Port Phillip Heads, a generally westerly flow is generated at Portarlington as the tide rounds the Bellarine Peninsula and enters Corio Bay. Typical current speeds at Portarlington during a flood tide range between 0.1 to 0.2 m/s. Figure 2-1 shows typical predicted current speeds and directions in the vicinity of Portarlington during a flood tide.
Under typical ebb tide conditions at Port Phillip Heads, a generally easterly flow is generated at Portarlington as the tide drains from Corio Bay and rounds the Bellarine Peninsula towards the heads. Typical current speeds at Portarlington during an ebb tide range between 0.08 to 0.15 m/s. Figure 2-2 shows typical predicted current speeds and directions in the vicinity of Portarlington during an ebb tide.
The model results show that the flood tide currents are generally stronger than the ebb tide currents. That is, there is a flood tide dominance of the currents at Portarlington. This can have implications with regard to coastal processes in the area, particularly with respect to the sediment transport regime. The sediment transport regime and its implications on the proposed Harbour development are discussed in Section 2.4.

Portarlington Safe Harbour – Coastal Processes Investigation
J538/R01, May 2007, Rev 5 Page 5
1 m/s
Current speed (m/s)Above 0.4
0.3 - 0.40.2 - 0.30.1 - 0.2
0 - 0.1Below 0
01/12/2003 05:00:00 Scale 1:100000
20 22 24 26 28 30 32 34 36 38(kilometer)
31
32
33
34
35
36
37
38
39
40
41
42
43
44
45
(kilo
met
er)
Figure 2-1 Typical Flood Tide Current Speed and Direction
1 m/s
Current speed (m/s)Above 0.4
0.3 - 0.40.2 - 0.30.1 - 0.2
0 - 0.1Below 0
01/16/2003 03:00:00 Scale 1:100000
20 22 24 26 28 30 32 34 36 38(kilometer)
31
32
33
34
35
36
37
38
39
40
41
42
43
44
45
(kilo
met
er)
Figure 2-2 Typical Ebb Tide Current Speed and Direction

Portarlington Safe Harbour – Coastal Processes Investigation
J538/R01, May 2007, Rev 5 Page 6
2.2 Sea Level Water levels at Portarlington Harbour have been adopted from available long term information at Williamstown in northern Port Phillip Bay. Operational tidal levels at Williamstown are considered an appropriate representation of levels at Portarlington as the spatial variation in tides within Port Phillip is limited.
Extreme tide levels at Williamstown are generated as a combination of high tides in the bay in combination with storm surge and wind set up. These levels may be higher at Williamstown compared to Portarlington, and are considered an appropriately conservative estimate of extreme tide levels at Portarlington. Table 2-1 below present the tidal levels for Williamstown.
Table 2-1 Tidal Levels - Williamstown
Tidal Elevation Height
(m AHD)
Highest Recorded Tide 30/11/1934 (1874-2004) (Adopted 100 Year Design Water Level) 1.33
1 Year Design Water Level 0.9 – 1.0
Highest Astronomical Tide (HAT) 0.52
Mean Higher High Water (MHHW) 0.42
Mean Lower High Water (MLHW) 0.12
Source: Victorian Tide Tables 2004, Port of Melbourne Corporation The highest recorded tide at Williamstown is typically adopted at the 100 year tide level for the Port Phillip Bay. The 1 year design water level has been derived and adopted from a review of available water level information at Williamstown. It includes provision for tide, storm surge and wind set up. The levels in Table 2-1 are provided for design and operational considerations associated with the Harbour development.
2.3 Wave Climate Within much of Port Phillip Bay, the wind and corresponding wave climate are the dominant physical forces impacting the coastline and coastal processes.
2.3.1 Wind Historical wind climate data for Portarlington was sourced from Point Wilson. An eight year period between the 1 January 1990 and 1 January 1998 was analysed. Seasonal variation in the wind climate experienced at Portarlington was quantified by analysing the historical wind data during the summer months and winter months respectively.
The wind climate has been presented visually in the form of wind roses at 22.50 direction intervals and 2.5m/s speed intervals for summer months (Figure 2-3), winter months (Figure 2-32) and annually (Figure 2-5).
In broad terms, summer tends to be windier than winter, with less occurrence of calm periods (average wind speed <2.5m/s) and a slightly higher mean wind speed. During winter, winds come predominantly from the western and northern quarters, while in summer, a greater occurrence of winds from the south and easterly quarters are experienced.

Portarlington Safe Harbour – Coastal Processes Investigation
J538/R01, May 2007, Rev 5 Page 7
Wind Speed (m/s)Above 12.5
10 - 12.57.5 - 10
5 - 7.52.5 - 5
Below 2.5
N
Calm7.29 %
Wind Speed (m/s)Above 12.5
10 - 12.57.5 - 10
5 - 7.52.5 - 5
Below 2.5
N
Calm17.89 %
Figure 2-3 Summer Figure 2-4 Winter
Wind Speed (m/s)Above 12.5
10 - 12.57.5 - 10
5 - 7.52.5 - 5
Below 2.5
N
Calm13.32 %
10 %
Figure 2-5 Annual
2.3.2 Waves A MIKE 21 Nearshore Spectral Waves (NSW) model of Port Phillip Bay was used to determine the nearshore wave climate at Portarlington. The model uses available wind information to determine wave height, direction and periods throughout Port Phillip Bay. The model was used to develop a correlation matrix where various combinations of wind speed and direction are input and simulations are undertaken to produce corresponding wave characteristics. The Point Wilson station wind climate is then processed through the correlation matrix to develop a wave climate at Portarlington. The wave climate developed using this methodology assumes maximum attainable wave heights are fetched limited. This is considered a reasonable assumption for waves generated within Port Phillip Bay.
The wave climate at Portarlington has been derived at a location directly offshore of Portarlington in approximately 2.0 metres water depth. The wave height distributions displayed are expressed as the significant wave height (Hs), defined as the average height of the highest third of all waves. Under normal sea conditions the maximum wave experienced could be expected to be up to double the significant wave height.

Portarlington Safe Harbour – Coastal Processes Investigation
J538/R01, May 2007, Rev 5 Page 8
Wave Height (Hsig.) (m)Above 10.75 - 10.5 - 0.75
0.25 - 0.50.1 - 0.25
Below 0.1
N
Calm61.87 %
Wave Height (Hsig.) (m)Above 10.75 - 10.5 - 0.75
0.25 - 0.50.1 - 0.25
Below 0.1
N
Calm41.74 %
Figure 2-6 Summer Figure 2-7 Winter
Wave Height (Hsig.) (m)Above 10.75 - 1
0.5 - 0.750.25 - 0.5
0.1 - 0.25Below 0.1
N
Calm51.76 %
10 %
Figure 2-8 Annual
The north facing location and limited westerly fetch exposed at Portarlington provides significant protection from waves generated from the dominant southerly summer winds and winter westerly winds. For these reasons the wave climate at Portarlington is considered rather subdued when compared with other locations on western and south facing locations around Port Philip Bay. The limited westerly fetch results in generally small waves (<0.5m) from the west and north-west with short mean wave periods (Tm) of between 1-3 seconds. Portarlington is exposed to larger waves (>0.5m) generated by north through to north easterly winds. These larger waves generally have mean wave periods of between 2-4 seconds.
2.4 Sediment Transport The transport of sediment along the coast of Port Phillip Bay is largely driven by littoral currents associated with the oblique approach to the coast of waves generated within Port Phillip Bay. The influence of tidal and wind driven currents within northern Port Phillip Bay are generally considered a minor contributor to the overall sediment transport volumes. The direction and magnitude of the sediment transport is therefore closely correlated with the seasonal pattern and size of waves within Port Phillip Bay.
Analysis of the wave climate developed for Portarlington reveals that on an annual basis, waves approach Portarlington with an almost equal percentage of easterly and westerly direction components. Waves from the east are in general however somewhat larger than those arriving from the west which would imply a general net westward sediment transport.
Based on the wave climate analyses, it is probable that most of the net westward sediment transport will occur in the summer months. During winter however, it is probable that the net sediment transport will be close to neutral, or that there may even be a small net easterly transport. Unfortunately none of the historical aerial photography of the coastline that could

Portarlington Safe Harbour – Coastal Processes Investigation
J538/R01, May 2007, Rev 5 Page 9
be sourced was taken during the winter months, so seasonal changes in the direction of sediment transport cannot be identified from the build up of sand on features in the photos.
During periods of northerly waves, when the wave driven sediment transport at Portarlington will be close to neutral, there may still be a net westerly sediment transport due to the dominance of the westerly flood tide current in the area. This is because the net westerly current will result in the net westerly transport of fine sand entrained in the water column due to wave action.
Although there is potential for west to east sediment transport during periods of northwest waves, there is little opportunity for this to occur in practice. This is because sediment that is transported westward along the coast by the net transport in the area will become trapped within the harbour. This material will then unavailable to the littoral regime.
Parks Victoria undertake maintenance dredging of the harbour and have estimated that up to approximately 21,000 m3 of material is required to be removed every 2 to 4 years on average. This would imply an average gross transport of between 5–10,000 m3 a year. This is considered consistent with transport rates observed in other locations within Port Phillip Bay. However, it should be noted that this number is the gross sediment transport at the harbour. That is, the amount of sand transported into the harbour from the east during north-easterly waves plus the amount of sand transported into the harbour from the west during west and north-westerly waves.
The net westerly transport is likely to be significantly lower than the gross sediment transport. Further investigations would be required to quantify the actual net transport rate; however, it may be in the order of 1-2,000 m3/year.
Dredged material from the harbour is reported by Parks Victoria to contain clean fine sand. This material is deposited on the beach to the west of Portarlington Harbour. Bellarine Bayside Foreshore Committee of Management (BBFCM) staff report that the dredged sand is general rapidly transported westward over a period of one to two months. While the rapid transport of the dredged sand is considered partly due to the small grain size distribution of the dredged material, it also illustrates that the potential transport rate is in excess of the littoral supply at Portarlington.
Depending on the degree of erosion along the beach and availability of sand at Point Richards, sand extracted from Point Richards is also used to patch local erosion scarps along the beaches. The quantity of material transported is however considered minor and is not undertaken in an attempt to balance the sediment deficit caused by the disruption of the longshore transport at the Portarlington Harbour.
2.5 Historical Coastline Changes A search of available aerial photography was undertaken at the Victorian Land Information Centre. Copies of suitable photographs were obtained for 1950, 1962, 1968, 1969, 1974, 1984, 1990 and 2001. The aerial photographs were scanned and geo-referenced in a GIS. A review of the available historical photography was undertaken to assess the status of shoreline evolution and dynamics in the vicinity of Portarlington.
Precise comparisons are difficult to make due to the varying quality and scale of the different photos, however a close examination of the coastline in the vicinity of Portarlington provided the following key observations:
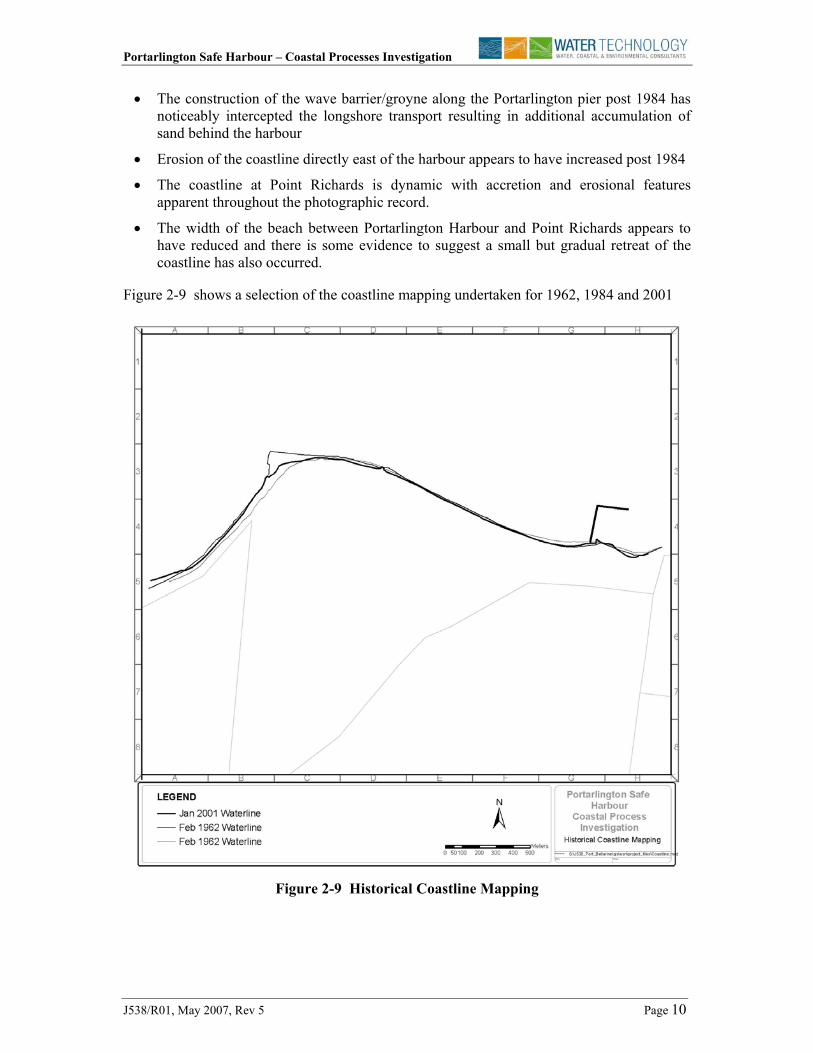
x The coastline in the immediate lee of the breakwater has in general been gradually advancing
Portarlington Safe Harbour – Coastal Processes Investigation
J538/R01, May 2007, Rev 5 Page 10
x The construction of the wave barrier/groyne along the Portarlington pier post 1984 has noticeably intercepted the longshore transport resulting in additional accumulation of sand behind the harbour
x Erosion of the coastline directly east of the harbour appears to have increased post 1984
x The coastline at Point Richards is dynamic with accretion and erosional features apparent throughout the photographic record.
x The width of the beach between Portarlington Harbour and Point Richards appears to have reduced and there is some evidence to suggest a small but gradual retreat of the coastline has also occurred.
Figure 2-9 shows a selection of the coastline mapping undertaken for 1962, 1984 and 2001
Figure 2-9 Historical Coastline Mapping
Portarlington Safe Harbour – Coastal Processes Investigation
J538/R01, May 2007, Rev 5 Page 11
2.6 Water Quality The Port Phillip Bay Environmental Study (Harris et al 1996) concluded that water quality in the Bay was generally good, and that there is a relative lack of organic nitrogen in the water making the system nitrogen limited. This conclusion was drawn from the analysis of Bay wide water quality monitoring results, including monitoring of a location offshore from Portarlington. Additionally, toxicants measured Bay wide during the study were found to be well below levels which are considered hazardous. Considering the lack of industry and modest levels of development in the area, it is expected that the water quality in the general vicinity of Portarlington will be similar to, or better than, the Bay wide averages. The main risk to the water quality in the vicinity of the harbour will be stormwater runoff discharged from the outfall pipe immediately to the east of the harbour (see below). The effect of this outfall will depend upon the wind, and tidal and wind-driven currents existing at the time of discharge. In this respect, it is noted that the EPA monitors faecal indicator organisms at Portarlington beach over the summer months as part of their Beach Report Program. Cumulative counts for Entercocci for the past 4 years (2002-2006) are reported as 10 orgs/100mL, with the 75th and 95th percentiles reported as 31 and 234 org/100mL, respectively (EPA, 2006). Higher counts are generally recorded after periods of rain and associated stormwater runoff. Overall, the monitoring results at Portarlington beach are considered good and reflect the modest level of development around Portarlington.
2.7 Site Inspection A site inspection at Portarlington and surrounds was undertaken on the 11 January 2006 to collect sediment samples and document the state of the coastline. A brief summary of the major features and observations taken are presented for the following sections of coastline:
x Coastal Cliffs and Rock Platforms East of Portarlington Harbour
x Portarlington Harbour
x Portarlington Beach West of Portarlington Harbour
x Point Richards
2.7.1 Coastal Cliffs and Rock Platforms East of Portarlington Harbour Evidence of a relatively recent erosional event was evident with some minor slumping of the cliffs and undermining of the stormwater drain outfall immediately east of the harbour. Seagrass strands were evident approximately 0.5 m up the cliff face in some locations indicating storm surge and wave attack at the base of the cliff was significant and sustained. Some very small, shallow deposits (< 50 mm depth) of sand were observed close to the base of the cliffs. This sand was considered to have a very uniform, small grain size and contained no traces of shell grit. Figure 2-10 shows the extent of the recent erosion and undermining of the stormwater drain immediately east of the Harbour.

Portarlington Safe Harbour – Coastal Processes Investigation
J538/R01, May 2007, Rev 5 Page 12
Figure 2-10 Recent Erosion and Undermining of Stormwater Drain Outfall
2.7.2 Portarlington Harbour Depths on the tip of the cuspate spit were estimated at only approximately 0.5 metres. This estimate was taken close to the 5:13pm high tide at Port Phillip Heads of 0.65 metres (AHD). Figure 2-11 shows bathers wading out along the cuspate spit nearing hide tide.
The sand on the cuspate spit was considered very fine grained and uniform. The sand on the beach behind the lee of the breakwater was considered medium to medium coarse grained it was however, poorly graded with a component of very fine grains and coarse shell grit evident. There was evidence to suggest a proportion of the sand located on the beach had been recently transported there and used to build up the beach.
The impact of the groyne alongside the pier in trapping the longshore westward transport was evident, with the beach set back an estimated 10 to 15 metres on the western side. Figure 2-12 displays the impact of the groyne alongside the Portarlington Harbour pier.

Portarlington Safe Harbour – Coastal Processes Investigation
J538/R01, May 2007, Rev 5 Page 13
Figure 2-11 Cuspate Spit Behind Portarlington Harbour Breakwater
Figure 2-12 Impact of Groyne Alongside Portarlington Harbour Pier
Portarlington Safe Harbour – Coastal Processes Investigation
J538/R01, May 2007, Rev 5 Page 14
2.7.3 Portarlington Beach West of Portarlington Harbour The condition of the beach approximately 500 metres west of Portarlington Harbour was inspected. The beach was relatively narrow at approximately 10 to 15 metres wide and was considered reasonably steep.
The sand sample taken in the swash zone was considered to be medium grained and uniform. The sand sample taken at the back of the berm was considered to be medium grained but was poorly sorted with components of fine grained and coarse grained sand and shell grit evident. There was evidence to suggest that sand had been recently transported to this section of beach which is consistent with BBFMC activities.
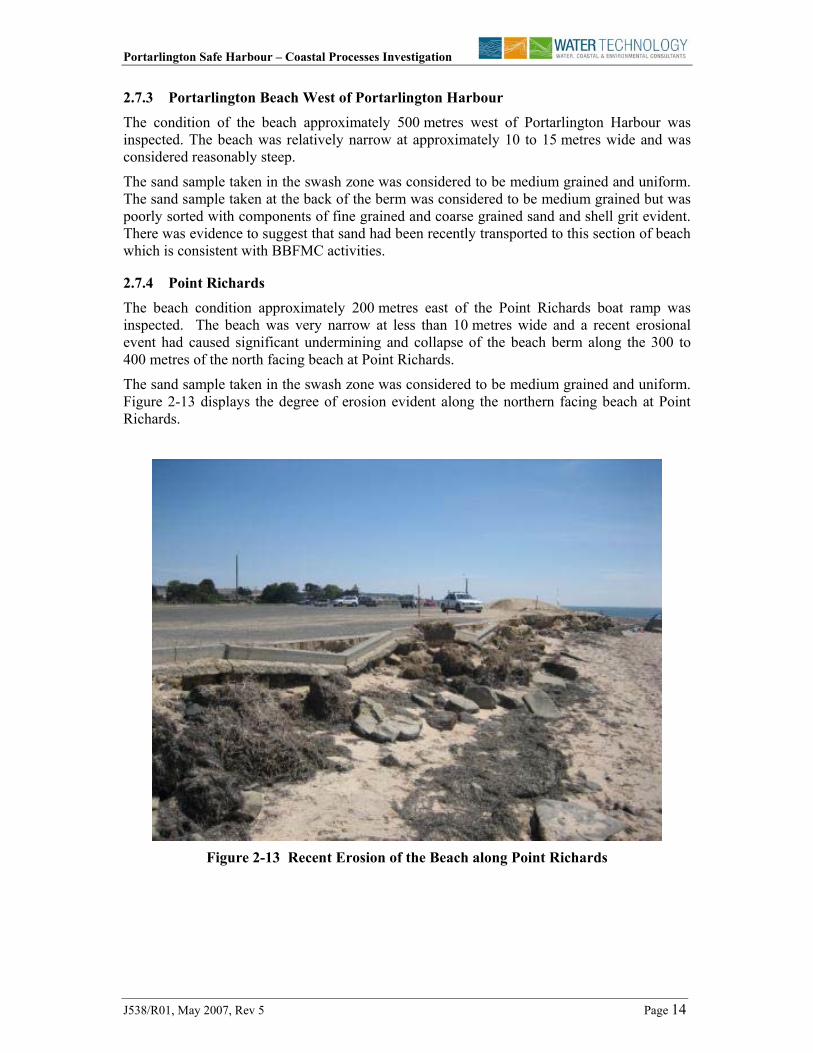
2.7.4 Point Richards The beach condition approximately 200 metres east of the Point Richards boat ramp was inspected. The beach was very narrow at less than 10 metres wide and a recent erosional event had caused significant undermining and collapse of the beach berm along the 300 to 400 metres of the north facing beach at Point Richards.
The sand sample taken in the swash zone was considered to be medium grained and uniform. Figure 2-13 displays the degree of erosion evident along the northern facing beach at Point Richards.
Figure 2-13 Recent Erosion of the Beach along Point Richards

Portarlington Safe Harbour – Coastal Processes Investigation
J538/R01, May 2007, Rev 5 Page 15
3 IMPACT OF EXISTING HARBOUR ON COASTAL PROCESSES
As discussed above, the average gross sand transport along the coast at Portarlington is in the order of 5–10,000 m3 a year, while the net westerly transport rate is likely to be significantly lower and may in the order of 1-2,000 m3/year. Additionally, the net sediment transport is limited by the rate of supply of sand from the east.
The existing harbour provides a major disruption to the alongshore transport of sand in the area. This is due not only to the presence of the offshore breakwater, but also to the groyne along the shoreward end of the jetty. In combination, these provide an almost complete barrier to the alongshore transport of sand in the area.
The combination of sheltering and wave diffraction around the ends of the offshore breakwater has caused an accumulation of sand in the lee of the breakwater. This mechanism traps most of the sand transported into the harbour from both the west and the east. That is, the harbour acts as a trap for most of the gross longshore transport of sand in the area. Over time, this has resulted in the formation of the cuspate spit that covers much of the area behind the breakwater. This spit locks up a significant quantity of sand that would otherwise be available to the littoral regime.
Without routine dredging, the accretion of sand in the lee of the breakwater could ultimately be expected to connect with the offshore breakwater.
The construction of the wave barrier or groyne along approximately 50 metres of the nearshore end of the pier also appears to be trapping sand at the coastline and further disrupting the longshore transport to the west.
The disruption of the longshore transport regime and accumulation of sand in the cuspate spit at Portarlington Harbour reduces the littoral volume of material available to replenish the beaches to the west, resulting in narrow, denuded beaches which are prone to erosion.
A secondary impact of the existing harbour on coastal processes may be increased localised erosion of the cliffs directly to the east of the offshore breakwater. The diffraction of waves around the breakwater is possibly intensifying the wave energy reaching the coast at this location and exacerbating the rate of erosion observed.

Portarlington Safe Harbour – Coastal Processes Investigation
J538/R01, May 2007, Rev 5 Page 16
4 IMPACT OF PROPOSED HARBOUR DEVELOPMENT ON
COASTAL PROCESSES
4.1 Coastal Processes A concept for the safe harbour has been included in the Stratcorp CW Business Case Report (2005). A copy has been included as Figure 4.1. This concept shows an almost fully enclosed harbour with the offshore breakwater extended to both the east and west, a reclamation area built out from the shore at the eastern end of the harbour, and a wave screen constructed along the western side of the existing jetty alignment.
Figure 4-1 Safe Harbour Concept prepared for Parks Victoria The impacts on the coastal processes of the three main components of the proposed harbour development are discussed separately below:
Breakwater Extension The extension of the width of the breakwater will increase the length of sheltered shoreline in the lee of the breakwater. This will in turn increase the width over which the cuspate spit can develop and will increase the quantity of sand locked up that would otherwise be available to the littoral regime. The increased sheltering of the shoreline is also likely to further reduce the small net westward sediment transport that may be occurring past the breakwater during large north easterly wave episodes. The increased sheltering will also protect the beach to the immediate west of the jetty from north-easterly wave action and would be expected to also result in a build up of the beach in this area.
Portarlington Safe Harbour – Coastal Processes Investigation
J538/R01, May 2007, Rev 5 Page 17
The approximate doubling of the length of the breakwater could be expected to trap almost the entire gross transport rate of 5-10,000 m3/year.
Eastern Reclamation The proposed reclamation area at the eastern end of the harbour will act both as a secondary breakwater, protecting the harbour from easterly waves, and as groyne that would be expected to interrupt the net westward sediment transport regime. Accretion of sand on the eastern side of the reclamation would be expected to occur at the net alongshore transport rate, which may be of the order of 1-2,000 m3/year. Given time, a small beach may be reinstated to the east of the harbour, and could provide a degree of protection to the coastal cliffs in the area, which appear to be undergoing locally increased rates of erosion.
In the absence of the western wave screen, accretion in the lee of the breakwater would still be expected to occur through easterly sand transport caused by west and northwest wave action. The build up would, however, be at a reduced rate equal to the existing eastward sediment transport rate.
Western Wave Screen In a similar manner, the construction of the wave screen the western side of the existing jetty alignment would provide protection to the harbour from west and northwest waves. Although the wave screen is open for the first metre above the sea bed, it would still be expected to act as a barrier to both the eastward and westward sediment transport along the coast at this point.
The reasoning behind having the wave screen only penetrating the upper part of the water column is unclear. Although it will allow for some enhanced exchange of water, due to tidal and wind-driven currents (that is, enhanced mixing), it will also allow some penetration of westerly waves in to the harbour, where the boats are moored north-south (that is, beam on to the in-coming wave action).
Additionally, it is noted that the existing jetty is in poor repair and will need to either be replaced or undergo significant repair work. The construction of an independent pile and panel wave screen will add a significant cost to these works. As an alternative, it is considered that replacing the jetty with a rubble mound structure may be a more cost effective solution to providing both vehicular and pedestrian access to the harbour, and protection to the harbour from westerly wave action.
In the absence of the eastern reclamation, any westerly alongshore sediment movement would become trapped within the harbour, in much the same way as it does at present.
The wave screen in combination with the existing groyne would also interrupt any eastward sediment transport. In this respect, it noted that the wave screen and extended breakwater would shelter the beach area to the west of the existing jetty from east and northeast wave action. As a result, some localised accretion would be expected to occur in this area during periods of west and northwest wave action. The volume of sand involved would be removed from the system and would be prevented from migrating in the net westward direction due to the sheltering from northeast waves.
Overall Effect In practice the impacts on coastal processes of the various coastal structures are interrelated and impacts of a particular combination of components is not necessarily the sum of the impacts of each individual component. Consideration should be given to the combined impact of various development proposals on coastal processes as the total impact may be more (or

Portarlington Safe Harbour – Coastal Processes Investigation
J538/R01, May 2007, Rev 5 Page 18
less) than the sum of the individual components. In this respect, it is noted that a harbour comprising all three components (extended offshore breakwater, western groyne and eastern groyne) would:
x Provide the greatest area of protected water for moorings
x Prevent sedimentation of the harbour, thereby minimizing maintenance dredging requirements
x Trap only the net westward alongshore sediment transport at the eastern reclamation
Overall, it would be expected that a proposed new harbour comprising all three components, as above, will have less impact on the coastal processes in the area, and will require less maintenance dredging than the existing harbour.
Southern Hardstand Area The presence, or otherwise, of the hardstand area proposed for the southeast corner of the harbour is unlikely to have any effect on coastal processes, and is unlikely to have any significant impact on the mixing processes within the harbour (discussed below). 4.2 Capital and Maintenance Dredging Requirements Capital Dredging A preliminary assessment of the volume of material to be dredged from the harbour has been made using the limited hydrographic survey undertaken by Parks Victoria in combination with interpreted depths from navigation charts of Port Phillip Bay. The excavation volume required to provide depths of -3.0m AHD in the navigable harbour area has been estimated to be in the order of 48,000 m3. Increasing the navigable depth to -3.5m AHD (i.e., -3.0m to Chart Datum) will increase this volume to be about 69,000 m3. More recent detailed hydrographic survey of the entire harbour area will be required before a more accurate estimate of the dredge volume can be made.
It is clear that much of the material to be dredged from the harbour will be sand and silty sand associated with the build up of the cuspate spit described in Section 2. There is, however, no information available regarding the nature of the remaining sediments to be dredged. It is likely that a significant proportion of the underlying sediments will comprise silts and clays, and that rock similar to that which is exposed in the adjacent inter-tidal reef areas may also be encountered.
The dredging method to be used will be very dependent upon the properties of the material to be dredged. For sand, silty sand, silts and clays, a cutter suction dredge is likely to be the most effective plant. This type of plant generates relatively little turbidity at the dredge site, but has the problem of dealing with large volumes of turbid water at the disposal site. Silt screens and/or detention basins may be required to control turbidity at the disposal site. The excavation of harder rock may require a pneumatic/hammer type system to break up the rock, with subsequent removal by grab or excavator.
Although relatively fine, the sand and silty sand could be used for beach nourishment, or may be suitable for the reclamation work associated with the eastern reclamation or the hardstand area. Silt and clay material may also be suitable for the reclamation works, but is likely to require a significant period of time (of the order of years) for dewatering and consolidation, before it can be built on. Alternatively, disposal to sea may be an option.

Portarlington Safe Harbour – Coastal Processes Investigation
J538/R01, May 2007, Rev 5 Page 19
Indicative cost for the deployment of a small cutter suction dredge and dredging and disposing of clean sand within reasonable proximity to the dredge may be of the order of $5 to $10 per cubic metre. However, it is considered that more detailed geotechnical investigations will need to be undertaken to determine the composition of the bed material before even indicative costings for the capital dredging can be undertaken.
Maintenance Dredging As discussed above, the full harbour proposal would prevent sedimentation of the harbour, and would trap only the net westward alongshore sediment transport at the eastern reclamation. This will minimise the requirement for maintenance dredging, which would then be limited to periodic bypassing of sand accumulated at the eastern side of the harbour. The rate of this bypassing requirement will be at the rate of the net westward littoral drift, which has been estimated to be in the order of 1-2,000 m3/year.
Overall, it would be expected that the proposed new harbour will have less impact on the coastal processes in the area, and will require less maintenance dredging than the existing harbour. 4.3 Water Quality Potential water quality risks to the harbour may include; fuel spills, sewage spills, copper accumulation from leaching of antifouling paints, and storm water inputs.
Fuel and sewage spill contamination within the harbour would be managed by appropriate procedures to prevent and/or contain the impact of such incidences.
Water quality within the harbour will largely be determined by the effectiveness of the tidal exchange of harbour water with that of the Bay, and tidal and wind-driven circulations maintaining adequate mixing within the harbour. With respect to the latter, it is noted that variations in the proposed harbour depths associated within the internal beach will assist in developing wind driven currents within the harbour and will assist in mixing.
Of order estimates of the average residence time for the proposed harbour can be developed by estimating the volume of water contained within the proposed harbour and considering the daily tidal exchange into the harbour and assuming a conservative exchange factor. With this method, residence times within the proposed harbour development are estimated conservatively at less than 14 days. Residence times of this magnitude are considered adequate to maintain good water quality conditions within the harbour over the long term. Further, it is noted that whether or not the wave screen is open for the bottom 1.0m of its depth is unlikely to reduce the residence times significantly.
Copper concentrations within the harbour will be a function of the number and size of the vessels moored within the harbour and the rate at which harbour waters are exchanged with the Bay. Based on our experience with similar harbour developments and in the approximate residence times estimated above, it is considered that, although copper concentrations may exceed water quality guidelines locally within the harbour, they are unlikely to have a significant impact on the surrounding Bay water.
In addition to the above, it is noted that relocating the stormwater outfall to deeper water near the end of the eastern reclamation, would be expected to improve the water quality at the coast after rainfall.

Portarlington Safe Harbour – Coastal Processes Investigation
J538/R01, May 2007, Rev 5 Page 20
4.4 Mitigation Options Regular by-passing of sand from the east of the harbour to the beaches in the west would help reinstate the natural westward sediment transport rates in the area. This could be achieved by periodically trucking sand from one side of the harbour to the other, or by the installation of more permanent by-passing plant. By-passing operations would be expected to reduce the impact of the harbour on the overall coastal processes in the area. Our preliminary estimate of the volume of sediment required to be bypassed to reinstate the natural longshore transport rates is of the order of 1-2,000 m3 per year.
As noted above, the beaches in the area are narrow and are prone to erosion during storms. Construction of a series of groynes along the coast between the harbour and Point Richards would be expected to help stabilise the beach in this area. However, without additional sand, the beaches would remain relatively narrow and prone to erosion.
As an alternative, the construction of the harbour could provide an opportunity to carry out more extensive renourishment of the beach. This renourishment could be carried out with, or without the use of groynes to stabilise the renourished beach.
As a minimum, the construction of a groyne approximately 300 – 500 metres west of the harbour may however be required to prevent the migration of littoral sediment eastward into the wave sheltered zone immediately west of the proposed harbour.
It is likely that a combination of sand by-passing, beach re-nourishment and groyne construction will provide the most cost-effective long-term strategy for maintaining the beaches in the area.

Portarlington Safe Harbour – Coastal Processes Investigation
J538/R01, May 2007, Rev 5 Page 21
5 IMPLICATIONS OF CLIMATE CHANGE AND SEA LEVEL RISE ON COASTAL PROCESSES
The Intergovernmental Panel on Climate Change (IPCC) was formed in 1988 to assess the potential impacts of climate change (greenhouse effect) around the world. It is operated by the World Meteorological Organization (WMO) and the United Nations Environment Programme (UNEP) and is recognised as an independent panel. They review the available literature and provide summary reports and information to governments. Their latest report (IPCC Third Assessment Report - Climate Change 2001) provides a range of predicted sea level rises from numerous scenarios and different predictive models. Figure 5-1 shows the IPCC summary of predictions from their report. The range of predicted sea level increases for a 50 year horizon (to the year 2060) varies from 0.05 to 0.40 m with a central value 0.20 m. This level has also been presented in climate change guidelines recently released by the National Committee on Coastal and Ocean Engineering (Engineers Australia 2004).
Global average sea level rise 1990 to 2100 for the SRES scenarios. Each of the six lines appearing in the key is the average of AOGCMs for one of the six illustrative scenarios. The region in dark shading shows the range of the average of AOGCMs for all thirty five SRES scenarios. The region in light shading shows the range of all AOGCMs for all thirty five scenarios. The region delimited by the outermost lines shows the range of all AOGCMs and scenarios including uncertainty in land-ice changes, permafrost changes and sediment deposition. Note that this range does not allow for uncertainty relating to ice-dynamic changes in the West Antarctic ice sheet. (After IPCC, Third Assessment Report - Climate Change 2001)
Figure 5-1 IPCC Greenhouse Sea-level Predictions
Considerable uncertainty exists in predicting the impact of climate induced sea level rises on coastal processes. In terms of shoreline evolution however, two major effects have been generally postulated: landward retreat due to the direct result of inundation associated with

Portarlington Safe Harbour – Coastal Processes Investigation
J538/R01, May 2007, Rev 5 Page 22
increased sea levels; and landward retreat due to possible greater storminess, resulting in larger waves and changes to the direction of wave attack.
On coastlines such as Portarlington, where the potential transport is in excess of the littoral supply, it is considered reasonable to conclude that a degree of landward retreat will occur until a new quasi-equilibrium is achieved. It is however not possible given the present understanding of the effects of climate change and the highly interrelated nature of coastal processes to make firm predictions on the magnitude of any changes.
Current best management practices for coastal zones therefore call for an adaptive approach towards planning and design in the coastal zone. With respect to the Portarlington Harbour development, the National Committee on Coastal and Ocean Engineering (Engineers Australia, 2004 Update) provides the following adaptive options to climate change threats to coasts and coastal infrastructure:
1. Retreat Prevent development in areas near threatened coastlines
Conditional approvals and phasing-out of developments
2. Accomodate Advanced planning to avoid worst impacts
Modification of land use, building codes
3. Protect
x Hard structural options including, dykes, sea walls, revetments and groynes
x Soft structural options including beach nourishment, wetland creation and littoral drift make-up
Any development of the Portarlington Harbour should be designed with an adaptive approach in mind. This approach can exploit the fact that coastal infrastructure such as Portarlington Harbour is rarely static and is likely to undergo major refurbishment or replacement on times scales of 25 to 30 years. This provides a number of opportunities to phase the structural adaption of coastal infrastructure to accommodate any impacts of climate change.
Measures that could be used to mitigate the effects of sea-level rise or increased storminess that may occur, could include:
x Design the breakwater and associated infrastructure to allow for a mean sea level rise of up to 0.4m (the current median estimate for the year 2100).
x Incorporate contingency plans for protection works along the adjacent sections of coast, which in the short to medium-term may include beach renourishment and groyne construction.
It is noted that since the original drafting of this report, the IPCC has revised the estimates of the degree of sea level change that may occur by 2100. Current estimates of sea level rise (for a range of emission scenarios) vary from 0.18m to 0.58m, with a mean of about 0.3m by 2100 (IPCC, 2007). Given the level of uncertainty in the predictions, the difference between the sea level rise predicted by IPCC (2001) of 0.4m, and that predicted by IPCC(2007) of 0.3m, is not considered significant.
Portarlington Safe Harbour – Coastal Processes Investigation
J538/R01, May 2007, Rev 5 Page 23
6 RECOMMENDATIONS
As a result of these investigations, and from experience with similar projects, it is considered that the following additional investigations will be required to provide a more detailed assessment of the likely impacts of the proposed harbour (similar to what might be required to obtain Coastal Management Act consent), and to optimise its final design parameters. These additional investigations would include:
x An assessment of the most appropriate approach for upgrading the existing jetty and constructing the western wave screen (including the consideration of a single rubble mound-based structure).
x Water quality sampling during both dry and wet weather conditions to assess the existing impacts of the stormwater outfall to the east of the harbour.
x An assessment of the likely effects of relocating the stormwater outfall to deeper water out along eastern reclamation.
x A more detailed wave climate analysis to provide a more reliable assessment of design wave conditions.
x More detailed sediment transport calculations to provide a more reliable estimate of the net westward sediment transport rate at Portarlington.
x Boussinesq wave modelling to assess the degree of protection provided by the breakwater and wave screen, and to optimise the dimensions of these structures.
x Hydrodynamic and water quality modelling to confirm residence times, and to assess the degree and extent of any impact of copper leaching from antifouling paints.
x Detailed hydrographic survey of the entire harbour area to allow a more reliable determination of the volume of material to be dredged.
x Detailed geotechnical investigations to characterise the spatial extent and depth of the sediments in the proposed harbour site.
x Sediment sampling and analysis to determine whether there are any contamination issues associated with dredging within the harbour.
x An updated assessment of dredging requirements and dredging methodology, based on more reliable sediment data.
Portarlington Safe Harbour – Coastal Processes Investigation
J538/R01, May 2007, Rev 5 Page 24
7 REFERENCES
Engineers Australia (2004 Update) Guidelines for Responding to the Effects of Climate Change in Coastal and Ocean Engineering, The National Committee on Coastal and Ocean Engineering