mauricio armellini parantap basu altruism, education subsidy and
TRANSCRIPT
EERIEconomics and Econometrics Research Institute
EERI Research Paper Series No 21/2010
ISSN: 2031-4892
Copyright © 2010 by Mauricio Armellini and Parantap Basu
Altruism, Education Subsidy and Growth
Mauricio Armellini and Parantap Basu
EERIEconomics and Econometrics Research Institute Avenue de Beaulieu 1160 Brussels Belgium
Tel: +322 299 3523 Fax: +322 299 3523 www.eeri.eu
Altruism, Education Subsidy and Growth
Mauricio Armellini Parantap Basu*
July 2010
Abstract An optimal education subsidy formula is derived using an overlapping generations model with parental altruism. The model predicts that public education subsidy is greater in economies with lesser parental altruism because a benevolent government has to compensate for the shortfall in private education spending of less altruistic parents with a finite life. On the other hand, growth is higher in economies with greater parental altruism. Cross-country regressions using the World Values Survey for altruism lend support to our model predictions. The model provides insights about the reasons for higher education subsidy in richer countries.
* This paper is an extension of Ch. 2 of Armellini’s PhD thesis (2009). We benefitted from the useful comments and discussions from Thomas Renstrom, Peter Sinclair, Kunal Sen and Indraneel Dasgupta. The usual disclaimer applies.
2
1. Introduction
There is a growing literature on the social desirability of education subsidy.
Should the government directly or indirectly subsidise education or should it be left in
the realm of private decision-making? The literature in this regard can be broadly
divided in two strands. The first strand advocates education subsidy as a redistributive
policy in the presence of credit market imperfections. Such capital market
imperfections pose barriers to poor individuals to finance schooling.1 The second
strand uses a growth-human capital framework to argue that education subsidy is
needed because the private returns to human capital could fall short of the social
returns. Human capital may have a positive spillover on productivity that may not be
privately internalized (Lucas, 1988, Azariadis and Drazen, 1990 and Tamura, 1991).
Education subsidy is needed to correct for this externality. Acemoglu and Angrist
(1999), Bils and Klenov (2000) and Krueger and Lindahl (1999), however, question
this positive externality argument.2
We approach the issue of education subsidy by striking a middle ground
between these two strands of literature. First, in our model we have an extreme form
of capital market imperfection as in Loury (1981) where education cannot be financed
through the credit market. Second, we have endogenous growth via the accumulation
of human capital. Human capital investment is driven by parental altruism which
turns out to be a key determinant of public education subsidy. If parents are less
altruistic towards their children, they will spend less on offspring’s education. This
happens because parents, due to their finite lives, do not internalise the full growth
effects of education by maximizing the discounted stream of utilities of all future
generations. This gives rise to a discrepancy between the private and social returns to
education. A far sighted government needs to correct this externality by instituting an
educational subsidy. The rate of education subsidy is higher in economies where
parents are less altruistic because a far sighted government has to compensate for this
shortfall in schooling investment by subsidising education. More altruistic societies 1 See Saint-Paul and Verdier, 1993, Perotti, 1993 and Benabou, 1999. This view has been challenged by Cameron and Heckman (1998), Cameron and Tabler (2000), Keane and Wolpin (1999) and Shea (2000). 2 The distinction between these two strands is not sharp. There are papers which combine growth and credit market imperfections. Glomm and Ravikumar (1992) argue that public education lowers income inequality but it may lower per capita income unless initial income inequality crosses a threshold. Bandyopadhyay and Basu (2005) make a case for redistributive tax-subsidy measure in the context of human capital and endogenous growth.
3
thus receive less public subsidy to education but grow faster which is the key testable
hypothesis in this paper.3
We establish this key hypothesis by employing a simple overlapping
generations model with limited altruism where parents care only about the immediate
descendant’s welfare. A closed-form formula for the optimal education subsidy is
derived to show the explicit relation between parental altruism and the education
subsidy. We test the key theoretical prediction of the model using cross-country data
and some hitherto unexplored data for parental altruism based on the World Values
Survey. Our cross-country regressions of education subsidy on parental altruism after
controlling for various macroeconomic factors lend support to the key predictions of
the model. Given that governments in rich countries spend systematically more on
education than in poor countries, a new testable hypothesis emanates from our model
whether parents in richer countries are less altruistic. Cross country data lend support
to this hypothesis.
The paper is organized as follows. In the following section, we lay out the
model. Section 3 provides some empirical justification of the model. Section 4
concludes.
2. The Model
At each date there is a continuum of identical agents in the unit interval who live for
two periods. Each such adult agent is attached to a single offspring. During the first
period (date t-1) of their life, agents do not consume; they go to school and transform
the inherited human capital 1�th into a flow income using a linear schooling
technology, 1�tah , where 0�a . The parameter a represents the return to schooling.
In the second period t they allocate their resources between consumption ( tc ) and
child’s education ( tb ). This flow education spending is converted one-for-one into
stock of knowledge ( th ) using a technology: th = tb . As in Loury (1981), we assume
that there is no credit market to finance education spending. The adult receives direct
3 The relationship between public education subsidy and private altruism is a relatively unexplored area of research. To the best of our knowledge, Eckstein and Zilcha (1994) come close to the issue that we address. However, their focus is more on compulsory public education while we look at broader education subsidy.
4
altruistic utility from his immediate descendant’s consumption which is positively
related to the amount the adult spends on his kid’s education. This parental altruism
is formulated by inserting th in parent’s utility function.4
The agent born at date t-1 thus has the following utility function:
(1) �tW )()1()( tt hVcU �� ��
where tW is the adult’s welfare, tc =consumption in period t and th = knowledge
acquired by the individual’s child. The degree of parental altruism is represented by
(1 )�� , as it shows the effect that the parent’s spending on the child’s education has
on utility.
There is a government that imposes a lump-sum tax equal to tT on all
individuals, and subsidises education expenditure at a flat rate t� . An individual born
at date t-1 will thus face the following flow budget constraint:
(2) ttttt hcTah )1(1 ������
The left-hand side of (2) shows the total resources: initial wealth ( 1�tah ) minus the
lump sum tax. The right-hand side of (2) shows the use of the resources, which can be
either spent on consumption or education. The fact that the expenditure on education
is subsidised at a rate t� is reflected in the factor )1( t�� . Individuals maximise (1)
subject to (2).
The government balances the budget and faces the following budget
constraint:
(3) ttt hT ��
The adult chooses his consumption and schooling spending on his offspring treating
the taxes ( tT ) educational subsidy rate ( t� ) as given.
The first order condition for the adult’s problem equates the marginal utility
cost of educational investment (net of education subsidy) to the marginal altruistic
utility gain:
4 The altruism in our model is limited in the sense that the adult cares only about the immediate descendant’s welfare. The modelling of parental altruism follows Glomm and Ravikumar (1992) and Bräuninger and Vidal (2000).
5
(4) )('1)(')1( ttt hVcU��� �
��
Using (2) and the government budget constraint (3), (4) can be rewritten as:
(5) )('1)(')1( 1 tttt hVhahU��� �
��� �
The comparative statics effect of a change in education subsidy on schooling and
consumption spending of the adult is thus given by:
(6) )](''1)('')1[(
)(' 1
ttt
tt
t
t
hVcU
hahUh
���� �
��
���
�� � >0
and
(7) t
t
t
t hc�� ��
���� <0
The total expenditure on education (ht) is positively related to the rate of subsidy
while the adult’s consumption is negatively related to the subsidy.
Private Desirability of Education SubsidyIs a higher education subsidy beneficial for private welfare? To investigate this
differentiate the private welfare (1) with respect to t� , use (7) and set the partial
equal to zero to obtain the first order condition for optimal education subsidy.
(8) 0)].(')1()('[ ���
���t
ttt
hhVcU�
��
Since t
th���
is positive as shown in (6), the necessary condition for privately optimal
education subsidy must satisfy
(9) )('.1)(' tt hVcU���
�
Comparison with (5) immediately reveals that the optimal education subsidy must be
zero. We thus have the following proposition.
Proposition 1: The privately optimal education subsidy ( t� ) is zero for all t.
6
Education subsidy is thus not privately desirable. The result follows from the basic
principles of uniform commodity taxation. Since consumption is not taxed or
subsidised, the optimal subsidy to education must be zero. The adult is thus worse off
with an education subsidy. To see this more clearly, take a parametric example.
Assume that the adult’s utility function (1) is logarithmic. In other words,
(10) tW = tt hc ln)1(ln �� ��
which implies the following consumption and education policies for the adult:
(11) ttt Tahc �� �1.�
(12) ttt Tahh ���
� �111
��
Plugging the government budget constraint (3) into (11) and (12) one obtains the
following equilibrium policy rules:
(13) 1.1
)1.(��
�� t
tt hah
���
(14) 1.1
)1(.��
�� t
t
tt hac
����
which upon substitution in (10) and differentiation with respect to t� yields:
(15) ttt
tW���
��
� ��
���
��
11
The two terms on the right hand side of expression (15) represent the private marginal
cost and benefit (respectively) of increasing subsidies: more subsidies decrease
parent’s consumption ���
���
��
�� 0
t
tc�
, which is a cost in terms of utility. At the same
time, more subsidies increase expenditure on education ���
���
��
�� 0
t
th�
and thus give
greater utility to parents. As long as 0 1�� � , the marginal costs are greater than the
marginal benefits. Parents are thus worse off with a higher education subsidy. Even
though higher education subsidy promotes growth, altruistic parents do not internalize
this growth effect of an education subsidy.
7
Socially Optimal Education SubsidyWe now turn our attention to designing an optimal education subsidy when the
government is far sighted and benevolent in the sense that it takes into account the
welfare of finitely lived future generations. The government takes the private sector
behaviour as given and commits to a sequence of education subsidy { t� } that
maximizes the discounted stream of indirect utilities of all generations. Doing so, the
government arrives at a socially optimal education subsidy.
We solve the socially optimal education subsidy in two steps. First, we solve the
far sighted government’s problem setting up a fictitious social planning problem. The
planner solves the intertemporal allocation of consumption ( tc ) and human capital
( th ) taking into account the welfare of the future generations. From the social
planner’s problem, we work out the social intergenerational marginal rate of
substitution in consumption. In the next step, from the adult’s private optimization
problem we work out the education subsidy which reproduces the social marginal rate
of substitution in consumption.
The social planning problem is given by:
(P) Max )]()1()([0
ttt
t hVcU ��� ����
�
s.t. 1��� ttt ahhc
The first order condition for the social planning problem (P) is given by:
(16) )(')('1)(' 1���
� ttt caUhVcU ���
The social planner equates the marginal utility cost of education spending to the
instantaneous marginal utility benefit of education spending plus the discounted future
marginal utility of consumption of the future generation. The private agent fails to
internalize the growth effect of education spending and that is why the term
)(' 1�tcaU� does not appear in adult’s first order condition (4). This difference
between the social and private benefits of education spending is an externality that the
government needs to correct by formulating the right education subsidy.
Comparing (4) with (16), it immediately follows that the socially optimal education
subsidy is:
8
(17) )(')(' 1
t
tt cU
cUa �� ��
The socially optimal education subsidy is thus positive while in contrast the privately
optimal education subsidy is zero. The education subsidy is proportional to the
marginal product of human capital ( a ) and the social intertemporal marginal rate of
substitution in consumption.
For a logarithmic utility function as in (10), a closed form expression for the
socially optimal education subsidy exists. We have the following proposition:
Proposition 2: If tW = tt hc ln)1(ln �� �� , a far sighted government sets the
optimal education subsidy at a constant level given by:
(18) )1.(1 ��
����
�
and the socially optimal balanced growth rate is given by:
(19) 1
[1 (1 )]t
t
h ah
� ��
� � �
Proof: Appendix.
The optimal education subsidy is negatively related to the degree of parental altruism.
In other words, � decreases with ��1 . This means that in countries with greater
parental altruism, education subsidy will be lower. Intuitively, when parents are
altruistic enough to naturally spend on their children’s education, there is less need for
a government subsidy. The government has to compensate for the lack of parents’
altruism via subsidies. For example, as evident from (18) in a non-altruistic society
( 1� � ), the rate of subsidy will tend to 100% ( 1� � ).
Second, the optimal education subsidy is positively related to � . A forward-
looking government that looks after the future generations has to care about growth.
The parameter � represents the degree of benevolence or foresightedness of the
government. At one extreme, if the government values the future generations as
much as the present (� �1), then (18) means that 1� � , which is the maximum level
of subsidy (100% subsidy). At the other extreme, a completely short-sighted
government ( � =0) will set 0�� . Greater foresight of the government means higher
subsidy to education.
9
Finally, the optimal growth rate (19) is higher in economies with a greater
altruism (lesser � ) and greater foresight of the government (larger � ). Comparison
with (13) immediately reveals that the socially optimal growth rate is higher than the
privately optimal growth rate, (1 )a �� which is obtained by plugging � equal to zero
in (13). The difference between social and private growth rates is ��a which
represents the degree of externality. This term basically consists of an interaction
between returns to education ( a ), the lack of private altruism (� ) and government
benevolence or foresight (� ). This clearly demonstrates the role of a benevolent
government who cares for growth while designing an optimal education subsidy.
The two key testable hypotheses thus originate from the model which can be
summarized by the following proposition.
Proposition 2 (i) The optimal education subsidy is higher if the degree of private
altruism ( )� is lower, and the social rate of discount is lower ( �/1 ).
(ii) The growth rate is higher in economies with greater private altruism and lower
social rate of discount.
In the next section, we look for empirical support for these two hypotheses
using cross country data.
3. Cross-Country Relation between Altruism, Education
Subsidy and Growth DataMeasuring Education Subsidy
There is no internationally comparable indicator for the level of subsidies to
education, which comes closest to the model � . We construct a proxy for this by
computing the ratio of public expenditure on education to the total expenditure on
education. The total expenditure on education is the sum of private and public
spending on education. For example, if an individual spends h on education, a rate of
subsidy � means that the individual receives a subsidy of �.h units. This means that
out of total expenditure on education h, only �.h units are public subsidy to
education. Thus,
10
.Public expenditure on educationTotal expenditure on education . (1 ).
t
t t
hh h
� �� �
� �� �
The appendix details the data sources for public and private spending on education.
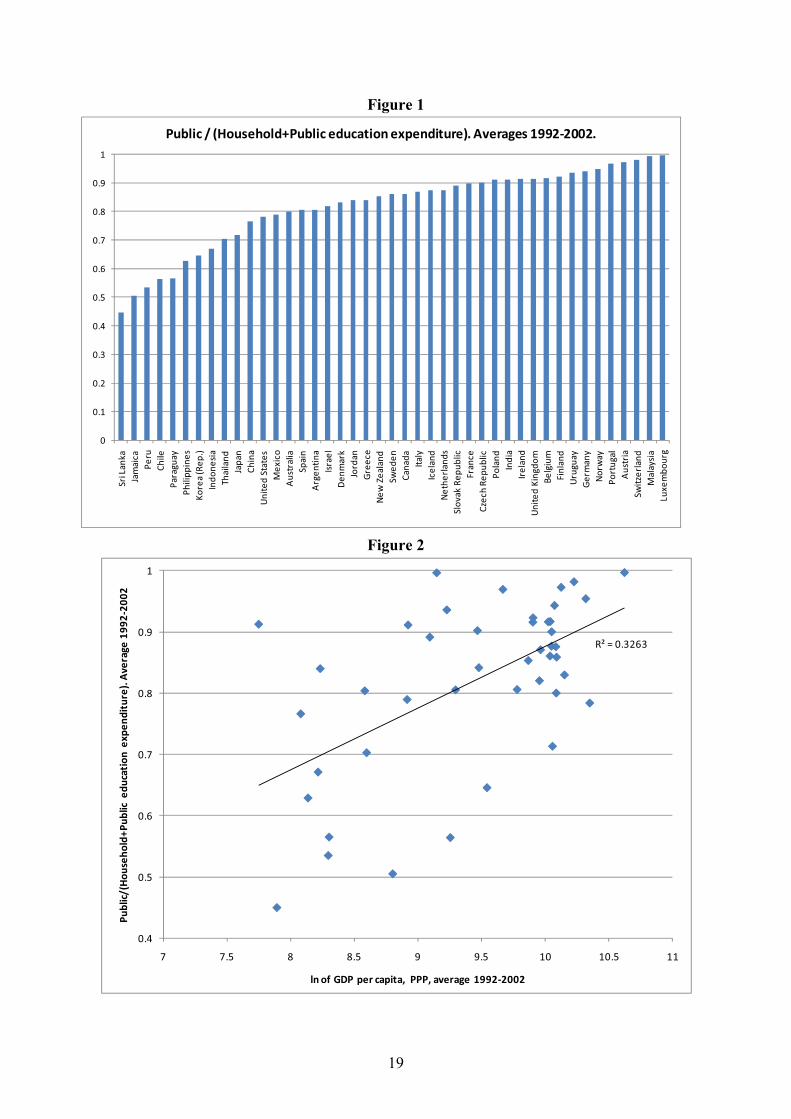
In the regression reported later, we label this measure as Subsidies. Figure 1
plots this for all the countries in our sample. Subsidies range from about 45% to 99%
which shows a substantial variation. Figure 2 plots Subsidies against log of GDP per
capita. Rich countries subsidise education more than poor countries.
<Figures 1 and 2 come here>
Proxy for Altruism
Our proxy for altruism comes from the question A026 of the World Values
Survey5, reproduced here:
“Which of the following statements best describes your views about parents'
responsibilities to their children?: A- Parents' duty is to do their best for their
children even at the expense of their own well-being; B- Parents have a life of their
own and should not be asked to sacrifice their own well-being for the sake of their
children”.
The proxy for altruism is the percentage of people choosing answer A from the
previous question in each country. The survey is carried out in different years in
different countries, and most countries have only one available observation for the
period 1994-2004 (where there are two available observations for a country we take
the average of these two). We call this proxy Altruism. 6 While arguably this could be
an imperfect measure of parental altruism, to the best of our knowledge this is the first
time this World Values Survey is used to identify altruism as a possible determinant
of public education subsidy.7
5 European and World Value Survey four-wave integrated data file, 1981-2004, v.20060423, 2006. The European Values Study Foundation and World Values Survey Association. Aggregate File Producers: ASEP/JDS, Madrid, Spain/Tilburg University, Tilburg, The Netherlands. Aggregate File Distributors: ASEP/JDS and ZA, Cologne, Germany. 6 Previous research has used monetary transfers made by individuals as a proxy for altruism. For example, Bouhga-Hagbe (2006) looks at the remittances of migrant workers as an expression of their altruism. Andreoni (2006) compares altruism across countries by looking at the percentage of cash revenues of the non-profit sector that are received from philanthropy. Castillo and Carter (2002) run behavioural experiments in South African communities, and derive their measure of altruism from the amount of money that the individuals are willing to transfer in their ‘dictator game’. However, these are not real proxies for altruism but rather some of its consequences. Furthermore, those measures tend to be aggregated and not standardised, whereas the measure presented here focuses particularly on preference based altruism from parents to children, which comes closest to the utility function developed in our theoretical model. 7 Alesina et al. (2010) use the world value survey to get a measure of family ties. However, their focus is on the regulation of labour market while we address the issue of education subsidy.
11
Altruism may not be necessarily represented by a continuous variable in the
context of cross-country regressions because its effect may show up across countries
once a threshold is reached. In other words, two countries may differ in Altruism by a
few percents and this may not make much difference to the measure of education
subsidy or growth. To take this possibility into account, three dummies are
constructed classifying countries as follows. The first dummy for altruism takes the
value 1 when a country has a value of Altruism on the top 50% of the values of the
sample (median), and 0 otherwise. A second associated dummy for altruism takes the
value 1 when a country has a value of Altruism on the top 33% of the values of the
sample, and 0 otherwise. A third associated dummy for altruism takes the value 1
when a country has a value of Altruism on the top 20% of the values of the sample,
and 0 otherwise. We call these proxies Altruism Dummy 50%, Altruism Dummy 33%
and Altruism Dummy 20% respectively. These various dummies are constructed to
check for robustness of the results.
Social Discount Rate
For the social discount rate we use the average real interest rate for 1992-2002
(World Bank, World Development Indicators (WDI) April 2008, ESDS International,
(Mimas) University of Manchester) as a proxy.
Common Sample Correlations
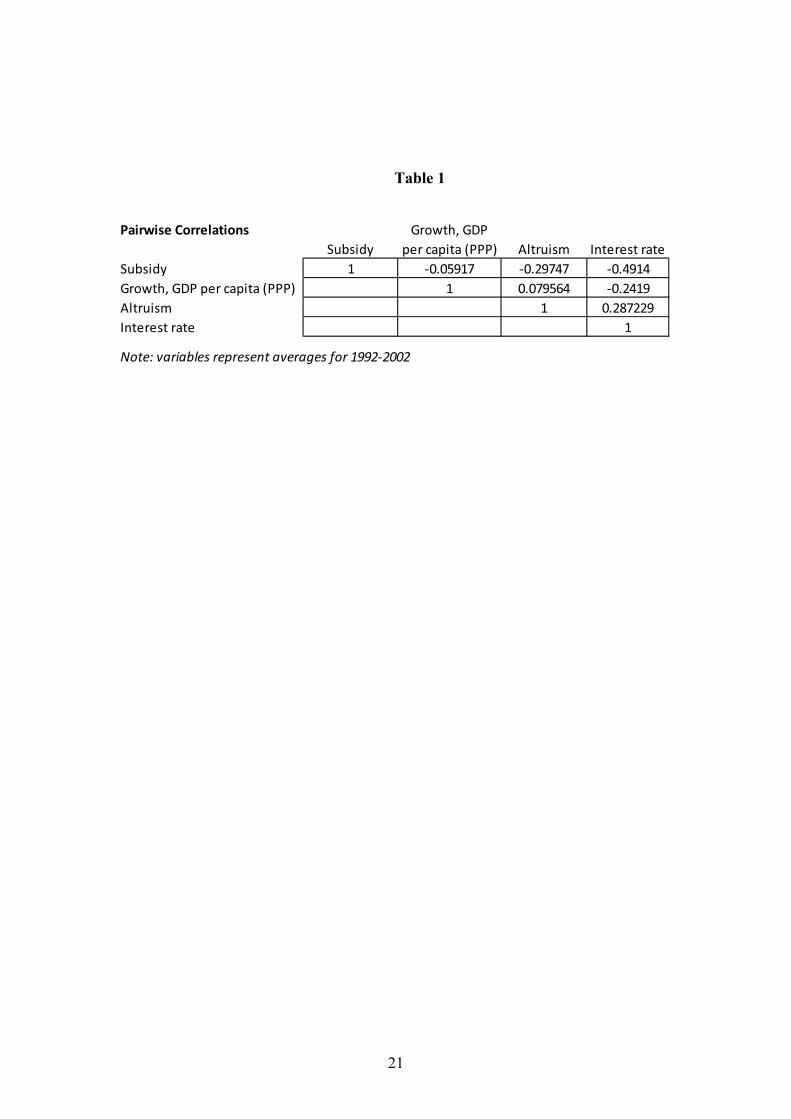
Table 1 presents the simple correlations between subsidy, GDP growth rate,
altruism and the interest rate. These correlations are consistent with the model
predictions in Proposition 1. There is a weak negative correlation between education
subsidy and growth, which might be due to the conflicting responses of growth and
subsidy to altruism.
<Table 1 comes here>
Cross-Country Regressions
Although these correlations are broadly consistent with the model, they do not
necessarily validate the model because these correlations may reflect the influences of
third factors, which are not accounted in our model. In the next step, we report some
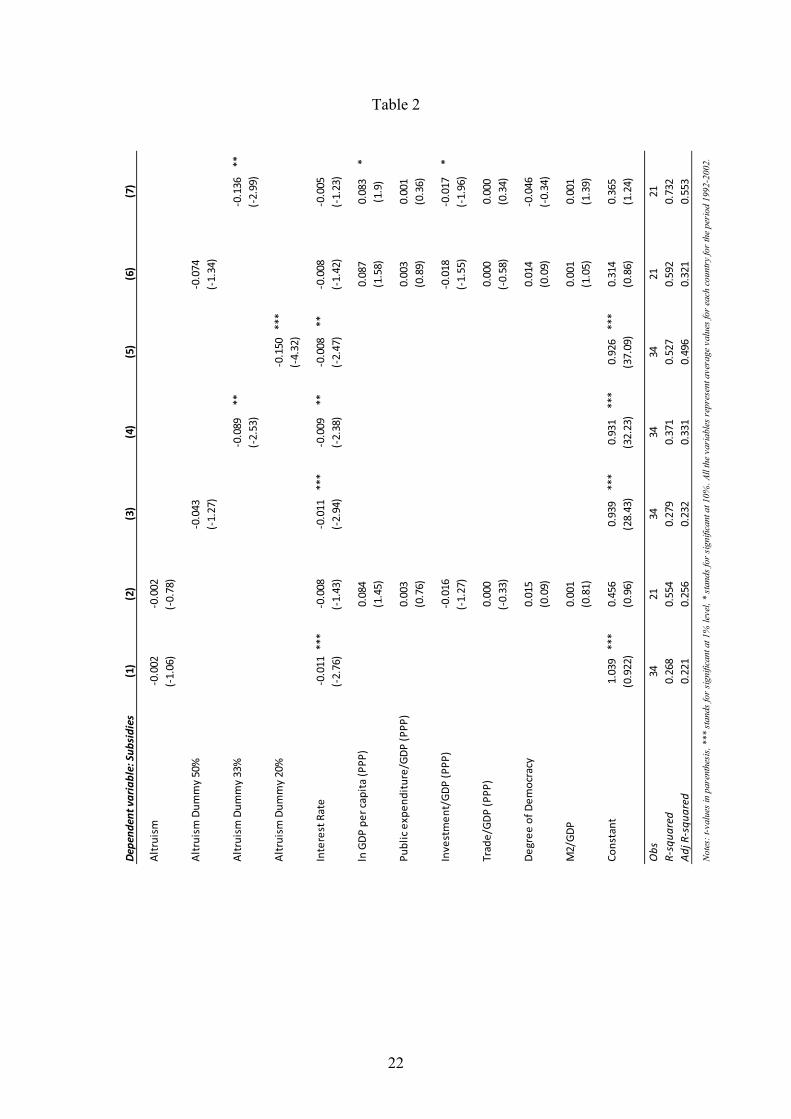
cross-country regression results in a similar vein as in Barro and Lee (1997). Table 2
12
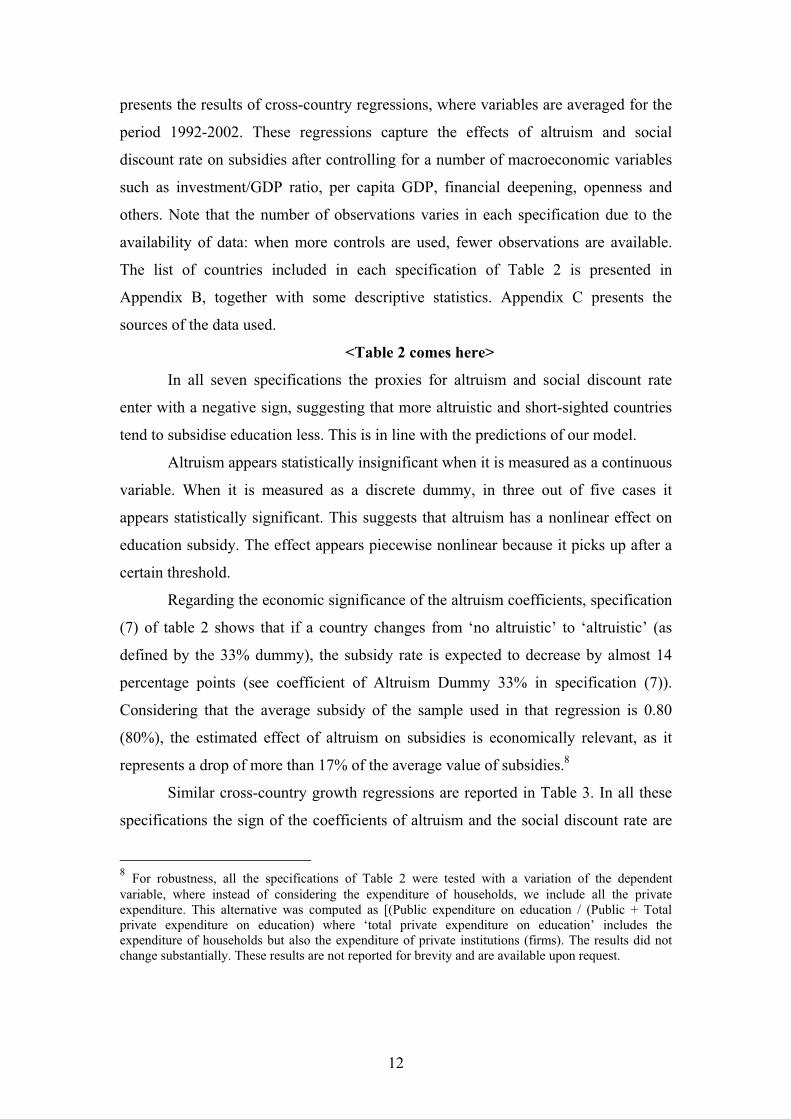
presents the results of cross-country regressions, where variables are averaged for the
period 1992-2002. These regressions capture the effects of altruism and social
discount rate on subsidies after controlling for a number of macroeconomic variables
such as investment/GDP ratio, per capita GDP, financial deepening, openness and
others. Note that the number of observations varies in each specification due to the
availability of data: when more controls are used, fewer observations are available.
The list of countries included in each specification of Table 2 is presented in
Appendix B, together with some descriptive statistics. Appendix C presents the
sources of the data used.
<Table 2 comes here>
In all seven specifications the proxies for altruism and social discount rate
enter with a negative sign, suggesting that more altruistic and short-sighted countries
tend to subsidise education less. This is in line with the predictions of our model.
Altruism appears statistically insignificant when it is measured as a continuous
variable. When it is measured as a discrete dummy, in three out of five cases it
appears statistically significant. This suggests that altruism has a nonlinear effect on
education subsidy. The effect appears piecewise nonlinear because it picks up after a
certain threshold.
Regarding the economic significance of the altruism coefficients, specification
(7) of table 2 shows that if a country changes from ‘no altruistic’ to ‘altruistic’ (as
defined by the 33% dummy), the subsidy rate is expected to decrease by almost 14
percentage points (see coefficient of Altruism Dummy 33% in specification (7)).
Considering that the average subsidy of the sample used in that regression is 0.80
(80%), the estimated effect of altruism on subsidies is economically relevant, as it
represents a drop of more than 17% of the average value of subsidies.8
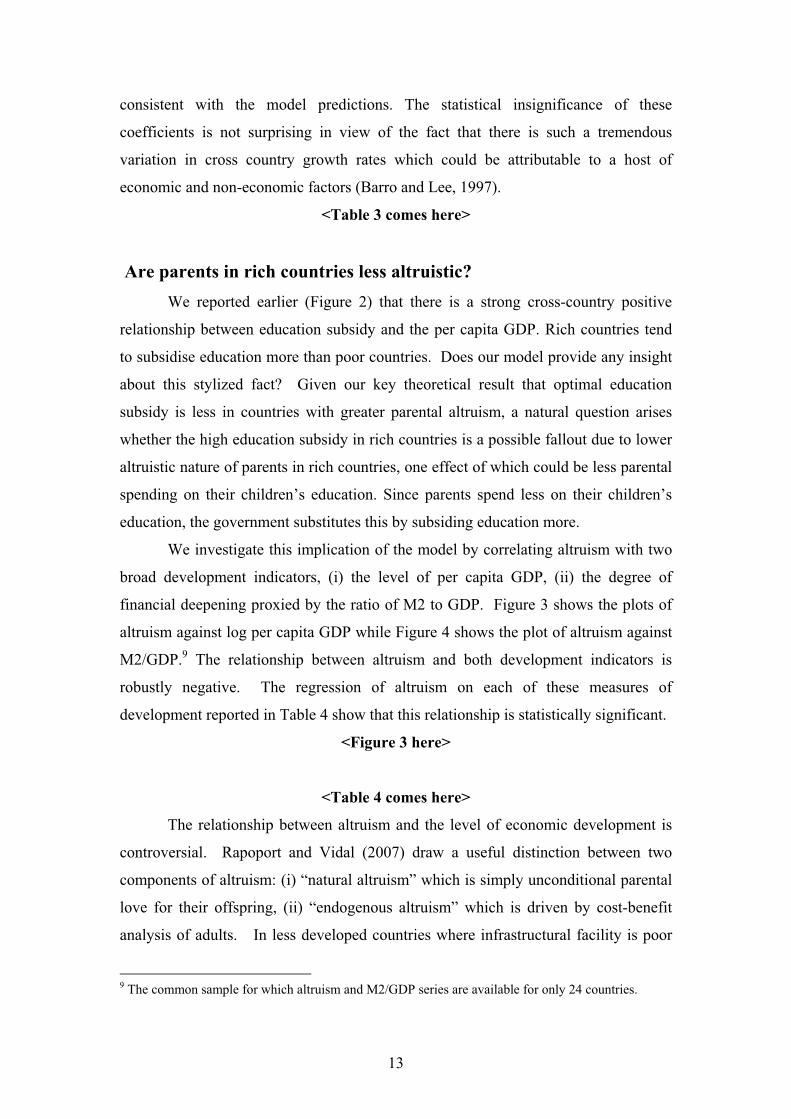
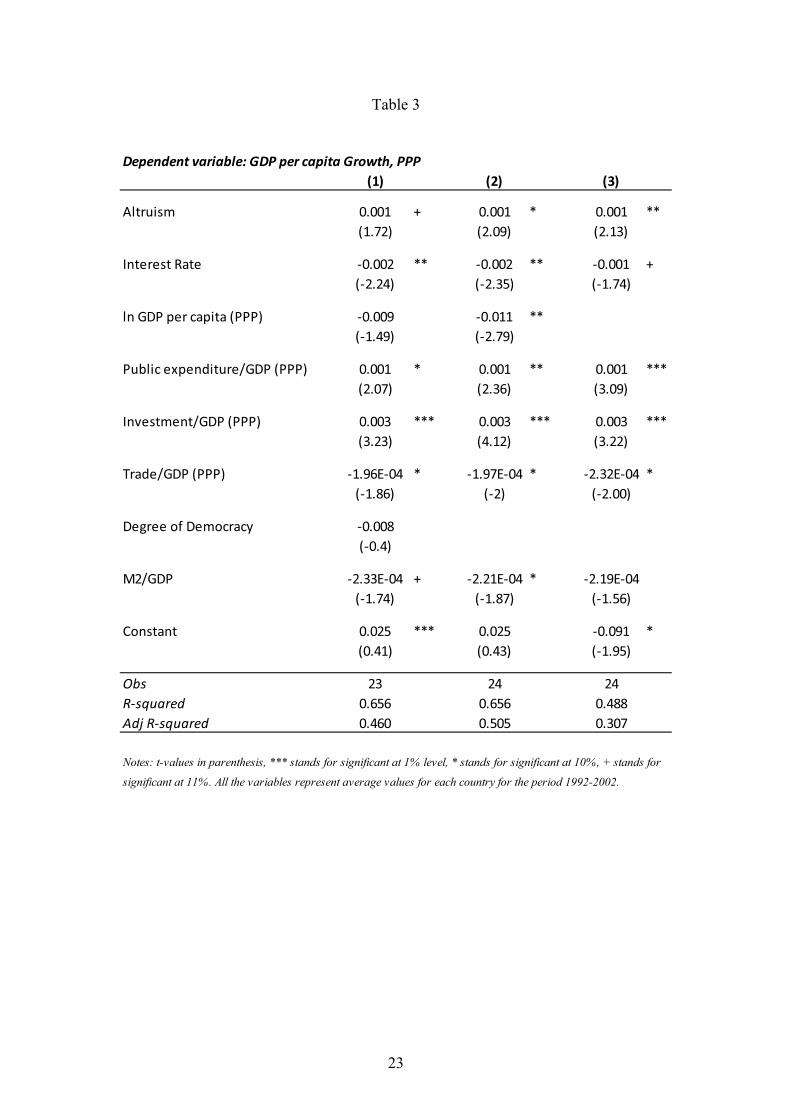
Similar cross-country growth regressions are reported in Table 3. In all these
specifications the sign of the coefficients of altruism and the social discount rate are
8 For robustness, all the specifications of Table 2 were tested with a variation of the dependent variable, where instead of considering the expenditure of households, we include all the private expenditure. This alternative was computed as [(Public expenditure on education / (Public + Total private expenditure on education) where ‘total private expenditure on education’ includes the expenditure of households but also the expenditure of private institutions (firms). The results did not change substantially. These results are not reported for brevity and are available upon request.
13
consistent with the model predictions. The statistical insignificance of these
coefficients is not surprising in view of the fact that there is such a tremendous
variation in cross country growth rates which could be attributable to a host of
economic and non-economic factors (Barro and Lee, 1997).
<Table 3 comes here>
Are parents in rich countries less altruistic?We reported earlier (Figure 2) that there is a strong cross-country positive
relationship between education subsidy and the per capita GDP. Rich countries tend
to subsidise education more than poor countries. Does our model provide any insight
about this stylized fact? Given our key theoretical result that optimal education
subsidy is less in countries with greater parental altruism, a natural question arises
whether the high education subsidy in rich countries is a possible fallout due to lower
altruistic nature of parents in rich countries, one effect of which could be less parental
spending on their children’s education. Since parents spend less on their children’s
education, the government substitutes this by subsiding education more.
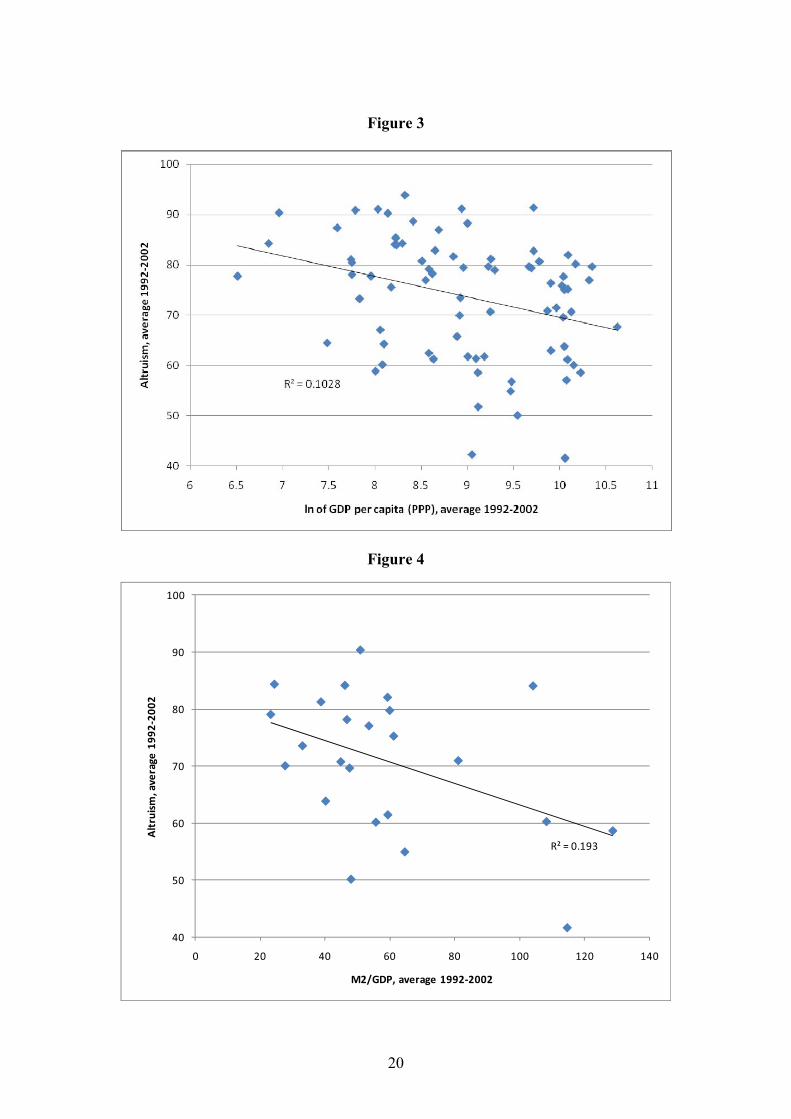
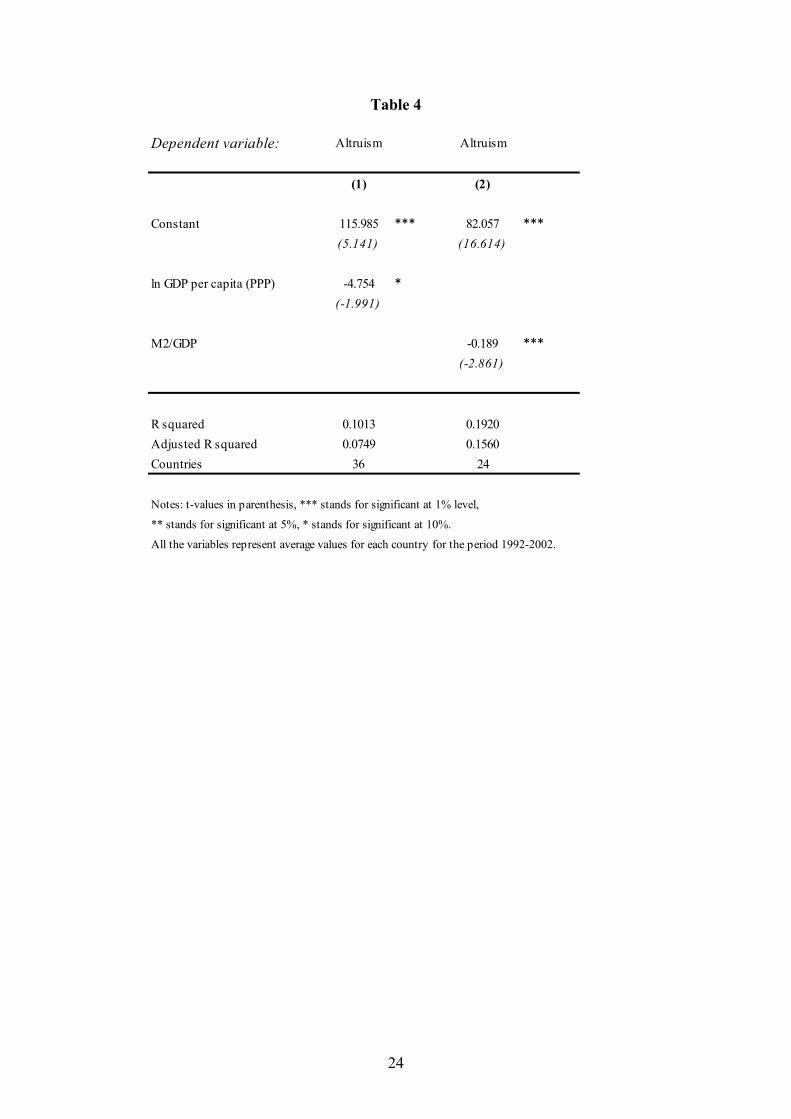
We investigate this implication of the model by correlating altruism with two
broad development indicators, (i) the level of per capita GDP, (ii) the degree of
financial deepening proxied by the ratio of M2 to GDP. Figure 3 shows the plots of
altruism against log per capita GDP while Figure 4 shows the plot of altruism against
M2/GDP.9 The relationship between altruism and both development indicators is
robustly negative. The regression of altruism on each of these measures of
development reported in Table 4 show that this relationship is statistically significant.
<Figure 3 here>
<Table 4 comes here>
The relationship between altruism and the level of economic development is
controversial. Rapoport and Vidal (2007) draw a useful distinction between two
components of altruism: (i) “natural altruism” which is simply unconditional parental
love for their offspring, (ii) “endogenous altruism” which is driven by cost-benefit
analysis of adults. In less developed countries where infrastructural facility is poor
9 The common sample for which altruism and M2/GDP series are available for only 24 countries.
14
and private insurance markets are lacking, one may argue that “natural altruism” may
prevail as a survival mechanism. On the other hand, in advanced economies where
basic necessities are already met and insurance markets exist to cover old age
contingencies, parents will choose altruistic behaviour based more on cost-benefit
considerations. This means that “endogenous altruism” might become more
predominant in rich countries. It is difficult to ascertain from the World Values
Survey question A026 whether this parental value represents “natural altruism” or
“endogenous altruism.” However, since the altruism parameter ��1 in our model is
preference driven, it is deemed to be “natural altruism.” Thus the negative relation
between altruism and the level of development reported here basically alludes to the
possibility that natural altruism is less in rich countries. While the issue whether rich
parents are less altruistic decidedly warrants more research, the two stylized facts, (i)
education subsidy in rich countries is greater in rich countries, and (ii) altruism
indicator is lower in rich countries, lend support to our key theoretical result that
government in rich countries may subsidise education more to offset the lack of
parental natural altruism.
ConclusionIn this paper we present a new hypothesis that parental altruism could be an important
factor determining the education subsidy. This hypothesis helps us understand the
reasons for the enormous cross-country variation in public education spending and
particularly why in rich countries government spends so much on public education
compared to poor countries. In countries where parents are less altruistic to their
offspring, a benevolent forward-looking government has to compensate for this
private shortfall in education spending by subsidising public education. The socially
optimal growth rate thus depends positively on private altruism and the government
benevolence. These theoretical predictions are tested against the cross-country data
which lend support to our model predictions. Our model and cross country regressions
also provide insights why governments in rich countries subsidise education more
than in poor countries.
15
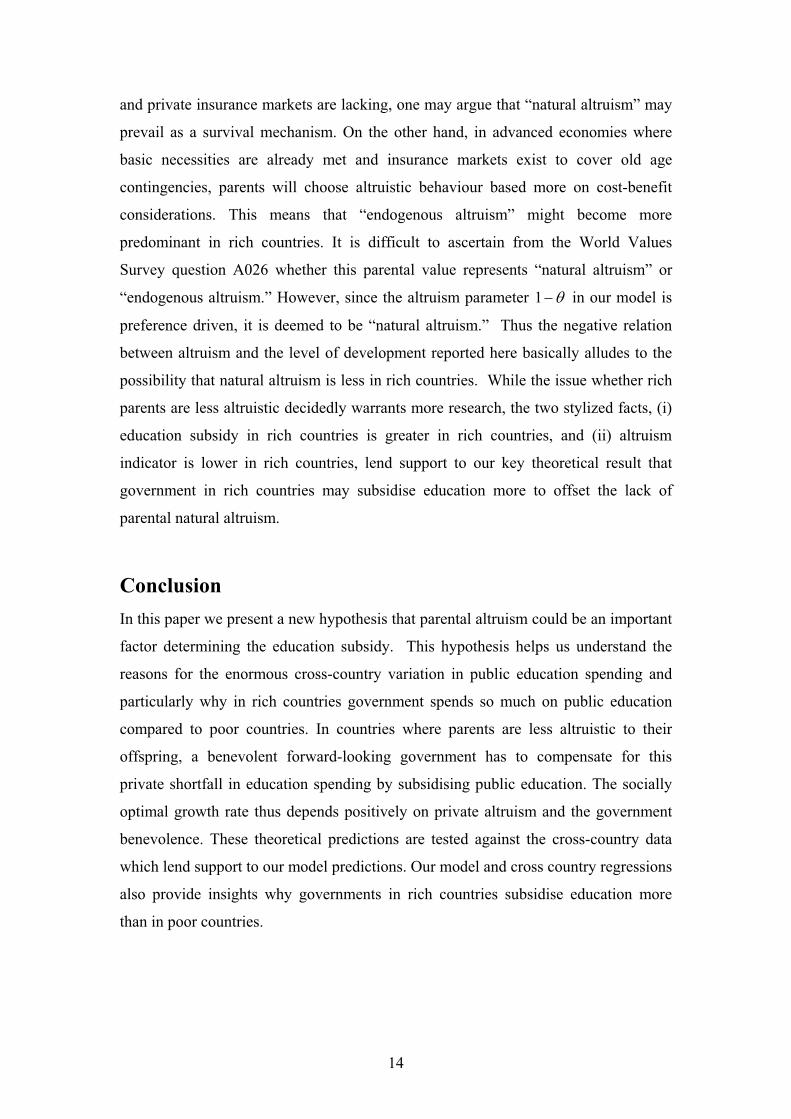
Appendix A: Proof of Proposition 1
The social planner’s maximization problem is:
Max ]ln)1(ln[0
ttt
t hc ��� ����
�
s.t. 1��� ttt ahhc
The first order condition for this problem is:
(A.1) 0111
���
���
��
���
���
��
��
�� ttttt haha
hahh����
which is a nonlinear second order difference equation in th . Conjecture a solution as
follows:
(A.2) 1�� tt hh �
We use the method of undetermined coefficient to solve for � . Plug (A.2) into (A.1)
to get:
(A.3) 0)()(
111
���
���
��
���
���
��
��
�� ttt haa
hah ���
��
��
which means
(A.4) ))(1([1 ����
������
�� a
ahht
t
Given our conjecture (A.2), it must be true from (A.4) that
(A.5) ))(1([ ����
�������
�a
a
which uniquely solves � as follows
(A.6) )1(1 ��� ��� a
This also characterizes the socially optimal growth rate.
Recall from (13) that for a given � the privately optimal growth rate is:
(A.7) ���
tt
t ahh
��
�� 1
)1(
1
16
Equating (A.6) to (A.7) it is straightforward to solve the socially optimal education
subsidy t� that equates the private and social growth rates. This completes the proof.
Appendix B
Countries common to all the specifications of table 2:
Argentina, Australia, Canada, Chile, China, Czech Republic, Denmark, India,
Indonesia, Japan, Jordan, Mexico, New Zealand, Norway, Peru, Philippines, Poland,
Slovak Republic, Sweden, Switzerland, United States.
Countries added for specifications 1, 3, 4, 5: Austria, Belgium, Finland, France,
Germany, Greece, Iceland, Ireland, Italy, Netherlands, Portugal, Spain, United
Kingdom.
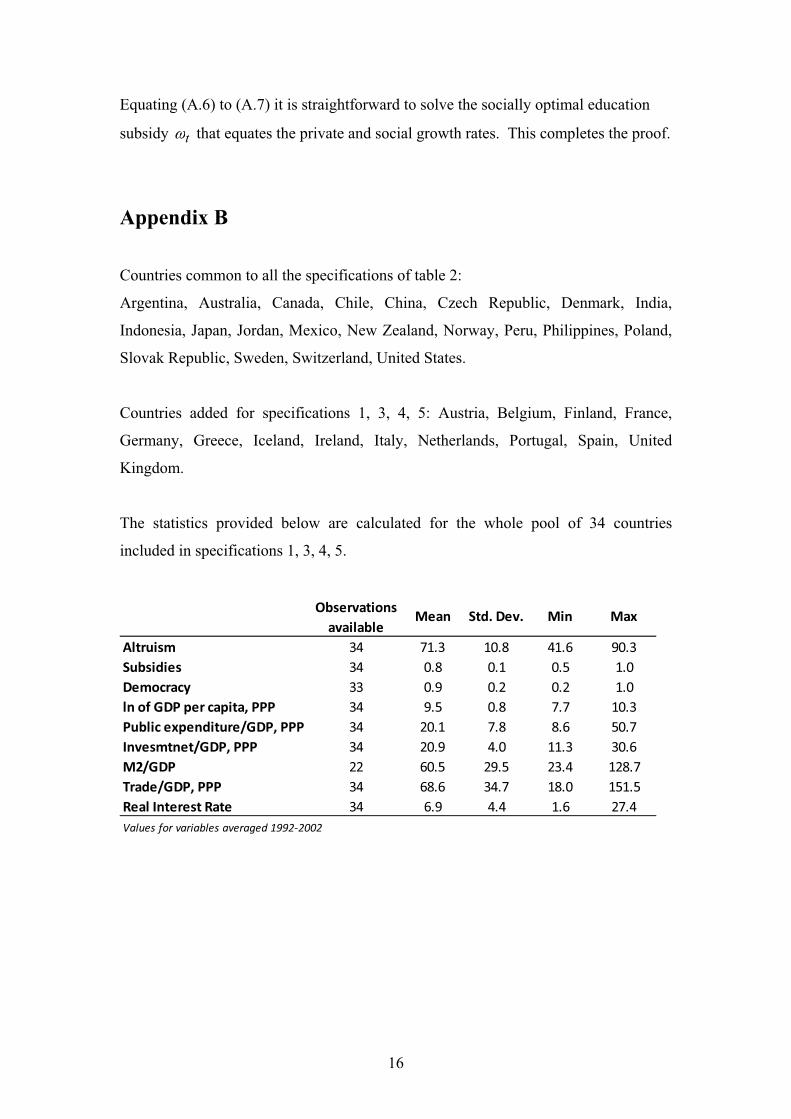
The statistics provided below are calculated for the whole pool of 34 countries
included in specifications 1, 3, 4, 5.
Observationsavailable
Altruism 34 71.3 10.8 41.6 90.3Subsidies 34 0.8 0.1 0.5 1.0Democracy 33 0.9 0.2 0.2 1.0ln�of�GDP�per�capita,�PPP 34 9.5 0.8 7.7 10.3Public�expenditure/GDP,�PPP 34 20.1 7.8 8.6 50.7Invesmtnet/GDP,�PPP 34 20.9 4.0 11.3 30.6M2/GDP 22 60.5 29.5 23.4 128.7Trade/GDP,�PPP 34 68.6 34.7 18.0 151.5Real�Interest�Rate 34 6.9 4.4 1.6 27.4Values�for�variables�averaged�1992�2002
Mean Std.�Dev. Min Max
17
Appendix C: Data
Altruism and Subsidies are explained in the text.
GDP per capita, PPP: Penn World Table. Source: Alan Heston, Robert Summers and
Bettina Aten, Penn World Table Version 6.2, Center for
International Comparisons of Production, Income and Prices at
the University of Pennsylvania, September 2006.
Public and Private Spending on Education: The private spending on education series
is proxied by household expenditure on education. The
difference between ‘household’ and ‘private’ is not major (the
latter includes expenditure by firms and other private but non-
household units). For our model ‘household’ was the right
choice, considering that we are looking at how individuals spent
on their offspring’s education. The data for household and
government spending on education came from the Organisation
for Economic Development and Cooperation, Education
Statistics, Volume 2006, Issue 01, ESDS International, (Mimas)
University of Manchester.
Investment/GDP, PPP: World Penn Table. Source: Alan Heston, Robert Summers and
Bettina Aten, Penn World Table Version 6.2, Center for
International Comparisons of Production, Income and Prices at
the University of Pennsylvania, September 2006. Expressed in
percentage points (1% instead of 0.01).
Degree of democracy: Measures the degree of institutionalised democracy from 0 to 1
(where higher numbers mean more democracy). This variable is
a linear transformation of the variable ‘Polity’ from the Polity
IV database, which ranges from -10 to 10. Source: Monty G.
18
Marshall and Keith Jaggers. 2004. Polity IV Data Set.
[Computer file; version p4v2004] College Park, MD: Center for
International Development and Conflict Management,
University of Maryland.
Trade/GDP, PPP: Sum of exports and imports of goods and services measured as
a share of gross domestic product. Source: World Penn Table.
Source: Alan Heston, Robert Summers and Bettina Aten, Penn
World Table Version 6.2, Center for International Comparisons
of Production, Income and Prices at the University of
Pennsylvania, September 2006. Expressed in percentage points
(1% instead of 0.01).
M2/GDP: Ratio of Money and quasi money (M2) as a share of GDP.
Source: World Bank, World Development Indicators (WDI)
April 2008, ESDS International, (Mimas) University of
Manchester. Expressed in percentage points (1% instead of
0.01).
19
0
0.1
0.2
0.3
0.4
0.5
0.6
0.7
0.8
0.9
1
Sri�Lanka
Jamaica
Peru
Chile
Paraguay
Philipp
ines
Korea�(Rep
.)Indo
nesia
Thailand
Japan
China
United�States
Mexico
Australia
Spain
Argen
tina
Israel
Den
mark
Jordan
Greece
New
�Zealand
Swed
enCanada
Italy
Iceland
Nethe
rlands
Slovak�Rep
ublic
France
Czech�Re
public
Poland
India
Ireland
United�Kingdo
mBe
lgium
Finland
Uruguay
Germany
Norway
Portugal
Austria
Switzerland
Malaysia
Luxembo
urg
Public�/�(Household+Public�education�expenditure).�Averages�1992�2002.
R²�=�0.3263
0.4
0.5
0.6
0.7
0.8
0.9
1
7 7.5 8 8.5 9 9.5 10 10.5 11
Public/(Hou
seho
ld+P
ublic�edu
cation
�expen
diture).�Average�199
2�20
02
ln�of�GDP�per�capita,� PPP,�average�1992�2002
Figure 1
Figure 2
20
Figure 3
Figure 4
R²�=�0.193
40
50
60
70
80
90
100
0 20 40 60 80 100 120 140
Altruism,�average�199
2�20
02
M2/GDP,�average�1992�2002
21
Pairwise�Correlations Growth,�GDPSubsidy per�capita�(PPP) Altruism Interest�rate
Subsidy 1 �0.05917 �0.29747 �0.4914Growth,�GDP�per�capita�(PPP) 1 0.079564 �0.2419Altruism 1 0.287229Interest�rate 1
Note:�variables�represent�averages�for�1992�2002
Table 1
22
Table 2
Dependent�variable:�Sub
sidies
(1)
(2)
(3)
(4)
(5)
(6)
(7)
Altruism
�0.002
�0.002
(�1.06)
(�0.78)
Altruism�Dum
my�50%
�0.043
�0.074
(�1.27)
(�1.34)
Altruism�Dum
my�33%
�0.089
**�0.13 6
**(�2.53)
(�2.99)
Altruism�Dum
my�20%
�0.150
***
(�4.32)
Interest�Rate
�0.011
***
�0.008
�0.011
***
�0.009
**�0.008
**�0.008
�0.005
(�2.76)
(�1.43)
(�2.94)
(�2.38)
(�2.47)
(�1.42)
(�1.23)
ln�GDP�pe
r�capita�(PPP
)0.084
0.087
0.083
*(1.45)
(1.58)
(1.9)
Public�expen
diture/GDP�(PPP
)0.003
0.003
0.001
(0.76)
(0.89)
(0.36)
Investmen
t/GDP�(PPP
)�0.016
�0.018
�0.017
*(�1.27)
(�1.55)
(�1.96)
Trade/GDP�(PPP
)0.000
0.000
0.000
(�0.33)
(�0.58)
(0.34)
Degree�of�Dem
ocracy
0.015
0.014
�0.04 6
(0.09)
(0.09)
(�0.34)
M2/GDP
0.001
0.001
0.001
(0.81)
(1.05)
(1.39)
Constant
1.039
***
0.456
0.939
***
0.931
***
0.926
***
0.314
0.365
(0.922)
(0.96)
(28.43)
(32.23)
(37.09)
(0.86)
(1.24)
Obs
3421
3434
3421
21R�squa
red
0.268
0.554
0.279
0.371
0.527
0.592
0.732
Adj�R�squ
ared
0.221
0.256
0.232
0.331
0.496
0.321
0.553
Notes
: t-v
alue
s in
par
enth
esis
, ***
stan
ds fo
r si
gnifi
cant
at 1
% le
vel,
* st
ands
for
sign
ifica
nt a
t 10%
. All
the
vari
able
s re
pres
ent a
vera
ge v
alue
s fo
r eac
h co
untry
for
the
peri
od 1
992-
2002
.
23
Table 3
Dependent�variable:�GDP�per�capita�Growth,�PPP(1) (2) (3)
Altruism 0.001 + 0.001 * 0.001 **(1.72) (2.09) (2.13)
Interest�Rate �0.002 ** �0.002 ** �0.001 +(�2.24) (�2.35) (�1.74)
ln�GDP�per�capita�(PPP) �0.009 �0.011 **(�1.49) (�2.79)
Public�expenditure/GDP�(PPP) 0.001 * 0.001 ** 0.001 ***(2.07) (2.36) (3.09)
Investment/GDP�(PPP) 0.003 *** 0.003 *** 0.003 ***(3.23) (4.12) (3.22)
Trade/GDP�(PPP) �1.96E�04 * �1.97E�04 * �2.32E�04 *(�1.86) (�2) (�2.00)
Degree�of�Democracy �0.008(�0.4)
M2/GDP �2.33E�04 + �2.21E�04 * �2.19E�04(�1.74) (�1.87) (�1.56)
Constant 0.025 *** 0.025 �0.091 *(0.41) (0.43) (�1.95)
Obs 23 24 24R�squared 0.656 0.656 0.488Adj�R�squared 0.460 0.505 0.307
Notes: t-values in parenthesis, *** stands for significant at 1% level, * stands for significant at 10%, + stands for
significant at 11%. All the variables represent average values for each country for the period 1992-2002.
24
Table 4
Dependent variable: Altruism Altruism
(1) (2)
Constant 115.985 *** 82.057 ***(5.141) (16.614)
ln GDP per capita (PPP) -4.754 *(-1.991)
M2/GDP -0.189 ***(-2.861)
R squared 0.1013 0.1920Adjusted R squared 0.0749 0.1560Countries 36 24
Notes: t-values in parenthesis, *** stands for significant at 1% level,
** stands for significant at 5%, * stands for significant at 10%.
All the variables represent average values for each country for the period 1992-2002.
25
References
Alesina, A, Y Algan, P. Cahue, P. Giuliano (2010), Family Values and the Regulation of Labour, Memeo. Andreoni, J. (2006). Philantropy. In ‘Handbook of the economics of giving, altruism and reciprocity’, Volume 1, North Holland. Edited by Kolm, S.-C. and Mercier Ythier, J. Acemoglu, D., and Angrist, J. (1999). How large are Social Returns to Education? Evidence from Compulsory Schooling Laws. NBER Working Paper W7444. Armellini, M (2009). Public Education, Growth and Political Regimes. PhD Thesis, Durham University, UK. Azariadis, C., and Drazen, A. (1990). Threshold Externalities in Economic Development. Quarterly Journal of Economics CV, 501-526. Bandyopadhyay , D and P. Basu (2001). Redistributive Tax and Growth in a Model with Discrete Occupational Choice. Australian Economic Papers, 40, 2, 2001, pp. 111-132. Barro, R. J. (1997). Determinants of Economic Growth: A Cross-Country Empirical Study. Lionel Robbins Lectures, Cambridge, MA: MIT Press. Benabou, R. (2002). Tax and Education Policy in a Heterogeneous Agent Economy: What Levels of Redistribution Maximize Growth and Efficiency? Econometrica, Vol. 70, No. 2, pp. 481-517 Bils, M., and Klenow, P. (2000). Does Schooling cause growth? American Economic Review 90, pp. 1160-1183. Bouhga-Hagbe, J. (2006). Altruism and worker’s remittances: Middle East and Central Asia. IMF Working Paper WP/06/130. Bräuninger, M., and Vidal, J. (2000). Private versus public financing of education and endogenous growth. Journal of Population Economics, Vol. 13, pp. 387-401. Cameron, S., and Heckman, J. (1998). Life Cycle Schooling and Dynamic Selection Bias: Models and Evidence for Five Cohorts. NBER Working Papers 6385 Cameron, S., and Taber, C. (2000). Borrowing Constraints and the Returns to Schooling. NBER Working Paper W7761. Castillo, M., and Carter, M. (2002). The economic impacts of altruism, trust and reciprocity: an experimental approach to social capital. Mimeo, University of Wisconsin-Madison. Eckestein, Z., and Zilcha, I. (1994). The effects of compulsory schooling on growth, income distribution and welfare. Journal of Public Economics 54, pp. 339-359.
26
Glomm, G., and Ravikumar, B. (1992). Public versus private investment in human capital: endogenous growth and income inequality. Journal of Political Economy 100, 818-34. Keane, M., and Wolpin, K. (2001). The effect of Parental Transfers and Borrowing Constraints on Educational Attainment. Penn Institute for Economic Research Working Paper 01-018. Krueger, A., and Lindahl, M. (2000). Education for Growth: Why and For Whom? NBER Working Paper W7591. Loury, G.C. (1981). Intergenerational Transfers and the Distribution of Earnings. Econometrica, 49, 4, pp. 848-857. Lucas, R. (1988). On the Mechanics of Economic Development. Journal of Monetary Economics 22, pp. 3–42. Perotti, R. (1993). Political Equilibrium, Income Distribution, and Growth. Review of Economic Studies, 60(4), pp. 755-776. Rapoport, H and J-P Vidal (2007), Economic Growth and Endogenous Intergenerational Altrusim, Journal of Public Economics, 91, 1231-1246. Saint-Paul, G., and Verdier, T. (1993). Education, Democracy and Growth. Journal of Development Economics, 42(2), pp. 399-407. Shea, J. (2000). Does Parents’ Money Matter? Journal of Public Economics, 77(2), pp. 155-184. Tamura, R. (1991). Income Convergence in an Endogenous Growth Model. Journal of Political Economy, 99(3), pp. 522-540.