mawson west limited
TRANSCRIPT
Mawson West Limited Technical Report on the Dikulushi Open Pit Project, Democratic Republic of
Congo – September 16, 2011

Technical Report on the Dikulushi Open Pit Project, Democratic Republic of Congo – September 16, 2011
P a g e | ii
Doc Ref:
110916_Optiro_Dikulushi_43-
101_Reserve_Draft_Base.docx
Print Date: 16 September 2011
Number of copies: 2
Optiro: 1
Mawson West Limited: 1
Perth Office
Level 4, 50 Colin Street
West Perth WA 6005
PO Box 1646
West Perth WA 6872
Australia
Tel: +61 8 9215 0000
Fax: +61 8 9215 0011
Optiro Pty Limited
ABN: 63 131 922 739
www.optiro.com
Principal Author: David Gray BSc Hons (Geology),
MAusIMM, PrSciNat
Signature:
Date: 16 September 2011
Principal Reviewer: Rick Stroud FAusIMM
Contributing author: Andrew Law FAusIMM
Signature:
Date: 16 September 2011
Important Information:
This Report is provided in accordance with the proposal by Optiro Pty Ltd (“Optiro”) to Mawson West Limited and the
terms of Optiro’s Consulting Services Agreement (“the Agreement”). Optiro has consented to the use and publication of
this Report by Mawson West Limited for the purposes set out in Optiro’s proposal and in accordance with the Agreement.
Mawson West Limited may reproduce copies of this entire Report only for those purposes but may not and must not
allow any other person to publish, copy or reproduce this Report in whole or in part without Optiro’s prior written
consent.
Unless Optiro has provided its written consent to the publication of this Report by Mawson West Limited for the purposes
of a transaction, disclosure document or a product disclosure statement issued by Mawson West Limited pursuant to the
Corporations Act, then Optiro accepts no responsibility to any other person for the whole or any part of this Report and
accepts no liability for any damage, however caused, arising out of the reliance on or use of this Report by any person
other than Mawson West Limited. While Optiro has used its reasonable endeavours to verify the accuracy and
completeness of information provided to it by Mawson West Limited and on which it has relied in compiling the Report, it
cannot provide any warranty as to the accuracy or completeness of such information to any person.

Technical Report on the Dikulushi Open Pit Project, Democratic Republic of Congo – September 16, 2011
P a g e | iii
Technical Report on the Dikulushi Open Pit Project, Democratic Republic of Congo
A technical report on the open pit cutback
Prepared for
Mawson West Limited
Authors
David Gray Principal Consultant, Optiro Pty Ltd BSc Hons (Geology), MAusIMM, PrSciNat
Andrew Law Director –Mining, Optiro Pty Ltd HND (MMin); MBA; FAusMM; FIQA; MAICD
Date of report: 16 September 2011
Technical Report on the Dikulushi Open Pit Project, Democratic Republic of Congo – September 16, 2011
P a g e | iv
TABLE OF CONTENTS
1. SUMMARY 11
1.1. LOCATION 11
1.2. OWNERSHIP 12
1.3. MINERALISATION 12
1.4. MINERAL RESOURCES & RESERVES 12
1.5. METALLURGICAL 13
1.6. ENVIRONMENTAL 13
1.7. CONCLUSIONS AND RECOMMENDATION 14
2. INTRODUCTION 15
2.1. SCOPE OF THE REPORT 15
2.2. AUTHORS 15
2.3. PRINCIPAL SOURCES OF INFORMATION 16
2.4. SITE VISIT 17
2.5. INDEPENDENCE 18
2.6. ABBREVIATIONS AND TERMS 18
3. RELIANCE ON OTHER EXPERTS 25
4. PROPERTY DESCRIPTION AND LOCATION 26
4.1. DEMOGRAPHICS AND GEOGRAPHIC SETTING 26
4.2. PROJECT OWNERSHIP 26
4.3. PROJECT LOCATION 26
4.4. THE PROJECT TENEMENT AREA 26
4.5. ENVIRONMENTAL PERMITS 29
5. ACCESSIBILITY, CLIMATE, LOCAL RESOURCES, INFRASTRUCTURE
AND PHYSIOGRAPHY 30
5.1. ACCESS 30
5.2. SITE TOPOGRAPHY, ELEVATION AND VEGETATION 30
5.3. CLIMATE, PHYSIOGRAPHY, LOCAL RESOURCES AND INFRASTRUCTURE 30
5.4. SURFACE RIGHTS 30
5.5. SITE INFRASTRUCTURE 31
5.5.1. WATER SUPPLY 31
5.5.2. POWER SUPPLY 31
5.5.3. MINE PERSONNEL 32
5.5.4. TAILINGS STORAGE FACILITY 32
5.5.5. ADMINISTRATION AND PLANT SITE BUILDINGS 32
5.5.6. ACCOMMODATION 32
5.5.7. COMMUNICATIONS 33
5.5.8. MOBILE EQUIPMENT 33
5.5.9. SECURITY 33
Technical Report on the Dikulushi Open Pit Project, Democratic Republic of Congo – September 16, 2011
P a g e | v
6. HISTORY 34
7. GEOLOGICAL SETTING AND MINERALISATION 35
8. DEPOSIT TYPES 36
9. EXPLORATION 37
10. DRILLING 38
11. SAMPLE PREPARATION, ANALYSIS AND SECURITY 39
12. DATA VERIFICATION 40
13. MINERAL PROCESSING AND METALLURGICAL TESTING 41
13.1. INTRODUCTION 41
13.2. ANVIL MINING TEST WORK 41
13.2.1. EARLY TEST WORK 41
13.2.2. LATER TEST WORK 42
13.1 PLANT OPERATIONAL RESULTS 46
13.2 METALLURGICAL PROPERTIES OF THE CUTBACK ORE 47
14. MINERAL RESOURCE AND MINERAL RESERVE ESTIMATES 49
14.1. GEOLOGICAL AND MINERALISATION MODELS 50
14.2. DRILL DATA FOR MINERAL RESOURCE MODELLING 51
14.3. DATA VALIDATION 53
14.4. DATA PREPARATION FOR MODELLING 53
14.5. DATA COMPOSITING 54
14.6. STATISTICS 55
14.7. SPATIAL STATISTICS 55
14.8. BLOCK MODEL 58
14.9. DENSITY ESTIMATES IN THE BLOCK MODEL 59
14.10. DETERMINATION OF TOP CUTS 59
14.11. GRADE ESTIMATION 59
14.12. ORDINARY KRIGING INTERPOLATION 59
14.13. MODEL VALIDATION 60
14.14. MINERAL RESOURCE CLASSIFICATION 62
14.15. RESOURCE TABULATION AND INVENTORY 63
14.15.1. GRADE TONNAGE CURVES 63
14.16. MINERAL RESOURCE ESTIMATE COMPARISONS 64
15. MINERAL RESERVE ESTIMATES 67
15.1. PIT OPTIMISATION 67

Technical Report on the Dikulushi Open Pit Project, Democratic Republic of Congo – September 16, 2011
P a g e | vi
15.1.1. OPTIMISATION PARAMETERS 67
15.1.2. OPTIMISATION RESULTS 69
15.2. PIT OPTIMISATION SENSITIVITY ANALYSIS 72
15.3. MINE DESIGN 73
15.4. CUT-OFF GRADE CRITERIA 74
15.5. MINING INVENTORIES 75
15.6. MINING RECOVERY AND DILUTION 75
15.7. RESERVE CLASSIFICATION 75
15.8. MINERAL RESERVES TABULATION 77
16. MINING METHODS 78
16.1. MINING STRATEGY 79
16.1.1. CONTRACTORS FLEET 82
16.2. OTHER MINING FLEET 83
16.3. GEOTECHNICAL 83
16.3.1. DATA 83
16.3.2. GEOTECHNICAL DOMAINS 84
16.3.3. SLOPE GUIDELINES 85
16.3.4. POTENTIAL FAILURES 89
16.3.5. OTHER FACTORS AFFECTING STABILITY 91
16.3.6. MAPPING, MONITORING AND ADDITIONAL DATA 93
16.4. IN-PIT SUPPORT REQUIREMENTS 93
16.4.1. EXISTING UNDERGROUND EXCAVATIONS 94
16.4.2. MAJOR STRUCTURES 97
16.4.3. CABLE BOLTS AND CATCH FENCES 98
16.5. ROM PAD DESIGN 99
16.6. WASTE DUMP DESIGN 100
16.7. SURFACE WATER MANAGEMENT 101
17. RECOVERY METHODS 103
17.1.1. PLANT FLOWSHEET 103
17.1.2. TAILINGS STORAGE FACILITIES (TSF) 104
17.1.3. PROCESSING STATISTICS 105
18. PROJECT INFRASTRUCTURE 107
18.1. SURFACE FACILITIES 107
18.2. POWER 108
18.3. PROCESS WATER SUPPLY 108
19. MARKET STUDIES AND CONTRACTS 111
19.1. MARKETS 111
19.2. CONTRACTS 111
20. ENVIRONMENTAL STUDIES, PERMITTING AND SOCIAL OR
COMMUNITY IMPACT 113

Technical Report on the Dikulushi Open Pit Project, Democratic Republic of Congo – September 16, 2011
P a g e | vii
21. CAPITAL AND OPERATING COSTS 114
21.1. CAPITAL COST ESTIMATE 114
21.2. OPERATING COST ESTIMATE 114
21.2.1. MINING OPERATING COST 115
21.3. PROCESSING OPERATING COSTS 117
21.3.1. OVERHEAD OPERATING COST 117
21.3.2. CAPITAL EXPENDITURE 117
21.3.3. OPERATING COSTS 117
22. ECONOMIC ANALYSIS 118
22.1. MINING SUMMARY 118
22.1.1. SENSITIVITY ANALYSIS 120
22.2. PAYBACK 121
22.3. MINE LIFE 122
22.4. TAXATION 122
23. ADJACENT PROPERTIES 123
24. OTHER RELEVANT DATA AND INFORMATION 124
25. INTERPRETATION AND CONCLUSIONS 125
26. RECOMMENDATIONS 126
27. REFERENCES 127
28. CERTIFICATES 129
TABLES
Table 1.1 Dikulushi Mineral Resource statement as at August 2011, using a 1.0% copper cut-
off grade 12
Table 1.2: Dikulushi Mineral Reserve statement as at August 2011, using a 1.0% copper cut-off
grade 13
Table 2.1 Glossary of terms 19
Table 4.1 Mawson West Limited tenement schedule 28
Table 13.1 Details of Dikulushi drillcore used in Mintek metallurgical testing 41
Table 13.2 Head grades of chalcocite composites 43
Table 13.3 Relative abundance of significant minerals 43
Table 13.4 Comminution test work results 44
Table 13.5 Effect of grind size on flotation performance (high grade chalcocite) 44
Table 13.6 Effects of collector addition on flotation performance (high grade chalcocite) 44
Technical Report on the Dikulushi Open Pit Project, Democratic Republic of Congo – September 16, 2011
P a g e | viii
Table 13.7 Effect of grind size on flotation performance (disseminated and low grade
chalcocite) 44
Table 13.8 Effect of collector addition on flotation performance (disseminated and low grade
chalcocite) 45
Table 13.9 Effect of grind size and Eh level on flotation performance (Pb/Zn rich chalcocite)45
Table 13.10 Head grades of chalcocite composites 46
Table 13.11 Locked cycle flotation test results 46
Table 13.12 Dikulushi processing summary (February 2007 – April 2008) 48
Table 14.1 Dikulushi Mineral Resource statement as at August 2011 above a 1.0% copper cut-
off grade 50
Table 14.2 Domain codes for Dikulushi modelling 54
Table 14.3 Summary statistics for copper % and silver g/t per domain 55
Table 14.4 Dikulushi variogram models with angle1 about axis 3 (Z), angle2 about axis 1 (X)
and angle3 about axis 3 (Z) 57
Table 14.5 Dikulushi - top cuts per domain 59
Table 14.6 Mean statistics per domain comparing model estimates with data values 60
Table 14.7 Dikulushi Mineral Resource statement using a 1.0% copper cut-off grade as at
August 2011 63
Table 14.8 Comparison of 2009 and 2007 Dikulushi Mineral Resource estimates 65
Table 15.1 Pit Optimisation Parameters 67
Table 15.2 Pit Design Parameters 73
Table 15.3 Pit design fleet parameters 74
Table 15.4 Dikulushi mined material 76
Table 15.5: Dikulushi Mineral Reserve statement as at August 2011 at a 1% copper cut-off
grade. 77
Table 16.1: Major Equipment List – Dikulushi Open Pit Project 82
Table 16.2 Slope design guidelines 86
Table 16.3 Weathering depth from new holes 86
Table 17.1 Dikulushi Processing Summary relevant to ore to be mined in the pit cutback105
Table 17.2 Processing statistics for the LG material completed by MWL 106
Table 21.1 Capital cost estimates 114
Table 21.2 Drill and blast unit costs 115
Table 21.3 Load and Haul unit costs 116
Table 21.4 Operating costs 117
Table 22.1 Dikulushi Mining and Financial Summary 118
Tables 22.2 to 7 Sensitivity analysis on the cash flow forecast for the open pit cutback and
treatment at Dikulushi 120
FIGURES
Figure 1.1 Locality plan of the Dikulushi Open Pit Project 11
Figure 4.1 Exploration Licences of the Dikulushi copper silver project 27
Figure 4.2 Dikulushi mine infrastructure within the PE 606 28
Figure 5.1 Dikulushi airstrip and the G1 Charter plane provides safe staff transportation to and
from site 31
Figure 13.1 Underground sources of ore presented in Table 13.2 48
Technical Report on the Dikulushi Open Pit Project, Democratic Republic of Congo – September 16, 2011
P a g e | ix
Figure 14.1 An oblique southward looking 3D view of drillhole type and distribution at Dikulushi
50
Figure 14.2 A vertically oriented 3D view at Dikulushi, looking southwest, showing
mineralisation lenses and current drilling 51
Figure 14.3 A plan showing the distribution of drillhole types across Dikulushi; blasthole data
from the pit have been excluded 52
Figure 14.4 Quantile Quantile (Q-Q) plot of Diamond (DD) drilled samples versus sludge drilled
samples within a common area 53
Figure 14.5 Cumulative distribution of sample lengths highlighting the dominant 1m sample
length 54
Figure 14.6 Log histogram and probability plot for the main FW zone of mineralisation showing
the results of robust domaining 56
Figure 14.7 Variogram models for copper % across the FW zone of mineralisation. 58
Figure 14.8 A plan view slice through the FW zone block model illustrating the good
comparison between model estimates and the nearby drillhole data 61
Figure 14.9 A statistical plot of estimates versus drillhole data grades for successive 30m
increments in elevation and the full strike length of the FW zone mineralisation61
Figure 14.10 3D view of the Dikulushi model, looking south, and showing resource classification
categories 62
Figure 14.11 The grade tonnage curves for the combined Measured and Indicated Mineral
Resources 64
Figure 14.12 A waterfall chart of cumulative Mineral Resource changes from 2007 to 2009 66
Figure 15.1 Pit optimisation plot (undiscounted) 69
Figure 15.2 East-west section 70
Figure 15.3 North-south section 70
Figure 15.4 North-south section 71
Figure 15.5 Oblique view showing fault planes 71
Figure 15.6 Final pit design 72
Figure 15.7 Pit optimisation sensitivity analysis plot (discounted @ 10%). 73
Figure 15.8 Mineral Resource and Mineral Reserve classification 76
Figure 16.1 The existing Dikulushi open pit in 2011 78
Figure 16.2 The cutback stages 80
Figure 16.3 The cutback width at the 880Mrl. The white outline is the existing pit. Red lines
show the old underground workings and the ore blocks are in blue. 81
Figure 16.4 Location of geotechnically logged drillholes 84
Figure 16.5 Pit slope design domains 85
Figure 16.6 Domain E Wedge Potential 88
Figure 16.7 Factor of Safety Sensitivity Analysis, Domain E, 75° Bench Face Angle 89
Figure 16.8 Run-off control domains 92
Figure 16.9 Underground development holings in the North Wall of the pit design 95
Figure 16.10 Underground development holings in the South Wall of the pit design 95
Figure 16.11 Stope Intersection Indicating Rockbolt support. 96
Figure 16.12 Area of pit wall requiring rockbolt support to prevent unravelling 96
Figure 16.13 Plan view indicating development associated with the 870 to 830 Ventilation Rise
97
Figure 16.14 North wall cable bolts and catch fence 98
Figure 16.15 North wall bolting patterns. 98
Figure 16.16 South wall catch fence on 830m RL 99

Technical Report on the Dikulushi Open Pit Project, Democratic Republic of Congo – September 16, 2011
P a g e | x
Figure 16.17 Location of waste dump relative to expanded pit 100
Figure 16.18 Surface water management – general arrangement 102
Figure 17.1 Dikulushi Plant flow diagram 103
Figure 18.1 On-site office facilities at Dikulushi 107
Figure 18.2 Lake Newton 108
Figure 18.3 Average water balance 110
Technical Report on the Dikulushi Open Pit Project, Democratic Republic of Congo – September 16, 2011
P a g e | 11
1. SUMMARY
Mawson West Limited’s (MWL) Dikulushi Open Pit Project (the Project) is located in the Katanga
Province of the Democratic Republic of Congo (DRC). The pit comprises Mineral Resources from the
main Dikulushi deposit’s “Footwall” zone, which has a 230 m strike length and true widths up to 25
m. The pit is planned as a cutback extension of the existing Dikulushi pit left by Anvil Mining Limited
(Anvil) during its tenure of the Dikulushi deposit. MWL has completed open pit studies to mine out
the remaining high grade resource at the Dikulushi deposit and is in the process of developing a pre-
feasibility study in order to access the mineralisation below the current open pit.
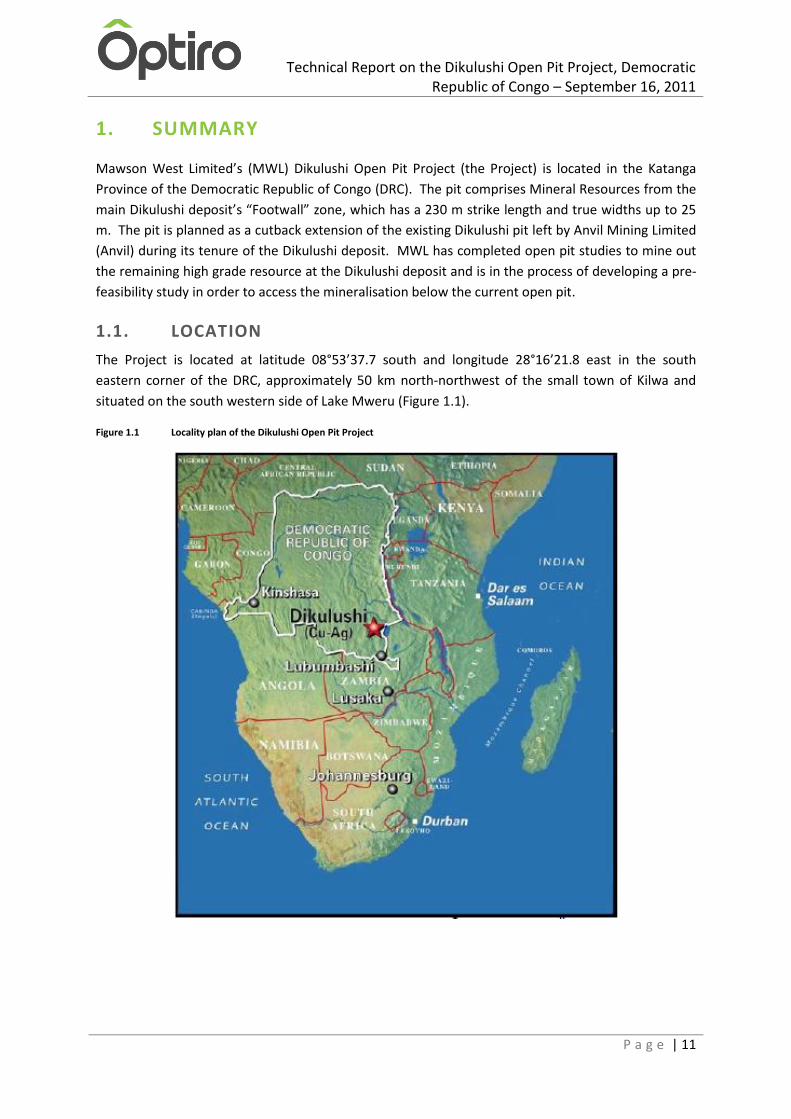
1.1. LOCATION
The Project is located at latitude 08°53’37.7 south and longitude 28°16’21.8 east in the south
eastern corner of the DRC, approximately 50 km north-northwest of the small town of Kilwa and
situated on the south western side of Lake Mweru (Figure 1.1).
Figure 1.1 Locality plan of the Dikulushi Open Pit Project

Technical Report on the Dikulushi Open Pit Project, Democratic Republic of Congo – September 16, 2011
P a g e | 12
1.2. OWNERSHIP
The Dikulushi mine is part of the Dikulushi Mining Convention signed on January 31, 1998 with the
Government of the DRC, and ratified by Presidential Decree issued on February 27, 1998.
The Dikulushi Mining Convention is 100% owned by Anvil Mining Congo SARL which is in the process
of being renamed to CMCC SARL (CMCC). Mawson West Investments Ltd, a wholly owned subsidiary
of Mawson West Limited holds 90% of the issued capital of CMCC, with the remaining 10% being
held by the Dikulushi–Kapulo Foundation NPO.
Mining operations at Dikulushi are currently conducted under the Exploitation Permit 606 (PE)
issued by Ministerial Decree under the terms of the Dikulushi Mining Convention. This guarantees
the sole and exclusive rights to the benefit of the holding company for 20 years until 2022. The
Dikulushi deposit and LG ROM stockpile form part of the PE. This report presents technical
information on the Dikulushi open pit cut back only.
1.3. MINERALISATION
The Dikulushi copper deposit is interpreted to be a hypogene, fault-controlled deposit, comprising
disseminated, brecciated and massive chalcocite-bornite mineralisation with a supergene weathered
and oxidised zone of semi-massive malachite, azurite and nodular cuprite. Most of the oxidised zone
of the Dikulushi deposit has been mined out.
1.4. MINERAL RESOURCES & RESERVES
The current Mineral Resources of the Dikulushi ore body have been modelled using a mineralisation
based interpretation of copper. A block model estimate was completed in May 2009 by David Gray
of Optiro and was depleted in August 2011 according to updated surveyed volumes of historical
mining. The resulting Mineral Resources are stated for a 1.0% copper cut-off grade as per Table 1.1
below.
Table 1.1 Dikulushi Mineral Resource statement as at August 2011, using a 1.0% copper cut-off grade
Category Volume
(m3*1,000)
Density
(t/m3)
Tonnes
(*1,000)
Copper
(%)
Silver
(g/t)
Measured Mineral Resources 184 2.8 516 7.0 211
Indicated Mineral Resources 90 2.8 251 5.6 114
Total Measured and Indicated Mineral Resources 274 2.8 767 6.6 179
Category Volume
(m3*1,000)
Density
(t/m3)
Tonnes
(*1,000)
Copper
(%)
Silver
(g/t)
Inferred Mineral Resources 136 2.8 380 6.8 91
The resulting estimates are supported by historical production and current processing data. The
Mineral Reserves are shown in Table 1.2 and are stated for a 1.0% copper cut-off grade. Mineral
Resources are inclusive of Mineral Reserves. The Mineral Reserve, as per the CIM definition,
incorporated mining losses and dilution material brought about by the mining operation.

Technical Report on the Dikulushi Open Pit Project, Democratic Republic of Congo – September 16, 2011
P a g e | 13
Table 1.2: Dikulushi Mineral Reserve statement as at August 2011, using a 1.0% copper cut-off grade
Category Volume
(m3*1,000)
Density
(t/m3)
Tonnes
(*1,000) Copper (%)
Silver
(g/t)
Proven 66633 2.8 184719 7.27% 207
Probable 127790 2.8 354258 5.51% 169
Total Proven and Probable Reserves 194423 2.8 538977 6.12% 182
1.5. METALLURGICAL
Several metallurgical test work programmes have been completed by Anvil on the Dikulushi ore and
are discussed in Chapter 13. These results are appropriate for deposits with similar styles of
mineralisation, such as Dikulushi, and have subsequently been compared against actual production
results during the period of operation by Anvil.
The most recent metallurgical test work was managed by Sedgman Metals, a metallurgical
consulting company of Perth, Western Australia. Test work was completed at AMDEL Laboratories
in Perth. Metallurgical test work was carried out previously by Anvil on the main resource ore body.
Additional test work was reported on in June 2004 by Independent Metallurgical Laboratories IML
utilised samples provided from the mill feed and an open pit sample to perform a locked cycle
flotation test. Results indicated from a feed grade of 8.76% copper and 306 g/t silver that a recovery
of 91.1% copper and 89.7% silver could be achieved to produce a concentrate grade of 42.1% copper
and 1,447 g/t silver. This sample contained 18% acid soluble copper in feed. Actual production
results during operation by Anvil were higher.
The float plant at Dikulushi operated from 2004 to 2008, fed with high grade ore from the open pit
and underground mine, giving recoveries of 93% copper and 90% silver, producing a concentrate
with 55% copper and 2,100 g/t silver.
There has been no change in the material ore types since the previous open pit and underground
operations and it is therefore expected that the recoveries previously experienced for the fresh ore
from the open pit will be achieved.
The financial model uses a 90% recovery for both copper and silver, with a copper concentrate of
50% copper.
1.6. ENVIRONMENTAL
An ESIA and EMP was lodged in 2003 and was completed by African Mining Consultants of Kitwe,
Zambia, an environmental company licensed to work and report in the DRC.
MWL has lodged $368,409.50 as an Environment bond. This financial guarantee is a contribution
towards environmental rehabilitation costs for the Dikulushi mine.
An updated ESIA was completed for the Project and will be submitted as part of the environmental
requirements of the mining lease.
Technical Report on the Dikulushi Open Pit Project, Democratic Republic of Congo – September 16, 2011
P a g e | 14
1.7. CONCLUSIONS AND RECOMMENDATION
The Project is at an advanced stage and Dikulushi may be described as a producing and developing
property. MWL has completed a pre-feasibility study in order to determine the economics of
developing the Dikulushi deposit via an open pit cutback. Since this was previously an operating
open pit the remaining ore zones have the same risks and are somewhat mitigated for the
mineralogy, metallurgical properties and the processing aspects. There will remain risks for the
mining operations and constant recognition of changing conditions will need to be ensured and
appropriate changes made as mining progresses. Geotechnical knowledge will increase with the
physical mining activities and a better understanding of the ground conditions will be established.
There is likely to be continued resource drilling throughout the mining operations in order to locate
and evaluate additional resources associated with the same ore zone, either at depth or as lateral or
parallel extensions. During the period required to implement the cut-back, and any other required
development, MWL intends to continue processing the LG stockpile and open pit mining of satellite
resources. In addition MWL is currently in the process of defining additional deposits within 50 km
of the Dikulushi plant.

Technical Report on the Dikulushi Open Pit Project, Democratic Republic of Congo – September 16, 2011
P a g e | 15
2. INTRODUCTION
2.1. SCOPE OF THE REPORT
Mawson West Limited (MWL) commissioned Optiro Pty Ltd (Optiro) in May 2011 to review the
pre-feasibility study, generated by MWL, and to prepare an independent technical report regarding
copper-silver Mineral Reserves at the Dikulushi deposit based on this study. This technical report
has been written to comply with the reporting requirements of the Canadian National Instrument
43-101 guidelines: “Standards of disclosure for Mineral Properties” of April 2011 (the Instrument)
and with the “Australasian Code for Reporting of Mineral Resources and Ore Reserves” of December
2004 (the JORC Code) as produced by the Joint Ore Reserves Committee of the Australasian Institute
of Mining and Metallurgy, Australian Institute of Geoscientists and Minerals Council of Australia
(JORC).
The technical report has been written to provide the market with an update on Mineral Resources
and Reserves for the Dikulushi Open Pit Project (the Project) which is now entering an expansion
cut-back of the original Anvil open pit.
All monetary amounts expressed in this report are in United States of America dollars (US$) unless
otherwise stated.
This report presents technical information relevant to the Project’s open pit cut back only.
2.2. AUTHORS
The key authors for compiling this report are:
Mr David Gray is the principal author and Qualified Person and takes overall responsibility
for this report. Mr Gray, of Optiro, is a professional geologist and has a BSc (Hons) degree
(1988) from Rhodes University, South Africa. He has more than 20 years experience in
exploration and mining geology. Mr Gray is a Member of the Australasian Institute of
Mining and Metallurgy (AusIMM) and a member of the South African Council for Natural
Scientific Professions (PrSciNat, 400018/4) and has the relevant qualifications, experience
and independence to be considered as a “Qualified Person” as defined in Canadian National
Instrument 43-101. Mr Gray has visited the Dikulushi deposits in November 2010 and has
generated and supervised Mineral Resource models on the Dikulushi deposits. Optiro is an
Australian based mining and resources consulting and advisory firm which provides a broad
range of expert services and advice, locally and internationally, to the minerals industry and
financial institutions.
Mr Andrew Law is a Qualified Person and takes responsibility for Mineral Reserves
estimation portion of this report. Mr Law is the Director - Mining at Optiro and is a
professional Mining Engineer. He has a HND Metalliferous Mining (1982) and an MBA from
the University of Western Australia. He has more than 28 years’ experience in the planning,
development and extraction of mineral reserves. Mr Law is a Fellow of the Australasian
Institute of Mining and Metallurgy (FAusIMM) and has the relevant qualifications,
Technical Report on the Dikulushi Open Pit Project, Democratic Republic of Congo – September 16, 2011
P a g e | 16
experience and independence to be considered as a “Qualified Person” as defined in
Canadian National Instrument 43-101. Mr Law has not visited the Dikulushi deposits and at
this stage does not intend to visit the deposit. He has however reviewed previous NI 43-101
reports generated by Anvil and Optiro, for MWL, and has held discussions with both David
Gray of Optiro, and staff members from MWL. Mr Law has reviewed all sections of the “Pre-
Feasibility” study generated by various other Qualified Persons, most of whom were
independent of Mawson West, and collated into the pre-feasibility study by MWL.
In September 2011 Optiro generated and supervised Mineral Resource and Reserves models for the
Dikulushi deposit. Optiro is an Australian based mining and resources consulting and advisory firm
which provides a broad range of expert services and advice, locally and internationally, to the
minerals industry and financial institutions.
The following authors contributed to the report:
Name Position NI 43-101 Contribution
David Gray Principal Consultant, Optiro Pty Ltd Principal Qualified Person
Andrew Law Director – Mining, Optiro Pty Ltd Qualified Person and author of
chapters 15, 16, 19, 20, 21, 22, 24, 25,
26.
Nick Hunt-Davies Principal Consultant, Optiro Pty Ltd Contributing author of chapters 15,
16, 19, 20, 21, 22, 24, 25, 26.
Rick Stroud Director, Optiro Pty Ltd Peer review
Mike Turner Turner Mining and Geotechnical Pty Ltd Geotechnical, QP and author of
geotechnical submission in chapter 16
Duncan Grant-Stuart Knight Piesold Consulting Engineer, QP and author of tailings
storage facilities in Chapter 17
Peter Shepard SRK Consulting Hydrological, QP and author of
hydrological submission in chapter 16
and 18
Ray Creese Sedgman Ltd Metallurgical, QP and input into
chapter 13 and 17.
2.3. PRINCIPAL SOURCES OF INFORMATION
The principal source of information used to prepare this report is the information prepared for the
development of the pre-feasibility study and the previously submitted NI 43-101 covering Mineral
Resources at Dikulushi. This pre-feasibility information was provided to Optiro by MWL. The
Mineral Resource information has been provided from the previously submitted NI 43-101 Technical
Report, by Optiro, on the Dikulushi Project, Democratic Republic of Congo, February 3, 2011 and
subsequently revised March 7, 2011. The Mineral Resource has recently undergone a review based
on recently supplied and updated underground survey information and revised cut-off grades.
In summary, the following are primary data sources:
1. The NI 43-101 Technical Report on the Dikulushi Project, Democratic Republic of Congo,
February 3, 2011 and subsequently revised March 7, 2011
2. Historical and current production and processing data

Technical Report on the Dikulushi Open Pit Project, Democratic Republic of Congo – September 16, 2011
P a g e | 17
3. A pre-feasibility study prepared by Mawson West based on inputs from various independent
qualified persons.
Optiro has made all reasonable enquiries to establish the completeness and authenticity of the
information provided. In addition, a final draft of this report was provided to MWL along with a
written request to identify any material errors or omissions prior to lodgement. The following
professionals have been consulted for relevant detail contained in this report.
Name Company Pre-Feasibility Contribution
Mr Jan Dharma-bandu Mawson West Ltd Mining
Adam Anderson Mawson West Ltd Geological
Mike Turner Turner Mining and Geotechnical Pty Ltd Geotechnical
Duncan Grant-Stuart Knight Piesold Consulting Tailings storage facilities
Peter Shephard SRK Consulting Hydrology and Water Management
Peter Haywood Sedgman Ltd Metallurgical
Andries Strauss Knight Piesold Consulting Tailings storage facilities
Glen Zamudio Mawson West Ltd Finance, Marketing and Legal
2.4. SITE VISIT
Mr David Gray completed a comprehensive site visit to the Dikulushi copper Project in November
2010. The purpose of this visit was to:
verify the relative size, position and presence of copper mineralisation at the Dikulushi and
Kazumbula deposits and the LG ROM Stockpile
verify the presence and position of drillhole sampling for the respective resources and
reserves
inspect the drill core for mineralisation, geological relationships with mineralisation and
general sample quality
review the respective sampling methods and QAQC with onsite geologists
review and confirm sample and assay data as stored in the drillhole database
observe and inspect operational activities related to processing the LG stockpile
review historical and current production and processing data.
Mr David Gray did not take independent samples due to the operational nature of the respective
resources and the visible in-situ mineralisation which confirms drillhole sample results. Site visits
have been carried out by the following persons:
Name Company Section Date of Visits
David Gray Optiro Resource NI 43-101 November 2010
Mr Jan Dharma-bandu Mawson West Mining Various as employee of MWL
Adam Anderson Mawson West Geology Various as employee of MWL
Mike Turner Turner Mining and
Geotechnical Pty Ltd
Geotechnical August 2008
Duncan Grant-Stuart Knight Piesold Consulting Tailings storage facility July 2010
Ray Creese Sedgman Ltd Metallurgical Twice during 2006 to 2008
Peter Shephard SRK Consulting Hydrology, Water Management Once during 2007
Glen Zamudio Mawson West Ltd Finance, Marketing and Legal Various as employee of MWL

Technical Report on the Dikulushi Open Pit Project, Democratic Republic of Congo – September 16, 2011
P a g e | 18
Mr Andrew Law has not visited the Dikulushi deposits and at this stage there is no intention for him
to visit the deposit. He has however reviewed previous NI 43-101 reports generated by Optiro for
MWL and has held discussions with both David Gray, of Optiro, and staff members from MWL.
Mr Andrew Law has reviewed all sections of the “Pre-Feasibility” study generated by various
Qualified Persons, many of whom were independent of Mawson West. The report was collated by
MWL.
2.5. INDEPENDENCE
Neither Mr David Gray nor Mr Andrew Law, nor Optiro, have or have had any material interest in
MWL or its related entities or interests. This report has been prepared in return for fees based upon
agreed commercial rates and the payment of these fees is in no way contingent on the results of this
report.
2.6. ABBREVIATIONS AND TERMS
A listing of abbreviations and terms used in this report is provided in Table 2.1 below.
Technical Report on the Dikulushi Open Pit Project, Democratic Republic of Congo – September 16, 2011
P a g e | 19
Table 2.1 Glossary of terms
/ Per
$ Dollars
% Percentage
2D Two dimensional
3D Three dimensional
A Ampere(s)
AC Alternating Current
ADT Articulated dump truck
Ag The chemical symbol for the element silver
allochthonous A term applied to the material forming rocks which have been transported to the
site of deposition
anticline A description of folding of rocks which has produced a convex shape
arenaceous A group of detrital sedimentary rocks, typically sandstones, in which the particles
range in size from 0.06 mm to 2 mm
argillaceous A group of detrital sedimentary rocks, typically clays, shales, mudstones and
siltstones, in which the particles range in size from less than 0.06 mm
As The chemical symbol for the element arsenic
ASCu Acid Soluble copper
arsenopyrite A mineral that is made up of arsenic, iron and sulphur
azurite A mineral that is made up of copper, up to 55% copper, with carbonate and water
BCM, bcm Bank Cubic Metres, a measure of volume applied to unbroken rock
bimodal Statistical term for two peaks in a graph of values
black copper
An impure form of copper produced by smelting oxidised copper ores or impure
scrap, usually in a blast furnace. The copper content varies widely, usually in the
range of approximately 60 to 85% by weight
BOCO Bottom of complete oxidation
bornite A mineral made up of copper, up to 63%, copper, iron and sulphur
boudinaged A minor structure arising from tensional forces, resulting in an appearance in cross-
section similar to that of a string of sausages
brecciated Describes rock made up of angularly broken or fractured rock generally indicating a
fault plane
BMWi Bond Mill Work index
°C Temperature measurement in degrees Celsius (also called Centigrade)
carbonates Rocks made up mainly of a metal, commonly calcium or magnesium or copper, zinc
and lead and carbon dioxide
carrollite A rare mineral that is made up of cobalt, copper and sulphur
CCD Counter Current Decantation
cell A term applied to the three dimensional volume used in the mathematical
modelling by computer techniques of ore bodies
chalcocite A mineral that is made up of copper, up to 80% copper and sulphur
chalcopyrite A mineral that is made up of copper, up to 35% copper, iron and sulphur
chrysocolla A mineral that is made up of copper, up to 36% copper, silica and water
clastic
Rocks formed from fragments of pre-existing rocks which have been produced by
the processes of weathering and erosion, and in general transported to a point of
deposition
cm Centimetre
CMN Calcaire a Minerais Noirs (limestone and dolomite with black oxides)
Co The chemical symbol for the element cobalt
conglomerate A sedimentary rock made up of various size particles from small pebbles to large
boulders and rounded other rock fragments cemented together

Technical Report on the Dikulushi Open Pit Project, Democratic Republic of Congo – September 16, 2011
P a g e | 20
Cu The chemical symbol for the element copper
CuOx copper in the oxide form, generally soluble in dilute sulphuric acid
cuprous copper in ionic state of one missing electron
cut-off
The minimum concentration (grade) of the valuable component in a mass of rock
that will produce sufficient revenue to pay for the cost of mining, processing and
selling it
DC Direct Current
DCF Discounted Cash Flow
Datamine A proprietary computer program developed to model, view, report and analyse
geological and mining data
diagenetic Pertaining to the processes affecting a sediment while it is at or near the Earth’s
surface, i.e., at low temperature and pressure
dilution A term used to describe the waste or non economic materials included when
mining ore
disseminated Ore carrying fine particles, usually sulphides scattered throughout the rock
dolomite A mineral containing calcium, magnesium and carbonate
domain
A term used mainly in mineral resource estimation or geotechnical investigations to
describe regions of a geological model with similar physical or chemical
characteristics
DRC Democratic Republic of Congo
DStrat Dolomies Stratifies (stratified dolomite)
DTD Direct tailings disposal
DTM Digital Terrain Model
Dwi Drop Weight index
E Easting coordinate
EAF Electric Arc Furnace – a smelting facility
Écaille
A French term meaning ‘fragment’, used to describe the large blocks of prospective
Mines Series stratigraphy that appear to ‘float’ in a mega-breccia-type
arrangement
EGL Effective Grinding Length
EIA Environmental Impact Assessment
EMP Environmental Management Plan
EPCM Engineering, Procurement, Construction and Management
Equator Principles A financial industry benchmark for determining, assessing and managing social and
environmental risk in project development
EW Electrowinning
FC Congolese Francs
ferric Iron in an ionic state of three missing electrons
fluvial A geological process in, or pertaining to, rivers
fluvio A description applied to moving material by streams of water
flotation
A widely used process to concentrate valuable minerals after mining that treats
finely ground rock in a water based pulp with chemicals that allow them to float to
the surface where they are recovered in preference to waste or gangue minerals
which sink
framboidal Akin to the skin of a strawberry or raspberry
g Gram
GAC Gangue acid consumption
Gécamines La Générale des Carrierés et des Mines, Parastatal copper Mining Company of the
DRC
geostatistics A mathematical method based on geological spatial knowledge of grade
distributions used to estimate mineralisation grades

Technical Report on the Dikulushi Open Pit Project, Democratic Republic of Congo – September 16, 2011
P a g e | 21
GRAT Grey Roches Argilo-Talcqueuse (a dolomitic and talcose argillaceous rock)
GST Goods and Services Tax
ha Hectares
HAZOP Hazard and Operability Study
HDPE High Density Polyethylene
HG High Grade
HLS Heavy Liquid Separation
HMS Heavy Media Separation. A process that uses high density fluids to separate
valuable minerals from waste or gangue by exploiting differences in specific gravity
HQ3 Diamond drill core with a diameter of 63.5 mm
hrs Hours
HT High tension
HV High voltage
ICP Inductively Coupled Plasma Mass Spectrometry
ICWi Impact Crushing Work index
ID2/IDS
Inverse Distance Squared (method of estimating grades by mathematically
weighting samples based on their distance away from the estimation point)
IT Information technology
JORC
An acronym for Joint Ore Reserve Committee, an Australian committee formed by
the Australian Stock Exchange and Australasian Institute of Mining and Metallurgy,
the purpose of which is to set the regulatory enforceable standards for the Code of
Practice for the reporting of Mineral Resources and Ore Reserves
kg Thousands of grams
kL Thousands of litres
km Thousands of metres
kt Thousands of tonnes
kV Thousands of volts
kW Thousands of watts
kWh Thousand watt hours
kriging
A geostatistical method (named after the South African, D. G. Krige) of estimating
the unknown grade of resource blocks from the grades of samples, taking
cognizance of the sample distribution
kurtosis Statistical term for peaked graph shape (peakedness)
L, l Litres
L/sec, L/s, l/sec, l/s Litres per second
lacustrine Sediment deposition in lakes
Lb Pounds
LIDAR Light Detection and Ranging – a remote sensing system used to collect topographic
data
LOB Lower Orebody
Log Natural logarithm to the base 10
LOM Life of Mine
LV Low voltage
m Metre
mm Millimetre
m% Metre percentage (obtained by multiplying metres by % of assay value)
m3 Cubic metre
Ma Mega annum (Million years)
malachite A mineral containing copper, up to 57% Cu, carbonate and water
mamsl Metres above mean sea level
massive A term used to describe a large occurrence of a pure mineral species, often with no
Technical Report on the Dikulushi Open Pit Project, Democratic Republic of Congo – September 16, 2011
P a g e | 22
structure
MAX Maximum
mbgl Metres below ground level
mbs Metres below surface
MCC Motor Control Centre
MCK Mining Company of Katanga
Mg Milligrams
MIR Milling in raffinate
MIN Minimum
MINDIL A Whittle Four-X mine planning software term for mining dilution
mineralisation The presence of minerals of possible economic value or the description of the
process by which the concentration of valuable minerals occurs
mm Millimetre.
ML Millions of litres
MN Magnetic North.
MODFLOW A groundwater modelling program used to assess the impact on the regional
groundwater table of pumping and abstraction, and also contaminant flow
MPa Millions of Pascals
Mt Millions of tonnes
MVa Millions of Volt Amps
MW Millions of Watts
N Northing Coordinate
Neo-Proterozoic The term used in the geological time scale for the period from 545 million years
ago to 1000 million years ago
NI National Instrument
OC Organic Continuous
ore
A natural aggregate of one or more minerals which, at a specified time and place,
may be mined and sold at a profit or from which some part may be profitably
separated
orogeny Greek for ‘mountain generating’ - the process of mountain building. Orogenic
events occur as a result of plate tectonic processes
P80 80% of product passes
Pb The chemical symbol for the element lead
PBC Pinned Bed Clarifier
PDT Phase Disengagement Time
PE Permis d’Exploitation (Exploitation Permit or Licence)
PFDs Process Flow Diagrams
PFS Pre-feasibility Study
P&IDs Piping and Instrumentation Drawings
pH Concentration of hydrogen ion
PLC Programmable Logic Controller
PLS Pregnant Liquor Solution
ppm Parts per million (same as grams per tonne)
pseudomalachite Pseudomalachite or ‘false malachite’ – named because it is visually similar in
appearance to malachite
PVC Polyvinyl chloride
QAQC Quality Assurance and Quality Control
raffinate A liquid stream that remains after the extraction with the immisciable liquid to
remove solutes from the original liquor. From French: raffinere, to refine.
RAT Roches Argilo-Talcqueuse (a dolomitic/talcose argillaceous rock)
RC Reverse circulation (as in drilling)
Technical Report on the Dikulushi Open Pit Project, Democratic Republic of Congo – September 16, 2011
P a g e | 23
recovery
A measure in percentage terms of the efficiency of a process, usually metallurgical,
in gathering the valuable minerals. The measure is made against the total amount
of valuable mineral present in the ore
reserve (Ore Reserve)
The term for the economic quantities and grade of valuable materials as strictly
applied in compliance with the definition in the Australian JORC Code and in the
Canadian National Instrument (NI) 43-101
resource (Mineral Resource)
The term for the estimate of the quantities and grade of valuable materials but
with no economic considerations as strictly applied in compliance with the
definition in the Australian JORC Code and in the Canadian National Instrument (NI)
43-101
RL Reduced Level (same as elevation coordinate)
Roan Supergroup Describes the stratigraphic succession of sedimentary rocks of Neo-Proterozoic age,
in the Katanga Province of the Democratic Republic of Congo
RMWi Rod Mill Work index
ROM Run-of-Mine (ore)
RSA Republic of South Africa
RSC Roches Silicieuses Cellulaires (siliceous rocks with cavities)
RSF Roches Siliceuses Feuilletees (foliated and silicified dolomitic shales)
S South Coordinate.
s, sec Second
SAG Semi-autogenous Grinding
sandstone A sedimentary rock consisting of sand size grains, generally the mineral quartz,
which is in a consolidated mass
SCADA Supervisory Control and Data Acquisition System
SD Shales Dolomitiques (dolomitic shales)
SEM Scanning Electron Microscopy
SG Specific Gravity
siltstone A sedimentary rock consisting of grains from 0.063 to 0.25 mm, generally the
mineral quartz and clay, which is in a consolidated mass
silica A compound of silicon and oxygen, generally occurring in the form of a mineral
called quartz
SMC SAG mill comminution
SNEL Société Nationale d’Electricité – the provider of electrical power in the DRC
SPLP Simulated Precipitation Leach Procedure
S/S, SS Stainless steel
storativity The volume of water an aquifer releases from or takes into storage per unit surface
area of the aquifer per unit change in head
stratiform
Describes a layered or tabular shaped body of mineralized rock within a
sedimentary rock and implies that the layering of the mineralisation is parallel to
the bedding planes in that sedimentary rock
strings A term used to a digital line drawn within a computer program that outlines or
describes a shape of an object or interpretation
supergene
Pertaining to that part of an ore deposit in which the mineralisation has been
increased as a result of the downward percolation of fluids carrying metal in
solution
SURPAC A proprietary computer program developed to model, view, analyse and report on
geological and mining data
SX Solvent Extraction
SX-EW Solvent Extraction and Electrowinning
t Metric tonne
TCu Total copper
termitaria Termite mounds
Technical Report on the Dikulushi Open Pit Project, Democratic Republic of Congo – September 16, 2011
P a g e | 24
TN True North
TOFR Top of fresh rock
tpa Tonnes per annum
tpd Tonnes per day
tph Tonnes per hour
transmissivity The volume of water flowing through a defined cross-sectional area of an aquifer
TSF Tailings Storage Facility
TSS Total Suspended Solids
UCS Unconfined Compressive Strength
UTM Universal Transverse Mercator grid
V Volts
VAT Value Added Tax
VESDA Very Early Smoke Detection and Alarm
VSD Variable Speed Drive
%v/v Percent by volume
W Westing Coordinate
Whittle Four-X A mine planning software program used to optimise resource models, based on
economic and mining/processing parameters
WNW West North West
WRD Waste Rock Dump
%w/w Percent by weight
Zn The chemical symbol for the element zinc
μm Microns, micrometers
Technical Report on the Dikulushi Open Pit Project, Democratic Republic of Congo – September 16, 2011
P a g e | 25
3. RELIANCE ON OTHER EXPERTS
This technical report has been prepared and approved under the supervision of Mr. David Gray,
Principal Consultant, Optiro Pty Ltd., and Mr Andrew Law, Director Mining, Optiro Pty Ltd. Mr David
Gray, who is the principal author of the report, and Mr Andrew Law are both independent Qualified
Persons as defined in National Instrument 43‐101.
In preparing this report, the Qualified Persons have relied upon information provided by MWL
relating to mining, legal, environmental and financial information as noted below:
Legal title to the tenements held by MWL in the DRC and MWL’s permits to mine which is
relevant to Section 4 and 20 of this report.
Environmental permit and bond information which is relevant to Section 4 and Section 20 of
this report.
The nature and validity of any off-take agreements for concentrate held by MWL which is
relevant to Section 19 of this report.
Financial and cash flow models were provided to Optiro by MWL which is relevant to Section
22 of this report.
Metallurgical balance information leading to the assessed head grade of the copper-silver
concentrate produced from treatment of the mined ore which is relevant to Section 13 and
17 of this report.
Mine design, geotechnical, hydrology, planning, scheduling and costing which is relevant to
sections 15, 16, 21, and 22.
The Qualified Persons have made all reasonable inquiries to establish the completeness and
authenticity of the information provided and drafts of this report were provided to MWL with a
request to identify any material errors or omissions prior to filing.

Technical Report on the Dikulushi Open Pit Project, Democratic Republic of Congo – September 16, 2011
P a g e | 26
4. PROPERTY DESCRIPTION AND LOCATION
4.1. DEMOGRAPHICS AND GEOGRAPHIC SETTING
The Democratic Republic of the Congo (DRC) is located in central Africa and straddles the Equator.
The DRC has an east-west lateral extent of approximately 1,500 km and extends over a north-south
distance of some 1,800 km. The DRC is Africa’s largest country, covering an area of approximately
2.3 million km2 and shares land borders with Angola, Zambia, Rwanda, Tanzania, Uganda, the
Republic of the Congo, Sudan, Burundi and The Central Africa Republic. The capital city is Kinshasa,
which is located in the western portion of the country. The DRC’s main port is Matandi,
approximately 115km from the coast on the Congo River.
The DRC has a population in excess of 66 million of which approximately 50% are aged between 15
and 64 years old. There are over 200 African ethnic groups within the country’s borders, although
the Bantu and Hamitic groups account for approximately 45% of the population. The majority of the
population reside in rural areas with one-third living in urban centres.
Christianity is the dominant religion in the DRC, with approximately half of the population being of
the Roman Catholic faith, with a further 20% Protestant. The remaining population follow the
Kimbanguist (10%), Muslim (10%) and other (10%) faiths.
The national language is French, although Lingala, Kingwana, Kikongo and Tshiluba are widely
spoken.
4.2. PROJECT OWNERSHIP
The Dikulushi mine is part of the “Dikulushi Mining Convention”, signed on the January 31, 1998 with
the Government of the DRC, and ratified by Presidential Decree issued on February 27, 1998.
The Dikulushi Mining Convention is owned 100% by Anvil Mining Congo SARL (which is in the process
of being renamed CMCC SARL) (“CMCC”). Mawson West Investments Ltd a wholly owned subsidiary
of Mawson West Limited, holds 90% of the issued capital of CMCC, the remaining 10% is held by the
Dikulushi – Kapulo Foundation (NPO).
4.3. PROJECT LOCATION
The Project is located within the Katanga Province in the southeastern DRC, some 400 km north of
Lubumbashi and 50 km north of the regional town of Kilwa. The Project is centred at approximately
S 08° 53’ E 28° 16’, some 25 km west of Lake Mweru near the DRC border with Zambia (Figure 4.1).
4.4. THE PROJECT TENEMENT AREA
CMCC holds title to the Dikulushi mine and surrounding exploration tenements through the
Dikulushi mining convention. Under the Mining Convention the exploration tenements known as
“PR’s” were issued for a five year period and are renewable a further three times, each time for a
period of five years. The PR’s shown in Table 4.1 and Figure 4.1 below were first granted on the
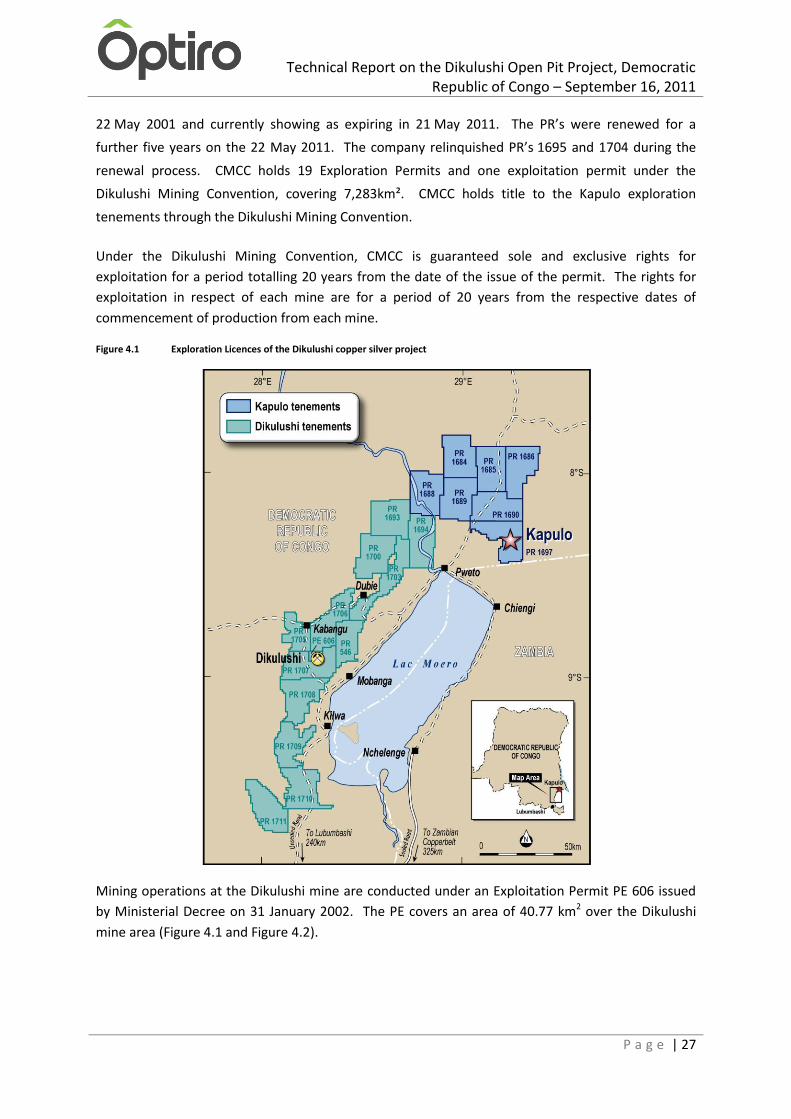
Technical Report on the Dikulushi Open Pit Project, Democratic Republic of Congo – September 16, 2011
P a g e | 27
22 May 2001 and currently showing as expiring in 21 May 2011. The PR’s were renewed for a
further five years on the 22 May 2011. The company relinquished PR’s 1695 and 1704 during the
renewal process. CMCC holds 19 Exploration Permits and one exploitation permit under the
Dikulushi Mining Convention, covering 7,283km². CMCC holds title to the Kapulo exploration
tenements through the Dikulushi Mining Convention.
Under the Dikulushi Mining Convention, CMCC is guaranteed sole and exclusive rights for
exploitation for a period totalling 20 years from the date of the issue of the permit. The rights for
exploitation in respect of each mine are for a period of 20 years from the respective dates of
commencement of production from each mine.
Figure 4.1 Exploration Licences of the Dikulushi copper silver project
Mining operations at the Dikulushi mine are conducted under an Exploitation Permit PE 606 issued
by Ministerial Decree on 31 January 2002. The PE covers an area of 40.77 km2 over the Dikulushi
mine area (Figure 4.1 and Figure 4.2).

Technical Report on the Dikulushi Open Pit Project, Democratic Republic of Congo – September 16, 2011
P a g e | 28
Table 4.1 Mawson West Limited tenement schedule
Tenement Schedule
Project Group Entity Permit No. Area km² Type Granted Expiry
Dikulushi AMC PE606 40.77 Mining 31-Jan-02 30-Jan-22
Dikulushi AMC PR546 283.8 Exploration 23-May-11 22-May-16
Kapulo AMC PR1684 399.1 Exploration 12-Apr-11 11-Apr-16
Kapulo AMC PR1685 399.0 Exploration 12-Apr-11 11-Apr-16
Kapulo AMC PR1686 395.7 Exploration 22-May-11 21-May-16
Kapulo AMC PR1688 398.8 Exploration 12-Apr-11 11-Apr-16
Kapulo AMC PR1689 398.8 Exploration 22-May-11 21-May-16
Kapulo AMC PR1690 398.9 Exploration 22-May-11 21-May-16
Dikulushi AMC PR1693 398.6 Exploration 12-Apr-11 11-Apr-16
Dikulushi AMC PR1694 398.5 Exploration 12-Apr-11 11-Apr-16
Kapulo AMC PR1697 398.7 Exploration Held Held
Dikulushi AMC PR1700 398.4 Exploration 12-Apr-11 11-Apr-16
Dikulushi AMC PR1703 398.3 Exploration 22-May-11 21-May-16
Dikulushi AMC PR1705 237.0 Exploration 22-May-11 21-May-16
Dikulushi AMC PR1706 398.0 Exploration 22-May-11 21-May-16
Dikulushi AMC PR1707 397.7 Exploration 23-May-11 22-May-16
Dikulushi AMC PR1708 405.1 Exploration 22-May-11 21-May-16
Dikulushi AMC PR1709 345.0 Exploration 22-May-11 21-May-16
Dikulushi AMC PR1710 397.0 Exploration 22-May-11 21-May-16
Dikulushi AMC PR1711 396.9 Exploration 22-May-11 21-May-16
Total Area 7,283
Figure 4.2 Dikulushi mine infrastructure within the PE 606
Technical Report on the Dikulushi Open Pit Project, Democratic Republic of Congo – September 16, 2011
P a g e | 29
4.5. ENVIRONMENTAL PERMITS
An Environmental Impact Assessment (EIA) was completed by African Mining Consultants of Zambia
in April 2003, along with an Environmental Management Plan (EMP), which have been approved by
the DRC Government. The EMP includes commitments relating to mine decommissioning. Annual
reporting of environmental issues and measurements to relevant government bodies is a condition
of the operating license and EMP.
MWL have lodged $368,409.50 as an Environment Bond. The financial guarantee is a contribution
towards an estimate of the total costs of closure, rehabilitation and re-vegetation of the Dikulushi
mine. The development of the financial guarantee is conducted in compliance with:
Articles 410 of the Mining Regulations
Articles 124 and 125 of Appendix XI of the DRC Mining Regulations 2003; and
Appendix II of the Mining Regulations 2003 Regular environmental audits are carried to determine the mine’s compliance with its Environmental
Management Plan. An updated EAP was completed for the Project in July 2011 and will be
submitted as part of the requirements
An environmental monitoring database is maintained at the mine, comprising the following:
4. wet/dry, min/max temperatures
5. rainfall
6. dust exposure
7. noise levels
8. ground and surface water quality
9. groundwater levels
10. Tailings Dam piezometer water levels
11. light levels.
A study into the acid rock drainage potential of the process plant tailings was conducted in 2005 and
they were classified as low risk.

Technical Report on the Dikulushi Open Pit Project, Democratic Republic of Congo – September 16, 2011
P a g e | 30
5. ACCESSIBILITY, CLIMATE, LOCAL RESOURCES,
INFRASTRUCTURE AND PHYSIOGRAPHY
5.1. ACCESS
Access to the Dikulushi Mine is by sealed road from Lubumbashi to Kasenga along the Luapula River
by boat to Kilwa and then approximately 54 km by refurbished gravel road from Kilwa to Dikulushi.
The total travelling distance is approximately 500 km. The closest international airport is at
Lubumbashi, approximately 450 km to the south. An all weather airstrip is located at the Dikulushi
mine and charter flights from Lubumbashi can land directly at site. Supplies for the project are
typically trucked on sealed roads from South Africa via Botswana to Nchelenge port on the Zambian
side of Lake Mweru. Supplies are then transferred from Nchelenge to Kilwa on the Congo side of
Lake Mweru on 340 t capacity barge owned by CMCC; the water journey takes 5 hours. Access from
Kilwa port to the mine is via a 54 km refurbished gravel road and takes approximately 1 hour by light
vehicle.
5.2. SITE TOPOGRAPHY, ELEVATION AND VEGETATION
The Dikulushi deposit is located on a plateau approximately 1000 m above sea level. The area
surrounding the Dikulushi site is almost entirely covered with woodland and forest, with some
swamps or wetland areas. The plateau rises into the Kundelungu ranges 60 km to the west of
Dikulushi and forms an escarpment 25 km to the east along the fault-bounded edge of Lake Mweru.
A minor ephemeral stream is located near the Dikulushi mine site. The Luapula River is the main
drainage into Lake Mweru and both form the international boundary between Zambia and the DRC.
5.3. CLIMATE, PHYSIOGRAPHY, LOCAL RESOURCES AND
INFRASTRUCTURE
The average annual rainfall, as indicated by mission records, is 1,260 mm, with a range of 800 mm to
2,200mm. An Oregon Scientific weather station was installed at Dikulushi in 2006. Weather data
collected at Dikulushi over 3 full years from 2006 to 2008 shows an average annual rainfall of 1,127
mm. The wet season begins towards the end of October and finishes at the end of April, with 90% of
the annual rainfall occurring during this period. The average minimum recorded temperature is 18°C
and the average maximum temp is 29°C over the year.
The wet season does not affect mining or processing operations at Dikulushi but does inhibit
exploration activities, and access to some areas within the PR with flooded roads and rivers and
terrain becoming difficult to access with vehicles. Labour is sourced locally for camp, geological and
drilling assistant type work.
5.4. SURFACE RIGHTS
The Dikulushi mine is based on Exploitation Licence (PE606) granted on 31 January 2001. The lease
is valid for 20 years and can be renewed for a further 20 years.

Technical Report on the Dikulushi Open Pit Project, Democratic Republic of Congo – September 16, 2011
P a g e | 31
There are no competing mining rights (for example, small artisanal mining licenses) in the project
area.
5.5. SITE INFRASTRUCTURE
The development of the Dikulushi mine has required development of seven major locations:
1. the treatment plant area, which includes the mine administration building
2. the mine services area, including workshops, fuel farm and powerhouse
3. the explosives storage area
4. the staff village
5. the airstrip
6. the process water dam
7. the tailings storage facility.
These items of infrastructure are depicted in Figure 4.2. This infrastructure was in place for the
previous operations under Anvil and is well established and sufficient in size for current and planned
requirements.
Figure 5.1 Dikulushi airstrip and the G1 Charter plane provides safe staff transportation to and from site
5.5.1. WATER SUPPLY
Mine water is sourced from a raw water dam located adjacent to the Tailings Dam. Supernatant
tailings water is reclaimed via penstock arrangements for use in the processing plant.
Potable water is supplied from various bores on the property which are tested regularly.
5.5.2. POWER SUPPLY
The project is located in a remote area where there is no electrical utility grid. The mine power is
supplied by diesel generators. There is sufficient back-up capacity.
Technical Report on the Dikulushi Open Pit Project, Democratic Republic of Congo – September 16, 2011
P a g e | 32
The existing power station at Dikulushi comprises the following generators: 1 x 2.0 MW Caterpillar, 1
x 1.6 MW Caterpillar, 4 x 0.8 MW Mirrlees for a total capacity of 6.8 MW. The current power
demand is in the order of 1.8 MW and only the 2.0 MW Cat, 1.6 MW Cat and 2x Mirrlees are being
utilised on rotation. This is sufficient to supply the extra demand of 0.6-1.0 Megawatts for
dewatering purposes during the cut-back project.
CMCC recognises that a consistent reliable fuel supply is crucial to the success of the Dikulushi
operation. The operation currently uses approximately 450,000l of diesel per month. This fuel is
supplied by three DRC based companies, two receive supplies from the port of Beira and the other
receives supplies from the port of Dar Es Saleem. CMCC has contacted a further supplier from Dar Es
Saleem whom would be able to supply fuel to Dikulushi. During the cutback project the demand for
diesel will increase to 1,200,000 l/month for a four to five month period. CMCC is regularly speaking
to suppliers to guarantee no interruptions in supply. Thus CMCC believes that it has mitigated the
risk of fuel supply by having a number of suppliers whom source fuel from different ports.
5.5.3. MINE PERSONNEL
As at December 2010, Dikulushi mine employed 270 people, of which 22 were expatriates. The
requirements for the cut-back of the open pit and other associated activities will require a total
workforce of 145 - 40 employees and 105 contractors.
5.5.4. TAILINGS STORAGE FACILITY
There are currently three tailing storage facilities (TSF) on site. The initial TSF designed for HMS
tailings, dormant since 2004, has had the coarse portion reclaimed and retreated in recent
operations. The second TSF is dormant whilst the third is in use to accommodate the tailings
resulting from the treatment of the HMS material and other low grade stockpiles. The third TSF has
been reviewed for extended use beyond its current life. This will be built up to accommodate
tailings resulting from the open pit cut back mining operations.
More detail on the TSF is covered in Section 17.
5.5.5. ADMINISTRATION AND PLANT SITE BUILDINGS
The infrastructure on site includes administration offices, a warehouse, mining equipment and
maintenance garages, mechanical workshops and a service area with access pit for inspection and
repair of vehicles.
There is an infirmary on site and a hospital at Kilwa, approximately 50 km from the mine. An assay
laboratory has been constructed on site in order to facilitate metallurgical, exploration and grade
control sampling.
5.5.6. ACCOMMODATION
A staff village has been constructed 1.8 km from the process plant. A mess hall, fully equipped
kitchen, food storage and laundry facilities serve all employees. Recreational facilities are also
available to employees.
Technical Report on the Dikulushi Open Pit Project, Democratic Republic of Congo – September 16, 2011
P a g e | 33
5.5.7. COMMUNICATIONS
Mobile phone coverage is possible through a dedicated mast located on top of the waste dump.
There are satellite systems for data transmission and VOIP telephone coverage. There is a base
station radio system, along with vehicle and hand-held radios.
5.5.8. MOBILE EQUIPMENT
Sufficient mobile equipment for the efficient running of the operations is in place, comprising light
vehicles (including an ambulance), quad bikes, light trucks, forklifts, buses and generators.
5.5.9. SECURITY
Security is provided by a contractor. Appropriate secure facilities are provided for storage of fuel
and explosives.

Technical Report on the Dikulushi Open Pit Project, Democratic Republic of Congo – September 16, 2011
P a g e | 34
6. HISTORY
For information on the history of the project/property refer to item 8 in the NI 43-101 Technical
Report on the Dikulushi Project, Democratic Republic of Congo, February 3, 2011 and subsequently
revised March 7, 2011.

Technical Report on the Dikulushi Open Pit Project, Democratic Republic of Congo – September 16, 2011
P a g e | 35
7. GEOLOGICAL SETTING AND MINERALISATION
For information on the Geological Setting and the Mineralisation refer to item 9 and item 11 of the
NI 43-101 Technical Report on the Dikulushi Project, Democratic Republic of Congo, February 3,
2011 and subsequently revised March 7, 2011.

Technical Report on the Dikulushi Open Pit Project, Democratic Republic of Congo – September 16, 2011
P a g e | 36
8. DEPOSIT TYPES
For information on the Deposit Types refer to item 10 of the NI 43-101 Technical Report on the
Dikulushi Project, Democratic Republic of Congo, February 3, 2011 and subsequently revised March
7, 2011.

Technical Report on the Dikulushi Open Pit Project, Democratic Republic of Congo – September 16, 2011
P a g e | 37
9. EXPLORATION
For information on the Exploration of the project/property refer to item 12 of the NI 43-101
Technical Report on the Dikulushi Project, Democratic Republic of Congo, February 3, 2011 and
subsequently revised March 7, 2011.

Technical Report on the Dikulushi Open Pit Project, Democratic Republic of Congo – September 16, 2011
P a g e | 38
10. DRILLING
For information on the drilling used for the generation of the resource refer to item 13 of the NI 43-
101 Technical Report on the Dikulushi Project, Democratic Republic of Congo, February 3, 2011 and
subsequently revised March 7, 2011.

Technical Report on the Dikulushi Open Pit Project, Democratic Republic of Congo – September 16, 2011
P a g e | 39
11. SAMPLE PREPARATION, ANALYSIS AND SECURITY
For information on the Sample Preparation, Analysis and security used for the generation of the
resources refer to item 15 of the NI 43-101 Technical Report on the Dikulushi Project, Democratic
Republic of Congo in February 3, 2011 and subsequently revised March 7, 2011.

Technical Report on the Dikulushi Open Pit Project, Democratic Republic of Congo – September 16, 2011
P a g e | 40
12. DATA VERIFICATION
For information on the data verification used for the generation of the resources refer to item 16 of
the NI 43-101 Technical Report on the Dikulushi Project, Democratic Republic of Congo, February 3,
2011 and subsequently revised March 7, 2011.

Technical Report on the Dikulushi Open Pit Project, Democratic Republic of Congo – September 16, 2011
P a g e | 41
13. MINERAL PROCESSING AND METALLURGICAL TESTING
13.1. INTRODUCTION
Historically Anvil has completed a significant amount of test work for Dikulushi, and a summary of
this work is presented below. Relevant operational data from the Dikulushi processing plant is also
tabulated.
As the cut back ore will be mined from the same, or close to the same areas as the ore previously
treated at or below the current pit floor, it is not unreasonable to expect that it will exhibit similar
metallurgical characteristics during processing through the existing Dikulushi Processing plant.
13.2. ANVIL MINING TEST WORK
13.2.1. EARLY TEST WORK
The following information was supplied by Mawson West as background to the original design for
the process plant that was built at Dikulushi. Sedgman has not been able to review the original test
work reports and as such cannot verify the information in this sub-section.
A significant amount of metallurgical test work was undertaken by Anvil for the pre-feasibility phase
of their Dikulushi Project between February 1998 and April 1998 by the Minerals Engineering Group
of Mintek at their laboratories in Randburg, South Africa. Resource Management Group (RMG)
established and supervised the test work on behalf of Anvil. Local coordination and support in South
Africa were provided by Fluor Daniel, Southern Africa. The Mintek data were used as the process
design basis for the pre-feasibility study completed by Signet Engineering in Perth in April 1998.
A previous test work program was carried out by the Bureau de Recherches Géologiques et Minières
(BRGM), the results of which were available in Report no. 80 SGN 260 MIN, issued in April 1980. A
limited amount of preliminary test work was initiated by Anvil and undertaken by Goldfields in
Johannesburg and was detailed in their report no. FL04\ks dated 4 November, 1996.
The metallurgical test work program carried out by Mintek in 1998 was on various sulphide, oxide
and host rock samples from Dikulushi. The locations of these samples, their average grades and the
rock type classification are listed below in Table 13.1. Each composite comprised material from one
to three drillholes.
Table 13.1 Details of Dikulushi drillcore used in Mintek metallurgical testing
% Copper Silver
Composite No. Drillholes Classifications Total Oxide g/t
1 DIK 15, 22 East-oxidised 9.5 1.5-2 360
2 DIK 28, 31 East-deeper 15.2 0.8 525
3 DIK 6, 11, 14 West-main 10.1 1.0 150
4 DIK 26 West-disseminated 2.8 0.3 60
5 DIK 5, 14 West-complex 9.0 1.3 50
6 DIK 12, 13, 23 East-transition 7.9 0.6 260

Technical Report on the Dikulushi Open Pit Project, Democratic Republic of Congo – September 16, 2011
P a g e | 42
The sample nomenclature indicates that compositing was based upon special and oxidation
properties of the ore. Sedgman cannot comment on the representivity of these samples with
respect to the current study.
Physical tests were undertaken for typical composites of massive sulphide and light gray sandstone.
Flotation tests were carried out on primary, transition, oxidised and highly oxidised composites from
the east zone, and primary and complex sulphide composites from the west. These composites
represented an arbitrary sub-division of the ore body.
Head analyses revealed a relatively high total copper grade of 15.2% for the East Primary composite,
while the others were in the range of 8.2 - 11.4%, which was reasonably close to the target grade of
10% copper. Silver assays were variable, with a range of 138 - 562 g/t, the highest being for the East
Primary. Iron and sulphur levels were relatively low. Potential penalty elements identified were
lead and zinc in the West Complex, arsenic in the West Primary and West Complex, and fluorine in
all composites.
The previous test work by BRGM in the 1980s indicated good flotation characteristics, with
recoveries ranging from 84 - 96% for copper, and 79 - 96% for silver. High grade concentrate grades
of 63 - 72% copper and 950 - 2,600 g/t silver were produced. BRGM found that sulphidation with
Na2S was required for oxidised material, though highly oxidised near surface ore was not tested.
Mineralogical examination revealed that the dominant copper sulphide mineral was chalcocite, in
both massive and disseminated forms. Some of the massive chalcocite was crystalline, and may
tend to slime during grinding. Complex sulphides in the west zone contained chalcopyrite, bornite
and sphalerite. Sphalerite is also common in other areas associated with chalcopyrite. Near surface
oxide contained malachite, azurite and chrysocolla. The latter did not float even when sulphidised.
Silver was assumed to be present mostly in solid solution in chalcocite, and occasionally as selenide.
Arsenic occurred as arsenopyrite and tennanite. Sandstone was the dominant host rock.
The physical tests revealed that the Dikulushi ore was of moderate hardness, with figures of 14.1 -
17.4 for the Rod Mill Work Index (RMWI), 10.5 - 12.5 for Ball Mill Work Index (BMWI) and 0.21 - 0.39
for Abrasion Index (AI) being reported. The higher indices generally related to the massive ore.
Flotation results at a grind size of 80% passing 75 microns were comparable to those in the BRGM
data, with recoveries of 71 - 97% for copper and 63 - 95% for silver. The lower figures were for near
surface highly oxidised material. The predicted concentrate grades were 48 - 70% copper, and 661 -
2,300 g/t silver. Detailed concentrate analyses revealed that fluorine was the only impurity over the
penalty threshold. Reagent usage appeared modest, except for the Na2S required for the oxidised
material, which required up to 3.2 kg per tonne of ore
13.2.2. LATER TEST WORK
Additional test work was performed by Independent Metallurgical Laboratories (IML) in Perth during
2003. The related test work reports have been reviewed and Sedgman has been able to verify the
information detailed in this sub-section.
Five separate copper ore composites from Dikulushi were used for the test work:
Technical Report on the Dikulushi Open Pit Project, Democratic Republic of Congo – September 16, 2011
P a g e | 43
High Grade Chalcocite
Disseminated and Low Grade Chalcocite
Lead & Zinc Rich Chalcocite
Bornite
Stockpiled Dense Media Separation tailings
The various chalcocite composite assays are detailed in Table 13.2.
Table 13.2 Head grades of chalcocite composites
Element Unit High
Grade Chalcocite
Disseminated
& Low Grade
Chalcocite
Pb/Zn Rich
Chalcocite
Cu (Total) – Assay % 21.9 3.05 6.30
Cu (Total) – Calc. % 20.1 2.99 5.53
Cu (Total – Sequential.) – Calc. % 20.4 3.05 5.67
Cu (Acid Soluble) % 3.52 1.27 0.26
Cu (Cyanide Soluble) % 16.8 1.73 3.83
Cu (Residual) % 0.14 0.04 1.58
Ag ppm 624 75 23
Pb 39 ppm 21 ppm 1.58%
Zn 189 ppm 115 ppm 10.88%
The Sequential Diagnostic Leach Analysis identifies the oxide component as Acid Soluble copper, the
Secondary Sulphides (including Chalcocite and Covellite) report as Cyanide Soluble species and the
residual fraction relates to primary copper sulphides such as chalcopyrite.
Mineralogical examinations identified the abundance of various minerals as illustrated in Table 13.3.
Table 13.3 Relative abundance of significant minerals
Mineral
High
Grade Chalcocite
Disseminated
& Low Grade
Chalcocite
Pb/Zn Rich
Chalcocite
+0.1mm -0.1mm +0.1mm -0.1mm +0.1mm -0.1mm
Chalcocite Dominant Dominant Dominant Dominant Minor Accessory
Malachite Major Major Major Major - -
Bornite Accessory - Accessory Trace Trace Accessory
Chalcopyrite - - Trace - Major Minor
Pyrite - Trace - - Major Minor
Sphalerite - - Accessory - Dominant Dominant Note. Dominant: >50%, Major: 20 - 50%, Minor: 10 – 20%, Accessory: 1 – 10%, Trace: <1%.
The comminution data derived for these composites relating to the Bond Ball Mill, Bond Rod Mill
and Abrasion Indices are summarised in Table 13.4.
Technical Report on the Dikulushi Open Pit Project, Democratic Republic of Congo – September 16, 2011
P a g e | 44
Table 13.4 Comminution test work results
Composite BRMWi (kWH/t) BBMWi (kWh/t) BAi
High Grade Chalcocite 15.7 12.4 0.1472
Disseminated & Low Grade Chalcocite 17.3 13.8 0.4224
Pb/Zn Rich Chalcocite 17.7 - 0.2360
A series of flotation tests was performed on the composites.
HIGH GRADE CHALCOCITE
There was minimal difference in rougher flotation performance between grind P80’s of 75, 106 and
150 microns using a stainless steel mill. See Table 13.5.
Table 13.5 Effect of grind size on flotation performance (high grade chalcocite)
Grind P80 - mic
Cumulative Rougher Concentrates
Copper Silver
Assay (%) Distribution (%) Assay (ppm) Distribution (%)
75 52.0 97.8 1567 97.3
106 53.2 97.6 1632 97.3
150 54.9 97.7 1543 97.0
Using a grind P80 of 150 microns in each case, rougher flotation tests at potassium amyl xanthate
(collector) additions of 70, 105 and 140g/t resulted in high copper grades and recoveries in each case
although flotation kinetics were significantly slower at the lower addition rate. See Table 13.6.
Table 13.6 Effects of collector addition on flotation performance (high grade chalcocite)
Collector Addition (PAX) – g/t
Cumulative Rougher Concentrates
Copper Silver
Assay (%) Distribution (%) Assay (ppm) Distribution (%)
70 55.3 95.8 1818 96.8
105 51.0 96.2 1644 96.8
140 54.9 97.7 1543 97.0
DISSEMINATED AND LOW GRADE CHALCOCITE
A set of flotation tests was conducted at various grind sizes. A grind P80 of 150 microns produced
similar results to the finer grind sizes. See Table 13.7.
Table 13.7 Effect of grind size on flotation performance (disseminated and low grade chalcocite)
Grind P80 - mic
Cumulative Rougher Concentrates
Copper Silver
Assay (%) Distribution (%) Assay (ppm) Distribution (%)
75 13.4 82.3 303 80.6
106 14.3 81.5 326 79.4
150 13.1 81.5 303 78.8

Technical Report on the Dikulushi Open Pit Project, Democratic Republic of Congo – September 16, 2011
P a g e | 45
The effect of variation in collector dosing was investigated. Although a higher collector addition
produced better results, these tests were performed at the fine grind P80 of 75 microns and before
an optimised pulp Eh had been established. Consequently the testing was inconclusive. See Table
13.8.
Table 13.8 Effect of collector addition on flotation performance (disseminated and low grade chalcocite)
Collector Addition (PAX) – g/t
Cumulative Rougher Concentrates
Copper Silver
Assay (%) Distribution (%) Assay (ppm) Distribution (%)
100 22.4 75.8 521 75.3
165 25.5 78.0 615 79.5
PB/ZN RICH CHALCOCITE
Two sets of tests were performed to investigate the effect of grind size at different pulp Eh levels.
The results are shown in Table 13.9.
Table 13.9 Effect of grind size and Eh level on flotation performance (Pb/Zn rich chalcocite)
Grind P80 - mic Eh – mV
(Ag/AgCl/Sat KCl)
Cumulative Rougher Concentrates
Copper Zinc
Assay (%) Distribution (%) Assay (%) Distribution (%)
75 150 11.9 98.0 23.8 88.6
106 150 13.1 94.8 27.3 82.0
106 70 12.0 97.6 23.2 90.7
150 70 12.6 98.1 25.3 90.4
The tests showed high copper recoveries but the copper grades were diluted by the amount of zinc
also reporting to concentrate.
A series of tests were performed to determine the effect of a range of Zinc Depressants – Sodium
Cyanide, Zinc Sulphate and Sodium Meta-bisulphite. The results were disappointing with only
sodium meta-bisulphite demonstrating any depression of zinc, but unfortunately it also depressed
copper.
A mineralogical examination of a first rougher concentrate showed that approximately 50% of the
sphalerite was locked with chalcopyrite and another 10-20% of the sphalerite was associated with
other sulphides.
MIXED CHALCOCITE COMPOSITE
A locked cycle flotation test was performed on a composite comprising 41.6% High Grade Massive
Chalcocite and 58.4% Disseminated and Low Grade Chalcocite which produced a calculated head
grade of 9.41% copper.
A combined rougher/cleaner copper concentrate grade of 54.6% was produced at an overall
recovery of 86.9%. The combined silver concentrate grade was 1,683 ppm at a recovery of 91.9%.

Technical Report on the Dikulushi Open Pit Project, Democratic Republic of Congo – September 16, 2011
P a g e | 46
ROM LOCKED CYCLE TEST
In 2004 a locked cycle test was performed on a plant feed sample dated 25/11/2003 producing a
unit flash flotation cell, rougher and cleaner concentrate.
The headfeed sequential analysis is shown in Table 13.10 and the test results in Table 13.11.
Table 13.10 Head grades of chalcocite composites
Element Unit 25/11/2003 Feed Sample
Cu (Total) - Assay % 9.18
Cu (Total) – Calc. % 9.23
Cu (Total – Sequential.) – Calc. % 9.31
Cu (Acid Soluble) % 1.98
Cu (Cyanide Soluble) % 7.32
Cu (Residual) % 0.01
Ag ppm Not Assayed
Pb ppm 41
Zn ppm 857
Table 13.11 Locked cycle flotation test results
Product Wt% Copper Silver
Assay (%) Distribution (%) Assay (%) Distribution (%)
Unit Cell Conc. 4.99 61.32 34.92 2400 39.21
Rougher Conc. 8.62 47.80 47.72 1600 45.14
Cleaner Conc. 5.32 14.25 8.47 305 5.31
Scavenger Tail 81.07 1.03 8.89 39 10.34
Calculated Head 100.00 8.79 100.00 306 100.00
The results indicate a combined concentrate grade of 42.1% copper at an overall recovery of 91.1%.
The combined silver concentrate grade was 1,447ppm at an overall recovery of 89.7%.
TEST WORK SUMMARY
Of the three chalcocite composites tested at IML in 2003 the high grade chalcocite composite was
the most relevant to the Dikulushi Open Pit Project. However it cannot be considered truly
representative as the head grade was far higher than the planned feed grade and operational data at
Dikulushi showed that there was a positive correlation between copper head grade and recovery.
Overall the test work did demonstrate that provided the flotation conditions, including Redox
potential, was carefully controlled, chalcocite ore could be effectively recovered by flotation
producing fast kinetics, high concentrate grades and good recoveries.
13.1 PLANT OPERATIONAL RESULTS
Mawson West has indicated that the flotation plant at Dikulushi previously operated from 2004 to
2008 and processed high grade ore from both the open pit and underground mine. According to
Anvil production data between September 2004 and April 2008, it achieved recoveries of 88.3%
copper and 88.5% silver, producing a concentrate containing 54.7% copper and 1659 g/t silver. The

Technical Report on the Dikulushi Open Pit Project, Democratic Republic of Congo – September 16, 2011
P a g e | 47
plant was shut down in November 2008 after treating low grade stockpile material during the last
months of operation.
In May 2010 the plant was refurbished and commenced production in June 2010 by treating low
grade ore and HMS tails. The recoveries vary between 60 - 70% for the low grade and 50 – 65% for
the HMS tails. Concentrate grades average 45% copper and 1,100g/t silver. This information on
recent operations has been provided by Mawson West. Sedgman has not been able to review the
data relating to Mawson West operations to verify the accuracy of these statements.
13.2 METALLURGICAL PROPERTIES OF THE CUTBACK ORE
The Dikulushi deposit was mined and processed by Anvil Mining for several years and the high grade
chalcocite ore below the current pit floor has previously been processed in the mill during
underground mining operations. Anvil Mining’s monthly production reports, for the period where
ore from at or below the existing pit floor was being processed have been summarised in Table
13.12 to demonstrate the metallurgical response of this material.
Table 13.12 shows that ore from above and below the crown pillar achieved flotation recoveries
around 90% for both copper and silver from February 2007 to April 2008. The average treatment
rate on an annualised basis during this period was 365,317 tpa due to constraints associated with
underground mining.
Figure 13.1 shows the RL’s relative to the resource which is targeted by the cutback and the
locations of UG drives where material in Table 13.2 would have been sourced from.
As the cutback ore will be mined from the same or close to the same areas as the ore at or below the
present pit floor, it is not unreasonable to expect that it will exhibit similar metallurgical
characteristics. However concentrate recoveries will be marginally reduced as the planned
treatment rate is 500,000 tpa (or 1370 tpd). Flotation residence time will consequently be reduced
by approximately 27% compared to the operating period February 2007 to April 2008.
Reviewing historic operating data it can be seen that when average monthly treatment rates were
equivalent to around 1,370 tpd (Jan-06, Feb-06, Aug-06) the copper recovery was approximately 86-
87%. Based on historic production data, flotation grades should not be significantly affected.

Technical Report on the Dikulushi Open Pit Project, Democratic Republic of Congo – September 16, 2011
P a g e | 48
Table 13.12 Dikulushi processing summary (February 2007 – April 2008)
Month Blend %
ROM
RL mined (Ore Only)
Flotation Plant
Tonnes
Plant Feed Recovery Concentrate
Grade
Cu
(%)
Ag
(ppm)
Cu
(%)
Ag
(%)
Cu
(%)
Ag
(ppm)
Feb-07*
60 27,779 5.93 181 85.7 86.9 56.0 1730
Mar-07 100 860 pit stockpile 28,508 8.44 264 91.6 90.4 56.2 1734
Apr-07 100 860 pit stockpile 28,487 7.68 240 90.7 90.5 55.1 1722
May-07 100 850 pit stockpile 26,188 7.61 231 90.2 90.1 55.1 1670
Jun-07 100 850 pit stockpile 30,805 7.74 233 91.0 90.5 55.3 1654
July 07*
91.4 870 Dev 31,838 7.28 214 89.5 89.8 56.6 1668
Aug-07 100 stockpile 30,802 7.96 245 91.2 90.5 56.2 1717
Sep-07 100 850 Dev 25,934 7.97 258 91.3 91.4 54.9 1777
Oct-07 100 850 Dev & 890 Stoping 31,193 8.18 272 92.4 92.5 54.6 1821
Nov-07 100 870 Dev & 890 stoping 30,286 7.81 250 92.2 91.8 56.3 1793
Dec-07 100 870 Dev & 890 stoping 30,641 8.45 266 92.8 92.0 56.8 1772
Jan-08 100 830 Dev & 890 stoping 30,746 6.00 187 90.6 89.4 55.2 1694
Feb 08* 81.4 830 Dev & 870 Stoping 30,789 5.09 154 87.2 87.7 55.7 1687
Mar-08 100 830 Dev & 890/870
Stoping 37,998 5.50 170 88.2 88.5 54.5 1691
Apr-08 90 830 Dev & 870 Stoping 33,400 4.76 139 86.9 88.4 54.0 1601
Total 455,395 7.04 218 90.4 90.3 55.5 1721 * Low grade ore blended in with the development or stoping ore.
Figure 13.1 Underground sources of ore presented in Table 13.2
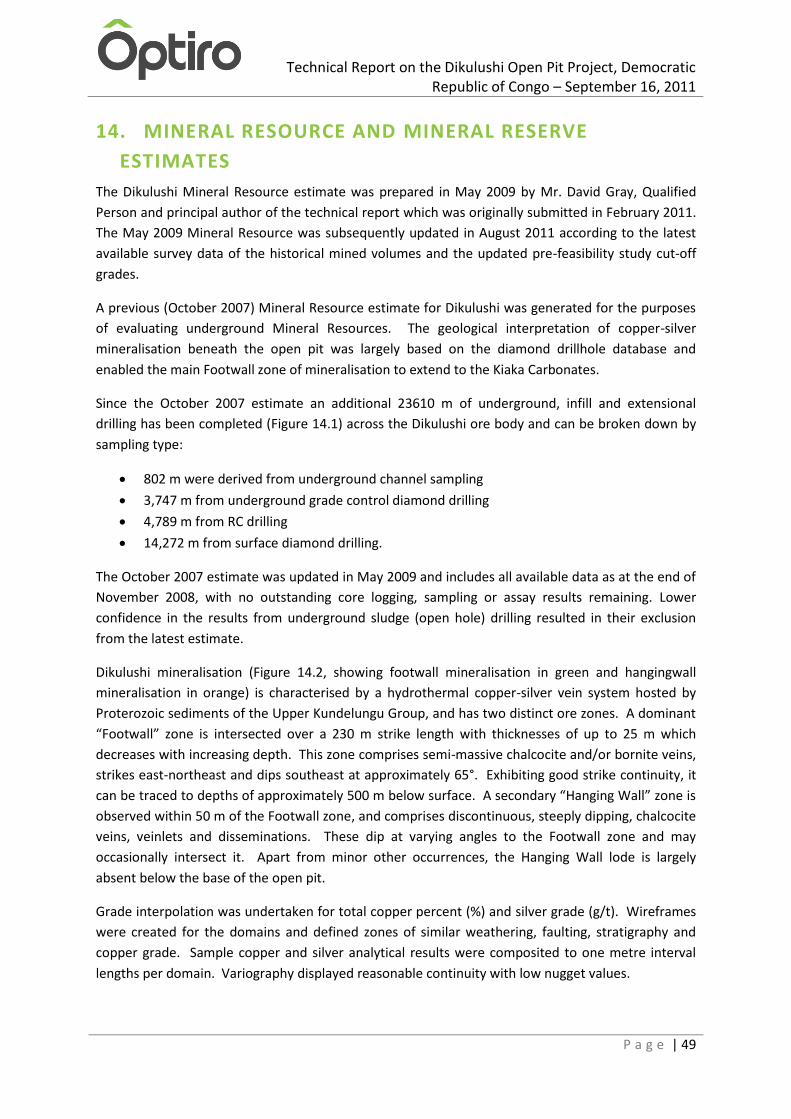
Technical Report on the Dikulushi Open Pit Project, Democratic Republic of Congo – September 16, 2011
P a g e | 49
14. MINERAL RESOURCE AND MINERAL RESERVE
ESTIMATES
The Dikulushi Mineral Resource estimate was prepared in May 2009 by Mr. David Gray, Qualified
Person and principal author of the technical report which was originally submitted in February 2011.
The May 2009 Mineral Resource was subsequently updated in August 2011 according to the latest
available survey data of the historical mined volumes and the updated pre-feasibility study cut-off
grades.
A previous (October 2007) Mineral Resource estimate for Dikulushi was generated for the purposes
of evaluating underground Mineral Resources. The geological interpretation of copper-silver
mineralisation beneath the open pit was largely based on the diamond drillhole database and
enabled the main Footwall zone of mineralisation to extend to the Kiaka Carbonates.
Since the October 2007 estimate an additional 23610 m of underground, infill and extensional
drilling has been completed (Figure 14.1) across the Dikulushi ore body and can be broken down by
sampling type:
802 m were derived from underground channel sampling
3,747 m from underground grade control diamond drilling
4,789 m from RC drilling
14,272 m from surface diamond drilling.
The October 2007 estimate was updated in May 2009 and includes all available data as at the end of
November 2008, with no outstanding core logging, sampling or assay results remaining. Lower
confidence in the results from underground sludge (open hole) drilling resulted in their exclusion
from the latest estimate.
Dikulushi mineralisation (Figure 14.2, showing footwall mineralisation in green and hangingwall
mineralisation in orange) is characterised by a hydrothermal copper-silver vein system hosted by
Proterozoic sediments of the Upper Kundelungu Group, and has two distinct ore zones. A dominant
“Footwall” zone is intersected over a 230 m strike length with thicknesses of up to 25 m which
decreases with increasing depth. This zone comprises semi-massive chalcocite and/or bornite veins,
strikes east-northeast and dips southeast at approximately 65°. Exhibiting good strike continuity, it
can be traced to depths of approximately 500 m below surface. A secondary “Hanging Wall” zone is
observed within 50 m of the Footwall zone, and comprises discontinuous, steeply dipping, chalcocite
veins, veinlets and disseminations. These dip at varying angles to the Footwall zone and may
occasionally intersect it. Apart from minor other occurrences, the Hanging Wall lode is largely
absent below the base of the open pit.
Grade interpolation was undertaken for total copper percent (%) and silver grade (g/t). Wireframes
were created for the domains and defined zones of similar weathering, faulting, stratigraphy and
copper grade. Sample copper and silver analytical results were composited to one metre interval
lengths per domain. Variography displayed reasonable continuity with low nugget values.

Technical Report on the Dikulushi Open Pit Project, Democratic Republic of Congo – September 16, 2011
P a g e | 50
Figure 14.1 An oblique southward looking 3D view of drillhole type and distribution at Dikulushi
The resulting Mineral Resource statement has been depleted for open pit and underground material
as surveyed from mined volumes and since the previous October 2007 estimate, through to
November 2008. The estimate is representative of all data acquired. Mineral Resources have been
classified into Measured, Indicated and Inferred categories for the fresh sulphide mineralisation
located below the current pit surface as per Table 14.1.
Table 14.1 Dikulushi Mineral Resource statement as at August 2011 above a 1.0% copper cut-off grade
Category Volume
(m3*1,000)
Density
(t/m3)
Tonnes
(*1,000)
Copper
(%)
Silver
(g/t)
Measured 184 2.8 516 7.0 211
Indicated 90 2.8 251 5.6 114
Measured & Indicated 274 2.8 767 6.6 179
Inferred 136 2.8 380 6.8 91
14.1. GEOLOGICAL AND MINERALISATION MODELS
Lithology and lode profiles were developed using five metre spaced north-south cross sections. The
ore body was modelled as a Footwall fault zone with sporadic mineralisation intersected within 50 m

Technical Report on the Dikulushi Open Pit Project, Democratic Republic of Congo – September 16, 2011
P a g e | 51
of the overlying hangingwall. Two Hangingwall domains, as observed in the pit, were delineated and
modelled. The open pit has mined most of the weathered material and has exposed weathering to
depths of 35 m; Weathering was therefore not considered in the 2009 estimate. Wireframes
representing the boundaries relevant to the mineralisation were constructed in three dimensions
(3D) using north-south vertical cross sections. Mineralisation outlines were guided by geological
continuity between drillholes and a mineralisation threshold between 0.3% and 0.7% copper.
Both blasthole and underground channel data (Figure 14.2) supported depth extension of the
Footwall Fault zone.
Figure 14.2 A vertically oriented 3D view at Dikulushi, looking southwest, showing mineralisation lenses and current drilling
14.2. DRILL DATA FOR MINERAL RESOURCE MODELLING
Drill data was stored using Dikulushi’s on-site Access database. While some risk exists regarding the
reliability of manually handled data in an Access database, the drillhole de-surveying process
revealed only minor location errors, which were immediately corrected.

Technical Report on the Dikulushi Open Pit Project, Democratic Republic of Congo – September 16, 2011
P a g e | 52
A plan view of drillhole data by type is presented in Figure 14.3. A total of 567 holes were available
for geological modelling, comprising 22,129 m surface diamond, 4,951 m surface reverse circulation,
1,285 m channel, 4,131 m underground grade control diamond and 1,369 m sludge metres. This
translates as a net increase of 23,610 m from the previous resource estimate.
Diamond drilling was undertaken along north-south oriented lines spaced 20 - 25m apart, with holes
at 25 m intervals along each line. To maximise true width intersections, most drilling was angled at
50 to 60 degrees to the south. As the risk of undetected changes to orebody orientation increases
with depth, additional infill drilling will naturally assist in improving the confidence in deposit
geometry. In 2008, a total of 4 surface exploration drillholes were drilled to both infill and extend
FW zone mineralisation. While the deposit remains open at depth, this recent drilling has led to only
minor east-west extension.
Figure 14.3 A plan showing the distribution of drillhole types across Dikulushi; blasthole data from the pit have been excluded
Since twin-hole drilling was not completed, drilling and sampling methods were compared for
potential bias across a similar volume of the FW zone mineralisation using quantile-quantile (Q-Q)
plots. Diamond core was accepted as generally providing the most representative sample. This
comparison emphasises the difference in copper values between diamond and sludge hole samples
(Figure 14.4), with the latter decreasing as the former increases. As a direct result, sludge hole data
was not used in this estimate.

Technical Report on the Dikulushi Open Pit Project, Democratic Republic of Congo – September 16, 2011
P a g e | 53
Figure 14.4 Quantile Quantile (Q-Q) plot of Diamond (DD) drilled samples versus sludge drilled samples within a common area
14.3. DATA VALIDATION
A series of data validations were completed prior to de-surveying the drillhole data into a three
dimensional format. These included:
verification of collar coordinates with existing topography and underground development
wireframes, with virtually no problems observed
visualisation of downhole survey data to identify improperly recorded downhole survey
values, with all minor discrepancies corrected
dataset examination for sample overlaps and/or gaps in downhole survey, sampling and
geological logging data, with none observed
database interrogation for negative values representing codes such as ‘insufficient sample’,
with all such samples set to absent
examination for negative assays reflecting ‘below detection’ range; these values were all re-
set to 0.01%
testing for absent or duplicate samples, with none recorded.
14.4. DATA PREPARATION FOR MODELLING
The de-surveyed 3D assay drillhole file was coded and selected within the mineralisation and
lithological 3D wireframes. Each sample interval was coded with a mineralization zone and

Technical Report on the Dikulushi Open Pit Project, Democratic Republic of Congo – September 16, 2011
P a g e | 54
weathering profile, providing mineralised domain codes for estimation (Table 14.2). The coded
drillhole data was exported for subsequent geostatistical analysis and grade interpolation.
Table 14.2 Domain codes for Dikulushi modelling
Field name Domain Code
OREZONE Oxidised FW zone 50 Fresh FW zone 100 Shallow HW zone A 200 Shallow HW zone B 300 Internal FW zone waste 400 WEATH Soil to 5m 0.1 Oxidised to 35m 0.2 Transitional to 75m depth 0.3 Fresh rock 0.4 Air 0 MINED Not mined 0 Open pit mined 1 Mined underground 2 Open pit reserves 3
14.5. DATA COMPOSITING
To determine the most common sample length, the distribution of raw sample lengths was plotted.
Approximately 45% of the data had a sample length within a few centimetres of 1 m (Figure 14.5).
All data was composited to 1 m sample lengths, ensuring that intervals provided good resolution
across domain boundaries. The total raw sample length is identical to the composited total sample
length.
Figure 14.5 Cumulative distribution of sample lengths highlighting the dominant 1m sample length
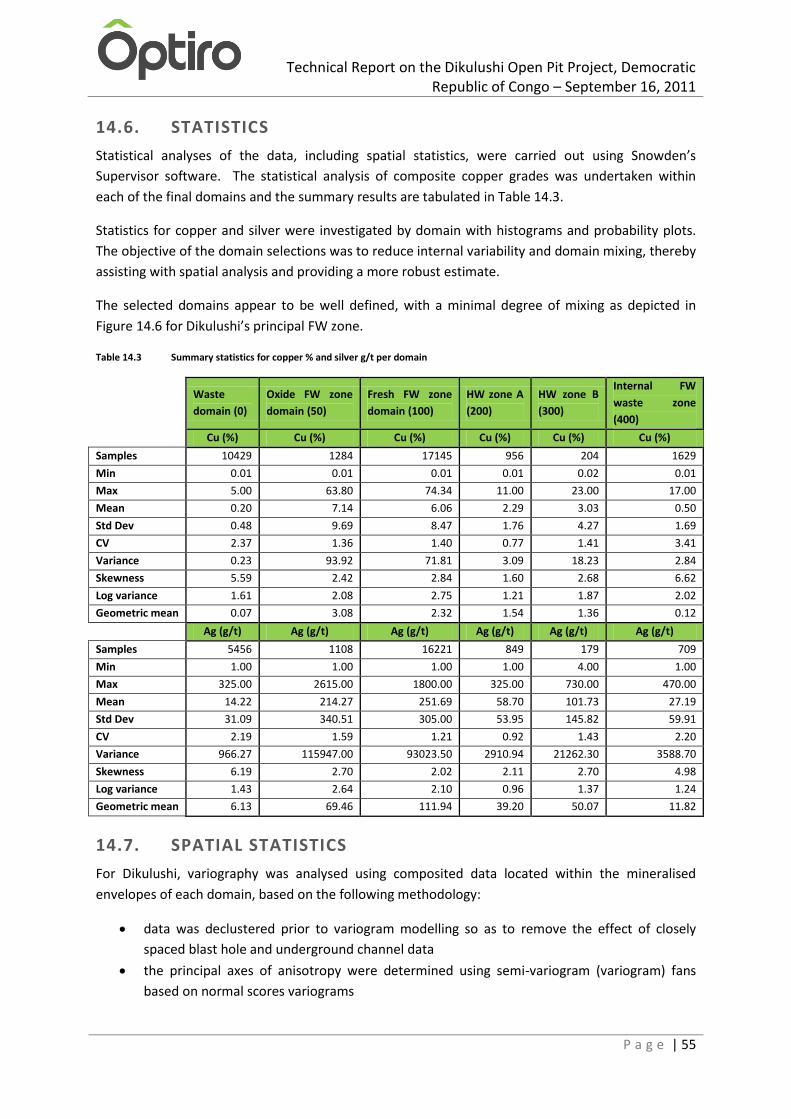
Technical Report on the Dikulushi Open Pit Project, Democratic Republic of Congo – September 16, 2011
P a g e | 55
14.6. STATISTICS
Statistical analyses of the data, including spatial statistics, were carried out using Snowden’s
Supervisor software. The statistical analysis of composite copper grades was undertaken within
each of the final domains and the summary results are tabulated in Table 14.3.
Statistics for copper and silver were investigated by domain with histograms and probability plots.
The objective of the domain selections was to reduce internal variability and domain mixing, thereby
assisting with spatial analysis and providing a more robust estimate.
The selected domains appear to be well defined, with a minimal degree of mixing as depicted in
Figure 14.6 for Dikulushi’s principal FW zone.
Table 14.3 Summary statistics for copper % and silver g/t per domain
Waste
domain (0)
Oxide FW zone
domain (50)
Fresh FW zone
domain (100)
HW zone A
(200)
HW zone B
(300)
Internal FW
waste zone
(400)
Cu (%) Cu (%) Cu (%) Cu (%) Cu (%) Cu (%)
Samples 10429 1284 17145 956 204 1629
Min 0.01 0.01 0.01 0.01 0.02 0.01
Max 5.00 63.80 74.34 11.00 23.00 17.00
Mean 0.20 7.14 6.06 2.29 3.03 0.50
Std Dev 0.48 9.69 8.47 1.76 4.27 1.69
CV 2.37 1.36 1.40 0.77 1.41 3.41
Variance 0.23 93.92 71.81 3.09 18.23 2.84
Skewness 5.59 2.42 2.84 1.60 2.68 6.62
Log variance 1.61 2.08 2.75 1.21 1.87 2.02
Geometric mean 0.07 3.08 2.32 1.54 1.36 0.12
Ag (g/t) Ag (g/t) Ag (g/t) Ag (g/t) Ag (g/t) Ag (g/t)
Samples 5456 1108 16221 849 179 709
Min 1.00 1.00 1.00 1.00 4.00 1.00
Max 325.00 2615.00 1800.00 325.00 730.00 470.00
Mean 14.22 214.27 251.69 58.70 101.73 27.19
Std Dev 31.09 340.51 305.00 53.95 145.82 59.91
CV 2.19 1.59 1.21 0.92 1.43 2.20
Variance 966.27 115947.00 93023.50 2910.94 21262.30 3588.70
Skewness 6.19 2.70 2.02 2.11 2.70 4.98
Log variance 1.43 2.64 2.10 0.96 1.37 1.24
Geometric mean 6.13 69.46 111.94 39.20 50.07 11.82
14.7. SPATIAL STATISTICS
For Dikulushi, variography was analysed using composited data located within the mineralised
envelopes of each domain, based on the following methodology:
data was declustered prior to variogram modelling so as to remove the effect of closely
spaced blast hole and underground channel data
the principal axes of anisotropy were determined using semi-variogram (variogram) fans
based on normal scores variograms

Technical Report on the Dikulushi Open Pit Project, Democratic Republic of Congo – September 16, 2011
P a g e | 56
normal scores variograms were calculated for each of the principal axes of anisotropy
downhole normal scores variograms were modelled for each domain and adjusted to
determine the normal scores nugget effect
variogram models were then determined for each of the principal axes of anisotropy using
the nugget effect from the downhole variogram
the variogram models were back-transformed to the original distribution and used to guide
search parameters and complete ordinary kriging estimation.
Figure 14.6 Log histogram and probability plot for the main FW zone of mineralisation showing the results of robust domaining
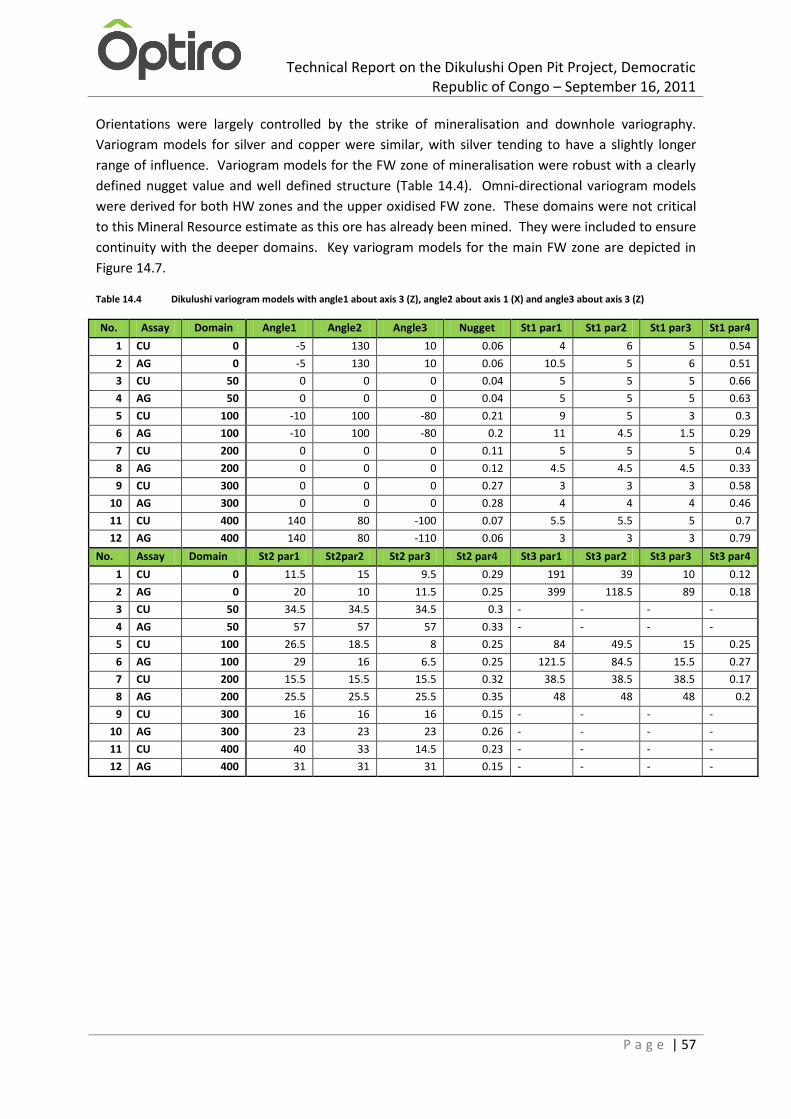
Technical Report on the Dikulushi Open Pit Project, Democratic Republic of Congo – September 16, 2011
P a g e | 57
Orientations were largely controlled by the strike of mineralisation and downhole variography.
Variogram models for silver and copper were similar, with silver tending to have a slightly longer
range of influence. Variogram models for the FW zone of mineralisation were robust with a clearly
defined nugget value and well defined structure (Table 14.4). Omni-directional variogram models
were derived for both HW zones and the upper oxidised FW zone. These domains were not critical
to this Mineral Resource estimate as this ore has already been mined. They were included to ensure
continuity with the deeper domains. Key variogram models for the main FW zone are depicted in
Figure 14.7.
Table 14.4 Dikulushi variogram models with angle1 about axis 3 (Z), angle2 about axis 1 (X) and angle3 about axis 3 (Z)
No. Assay Domain Angle1 Angle2 Angle3 Nugget St1 par1 St1 par2 St1 par3 St1 par4
1 CU 0 -5 130 10 0.06 4 6 5 0.54
2 AG 0 -5 130 10 0.06 10.5 5 6 0.51
3 CU 50 0 0 0 0.04 5 5 5 0.66
4 AG 50 0 0 0 0.04 5 5 5 0.63
5 CU 100 -10 100 -80 0.21 9 5 3 0.3
6 AG 100 -10 100 -80 0.2 11 4.5 1.5 0.29
7 CU 200 0 0 0 0.11 5 5 5 0.4
8 AG 200 0 0 0 0.12 4.5 4.5 4.5 0.33
9 CU 300 0 0 0 0.27 3 3 3 0.58
10 AG 300 0 0 0 0.28 4 4 4 0.46
11 CU 400 140 80 -100 0.07 5.5 5.5 5 0.7
12 AG 400 140 80 -110 0.06 3 3 3 0.79
No. Assay Domain St2 par1 St2par2 St2 par3 St2 par4 St3 par1 St3 par2 St3 par3 St3 par4
1 CU 0 11.5 15 9.5 0.29 191 39 10 0.12
2 AG 0 20 10 11.5 0.25 399 118.5 89 0.18
3 CU 50 34.5 34.5 34.5 0.3 - - - -
4 AG 50 57 57 57 0.33 - - - -
5 CU 100 26.5 18.5 8 0.25 84 49.5 15 0.25
6 AG 100 29 16 6.5 0.25 121.5 84.5 15.5 0.27
7 CU 200 15.5 15.5 15.5 0.32 38.5 38.5 38.5 0.17
8 AG 200 25.5 25.5 25.5 0.35 48 48 48 0.2
9 CU 300 16 16 16 0.15 - - - -
10 AG 300 23 23 23 0.26 - - - -
11 CU 400 40 33 14.5 0.23 - - - -
12 AG 400 31 31 31 0.15 - - - -
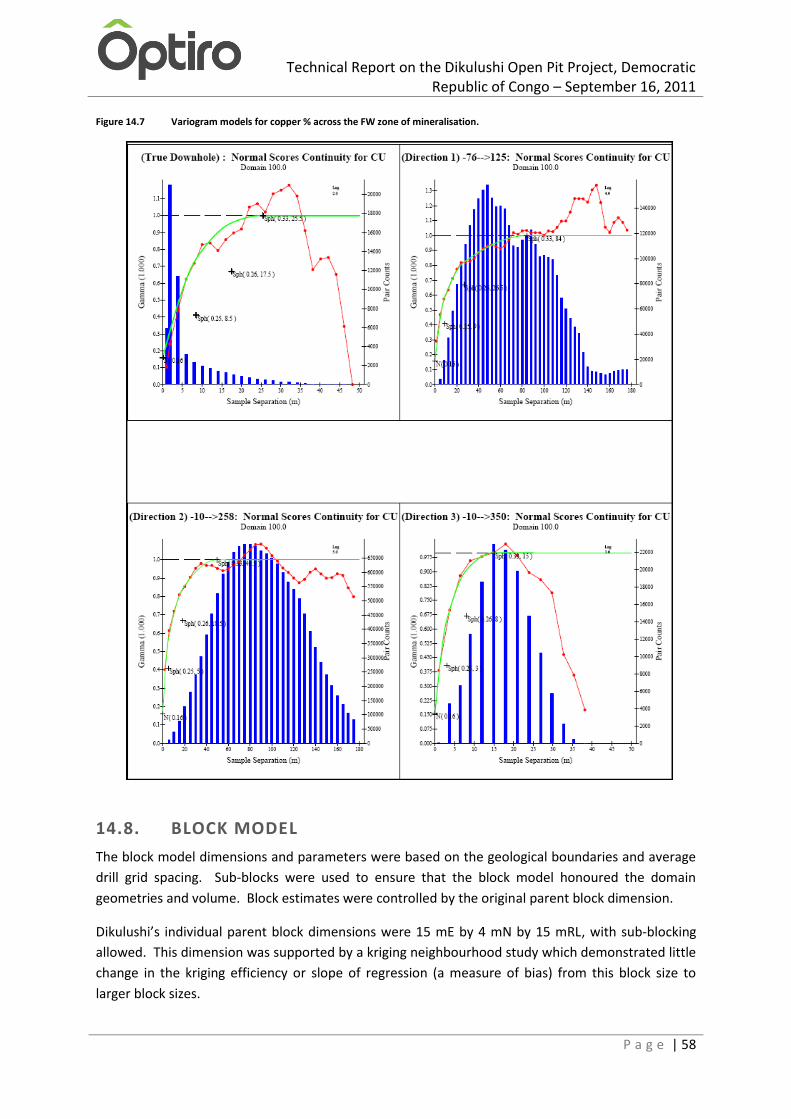
Technical Report on the Dikulushi Open Pit Project, Democratic Republic of Congo – September 16, 2011
P a g e | 58
Figure 14.7 Variogram models for copper % across the FW zone of mineralisation.
14.8. BLOCK MODEL
The block model dimensions and parameters were based on the geological boundaries and average
drill grid spacing. Sub-blocks were used to ensure that the block model honoured the domain
geometries and volume. Block estimates were controlled by the original parent block dimension.
Dikulushi’s individual parent block dimensions were 15 mE by 4 mN by 15 mRL, with sub-blocking
allowed. This dimension was supported by a kriging neighbourhood study which demonstrated little
change in the kriging efficiency or slope of regression (a measure of bias) from this block size to
larger block sizes.

Technical Report on the Dikulushi Open Pit Project, Democratic Republic of Congo – September 16, 2011
P a g e | 59
14.9. DENSITY ESTIMATES IN THE BLOCK MODEL
Density estimates were based on approximately 61 samples from the Footwall mineralisation and
1,236 samples from the surrounding waste material. These values have been tested and confirmed
via two mill feed samples. The assigned density of the Footwall ore zone was 2.8 t/m3 and the
surrounding waste material 2.6 t/m3.
14.10. DETERMINATION OF TOP CUTS
Top cuts were used to describe the maximum reasonable metal grade for a composite sample value
within a given domain. If the grade of a sample exceeded this value, the grade was reset to the top
cut value. The objective of applying top cuts is to minimise the risk of uniquely high metal
concentrations biasing individual block estimates, especially those located within areas of low
sample support.
Top cuts for Dikulushi were established by investigating univariate statistics and histograms of
sample values by domain. A top cut was selected if it reduced the sample variance and did not
materially change the mean value. The following top cuts were applied to the data for resource
estimation (Table 14.5).
Table 14.5 Dikulushi - top cuts per domain
Domain Copper% Silver g/t
0 5 325
50 56 2000
100 - 1800
200 11 325 300 23 730 400 17 470
14.11. GRADE ESTIMATION
Grades for copper and silver were estimated into parent blocks of an empty domain coded block
model using ordinary kriging (OK). OK was deemed an appropriate interpolation technique owing to
near normal data distributions and differentiable grade ranges particular to the lode style
mineralisation. Estimation into parent blocks used a discretisation of 8 (X points) by 3 (Y points) by 8
(Z points) to better represent estimated block volumes.
14.12. ORDINARY KRIGING INTERPOLATION
Estimation parameters for kriging were based on variography, geological continuity and the average
spatial distribution of data. The first pass search radius was set within half to two thirds of the
variogram range to improve the quality of the local block grade estimate for areas of close spaced
drilling and to ensure that grade was not smeared laterally. Most blocks (75%) were estimated
within the first search radius. Subsequent search radii were set to ensure that remaining blocks
within the mineralised domain were interpolated with a copper grade.
For the ore domains, a minimum of 8 samples were required for a single block estimate and a
maximum of 40 samples in order to limit grade smoothing. Due to the long drillhole intercepts
within the orebody estimates were limited to a maximum of 10 samples per drillhole.
Technical Report on the Dikulushi Open Pit Project, Democratic Republic of Congo – September 16, 2011
P a g e | 60
Soft boundaries were created between the oxidised and fresh weathering domains in order to
represent the variable nature of this boundary and the transition in values. All other domain
boundaries were hard and data between domains was not included for estimation.
14.13. MODEL VALIDATION
The first pass of model validation included:
visual comparisons (Figure 14.8) of drillholes and estimated block grades
checks for negative estimates; if there were any, they were reset to a minimum 0.01 % grade
checks to ensure that only blocks significantly distal to the drillholes remained without grade
estimates.
The model was further validated by statistical comparison of mean composite grades and model
grades, in addition to visual comparisons with drillholes. A table comparing the mean values for the
estimate with those of the data (Table 14.6) illustrates acceptable correlation.
Table 14.6 Mean statistics per domain comparing model estimates with data values
Domain Field Data Model % Variance
100 Ag g/t 219.01 201.22 8.12
100 Cu% 7.48 7.44 0.44
50 Ag g/t 172.11 169.34 1.61
50 Cu% 6.07 6.18 -1.81
400 Ag g/t 17.87 15.82 11.46
400 Cu% 0.42 0.42 0.19
Spatial statistical plots by domain are used to compare the mean model and drill grades data by
relative elevation slices (Figure 14.9). Model estimates respond well to changes in the composite
grade data, but local estimates are likely to be improved with additional drillhole intersections.
Based upon the summary statistics, visual validations and graphical plots, the OK estimates are
consistent with the drillhole composites, and are believed to constitute a reasonable representation
of the FW mineralisation.
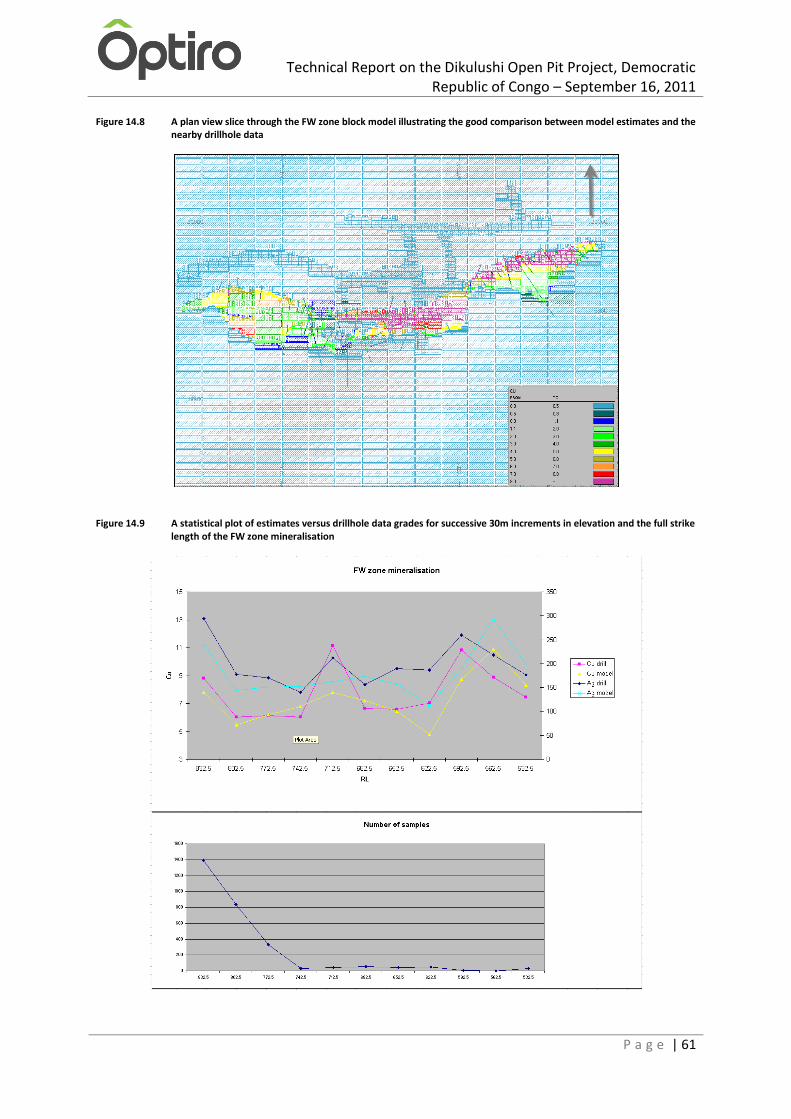
Technical Report on the Dikulushi Open Pit Project, Democratic Republic of Congo – September 16, 2011
P a g e | 61
Figure 14.8 A plan view slice through the FW zone block model illustrating the good comparison between model estimates and the nearby drillhole data
Figure 14.9 A statistical plot of estimates versus drillhole data grades for successive 30m increments in elevation and the full strike length of the FW zone mineralisation

Technical Report on the Dikulushi Open Pit Project, Democratic Republic of Congo – September 16, 2011
P a g e | 62
14.14. MINERAL RESOURCE CLASSIFICATION
Classification of the Mineral Resource was primarily based on confidence in assayed grade,
geological continuity, and the quality of the resulting kriged estimates.
Geological confidence is supported by extensive open pit exposures and underground geological
mapping and channel data, which in turn reinforces drillhole logging and domain volumes.
Confidence in the kriged estimate is associated with drillhole coverage, analytical data integrity,
kriging variance and efficiency and regression slope values. Specifically, kriging variances below 0.2,
kriging efficiencies above 80% and regression slope values above 0.8 were considered appropriate
for a Measured Mineral Resource category of classification. Whereas the use of mean domain
density values is appropriate, subsequent models should make use of increased density data for
more robust estimates.
Regarding drillhole spacing, a Measured Mineral Resource category was considered appropriate with
a 20 m separation between drill holes and drill line spacing between 25 m to 50 m. An Indicated
Mineral Resource category was considered appropriate where there was a drill spacing of about 50
m to 75 m along drill lines and a line spacing of approximately 50 m. An Inferred Mineral Resource
category was considered where there was a drill spacing of about 75 m to 100 m along drill lines and
where the line spacing was around 100 m.
The Measured Mineral Resources are located below the pit and where underground sampling and
drilling is closely spaced. Indicated Resources extend as a consistent rim below the Measured
Resources. Confidence in the estimates deteriorates rapidly into Inferred Resources with the
increase in grid spacing and the short ranges of influence/grade continuity.
Figure 14.10 3D view of the Dikulushi model, looking south, and showing resource classification categories
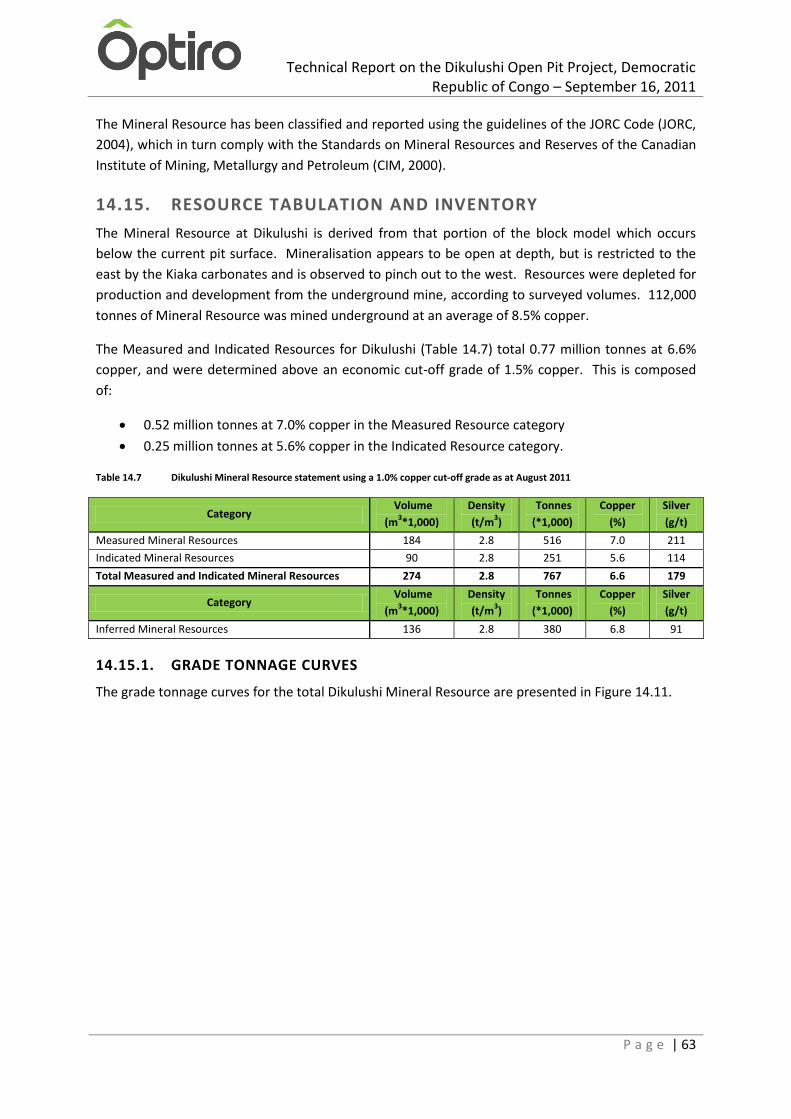
Technical Report on the Dikulushi Open Pit Project, Democratic Republic of Congo – September 16, 2011
P a g e | 63
The Mineral Resource has been classified and reported using the guidelines of the JORC Code (JORC,
2004), which in turn comply with the Standards on Mineral Resources and Reserves of the Canadian
Institute of Mining, Metallurgy and Petroleum (CIM, 2000).
14.15. RESOURCE TABULATION AND INVENTORY
The Mineral Resource at Dikulushi is derived from that portion of the block model which occurs
below the current pit surface. Mineralisation appears to be open at depth, but is restricted to the
east by the Kiaka carbonates and is observed to pinch out to the west. Resources were depleted for
production and development from the underground mine, according to surveyed volumes. 112,000
tonnes of Mineral Resource was mined underground at an average of 8.5% copper.
The Measured and Indicated Resources for Dikulushi (Table 14.7) total 0.77 million tonnes at 6.6%
copper, and were determined above an economic cut-off grade of 1.5% copper. This is composed
of:
0.52 million tonnes at 7.0% copper in the Measured Resource category
0.25 million tonnes at 5.6% copper in the Indicated Resource category.
Table 14.7 Dikulushi Mineral Resource statement using a 1.0% copper cut-off grade as at August 2011
Category Volume
(m3*1,000)
Density
(t/m3)
Tonnes
(*1,000)
Copper
(%)
Silver
(g/t)
Measured Mineral Resources 184 2.8 516 7.0 211
Indicated Mineral Resources 90 2.8 251 5.6 114
Total Measured and Indicated Mineral Resources 274 2.8 767 6.6 179
Category Volume
(m3*1,000)
Density
(t/m3)
Tonnes
(*1,000)
Copper
(%)
Silver
(g/t)
Inferred Mineral Resources 136 2.8 380 6.8 91
14.15.1. GRADE TONNAGE CURVES
The grade tonnage curves for the total Dikulushi Mineral Resource are presented in Figure 14.11.
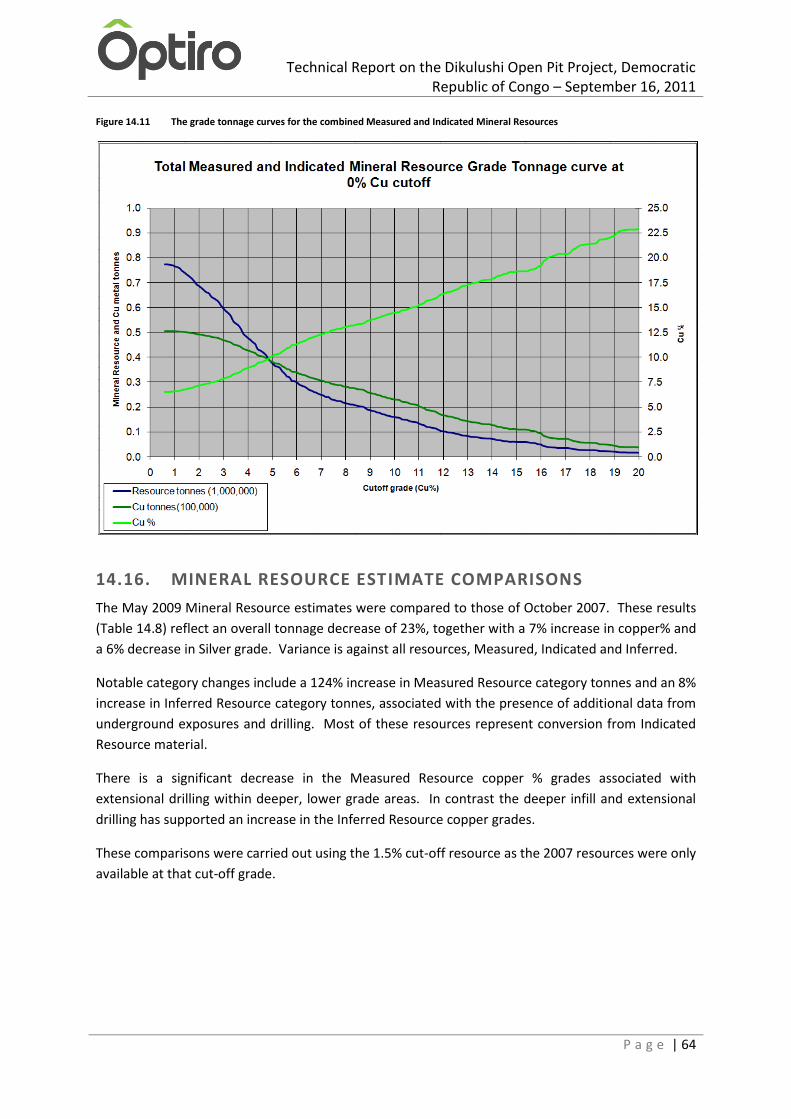
Technical Report on the Dikulushi Open Pit Project, Democratic Republic of Congo – September 16, 2011
P a g e | 64
Figure 14.11 The grade tonnage curves for the combined Measured and Indicated Mineral Resources
14.16. MINERAL RESOURCE ESTIMATE COMPARISONS
The May 2009 Mineral Resource estimates were compared to those of October 2007. These results
(Table 14.8) reflect an overall tonnage decrease of 23%, together with a 7% increase in copper% and
a 6% decrease in Silver grade. Variance is against all resources, Measured, Indicated and Inferred.
Notable category changes include a 124% increase in Measured Resource category tonnes and an 8%
increase in Inferred Resource category tonnes, associated with the presence of additional data from
underground exposures and drilling. Most of these resources represent conversion from Indicated
Resource material.
There is a significant decrease in the Measured Resource copper % grades associated with
extensional drilling within deeper, lower grade areas. In contrast the deeper infill and extensional
drilling has supported an increase in the Inferred Resource copper grades.
These comparisons were carried out using the 1.5% cut-off resource as the 2007 resources were only
available at that cut-off grade.

Technical Report on the Dikulushi Open Pit Project, Democratic Republic of Congo – September 16, 2011
P a g e | 65
Table 14.8 Comparison of 2009 and 2007 Dikulushi Mineral Resource estimates
Dikulushi Mineral Resource statement as at August 2011, using a 1.5% copper cut-off
grade *
Category Volume
(m3*1,000)
Density
(t/m3)
Tonnes
(*1,000)
Copper
(%)
Silver
(g/t)
Measured 176 2.80 493 7.32 219
Indicated 86 2.80 241 5.79 118
Measured & Indicated 262 2.80 733 6.82 186
Inferred 129 2.80 361 7.11 94
Total MII 391 2.80 1095 6.91 155
Dikulushi Mineral Resource statement as at October 2007, using a 1.5% copper cut-off
grade
Category Volume
(m3*1,000)
Density
(t/m3)
Tonnes
(*1,000)
Copper
(%)
Silver
(g/t)
Measured 78 2.83 220 9.63 289
Indicated 307 2.83 869 6.50 155
Measured & Indicated 385 2.83 1,089 7.13 182
Inferred 119 2.83 336 4.30 112
Total MII 504 2.83 1425 6.46 166
Comparison by percentage variation between the August 2011 and October 2007 results.
Category Volume
(m3*1,000)
Density
(t/m3)
Tonnes
(*1,000)
Copper
(%)
Silver
(g/t)
Measured 126% -1% 124% -24% -24%
Indicated -72% -1% -72% -11% -24%
Measured & Indicated -32% -1% -33% -4% 2%
Inferred 9% -1% 8% 65% -16%
Total MII -22% -1% -23% 7% -6%
The 2011 Mineral Resource estimates have been guided by additional drillholes, underground
sampling, density, geological and in-pit blasthole data available as of November 2008. The
additional data has enabled an increase of 21,186 copper tonnes from previous Indicated and
Inferred Mineral Resources to be upgraded to a Measured category.
Figure 14.12 illustrates the relative and cumulative change in copper tonnes between the 2007 to
2011 estimates. The 2011 Mineral Resource estimate has dropped by 14%, a total of 13,000 tonnes
of copper. Some of this is associated with mining depletion and significant changes to the volumes of
mineralisation. Grade reductions for the Measured and Indicated categories are offset by increases
in the Inferred category.
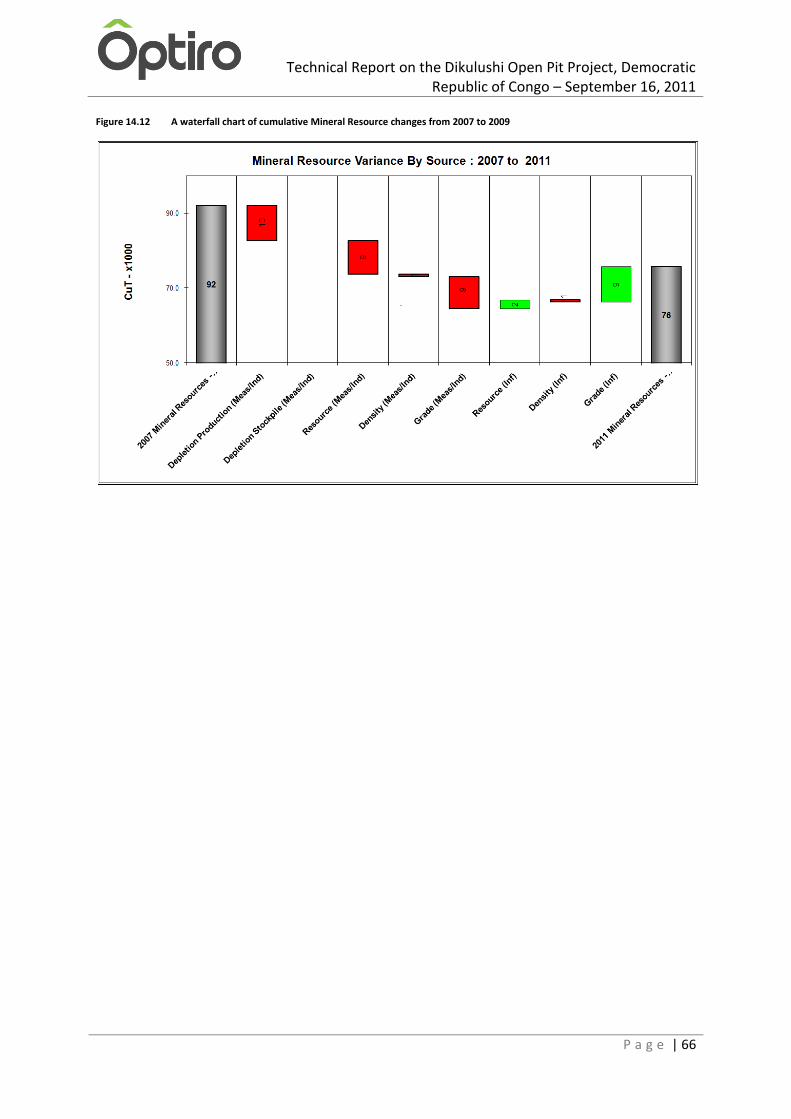
Technical Report on the Dikulushi Open Pit Project, Democratic Republic of Congo – September 16, 2011
P a g e | 66
Figure 14.12 A waterfall chart of cumulative Mineral Resource changes from 2007 to 2009
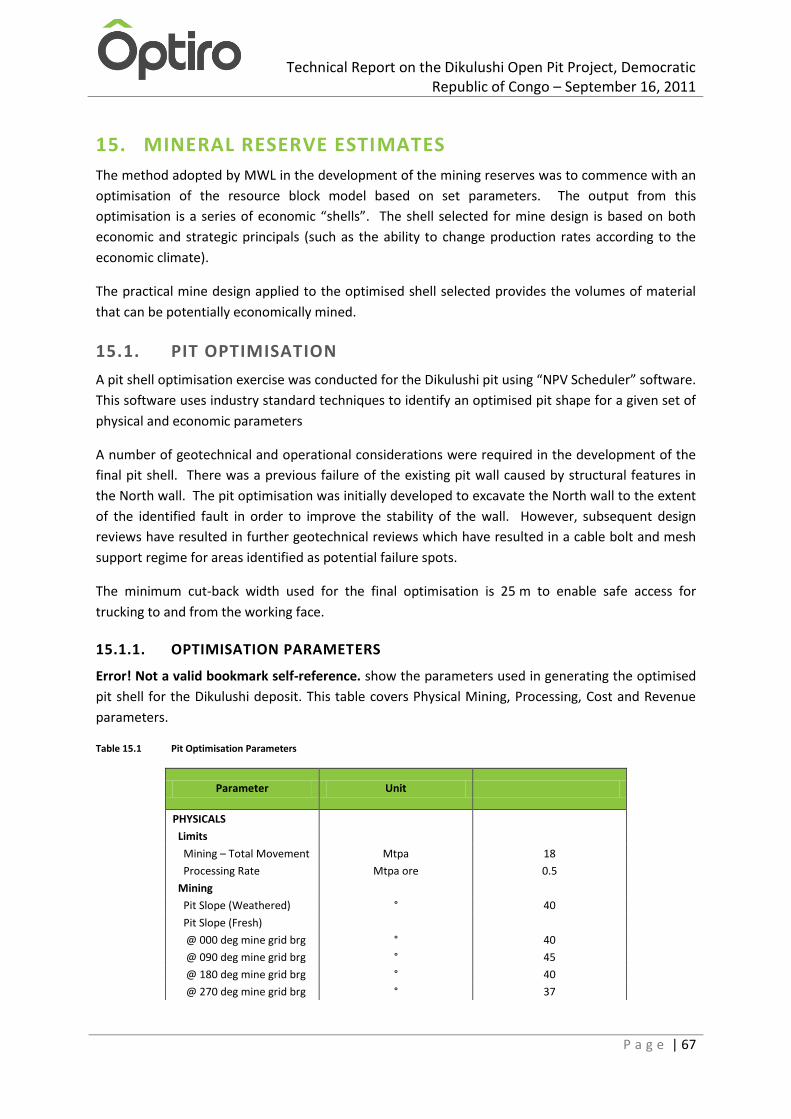
Technical Report on the Dikulushi Open Pit Project, Democratic Republic of Congo – September 16, 2011
P a g e | 67
15. MINERAL RESERVE ESTIMATES
The method adopted by MWL in the development of the mining reserves was to commence with an
optimisation of the resource block model based on set parameters. The output from this
optimisation is a series of economic “shells”. The shell selected for mine design is based on both
economic and strategic principals (such as the ability to change production rates according to the
economic climate).
The practical mine design applied to the optimised shell selected provides the volumes of material
that can be potentially economically mined.
15.1. PIT OPTIMISATION
A pit shell optimisation exercise was conducted for the Dikulushi pit using “NPV Scheduler” software.
This software uses industry standard techniques to identify an optimised pit shape for a given set of
physical and economic parameters
A number of geotechnical and operational considerations were required in the development of the
final pit shell. There was a previous failure of the existing pit wall caused by structural features in
the North wall. The pit optimisation was initially developed to excavate the North wall to the extent
of the identified fault in order to improve the stability of the wall. However, subsequent design
reviews have resulted in further geotechnical reviews which have resulted in a cable bolt and mesh
support regime for areas identified as potential failure spots.
The minimum cut-back width used for the final optimisation is 25 m to enable safe access for
trucking to and from the working face.
15.1.1. OPTIMISATION PARAMETERS
Error! Not a valid bookmark self-reference. show the parameters used in generating the optimised
pit shell for the Dikulushi deposit. This table covers Physical Mining, Processing, Cost and Revenue
parameters.
Table 15.1 Pit Optimisation Parameters
Parameter Unit
PHYSICALS
Limits
Mining – Total Movement Mtpa 18
Processing Rate Mtpa ore 0.5
Mining
Pit Slope (Weathered) ° 40
Pit Slope (Fresh)
@ 000 deg mine grid brg ° 40
@ 090 deg mine grid brg ° 45
@ 180 deg mine grid brg ° 40
@ 270 deg mine grid brg ° 37

Technical Report on the Dikulushi Open Pit Project, Democratic Republic of Congo – September 16, 2011
P a g e | 68
Parameter Unit
Mining Recovery % 95%
Mining Dilution % 15%
Processing
copper Recovery
Weathered % 70%
Transitional % 90%
Fresh % 90%
Silver Recovery
Weathered % 70%
Transitional % 90%
Fresh % 90%
CAPEX
Capital
Infrastructure & dewatering Equipment
USD M 1.6
Plant & Equipment USD M 5.10
Sustaining Capital USD M 2.0
OPEX
Mining
variable
Waste / ore USD / BCM mined avg 9.62
MCAF USD / BCM / 10m Bench avg 0.41
Processing
Variable
Ore Processing USD / t ore 37.29
Rehabilitation
Variable USD / BCM waste 0.03
Selling
Variable
copper Sales USD / t Cu 1,720
Silver Sales USD / t Ag -
Administration USD M / y 7.2
REVENUE
copper
Base Price USD / lb 3.50
USD / t 7,716
NSR % 96.75%
Royalties % -
Realised Price USD / lb 3.39
Siver
Base Price USD / oz 30.00
USD / g 0.96
NSR % 91%
Royalties % -
Realised Price USD / oz 27.30
FINANCIAL
Discount Rate % 10%
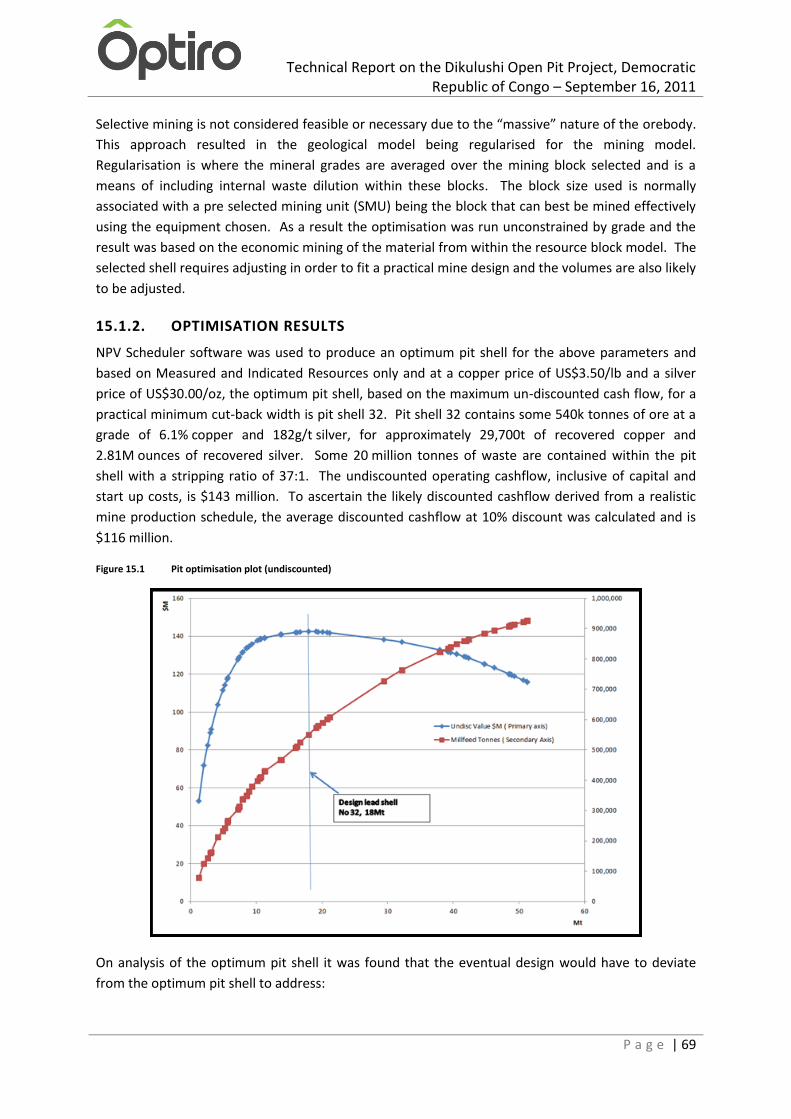
Technical Report on the Dikulushi Open Pit Project, Democratic Republic of Congo – September 16, 2011
P a g e | 69
Selective mining is not considered feasible or necessary due to the “massive” nature of the orebody.
This approach resulted in the geological model being regularised for the mining model.
Regularisation is where the mineral grades are averaged over the mining block selected and is a
means of including internal waste dilution within these blocks. The block size used is normally
associated with a pre selected mining unit (SMU) being the block that can best be mined effectively
using the equipment chosen. As a result the optimisation was run unconstrained by grade and the
result was based on the economic mining of the material from within the resource block model. The
selected shell requires adjusting in order to fit a practical mine design and the volumes are also likely
to be adjusted.
15.1.2. OPTIMISATION RESULTS
NPV Scheduler software was used to produce an optimum pit shell for the above parameters and
based on Measured and Indicated Resources only and at a copper price of US$3.50/lb and a silver
price of US$30.00/oz, the optimum pit shell, based on the maximum un-discounted cash flow, for a
practical minimum cut-back width is pit shell 32. Pit shell 32 contains some 540k tonnes of ore at a
grade of 6.1% copper and 182g/t silver, for approximately 29,700t of recovered copper and
2.81M ounces of recovered silver. Some 20 million tonnes of waste are contained within the pit
shell with a stripping ratio of 37:1. The undiscounted operating cashflow, inclusive of capital and
start up costs, is $143 million. To ascertain the likely discounted cashflow derived from a realistic
mine production schedule, the average discounted cashflow at 10% discount was calculated and is
$116 million.
Figure 15.1 Pit optimisation plot (undiscounted)
On analysis of the optimum pit shell it was found that the eventual design would have to deviate
from the optimum pit shell to address:
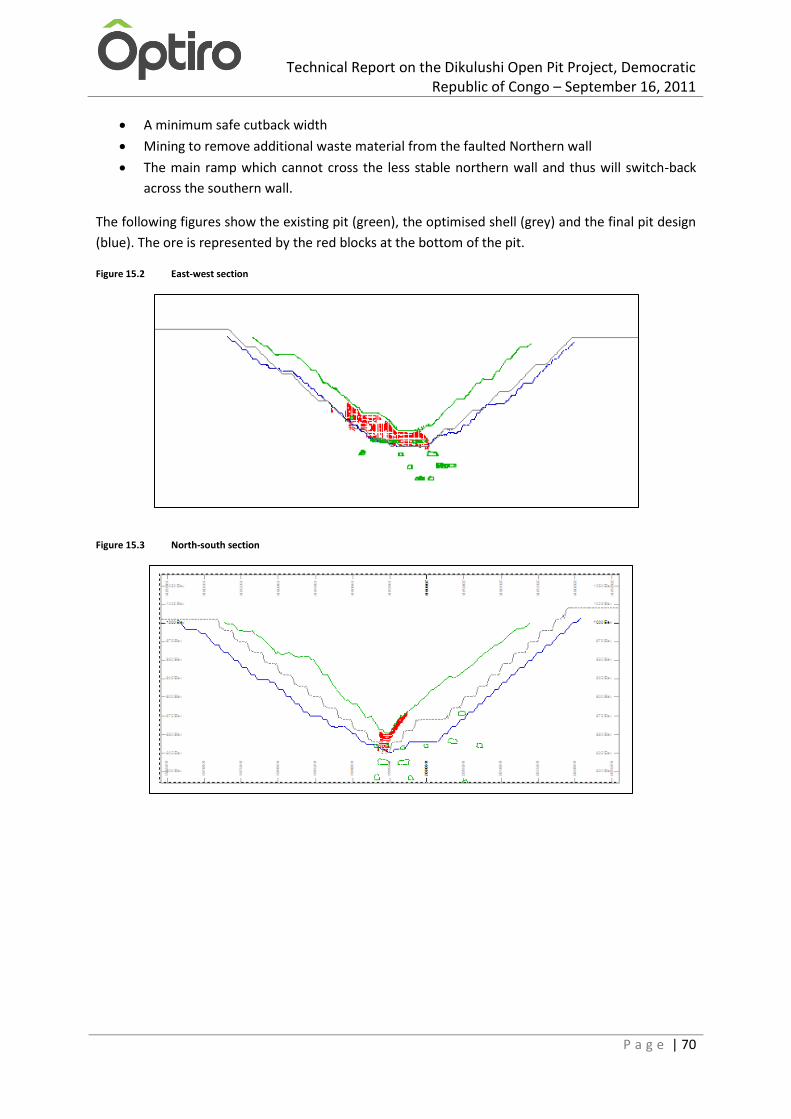
Technical Report on the Dikulushi Open Pit Project, Democratic Republic of Congo – September 16, 2011
P a g e | 70
A minimum safe cutback width
Mining to remove additional waste material from the faulted Northern wall
The main ramp which cannot cross the less stable northern wall and thus will switch-back
across the southern wall.
The following figures show the existing pit (green), the optimised shell (grey) and the final pit design
(blue). The ore is represented by the red blocks at the bottom of the pit.
Figure 15.2 East-west section
Figure 15.3 North-south section
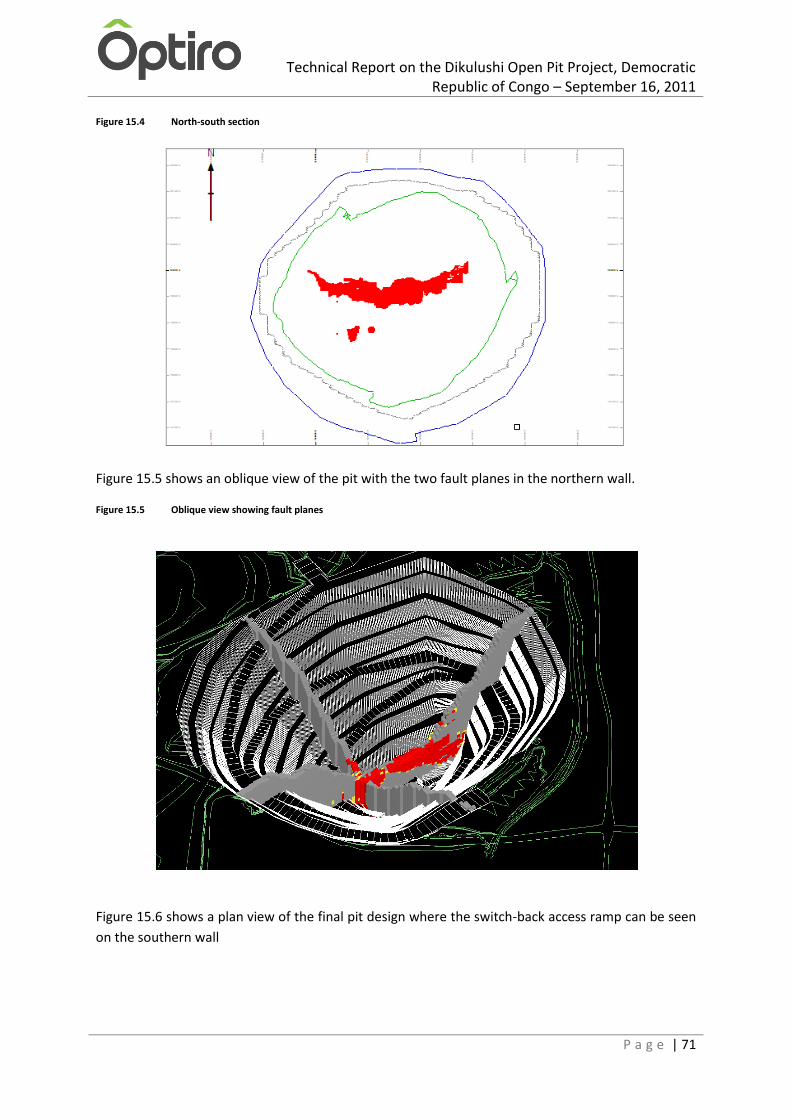
Technical Report on the Dikulushi Open Pit Project, Democratic Republic of Congo – September 16, 2011
P a g e | 71
Figure 15.4 North-south section
Figure 15.5 shows an oblique view of the pit with the two fault planes in the northern wall.
Figure 15.5 Oblique view showing fault planes
Figure 15.6 shows a plan view of the final pit design where the switch-back access ramp can be seen
on the southern wall

Technical Report on the Dikulushi Open Pit Project, Democratic Republic of Congo – September 16, 2011
P a g e | 72
Figure 15.6 Final pit design
15.2. PIT OPTIMISATION SENSITIVITY ANALYSIS
A sensitivity analysis is carried out on the selected pit shell to determine how selected major
elements will affect the economic viability of the operation. The sensitivity analysis for this
estimation can be seen below (Figure 15.7).
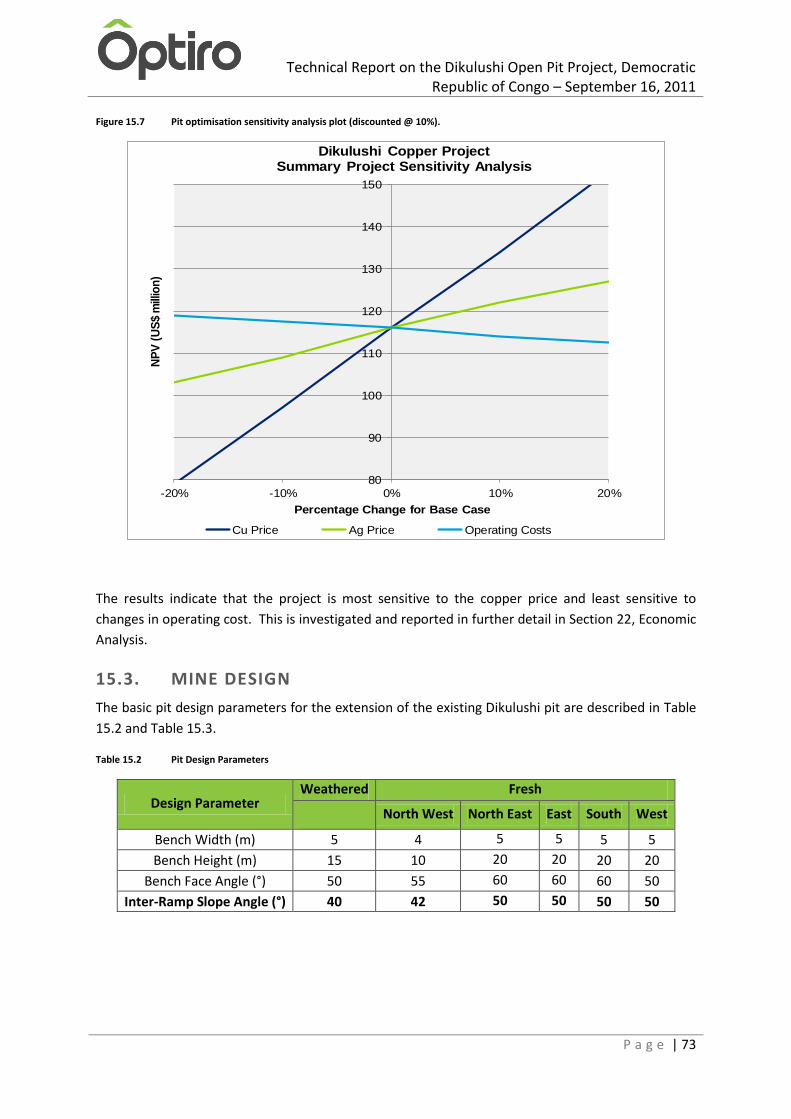
Technical Report on the Dikulushi Open Pit Project, Democratic Republic of Congo – September 16, 2011
P a g e | 73
Figure 15.7 Pit optimisation sensitivity analysis plot (discounted @ 10%).
The results indicate that the project is most sensitive to the copper price and least sensitive to
changes in operating cost. This is investigated and reported in further detail in Section 22, Economic
Analysis.
15.3. MINE DESIGN
The basic pit design parameters for the extension of the existing Dikulushi pit are described in Table
15.2 and Table 15.3.
Table 15.2 Pit Design Parameters
Design Parameter Weathered Fresh
North West North East East South West
Bench Width (m) 5 4 5 5 5 5
Bench Height (m) 15 10 20 20 20 20
Bench Face Angle (°) 50 55 60 60 60 50
Inter-Ramp Slope Angle (°) 40 42 50 50 50 50
80
90
100
110
120
130
140
150
-20% -10% 0% 10% 20%
NP
V (
US
$ m
illio
n)
Percentage Change for Base Case
Dikulushi Copper ProjectSummary Project Sensitivity Analysis
Cu Price Ag Price Operating Costs
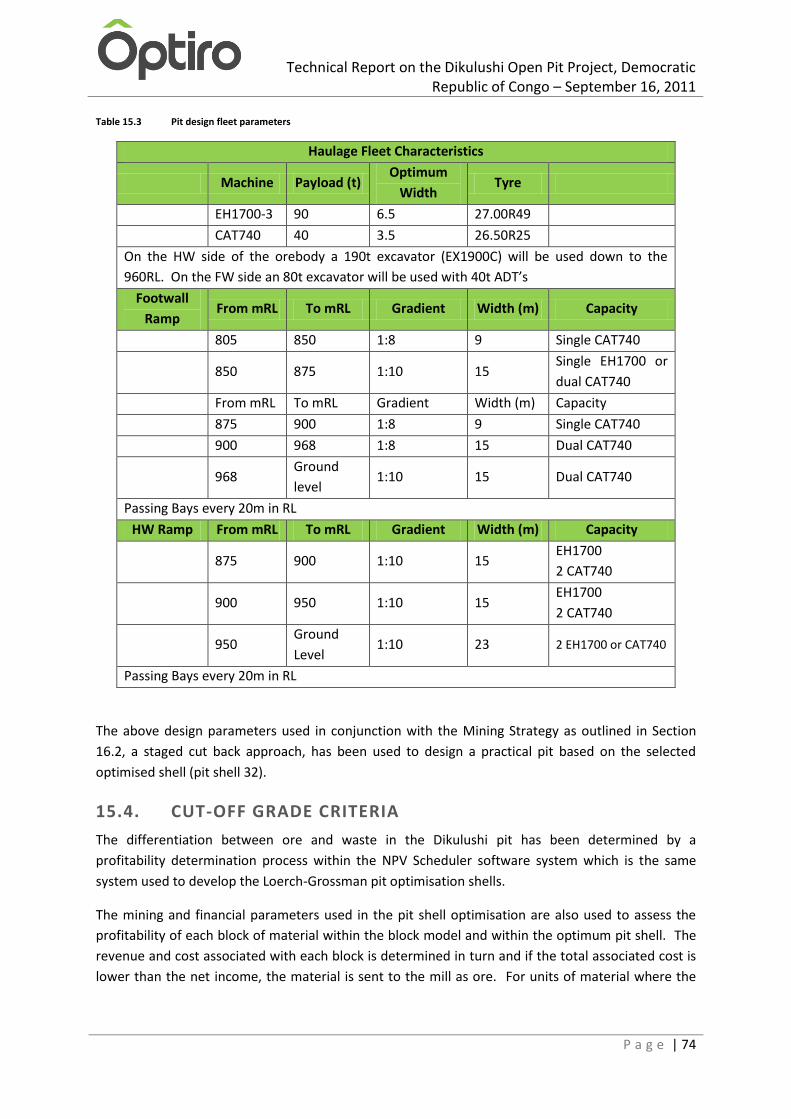
Technical Report on the Dikulushi Open Pit Project, Democratic Republic of Congo – September 16, 2011
P a g e | 74
Table 15.3 Pit design fleet parameters
Haulage Fleet Characteristics
Machine Payload (t) Optimum
Width Tyre
EH1700-3 90 6.5 27.00R49
CAT740 40 3.5 26.50R25
On the HW side of the orebody a 190t excavator (EX1900C) will be used down to the
960RL. On the FW side an 80t excavator will be used with 40t ADT’s
Footwall
Ramp From mRL To mRL Gradient Width (m) Capacity
805 850 1:8 9 Single CAT740
850 875 1:10 15 Single EH1700 or
dual CAT740
From mRL To mRL Gradient Width (m) Capacity
875 900 1:8 9 Single CAT740
900 968 1:8 15 Dual CAT740
968 Ground
level 1:10 15 Dual CAT740
Passing Bays every 20m in RL
HW Ramp From mRL To mRL Gradient Width (m) Capacity
875 900 1:10 15
EH1700
2 CAT740
900 950 1:10 15
EH1700
2 CAT740
950
Ground
Level 1:10 23 2 EH1700 or CAT740
Passing Bays every 20m in RL
The above design parameters used in conjunction with the Mining Strategy as outlined in Section
16.2, a staged cut back approach, has been used to design a practical pit based on the selected
optimised shell (pit shell 32).
15.4. CUT-OFF GRADE CRITERIA
The differentiation between ore and waste in the Dikulushi pit has been determined by a
profitability determination process within the NPV Scheduler software system which is the same
system used to develop the Loerch-Grossman pit optimisation shells.
The mining and financial parameters used in the pit shell optimisation are also used to assess the
profitability of each block of material within the block model and within the optimum pit shell. The
revenue and cost associated with each block is determined in turn and if the total associated cost is
lower than the net income, the material is sent to the mill as ore. For units of material where the

Technical Report on the Dikulushi Open Pit Project, Democratic Republic of Congo – September 16, 2011
P a g e | 75
total cost is greater than the income and the material falls within the optimum pit shell, the material
is sent to the waste dump.
This technique allows the individual costs for each block located at various depths within the pit (and
therefore varying costs) to be determined. This avoids a common cut-off grade being applied to
every block within the pit but allows each block to be evaluated on its merits.
For mining operational purposes a marginal cut-off grade will be applied based on grade control
results and the edges of economic material will be determined by this. In order to perform this
function a cut-off grade value of 1.0% has been determined based on a copper price of$3.50 / lb.; a
silver price of $30 / oz and metallurgical recovery of 90%.
15.5. MINING INVENTORIES
The resource model for the Dikulushi deposit has been developed to define the deposit from surface
to a depth of approximately 350 m below surface. The current open pit strategy targets the top-
most portion of the identified Mineral Resources. The extraction of the deeper resources will
depend on a viable underground mining approach.
15.6. MINING RECOVERY AND DILUTION
Internal mining dilution has been built in to the mining block model through regularisation with the
intent being to mine the blocks above cut-off grade criteria in their entirety. There will be some
additional dilution at the edges of this economic mineralised zone, such as between the classified
ore and the waste material. This will be at waste copper and silver grades according to the resource
model. The average additional dilution of 15% (after ore loss) at 0.5% copper and 20g/t silver has
been allowed in the financial modelling to account for this peripheral dilution and is effected after
the mining recovery of 95% has been applied. The dilution is considered conservative at this stage.
15.7. RESERVE CLASSIFICATION
The classification of ore reserves according to the JORC code follows a process as described in Figure
15.8. Reserves declared from an Indicated Mineral Resource are only allowed to be classified as
Probable Reserves. Typically reserves declared from a Measured Mineral Resource are classified as
Proved reserves. However, a provision exists where Measured Resources can be declared as
Probable Reserves if there is insufficient certainty in the modifying factors to meet the requirements
of the proved category but still sufficient certainty to meet the probable category. In the case of the
Projects reserve categorisation, all Measured and Indicated Mineral Resources below the 850m RL
are classified as probable due to the following areas of uncertainty and thus risk:
Further work is required on the final designs regarding the support of the North pit wall in
the lower section where it interacts with the major, known fault, existing underground
stopes, and underground development. Initial work has indicated that it appears feasible,
based on good mining practices being maintained, but there remains an elevated risk related
to the actual physical properties of the rock and the location of faults zones.
Technical Report on the Dikulushi Open Pit Project, Democratic Republic of Congo – September 16, 2011
P a g e | 76
It is considered that mining down to the 850m RL bench can be effectively managed, and
possibly below to the 840m RL with no major ore loss. However, should the ground
conditions be significantly different to those used then the steeper pit walls may not be
practicable and would render mining of material below this point to be at a higher risk.
Stope blasting may have adversely affected the wall rock between 870m RL and 850m RL. It
is considered that mining can effectively take place down to the 850m RL since the stope is
confined to the eastern end and access to the bulk of the ore can still be maintained.
Since the inter-ramp wall angles have been steepened over initial parameters there will be a
need for continued monitoring of the pit slope stability. This is especially so in the areas of
faulting, interaction with underground excavations, wall support and catch fences.
It is considered that practical operating constraints may prevent final extraction as planned
due to the steepening and narrowing of the pit below 850m RL, especially when considered
in conjunction with the points above.
Figure 15.8 Mineral Resource and Mineral Reserve classification
There is a small portion of Inferred Mineral Resource material within the pit design, down to 840m
RL, which is likely to be mined and treated. This is not included in the mining inventory or the
Mineral Reserves and has no effect on the economic viability of the reserve.
Table 15.4 Dikulushi mined material
Mining Loss and Dilution applied
tonnes
Waste 20,102,963
Ore (diluted and recovered) 538,978
Strip Ratio 1:37
Total Material 20,641,941

Technical Report on the Dikulushi Open Pit Project, Democratic Republic of Congo – September 16, 2011
P a g e | 77
15.8. MINERAL RESERVES TABULATION
A financial model has been developed and analysis indicates that a positive return will be made.
There are several areas where it is considered that conservative estimates in mining costs have been
made. It has also been noted that the waste dilution of the ore is considered conservative for this
type of operation, mining style and deposit.
Resulting Mineral Reserves at the Project are only based upon Measured and Indicated Mineral
Resources. The Mineral Resources located below the 850m RL that fall within the optimised pit
shells, are classified into the Probable Mineral Reserve category due to the areas of uncertainty and
higher risk relating to maintaining good mining practice coupled with geotechnical risk relating to
faults and underground void interaction. It is recommended that the risk profile is reviewed at the
850m RL.
The resulting Mineral Reserves are supported by historical production and current processing data
and are tabulated in Table 15.5 using a 1.0% copper cut-off grade. All stated Mineral Resources are
inclusive of Mineral Reserves. The Mineral Reserve, as per the CIM definition, has incorporated
mining losses and diluting materials brought about by the mining operation.
Table 15.5: Dikulushi Mineral Reserve statement as at August 2011 at a 1% copper cut-off grade.
Category Volume
(m3*1,000)
Density
(t/m3)
Tonnes
(*1,000) Copper (%)
Silver
(g/t)
Proven 65,971 2.8 184,719 7.27% 206.85
Probable 126,521 2.8 354,258 5.51% 169.46
Total Proven and Probable Reserves 192,492 2.8 538,977 6.12% 182.28
The above reserve does not include any inferred material.
It is noted that finance for the cut-back has already been made available and that the planned cut-
back is already in progress.
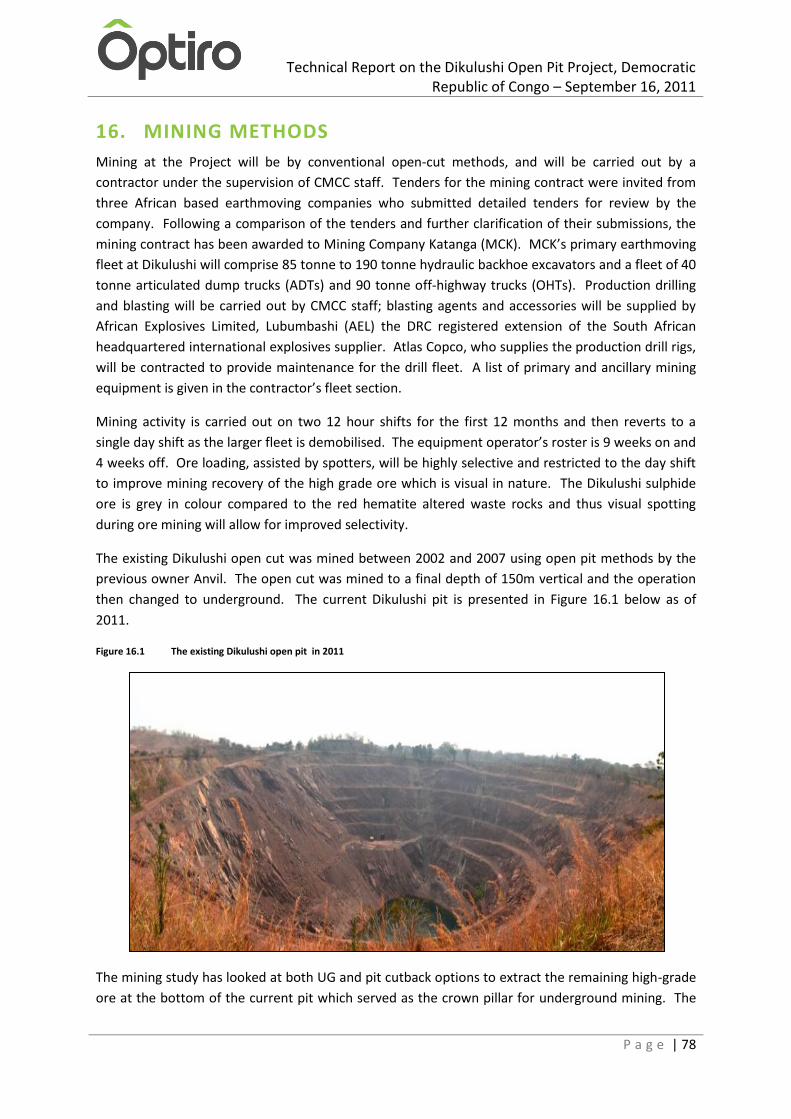
Technical Report on the Dikulushi Open Pit Project, Democratic Republic of Congo – September 16, 2011
P a g e | 78
16. MINING METHODS
Mining at the Project will be by conventional open-cut methods, and will be carried out by a
contractor under the supervision of CMCC staff. Tenders for the mining contract were invited from
three African based earthmoving companies who submitted detailed tenders for review by the
company. Following a comparison of the tenders and further clarification of their submissions, the
mining contract has been awarded to Mining Company Katanga (MCK). MCK’s primary earthmoving
fleet at Dikulushi will comprise 85 tonne to 190 tonne hydraulic backhoe excavators and a fleet of 40
tonne articulated dump trucks (ADTs) and 90 tonne off-highway trucks (OHTs). Production drilling
and blasting will be carried out by CMCC staff; blasting agents and accessories will be supplied by
African Explosives Limited, Lubumbashi (AEL) the DRC registered extension of the South African
headquartered international explosives supplier. Atlas Copco, who supplies the production drill rigs,
will be contracted to provide maintenance for the drill fleet. A list of primary and ancillary mining
equipment is given in the contractor’s fleet section.
Mining activity is carried out on two 12 hour shifts for the first 12 months and then reverts to a
single day shift as the larger fleet is demobilised. The equipment operator’s roster is 9 weeks on and
4 weeks off. Ore loading, assisted by spotters, will be highly selective and restricted to the day shift
to improve mining recovery of the high grade ore which is visual in nature. The Dikulushi sulphide
ore is grey in colour compared to the red hematite altered waste rocks and thus visual spotting
during ore mining will allow for improved selectivity.
The existing Dikulushi open cut was mined between 2002 and 2007 using open pit methods by the
previous owner Anvil. The open cut was mined to a final depth of 150m vertical and the operation
then changed to underground. The current Dikulushi pit is presented in Figure 16.1 below as of
2011.
Figure 16.1 The existing Dikulushi open pit in 2011
The mining study has looked at both UG and pit cutback options to extract the remaining high-grade
ore at the bottom of the current pit which served as the crown pillar for underground mining. The

Technical Report on the Dikulushi Open Pit Project, Democratic Republic of Congo – September 16, 2011
P a g e | 79
open cut method was chosen as it posed a lower risk, less specialised workforce, shorter lead-time
for contractor mobilisation, and higher reclamation of existing resource. The decision to go with
contract mining was made based on the capital outlay required being too high to go with an owner
operated mining fleet and the supplier lead times being too long.
Mining equipment selection was done to allow mining of the waste in a suitable time frame to make
the cutback project viable and to allow small enough equipment to operate in a tight area at the
bottom of the pit. The cutback requires two sets of equipment to allow the pit to be mined to final
planned depth.
The cutback requires a total of 20.1Mt of waste to be mined over 18 months. However in order to
mine the cutback economically, 18Mt is required to be moved in 12 months. The bulk earthmoving
requirement over a short period combined with the spatial limitations of mining a cutback meant
larger excavators and haul trucks were required. The larger equipment was sized to meet these
requirements.
The final pit design narrows significantly at depth as the ore body itself has an average width of
about 10 m. The deeper part of the pit design dictates smaller equipment is required to mine the pit
past the 850mRL level. Therefore two sets of equipment were necessary to be able to mine the
Dikulushi cutback economically. The mining contractor selection process then required the
contractor to have suitable large scale equipment available in the DRC. Most mining contractors in
the DRC only have access to smaller capacity mining equipment.
Selection of the blasting and explosives mixing and storage equipment was completed and supplied
by AEL, based on the remnant storage blasting infrastructure at Dikulushi and the proposed
explosives consumption rate. AEL supplied explosives to Dikulushi under the previous owners. AEL
is the only reliable international explosives supplier in the region.
16.1. MINING STRATEGY
The current Mawson West strategy is to process the current low grade stockpile on surface and
thereafter, open pit mining of satellite resources until the transition into processing ore from the
active mining faces of the pit. The low grade stockpile is expected to be exhausted by December
2011.
The mining strategy for the Dikulushi open-pit is to use conventional drill and blast techniques using
an excavator and truck fleet to load and haul the mined material to the ROM pad or waste dump
site. A mining contractor is to be engaged to carry out this work.
The pit is planned to be mined as a series of staged cut-backs of all the walls to enable deepening of
the pit and mining of ore in the lower regions.
Portions of the deposit have been mined from underground. Some of these existing underground
workings, both existing underground stopes and development headings, will be intersected by the
deepened open pit. In all cases the geotechnical and physical interaction of the pit operation and the
pit walls with the existing underground voids has been considered.

Technical Report on the Dikulushi Open Pit Project, Democratic Republic of Congo – September 16, 2011
P a g e | 80
Mining will be done both on a BCM rate and on an hourly hire rate. The footwall side of the cutback
has a number of underground workings which will create working areas requiring elevated safety
compliance. DOIR/MOSHAB Guidelines (2000) for open pit mining through underground workings is
the minimum Mawson West internal safety compliance standard. Rather than place the emphasis
on the local earth moving contractor to adhere to these standards. Mawson West mining staff will
strictly supervise the mining of these areas by utilising the mining fleet on an hourly hire basis.
The split between BCM and hourly hire is achieved by considering the pit in three stages. The white
lines in the Figure 16.2 represent the existing pit.
Stage 1, shown in Figure 16.2 as green horizontal lines. Stage 1 does not contain any known ore and
extends from the surface to 850mRL and will be mined on a BCM rate.
Stage 2, shown in Figure 16.2 as blue lines. Stage 2 generally lies on the footwall side of the pit and
has ore and all underground workings including footwall drives, ore drives, and access cross cuts,
decline and stopes and will be mined on an hourly rate. Stage 2 extends from 940mRL to 850mRL.
Stage 3, Stage 3 is shown in Figure 16.2 in yellow lines at the base of the pit. Stage 3 commences
from 850mRL where both Stage 1 and Stage 2 simultaneously end. Stage 3 is mined on an hourly
hire basis only.
The total quantity of material mined by hourly hire is 18% of the total volume moved.
Figure 16.2 The cutback stages
Stage’s 2 and 3 of the cutback will be mined by hourly hire of MCK equipment. The areas mined by
hourly hire were identified as not suitable for the big fleet due to either safety or grade control
considerations. These areas were identified by individually inspecting flitches at 5 m intervals
through the pit and assigned as being extracted on hourly hire using the small 85t digger.
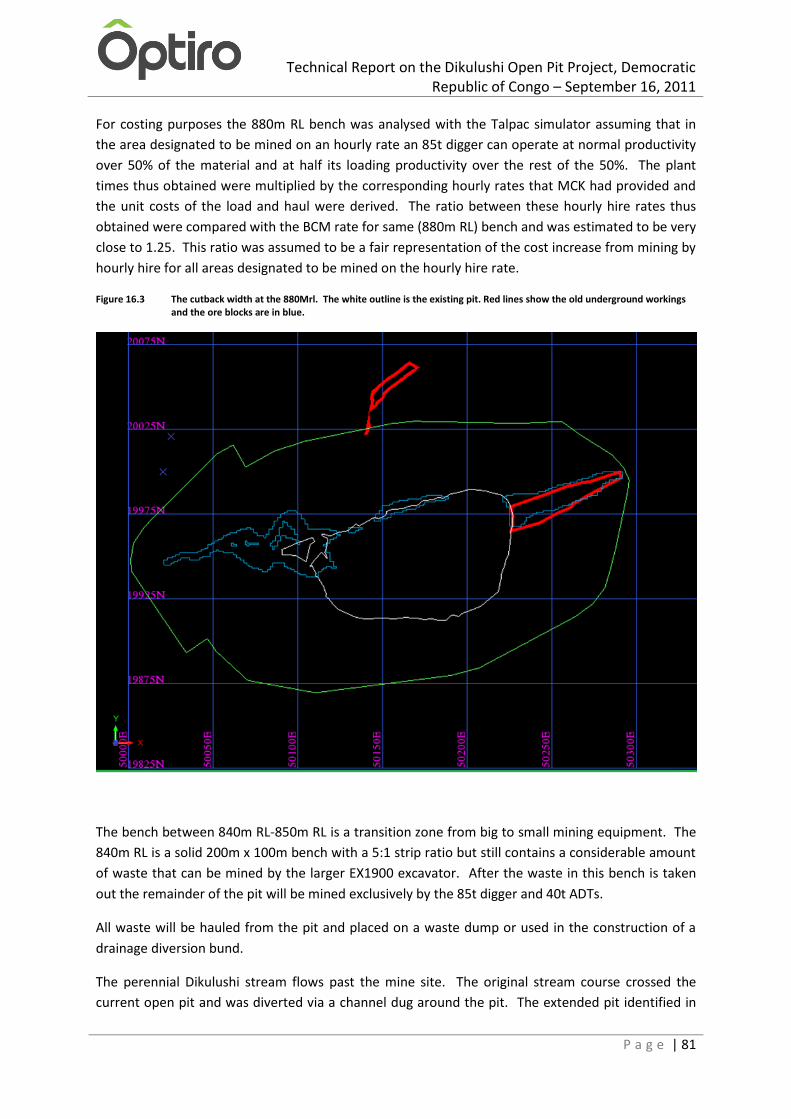
Technical Report on the Dikulushi Open Pit Project, Democratic Republic of Congo – September 16, 2011
P a g e | 81
For costing purposes the 880m RL bench was analysed with the Talpac simulator assuming that in
the area designated to be mined on an hourly rate an 85t digger can operate at normal productivity
over 50% of the material and at half its loading productivity over the rest of the 50%. The plant
times thus obtained were multiplied by the corresponding hourly rates that MCK had provided and
the unit costs of the load and haul were derived. The ratio between these hourly hire rates thus
obtained were compared with the BCM rate for same (880m RL) bench and was estimated to be very
close to 1.25. This ratio was assumed to be a fair representation of the cost increase from mining by
hourly hire for all areas designated to be mined on the hourly hire rate.
Figure 16.3 The cutback width at the 880Mrl. The white outline is the existing pit. Red lines show the old underground workings and the ore blocks are in blue.
The bench between 840m RL-850m RL is a transition zone from big to small mining equipment. The
840m RL is a solid 200m x 100m bench with a 5:1 strip ratio but still contains a considerable amount
of waste that can be mined by the larger EX1900 excavator. After the waste in this bench is taken
out the remainder of the pit will be mined exclusively by the 85t digger and 40t ADTs.
All waste will be hauled from the pit and placed on a waste dump or used in the construction of a
drainage diversion bund.
The perennial Dikulushi stream flows past the mine site. The original stream course crossed the
current open pit and was diverted via a channel dug around the pit. The extended pit identified in
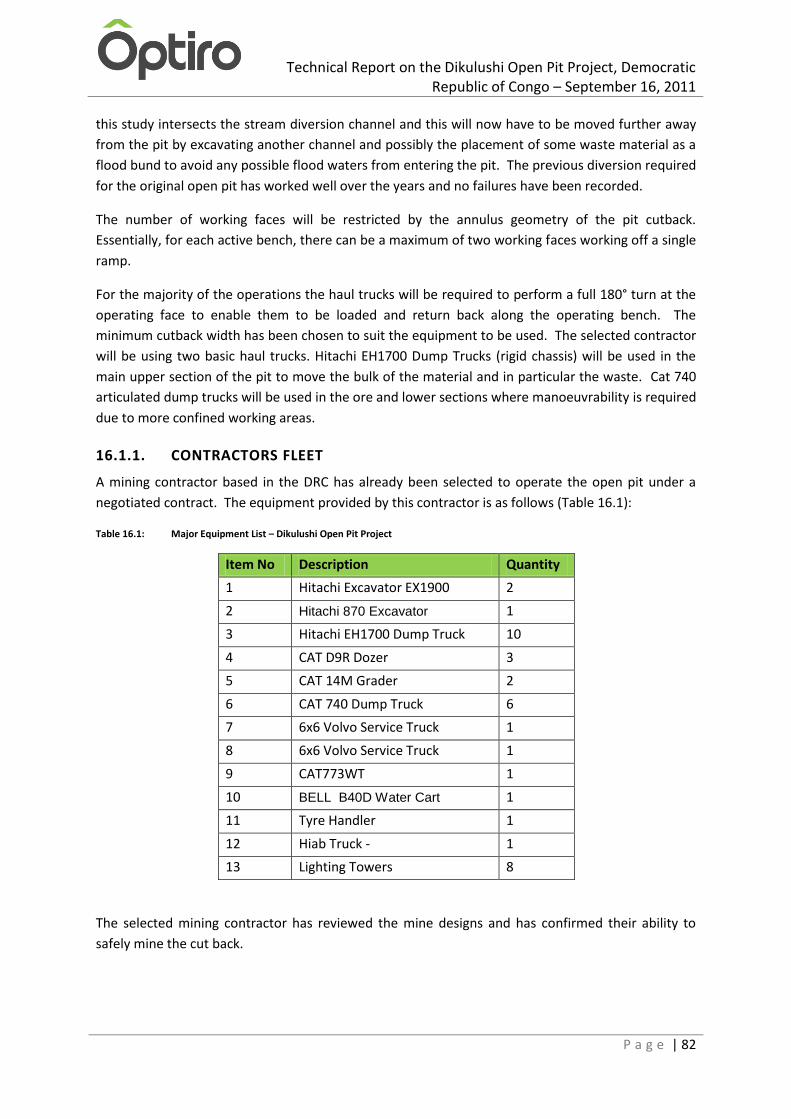
Technical Report on the Dikulushi Open Pit Project, Democratic Republic of Congo – September 16, 2011
P a g e | 82
this study intersects the stream diversion channel and this will now have to be moved further away
from the pit by excavating another channel and possibly the placement of some waste material as a
flood bund to avoid any possible flood waters from entering the pit. The previous diversion required
for the original open pit has worked well over the years and no failures have been recorded.
The number of working faces will be restricted by the annulus geometry of the pit cutback.
Essentially, for each active bench, there can be a maximum of two working faces working off a single
ramp.
For the majority of the operations the haul trucks will be required to perform a full 180° turn at the
operating face to enable them to be loaded and return back along the operating bench. The
minimum cutback width has been chosen to suit the equipment to be used. The selected contractor
will be using two basic haul trucks. Hitachi EH1700 Dump Trucks (rigid chassis) will be used in the
main upper section of the pit to move the bulk of the material and in particular the waste. Cat 740
articulated dump trucks will be used in the ore and lower sections where manoeuvrability is required
due to more confined working areas.
16.1.1. CONTRACTORS FLEET
A mining contractor based in the DRC has already been selected to operate the open pit under a
negotiated contract. The equipment provided by this contractor is as follows (Table 16.1):
Table 16.1: Major Equipment List – Dikulushi Open Pit Project
Item No Description Quantity
1 Hitachi Excavator EX1900 2
2 Hitachi 870 Excavator 1
3 Hitachi EH1700 Dump Truck 10
4 CAT D9R Dozer 3
5 CAT 14M Grader 2
6 CAT 740 Dump Truck 6
7 6x6 Volvo Service Truck 1
8 6x6 Volvo Service Truck 1
9 CAT773WT 1
10 BELL B40D Water Cart 1
11 Tyre Handler 1
12 Hiab Truck - 1
13 Lighting Towers 8
The selected mining contractor has reviewed the mine designs and has confirmed their ability to
safely mine the cut back.

Technical Report on the Dikulushi Open Pit Project, Democratic Republic of Congo – September 16, 2011
P a g e | 83
16.2. OTHER MINING FLEET
The remaining mining equipment fleet of drills, charging vehicle and ancillary equipment will be fit
for purpose and depend on the requirements of both Mawson West and the mining contractor. The
selection of these items is not critical to the reserve estimation.
16.3. GEOTECHNICAL
Geotechnical analysis and recommendations were provided by Turner Mining and Geotechnical Pty
Ltd (Turner) for slope and design guidelines in designing the Dikulushi pit. Mike Turner is a Qualified
Person and has signed off against the geotechnical portion of the pre-feasibility study.
16.3.1. DATA
The data used for this stability analysis included all previously available data plus diamond drill core
logging from a drilling programme completed in late 2010 (Figure 16.4). The drillhole programme in
2010 targeted areas where there were gaps in geotechnical data.
Data was filtered to ensure only reliable, quality measurements were used and many of the old
orientated measurements from core for the hanging wall were not used due to poor orientation
quality and potential measurement errors. The holes drilled in 2010 were logged by Mawson West
geologists under the guidance of geotechnical engineers from AMC Consultants (Perth) and was of a
higher quality than older data. Alpha and beta angles were taken of joints per core run (“joint” in
this regard includes joints, bedding, open veins, fault related fractures and other open structures).

Technical Report on the Dikulushi Open Pit Project, Democratic Republic of Congo – September 16, 2011
P a g e | 84
Figure 16.4 Location of geotechnically logged drillholes
All structural data used in the stability analyses was derived from open pit mapping and orientated core logging and only included data where the original source could be verified with surveyed coordinates. The data was analysed using the same techniques used in previous stability assessments at Dikulushi. The orientated structural data was analysed using the following software packages: Dips (Rocscience, 2010); and Swedge (Rocscience, 2010). “Dips” was used to evaluate multiple structural measurements with stereographic projections, and “Swedge” was used to evaluate wedge stability.
16.3.2. GEOTECHNICAL DOMAINS
Geotechnical domains were defined during previous studies based on rock type, rockmass strength,
pit orientation, and bedding dip and orientation. The domain boundaries were adjusted in the most
recent study (February 2011) with the additional data and modified slightly to suit changes in
bedding orientation and pit designs. The stability analyses were undertaken for each geotechnical
domains (Figure 16.5).

Technical Report on the Dikulushi Open Pit Project, Democratic Republic of Congo – September 16, 2011
P a g e | 85
Figure 16.5 Pit slope design domains
16.3.3. SLOPE GUIDELINES
The domain data was analysed using Dips (Rocscience, 2010) to determine representative dip and
direction values for the major structural sets. This was used to provide an indication of the potential
for wedge and toppling failures. No areas were determined to be susceptible to toppling failure but
a number of wedges were observed.
The Swedge software (Rocscience, 2010) was used to further evaluate the potential for wedge
instability in the domains. A joint water content of 25% was used for all joints, together with
cohesion of 100kPa and friction of 30°.
The most recent slope design guidelines are summarised in Table 16.2. These guidelines assume
good quality blasting, drained slopes and no additional joint sets or faults, or major changes to
bedding dip and dip direction. Changes to any of these conditions will require an additional analysis
of data to check the continued suitability of designs.
The pit designs (110729base3008.dtm) complied with these pit design guidelines apart from 4m
benches instead of 6m on the 830mRL in the eastern half of the pit. Catch fences should be installed
on these benches to ensure rockfalls can still be controlled.
The additional information obtained from the 2010 geotechnical drill holes has permitted the bench
height to be increased to 20m in Domains A-East, D, E and F, whereas the bench height for the A-
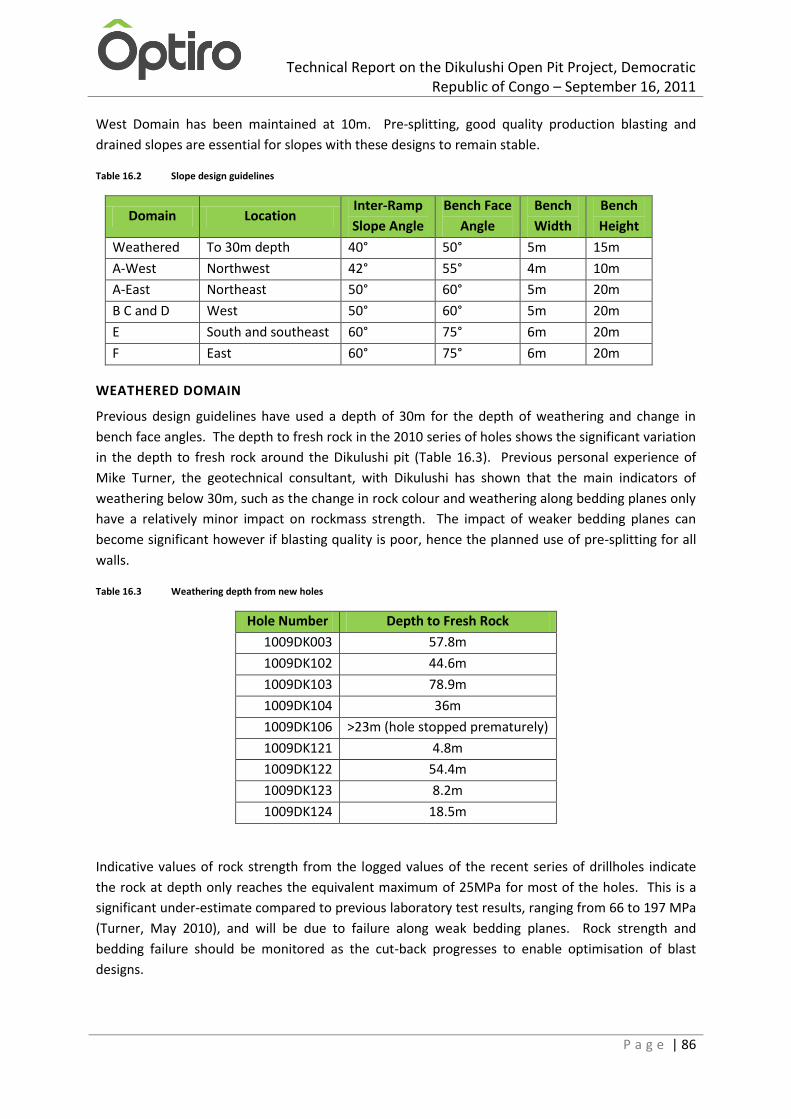
Technical Report on the Dikulushi Open Pit Project, Democratic Republic of Congo – September 16, 2011
P a g e | 86
West Domain has been maintained at 10m. Pre-splitting, good quality production blasting and
drained slopes are essential for slopes with these designs to remain stable.
Table 16.2 Slope design guidelines
Domain Location Inter-Ramp
Slope Angle
Bench Face
Angle
Bench
Width
Bench
Height
Weathered To 30m depth 40° 50° 5m 15m
A-West Northwest 42° 55° 4m 10m
A-East Northeast 50° 60° 5m 20m
B C and D West 50° 60° 5m 20m
E South and southeast 60° 75° 6m 20m
F East 60° 75° 6m 20m
WEATHERED DOMAIN
Previous design guidelines have used a depth of 30m for the depth of weathering and change in
bench face angles. The depth to fresh rock in the 2010 series of holes shows the significant variation
in the depth to fresh rock around the Dikulushi pit (Table 16.3). Previous personal experience of
Mike Turner, the geotechnical consultant, with Dikulushi has shown that the main indicators of
weathering below 30m, such as the change in rock colour and weathering along bedding planes only
have a relatively minor impact on rockmass strength. The impact of weaker bedding planes can
become significant however if blasting quality is poor, hence the planned use of pre-splitting for all
walls.
Table 16.3 Weathering depth from new holes
Hole Number Depth to Fresh Rock
1009DK003 57.8m
1009DK102 44.6m
1009DK103 78.9m
1009DK104 36m
1009DK106 >23m (hole stopped prematurely)
1009DK121 4.8m
1009DK122 54.4m
1009DK123 8.2m
1009DK124 18.5m
Indicative values of rock strength from the logged values of the recent series of drillholes indicate
the rock at depth only reaches the equivalent maximum of 25MPa for most of the holes. This is a
significant under-estimate compared to previous laboratory test results, ranging from 66 to 197 MPa
(Turner, May 2010), and will be due to failure along weak bedding planes. Rock strength and
bedding failure should be monitored as the cut-back progresses to enable optimisation of blast
designs.

Technical Report on the Dikulushi Open Pit Project, Democratic Republic of Congo – September 16, 2011
P a g e | 87
For the purposes of the pit design work the depth to the base of weathering has been maintained at
30m for slope design after reviewing the logging. The actual depth and resultant mining in the
weathered material will be guided by inspection of the rock mass as mining of the cut-back
progresses. As a result of this there should be sufficient area allowed around the pit to adjust the pit
edge accordingly.
A-WEST DOMAIN
The bedding angle in the A-West domain is 45°/099° (into the pit) and this will result in major large-
scale instability if the inter-ramp angle is cut steeper than bedding.
The slope design guidelines for this domain include the flattest slopes in the pit for this reason, with
a 55° bench face angle, 10m bench heights and 4m bench widths.
A-EAST DOMAIN
The additional data obtained for Domain A-East enabled a more detailed analysis for a potential cut-
back. The recommended design uses a 60° bench face angle, 20m bench height and 5m bench width,
for an inter-ramp angle of 50°.
The data and previous experience in this section of the pit indicates variable bedding and joint
orientations, with large-scale undulations. These features will result in bench-scale instabilities,
irrespective of bench face angle. Mesh might be required to stabilise bench faces above haulage
ramps if located along this wall. This is an acceptable, and well established, support technique used
in the stability control of open pit walls.
D DOMAIN
The Swedge analysis for Domain D was undertaken using a 60° bench face angle and 20m bench
heights and the analysis indicated no major wedges. Previous experience and the variability of the
rockmass and structural orientations indicates that this will lead to material falling off from bench
faces. The 5m bench widths have previously performed satisfactorily with regards to controlling this
type of fall material.
E DOMAIN
The Swedge analysis of Domain E showed that a combination of a 75° bench face angle, 20m face
height and 5m bench width would produce a factor of Safety of 1.58 assuming a joint-water content
of 25%.
The sensitivity analysis shows the critical impact of wall orientation. The water content of joints is
also critical, reducing the Factor of Safety from 1.59 for the general 25% water content to 1.2 for a
water content of 82%. This emphasises the need for good wall drainage of groundwater. The
previous failure in the south of the pit was associated with both poor mining and water inflows into
the joints (water flowing down the haulage ramp).
The results of the Swedge analysis can be seen in Figure 16.6 and the factor of safety sensitivity in
Figure 16.7.
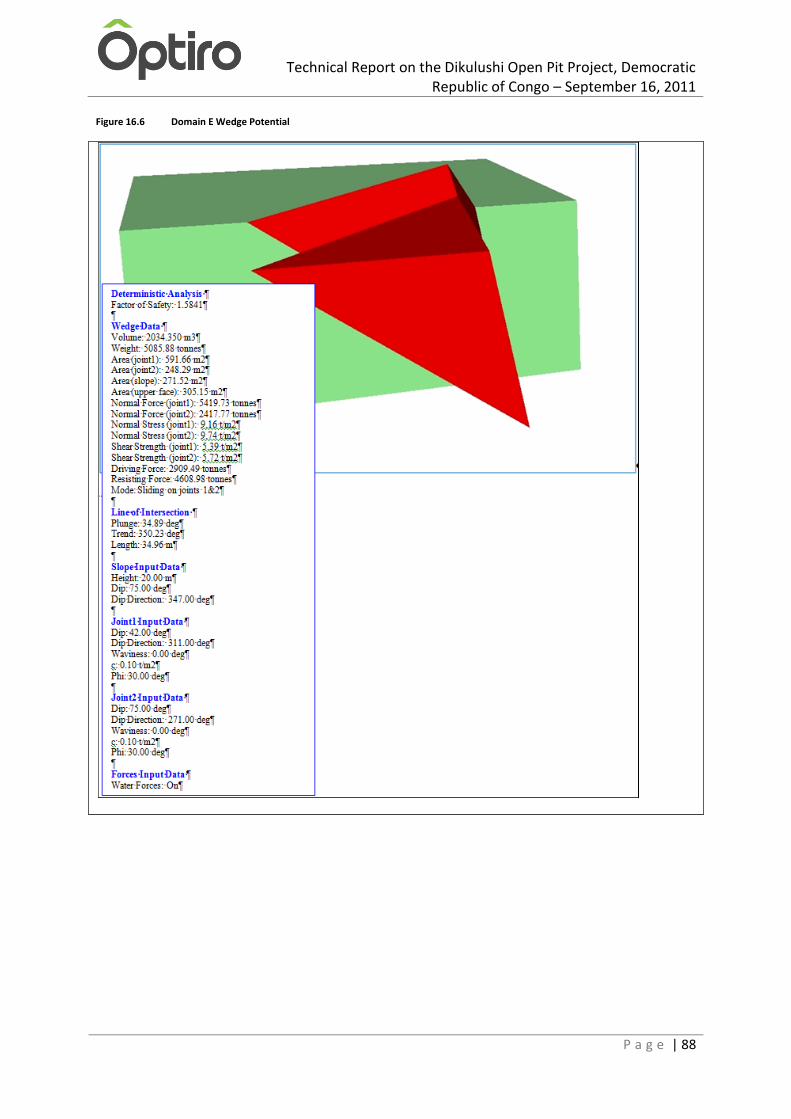
Technical Report on the Dikulushi Open Pit Project, Democratic Republic of Congo – September 16, 2011
P a g e | 88
Figure 16.6 Domain E Wedge Potential

Technical Report on the Dikulushi Open Pit Project, Democratic Republic of Congo – September 16, 2011
P a g e | 89
Figure 16.7 Factor of Safety Sensitivity Analysis, Domain E, 75° Bench Face Angle
F DOMAIN
The Swedge analysis for Domain F was undertaken using a 75° bench face angle and 20m bench
height. The analysis indicated a potential for wedges only with a rare combination of joint sets. This
wall has previously been shown to be stable but is susceptible to blast damage, as with all other
walls.
16.3.4. POTENTIAL FAILURES
There have been several wall failures in the pit during the previous mining activities. It was
determined that a previous south wall failure at Dikulushi during the operations under Anvil was
partly caused by over mining of a lower bench and poor wall blasting aggravated by rainfall run-off
flowing into the rockmass via the haulroad. A north wall failure occurred on a previously unmapped
fault, also aggravated by run-off flowing down the haulroad.
It is essential that good mining practices and blasting techniques are enforced. The other factors
affecting stability described in the May 2010 report are still valid and need to be taken into account
during the design and operational stages.
The factors that could affect stability in the pit include:
blast-damage to walls
over-mining of benches
elevated groundwater levels, such as perched water levels behind structures or poor
drainage through clay-rich zones
unexpected structures and joint combinations
1.52
1.54
1.56
1.58
1.6
1.62
0 10 20 30 40 50 60 70 80 90 100
Fact
or
of
Safe
ty
Percent Change (%)
Percent Change (%) vs. Factor of Safety
Slope Dip (60°-90°) Slope Dip Direction (312°-382°)
Slope Height (10 to 30m) Water Percent Filled (0 to 50%)
Technical Report on the Dikulushi Open Pit Project, Democratic Republic of Congo – September 16, 2011
P a g e | 90
exposure of wide shear zones adjacent to the orebody
severe rainfall surface run-off
long-term water inflow into rockmass
failure of benches and pit floor into existing underground excavations.
Some of these could impact on stability around the pit, and the major risks are discussed below.
NORTHERN WALL
The Northern wall suffered a major failure in 2006 following exposure of a persistent planar fault
behind the wall. Exposure of similar combinations of faults and bedding will require adjustments to
slope designs to prevent failures. The current designs (110729base3008.dtm) include leaving in-situ
a portion of ground between the Northwall fault and the northern wall of the pit. This block of
ground does not daylight and is therefore not technically a wedge. Failure of the block will still be
possible due to stepped-path failure and therefore an intensive cable bolt reinforcement
programme is planned to stabilise the area as the wall is cut-back.
NORTHEAST WALL
The northeast wall is susceptible to bench-scale wedge failures and adherence to slope design
guidelines is necessary to minimise such failures.
EAST WALL
The northern half of the east wall suffered a combination circular/toppling slumping failure in a fault
related zone during the wet season in the first quarter of 2005. The failed material was removed as
part of a cut-back and has shown no sign or similar movement. Drainage has improved since the
failure and the width of the poor ground zone has narrowed significantly further to the east. No
similar instabilities are expected if groundwater levels are controlled by pumping from underground.
SOUTHEAST WALL
The south/southeast wall suffered a large wedge failure in 2006 due to a combination of issues,
including poor run-off control down the haulage ramp, blocked weep holes and very poor blasting
techniques at the toe of the south wall. Improved groundwater drainage, run-off controls and good
blasting techniques will significantly reduce the risk of similar failures and the Factor of Safety is over
1.5 for the design with 75° bench face angles (Figure 16.6). A sensitivity analysis using Swedge for
the 75° bench face angle (Figure 16.7) shows the most critical item impacting on stability is the water
content of joints.
WEST WALL
The west wall was the site of very difficult mining conditions early in the life of the pit, due to the
mélange of carbonates, clay and other fault-breccia related material in combination with saturated
ground conditions. The deeper exposures on the west wall show less intense weathering, reduced
water content and significantly more competent rock. The proposed weep holes and run-off
controls will assist in maintaining stable walls.
Technical Report on the Dikulushi Open Pit Project, Democratic Republic of Congo – September 16, 2011
P a g e | 91
16.3.5. OTHER FACTORS AFFECTING STABILITY
MINING PRACTICES
Slope stability can be seriously affected by sub-standard mining practices and Mawson West at
Dikulushi is planning to dramatically improve mining practices relative to those previously employed.
Blasting, dewatering and surface run-off should be improved and cable bolt support and catch-
fences should be used in critical sections.
BLASTING
The stability of existing bench faces at Dikulushi was affected by the quality of wall perimeter
blasting. The walls were damaged by poor blasting and stability was compromised, leading to
numerous small batter-scale wedge failures. Pre-split blasting was only undertaken along some of
the bench faces, and the improvement in conditions was very noticeable.
Pre-split blasting and improved buffer blasting should be used to reduce blast damage to the walls.
Spare drilling capacity and additional supervision should be made available to ensure a high standard
of drill and blast practices are employed
Pre-splitting or well-designed buffer-blasting will prevent or limit failure to bedding planes, which
are weakly cemented. Failure of bedding planes leads to wedge failures and potentially could lead to
toppling failure in the south-east wall of the pit. Wall-control blasting should incorporate angled
holes parallel to the bench face angle where possible.
The slope design guidelines included in this report assume good quality wall control blasting.
DEWATERING
Instability due to groundwater is not expected for the planned cutback.
The rockmass close to the existing Dikulushi pit is planned to primarily be dewatered via drainage
into the existing voids. Deeper sections of the cutback should incorporate weep holes drilled into
the walls to ensure the rockmass within 10m of the wall is drained. This drainage method has
worked successfully in the past at Dikulushi.
The presence of an existing underground mine will have a significant dewatering impact, especially
on the northern wall where most of the underground development is located.
Conditions in the western wall of the pit have deteriorated in the past due to saturated conditions.
Existing dewatering boreholes to the west of the pit were installed to reduce groundwater levels in
the area and reduce inflows to the weak western rocks. These dewatering boreholes should be re-
commissioned ahead of mining if still serviceable. The planned surface run-off controls should limit
the inflow and recharge of groundwater via haul roads, which was previously a major issue.
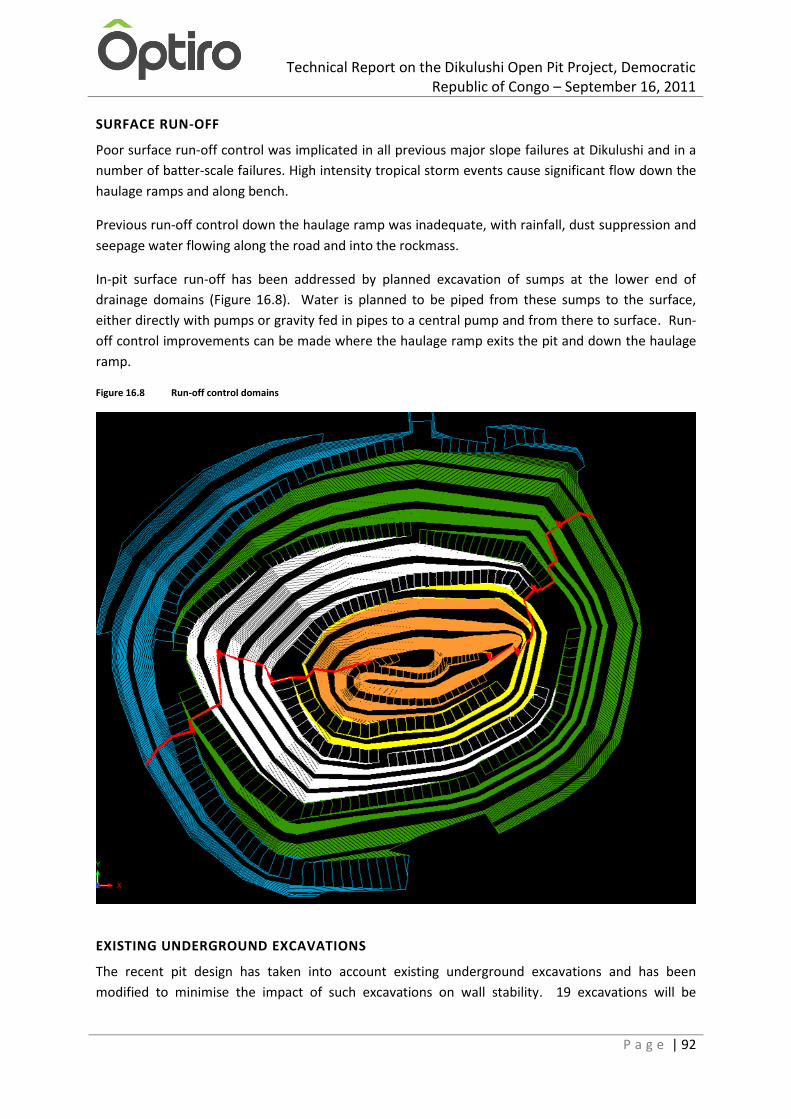
Technical Report on the Dikulushi Open Pit Project, Democratic Republic of Congo – September 16, 2011
P a g e | 92
SURFACE RUN-OFF
Poor surface run-off control was implicated in all previous major slope failures at Dikulushi and in a
number of batter-scale failures. High intensity tropical storm events cause significant flow down the
haulage ramps and along bench.
Previous run-off control down the haulage ramp was inadequate, with rainfall, dust suppression and
seepage water flowing along the road and into the rockmass.
In-pit surface run-off has been addressed by planned excavation of sumps at the lower end of
drainage domains (Figure 16.8). Water is planned to be piped from these sumps to the surface,
either directly with pumps or gravity fed in pipes to a central pump and from there to surface. Run-
off control improvements can be made where the haulage ramp exits the pit and down the haulage
ramp.
Figure 16.8 Run-off control domains
EXISTING UNDERGROUND EXCAVATIONS
The recent pit design has taken into account existing underground excavations and has been
modified to minimise the impact of such excavations on wall stability. 19 excavations will be

Technical Report on the Dikulushi Open Pit Project, Democratic Republic of Congo – September 16, 2011
P a g e | 93
intersected on the northern wall and 5 on the southern wall. Ore drives and cross-cuts will be
intersected in the base of the pit on every underground level, spaced 20m apart. Some of these
underground excavations collapsed or suffered overbreak which should be taken into account when
the open pit approaches any excavation.
The mine should use the guidelines covering mitigation of this risk published in the Open Pit Mining
Through Underground Workings document issued by the DoIR (2000) in Western Australia.
Measures included marking off zones of potential impact with caution tape, probe drilling and
modified drill and blast patterns and techniques.
Probe holes should be drilled when approaching potential voids, holes should be fired to collapse
the rock around the voids and old voids should be filled where the pillars between the pit and the
voids are potentially unstable.
EARTHQUAKES
The seismic hazard data for the Dikulushi area has been assessed from the Global Seismic Hazard
Assessment Program data (GSHAP, 1999). The data indicated a 10% probability of exceeding
between 0.4 and 0.8 m/s2 peak ground acceleration over 50 years (based on a 475 year return
period). This falls in the low-hazard category and increased acceleration has not been considered in
the stability analyses.
16.3.6. MAPPING, MONITORING AND ADDITIONAL DATA
Additional measures and data are required to ensure a high degree of confidence in designs and
stability. These include ongoing geological mapping, monitoring prisms and additional diamond
drillholes.
Fresh exposures of rock should be mapped for rocktype, structures and cracks as the cut-back
progresses deeper and should be stored on hardcopy and digitally.
16.4. IN-PIT SUPPORT REQUIREMENTS
Due to the interaction of the pit with the Northwall fault, existing underground stopes and
underground development it was necessary to review the stability of the pit walls in more detail.
Underground stope and development blasting may have adversely affected the integrity of the
wallrock adjacent to the 850E stope between 870m RL and 850m RL, and rockbolt and mesh support
should be installed on walls either side of the stope void intersection. The lateral and vertical extent
of such support depends on the condition of the rockmass, which should be evaluated during the
cutback.
Underground development will have affected the integrity of the rock adjacent to excavations and
additional support may be required at various points around the pit to control loose rocks, especially
at the 19 holing points on the northern wall and 5 on the southern wall.
There will be a need for monitoring of the pit slope where there is potential for movement due to
the Northwall fault, and areas close to underground excavations. Regular documented visual

Technical Report on the Dikulushi Open Pit Project, Democratic Republic of Congo – September 16, 2011
P a g e | 94
examinations will suffice unless cracks and deformations are observed and then prisms should be
installed.
The reviewed pit designs (110729base3008.dtm) have followed the most recent geotechnical slope
design guidelines. The lowest berm (830m RL) is only 4 m instead of 6 m on the eastern end of the
north and south walls and catch fences are planned to control rockfalls on these berms. Sufficient
funds and equipment are available for the catch fences and the support and reinforcement work
mentioned below.
As the pit approaches the 870m RL the effects of the interaction with the underground stope will
need to be monitored carefully, especially the state of the wall rock. Geotechnical reviews should be
undertaken as the pit progresses below the 870m level. Modifications to the design and support
regime may be required as a result of these reviews.
It is considered that mining down to the 850 bench can be effectively managed, and possibly below
to the 840m RL with no major ore loss. However, should the ground conditions be significantly
different to those considered then the steeper pit walls may not be practicable and would render
mining of material below this point impractical and unsafe due to the narrowness of the pit below
840m RL.
16.4.1. EXISTING UNDERGROUND EXCAVATIONS
Cutback designs have taken into account existing underground excavations. Footwall drives and ore
drives are the main high-risk excavations as they run parallel to the pit slopes and designs have been
adjusted to avoid any impact from these excavations on slope stability. There are a number of other
drives that the pit will intersect and these have been highlighted in Figure 16.9 and Figure 16.10 for
the North and South walls respectively.
The mine will be following the guidelines covering mitigation of this risk issued by the DoIR (2000) in
Western Australia (Open Pit Mining Through Underground Workings).
Measures included marking off zones of potential void intersection with caution tape followed by
probe drilling. No-entry tapes and modified drill and blast patterns and techniques would follow
once the void location has been confirmed.
Deepening of the pit floor above old stopes and drives will be an area requiring extra care, especially
as the pit passes through the old 810 ore drive. Drilling of probe holes, and firing holes to collapse
the rock around the voids or for filling of old voids should be undertaken where required.
NORTH WALL
A total of 16 holing points have been highlighted in the North Wall from analysis of the existing
Surpac files obtained from Anvil Mining Figure 16.9.
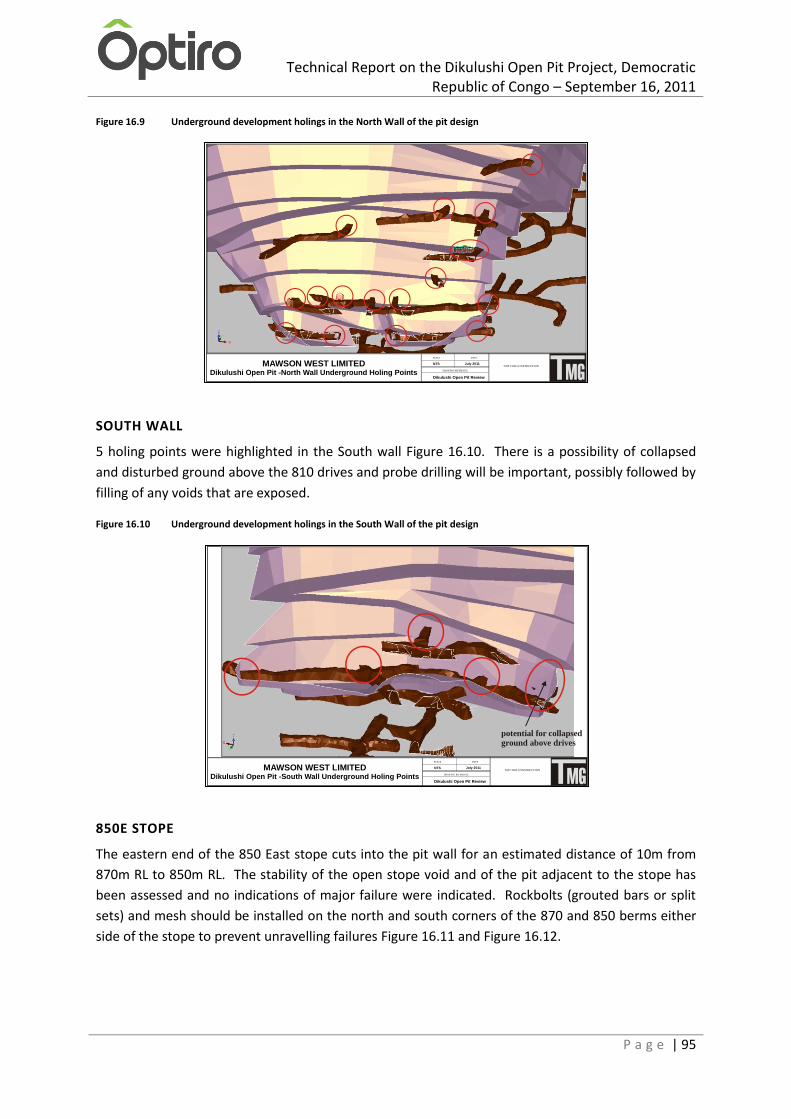
Technical Report on the Dikulushi Open Pit Project, Democratic Republic of Congo – September 16, 2011
P a g e | 95
Figure 16.9 Underground development holings in the North Wall of the pit design
SOUTH WALL
5 holing points were highlighted in the South wall Figure 16.10. There is a possibility of collapsed
and disturbed ground above the 810 drives and probe drilling will be important, possibly followed by
filling of any voids that are exposed.
Figure 16.10 Underground development holings in the South Wall of the pit design
850E STOPE
The eastern end of the 850 East stope cuts into the pit wall for an estimated distance of 10m from
870m RL to 850m RL. The stability of the open stope void and of the pit adjacent to the stope has
been assessed and no indications of major failure were indicated. Rockbolts (grouted bars or split
sets) and mesh should be installed on the north and south corners of the 870 and 850 berms either
side of the stope to prevent unravelling failures Figure 16.11 and Figure 16.12.
DRAWING REFERENCE
DATE
NTS July 2011
SCALE
NOT FOR CONSTRUCTIONMAWSON WEST LIMITEDDikulushi Open Pit -North Wall Underground Holing Points
Dikulushi Open Pit Review
DRAWING REFERENCE
DATE
NTS July 2011
SCALE
NOT FOR CONSTRUCTIONMAWSON WEST LIMITEDDikulushi Open Pit -South Wall Underground Holing Points
potential for collapsedground above drives
Dikulushi Open Pit Review
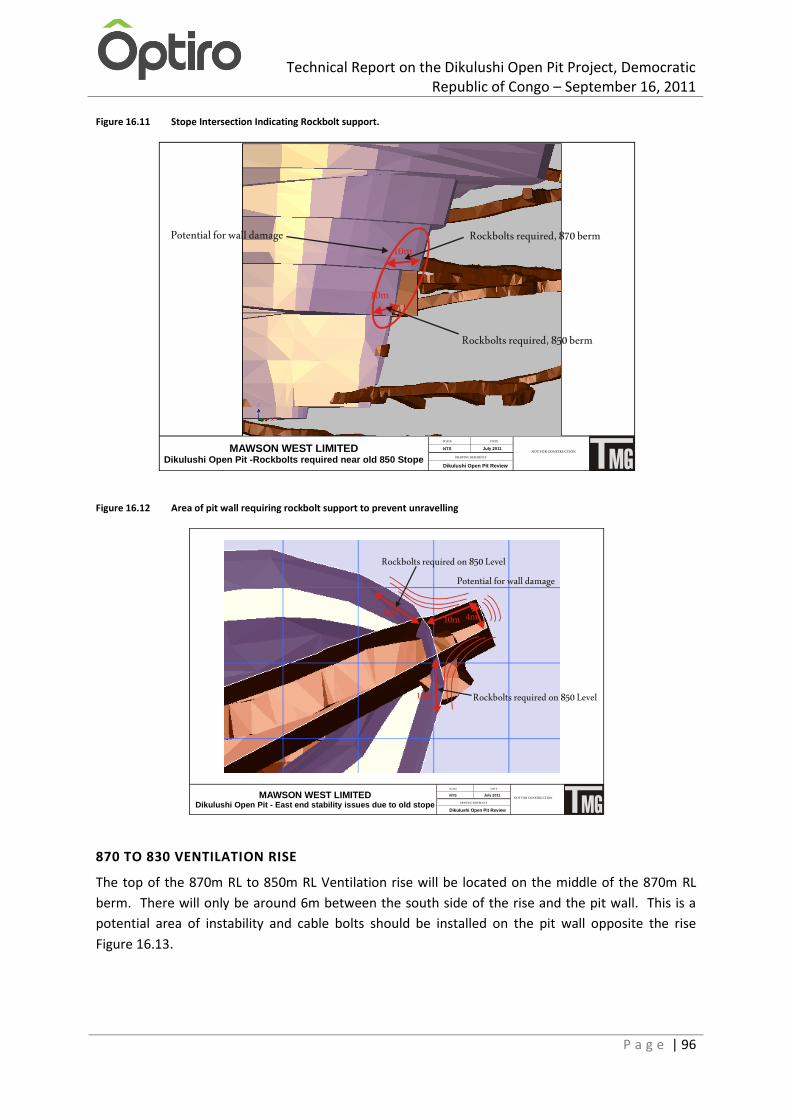
Technical Report on the Dikulushi Open Pit Project, Democratic Republic of Congo – September 16, 2011
P a g e | 96
Figure 16.11 Stope Intersection Indicating Rockbolt support.
Figure 16.12 Area of pit wall requiring rockbolt support to prevent unravelling
870 TO 830 VENTILATION RISE
The top of the 870m RL to 850m RL Ventilation rise will be located on the middle of the 870m RL
berm. There will only be around 6m between the south side of the rise and the pit wall. This is a
potential area of instability and cable bolts should be installed on the pit wall opposite the rise
Figure 16.13.
DRAWING REFERENCE
DATE
NTS July 2011
SCALE
NOT FOR CONSTRUCTIONMAWSON WEST LIMITEDDikulushi Open Pit -Rockbolts required near old 850 Stope
10mPotential for wall damage Rockbolts required, 870 berm
Rockbolts required, 850 berm
10m
Dikulushi Open Pit Review
DRAWING REFERENCE
DATE
NTS July 2011
SCALE
NOT FOR CONSTRUCTIONMAWSON WEST LIMITEDDikulushi Open Pit - East end stability issues due to old stope
4m10m
Potential for wall damage
Rockbolts required on 850 Level
Rockbolts required on 850 Level
10m
10m
Dikulushi Open Pit Review
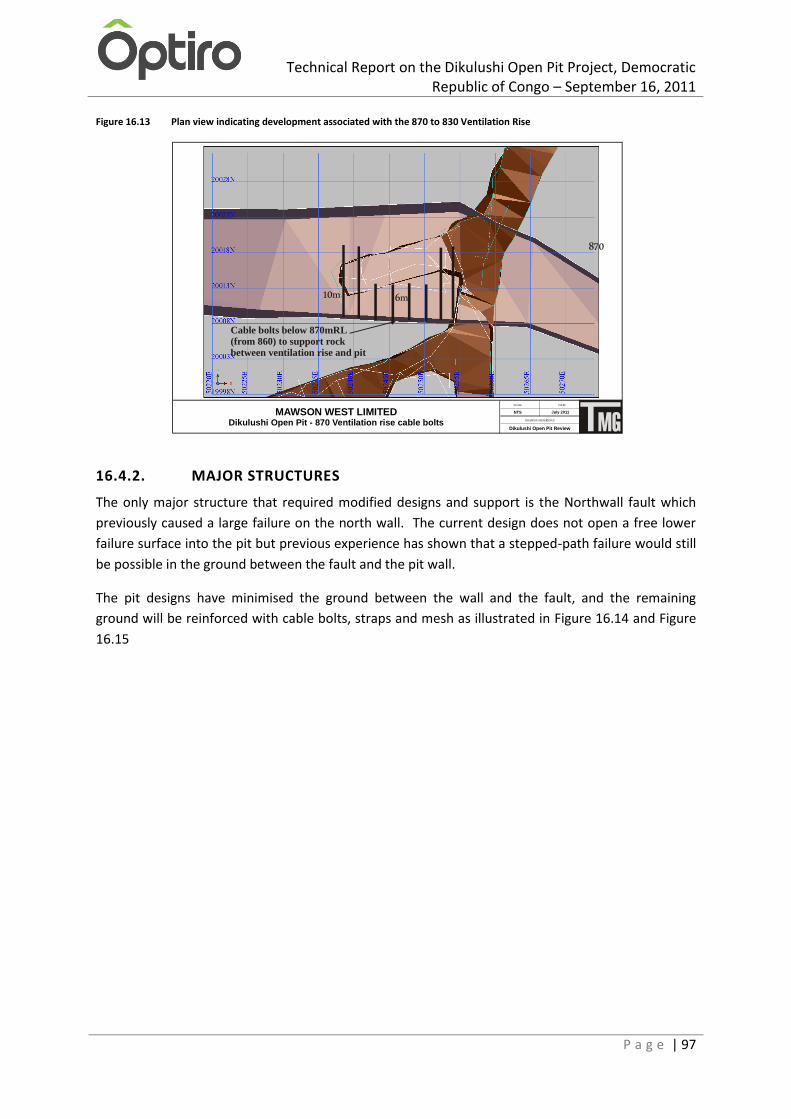
Technical Report on the Dikulushi Open Pit Project, Democratic Republic of Congo – September 16, 2011
P a g e | 97
Figure 16.13 Plan view indicating development associated with the 870 to 830 Ventilation Rise
16.4.2. MAJOR STRUCTURES
The only major structure that required modified designs and support is the Northwall fault which
previously caused a large failure on the north wall. The current design does not open a free lower
failure surface into the pit but previous experience has shown that a stepped-path failure would still
be possible in the ground between the fault and the pit wall.
The pit designs have minimised the ground between the wall and the fault, and the remaining
ground will be reinforced with cable bolts, straps and mesh as illustrated in Figure 16.14 and Figure
16.15
DRAWING REFERENCE
DATE
NTS July 2011
SCALE
MAWSON WEST LIMITEDDikulushi Open Pit - 870 Ventilation rise cable bolts
870
Cable bolts below 870mRL(from 860) to support rockbetween ventilation rise and pit
10m 6m
Dikulushi Open Pit Review
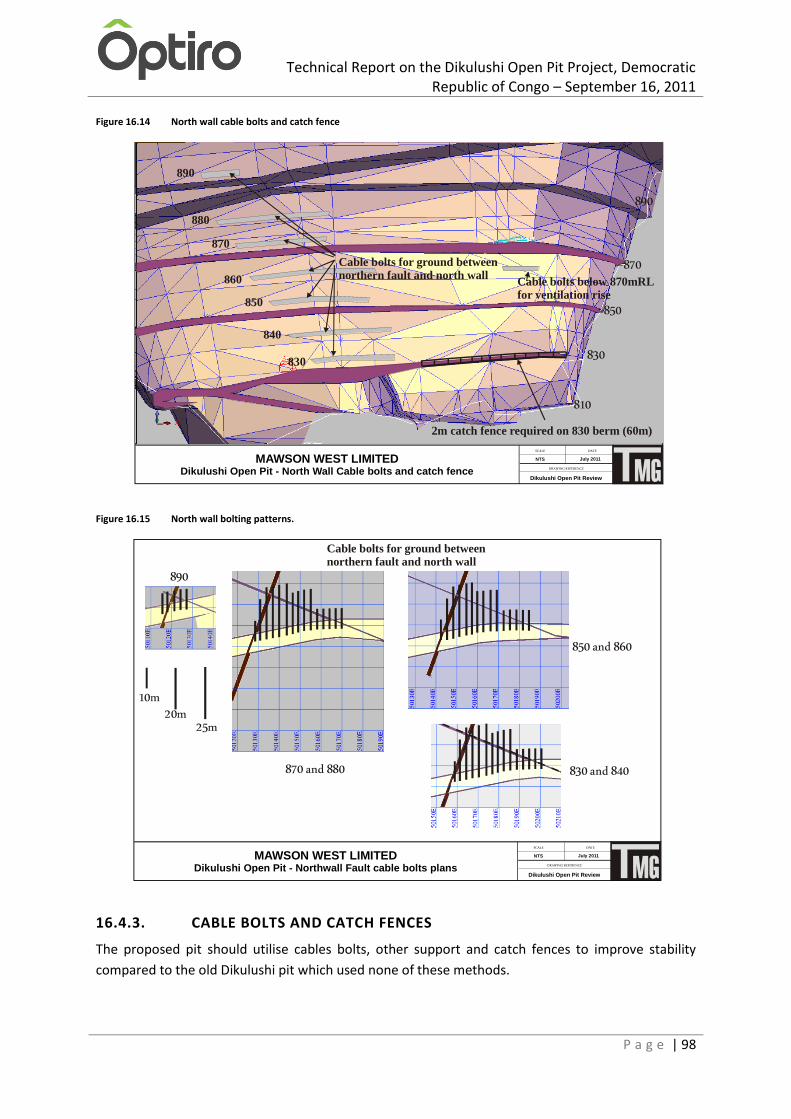
Technical Report on the Dikulushi Open Pit Project, Democratic Republic of Congo – September 16, 2011
P a g e | 98
Figure 16.14 North wall cable bolts and catch fence
Figure 16.15 North wall bolting patterns.
16.4.3. CABLE BOLTS AND CATCH FENCES
The proposed pit should utilise cables bolts, other support and catch fences to improve stability
compared to the old Dikulushi pit which used none of these methods.
DRAWING REFERENCE
DATE
NTS July 2011
SCALE
MAWSON WEST LIMITEDDikulushi Open Pit - North Wall Cable bolts and catch fence
850
870
890
810
830
2m catch fence required on 830 berm (60m)
Cable bolts for ground betweennorthern fault and north wall
Cable bolts below 870mRLfor ventilation rise
830
840
850
860
870
880
890
Dikulushi Open Pit Review
DRAWING REFERENCE
DATE
NTS July 2011
SCALE
MAWSON WEST LIMITEDDikulushi Open Pit - Northwall Fault cable bolts plans
850 and 860
870 and 880
890
Cable bolts for ground betweennorthern fault and north wall
10m20m
25m
830 and 840
Dikulushi Open Pit Review
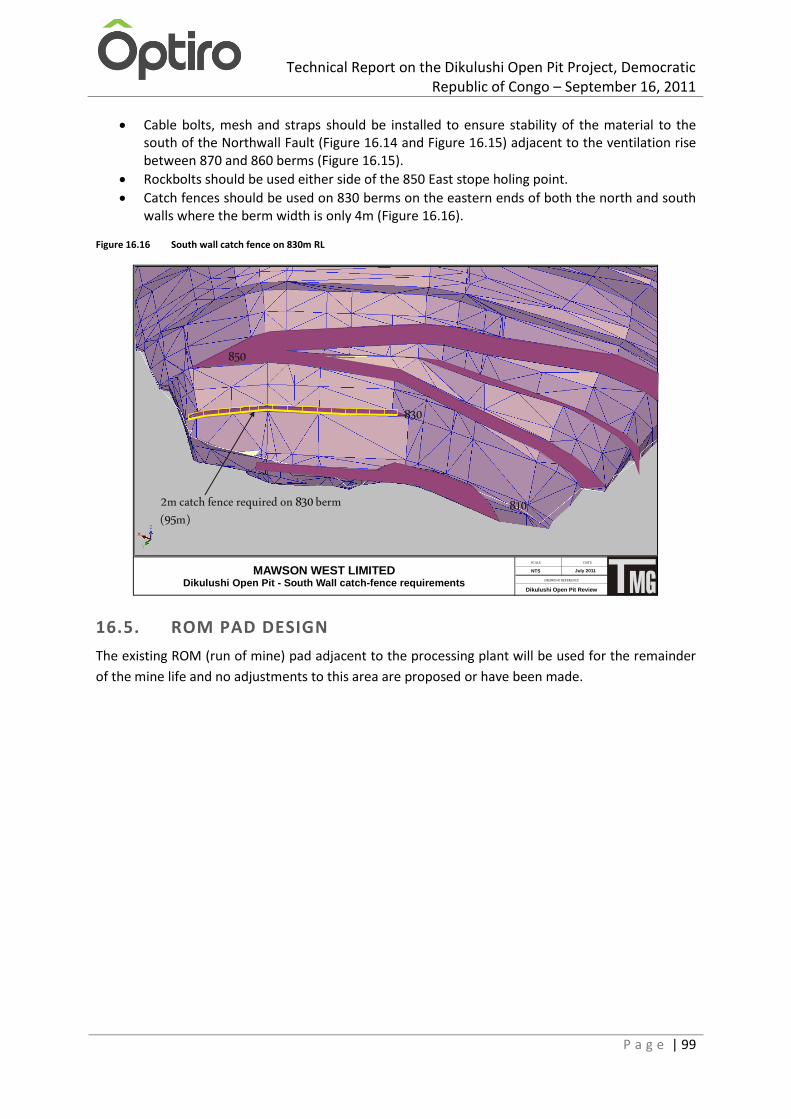
Technical Report on the Dikulushi Open Pit Project, Democratic Republic of Congo – September 16, 2011
P a g e | 99
Cable bolts, mesh and straps should be installed to ensure stability of the material to the south of the Northwall Fault (Figure 16.14 and Figure 16.15) adjacent to the ventilation rise between 870 and 860 berms (Figure 16.15).
Rockbolts should be used either side of the 850 East stope holing point.
Catch fences should be used on 830 berms on the eastern ends of both the north and south walls where the berm width is only 4m (Figure 16.16).
Figure 16.16 South wall catch fence on 830m RL
16.5. ROM PAD DESIGN
The existing ROM (run of mine) pad adjacent to the processing plant will be used for the remainder
of the mine life and no adjustments to this area are proposed or have been made.
DRAWING REFERENCE
DATE
NTS July 2011
SCALE
MAWSON WEST LIMITEDDikulushi Open Pit - South Wall catch-fence requirements
850
8102m catch fence required on 830 berm(95m)
830
Dikulushi Open Pit Review

Technical Report on the Dikulushi Open Pit Project, Democratic Republic of Congo – September 16, 2011
P a g e | 100
16.6. WASTE DUMP DESIGN
Figure 16.17 Location of waste dump relative to expanded pit
The waste dump design parameters used for the Cutback dumps are:
Face slope 20º
Bench height 10m
Berm width 5m
Overall slope 15º
The waste dump capacities have been based on a swell factor of 30%. The top of the waste dump is
at 1,020mRL. The pit cutback will generate 20Mt of waste material with the height of the dumps
limited to 20m. The dump height is limited to 20m in order to keep the waste stripping costs to a
minimum. The dump footprint covers 82.5Ha with 71.5Ha in the south dump and 11Ha in the north
dump as per Figure 16.17.
The waste dumps were designed in Surpac using the dump design module. The waste dump
positions have been determined by taking into account geologically prospective ground (where
sterilisation drilling is still to be carried out), the existing drainage patterns, waste haulage profiles
and the space and infrastructure issues required for the planned operations. A grid of dump blocks
was overlayed on the dumping areas. Mining waste was scheduled into these blocks progressively
away from the pit until the total volume of waste is accounted for in the waste blocks. Additional

Technical Report on the Dikulushi Open Pit Project, Democratic Republic of Congo – September 16, 2011
P a g e | 101
waste capacity is available at the Dikulushi site by either extending the length of the dumps or by
raising the height.
Some existing road re-alignments are required to accommodate the dumps. The waste mined
during the pre-production period will be utilised to provide road base material and other
infrastructure items, such as haul roads, as required.
16.7. SURFACE WATER MANAGEMENT
The surface water hydrology at Dikulushi is well understood. The mine has been operating for 9
years and current surface water management practices have been successful in controlling runoff in
the mine and plant area during this time.
In order to accommodate the pit expansion the eastern surface water management diversion drain
requires relocating. This diversion channel to the south of the existing pit was previously installed as
a result of the initial mining operations.
The new drain has been designed to accommodate as a minimum requirement a one in one hundred
year rainfall event based on historical rainfall records for the area. The gentle undulating
topography and rainfall records indicate that relocation of the surface water management drain
does not pose a significant flood risk to the expanded pit design.
The ESIA report previously submitted and approved for the Dikulushi mine includes an
Environmental Management Plan (EMP). The EMP includes water monitoring of the local waterways
and annual environmental reports that are submitted to the DRC govt. Water sampling in the
Dikulushi Mine area clearly indicates there is not an acid rock drainage problem associated with the
Dikulushi minesite. The water sampling records for the Dikulushi minesite have to be submitted
annually to the DRC government for review and have consistently been compliant with the
requirements of the DRC regulations. The waste and ore material that will be mined in the proposed
pit cutback at Dikulushi is the same as previously mined and therefore no ARD drainage problems
are envisaged based on the current dumps being in place for over 9 years with no ARD issues to
date.
A study of the mine water flows and mine water requirements was previously completed by SRK
consulting of South Africa in 2007 (report “Water Balance for Dikulushi July 2007”). The current and
future requirements for process water were reviewed by SRK consulting to ensure future mine water
requirements will be met and SRK issued an updated report on the Dikulushi mine water
requirements in July 2011 (“Water balance for Dikulushi Mine 2011 update”). The current water
sources are sufficient for the current operation although additional water will have to be drawn from
Lake Newton or boreholes in the driest month. The report contained the following
recommendations;
Recording of mine water flows from the installed meters and on site staff training to ensure
this is done correctly.
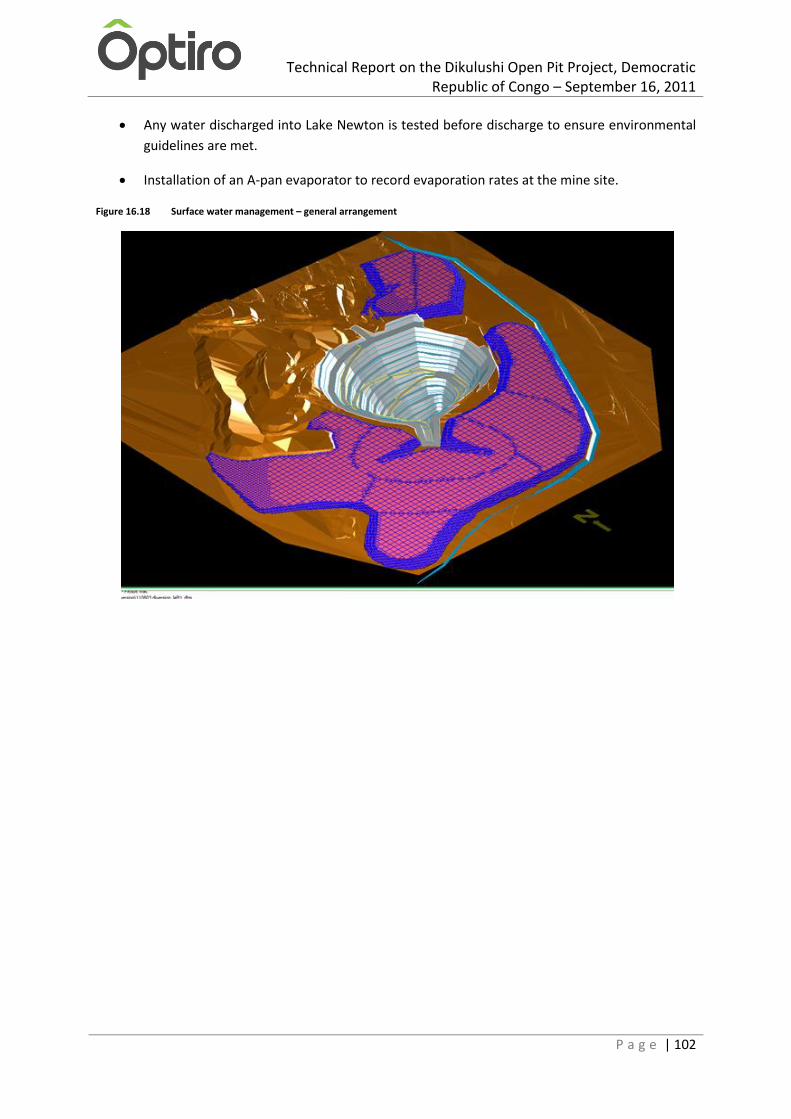
Technical Report on the Dikulushi Open Pit Project, Democratic Republic of Congo – September 16, 2011
P a g e | 102
Any water discharged into Lake Newton is tested before discharge to ensure environmental
guidelines are met.
Installation of an A-pan evaporator to record evaporation rates at the mine site.
Figure 16.18 Surface water management – general arrangement
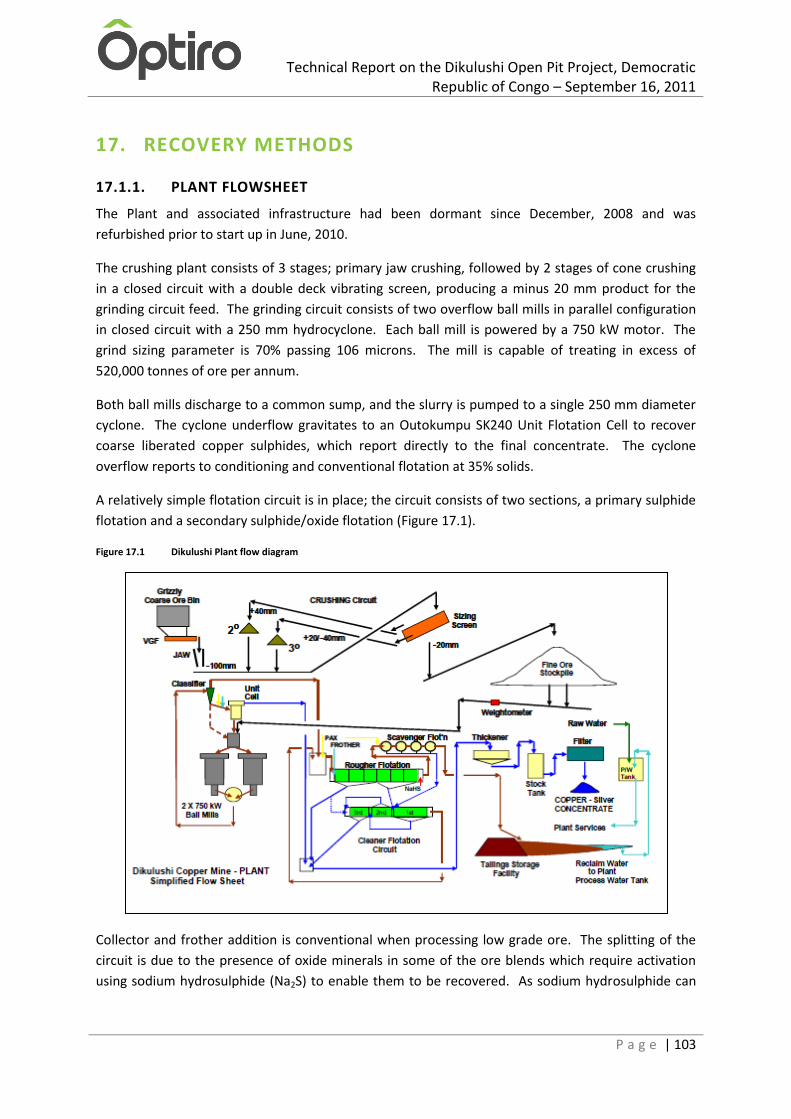
Technical Report on the Dikulushi Open Pit Project, Democratic Republic of Congo – September 16, 2011
P a g e | 103
17. RECOVERY METHODS
17.1.1. PLANT FLOWSHEET
The Plant and associated infrastructure had been dormant since December, 2008 and was
refurbished prior to start up in June, 2010.
The crushing plant consists of 3 stages; primary jaw crushing, followed by 2 stages of cone crushing
in a closed circuit with a double deck vibrating screen, producing a minus 20 mm product for the
grinding circuit feed. The grinding circuit consists of two overflow ball mills in parallel configuration
in closed circuit with a 250 mm hydrocyclone. Each ball mill is powered by a 750 kW motor. The
grind sizing parameter is 70% passing 106 microns. The mill is capable of treating in excess of
520,000 tonnes of ore per annum.
Both ball mills discharge to a common sump, and the slurry is pumped to a single 250 mm diameter
cyclone. The cyclone underflow gravitates to an Outokumpu SK240 Unit Flotation Cell to recover
coarse liberated copper sulphides, which report directly to the final concentrate. The cyclone
overflow reports to conditioning and conventional flotation at 35% solids.
A relatively simple flotation circuit is in place; the circuit consists of two sections, a primary sulphide
flotation and a secondary sulphide/oxide flotation (Figure 17.1).
Figure 17.1 Dikulushi Plant flow diagram
Collector and frother addition is conventional when processing low grade ore. The splitting of the
circuit is due to the presence of oxide minerals in some of the ore blends which require activation
using sodium hydrosulphide (Na2S) to enable them to be recovered. As sodium hydrosulphide can

Technical Report on the Dikulushi Open Pit Project, Democratic Republic of Congo – September 16, 2011
P a g e | 104
depress some sulphide minerals, the majority of the sulphide minerals are recovered in the primary
sulphide flotation circuit.
The tailings from the primary sulphide flotation circuit are sulphidised and the liberated oxides and
additional sulphides are recovered. In the event of the ore blend containing little or no oxides and
thus not requiring sulphidising, the secondary sulphide circuit acts as a sulphide scavenger. The
primary rougher circuit has provision for bypassing initial rougher concentrates directly to final
concentrate. Lower grade rougher concentrates report to the cleaning flotation cells for upgrading.
Final tailings from the secondary rougher circuit are pumped to the tailings storage facility.
Supernatant water is recovered from the tailings dam and recycled to the processing plant. The
circuit is based on a nominal flotation time of 20 minutes in each of the rougher flotation stages and
a minimum 15 minutes in each of the cleaner stages.
Final concentrate is pumped to a thickener and the underflow is pumped to a concentrate storage
tank. The storage tank has sufficient capacity for 8 hours of concentrate production. A filter press
with a capacity of 194t per day is operated in batch mode. Filter cake discharges directly onto a
concrete floor below the filter where it is recovered and transported to a simple hopper/bagging
arrangement with a skid steer loader. Concentrate is loaded into two tonne capacity bulk bags.
Moisture content is near 10%.
Each bag is weighed ready for despatch by truck to the Kilwa port.
17.1.2. TAILINGS STORAGE FACILITIES (TSF)
The first TSF for HMS tailings covers 1.8 hectares and has been dormant since September, 2004. A
particularly coarse portion of the HMS tailings was recovered and processed through the flotation
plant by Anvil (previous owners and operators of Dikulushi Mine). Mawson West has recovered and
processed approximately 15,000 t of coarse sand fraction tailings and fine material from this TSF.
A second TSF (TD2), designed by D.E. Cooper and Associates, Australia, was built during 3Q, 2004 to
receive flotation tailings. This facility is located ~100m North of the HMS TSF, covers about 12
hectares and is 12 m high on the eastern embankment. This facility has also reached capacity.
A third TSF (TD3), designed by Knight Piésold, is located adjacent to and north of the second TSF and
covers a 21 hectare area. This dam is a typical side-hill impoundment and provides the area required
to limit the rise rate of tailings to acceptable norms.
Supernatant water from the tailings slurry is reclaimed for use in the processing plant via a gravity
decant comprising outfall pipe with three stacked ring penstock inlets.
The third TSF (TD3) was utilized until December, 2008 and lay dormant until it was recommissioned
in July 2010. At this juncture Knight Piésold was employed to carry out a volumetric assessment
study to determine the storage capacity of the dam to accommodate 840,000t of tailings resulting
from the processing of the low grade ore stockpile. The study concluded that a 2m embankment
raise would be required during 2011.
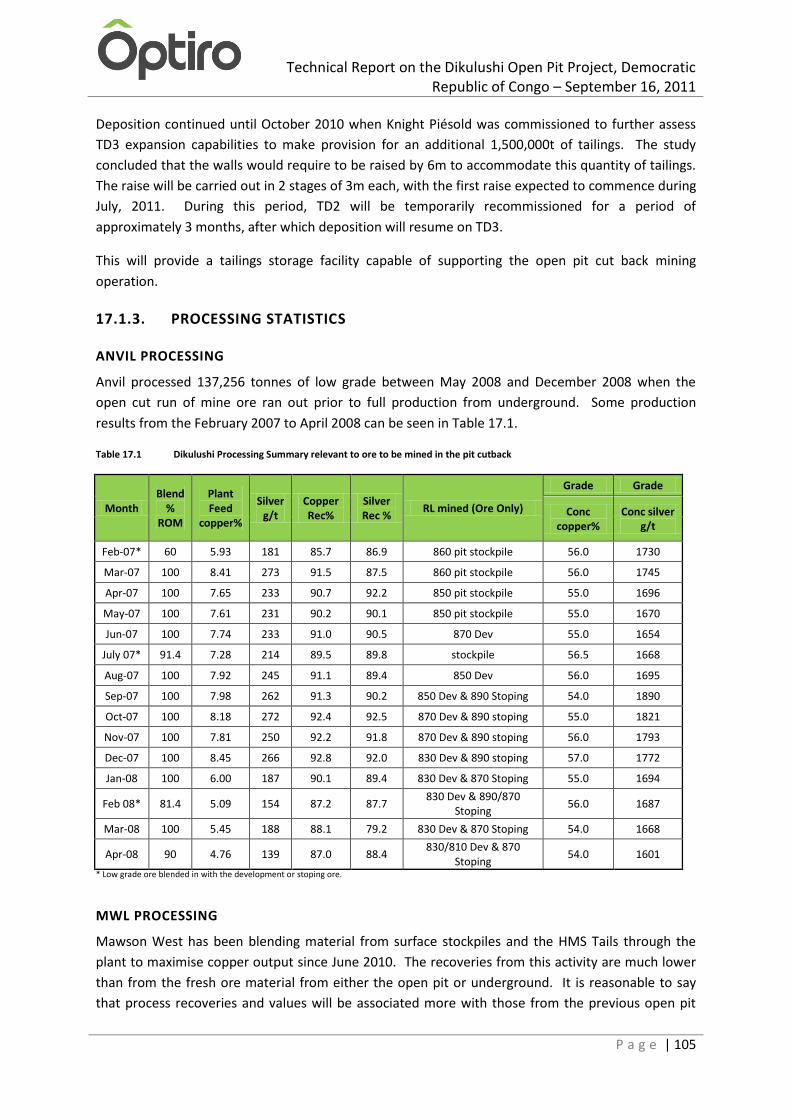
Technical Report on the Dikulushi Open Pit Project, Democratic Republic of Congo – September 16, 2011
P a g e | 105
Deposition continued until October 2010 when Knight Piésold was commissioned to further assess
TD3 expansion capabilities to make provision for an additional 1,500,000t of tailings. The study
concluded that the walls would require to be raised by 6m to accommodate this quantity of tailings.
The raise will be carried out in 2 stages of 3m each, with the first raise expected to commence during
July, 2011. During this period, TD2 will be temporarily recommissioned for a period of
approximately 3 months, after which deposition will resume on TD3.
This will provide a tailings storage facility capable of supporting the open pit cut back mining
operation.
17.1.3. PROCESSING STATISTICS
ANVIL PROCESSING
Anvil processed 137,256 tonnes of low grade between May 2008 and December 2008 when the
open cut run of mine ore ran out prior to full production from underground. Some production
results from the February 2007 to April 2008 can be seen in Table 17.1.
Table 17.1 Dikulushi Processing Summary relevant to ore to be mined in the pit cutback
Month Blend
% ROM
Plant Feed
copper%
Silver g/t
Copper Rec%
Silver Rec %
RL mined (Ore Only)
Grade Grade
Conc copper%
Conc silver g/t
Feb-07* 60 5.93 181 85.7 86.9 860 pit stockpile 56.0 1730
Mar-07 100 8.41 273 91.5 87.5 860 pit stockpile 56.0 1745
Apr-07 100 7.65 233 90.7 92.2 850 pit stockpile 55.0 1696
May-07 100 7.61 231 90.2 90.1 850 pit stockpile 55.0 1670
Jun-07 100 7.74 233 91.0 90.5 870 Dev 55.0 1654
July 07* 91.4 7.28 214 89.5 89.8 stockpile 56.5 1668
Aug-07 100 7.92 245 91.1 89.4 850 Dev 56.0 1695
Sep-07 100 7.98 262 91.3 90.2 850 Dev & 890 Stoping 54.0 1890
Oct-07 100 8.18 272 92.4 92.5 870 Dev & 890 stoping 55.0 1821
Nov-07 100 7.81 250 92.2 91.8 870 Dev & 890 stoping 56.0 1793
Dec-07 100 8.45 266 92.8 92.0 830 Dev & 890 stoping 57.0 1772
Jan-08 100 6.00 187 90.1 89.4 830 Dev & 870 Stoping 55.0 1694
Feb 08* 81.4 5.09 154 87.2 87.7 830 Dev & 890/870
Stoping 56.0 1687
Mar-08 100 5.45 188 88.1 79.2 830 Dev & 870 Stoping 54.0 1668
Apr-08 90 4.76 139 87.0 88.4 830/810 Dev & 870
Stoping 54.0 1601
* Low grade ore blended in with the development or stoping ore.
MWL PROCESSING
Mawson West has been blending material from surface stockpiles and the HMS Tails through the
plant to maximise copper output since June 2010. The recoveries from this activity are much lower
than from the fresh ore material from either the open pit or underground. It is reasonable to say
that process recoveries and values will be associated more with those from the previous open pit

Technical Report on the Dikulushi Open Pit Project, Democratic Republic of Congo – September 16, 2011
P a g e | 106
and underground mining operations carried out by Anvil. Processing statistics for the LG material
completed by MWL are shown in Table 17.2.
Table 17.2 Processing statistics for the LG material completed by MWL
Jun-
10 Jul-10
Aug-
10
Sep-
10 Oct-10
Nov-
10
Dec-
10
Jan-11 Feb-
11
Mar-
11
Apr-
11
May-
11 YTD
Ore Processed tonnes 5,387 36,157 43,882 40,839 27,450 49,029 41,111 49,650 42,839 46,054 40,855 44,705 467,958
Mill Feed Grade Cu % 1.28 1.45 1.04 1.27 3.78 1.52 1.17 1.33 1.32 1.28 1.40 1.32 1.46
Mill Feed Grade Ag g/t 35.87 40.4 27.63 31.72 77.17 41.2 28.5 32.6 29.2 27.8 34.6 33.31 35.31
Tails Grade Cu Cu % 0.34 0.39 0.35 0.46 1.64 0.63 0.52 0.46 0.43 0.46 0.44 0.52 0.54
Tails Grade Ag Ag g/t 10.1 11.1 10.5 10.9 23.0 13.6 10.70 11.3 7.95 7.85 8.7 9.1 10.95
Conc Tonnes dmt 128 896 719 783 1,380 1,066 684 1001 890 893 906 865 10,211
Conc Grade Cu Cu % 38.7 43.5 42.7 43.0 44.1 41.5 39.74 40.1 41.6 39.35 40.2 41.7 41.66
Conc Grade Ag Ag g/t 1,067 1,138 1,107 1,119 1,139 1,188 1139 1070 1033 941 1092 993 1089
Cu metal in Conc dmt 51.45 389.6 306.9 336.7 608.5 442.7 272 400 366 351 365 361 4,251
Ag metal in Conc oz 4,384 32,778 25,581 28,177 50,534 40,726 25,057 32,737 29,385 27,279 31,904 27,559 356,101
Recovery Cu % 74.62 74.31 67.25 64.92 58.64 59.41 56.54 64.13 66.91 62.66 67.46 61.37 64.05
Recovery Ag % 70.57 69.88 65.62 67.65 74.20 62.68 66.45 62.70 73.09 63.34 71.25 61.3 66.68

Technical Report on the Dikulushi Open Pit Project, Democratic Republic of Congo – September 16, 2011
P a g e | 107
18. PROJECT INFRASTRUCTURE
The Dikulushi operation was previously an operating mine and the infrastructure remains in place. It
has been used and maintained by MWL since they took over the project site. The infrastructure is
considered adequate for the resumption of open pit activities at the designed mining rates.
18.1. SURFACE FACILITIES
The existing surface facilities (Figure 18.1) remaining from the underground mining operation will be
suitable for use by the open pit mining personnel.
Figure 18.1 On-site office facilities at Dikulushi

Technical Report on the Dikulushi Open Pit Project, Democratic Republic of Congo – September 16, 2011
P a g e | 108
18.2. POWER
The project is located in a remote area where there is no electrical utility grid. The mine power is
supplied by diesel generators. Power for the Dikulushi operation will be provided by the existing
diesel powered electricity generation installation. This installation has previously supplied power to
the camp and the processing plant. Current production plans will not exceed previous levels and the
installed capacity is expected to be sufficient for future activities. There is sufficient back-up
capacity.
The existing power station at Dikulushi comprises the following generators: 1x 2.0Megawat
Caterpillar, 1x 1.6 Megawatt Caterpillar, 4x 0.8Megawatt Mirrlees for a total capacity of
6.8Megawatts. The current power demand is in the order of 1.8MW and only the 2.0MW Cat,
1.6MW Cat and 2x Mirrlees are being utilised on rotation. This is sufficient to supply the extra
demand of 0.6-1.0 Megawatts for dewatering purposes during the cut-back project.
CMCC recognises that a consistent reliable fuel supply is crucial to the success of the Dikulushi
operation. The operation currently uses approximately 450,000l of diesel per month. This fuel is
supplied by three DRC based companies, two receive supplies from the port of Beira and the other
receives supplies from the port of Dar Es Saleem. CMCC has contacted a further supplier from Dar Es
Saleem whom would be able to supply fuel to Dikulushi. During the cutback project the demand for
diesel will increase to 1,200,000 l/month for a four to five month period. CMCC is regularly speaking
to suppliers to guarantee no interruptions in supply. Thus CMCC believes that it has mitigated the
risk of fuel supply by having a number of suppliers whom source fuel from different ports.
18.3. PROCESS WATER SUPPLY
Lake Newton (Figure 18.2) on the perennial Dikulushi stream provides storage for dewatering and
serves as a reservoir for the supply of process water.
Figure 18.2 Lake Newton
Technical Report on the Dikulushi Open Pit Project, Democratic Republic of Congo – September 16, 2011
P a g e | 109
Meteorological data has been collected between August 2005 and July 2011, with the exception of
2009 and 2010 where little or no data was collected due to reduced activities on site. The mine
water flow regime has changed since the 2007 report due to changes in the mine ownership and as a
result the water balance was reviewed in July 2011 by SRK.
There are several sources of water on site:
The Dikulushi stream, which traverses adjacent to the mine, has two abstraction points. The
first abstraction point feeds water to the Process Plant with the flow being measured. The
second abstraction point is at Lake Newton which stores the water before routing it to the
Return Water Dam (RWD) as make-up water. The flow between Lake Newton and the RWD
is measured.
The second source of water is from the Stream Borehole which supplies the Process Plant.
The borehole is not currently in operation.
The current main source of water is from the Open Pit which has a single supply pipeline to
the Process Plant which is metered.
Water from Tailings Dam 3 (TD3) is captured at the RWD where it is routed to the Process
Plant, This flow is also metered.
Other flow metered points are the Admin Building and the Power House which are internal plant
meters. The Truck Feed receives water from Lake Newton and is used for dust suppression around
the mine. The recent update carried out a full water balance for June and July which are amongst
the driest months in the year. The study arrived at the following recommendations:
The water balance should be updated monthly so the variation in water use can be
measured and incorporated into the water balance. Measuring of meters has recently
commenced and the seasonal variation is unknown at this stage;
The water that is discharged to the Lake Newton will need to be monitored and only
released to the environment when the quality meets the discharge requirements
Record maximum and minimum temperatures, wet and dry bulb temperatures, rainfall,
wind speed, pressure and humidity from the weather station on site;
Install an A- Pan evaporator to record the evaporation at the mine,
A training session is recommended with mine personnel to train and handover the water
balance model.
A monthly water balance was prepared for Dikulushi Mine and is simulating an average monthly
water balance for June and July 2011. The model has been set up so that it can be updated on a
monthly basis. However, the meter data has only been collected for the past two months and
therefore little can be deduced from the model at this stage. The hydrology has however been
incorporated to try and simulate the impact of weather changes. An average water balance is
presented in Figure 18.3

Technical Report on the Dikulushi Open Pit Project, Democratic Republic of Congo – September 16, 2011
P a g e | 110
Figure 18.3 Average water balance
This was also calculated for both a dry month and a wet month. From the water balance review the
following is noted:
The total inflow onto the Tailings dam under present conditions is 3,607 m3/d of which
1,856 m3/d is returned back to the return water pond for reuse in the plant;
The RWD gets about 2,433 m3/d from Lake Newton via the river and 1,856 m3/d from the
tailings dam, while a total of 1,940 m3/d is sent to the plant for reuse;
The main losses from the Tailings dam are seepage, evaporation and interstitial storage;
The rainfall onto the open pit that is collected in the sumps below is reused in the plant and
only when water cannot be reused in the plant is the water discharged into Lake Newton
after the water is settled;
The extended waste footprint means that there will be runoff from the dump that will need
to be settled in paddocks and evaporated where possible;
Borehole water is currently not being used but will be used as potable water and make-up
water when it is in operation;
Approximately 1,589 m3/d will need to be supplied from Lake Newton or from boreholes to
sustain the mine during the dry months;
During the wet season there will be times where the water will discharge from the RWD into
the perennial stream as the plant will not be able to use all the water in the process.
Technical Report on the Dikulushi Open Pit Project, Democratic Republic of Congo – September 16, 2011
P a g e | 111
19. MARKET STUDIES AND CONTRACTS
19.1. MARKETS
The Dikulushi plant is currently configured to produce a copper/silver concentrate which contains
approximately 50% copper.
CMCC currently has a contract to sell all the copper concentrate produced from the low grade
stockpile to smelters in India and China using LN Metals as its agent. CMCC has not yet committed
any of the concentrate that will be produced from the Project cut-back operation.
19.2. CONTRACTS
CMCC currently has a contract to sell all the copper concentrate produced from the low grade
stockpile to smelters in India and China using LN Metals as its agent and this agreement can be
extended at CMCC’s discretion. CMCC has not yet committed any of the concentrate that will be
produced from the Project cut-back operation.
There are various contracts either already in place or required to be entered into for the following
major areas:
Mining
Diesel supply
Transport
Reagents
Spares
A mining services agreement has been entered into with Mining Company Katanga SPRL, which will
be ratified in the coming weeks.
CMCC recognises that a consistent reliable fuel supply is crucial to the success of the Dikulushi
operation. The operation currently uses approximately 450,000l of diesel per month. This fuel is
supplied by three DRC based companies, two receive supplies from the port of Beira and the other
receives supplies from the port of Dar Es Saleem. CMCC has contacted a further supplier from Dar Es
Saleem whom would be able to supply fuel to Dikulushi. During the cutback project the demand for
diesel will increase to 1,200,000 l/month for a four to five month period. CMCC is regularly speaking
to suppliers to guarantee no interruptions in supply. Thus CMCC believes that it has mitigated the
risk of fuel supply by having a number of suppliers whom source fuel from different ports.
The current revenue estimates include the concentrate being transported to a smelter in China
where it will be converted to metal and sold to market.
Copper concentrate will be sold either directly to smelters, or via an agent or directly to metal
trading companies.
Technical Report on the Dikulushi Open Pit Project, Democratic Republic of Congo – September 16, 2011
P a g e | 112
The current cost for transport to the smelter is $335.00/wet metric tonne (wmt) of concentrate with
a treatment charge of $56.00/wmt of concentrate and refining charges of $0.06/lb copper and
$0.40/oz silver.
The resultant net smelter return (NSR) for copper is 96.75% and the NSR for silver is 91%. The
estimated moisture content is 10%.
The study has used a copper price of $7,716/tonne copper ($3.50/lb. copper) and a silver price of
$0.96/g silver ($30.00/oz silver)
No formal off-take agreements have been confirmed to support these assumptions, but the
expected revenue parameters are based on assessments completed by Mawson West of likely
conditions and forward price curves
The average cost per tonne of copper product for transport, treatment, refining and marketing is
estimated to be $1,201 per tonne of copper metal sold.
Commodity price projections have not been evaluated due to the short life of the cut back and
processing operations being less than 24 months.

Technical Report on the Dikulushi Open Pit Project, Democratic Republic of Congo – September 16, 2011
P a g e | 113
20. ENVIRONMENTAL STUDIES, PERMITTING AND SOCIAL
OR COMMUNITY IMPACT
CMCC submitted an Environmental Management Plan (EMP) which was accepted and adopted as
one of the permitting documents. MWL is required to provide annual environmental reports and
demonstrate that it is in compliance with the EMP. Mine remediation is one of the compliance items
in the EMP.
CMCC has lodged an environmental bond of $368,410. The financial guarantee is a contribution
towards an estimate of the total costs of closure, rehabilitation and re-vegetation of the Dikulushi
mine. The development of the financial guarantee is conducted in compliance with:
Articles 410 of the Mining Regulations
Articles 124 and 125 of Appendix XI of the DRC Mining Regulations 2003; and
Appendix II of the Mining Regulations 2003.
The company recently had completed an annual review of the EIA which is yet to be lodged. This
review did not find anything out of requirements.
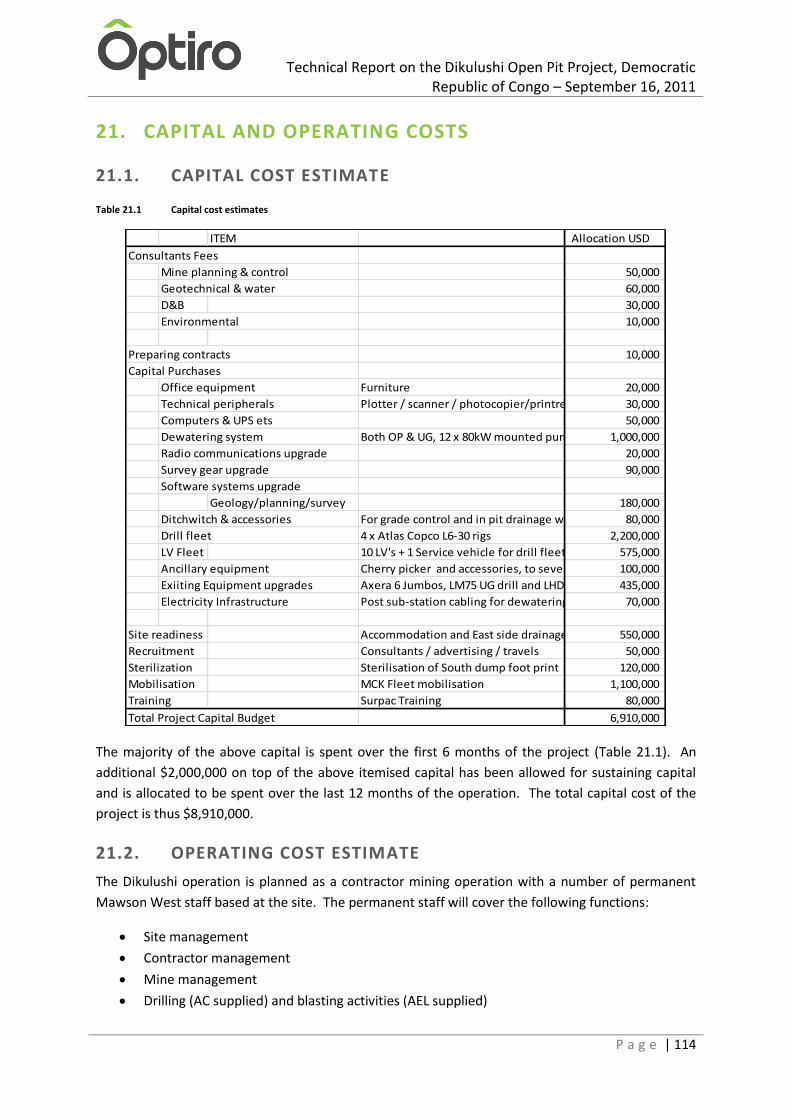
Technical Report on the Dikulushi Open Pit Project, Democratic Republic of Congo – September 16, 2011
P a g e | 114
21. CAPITAL AND OPERATING COSTS
21.1. CAPITAL COST ESTIMATE
Table 21.1 Capital cost estimates
The majority of the above capital is spent over the first 6 months of the project (Table 21.1). An
additional $2,000,000 on top of the above itemised capital has been allowed for sustaining capital
and is allocated to be spent over the last 12 months of the operation. The total capital cost of the
project is thus $8,910,000.
21.2. OPERATING COST ESTIMATE
The Dikulushi operation is planned as a contractor mining operation with a number of permanent
Mawson West staff based at the site. The permanent staff will cover the following functions:
Site management
Contractor management
Mine management
Drilling (AC supplied) and blasting activities (AEL supplied)
ITEM Allocation USD
Consultants Fees
Mine planning & control 50,000
Geotechnical & water 60,000
D&B 30,000
Environmental 10,000
Preparing contracts 10,000
Capital Purchases
Office equipment Furniture 20,000
Technical peripherals Plotter / scanner / photocopier/printre 30,000
Computers & UPS ets 50,000
Dewatering system Both OP & UG, 12 x 80kW mounted pumps, 2 submersibles1,000,000
Radio communications upgrade 20,000
Survey gear upgrade 90,000
Software systems upgrade
Geology/planning/survey 180,000
Ditchwitch & accessories For grade control and in pit drainage works 80,000
Drill fleet 4 x Atlas Copco L6-30 rigs 2,200,000
LV Fleet 10 LV's + 1 Service vehicle for drill fleet 575,000
Ancillary equipment Cherry picker and accessories, to severe steelworks from UG reinforcements/ Rockbolting work100,000
Exiiting Equipment upgrades Axera 6 Jumbos, LM75 UG drill and LHD. 435,000
Electricity Infrastructure Post sub-station cabling for dewatering systems and LM 25 diamond rig for depressurization and probe drilling70,000
Site readiness Accommodation and East side drainage culvert 550,000
Recruitment Consultants / advertising / travels 50,000
Sterilization Sterilisation of South dump foot print 120,000
Mobilisation MCK Fleet mobilisation 1,100,000
Training Surpac Training 80,000
Total Project Capital Budget 6,910,000
Technical Report on the Dikulushi Open Pit Project, Democratic Republic of Congo – September 16, 2011
P a g e | 115
Dewatering
Ore Processing
Resource definition
Geological and grade control
Mine planning
Environmental monitoring and management
Community relations
Commercial, procurement and logistics
The mining contractor will be responsible for the following functions:
Clearing and topsoil removal
Truck loading
Haulage from the pit face to a waste dump or ROM pad adjacent to the pit or processing
plant
Roadway maintenance
Maintenance of all mining equipment
Supply of necessary ancillary mining equipment such as graders, dozers and lighting plant
21.2.1. MINING OPERATING COST
The mining operating costs have been based on a schedule of rates tendered by the mining
contractor who will carry out the mining activity. Adjustments have been made to these costs in
areas where additional difficulty in mining is expected and an hourly rate has been calculated. These
adjustments increase the mining costs in these areas and are considered to be very conservative.
DRILL AND BLAST COSTS
Drill and blast costs have been separately estimated based on a schedule of rates tendered by a
drilling contractor and explosive costs by the supplier for this project.
Table 21.2 Drill and blast unit costs
Drill and Blast Costs US$/t rock
Weathered 0.00
Transitional / Fresh 0.96
LOAD AND HAUL COSTS
Costs have been tendered by the mining contractor engaged to carry out the mining of this cut-back.
The overall load and haul costs have been based on the haulage profiles for the various benches in
the pit design. These profiles cover the haulage of the ore or waste from the respective mining
bench, to surface by the pit ramp system, thence to either the designated waste dump or the ROM
pad for feeding to the mill.
Adjustments have been made to the loading and hauling of material from below the 830m RL. This
adjustment is based on the perceived difficulty in mining operations below this horizon where the
pit steepens and narrows for the final ore removal. Whilst the incremental factors are arbitrarily
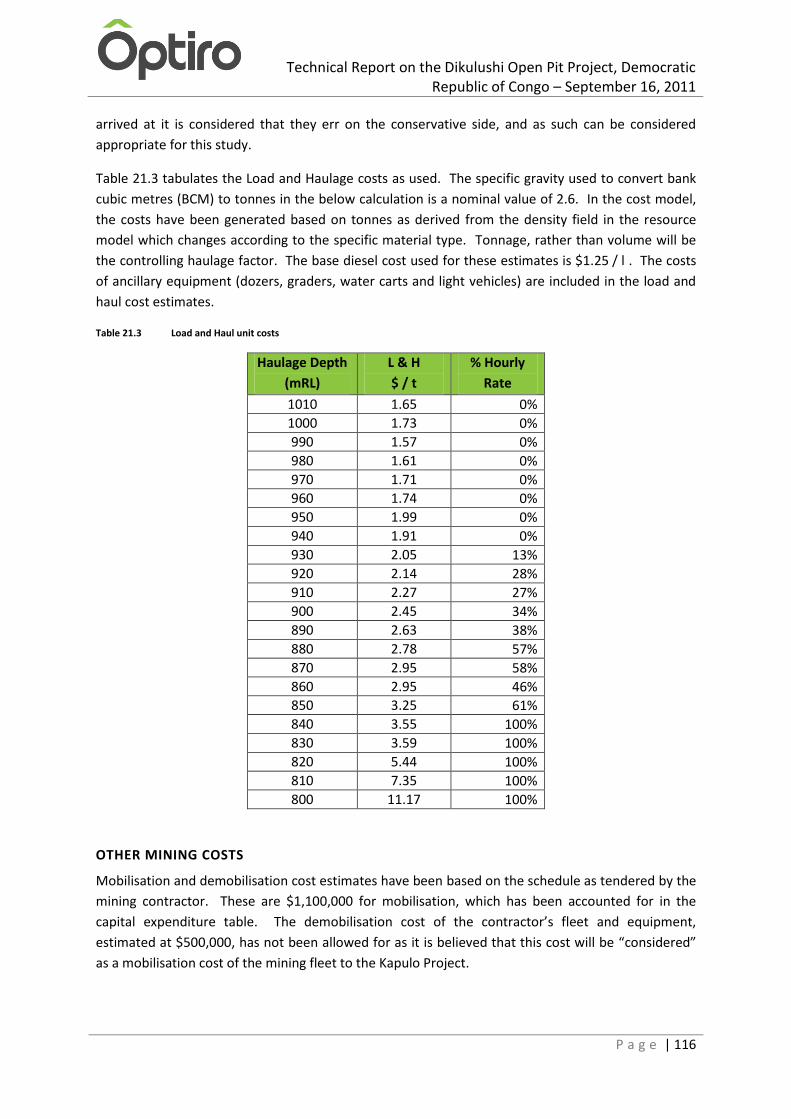
Technical Report on the Dikulushi Open Pit Project, Democratic Republic of Congo – September 16, 2011
P a g e | 116
arrived at it is considered that they err on the conservative side, and as such can be considered
appropriate for this study.
Table 21.3 tabulates the Load and Haulage costs as used. The specific gravity used to convert bank
cubic metres (BCM) to tonnes in the below calculation is a nominal value of 2.6. In the cost model,
the costs have been generated based on tonnes as derived from the density field in the resource
model which changes according to the specific material type. Tonnage, rather than volume will be
the controlling haulage factor. The base diesel cost used for these estimates is $1.25 / l . The costs
of ancillary equipment (dozers, graders, water carts and light vehicles) are included in the load and
haul cost estimates.
Table 21.3 Load and Haul unit costs
Haulage Depth
(mRL)
L & H
$ / t
% Hourly
Rate
1010 1.65 0%
1000 1.73
0%
990 1.57
0%
980 1.61 0%
970 1.71 0%
960 1.74 0%
950 1.99 0%
940 1.91 0%
930 2.05 13%
920 2.14 28%
910 2.27 27%
900 2.45 34%
890 2.63 38%
880 2.78 57%
870 2.95 58%
860 2.95 46%
850 3.25 61%
840 3.55 100%
830 3.59 100%
820 5.44 100%
810 7.35 100%
800 11.17 100%
OTHER MINING COSTS
Mobilisation and demobilisation cost estimates have been based on the schedule as tendered by the
mining contractor. These are $1,100,000 for mobilisation, which has been accounted for in the
capital expenditure table. The demobilisation cost of the contractor’s fleet and equipment,
estimated at $500,000, has not been allowed for as it is believed that this cost will be “considered”
as a mobilisation cost of the mining fleet to the Kapulo Project.

Technical Report on the Dikulushi Open Pit Project, Democratic Republic of Congo – September 16, 2011
P a g e | 117
The contractors (MCK, AC; AEL) fixed monthly fee amount ($408,311) has been converted into a unit
cost of $0.36 / tonne ($0.93 / BCM). MWL’s monthly Management and labour costs are estimated at
$370,208 ($0.84 / BCM). Miscellaneous earthworks have been costed at $0.19 / BCM. Additional
fuel excess costs have been estimated at $0.25 / BCM; Rehabilitation costs at $0.03 / BCM and
dewatering, geotechnical and grade control costs at $0.33 / BCM.
21.3. PROCESSING OPERATING COSTS
The Dikulushi treatment plant has been operated by CMCC since June 2010 treating low grade ore
and has average processing costs of $37.00 per tonne of ore. The TCRC’s of the current low grade
ore are approximately USD$1200.00 per tonne of copper metal after treatment and refining charges
and silver credits have been applied. It is anticipated that similar processing costs per tonne of ore
will be achievable when processing the proposed cutback ore. Due to the changes in ore grades and
recoveries for both copper and silver, it is estimated that the treatment cost will be approximately
$992.35 per tonne of copper metal after treatment and refining charges and silver credits have been
applied. The figure assumes a concentrate grade of 50% copper and 10% moisture.
21.3.1. OVERHEAD OPERATING COST
Site overheads and administration costs were based on an estimated a total amount of $4.2 Million
as supplied by MWL that includes permanent staff, travel, site maintenance, environmental
monitoring, transport, logistics, local taxes, levies and community costs.
Mining Contactor overheads are covered in the fixed monthly rate of $408,311 based on a schedule
of rates as supplied by the mining contractor (MCK); Drilling contractor (AC) and explosive supplier
(AEL) and accounted for in the mining costs.
21.3.2. CAPITAL EXPENDITURE
The cost of refurbishment of the plant has been repaid for by the processing of low grade ore so
there are no further capital costs for this project other than a small quantity of sustaining capital,
which has been allowed for in the sustaining capital estimate of $2.0 Million.
21.3.3. OPERATING COSTS
The process and administration operating costs have been estimated at $37.00/t of ore processed,
based on current operating parameters.
Table 21.4 Operating costs
Operating Cost Unit Cost
Management @ Admin $ / t $6.00
Labour $ / t $7.00
Operating Consumables $ / t $6.00
Maintenance Consumables $ / t $2.00
Power $ / t $16.00
TOTAL $ / t Processed $37.00

Technical Report on the Dikulushi Open Pit Project, Democratic Republic of Congo – September 16, 2011
P a g e | 118
22. ECONOMIC ANALYSIS
22.1. MINING SUMMARY
Table 22.1 below provides a summary of the mining and cashflow performance of the Project mine.
The total material moved is 20.64 Mt of material of which 538,969 t is ore at a diluted and recovered
grade of 6.12% copper. The average life of mine stripping ratio is 38.0 on a waste tonne for ore
tonne basis.
The average mining cost $3.95 per total tonne and $151.27 per ore tonne. The processing cost is $37
per ore tonne processed.
Capital costs are relatively low as the installations are already in place. A total capital cost $8.91M
has been allowed for of which $6.91M is start-up capital and $2.0M of sustaining capital is
estimated.
The mine life is 18 monthswith the majority of the ore mined in the last year. Initial ore production
occurs after 9 months of mining. Processing and copper production and sales occurs after month 10.
Power and dewatering costs have been included in the water management cost category as a unit
cost. Ancillary equipment has been included into the contract unit rates used in the operating cost
estimate.
The processing recovery for copper used for this estimate was 90% for the transitional and fresh
material.
The total cash cost of the operation is $92.7M. A total of 28.7 Kt of copper is sold along with
2.6 Moz of silver to produce revenue of $299.47M. This relates to an NPV12 of $115.78M at a
discount rate of 10%.
Table 22.1 Dikulushi Mining and Financial Summary
Year 1 Year 2 Total
Physical Schedule Total material mined K tonnes 17,485 3,157 20,642
Waste Mined K tonnes 17,437 2,666 20,103
Ore Mined tonnes 48,087 490,883 538,970
Copper mined grade copper% 3.71 6.35 6.12
Silver mined grade silver g/t 88.76 191.44 182.28
Copper mined t 1,783 31,188 32,971
Silver mined oz 137,222 3,021,321 3,158,544
Stripping Ratio 363:1 5.4:1 38:1
Costs Mining
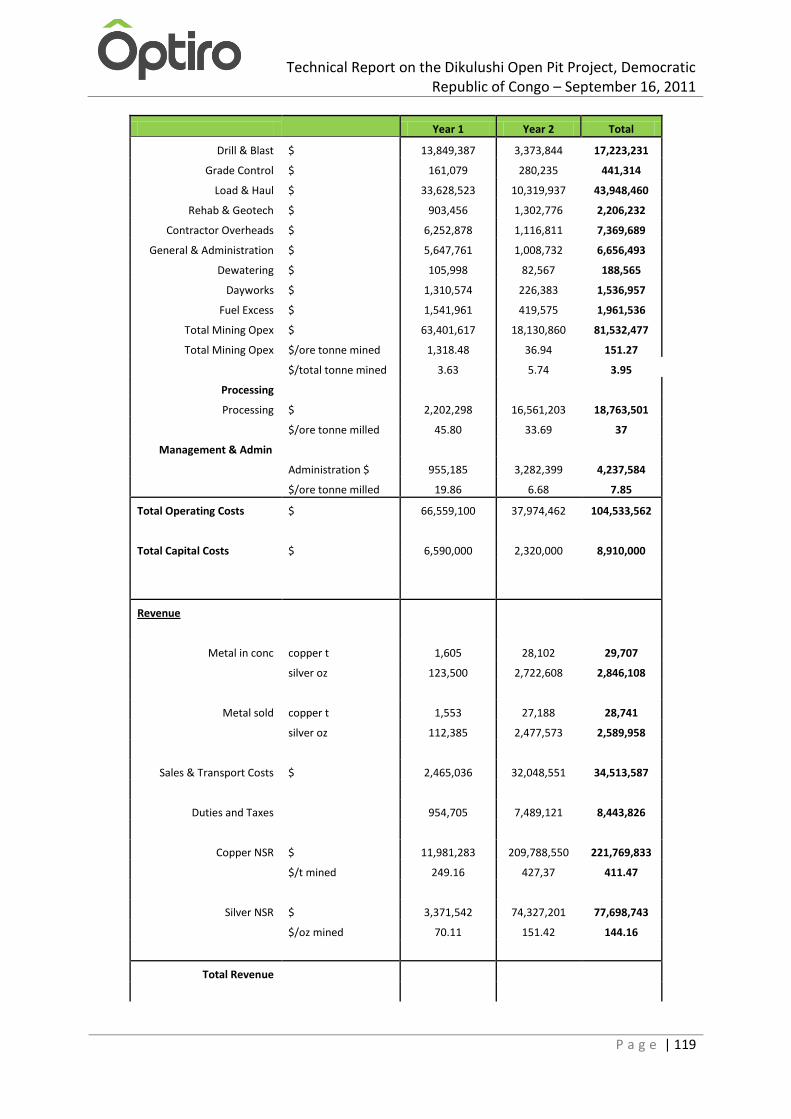
Technical Report on the Dikulushi Open Pit Project, Democratic Republic of Congo – September 16, 2011
P a g e | 119
Year 1 Year 2 Total
Drill & Blast $ 13,849,387 3,373,844 17,223,231
Grade Control $ 161,079 280,235 441,314
Load & Haul $ 33,628,523 10,319,937 43,948,460
Rehab & Geotech $ 903,456 1,302,776 2,206,232
Contractor Overheads $ 6,252,878 1,116,811 7,369,689
General & Administration $ 5,647,761 1,008,732 6,656,493
Dewatering $ 105,998 82,567 188,565
Dayworks $ 1,310,574 226,383 1,536,957
Fuel Excess $ 1,541,961 419,575 1,961,536
Total Mining Opex $ 63,401,617 18,130,860 81,532,477
Total Mining Opex $/ore tonne mined 1,318.48 36.94 151.27
$/total tonne mined 3.63 5.74 3.95
Processing
Processing $ 2,202,298 16,561,203 18,763,501
$/ore tonne milled 45.80 33.69 37
Management & Admin
Administration $ 955,185 3,282,399 4,237,584
$/ore tonne milled 19.86 6.68 7.85
Total Operating Costs $ 66,559,100 37,974,462 104,533,562
Total Capital Costs $ 6,590,000 2,320,000 8,910,000
Revenue
Metal in conc copper t 1,605 28,102 29,707
silver oz 123,500 2,722,608 2,846,108
Metal sold copper t 1,553 27,188 28,741
silver oz 112,385 2,477,573 2,589,958
Sales & Transport Costs $ 2,465,036 32,048,551 34,513,587
Duties and Taxes 954,705 7,489,121 8,443,826
Copper NSR $ 11,981,283 209,788,550 221,769,833
$/t mined 249.16 427,37 411.47
Silver NSR $ 3,371,542 74,327,201 77,698,743
$/oz mined 70.11 151.42 144.16
Total Revenue
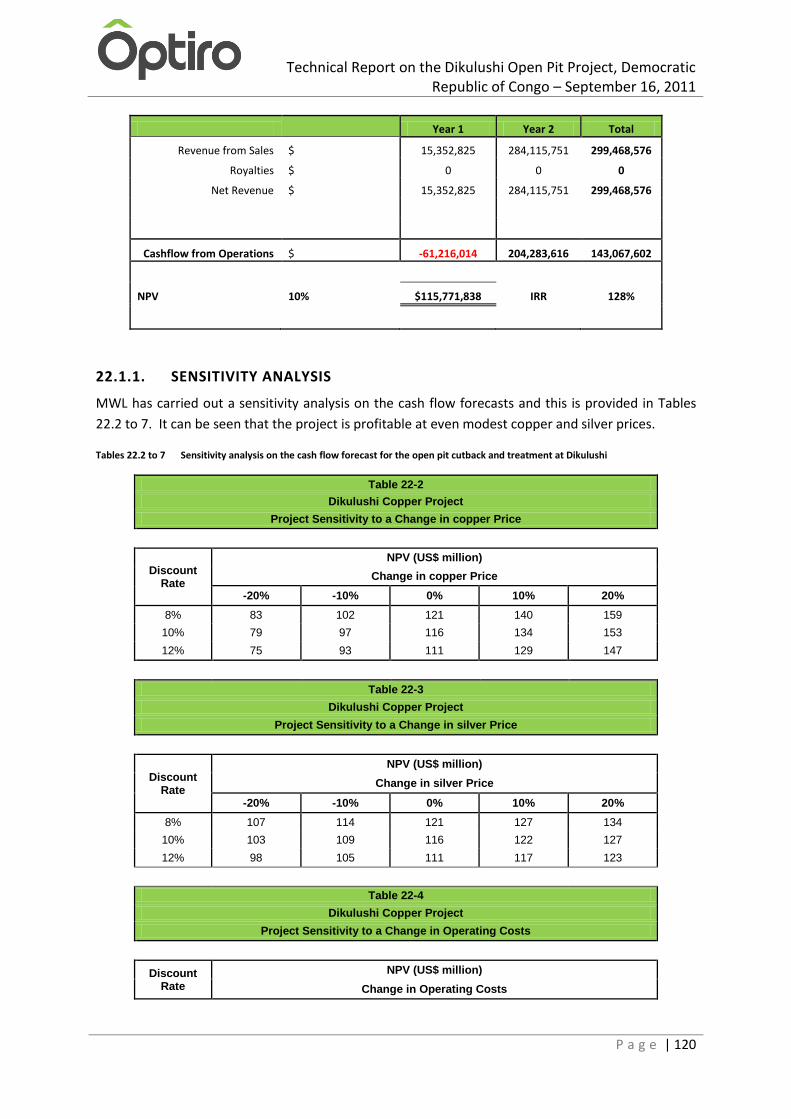
Technical Report on the Dikulushi Open Pit Project, Democratic Republic of Congo – September 16, 2011
P a g e | 120
Year 1 Year 2 Total
Revenue from Sales $ 15,352,825 284,115,751 299,468,576
Royalties $ 0 0 0
Net Revenue $ 15,352,825 284,115,751 299,468,576
Cashflow from Operations $ -61,216,014 204,283,616 143,067,602
NPV 10% $115,771,838 IRR 128%
22.1.1. SENSITIVITY ANALYSIS
MWL has carried out a sensitivity analysis on the cash flow forecasts and this is provided in Tables
22.2 to 7. It can be seen that the project is profitable at even modest copper and silver prices.
Tables 22.2 to 7 Sensitivity analysis on the cash flow forecast for the open pit cutback and treatment at Dikulushi
Table 22-2
Dikulushi Copper Project
Project Sensitivity to a Change in copper Price
Discount Rate
NPV (US$ million)
Change in copper Price
-20% -10% 0% 10% 20%
8% 83 102 121 140 159
10% 79 97 116 134 153
12% 75 93 111 129 147
Table 22-3
Dikulushi Copper Project
Project Sensitivity to a Change in silver Price
Discount Rate
NPV (US$ million)
Change in silver Price
-20% -10% 0% 10% 20%
8% 107 114 121 127 134
10% 103 109 116 122 127
12% 98 105 111 117 123
Table 22-4
Dikulushi Copper Project
Project Sensitivity to a Change in Operating Costs
Discount Rate
NPV (US$ million)
Change in Operating Costs

Technical Report on the Dikulushi Open Pit Project, Democratic Republic of Congo – September 16, 2011
P a g e | 121
-20% -10% 0% 10% 20%
8% 124 122 121 119 117
10% 119 117 116 114 112
12% 114 113 111 109 107
Table 22-5
Dikulushi Copper Project
Project Sensitivity to a Change in Capital Costs
Discount Rate
NPV (US$ million)
Change in Capital Costs
-20% -10% 0% 10% 20%
8% 123 122 121 120 119
10% 118 117 116 115 114
12% 113 112 111 110 109
Table 22-6
Dikulushi Copper Project
Project Sensitivity to a Change in Fuel on Mining Costs
Discount Rate
NPV (US$ million)
Change in Fuel on Mining Costs
-20% -10% 0% 10% 20%
8% 123.8 122.3 121 119.3 117.7
10% 118.8 117.3 116 114.3 112.7
12% 113.9 112.4 111 109.5 108
Table 22-7
Dikulushi Copper Project
Project Sensitivity to a Change in Metal Transport Costs
Discount Rate
NPV (US$ million)
Change in Metal Transport Costs
-20% -10% 0% 10% 20%
8% 124.6 122.7 121 118.9 117
10% 119.5 117.6 116 113.9 112
12% 114.5 112.7 111 109.2 107.4
22.2. PAYBACK
As discussed the refurbishment cost of the mill has already been covered by the revenues from the
LG treatment, thus there is no formal capital payback period. The development of the cutback is to
be fully funded out of MWL’s current existing cash reserves. The total negative cashflow (including
capital costs) is -$61.22M (end of month 12) and which is back in positive territory by the end of
month 16.

Technical Report on the Dikulushi Open Pit Project, Democratic Republic of Congo – September 16, 2011
P a g e | 122
22.3. MINE LIFE
As stated, the mine life is 18 months for the Open pit cutback and treatment operations. MWL fully
expects to extend the mine life once other satellite projects within 50km of Dikulushi have been fully
evaluated.
22.4. TAXATION
The Dikulushi mine operates under the Dikulushi Mining Convention, which provides for
concessionary rates of taxation for each new mine. The first five years of production were tax free,
the effective tax rate from the sixth through tenth years of production is 16% and for the eleventh
through fifteenth years of production 18%, thereafter 40%. Dikulushi has been producing for nine
and half years.
In addition to the usual deductions of expenses and accruals, the Dikulushi Mining Convention
provides that taxable income is adjusted by allowances for:
depreciation of moveable and immoveable fixed assets,
a “depletion allowance” equal to 15% of gross sales up to 50% of net profit, and
all exploration and evaluation expenses.
The mining convention also provides concessionary import duty rates. During the construction
phase, 2% import duties are applied and then during production import duties are applied at the
rate of 3% for fuel, lubricants and mining consumables and 5% of all other supplies.

Technical Report on the Dikulushi Open Pit Project, Democratic Republic of Congo – September 16, 2011
P a g e | 123
23. ADJACENT PROPERTIES
There are no significant mining properties adjacent to the Dikulushi Project.

Technical Report on the Dikulushi Open Pit Project, Democratic Republic of Congo – September 16, 2011
P a g e | 124
24. OTHER RELEVANT DATA AND INFORMATION
Historically, Dikulushi was a producing open pit operation from 2002 until 2006. It continued for a
period of time supplying ore from underground operations until closure in November 2008.
The Dikulushi mine was acquired from Anvil in April 2010 and work started immediately on
refurbishment of the plant, which was completed in June 2010. Since June 2010, MWL has been
producing copper-silver concentrate from a feed of blended HMS tails and reclamation of the LG
stockpile.

Technical Report on the Dikulushi Open Pit Project, Democratic Republic of Congo – September 16, 2011
P a g e | 125
25. INTERPRETATION AND CONCLUSIONS
The Dikulushi Project is a producing and developing property. Current processing of the Dikulushi LG
stockpile reserves has provided MWL with a robust cash flow and results demonstrate reliable
grades of remaining stocks when compared with RC drilling results and estimates.
The Dikulushi deposit has a long history of exploration and successful mining. Data quality across
the unmined volume of the deposit is of good quality and has representative sample values for
reliable Mineral Resource estimates. Mineral Resource classification supports both Proven and
Probable Reserve categories within the pit cut-back volume. The pre-feasibility study and resulting
Mineral Reserves from the open pit cut-back further strengthens MWL’s production life from the
Dikulushi Project. MWL has approved, and already has, the funding for the open pit cut-back.
Successful mining will result from good mining practice providing clean pre-split of the final walls,
maintenance of the mining design, safe handling of the interaction with any underground
development and good dewatering of the pit walls. MWL intends to continue processing the LG
stockpile during the build up phase to production from the pit cut-back.
MWL’s strategy is to continue to develop satellite deposits to Dikulushi, such as Kazumbula, in
addition to the remaining Dikulushi Mineral Resources located below the planned pit cut-back. The
recent exploration drilling at Kazumbula has provided good quality geological and sample
information to support a robust Mineral Resource estimate. Upon completion of the mine design,
scheduling and financial analysis, the Kazumbula deposit is most likely to be of reasonable size and
grade to be able to contribute feed to the Dikulushi plant. Additional satellite deposits within 50km
of Dikulushi are currently being drilled by MWL.

Technical Report on the Dikulushi Open Pit Project, Democratic Republic of Congo – September 16, 2011
P a g e | 126
26. RECOMMENDATIONS
It is recommended that MWL continues with the planned Project cut-back. The key aspects for the
success of the cut-back are those of maintaining good mining practices, including very good pre-split,
ensuring no undercutting, keeping water away from the pit and maintaining the pit draining systems.
Annual reviews will be required for the environmental approvals and to ensure the integrity of the
tailings dam is maintained.
The development of additional targets within the 50 km radius of Dikulushi has good synergies with
the overall MWL strategy.
Technical Report on the Dikulushi Open Pit Project, Democratic Republic of Congo – September 16, 2011
P a g e | 127
27. REFERENCES
DevMin Pty Ltd (Feb 2004): Anvil Mining Ltd “Dikulushi Copper-Silver Deposit, NI34-101 Technical
Report. February 16, 2004.
Franey, N., Hillbeck, M. and Fahey, G. (2006): Technical Report, Dikulushi Copper – Silver Deposit.
February 21, 2006
JORC (2004): Australasian Code for Reporting of Mineral Resources and Ore Reserves, Effective
December 2004. Prepared by the Joint Ore Reserves Committee of The Australasian Institute of
Mining and Metallurgy, Australian Institute of Geoscientists and Minerals Council of Australia (JORC).
National Instrument 43-101, Standards of Disclosure for Mineral Projects, Supplement to the OSC
Bulletin, April 8, 2011
Form 43-101F1 Technical Report, Supplement to the OSC Bulletin, April 8, 2011
Munro, K.D. & Associates (1998): Dikulushi Copper-Silver Project. Geological Review and Mineral
Resource Estimate for Dikulushi Copper-Silver Project.
Lemmon, T., Boutwood, A., Turner, B., (2003) The Dikulushi copper-silver deposit, Katanga, DRC. In,
Proterozoic Sediment-hosted base metal deposits of Western Gondwana, ed., J. Cailteux, Abstract of
the IGCP 450 conference and field workshop, July 14-24. Lubumbashi, DRC.
Dewaele, S., Muches, P., Heijlen, W., Lemmon, T., Boutwood, A., (in press), Reconstruction of the
hydrothermal history of the CU-Ag vein-type mineralisation of Dikulushi, Kundelunga foreland,
Katanga, DRC.
Fahey,G.,Franey,N., Anvil Mining Limited Dikulushi Copper-Silver Mine Katanga Region Democratic
Republic of Congo technical Report (NI43-101), December 22nd, 2006
Mawson West Ltd Pre-Feasibility study, July 2011
Independent Metallurgical Laboratories (IML): Metallurgical Ore Characterisation of Dikulushi
Copper Ores for Anvil Mining NL, August 2003
Independent Metallurgical Laboratories (IML): Confirmatory Metallurgical Testwork on ROM
Dikulushi Copper Ore for Anvil Mining NL, June 2004
Metallurgical Design and Management Pty Ltd; Dikulushi Copper Silver Project, Stage 2 Flotation
Project Interim Metallurgical Rreport, July 11, 2003
F Chikosha, Dikulushi Copper Mine Tailings Disposal Facility TD3 Expansion Study, June 2011
A J Strauss, Dikulushi Copper Mine Tailings TD3 Volumetric Assessment, July 2010
M.Turner, Indpendent geotechnical consultant: Dikulushi north wall cable bolts 270711, July 2011
M.Turner, Indpendent geotechnical consultant: MHTurner Project stability 260711, July 2011.

Technical Report on the Dikulushi Open Pit Project, Democratic Republic of Congo – September 16, 2011
P a g e | 128
SRK Consulting: Project No: 436159 Water Balance for Dikulushi Mine – 2011 Update
Technical Report on the Dikulushi Open Pit Project, Democratic Republic of Congo – September 16, 2011
P a g e | 129
28. CERTIFICATES
OPTIRO PTY LTD
CERTIFICATE OF QUALIFIED PERSON
As the lead author of the report entitled “Technical Report on the Dikulushi Open Pit Project,
Democratic Republic of Congo” (the Study) dated 16 September 2011, on the Project cut back, of
Mawson West Ltd , I hereby state:
1. My name is David Gray and I am a full time employee of the firm Optiro Pty Ltd of Level 4,
50 Colin Street, West Perth, WA, 6005, Australia.
2. I am a practising geologist and a member of the AusIMM (303226) and registered member of
The South African Council for Natural Scientific Professions (PrSciNat, 400018/04).
3. I am a graduate of Rhodes University in South Africa with a BSc (Hons) in Geology in 1988
4. I have practiced my profession continuously since 1990.
5. I am a “qualified person” as that term is defined in National Instrument 43-101 (Standards of
Disclosure for Mineral Projects) (the “Instrument”).
6. I visited the Dikulushi Project property and surrounding areas for two days in November 2010. I
have performed consulting services and reviewed files and data associated with Dikulushi
between May 2009 and the present.
7. I am responsible for all the Sections of the Study and have contributed to Sections 17.1 and 17.3
and the associated text in the summary, conclusions and recommendations.
8. As of the date of this certificate, to the best of my knowledge, information and belief, the Study
contains all scientific and technical information that is required to be disclosed to make the
Study not misleading.
9. I am independent of Mawson West Ltd pursuant to section 1.4 of the Instrument.
10. I have read the National Instrument and Form 43-101F1 (the “Form”) and the Study has been
prepared in compliance with the Instrument and the Form.
11. I do not have nor do I expect to receive a direct or indirect interest in the Dikulushi property of
Mawson West Ltd, and I do not beneficially own, directly or indirectly, any securities of Mawson
West Ltd or any associate or affiliate of such company.
Dated at Perth, Western Australia, on 22 September 2011.
David Gray
Principal Consultant (Optiro Pty Ltd)
BSc (Hons) (Geology), MAusIMM, PrSciNat

Technical Report on the Dikulushi Open Pit Project, Democratic Republic of Congo – September 16, 2011
P a g e | 130
OPTIRO PTY LTD
CERTIFICATE OF QUALIFIED PERSON
As a Qualified Person and author of the report entitled “Technical Report on the Dikulushi Open Pit
Project, Democratic Republic of Congo” (the Study) dated 16 September 2011, on the Project cut
back, of Mawson West Ltd , I hereby state:
1. My name is Andrew Law and I am a full time employee of the firm Optiro Pty Ltd of Level 4,
50 Colin Street, West Perth, WA, 6005, Australia.
2. I am a practising Mining Engineer and a Fellow of the AusIMM (107318), also a Fellow of the
Institute of Quarrying Australia (991004), and a Member of the Australian Institute of Company
Directors (0044149).
3. I am a graduate of the Witwatersrand Technikon, Johannesburg, South Africa, with a HND
Metalliferous Mining, in 1982.
4. I have practiced my profession continuously since 1983.
5. I am a “qualified person” as that term is defined in National Instrument 43-101 (Standards of
Disclosure for Mineral Projects) (the “Instrument”).
6. I have performed consulting services and reviewed files and data associated with Dikulushi from
August 2011 to the present.
7. Based on the information provided by Mawson West Ltd and reviewed by myself I contributed
to Sections 15, 16, 19, 20, 21, 22, 24, 25, and 26.
8. As of the date of this certificate, to the best of my knowledge, information and belief, the Study
contains all scientific and technical information that is required to be disclosed to make the
Study not misleading.
9. I have read the National Instrument and Form 43-101F1 (the “Form”) and the Study has been
prepared in compliance with the Instrument and the Form.
10. I do not have nor do I expect to receive a direct or indirect interest in the Dikulushi property of
Mawson West Ltd, and I do not beneficially own, directly or indirectly, any securities of Mawson
West Ltd or any associate or affiliate of such company.
Dated at Perth, Western Australia, on 22 September 2011.
Andrew Law
Director - Mining (Optiro Pty Ltd)
FAusIMM

Technical Report on the Dikulushi Open Pit Project, Democratic Republic of Congo – September 16, 2011
P a g e | 131
TURNER MINING AND GEOTECHNICAL PTY LTD
Technical Report on the Dikulushi Open Pit Project, Democratic Republic of Congo – September 16, 2011
P a g e | 132
Technical Report on the Dikulushi Open Pit Project, Democratic Republic of Congo – September 16, 2011
P a g e | 133
Technical Report on the Dikulushi Open Pit Project, Democratic Republic of Congo – September 16, 2011
P a g e | 134
Technical Report on the Dikulushi Open Pit Project, Democratic Republic of Congo – September 16, 2011
P a g e | 135
SEDGMAN LTD