max-planck-institut fu r physik, munich, germany arxiv
TRANSCRIPT
The Muon-Induced Neutron Indirect Detection
EXperiment, MINIDEX
I. Abta, A. Caldwella, C. Carissimoa, C. Goocha, R. Kneißla, J. Langforda,X. Liua, B. Majorovitsa, M. Palermoa,∗, O. Schulza, L. Vanhoefera
aMax-Planck-Institut fur Physik, Munich, Germany
Abstract
A new experiment to quantitatively measure neutrons induced by cosmic-ray muons in selected high-Z materials is introduced. The design of theMuon-Induced Neutron Indirect Detection EXperiment, MINIDEX, and theresults from its first data taking period are presented as well as future plans.Neutron production in high-Z materials is of particular interest as such ma-terials are used for shielding in low-background experiments. The designof next-generation large-scale experiments searching for neutrinoless dou-ble beta decay or direct interactions of dark matter requires reliable MonteCarlo simulations of background induced by muon interactions. The first fivemonths of operation already provided a valuable data set on neutron produc-tion and neutron transport in lead. A first round of comparisons betweenMINIDEX data and Monte Carlo predictions obtained with two GEANT4-based packages is presented. The rate of muon-induced events is overall afactor three to four higher in data than predicted by the Monte Carlo pack-ages. In addition, the time evolution of the muon-induced signal is not welldescribed by the simulations.
Keywords: muon-induced neutrons, low-background experiments, MonteCarlo simulation
1. Introduction
Muon-induced neutrons are not only an interesting physics topic by them-selves, but they are also a potentially very important source of backgroundin searches for new rare phenomena like neutrinoless double beta decay ordirectly observable interactions of dark matter.
∗Corresponding Author. Tel: +49-89-32354295Email address: [email protected] (M. Palermo)
Preprint submitted to Journal of LATEX Templates October 6, 2016
arX
iv:1
610.
0145
9v1
[ph
ysic
s.in
s-de
t] 5
Oct
201
6

The Muon-Induced Neutron Indirect Detection EXperiment (MINIDEX)was designed to provide data on the interactions of cosmic high-energy muonsin high-Z materials. Previous measurements are not really consistent [1, 2,3, 4, 5, 6, 7]. Neither are the corresponding calculations [8, 9, 10, 1, 11]. Oneof the problems is, that for all measurements, it is hard to disentangle theprimary neutron production rate from the influence of neutron transport. Inaddition, experiments have different energy thresholds for the detection ofneutrons. MINIDEX detects thermalised neutrons and thus, has no neutron-energy threshold. Another problem is the determination of the background.MINIDEX measures its own background to high precision simultaneouslywith the signal.
Neutrons produced by the interactions of high-energy muons with nucleiare emitted in all directions and have energies of up to several GeV. Astheir energy exceeds the maximum energy of neutrons produced by naturalradioactivity by several orders of magnitude, they can be important for low-background experiments, even though they are much more rare [12, 13, 14, 15,16]. The importance of muon-induced background will increase for the nextgeneration of low-background experiments, because the background level willhave to be reduced by at least another order of magnitude compared tocurrently running experiments [17, 18, 19, 20].
Traditionally, high-Z materials are used to shield low-background experi-ments. Examples are the MAJORANA [21] and CDEX I [22] projects. How-ever, in such a configuration, muons produce high-energy neutrons in theshield, close to the active volume. Therefore, besides going deeper under-ground, techniques to veto muons are commonly used. However, moderatedneutrons can create unstable states close to or in the active volume of anexperiment which decay too slowly to be vetoed against. A lot of effort wentinto Monte Carlo packages [12, 23, 24, 25, 26] to facilitate the evaluation ofsuch backgrounds. Nevertheless, all Monte Carlo predictions depend on theinput assumptions about the primary neutron-production processes, neutrontransport and neutron thermalisation. As a result, the predictions vary sub-stantially for the different packages [27, 12, 13, 16, 28, 29, 30, 31, 32, 15];summaries and discussions in [33, 34, 35].
The data accumulated with MINIDEX provide information on muon-induced neutron production and transport by detecting thermalised neutrons.For its first runs, MINIDEX was operated using lead as the target material.However, it was designed to provide data sets for a number of selected high-Z materials. The first data, taken from July 15 to November 25, 2015, arepresented as well a comparison with GEANT-based Monte Carlo predictions.
2

2. The experimental setup
MINIDEX was designed such that it can be operated remotely. It iscompact to fit into relatively small facilities, can be moved easily and thetarget material can be exchanged. It has to be operated underground tosuppress background from cosmogenic neutrons. As the experiment is rela-tively small, shallow sites are required to have a large enough muon flux toobtain reasonable data rates. MINIDEX was installed for its first data takingperiod, run I, in the Tubingen Shallow Underground Laboratory (TSUL) inJuly, 2015. The nominal overburden of the TSUL corresponds to ≈ 16 meterwater equivalent [36].
The detection strategy, see also Fig. 1, is:
• muons passing through the high-Z material are tagged with plasticscintillator panels;
• they interact with the high-Z target material;
• the muon-induced neutrons emerging from the high-Z volume are ther-malised in water and eventually captured by hydrogen nuclei;
• the 2.2 MeV gammas emitted after the neutron capture are identifiedby germanium detectors;
• the signal is 2.2 MeV gammas recorded within a predefined time windowafter the passage of a muon;
• the background is measured between the end of the signal window andthe passage of the next muon.
An important feature is that the background is measured by MINIDEX itselfwithout the need of any Monte Carlo calculation.
Indirect neutron detection through thermal capture in a selected isotopewith subsequent gamma ray emission is a standard technique to detect neu-trons [30, 34]. The plastic scintillator panels tagging the muons work inde-pendently from the germanium detectors identifying neutron captures. Thus,there are no inefficiencies due to time resolution, which can be a problem forexperiments using the same detectors to identify muons and neutrons.
Lead was chosen as the target material for run I as it is one of the mostcommonly used materials for high-Z shielding in deep underground experi-ments [30, 21, 18, 22].
3

Figure 1: Muon-induced neutrons are observed indirectly through capture inwater with subsequent gamma ray emission. Scintillators are used for muontagging. From [35].
2.1. Run I geometry
MINIDEX is a compact apparatus with a foot-print of 65× 75 cm2 anda height of 60.5 cm. It consists of a lead castle with outer dimensions of65× 75× 50.5 cm3. Plastic scintillator panels, 5 cm thick, exactly cover thelead surfaces at the top and the bottom of the setup. The outer view of theMINIDEX apparatus is depicted in Fig. 2(a).
A rectangular container with outer dimensions 35× 55× 30 cm3, filledwith ultra-pure water, is located inside the lead castle as shown in Figs. 2(b)and 3. This container is made of plastic (C10H8O4) and has a wall-thicknessof 1 cm. The minimum thickness of the water layer of about 9 cm was op-timized such that the probability to capture a neutron entering the watervolume is about 95 % [35].
The water container has a central hole which runs through the wholelength of the container. It is 13 cm wide and 8 cm high. Two high-puritygermanium (HPGe) detectors are placed in this hole, facing the center of thewater container.
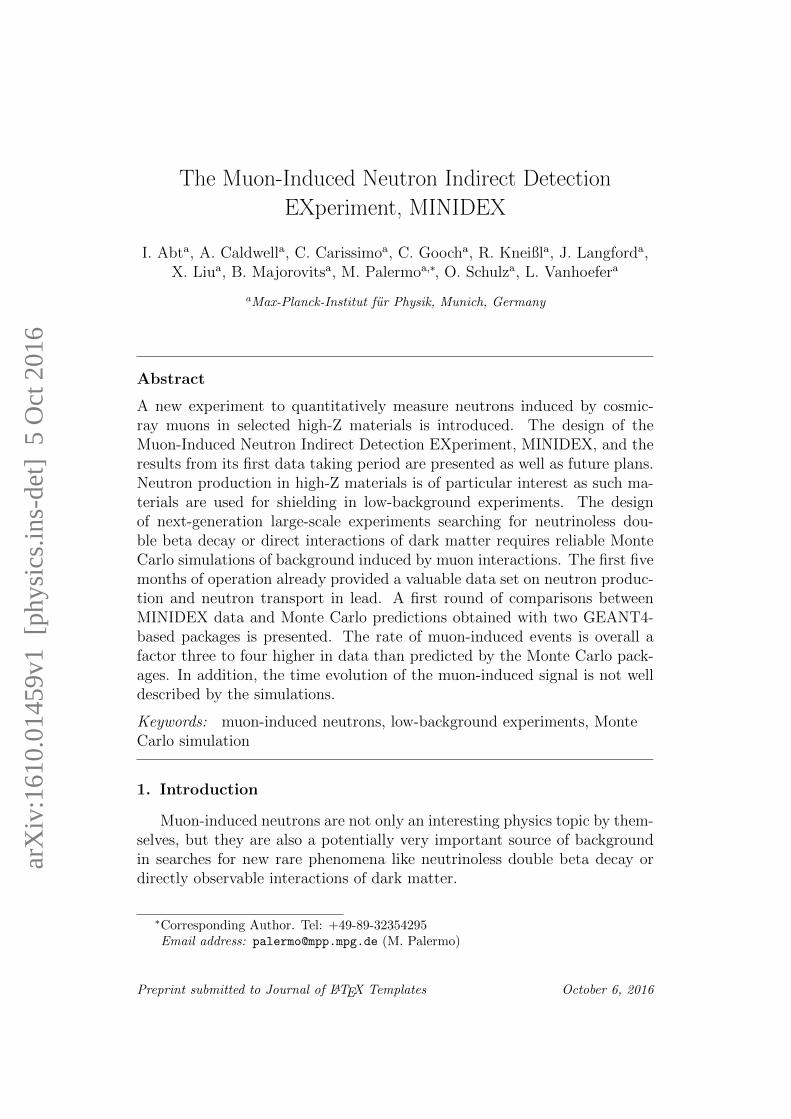
As a support for the top layer of lead, there is a 0.5 cm thick copperplate, see Fig. 4(d). This copper plate avoids any weight load on the watercontainer. Copper was chosen due to its relative low weight compared to itsstrength.
Photos of the MINIDEX setup during construction are shown in Fig. 4.
4

(a)
(b)
Figure 2: Schematic (a) of the outside of MINIDEX, (b) central cut from thetop of MINIDEX. Both adapted from [35].
(a) (b)
Figure 3: Schematic of central cuts through MINIDEX: (a) from the front,(b) from the side. Both adapted from [35].
The lead castle is placed on top of a heavy-load table (surface area of100× 150 cm2) with aluminum framing as shown in Fig. 5. The bottomscintillator, supported by an aluminum structure, is placed underneath thetable top; this is not indicated in Figs. 2 and 3. The lower shelf of the ta-ble is used for the data acquisition (DAQ) system and all electronic devicesneeded to operate MINIDEX. The complete MINIDEX run I setup is shownin Fig. 5. It was installed in the Tubingen Shallow Underground Laboratoryin less than three days.
5
(a) (b)
(c) (d)
Figure 4: (a) Partially built up lead castle with water tank being filled; (b)frontal view into MINIDEX with one germanium detector inserted from theother side; (c) view from the open top onto the two germanium detectors;(d) the setup covered by the structural copper plate before stacking the leadon top.
2.2. Physics composition of signal and background
The signal for run I was defined as 2.2 MeV gamma events recorded ina predefined time window after the passage of a muon through the top andbottom scintillators. Muons going vertically through a side-wall had energiesof at least 1.2 GeV; muons passing diagonally could have substantially lowerenergies. Events were counted as signal independently of the location ofthe muon interaction, which could not be determined in the run I geometry.Some small number of events were counted as signal even though a muononly passed one scintillator panel, because a secondary particle depositedenergy in the bottom scintillator.
6

Figure 5: The MINIDEX run I setup completely installed in the TubingenShallow Underground Laboratory. Visible are the lead castle, the top scin-tillator panel, the electrical cooling unit of one of the germanium detectorsand some electronic equipment on the lower shelf of the table.
Background are events with a 2.2 MeV gamma recorded due to
• neutrons induced by non-triggering muons;
– passing close by, but not entering the setup;
– passing only one of the scintillator panels due to geometrical rea-sons;
– being stopped in the apparatus;
• cosmogenic neutrons;
– due to the remnant cosmic neutron flux within TSUL;
• neutrons from natural radioactivity;
– from fission;
– from (α,n)-reactions.
2.3. Detectors
The MINIDEX run I setup requires only four detectors to be read out:two plastic scintillator panels and two HPGe detectors.
The two scintillator panels for run I, produced by Saint-Gobain Crys-tals [37], were made of BC-408 (Polyvinyltoluene, C10H11) with a density of
7

1.032 g/cm3. The wavelength of maximum emission was ≈ 425 nm. Both thephotomultiplier tubes (PMT) and the PMT HV bases (model HV2520AN)were embedded inside the panel volumes and no wavelength shifters wereused to collect the light of the scintillators onto the PMT photocathodes.The PMTs had a diameter of 30 mm and were produced by ET Enter-prises [38](model 9900B). The active diameter was 25 mm and the spectralrange was 280 nm to 680 nm, with a peak quantum efficiency of 26 % ataround 400 nm. Sensitive PMT sidewalls allowed for wide-angle light detec-tion. The tube housing the multiplication dynodes was ≈ 9 cm long.
The novel approach of having the PMTs incorporated in the scintillatorpanels was chosen as it is particularly space saving. However, the panelsproved to be not fully efficient over the whole surface area. The top andbottom panels were efficient to 86.53± 0.10 and 92.69± 0.15 %, respectively 1.The data were corrected for these inefficiencies in the analysis.
The two HPGe detectors used are commercial Extended Range (XtRa)coaxial germanium detectors, produced by CANBERRA [39]. Their nominalenergy resolution is ≈ 2 keV at 1.3 MeV. These detectors are manufacturedfrom cylindrical germanium crystals with radii of 3.5 cm, lengths of ≈ 7 cmand central bore holes with a length of 4.5 cm. The crystals are housedin cylindrical vacuum chambers made of aluminum. The detectors are inthermal contact with copper cooling fingers which extend beyond the leadcastle to the electrical cooling units, see Figs. 3(b) and 5. Having electro-cooled germanium detectors makes MINIDEX an almost maintenance-freesetup.
1These efficiencies were unexpectedly low. They cannot be explained by the geometricaleffects due to the embedding of the PMTS. The PMT sidewalls were probably less sensitivethan expected. A detailed investigation revealed that the PMTs were not properly opti-cally coupled. The panels were replaced by Saint-Gobain and exchanged for conventionalpanels with external PMTs after run I.
8
2.4. DAQ and Electronics
The DAQ system employed for MINIDEX is a 16-channel VME digitizercard, SIS3316-DT, produced by Struck Innovative Systems [40]. Each chan-nel can be used independently from the others with a 250 MHz samplingrate. All channels are equipped with a 14-bit resolution ADC and run indouble bank mode to avoid dead time. The time information is distributedto the channels via an internal clock.
All detector signals from MINIDEX are recorded independently with-out a shared trigger. Data are written to and stored in a server (sys-Gen/Supermicro SYS-5018D-MTF [41]) which is placed directly next to theDAQ on the lower shelf of the supporting table.
A two-channel HV power supply (iseg NHQ 206L) provides the high volt-age for the HPGe detectors. Low voltage supplies support the preampli-fiers of the germanium detectors and the scintillator panels. The whole sys-tem is being controlled remotely through a router, which provides access toevery single device. To prevent damage to the germanium detectors frompower cuts and to generally protect the system from noise due to the powerline, MINIDEX is operated behind an uninterruptible power supply (OnlineXSR3000 PSU).
2.5. Online Monitoring and Detector Performance
The MINIDEX apparatus is continuously monitored during operation.The energy spectra of the scintillators and the HPGe detectors are recordedand the data quality is constantly evaluated through the energy resolutionof both HPGe detectors at 1460 keV (40K line). Also recorded are the tem-perature of the water and its level inside the tank.
Figure 6 demonstrates the stability of the energy resolution of 2.2 keV at1460 keV for the sum of the energy spectra of the two germanium detectors.Each point represents approximately two hours of data taking.
The temperature of the water was measured with a PT100 [42] tempera-ture sensor placed inside the water tank. To measure the water level insidethe tank, MINIDEX was equipped with a liquid-level sensor probe producedby Vegetronix [43]. The stability of both temperature and water level isdemonstrated in Fig. 7. They vary only very little and the change in level iscompatible with the expansion of the water due to temperature shifts. Thus,the mass of the water was constant; there were no leaks over the whole datataking period.
9
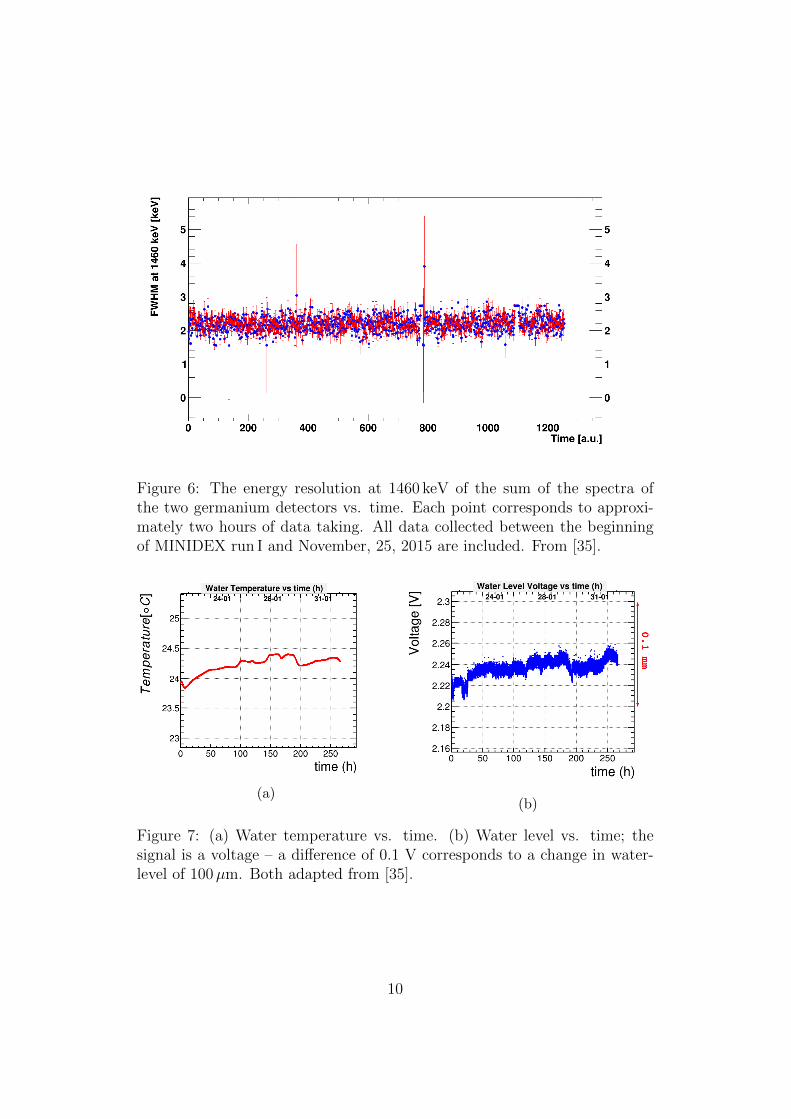
Figure 6: The energy resolution at 1460 keV of the sum of the spectra ofthe two germanium detectors vs. time. Each point corresponds to approxi-mately two hours of data taking. All data collected between the beginningof MINIDEX run I and November, 25, 2015 are included. From [35].
(a)(b)
Figure 7: (a) Water temperature vs. time. (b) Water level vs. time; thesignal is a voltage – a difference of 0.1 V corresponds to a change in water-level of 100µm. Both adapted from [35].
10

3. Run I
Run I started on July 15, 2015, and the setup was operated in a stableconfiguration until January 19, 2016. The data taken until November 25,2015 were included in the first analysis. They represent a run-time of 9.8 ×10⁶ s (114.4 days). This relates to an up-time of 86 % 2.
3.1. Offline trigger definition
The trigger for run I requires a muon passing through both the top andthe bottom scintillator panels. Such muons are identified through signals inboth panels within a time window to be determined. The signals from thetop and bottom scintillators are recorded independently at times denotedTtop and Tbot, respectively. The distribution of the time difference Ttop −Tbot
is shown in Fig. 8. A very significant peak characterises the coincidencesassociated with the passage of muons. The width of the peak is related totime jitter. The trigger window chosen was [−40; +20] ns. For each triggeredevent, Ttop was taken as the time of the passage of the muon, Ttrig. No cuton the light observed in each panel was applied 3.
Approximately 108 triggers were identified, corresponding to a trigger rateof ≈ 10 Hz. The individual total count rates of the scintillator panels wereRtop = 49.3 Hz and Rbot = 46.8 Hz, respectively. Given the width of thecoincidence window of ∆Tcoinc = 60 ns, the corresponding accidental triggerrate of ≈ 3 × 10⁻⁴ Hz only produces a negligible contamination of the trig-gered events. Outside the trigger window, an excess of events with negativeTtop − Tbot was observed. This is due to muons only passing through the topscintillator and secondary particles depositing energy in the bottom scintilla-tor. For muons only passing through the bottom scintillator, it is less likelythat secondary particles reach the top scintillator.
3.2. Definition of signal window
The data recorded for the two HPGe detectors are divided into two timewindows after each trigger:
• INSIDE : events recorded within a time window ∆Twin;
• OUTSIDE : events recorded between the end of ∆Twin and the arrivalof the next trigger.
2The down-time was caused by the infant mortality of HV supplies for the scintillators.3As the spectra of the panels did not show a good separation between single hits and
coincidences, this was unavoidable.
11

Figure 8: Distribution of the time difference Ttop−Tbot. The value of a givenTtop is compared to the previous and all following Tbot until a new Ttop isrecorded. The lightly shaded area around the pronounced peak correspondsto the trigger window. From [35].
The value of ∆Twin is not fixed, i.e. the analysis is performed for multiple∆Twin to study the time evolution of the signal. Simulations performed forthe design studies predicted that the time distribution of the muon-induced2.2 MeV gammas seen by the germanium detectors would not extend signifi-cantly beyond 1 ms after the occurrence of a trigger. Thus, the average timebetween triggers of ≈ 100 ms is large enough to not affect the full collectionof the signal.
With large enough ∆Twin, the inside window fully contains the signal plusbackground while the corresponding outside window only contains eventsrelated to background. Thus, the background is measured in parallel to thesignal. This procedure is illustrated in Fig. 9.
3.3. The germanium detector signal
The calibrated spectra of the germanium detectors were summed up forthe inside and outside windows. Figure 10 shows the result for ∆Twin = 4 ms.Also shown in Fig. 10 are fits with a Gaussian plus a first order polynomial.The resolution of the 2.2 MeV peak is 2.8 keV FWHM. The contribution ofneutron induced 2.2 MeV gammas is measured over a much larger time forthe background than for the signal and thus, to a much higher precision.This is important for background subtraction.
The numbers of neutron-induced events, Npeakinside and Npeak
outside, were
12

Figure 9: Sketch illustrating the analysis strategy adopted for MINIDEXrun I. When ∆Twin is big enough, the outside window contains only back-ground (Bkg.) events. The inside window contains also the full signal(S).From [35].
evaluated from fits as shown in Fig 10. To evaluate the systematic uncertaintyon the result of the extraction, a method based on side-bands around a regionof interest of 2.223 MeV± 5 keV was used [35]. Any difference between themethods was taken as a symmetric systematic uncertainty and added inquadrature to the statistical uncertainty. The systematic uncertainties arein general much smaller than the statistical uncertainties. They are onlysignificant for very small ∆Twin. Unless otherwise stated, total uncertaintiesare quoted.
3.4. Evaluation of signal and background rates
The signal is determined through the rate of 2.2 MeV gammas recordedin the predefined time window after a muon trigger. The effective run-timesaccumulated in the signal window, ETinside, and the background window ,EToutside, are defined as
ETinside = Ntrig · ∆Twin , (1)
EToutside = RT − ETinside , (2)
13
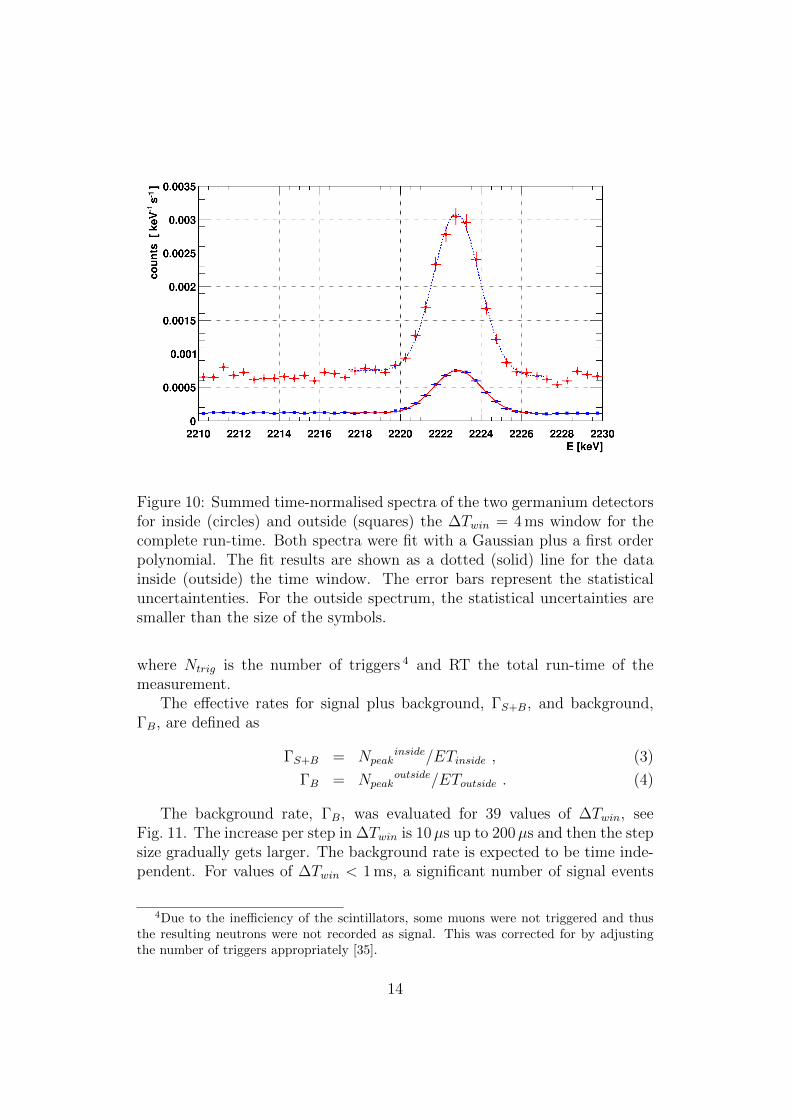
Figure 10: Summed time-normalised spectra of the two germanium detectorsfor inside (circles) and outside (squares) the ∆Twin = 4 ms window for thecomplete run-time. Both spectra were fit with a Gaussian plus a first orderpolynomial. The fit results are shown as a dotted (solid) line for the datainside (outside) the time window. The error bars represent the statisticaluncertaintenties. For the outside spectrum, the statistical uncertainties aresmaller than the size of the symbols.
where Ntrig is the number of triggers 4 and RT the total run-time of themeasurement.
The effective rates for signal plus background, ΓS+B, and background,ΓB, are defined as
ΓS+B = Npeakinside/ETinside , (3)
ΓB = Npeakoutside/EToutside . (4)
The background rate, ΓB, was evaluated for 39 values of ∆Twin, seeFig. 11. The increase per step in ∆Twin is 10µs up to 200µs and then the stepsize gradually gets larger. The background rate is expected to be time inde-pendent. For values of ∆Twin < 1 ms, a significant number of signal events
4Due to the inefficiency of the scintillators, some muons were not triggered and thusthe resulting neutrons were not recorded as signal. This was corrected for by adjustingthe number of triggers appropriately [35].
14

Figure 11: The effective rate, ΓB, of events observed in the outside window.The inner error bars represent the statistical uncertainties, the outer barsrepresent the statistical and the systematic uncertainties added in quadra-ture. The statistical uncertainties dominate such that the outer error barsare almost invisible. The entries are highly correlated as the events for eachwindow also contain the events in the smaller time windows.
are “leaking” into the background window. As expected, the rate flattensout at ∆Twin values of around 1 ms. To determine the overall backgroundrate, RB, safely, ∆Twin should be larger than 1 ms. A value of ∆Twin = 4 mswas chosen and RB determined to be RB = (1.84 ± 0.02) × 10−3 Hz. Theeffective signal rate, RS, for all predefined signal windows was calculated as
RS = ΓS+B −RB . (5)
3.5. Time evolution of the signal
Figure 12 shows the time evolution of the signal, Npeakinside, accumulated
in the 2.2 MeV peak in the gamma spectrum with growing ∆Twin on a lineartime scale. The values of Npeak
inside are correlated, since any ∆Twin windowcontains all the events already recorded in the smaller time windows. Thelinear fit to the histogram for ∆Twin ≥ 2 ms confirms a flat background rate.The intercept with the y-axis provides the total number of 2.2 MeV gammasthat can be attributed to the signal.
The time evolution of the background-subtracted signal rate, RS, is shownin Fig. 13 on the exponential time scale also used for the visualisation of the
15
Figure 12: Number of events,Npeakinside, accumulated vs. ∆Twin. A linear
fit, represented by a solid line, was performed for ∆Twin ≥ 2 ms. The ex-trapolation to ∆Twin = 0 is shown as a dotted line. Error bars represent theuncertainties of the fit to the 2.2 MeV peak in the gamma spectra.
background rate in Fig. 11. The effective rates are the highest for ∆Twinbetween 20µs and 100µs. The rates then drop, which is equivalent to adecreasing number of signal events added per unit time. Beyond 1 ms, nonew signal events are recorded and thus the effective rate drops due to thelarger windows considered. Clearly, ∆Twin up to 1 ms can be chosen for allstudies of the signal. The signal-to-background ratios, ρS/B = RS/RB, forsuch windows are shown to be above 15 in Fig. 14. For ∆Twin between 20µsand 100µs, ρS/B reaches values of up to 60.
16
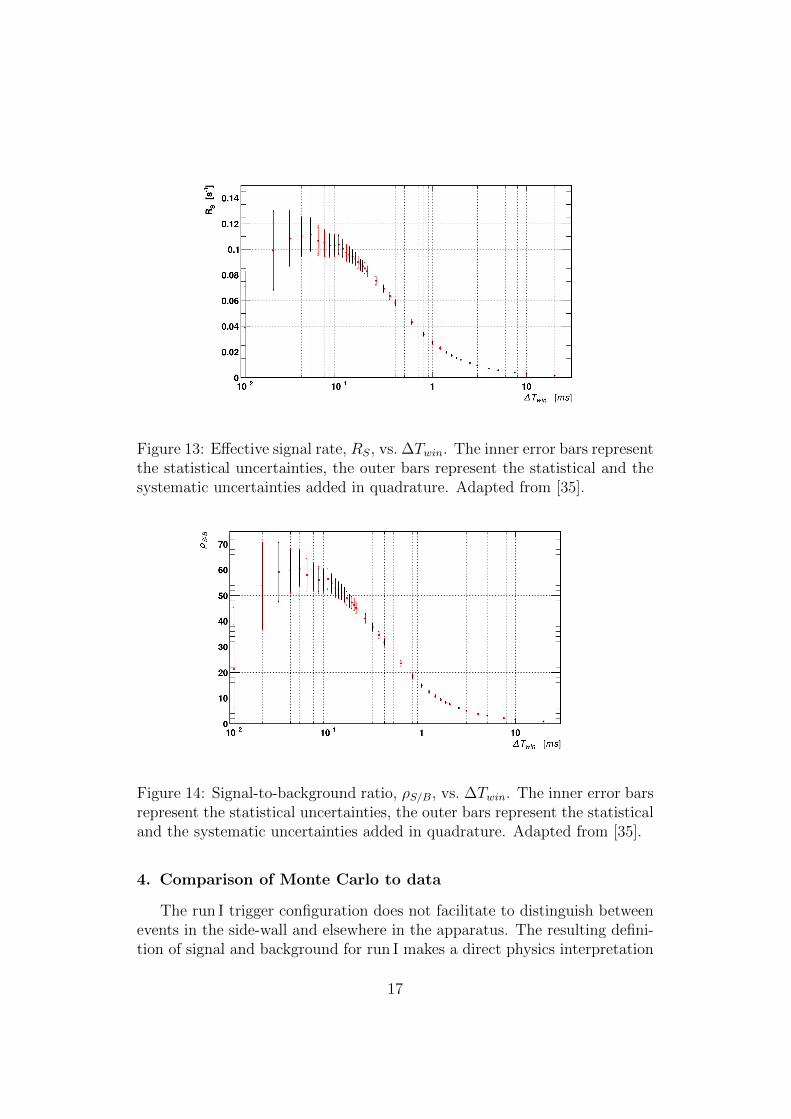
Figure 13: Effective signal rate, RS, vs. ∆Twin. The inner error bars representthe statistical uncertainties, the outer bars represent the statistical and thesystematic uncertainties added in quadrature. Adapted from [35].
Figure 14: Signal-to-background ratio, ρS/B, vs. ∆Twin. The inner error barsrepresent the statistical uncertainties, the outer bars represent the statisticaland the systematic uncertainties added in quadrature. Adapted from [35].
4. Comparison of Monte Carlo to data
The run I trigger configuration does not facilitate to distinguish betweenevents in the side-wall and elsewhere in the apparatus. The resulting defini-tion of signal and background for run I makes a direct physics interpretation
17
of the data in terms of the neutron production rate in lead difficult. However,the data can be compared to Monte Carlo predictions.
Figure 15: Effective MC rate, ΓMCB , see Eq. 4, vs. ∆Twin for the physics lists
default and shielding.
The simulations were performed within the Monte Carlo (MC) frameworkMaGe [44], jointly developed by the GERDA [45] and MAJORANA [21]collaborations. Two different “physics lists” were used:
• default as recommended by the MaGe developers;
• shielding as recommended by the GEANT4 collaboration [46].
These two physics lists differ mainly on the production of neutrons in the pri-mary interaction of the muon and in secondary hadronic interactions. Theyare basically identical on neutron transport.
A simplified version [35] of the overburden of the TSUL, together witha detailed description of the MINIDEX run I apparatus were implementedin GEANT4 (version 9.6.4 [47]). The cosmic muon [48] and neutron [49]spectra were used as input; both, muons and neutrons were tracked into theexperimental volume, where their interactions were simulated.
The energy resolution of the HPGe detectors was taken into account bysmearing all energies according to a Gaussian distribution with a constantstandard deviation of 1.6 keV. This value corresponds to a FWHM of ≈2.8 keV as measured for the peak at 2.2 MeV. Since all the comparisons ofMC to data only refer to the region around 2.2 MeV, the simplification of aconstant resolution is justified.
18

The background components due to cosmic muons and neutrons weresimulated together with the signal. The background contribution from cosmicneutrons was found to be around one order of magnitude smaller than fromnon-triggering cosmic muons [35].
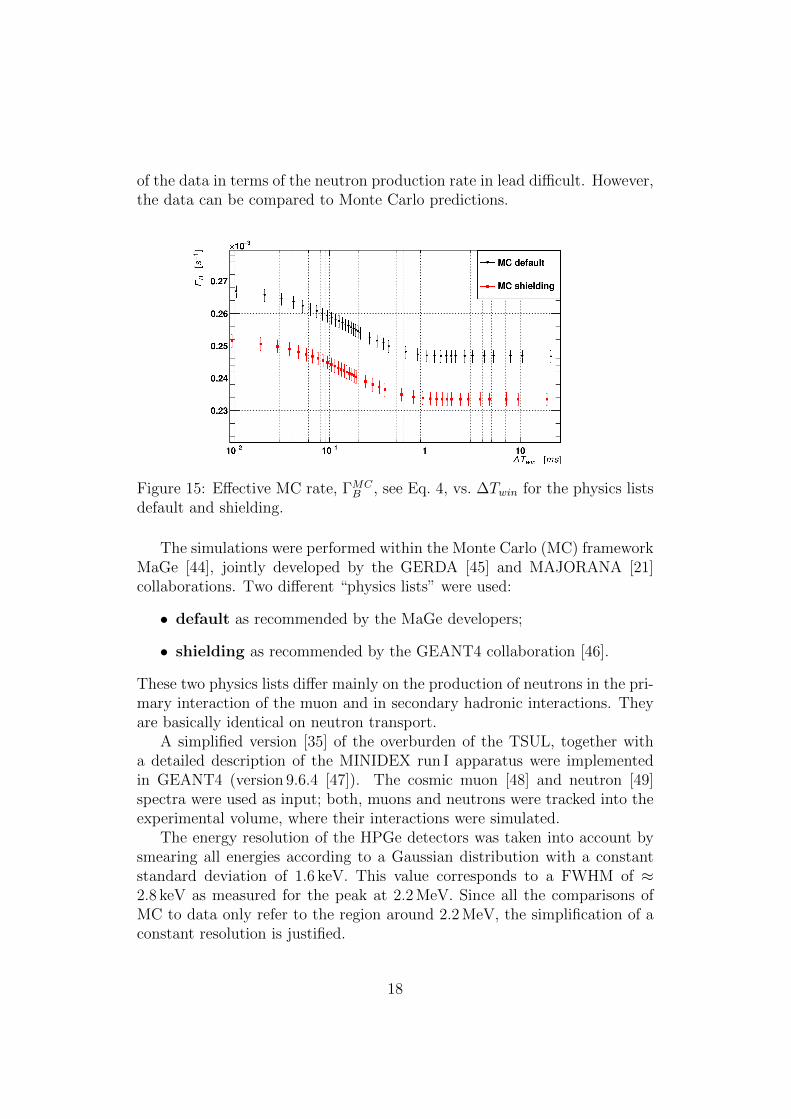
Figure 16: Comparison of the MC predictions from the two physics lists forRS to data. The points are horizontally displaced for better visibility. Theerror bars represent the total uncertainties, which are highly correlated.
The analysis of the MC data was performed exactly as for data withequivalent definitions for ΓMC
B , RMCS . Figure 15 shows the time evolution of
the rate ΓMCB vs. ∆Twin. The background contribution has already flattened
out at 1 ms where the influence of the signal ends. This is slightly earlierthan observed for the data, see Fig. 11. The prediction for ΓMC
B from thedefault list is about 5 % higher than from the shielding list for ∆Twin > 1 ms.
The component due to natural radioactivity was not included in the sim-ulation. This creates a large discrepancy in the absolute background ratebetween the MC and data. The background measured with ∆Twin = 4 msis more than a factor of seven higher in the data than predicted for the cos-mogenic contribution alone. This shows, that the background due to naturalradioactivity is dominating in the data.
The background-subtracted signal rate RS, see Eq. 5, allows a direct com-parison of Monte Carlo predictions to data. This is shown in Fig. 16. Bothphysics lists predict significantly smaller signals than observed. Table 1 lists
19

RS for ∆Twin = 4 ms as measured and predicted by the two MC versions.The data exceed the predictions from the MaGe default (GEANT shield-ing) Monte Carlo by a factor of 3.3 (4.1). The MaGe default list predicts astrong prompt signal, not observed in the data while the GEANT shieldinglist qualitatively describes the time evolution reasonably well.
Effective Signal Rate RS for
Data (7.0 ± 0.2) 10−3 Hz
GEANT with “MaGe default” list (2.1 ± 0.1) 10−3 Hz
GEANT with “GEANT shielding” list (1.7 ± 0.1) 10−3 Hz
Table 1: Effective signal rate, RS, for ∆Twin = 4 ms for data and the twoMCs.
Another approach is to compare the MC to data before background sub-traction. The muon-induced components of the MC predictions are separatedout by fitting the MC predictions to the data for each ∆Twin:
(ΓS+B)i = Ai · [ (Γinsidetr−µ )MCi + ΓMC
ntr−µ ] + Bi · ΓMCneutrons (6)
RB = Ai · ΓMCntr−µ + Bi · ΓMC
neutrons (7)
where:
• the index i is the ascending index for the different ∆Twin;
• Ai and Bi are the fit parameters for window i. Ai represent the factorsby which the muon-induced components are scaled to fit the data. Bi
represent the factors by which the background due to cosmic neutronsis scaled to account for the non-simulated background due to naturalradioactivity;
• (ΓS+B)i is the measured ΓS+B for window i;
• RB is the measured background rate;
• (Γinsidetr−µ )MCi is the simulated effective signal rate due to triggered muons
for window i;
• ΓMCntr−µ is the simulated background rate due to non-triggered muons;
• ΓMCneutrons is the simulated background rate due to cosmic neutrons.
20
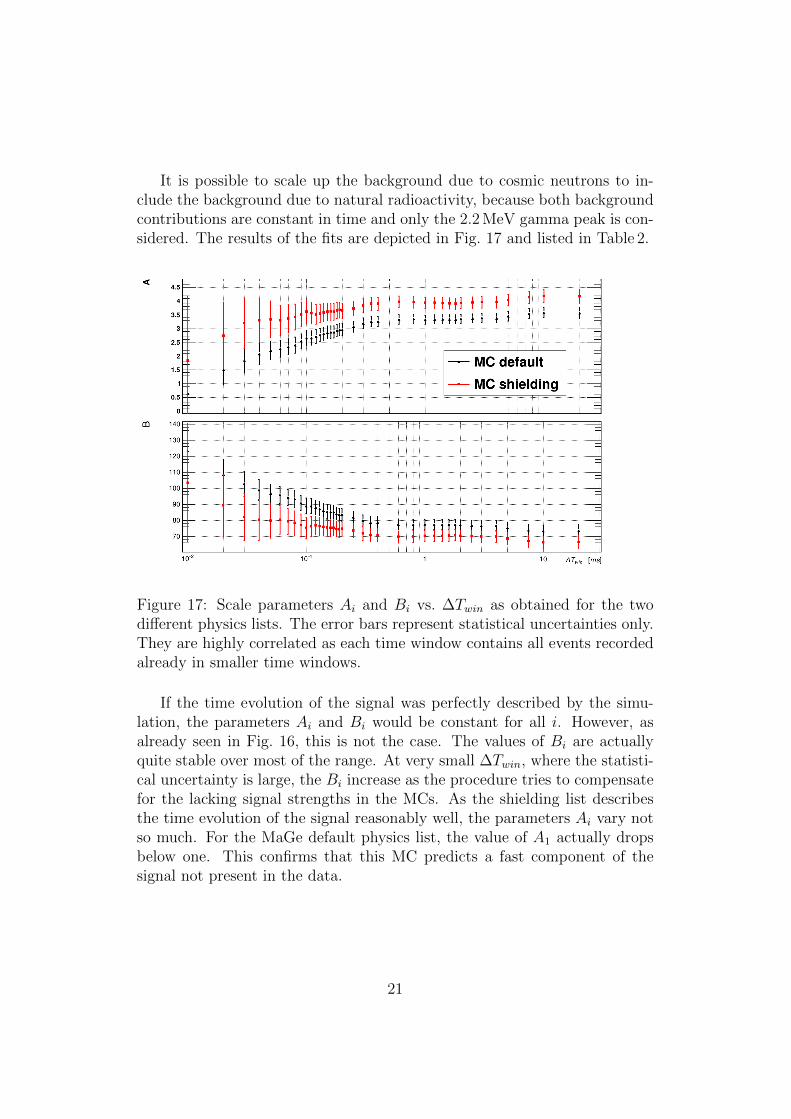
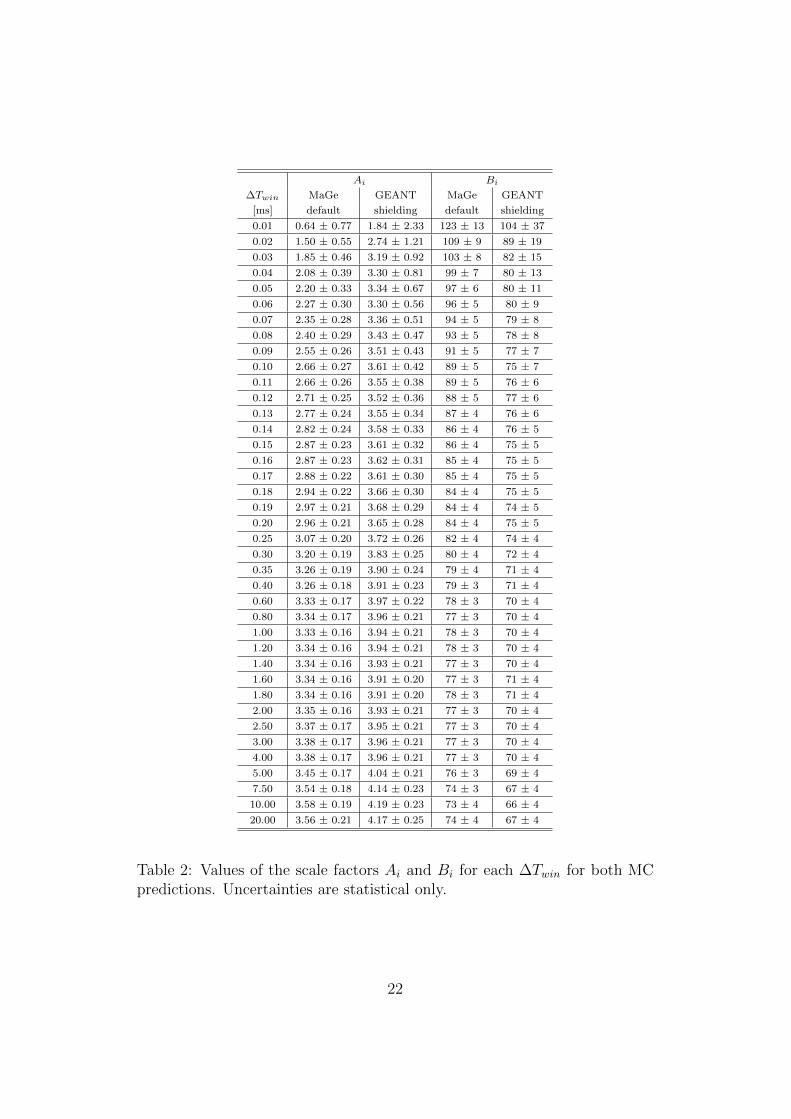
It is possible to scale up the background due to cosmic neutrons to in-clude the background due to natural radioactivity, because both backgroundcontributions are constant in time and only the 2.2 MeV gamma peak is con-sidered. The results of the fits are depicted in Fig. 17 and listed in Table 2.
Figure 17: Scale parameters Ai and Bi vs. ∆Twin as obtained for the twodifferent physics lists. The error bars represent statistical uncertainties only.They are highly correlated as each time window contains all events recordedalready in smaller time windows.
If the time evolution of the signal was perfectly described by the simu-lation, the parameters Ai and Bi would be constant for all i. However, asalready seen in Fig. 16, this is not the case. The values of Bi are actuallyquite stable over most of the range. At very small ∆Twin, where the statisti-cal uncertainty is large, the Bi increase as the procedure tries to compensatefor the lacking signal strengths in the MCs. As the shielding list describesthe time evolution of the signal reasonably well, the parameters Ai vary notso much. For the MaGe default physics list, the value of A1 actually dropsbelow one. This confirms that this MC predicts a fast component of thesignal not present in the data.
21
Ai Bi
∆Twin MaGe GEANT MaGe GEANT
[ms] default shielding default shielding
0.01 0.64 ± 0.77 1.84 ± 2.33 123 ± 13 104 ± 37
0.02 1.50 ± 0.55 2.74 ± 1.21 109 ± 9 89 ± 19
0.03 1.85 ± 0.46 3.19 ± 0.92 103 ± 8 82 ± 15
0.04 2.08 ± 0.39 3.30 ± 0.81 99 ± 7 80 ± 13
0.05 2.20 ± 0.33 3.34 ± 0.67 97 ± 6 80 ± 11
0.06 2.27 ± 0.30 3.30 ± 0.56 96 ± 5 80 ± 9
0.07 2.35 ± 0.28 3.36 ± 0.51 94 ± 5 79 ± 8
0.08 2.40 ± 0.29 3.43 ± 0.47 93 ± 5 78 ± 8
0.09 2.55 ± 0.26 3.51 ± 0.43 91 ± 5 77 ± 7
0.10 2.66 ± 0.27 3.61 ± 0.42 89 ± 5 75 ± 7
0.11 2.66 ± 0.26 3.55 ± 0.38 89 ± 5 76 ± 6
0.12 2.71 ± 0.25 3.52 ± 0.36 88 ± 5 77 ± 6
0.13 2.77 ± 0.24 3.55 ± 0.34 87 ± 4 76 ± 6
0.14 2.82 ± 0.24 3.58 ± 0.33 86 ± 4 76 ± 5
0.15 2.87 ± 0.23 3.61 ± 0.32 86 ± 4 75 ± 5
0.16 2.87 ± 0.23 3.62 ± 0.31 85 ± 4 75 ± 5
0.17 2.88 ± 0.22 3.61 ± 0.30 85 ± 4 75 ± 5
0.18 2.94 ± 0.22 3.66 ± 0.30 84 ± 4 75 ± 5
0.19 2.97 ± 0.21 3.68 ± 0.29 84 ± 4 74 ± 5
0.20 2.96 ± 0.21 3.65 ± 0.28 84 ± 4 75 ± 5
0.25 3.07 ± 0.20 3.72 ± 0.26 82 ± 4 74 ± 4
0.30 3.20 ± 0.19 3.83 ± 0.25 80 ± 4 72 ± 4
0.35 3.26 ± 0.19 3.90 ± 0.24 79 ± 4 71 ± 4
0.40 3.26 ± 0.18 3.91 ± 0.23 79 ± 3 71 ± 4
0.60 3.33 ± 0.17 3.97 ± 0.22 78 ± 3 70 ± 4
0.80 3.34 ± 0.17 3.96 ± 0.21 77 ± 3 70 ± 4
1.00 3.33 ± 0.16 3.94 ± 0.21 78 ± 3 70 ± 4
1.20 3.34 ± 0.16 3.94 ± 0.21 78 ± 3 70 ± 4
1.40 3.34 ± 0.16 3.93 ± 0.21 77 ± 3 70 ± 4
1.60 3.34 ± 0.16 3.91 ± 0.20 77 ± 3 71 ± 4
1.80 3.34 ± 0.16 3.91 ± 0.20 78 ± 3 71 ± 4
2.00 3.35 ± 0.16 3.93 ± 0.21 77 ± 3 70 ± 4
2.50 3.37 ± 0.17 3.95 ± 0.21 77 ± 3 70 ± 4
3.00 3.38 ± 0.17 3.96 ± 0.21 77 ± 3 70 ± 4
4.00 3.38 ± 0.17 3.96 ± 0.21 77 ± 3 70 ± 4
5.00 3.45 ± 0.17 4.04 ± 0.21 76 ± 3 69 ± 4
7.50 3.54 ± 0.18 4.14 ± 0.23 74 ± 3 67 ± 4
10.00 3.58 ± 0.19 4.19 ± 0.23 73 ± 4 66 ± 4
20.00 3.56 ± 0.21 4.17 ± 0.25 74 ± 4 67 ± 4
Table 2: Values of the scale factors Ai and Bi for each ∆Twin for both MCpredictions. Uncertainties are statistical only.
22

5. Summary and Outlook
A new experiment to measure the production of neutrons by cosmicmuons, MINIDEX, was introduced. It is a compact apparatus, easy to moveto different locations, almost maintenance free and operated remotely. Neu-trons are detected after thermalisation through 2.2 MeV gammas emittedafter their capture by the hydrogen in water. Thus, MINIDEX measuresneutrons without an energy threshold. The signal and the background aremeasured simultaneously, allowing the extraction of the signal and its timeevolution without major assumptions or Monte Carlo simulations.
The results of the first run of MINIDEX with lead as the target mate-rial and at a depth of about 16 meter water equivalent were presented. Aclear signal was observed with signal-to-background ratios above 15 for thecomplete development of the signal over one millisecond. The results werecompared to GEANT 4 based Monte Carlo simulations using the so called“MaGe default” and “GEANT shielding” physics lists. Both lists led topredictions that underestimate the integrated signal strength significantly.The data show an overall production of muon-induced 2.2 MeV gammas afactor of 3.3 (4.1) higher than predicted using the MaGe default (GEANT 4shielding) list. While the shielding list does not describe the overall signalstrength as well as the MaGe default list it qualitatively describes the timeevolution better. In particular, the MaGe default list predicts a promptsignal component not observed in the data.
During its first data taking period, MINIDEX ran with a very simplemuon trigger. In January 2016, the setup was upgraded to allow for the iden-tification of different event topologies. Especially, muons can be identifiedthat pass vertically and only through the selected high-Z material. Differentevent topologies should also provide some handle to disentangle the primaryneutron production rate from the influence of neutron transport.
At the end of 2016, a switch to copper as the target material is fore-seen. The data is expected to be available as input to the design phase ofthe next-generation large-scale low-background experiments currently envi-sioned, where lead and copper are discussed as shielding materials. Duringthe following years, MINIDEX will explore the neutron production due tocosmic muons in a variety of high-Z materials. In addition, the dependenceon the muon energy can be probed by moving MINIDEX to different depths.
6. Acknowledgments
We would like to thank the technical department of the Max-Planck-Institut fur Physik for their strong support. We would also like to thank the
23
Universitat Tubingen for the space in TSUL, especially Peter Grabmaier andIgor Usherov for their hospitality and help.
Bibliography:
References
[1] O.C. Allkofer and R.D. Andresen, Nucl. Phys. B 8, 402 (1968)
[2] M. Aglietta et al., Nuovo Cimento Soc. Ital. Fis., C 12, 467 (1989)
[3] M. Aglietta et al., in Proceedings of the 26th International Cosmic RayConference, Salt Lake City, 1999, edited by D. Kieda, M. Salamon, andB. Dingus, Vol. 2, p. 44, hep-ex/9905047
[4] R. Hertenberger, M. Chen, and B.L. Dougherty, Phys. Rev. C 52, 3449(1995)
[5] F. Boehm et al., Neutron production by cosmic-ray muons at shallowdepth, Phys. Rev. D 62, 092005 (2000)
[6] J. Rapp, Ph.D. thesis, University of Karlsruhe, 1996
[7] T. Langford et al., Fast neutron detection with a segmented spectrometer,Nucl. Instrum. Meth. A 771 (2015), 78-87
[8] J. Delorme et al., Phys. Rev. C 52, 2222 (1995)
[9] O.G. Ryazhskaya and G.T. Zatsepin, Izv. Akad. Nauk SSSR, Ser. Fiz.29, 1946 (1965); in Proceedings of the IX International Conference onCosmic Rays, London, 1965, Vol. 21, p.987
[10] J.C. Barton, in Proceedings of the 19th International Conference onCosmic Rays, La Jolla, 1985, edited by F. C. Jones Physical Society,London, 1985), p. 98.
[11] D.H. Perkins, Calculation of neutron background in Soudan 1990.
[12] D.-M. Mei and A. Hime, Muon-Induced Background Study for Under-ground Laboratories, Phys. Rev. D 73, (2006) 053004
[13] H. M. Araujo et al., Nucl. Instrum. Meth. A 545 (2005), 398.
[14] J. A. Formaggio and C. J. Martoff, Backgrounds to Sensitive Experi-ments Underground, Annu. Rev. Nucl. Part. Sci. 54, 361 (2004)
24

[15] H. Wulandari et al., Neutron Background Studies for the CRESST DarkMatter Experiment, hep-ex/0401032
[16] A. Empl et al, A Fluka study of underground cosmogenic neutron pro-duction, JCAP08 (2014) 064
[17] A. Gando et al, KamLAND-Zen Collaboration, Phys. Rev. Lett. 110,062502 (2013)
[18] J. B. Albert et al., EXO Collaboration, Nature 510, (2014) 229
[19] M. Agostini et al., GERDA Collaboration, Results on NeutrinolessDouble-β Decay of 76Ge from Phase I of the GERDA Experiment, Phys.Rev. Lett 111 (2013) 122503
[20] M. Agostini, First results from GERDA Phase II, (2016), Presentationat NEUTRINO2016, London, United Kingdom
[21] The Majorana Collaboration, Phys. of Atom. Nucl. Vol. 67, Issue 11 ,pp 2002-2010, DOI: 10.1134/1.1825519
[22] The CDEX Collaboration, Front. Phys., 2013, 8(4):412-437
[23] D.S. Akerib et al, CDMS Collab., First Results from the Cryogenic DarkMatter Search in the Soudan Underground Laboratory, Phys. Rev. Lett93, 211301 (2004)
[24] R. Brun et. al, GEANT 3, CERN DD/EE/84-1, 1987
[25] Geant4 Collaboration, Nucl. Instrum. Meth. A 506 (2003), 250.
[26] A. Fasso, A. Ferrari and P.R. Sala in: Proceedings of MonteCarlo 2000Conference, (Lisbon, October 23-26, 2000), Ed. A. Kling, F. Barao, M.Nakagawa, L. Tavora, P. Vaz (Springer-Verlag, Berlin, 2001).
[27] V.A. Kudryavtsev, N.J. Spooner and J.E. McMillan, Nucl. Instrum.Meth. A 505 (2003)
[28] Y.F. Wang et al., Predicting neutron production from cosmic-ray muons,Phys. Rev. D 62, 013012 (2000)
[29] C. Zhang and D.-M. Mei, Measuring Muon-Induced Neutrons with Liq-uid Scintillation Detector at Soudane Mine, Phys. Rev. D 90, 122003
[30] L. Reichhart et al., Measuremnt and simulation of the muon-inducedneutron yield in lead, Astropart. Phys. 47 (2013) 67-76
25
[31] M. G. Marino et al., Validation of spallation neutron production andpropagation within Geant4, Nucl. Instrum. Meth. A 582 (2007), 611-620
[32] A. Lindote et al., Simulation of neutrons produced by high-energy muonsunderground, Astropart. Phys. 31 (2009), 366-375
[33] M. Horn, Simulations of the muon-induced neutron background of theEDELWEISS-II experiment for Dark Matter search, Ph.D. Thesis, In-stitut fur Experimentelle Kernphysik, Karlsruhe, 2007
[34] H. Kluck, Measurement of the cosmic-induced neutron yield at theModane underground laboratory, Ph.D. Thesis, Institut fur Experi-mentelle Kernphysik, Karlsruhe, 2013
[35] M. Palermo, The Muon-Induced Neutron Indirect Detection EXperi-ment, MINIDEX, Ph.D. Thesis, Max-Planck Institute for Physics, Mu-nich, 2016
[36] Peter Grabmaier, Universitat Tubingen, private communication
[37] http://www.crystals.saint-gobain.com, Retreived on 26-01-2016
[38] http://www.et-enterprises.com/, Retreived on 26-01-2016
[39] http://www.canberra.com/products/detectors/germanium-detectors.asp,Retreived on 27-01-2016
[40] http://www.struck.de/sis3316.html, Retreived on 27-01-2016
[41] http://www.supermicro.com/products/system/1u/5018/SYS-5018D-MTF.cfm, Retreived on 27-01-2016
[42] https://en.wikipedia.org/wiki/Resistance thermometer, Retreived on 01-02-2016
[43] http://www.vegetronix.com/Products/AquaPlumb/, Retreived on 01-02-2016
[44] M. Bauer et al., MaGe: a Monte Carlo framework for the Gerda andMajorana double beta decay experiments, J. Phys. Conf. Ser. 39, (2006)362
[45] The GERDA Collaboration, Eur. Phys. J. C 73 (2013) 2330 DOI:10.1140/epjc/s10052-013-2330-0
26

[46] http://geant4.cern.ch/support/proc mod catalog/physics lists/useCases.shtml,Retreived on 17-02-2016
[47] Geant4 9.6 Release Notes, http://geant4.cern.ch/support/ReleaseNotes4.9.6.html,Retreived 03/11/2015
[48] M. Duranti, Measurement Of The Atmospheric Muon Flux On GroundWith The AMS-02 Detector, PhD Thesis, 2011
[49] Gordon et al, Measurement of the Flux and Energy Spectrum of Cosmic-Ray Induced Neutrons on the Ground,IEEE Transactions on Nucl. Sci.,Vol. 51, No. 6, December 2004
27