maximize value
DESCRIPTION
Maximize Value. How to get HIGH EFFICIENCY UTILITY SYSTEMS by using LOW EFFICIENCY COMPONENTS. Presentation Format. Presented by- Randall E. Witte, CEM [email protected] President, Emc 2 ConServ, Inc. (Consultants specializing in utility cost reduction and environmental benefits) - PowerPoint PPT PresentationTRANSCRIPT

Maximize Value
How to get
HIGH EFFICIENCY UTILITY SYSTEMS
by using
LOW EFFICIENCY COMPONENTS
Presentation FormatPresented by-
Randall E. Witte, CEM [email protected] President, Emc2 ConServ, Inc. (Consultants specializing in utility cost reduction and environmental benefits) 1st Place, ASHRAE Industrial Energy AwardsSoon-to-be Six-Sigma Black Belt
This program is to help you examine the ideas you likely have about cutting utility costs, improving reliability and reducing environmental impact.Many techniques will be discussed, but this is NOT a typical “how-to-do" presentation. It is intended to guide you on “HOW-TO-THINK”.

Presentation Format Business needs How did we get here? Alternative approaches available What does the FUTURE hold? Government & Industry response High Performance Buildings and Integrated Utilities Paradigm Busters Case Studies
#1- Existing Paper Manufacturing Plant #2- New School Construction #3- Large Office HVAC Upgrade #4- Commercial Laundry Plant Concept
Wrap-up Questions and Comments

BUSINESS NEEDS & WANTS (Why we are all HERE today!)
Virtually all organizations have similar needs-
Access to Reliable Energy High Quality Energy Sources and Supplies Stable Energy Prices (preferably cheaper) Environmentally-Friendly Utility Systems Low-Maintenance Utility Systems High Reliability Utility Systems
Unfortunately, they often run into the worst of all possible conditions-

The REAL WORLDThe REAL WORLDAs utility users search for their As utility users search for their energy energy nirvananirvana they come face-to-face with all kinds they come face-to-face with all kinds of obstacles-of obstacles-
INTANGIBLES-INTANGIBLES- It is becoming harder to define, control, and focus on the problemIt is becoming harder to define, control, and focus on the problem
PRICE / COST-BASED SOLUTIONS-PRICE / COST-BASED SOLUTIONS- Easy to define and quantify, but they often don’t actually SOLVE the Easy to define and quantify, but they often don’t actually SOLVE the problemsproblems
MISGUIDED EFFORTS-MISGUIDED EFFORTS- Faced with high quality, efficient & inexpensive imports, the auto Faced with high quality, efficient & inexpensive imports, the auto industry focused on industry focused on priceprice because they didn’t realize that lower cost because they didn’t realize that lower cost was the was the by-productby-product of the quality and efficiency. of the quality and efficiency.

How Did We Get Here? How Did We Get Here?
Engineering services are Engineering services are considered “overhead”, considered “overhead”, so cost-control so cost-control purchasing has caused purchasing has caused ““value designvalue design” to be ” to be replaced with “replaced with “adequate adequate designdesign” effort” effort

How Did We Get Here? How Did We Get Here?
SpecialistsSpecialists are now are now focusing on efficiency focusing on efficiency for single components, for single components, or or specificspecific utility utility systems, that they systems, that they understandunderstand

How Did We Get Here? How Did We Get Here? (cont’d)(cont’d)
Purchasing decisions Purchasing decisions are made based on are made based on CAPITALCAPITAL cost without cost without concern for concern for LIFE CYCLELIFE CYCLE cost. cost. CapitalCapital cost is cost is only 8-12% of the only 8-12% of the TOTAL cost of system TOTAL cost of system ownership. ownership.

How Did We Get Here? How Did We Get Here? (cont’d)(cont’d)
Utility operating cost Utility operating cost evaluations were based evaluations were based on “past experiences” on “past experiences” or current conditions. or current conditions. Future utility costs will Future utility costs will depend on future depend on future events.events.

Utility System Cost Containment Typical Approaches & Concerns
Real Time or Time of Day Rates
Production Constraints
Energy Cost Volatility
Administrative Demands
Brokers & Negotiated Costs“Better Value” Supply Risk
Interruptible Contracts
Production Constraints
Fuel Storage Space
Additional Staff Training
Alternate Fuel ChoicesSimilar to “Interruptible”
Supply Side Approach

Utility System Cost Containment
Typical Approaches & Concerns
Utility Data ManagementAdministrative Demands
“Lean Usage” Approach Focus on Discrete Usage
“Systems” Approach“Lean”, but more thorough
Energy Management System Facility Service OnlyCan Not Support ProcessOften Over-ridden
On-Site Power GenerationAdditional Staff TrainingSpecialty MaintenanceOften Not Integrated
End-Use Approach

Problems Resulting From Using Typical Savings Approaches
LIMITED “ASSURED” SAVINGS vs. INVESTMENT COST (ACCESS TO FUNDS)
RISK OF DISRUPTIONS TO PRODUCTION
SUSCEPTIBLE TO RAPID PRICE SWINGS
SUSTAINABILITY OF SAVINGS
SUBSTANTIAL ADMINISTRATIVE DEMAND
ADVERSE INTERACTIONS OF “SOLUTIONS”
FINGER-POINTING WHEN PROBLEMS ARISE

What does the future hold?What does the future hold?
Fuel / Energy costs will continue Fuel / Energy costs will continue
to climb, driven by a variety of to climb, driven by a variety of
market and environmental market and environmental
influences- influences-
plus the fact there is a limited plus the fact there is a limited
amount of fossil fuels availableamount of fossil fuels available

The future The future (Part 2)(Part 2)
OIL-OIL- Supplier issuesSupplier issues• Several sources, but many unstableSeveral sources, but many unstable
• Any disruption causes price spikesAny disruption causes price spikes
plus driven by China’s growing plus driven by China’s growing demanddemand• Just became the #2 importerJust became the #2 importer
• Their economy is ONLY 3% of world Their economy is ONLY 3% of world GDP, growing at 10-15% annuallyGDP, growing at 10-15% annually
• Adding jobs at 8-million per yearAdding jobs at 8-million per year

The future The future (Part 3)(Part 3)
Natural Gas- Natural Gas- Tends to track “oil” Tends to track “oil” in cost per BTUin cost per BTU
• Current market conditions are Current market conditions are showing skewed pricing due to showing skewed pricing due to low summer demand and “full” low summer demand and “full” storage wellsstorage wells
• Added demand pressure coming Added demand pressure coming because it’s “clean”, and a key because it’s “clean”, and a key element in “hydrogen” economyelement in “hydrogen” economy

The future The future (Part 4)(Part 4) ELECTRICITY- ELECTRICITY- Reasonable long-term Reasonable long-term
option, but facing added costs that option, but facing added costs that must be covered in rates must be covered in rates • Major investment for stable “grid”Major investment for stable “grid”• Additional generating capacityAdditional generating capacity
• Environmental issues increase Environmental issues increase construction and operating costsconstruction and operating costs
• Nuclear is viable long-term option, Nuclear is viable long-term option, but faces significant investment, but faces significant investment, long lead times, and fuel storage.long lead times, and fuel storage.

The future The future (Part 5)(Part 5)
U.S. manufacturing (and housing) U.S. manufacturing (and housing) growth will “fuel” more domestic growth will “fuel” more domestic energy demandenergy demand
Opportunities for significant energy Opportunities for significant energy cost savings are available, but will cost savings are available, but will require conscientious effortrequire conscientious effort
Organizations that proactively plan Organizations that proactively plan to reduce consumption will be more to reduce consumption will be more successful than their competitionsuccessful than their competition

Government and Government and Industry’s Response to Industry’s Response to
the Problemthe ProblemLots of “smart” folks trying to come Lots of “smart” folks trying to come up with simple “cookbook” up with simple “cookbook” regulations to solve the problem-regulations to solve the problem-• Developed by individual industry specialistsDeveloped by individual industry specialists
• Proposed solutions are focused on energy Proposed solutions are focused on energy components they understandcomponents they understand
• ““Creativity” is allowed, but most engineers Creativity” is allowed, but most engineers (and regulators) don’t understand utility (and regulators) don’t understand utility systems and their relationshipssystems and their relationships
““K.I.S.S.” is usually NOT the K.I.S.S.” is usually NOT the bestbest solution for a complex problemsolution for a complex problem

Today’s CHALLENGE
Rule #1- Commercial and Industrial facilities are NOT residential structures.
Rule #2- Most Building and Energy Codes tend to ignore Rule #1.

Today’s SOLUTION
Optimum efficiency (& lowest costs) at a facility occur when ALL
components work together toward a common result.
There is no economic “value” gained in SPENDING MONEY to make a building more thermally and air-side “tight”, then having to SPEND MORE MONEY and MORE ENERGY to remove the trapped heat and contaminants.

Finding the right pathHow business has responded to other needs-
PRODUCT QUALITY Failure analysis, Paredo Charts, ISO 9001
PROCESS EFFECTIVENESS 6-Sigma Black Belt Analysis, Systems Re-engineering
ENVIRONMENTAL IMPACT LEED analysis, design, and operation, ISO 14001
Each “solution” requires commitment, thorough analysis, and big-picture perspective- and they
solve problems COST-EFFECTIVELY.

Achieving the GoalWinning a race at Le Mans needs a very different approach than the Indy 500 or a NASCAR event.Fewer rules on equipment assembly, parts,
or required fuel economySuccess means components are matched to
specific needs and other componentsReliability matched to peak performanceHigh Performance Building Design provides the
right solution to today’s demanding business practices and utility operating needs.

High PerformanceBuilding Design
• Incorporates INTEGRATED UTILITIES Concepts
• Designed & built based on intended results- and integrated into “PROCESS”
• Life Cycle Performance becomes prime criteria for selecting facility components
• THESE AREN’T HOUSES!

KEY CONSIDERATIONS for High Performance Building Design-
Six feet back from any exterior wall is ALWAYS interior space.
Significant heat-producing systems (like computers) are generally always “ON”
Thermopane glass and high insulation holds excess heat inside the “box”
Many buildings operate at “net positive” heat down to below freezing outside temp.

More CONSIDERATIONS for High Performance Building Design-
The Electric energy required to cool a space (remove heat) has a thermal cost ($/BTU) that is 200%-400% higher than the fuel required to add heat to a space.
Many “standard” utility system designs are not able to properly support actual space requirements because the designers did not understand all the dynamics of the building AND the occupants.

TYPICAL “CENTRAL” PLANT UTILITIES ARRANGEMENT
Each system designed for efficient, stand-alone operation
USER
USER
USER
USER
USER
USER
USER
USER
CompAir
USER
USER
USER
USER
USER
USER
USER
USER
Elect
USER
USER
USER
USER
USER
USER
USER
USER
Boiler
USER
USER
USER
USER
USER
USER
USER
USER
HVAC
USER
USER
USER
USER
USER
USER
USER
USER
Chiller

The The FACILITYFACILITY is the SYSTEM is the SYSTEM
USER
USER
USER
USER
USER
USER
USER
USER
UTILITY
• The The structurestructure, lighting, , lighting, power, compressed air, power, compressed air, heating, cooling, domestic heating, cooling, domestic water, refrigeration, sewer, water, refrigeration, sewer, fire protection, plus all of fire protection, plus all of the process loads are the process loads are ALL ALL JUST SUB-SYSTEMSJUST SUB-SYSTEMS..
• How well the sub-systems How well the sub-systems work togetherwork together determines determines how well the FACILITY will how well the FACILITY will work, and how much it will work, and how much it will cost to operate & maintain. cost to operate & maintain.
USER
USER
USER
USER
USER
USER
USER
USER
UTILITY
USER
USER
USER
USER
USER
USER
USER
USER
UTILITY
USER
USER
USER
USER
USER
USER
USER
USER
UTILITY
USER
USER
USER
USER
USER
USER
USER
USER
UTILITY
User
USER
USER
USER
USER
USER
USER
USER
UTILITY
USER
USER
USER
USER
USER
USER
USER
USER
UTILITY
USER
USER
USER
USER
USER
USER
USER
USER
UTILITY
USER
USER
USER
USER
USER
USER
USER
USER
UTILITY
USER
USER
USER
USER
USER
USER
USER
USER
UTILITY
USER
USER
USER
USER
USER
USER
USER
USER
UTILITY
USER
USER
USER
USER
USER
USER
USER
USER
UTILITY

High Performance UtilitiesHigh Performance Utilities““Integrated” utility systems- the by-product of one Integrated” utility systems- the by-product of one
component becomes the input to anothercomponent becomes the input to anotherCore components are matched to “continuous” Core components are matched to “continuous”
loads loads andand related utilities so system operates related utilities so system operates “steady-state” “steady-state”
Component “efficiency” doesn’t matter. High Component “efficiency” doesn’t matter. High Performance Utilities Performance Utilities recyclerecycle by-products by-products
Modular components allow for peak loadingModular components allow for peak loadingTOTAL component operating cost considered- TOTAL component operating cost considered-
utilities, maintenance, life expectancy, replacementutilities, maintenance, life expectancy, replacement
Because energy purchases are recycled, there Because energy purchases are recycled, there is much lower environmental (COis much lower environmental (CO22, etc.) impact, etc.) impact

High Performance Concept• Sub-systems, the process, and
the building, produce heat as a by-product of operation.
• Integrated utilities produce electricity, extract heat (with distilled water refrigerant) and reject heat to “cooling” water.
• Other sub-systems, including the process, are heat-using and can be significantly aided by the rejected utility heat put into “cooling” water or directly to the “user” device.
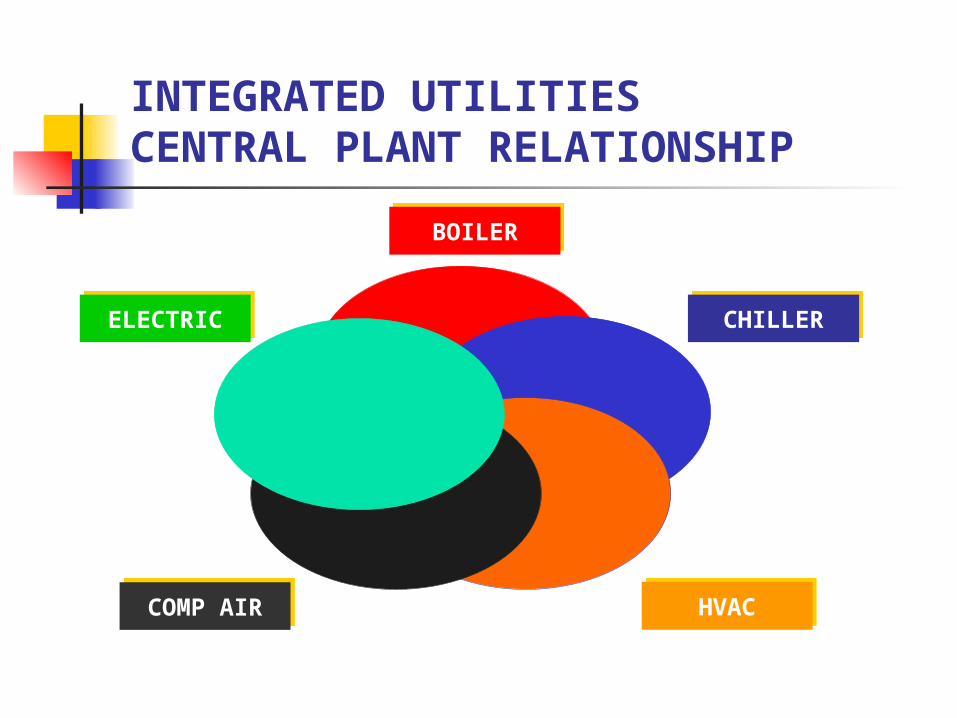
INTEGRATED UTILITIES CENTRAL PLANT RELATIONSHIP
BOILERBOILER
CHILLERCHILLER
HVACHVACCOMP AIRCOMP AIR
ELECTRICELECTRIC

Integrated Utilities are only limited by your imagination
This approach is a GENERIC solution- The value of generic solutions is their
flexibility and adaptability The previous slides have shown how
you can integrate “normal” utilities The next slides will show you (a little)
just how far this concept can go and still show significant value

Waste Water Treatment Plants(Another Integrated Utilities Application)
The size of a typical treatment plant (land area and components) is determined by- Total Peak Design Flow Contaminants to be Remediated Ambient Weather (“bug” operating ranges)
A treatment plant for a large manufacturing complex might be $2.5 M, and need 2 acres of land at -20F.
By preheating the effluent (using excess heat from the plant processes) to 100F, the treatment plant cost can be lowered to $1.5 M and only 1 acre of land.
In addition to lower space requirements and cost, risk of plant operating upset is virtually eliminated

Residential “Total Solutions”(Another Integrated Utilities Application)
To do “the right thing”, lots of folks buy 94% efficient furnaces. It’s only useful half the time, so they also get high-efficiency air conditioners. They spend about twice as much as “regular” units, but it’s worth it.
For LESS fuel than that new furnace needs, you could- Make all the electricity you need to run your home Use the rejected generator heat to run a cooling unit to
extract heat from a ground loop (or your home in summer) Use the combined rejected heat for ALL of your Hot Water Then use the cooler rejected heat for your home (or pool) Then use the cooler rejected heat for your garage Then use the cooler rejected heat to melt snow & ice
For about the same price as the Hi-E system

Paradigm Busters
The following slides identify several issues where “common sense” and “conventional wisdom” is just plain WRONG.
We will present the ideas that are apparent “conflicts with reason”, then explain WHY they are the right way to handle a situation.

Paradigm Buster #1
More insulation and tighter building’s will generally INCREASE operating costs and LOWER indoor air quality.
The amount of “internal” heat from motors, lights, computers, and processes is usually well above the “skin” (perimeter walls and roof) losses of the building.A classic example is a large office complex built with glass walls. If you drive by on a cold winter morning, you will see the A/C system rejecting excess heat even after the perimeter losses have been covered. That’s before the people arrive.

Paradigm Buster #2
Air Conditioning a factory can cost less to operate (and have a lower life-cycle cost) than if it’s just ventilated with exhaust fans.Exhaust fans take heat from lights, motors and plant processes that you have already “paid for” (or was free building skin load) and throw it away. Meanwhile, boilers are heating water or other process loads (heat you are removing).
An Integrated Utility gathers that energy and puts it back into the process. Improved morale, higher productivity and reduced defects are additional side-benefits.

Paradigm Buster #3
Economizers and other “free-cooling” systems waste energy, increase operating costs, and lower indoor air quality. Per #2, throwing away “already purchased” heat and buying more is a hidden money-waste.Economizers bring in outside air that is much “drier” than from a cooling coil. The inside air gets so dry that it is a great breeding ground for bacteria (50% RH has the highest mortality rate for “bugs”).
Dry air also adds to sinus and skin problems, and encourages static- which is bad for your electronic equipment.

Paradigm Buster #4
Increasing lighting levels can lower the utility costs of a manufacturing facility.
With Integrated Utilities, a thermal device called a “generator” has a by-product called electricity that is used to run the lights. If you recycle waste heat from the lights back into the process with a thermally-driven cooling unit, ALL of the energy put into the generator stays in the building or the process. The increased lighting levels also improve the working environment and reduce accident rates.

Paradigm Buster #5
Using low-efficiency motors reduces a plant’s utility costs.
“By-product” electric heat is also a factor here. The electrical energy gets recycled much as the lighting does to lower the heat energy purchases.Depending on where the motors are located, they can also take the place of “normal” heaters, saving capital.These motors cut maintenance expense because it’s easy to rewind or rebuild them. Reliability improves because replacements are fairly easy to acquire.

CASE STUDIESThese projects are not “how-to” teaching aids. They are guides- demonstrating the value of using a comprehensive approach to solving problems by studying how components perform, understanding relationships, and focusing on life-cycle costs.
#1- Existing Paper Manufacturing Plant
#2- New School Construction
#3- Large Office HVAC Upgrade
#4- Commercial Laundry Plant Concept

Case Study #1
Existing Paper Manufacturing Plant

Existing Conditions
4-year old facilityState-of-the-art, using “best available”
manufacturing technology systemsMain Utilities- Natural Gas and ElectricityProcess utilities- 200# &125# steam, RO
water, vacuum (dewatering), natural gas dryers
Process water from river (sand filter)$25,000,000 annual utility costs
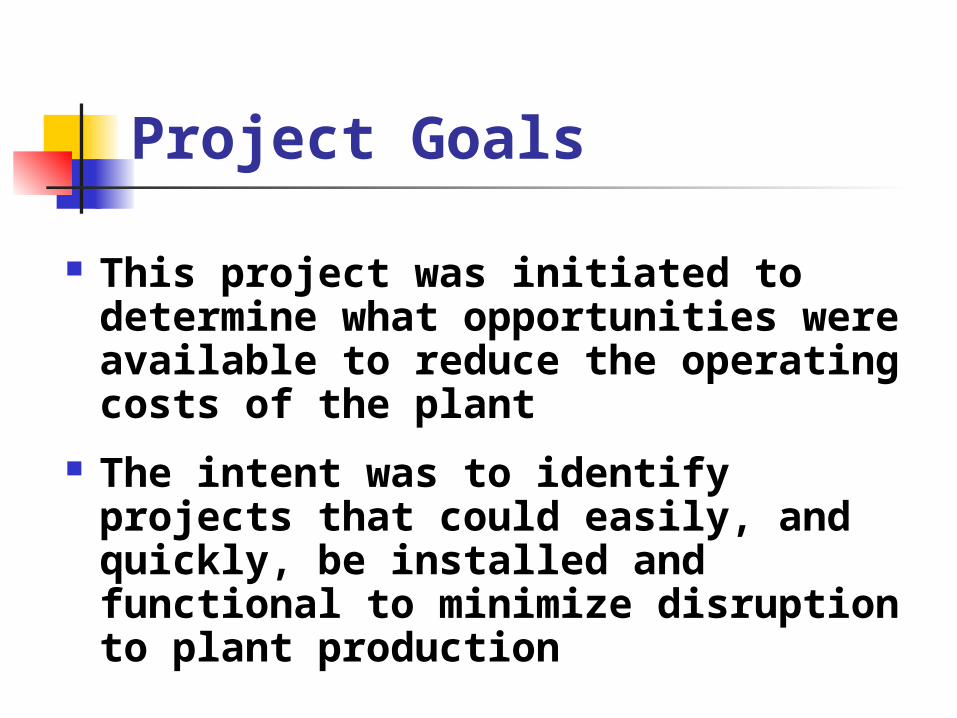
Project Goals
This project was initiated to determine what opportunities were available to reduce the operating costs of the plant
The intent was to identify projects that could easily, and quickly, be installed and functional to minimize disruption to plant production

Integrated Utilities Solutions (A FEW OF THE HIGH POINTS DEVELOPED)
“Unload” major electric motors w/ parallel hydraulic drives coupled to gas turbine (20% lower cost than electric generator and panel interface, easier to maintain)- THIS DRIVE CONCEPT IS CURRENTLY BEING PATENTED
Waste heat of turbine makes 15 PSI steam used to drive an absorption chiller, then residual “warm” exhaust gas goes to dryer line

Integrated Utilities Solutions (A FEW OF THE HIGH POINTS DEVELOPED)
Chiller cools seal water for vacuum pumps, cutting power from 7400 HP to 4800 HP (data provided by the vacuum pump manufacturer) at equal vacuum capacity
Waste heat from chiller (thermal input plus heat from the water) preheats additional dryer line makeup air

Additional Cost-Saving Ideas
(A FEW MORE SELECTED OPPORTUNITIES)
Preheat RO input water with compressor waste heat (increased capacity, reduced membrane pressure drop)
Reclaim energy from dryer lines to further preheat inlet air after turbine & chiller preheat input and before burner
Convert open tank process CHW to closed-loop piping system w/ variable-flow to reduce baseline head losses and pipe corrosion pressure drop

Additional Cost-Saving Ideas
(A FEW MORE SELECTED OPPORTUNITIES)
Convert steam heating system to HTHW, eliminate trap maintenance expense, stand-by heat loss, plus water and energy losses from flash tanks.
Increased Compressed Air storage, tightly regulated air pressure in mains, and load controls to free up compressors
Reduce air volume of major Air Handlers to minimize reheat and lower fan HP (and energy costs)
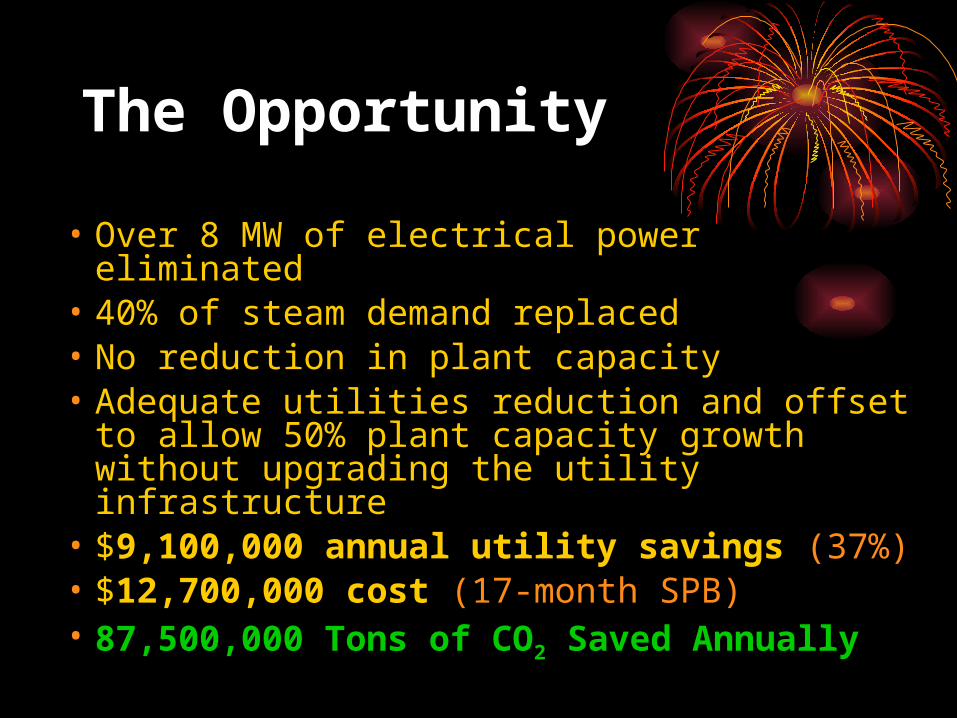
The Opportunity
• Over 8 MW of electrical power eliminated• 40% of steam demand replaced• No reduction in plant capacity• Adequate utilities reduction and offset to
allow 50% plant capacity growth without upgrading the utility infrastructure
• $9,100,000 annual utility savings (37%)• $12,700,000 cost (17-month SPB) • 87,500,000 Tons of CO2 Saved Annually
Case Study #2
New School Construction

Project Description
New High SchoolRemodel and Expand Middle School
New Elementary SchoolUpgrade/Renovate Primary School
Construction Budget– $46,000,000Utility Systems Budget - $ 15,000,000
Projected Utility Cost Increase - $ 560,000 / yr(Added to Existing Utility Costs of $ 870,000)

New School ConstructionValue Engineering Design Review
Review Utility Systems DesignRecommend Alternate Designs for Reductions in First Cost, Utility Cost, and Maintenance & Operation Savings
Net Present Value computed over planned 40-year Life
72 Total Recommendations54 “Unique” Choices (some were alternatives)
46 Selected for Implementation

Value Engineering Design ReviewLIGHTING SYSTEM Highlights
Ceiling lay-in fixtures, rather than suspended or wall-mounted (lower cost, more efficient so fewer required, and 50% of heat direct to return for smaller fans and less air supply)
2x4 fixtures, rather than 2x2 (less expensive, more efficient so fewer required. 2x2 lamps cost over 500% of 2x4 lamps)
Minimize “can” lights (low quality light, lamps cost 800% more per lumen, expensive, hard to maintain)
Capital Savings- $ 648,300Utility Savings- $ 56,600 (including HVAC)Net Present Value of Savings- $ 3,393,500

Value Engineering Design ReviewHVAC SYSTEM Highlights
Install ROUND, versus rectangular ductwork (less, and lighter, metal so costs less, more efficient so lower fan power, and easier to insulate)
Eliminate return air ductwork (don’t need to insulate supply ducts, better energy recovery, plus lower space cooling load that reduces fan energy)
Eliminate supply air duct silencers by using higher grade air handling units (less total expense, lower fan energy, and reduced structural requirements)
Capital Savings- $ 549,700Utility Savings- $ 61,200Net Present Value of Savings- $ 3,252,700

Value Engineering Design ReviewVENTILATION AIR Highlights
Design exhaust rates and ventilation air systems to match occupancy and recover energy from all exhaust air (less expensive central system, more efficient so lower energy required, and better internal environment)
Control ventilation, exhaust (plus lighting and room temperature settings) with occupancy sensors (reduced energy usage and cost)
Capital Savings- $ 624,800Utility Savings- $ 53,900Net Present Value of Savings- $
4,426,500

Value Engineering Design ReviewCHILLER & CHW SYSTEM Highlights
Install “Ice Bank” thermal storage system to downsize base chiller & transfer electric use Off-Peak. 300 Ton peak load reduction and chiller downsizing, plus “free cooling” in winter and early spring because ice made naturally.
30F CHW temp difference vs. standard 10-16F (less flow, so smaller piping, pumps and lower energy costs)
Capital Savings- $ 295,300Utility Savings- $ 62,400 Net Present Value of Savings- $ 3,046,700

New School ConstructionValue Engineering Design Review
Results of Selected Recommendations(Not all of selected recommendations discussed)
Capital Costs- $ 3,045,200 Saved
Utility Costs- $ 252,700/year Saved(Equal to 4 teachers’ salaries)
Net Present Value- $ 16,173,000Study Cost- $ 150,000 (free, based on capital savings)

Case Study #3
Large Office
HVAC Upgrade

Existing Conditions
Commercial Office Building, built in 1984
Height- 29 FloorsTotal Gross Area- 600,000 Sq. Ft.
Typical Floor Area- 25,000 Sq. Ft.
3-story, street-level atrium Lobby6 stories of underground parking

Original Mechanical System
Central Plant located in roof-level penthouse
CHILLED WATER COOLING (2) 800-ton electric centrifugal chillers (2) 800-ton cross flow design cooling towers
OUTSIDE AIR SUPPLY (1) Vane-Axial, belt-driven supply fanCentral Shaft vertical supply duct riser (1) 443 kW, multi-stage electric duct heater

Original Mechanical System
INDIVIDUAL FLOOR HVAC SYSTEMS
Central Air Handler with CHW cooling coil at each floor- dedicated fresh air intake
Dual-Duct Design- fresh air and return air are mixed, then sent thru cooling coil or bypass and out to mixing boxes
Duct-mounted Electric Heat / Reheat coils in each zone’s mixing box w/ multi-stage controls

Project Goals
Improve indoor air quality- maximize amount of outdoor air delivered to the occupants
Reduce operating expenses
Meet leasing requirements (fresh air per occupant standards) on a floor-by-floor basis
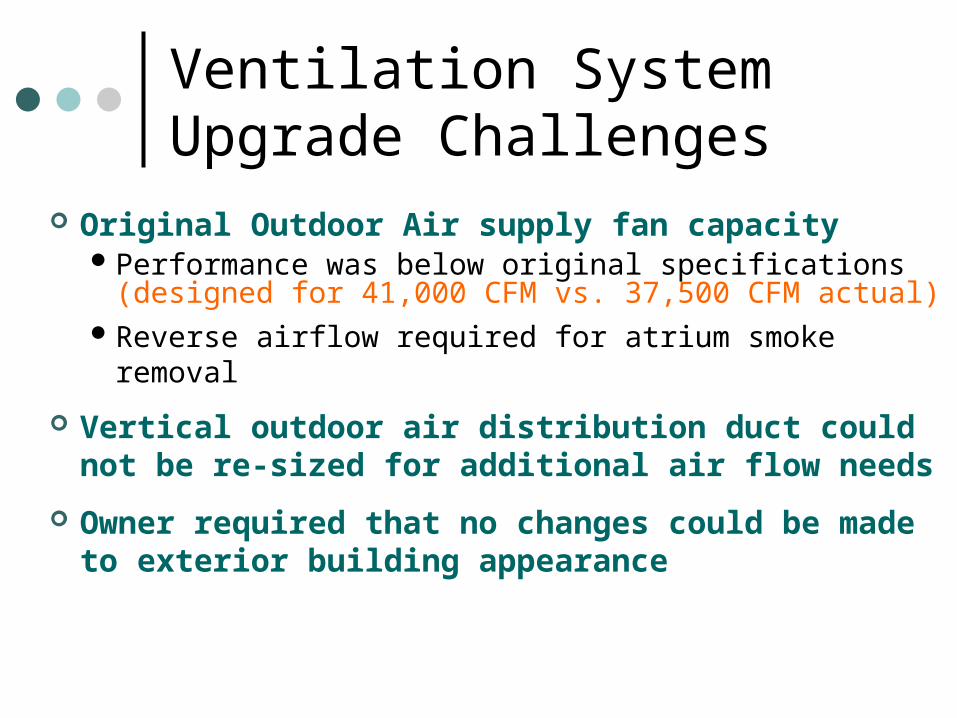
Ventilation System Upgrade Challenges
Original Outdoor Air supply fan capacityPerformance was below original specifications
(designed for 41,000 CFM vs. 37,500 CFM actual)Reverse airflow required for atrium smoke removal
Vertical outdoor air distribution duct could not be re-sized for additional air flow needs
Owner required that no changes could be made to exterior building appearance

Solutions Implemented Maximize the total amount of Outdoor Air
delivered to the buildingIncrease fan motor from 30 HP to 50 HP and increase fan speed to meet new requirements
Reduce operating costs of the facility
Install psychometric (heat and moisture) energy recovery wheel in ducts between toilet exhaust air riser and the outside air make-up distribution riser

Solutions Implemented
Meet the leasing requirements by floorReplace individual floor outdoor air dampers with a new combination air-flow measuring station & damper assembly
Air quantities sent to each floor based on programmed quantity of occupants and on scheduled occupancy periods (with override capability for after-hours work)
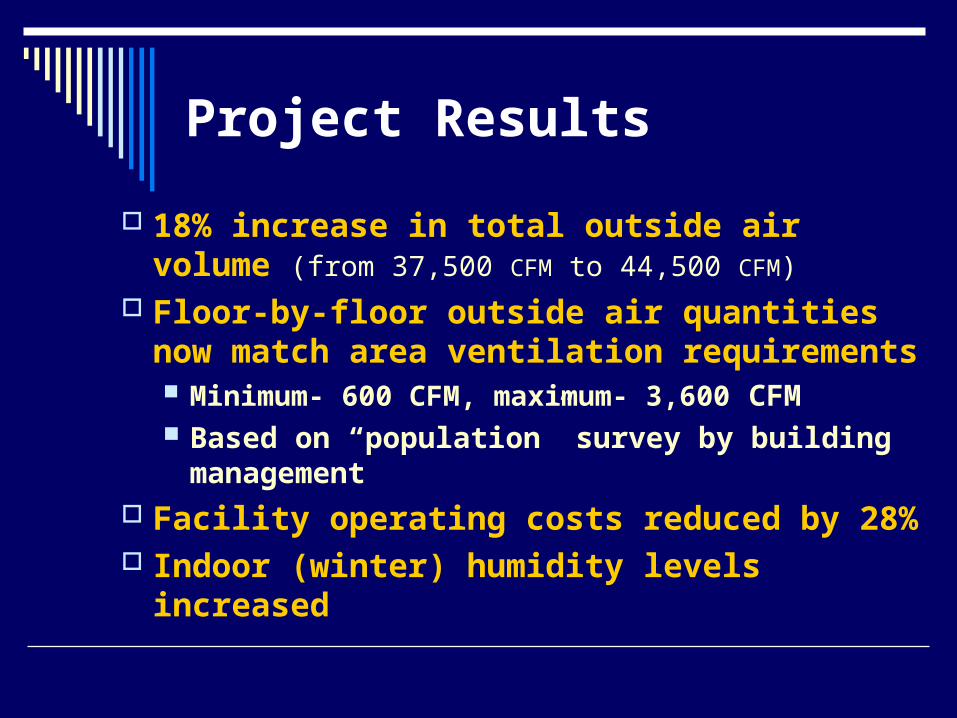
Project Results
18% increase in total outside air volume (from 37,500 CFM to 44,500 CFM)
Floor-by-floor outside air quantities now match area ventilation requirements Minimum- 600 CFM, maximum- 3,600 CFM Based on “population” survey by building
management Facility operating costs reduced by 28% Indoor (winter) humidity levels increased

Project Results (cont’d)
Tenant complaints of static shock (and related issues) eliminated
Chiller loads reduced and HVAC system performing more effectively Outside air now tracking actual occupant
density loading Energy recovery wheel reduces ventilation air
load to only 35% of “original”, although total outside air supplied is 18% greater

Conclusions
New “smart” ventilation system delivers outside air quantities to match the actual occupancy requirements of any space, any time.
“Simple” (only one moving part) energy recovery unit enabled outside air to be increased (improving indoor air quality) while reducing the HVAC system operating cost and fixing a low humidity operating problem.

Case Study #4
Commercial Laundry Plant

CURRENT ISSUES
Significant Water / Sewer Usage 98% Process Related BOD, TSS levels often cause surcharge Limits to new Plant Locations due to high usage
Process Steam Boiler Operates Continuously Plants run 2 or 3 shifts / day for 5 days / week Normal steam loads well below peak boiler capacity
High On-Peak Power Costs Several Large HP Process Motors High-Tonnage Rooftop Air Conditioners
Significant Natural Gas Costs SEASONAL- Tracks weather and water temperatures

SOLUTION CONCEPTSINTEGRATED BUILDING DESIGN
(The Building is Part of the Process) Integrated design allows smaller “foot print”
(lower cost) Active biological filtration system treating
“warm” wastewater (24/7 system operation supporting 5-day process load) Over 95% of process waste water will be fully
recycledRain water / snow provide make-up water for
“blow down” and drier evaporation (smaller storm drains and retention ponds)

SOLUTION CONCEPTSINTEGRATED BUILDING DESIGN
(The Building is Part of the Process) Floor-Level Supply from single, central HVAC
unit with 100% outside air for process make-up. Entire plant will now be “cooled”, plus cleaner,
better indoor air quality. Air will stagnate and rise as it is warmed by bodies, process, and lighting and “puddle” near roof for intake to dryers (vs. current direct outdoor air intake to dryers).
Minimal wall and roof insulation Heating & Cooling energy from process utility by-
products.

SOLUTION CONCEPTSINTEGRATED UTILITIES DESIGN
(Fully Incorporated & Dedicated to the Process) Packaged Micro Turbine Generators
matched to PROCESS LOADS (with some
reserve capacity) that will run only to support the Process
Waste Heat from Generators drives absorption chiller that extracts heat from process (and space if required)
Waste Heat from chiller heats process water (and space or make-up air if required)
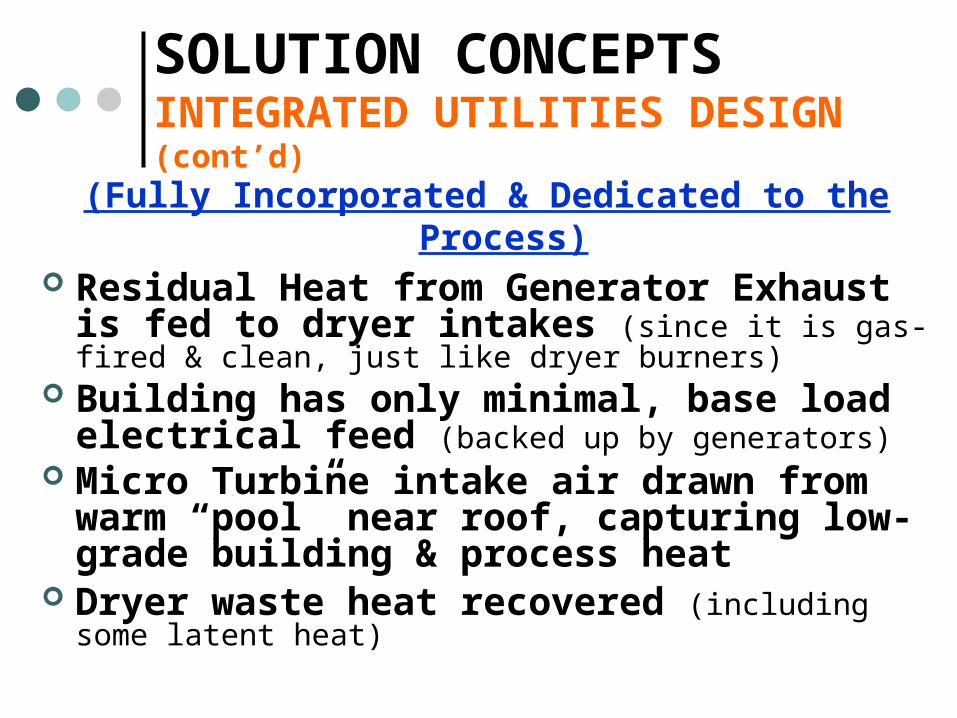
SOLUTION CONCEPTSINTEGRATED UTILITIES DESIGN (cont’d)
(Fully Incorporated & Dedicated to the Process) Residual Heat from Generator Exhaust is fed
to dryer intakes (since it is gas-fired & clean, just like dryer burners)
Building has only minimal, base load electrical feed (backed up by generators)
Micro Turbine intake air drawn from warm “pool” near roof, capturing low-grade building & process heat
Dryer waste heat recovered (including some latent heat)

SOLUTION CONCEPTSINTEGRATED UTILITIES DESIGN (cont’d)
Packaged Propane/Air Back-up Fuel Plant (allowing use of interruptible natural gas supply for better utility cost control)
Generators allow use of interruptible electric supply (for better utility cost control)
Electric Heat used to produce process steam on demand (eliminating stand-by losses, plus reduced maintenance)
Generators will also operate “on-demand” for space heating (or back-up electricity) during “off-hours” operation

Indicated Results
• TOTAL facility cost will be very close to current “standard” design package
• No reduction in plant capacity
• 98% of process water “use” eliminated, including sewer and special surcharges
• No restrictions to plant site selection
• Nearly 60% reduction in utilities costs
• Over 70% of annual CO2 releases saved

The TRUE VALUE of Using “Low-Efficiency” Components
MUCH LOWER Base Cost (often about 50% of higher-efficiency components)
Proven Technology Simpler, More Reliable Design easier to understand Easier to maintain and/or Replace

The TRUE VALUE of Using “Low-Efficiency” Components
Proper evaluation of actual utility
system requirements and a full
understanding of component
operating limits is necessary to
facilitate effective integration of
“Low-Efficiency” components into
“High-Efficiency” utility systems

Maximize Value
High Performance Buildings offers direct, quantifiable benefits- NEW DESIGN
• 20% or more SAVINGS on utility system construction costs with up to 50% lower operating costs
RETROFIT• 25% - 50% LOWER utility operating costs,
often with paybacks of 2-years or less
Either “VALUE” approach results in substantially lower environmental pollutant (CO2, etc.) releases
