maximizing benefit transfers to the poor: evidence from south african employment programmes
TRANSCRIPT

International Labour Review, Vol. 140 (2002), No. 3
Copyright © International Labour Organization 2002
Maximizing bene�t transfers to the poor:Evidence from South African
employment programmes
Lawrence HADDAD* and Michelle ADATO**
In the developing world, most best-practice national poverty-reduction strategies include workfare programmes (World Bank,
2000). Receipt of benefit from such programmes is contingent on thebeneficiaries’ willingness to work. The programmes are typically com-posed of public works schemes involving the creation of physical assetsat wages that do not exceed market wages for comparable unskilledwork. Such initiatives attempt to create physical assets in a labour-intensive way so that as much employment as possible is generated. Toincrease their poverty-reducing effect an attempt is made to generateassets – both physical and human – that benefit the poor in the medium-to-long run (Subbarao, 1997).1
Nevertheless, this type of anti-poverty intervention has notescaped the general scepticism encountered by targeted programmesin general (see some of the case-studies in van de Walle and Nead(1995), for example). Can the programmes be sufficiently accuratelytargeted to generate additional employment, rather than substitute formarket-led employment? Will the administrative requirements of theprogrammes consume too many of the resources? Can high-qualityassets be generated in a sufficiently labour-intensive way to generate
* Director, Food Consumption and Nutrition Division, International Food Policy ResearchInstitute, Washington, DC. ** Research Fellow, Food Consumption and Nutrition Division, Inter-national Food Policy Research Institute, Washington, DC.
1 Workfare programmes in the developing world are unlike those introduced in the UnitedStates and the United Kingdom in the 1990s. The latter require a gradual substitution of incometransfers with income from market-based employment. In the developing world in general, and inSouth Africa in particular, workfare programmes are additional to a given set of social policy ini-tiatives. Good starting-points on the impact of work-to-welfare programmes in the United Statesand the United Kingdom are provided by Haveman and Wolfe (2000), Mills et al. (2000) and Peckand Theodore (2000).
204 International Labour Review
enough income for the poor? These are just some of the questionsposed by critics.
To date, the data needed to address these questions have not beencommonly available. This article exploits a new data set from SouthAfrica to do so. A framework first proposed by Ravallion (1999) isemployed and extended, in order to estimate the public expenditure inrands (the South African currency) necessary to transfer one rand ofresources to the poor. This ratio is then compared with that generatedby a hypothetical, untargeted transfer under a range of assumptionsabout parameter values. The vast majority of public works programmesis found to outperform the benchmark quite considerably across a widerange of parameter scenarios.
Unemployment and poverty are major problems in South Africa.In the mid-1990s, 30 per cent of working-age South Africans wereunemployed (Klasen, 1997).2 For individuals in the poorest 20 per centof households, the rate of unemployment was 53 per cent. In 1993, 9,000households nationwide were asked what action the Government couldtake that would most help their household improve its living conditions.From a list of 18 items, jobs were the highest-rated item. Moreover,“jobs” (i.e. job creation) were the number-one priority in rural, urbanand metropolitan regions, as well as in the Western Cape Province inwhich this public works study was conducted (PSLSD, 1994; Klasen,1997).
In response to these problems, a National Public Works Pro-gramme (NPWP) was established in 1994. Its objectives were: (a) tocreate, rehabilitate and maintain physical assets that meet the basicneeds of the poor and promote broader economic activity; (b) to reduceunemployment through the creation of productive jobs; (c) to educateand train those on the programme as a means to their “economicempowerment”; and (d) to build up communities’ capacity to managetheir own affairs (NEF, 1994).
The broad objectives of the NPWP are a stark illustration of thedifficulties that unavoidably arise when comparing different types oftargeted poverty programme. Clearly, the model presented here doesnot pretend to capture all the benefits or costs of public works schemesin any given geographical and social context. The particular configur-ation of historical and political factors that ushered in the first demo-cratically elected government in South Africa and that structured itsearly poverty policies (including public works), the political andadministrative structures at provincial and local levels managing these
2 Unemployment was defined as “all people not working who would like to work and areactively seeking work or have given up looking”. The reference period is the previous seven days(Klasen, 1997, p. 69). The unemployment rate was estimated at 41.5 per cent in 2001 (Departmentof Trade and Industry, 2002).

Maximizing benefit transfers to the poor 205
programmes, and the political, economic and social conditions of SouthAfrican communities and workers – all play a part in determining pro-gramme outcomes at the micro level.
In South Africa, public works programmes were developed toachieve the internationally pursued objectives of generating incomeand productive infrastructure. However, as the NPWP illustrates, theprogrammes considered went beyond these goals to include systematicjob training to prepare project workers for future integration into thelabour market, targeting of women to expand their skills and power,and community participation aimed at increasing the management anddecision-making skills of local people, thus enhancing their capacity toharness new resources and manage future development initiatives.These objectives reflect the principles of the first post-apartheid Govern-ment, as embodied in the Reconstruction and Development Pro-gramme (RDP, 1994), that stressed the empowerment of civil societyinstitutions and community control of development processes as part ofa poverty-reduction strategy. In this sense, the model presented here todemonstrate the efficiency of these programmes at transferringresources to the poor is likely to underestimate its impact on poverty inthe long run, and possibly even the short run. It is also likely to misssome of the costs to be factored in, given the context of South Africaand the Western Cape Province on which the study focuses. Examplesare costs associated with the difficulty of restructuring delivery institu-tions in order to achieve broad sets of poverty reduction and develop-ment goals (rather than simply building infrastructure), or puttingproject management in the hands of local government authorities andof communities with a history of political strife.
Each of the seven programmes in the study has its own story – in-volving different institutions and actors with their particular histories,rules and guidelines, as well as the various ways in which these haveinteracted and worked out in practice – and each story helps to explainthe programme’s results. These stories and particularly importantissues – the role of community-based organizations and communityparticipation, inter-sectoral forums, and trade unions, and institutionalculture and transformation at the level of local and provincial govern-ment and the private sector – are explored in detail in the authors’ otherpapers on South African public works programmes (see Adato et al.(2000); Adato and Haddad (2002); Hoddinott et al. (2001)).
This article has a different objective. Given the difficulty of accu-rately measuring these other types of impact, it is useful to evaluate thebenefits and costs of the transfers on the basis of more limited types ofquantifiable data and indicators. This “cleaner” calculation is an impor-tant starting-point for the purpose of evaluating the benefits of publicworks programmes compared with other kinds of transfer programmes,a comparison that governments of countries with large populations of

206 International Labour Review
poor people and limited budgets need to make. Policy-makers can thenevaluate this economic information alongside the broader sets of bene-fit associated with transfer programmes that are more ambitious intheir development goals, costs or benefits generated by the politicalenvironment, national or locally defined objectives and priorities, andother context-specific factors.
This article analyses project-level data collected by the authors inthe Western Cape Province in South Africa. In particular, informationon 101 NPWP-like public works projects undertaken in the Provinceduring the 1993-97 period was merged with household survey data fromthe 25 magisterial districts in which the projects were based. The secondpart of the article describes the analytical framework used. The thirdpart describes the data sources used, and the fourth describes theresults. The final part presents conclusions.
Analytical frameworkHow can the ability of public works programmes to transfer bene-
fits to the poor be assessed? The ultimate aim of such an exercise is toknow how many rands of public funds are needed to transfer one randto a poor worker. Projects using fewer public funds to transfer one randto the poor are more cost efficient than other projects. What makesthem more cost efficient? And how do the public works projects com-pare with pure transfer programmes?
To some extent, the last question forces a comparison of applesand oranges. As discussed above, in addition to providing a source ofemployment (and hence income), public works programmes in SouthAfrica seek to meet a broader set of less measurable, longer-term goals.Cash transfers simply transfer income. The analytical frameworkemployed below attempts to bridge this divide by capturing some ofthese non-wage benefits,3 though these still do not capture the potentialbenefits of job training and community and individual empowermentthrough the generation of technical skills, community capacity, or evenindividual self-esteem through work. Hence, it is likely that the non-wage benefits captured by the framework represent a lower bound.This point will be returned to in the discussion.
The starting-point for the analytical framework used to addressthe above questions for the 101 projects examined is set out in Raval-lion (1999).First, de�ne the following:
G = government spending on public worksC = private co-financing
3 Via assumptions about the social returns to the programmes and the social costs of theirfinancing.

Maximizing benefit transfers to the poor 207
W = wage bill to poor workers on public works projectL = wage bill leaked to non-poor workers on projectIB = non-transfer or indirect benefits to the poorIBNP = non-transfer or indirect benefits to the non-poor.
Now de�ne:
P* = the probability of a poor worker getting a job, in the absenceof the projectP = the probability of a poor worker �nding work while workingon the projectW* = the wage bill of poor workers in the absence of the project.
The wages earned by poor workers in the absence of the project areP*W*. In the presence of the project, poor workers earn (1 - P)W + PW*.The net wage gain to the poor, NW, is:
(1 – P)W + PW* – P*W*or
(1 – P)W – (P* – P)W*.
The total benefits to the poor, B, become NW + IB, and the total non-transfer or indirect benefits, SB = IB + IBNP.
On the basis of these components the following can be defined:labour intensity = (W + L)/(G + C);percentage of earnings to the poor = W/(W + L); andthe rands (from the Government) cost per unit of rand bene�t tothe poor = G/B.
The lower the G/B, the more efficient transfer mechanism is thepublic works project for the poor, at least in terms of government out-lays. One might hypothesize that G/B will decline with:
(a) increased labour intensity (high (W+L)/(G+C), although thisdepends on how large leakages, L, are and how competitive thelabour market is in the absence of the public works programme);(b) improved targeting performance (high W/(W+L), resulting in ahigher B, holding G constant, although G may have to increase toachieve better targeting);(c) large net wage gains (large NW/W, resulting in a greater B at aconstant G);(d) a large proportion of the indirect bene�ts to the poor (large IB/SB, resulting in a greater B, although G may have to increase toachieve this effect); and(e) the ability of public funds to leverage other funds (high (G+C)/G, assuming that the greater availability of private funds does notworsen the ability to target the poor).
208 International Labour Review
Moreover the relationships between these components are com-plex. For example, a labour intensity that is too high might reduce theability of the project to generate indirect benefits (for example, a vege-tation-clearing programme as opposed to a road-building programme)that are important for the poor as well as the non-poor. How these com-ponents combine to generate different levels of G/B is an empiricalmatter, which is now discussed below.
Data and variablesThe study focused on seven public works programmes containing
101 completed public works projects in the Western Cape Province –one of nine provinces in South Africa. Together, the 101 projects in theseven programmes represent a census of all labour-intensive publicworks projects initiated and completed in the period, mainly 1994-97.There were more than seven public works programmes in the WesternCape Province, but only seven had been initiated since 1993 with a setof objectives mirroring those of the NPWP; these are listed in theAppendix.
By means of project documents and mail-in questionnaires withfollow-up telephone calls and visits, quantitative and qualitative datawere collected for each project in terms of location, type of asset cre-ated, cost structure, duration, employment days generated, wage ratesoffered, and type of implementing arrangement. Initially, all pro-gramme documents were identified for each of the programmes(monthly reports, final project close-out reports, project review sum-maries, etc.) However, it was soon determined that these documentseither contained data taken from project applications and did notreflect actual data collected during project implementation; wereincomplete, existing for some projects and not for others, and/or con-taining certain pieces of data for some projects and not for others; orcontained data that were contradictory or of questionable origin. Thus,in order to obtain accurate data, a project-level questionnaire wasdesigned and administered to implementing agents for each project. Inmany cases, the implementing agent did not have the data, and manyvisits had to be made to a wide range of programme and project admin-istrators or managers, consultants, contractors, and accountants (Adatoet al., 2000).
The project-level data were merged at the district level with dis-trict-level averages from the 1995 October Household Survey con-ducted by the Government’s Central Statistical Service (CSS, 1998).District-level variables included: average per capita income, the stand-ard deviation of district per capita income, the headcount poverty rate,the unemployment rate (using the broad definition provided by Klasen(1997)), the wage rates of unskilled manual labour, and the percentage
Maximizing benefit transfers to the poor 209
of individuals with at least a standard 10 education (= graduation fromhigh school). The variables outlined in the previous section were con-structed on the basis of these data. Bearing in mind that the aim was tocalculate G/B for each project, the assumptions behind the chosen val-ues of the components of G/B are now explained.
Government spending on public works (G). This was collecteddirectly from project records and verified with government records,whenever possible. It consisted of a combination of national, provincialand local government spending. The range of government expenditureper project ran from 14,000 to 34 million rands. The median value wasapproximately 340,000 rands.
Private co-financing (C). Only information on planned (as opposedto actual) co-financing was available. “Planned private co-financing”was used as a proxy for actual private co-financing. Twenty-fourprojects had a non-zero value for C.
Wage bill leaked to non-poor workers on project (L). It would havebeen a very large task to survey enough participating and non-partici-pating individuals at each of the 101 project sites to determine the leak-age of the wage benefits to the non-poor on a project-by-project basis.Instead, this leakage was estimated as follows. For the 79 projects inwhich the project wage was equal to or lower than the district wage forsimilar unskilled work (obtained from the OHS (1995) data, withappropriate cost-of-living adjustments for the date of project initi-ation), it was assumed there was no leakage to the non-poor. For the 22projects that set wages above the area wage for a similar task, it wasassumed that leakage to the non-poor was greater than zero. Specifi-cally for nine projects in districts with a low variability in household percapita income (standard deviation of income below an arbitrarily deter-mined 60th percentile cut-off), it was assumed that leakage to the non-poor was 10 per cent. For the remaining 13 projects, a leakage of 20 percent was assumed. Admittedly, these cut-offs and numbers wereentirely arbitrary, but they seem to be in line with the general consensuson how large these numbers are in a middle-income country such asSouth Africa (Subbarao et al., 1997).
Public works project wage bill (W). This was collected directlyfrom project records and was equivalent to the wage costs to workers.
The wage bill of the workers in a job, in the absence of the pro-gramme (W*). This was estimated as the number of days of employ-ment generated by the project (as derived from project records)multiplied by the area wage for similar unskilled work.
The probability of the worker getting a job, in the absence of theprogramme (P*). Most unemployed individuals in South Africa havenot had work for a long time. This is confirmed by the OHS (1995) sur-vey. For all those who had not worked in the seven days prior to the sur-vey, did not have their own business and would have accepted a suitable
210 International Labour Review
job if offered, the length of time they reported they had been lookingfor work varied from 3 to 25 months (median=17). The inverse of theaverage search length in the district was used as the probability of find-ing a job in the absence of the project.
The probability of finding non-project work while working on theprogramme (P). For seven of the 101 completed projects, surveys of arandom selection of former project employees were conducted. In all,193 former employees were asked the question “Was any new workrelated to the type of work on the project?” Of these individuals, 12 (orjust over 6 per cent) replied in the affirmative. Hence P was estimatedas 0.06 for all projects; being based on qualitative data from the sevencase-study projects, this was probably a conservative estimate.
Non-transfer benefits (SB). This component of the cost-effective-ness analysis was by far the most complicated to generate without adetailed project-by-project evaluation of full impact. No estimates ofthe non-transfer benefits generated by public works projects werefound in the literature. The World Bank (1994) has published someestimates of the rates of return on various types of infrastructureprojects from around the world, but it is difficult to generate a benefitstream from this information for well-known reasons, including thenon-uniqueness of the internal rate of return that equates the netpresent value of a benefit stream to zero. Based on an analysis of theEmployment Guarantee Scheme in Maharashtra (India), Ravallionand Datt (1995) consider a level of “indirect benefits” (such as theincreased demand for rural labour and the value of the infrastructure)of 40 per cent of the costs of a project to be reasonable.4
For the calculations in this study, the standard Little and Mirrlees(1974) approach was used, whereby:
P = a W – [W – l (W – W*P*)],
where W, W* and P* were defined as above; P = the net benefits from aninvestment (what Ravallion (1999) terms “the non-transfer benefits”);a W = the value to society of the output produced; and [W – l (W – W*P*)]was the cost to society of the investment. Note that the costs to societycomprised the immediate costs W minus the output gain from redeploy-ing labour (W – W*P*) weighted by a factor l . Note that W – W*P* wasidentical to NW when P, the probability of a poor worker finding workwhile working on the project, was zero.
The output gain was weighted by l , which one can interpret as thesocial value of the income gain to the workers from funds extracted
4 As discussed earlier, it is recognized that this estimate does not include the full range ofindirect benefits likely to be generated by the South African programmes that include job trainingand community capacity-building. Thus these estimates constitute a lower bound.
Maximizing benefit transfers to the poor 211
from individuals with higher incomes (from taxes, for example). l canbe thought of as:
= (Ym/Yw) e
where Ym was the average income of those from whom governmentresources was drawn, Yw was the average income of the public worksworkers, and e was a weight given to differences in Ym and Yw. Forexample, if (Ym/Yw) = 2 and e = 1, then l = 2. When e = 1, the transferto workers was valued in direct proportion to (Ym/Yw). The larger thedifference between Ym and Yw , the larger was l for a given e .
SB was calculated for each project by using W, W*, P*, and P.It was assumed that e = 1 and l was generated for each project as theratio of 2,500 rands/month/capita (the study’s proxy for Ym) to the dis-trict average per capita monthly income (which ranged from 258 to3,183 rands) (the study’s proxy for Yw). Assumptions had to be madeabout Ym and Yw, as the income levels of workers in the projects werenot available, nor were those of taxpayers. The guesses about Yw wereprobably overestimates of workers’ income. As to the assumption of2,500 rands per month per capita as the average income of taxpayers inthe Western Cape Province (Ym), this was approximately twice the pro-vincial average income (PSLSD, 1994).
To generate a for each project, reliance was made on qualitativedata collected on a project-by-project basis as to the community’s per-ceptions about the value to its members of the assets created by theproject. One can think of a as the return on the investment W. Eachcommunity was asked to assess the wider value to the community of theasset generated (and the process by which it was generated), and toclassify the generation of assets in three grades: no broader value men-tioned, one broader value mentioned, and broader value mentionedtwice. Examples of such broader uses include future income generationfrom assets, community empowerment, and the development of smallcontractors in the area. For the first group, a was assumed to be 1.0 andfor the second two responses, 1.1 and 1.2 respectively. These seem likereasonable rates of return, but they were chosen arbitrarily. For 20 ofthe CEP/IDT projects this information was unobtainable. For theremaining 81 projects, 32 did not identify a broad effect, 39 identifiedone and ten identified two. The 20 CEP/IDT projects were assigned avalue for a identical to the average of the CBPWP (1.0778) – a pro-gramme with similar goals in terms of community participation.
Once the non-transfer benefits were estimated, they were allo-cated to the poor and the non-poor by the district poverty rate. If, forexample, the proportion of the district population below the povertyline was 30 per cent, then 30 per cent of the non-transfer benefits wereallocated to the poor. The non-transfer benefits to the poor (IB) werethen added to the direct benefits to the poor (the value of the net

212 International Labour Review
transfer increase (NW)) to give the total benefit to the poor (B). Thiswas then compared with the Government’s contribution to the cost ofthe public works project (G), to estimate the cost per public rand ofbenefit transferred to the poor (G/B).
ResultsEstimates of some of the key variables contributing to the calcula-
tion of G/B are first presented. Then G/B for e = 1, 2 (the sensitivity toincome transfers from rich to poor) is presented and compared with thecost of transferring a rand to the poor with a hypothetical transfer pro-gramme for the district in which the public works programme waslocated. Finally, the untargeted transfer is made less efficient in that anadministrative charge is imposed, which increases the cost of transfer-ring one rand to the poor by 20 per cent.
Table 1 describes some of the variables outlined in earlier sections.A number of points are worth noting here. First, the public works wagebill to the poor (W) is, on average, lower than the wages the workerscould have earned if they had had guaranteed full employment in theabsence of the project (W*). However, the mean expected probabilityof gaining employment in the absence of the programme (P*) is 0.09,hence the expected value of earnings in the absence of the project ismuch lower than in the presence of the project. Second, note the lowlevel of leakage to the non-poor (L), which represents about 4-5 percent of the total wage bill. This seems low but it should be recalled that79 of the 101 projects offered wages equal to or lower than the compar-able unskilled wage in the area. Third, the costs of the projects borne bynon-governmental sources (C) are low, at least when based on plannedcontributions. Fourth, note that the net wage bill to the poor as a pro-portion of the wage bill to the poor (NW/W) is 0.9 at the mean. Thisreflects the low value for P*. As Ravallion (1999) notes, this ratio is
Table 1. Components of project performance1
Variable Mean Minimum Maximum N
Wage bill to poor from the project (W) 380 616 6 600 3 158 700 101
Wage bill to non-poor from project (L) 21 265 0 522 738 101
Wage earnings, poor, no programme (W*) 473 725 8 711 4 520 471 101
Probability of wages without project (P*) 0.09 0.04 0.33 101
Government costs of project (G) 1 614 258 14 928 34 993 046 101
Costs co-�nanced by non-governmentsources (C) 18 186 0 430 000 101
Net wage bene�t to poor (NW) 351 488 6 065 2 976 840 101
Net wage/wage bill (NW/W) 0.90 0.56 0.98 101
1 Units are rands unless otherwise speci�ed.

Maximizing benefit transfers to the poor 213
often assumed to be 1.0, although this study’s mean estimates arehigher than those estimated by Ravallion and Datt (1995) for theEmployment Guarantee Scheme. Their study found that the opportu-nity cost of participation by the poor in the programme was one quarterof the gross wage earnings of the scheme, in other words they estimatedNW/W at 0.75.
Table 2 provides a breakdown of these numbers by programme.First, note that the two least labour-intensive programmes were PILOTand TRANSPORT, which were both involved in road construction.The most labour-intensive programmes were the CAG and WWP – nei-ther of which involved large-scale infrastructure construction. Second,the programmes varied in size in terms of the average wage bill to poorworkers, W, with the WWP programme being the largest. So there ismuch variation in activity and scale between the programmes. Third,some programmes (CBPWP, CEP/IDT, CAG and NEF) were able toraise private funds.
Table 3 presents estimates of the non-transfer benefits at values ofe = 1, 2 and for different administrative overhead rates for the untar-geted transfer programme. From the first panel of table 3 ( e = 1, zerooverhead) it can be seen that on average, non-transfer benefits com-prised just under half of the benefits to the poor (300,550/652,038). Thisratio will tend to be higher for the programmes located in poorer dis-tricts, since this was the rule adopted to allocate non-transfer benefitsto the poor and the non-poor.
The average cost of directing 1 rand to the poor ranged from 0.81to 28.83 rands. Given the assumptions in this panel of the table, 83 percent of the 101 public works programmes delivered 1 rand to the poormore efficiently than did the hypothetical untargeted programme. TheWWP, CAG, CEP/IDT and PILOT programmes were particularly effi-cient in delivering benefits to the poor, at least in an absolute sense. The
Table 2. Components of project performance, by programme1
Programme name2
Wage billto poor
(W)
Wage bill to non-poor
(L)
Wage bill to poor without project
(W*)
Probabilityofearning W*
(P*)
Government costs
(G)
Non-gov. costs
(C)
% of coststo labour
100´(W+L)/(G+C)
Net wages to poor
(NW)
No. of projects
CAG 90 453 5 412 148 053 0.07 166 902 22 442 46 84 508 10CBPWP 108 780 6 436 119 021 0.09 577 856 3 056 27 99 769 18CEP/IDT 54 771 1 796 94 988 0.11 187 520 13 013 31 46 636 22WWP 1 643 514 114 588 1 828 173 0.09 2 366 540 0 86 1 516 987 14PILOT 626 265 0 1 159 015 0.04 4 993 744 0 13 610 088 2TRANSPORT 457 512 16 822 539 452 0.07 10 522 935 0 11 430 845 6NEF 254 067 8 038 378 773 0.08 1 399 569 43 830 36 234 148 29All 380 616 21 265 473 725 0.09 1 614 258 18 186 39 351 488 101
1 Units are rands unless otherwise speci�ed.2 Programmes are identi�ed in the appendix.

214 International Labour Review
exception is the TRANSPORT programme, which delivered resourcesto the poor in a relatively expensive way on average (although two ofits six projects still managed to do so more effectively than the hypo-thetical untargeted programme). Note that the G/B ratio is less thanone for the WFW projects. This means that they generated a benefitstream larger than the government resources used in the project. Thecomponents of project performance are examined below.
In relative terms, which programmes seem to be doing best at out-performing the untargeted programme in their district? Still from thefirst panel of table 3, it can be observed that the cost of delivering 1 randin an untargeted programme varied more by programme location thandid the cost of transferring 1 rand to the poor by the public worksproject. For example, the CAG projects were poorly targeted at the dis-trict level, in the sense that they were located in districts with a rela-tively low poverty rate (7.44 per cent), hence it cost 13.44 rands todeliver 1 rand to the poor. Conversely, the PILOT projects were situ-ated in districts with a poverty rate of 27.47 per cent, hence it cost 3.64rands to deliver one rand to the poor. This logic might lead the reader
Table 3. Project performance by programme, e = 1, 2, overhead = 0 and 20 per cent1
Programme name2 Non-transfer bene�tsto poor
(IB)
Total bene�ts to poor
(B)
Gov. rands to give1 rand to poor via a PW project
(G/B)
Gov. randsto give 1 rand to poor via untargeted transfer
Proportion of PW projects that outperformuntargeted programmein terms of transfer ef�ciency
Assumed overhead
Number of PW projects
0% 20%
e = 1
CAG 53 051 137 559 2.27 13.44 1.00 1.00 10
CBPWP 40 584 140 353 4.26 7.79 0.83 0.89 18
CEP/IDT 46 607 93 243 2.37 4.22 0.86 0.95 22
WWP 1 401 559 2 918 547 0.81 4.50 1.00 1.00 14
PILOT 919 010 1 529 098 3.15 3.64 1.00 1.00 2
TRANSPORT 200 581 631 426 28.83 7.11 0.33 0.33 6
NEF 186 408 420 556 3.20 6.35 0.76 0.79 29
All 300 550 652 038 4.31 6.58 0.83 0.87 101
e = 2
CAG 105 490 189 997 2.06 13.44 1.00 1.00 10
CBPWP 80 216 179 985 3.38 7.79 0.89 0.89 18
CEP/IDT 92 086 138 721 1.75 4.22 0.95 0.95 22
WWP 2 777 758 4 294 745 0.59 4.50 1.00 1.00 14
PILOT 1 819 918 2 430 006 1.98 3.64 1.00 1.00 2
TRANSPORT 398 187 829 031 26.39 7.11 0.33 0.33 6
NEF 366 929 601 077 2.52 6.35 0.86 0.97 29
All 594 883 946 371 3.60 6.58 0.89 0.92 101
1 Units are rands unless otherwise speci�ed. 2 Programmes are identi�ed in the appendix.

Maximizing benefit transfers to the poor 215
to think that public works projects should therefore be located in low-poverty areas, where universal untargeted schemes are not cost-effec-tive interventions. However, the location of projects outside areas ofpoverty and high unemployment would reduce the performance of thepublic works projects, as will be shown below.
When the assumed overhead rate was raised from zero to 20 percent, the untargeted transfer became less efficient and the public worksprojects became more competitive. Now, 87 per cent of them delivered1 rand to the poor more effectively than a hypothetical untargetedtransfer. In the second, lower panel, e = 2. This increased the non-trans-fer benefits in total, and hence the absolute amount to the poor. Non-transfer benefits now comprised over 60 per cent of the benefits to thepoor (594,883/946,371). This assumption made the public works morecompetitive, with 89 per cent of them being more efficient transfermechanisms for the poor. An assumption of a 20 per cent overhead onthe untargeted transfer resulted in 92 per cent of the projects outper-forming the untargeted transfers.
Why, then, were some programmes more efficient in transferring1 rand to the poor? Table 4 selects the scenario with the e = 1, and a20 per cent overhead on the untargeted transfer programme. In thissitu-ation, the WWP, CAG and PILOT projects did best, with all oftheir 26 projects outperforming the hypothetical untargeted transfer.Why is this? Table 4 offers some clues.
First, the low leakage of benefits to the non-poor for the CAG,PILOT and NEF projects is a reflection (by construction) of their offer-ing wages equal to or below comparable area wages. The WWP projectstended not to set wages below market, but they were very labour inten-sive, thus ensuring that the poor would receive a sizeable transfer, nomatter the magnitude of the non-transfer benefits or the percentage of
Table 4. Deconstructing performance by programme, e = 1, overhead = 20 per cent
Programmename1
%of wage bill to non-poor
(L)
% of coststo labour
(W+L)/(G+C)
Meannet wageto poor/wage billto poor
(NW/W)
Gov. randsto give1 randto poor, untargeted transfer
a l % of PW cost from NGO source
100´ C/(G+C)
Gov. randsto give1 rand to poor
(G/B)
Proportion of PW projects out-performing untargeted transfer progs.
Number of projects
CAG 3.00 0.46 0.93 16.12 1.04 2.54 13.40 2.27 1.00 10
CBPWP 5.56 0.27 0.90 9.34 1.08 2.47 1.04 4.26 0.89 18
CEP/IDT 2.27 0.31 0.87 5.06 1.08 3.16 7.24 2.37 0.95 22
WWP 7.14 0.86 0.91 5.40 1.06 3.82 0.00 0.81 1.00 14
PILOT 0.00 0.13 0.97 4.36 1.10 5.37 0.00 3.15 1.00 2
TRANSPORT 5.00 0.11 0.93 8.53 1.05 2.25 0.00 28.83 0.33 6
NEF 1.38 0.36 0.91 7.61 1.09 3.43 7.86 3.20 0.79 29
All 3.47 0.39 0.90 7.89 1.07 3.13 5.35 4.31 0.87 101
1Programmes are identi�ed in the appendix.
216 International Labour Review
the latter that were captured by the non-poor. It is important to note,however, that other projects which performed well against the untar-geted transfer had a much lower labour intensity. This is the secondpoint made here, namely, that a project does not have to be labourintensive to be an effective transfer mechanism to the poor, but it helps– up to a point. A project that does not generate an asset of value to thepoor in the community will have a small value of a and therefore asmaller non-transfer component, all things being equal.
Third, a large net transfer benefit is generated by locating a projectin a high unemployment area and by offering a wage that is not too low.If the area is not one of high unemployment, the value of non-projectemployment lost because of the existence of the project is likely to behigh. Moreover, if the project wage is set too low, the benefit fromworking on the project will be minimal and the project could becomeexploitative, particularly in a country such as South Africa where inmany areas market wages are very low relative to the cost of living. Ifthe wage is too high, however, leakage to the non-poor occurs. In thisconnection, Majeres (1995) and von Braun (1995, p. 307) recommendthat in poverty-reducing programmes, wages should be higher than thepoverty line for the working poor, but below a level that would attractthe non-poor. Particularly where public works projects have a finiteduration, as in South Africa (as opposed to being available year-round,as in the case of the Maharashtra Employment Guarantee Scheme), itis less likely that people will leave jobs (in agriculture or construction,for example) that offer greater security of future employment, unlessthe public works wage is substantially higher than the market one. Inthe case study research, some workers made this precise point (Adatoet al., 2000). It is also possibile that setting wages higher than the mar-ket wage can push up local market wages, as employers try not to loseworkers. Collecting data on market wages post-project was beyond thescope of this research, but there were reports that in one area agricul-tural wages increased slightly, specifically in order to compete withwages being paid by the WFW. Finally, another consideration is thatsetting wage rates below market wage will in some contexts result inlabour strife. In South Africa the largest labour federation, the Con-gress of South African Trade Unions (COSATU), signed a nationalagreement stating that public works projects could pay less than theindustry wage if job training was provided and if communities wereinvolved with decisions and benefited from the infrastructure (NCC,1996). Nevertheless, workers at project level had difficulty acceptinglow wages. In some cases, workers understood the principle that higherwages meant that fewer workers could be employed or for a shorterperiod, or fewer funds would be available for building the asset, but inother cases they did not accept the wages offered. Of the 101 projectsin this study’s dataset, 39 experienced strikes or labour disputes.

Maximizing benefit transfers to the poor 217
Twenty-seven projects ended with a higher wage than when theystarted, and their project managers explained that the constructiondelays were making the projects too expensive and it was thus worthraising the wages. Some also explained that it was particularly difficultto justify to workers why they were being paid one wage on a publicworks project, when workers across the street were being paid substan-tially more for doing the same work on a conventional government orprivate sector contract (Adato and Haddad, 2002).
Project location in a high unemployment area will boost NW, butbecause poverty and unemployment are correlated, untargeted pro-grammes in such districts will be more efficient than in other districts.Hence projects located in areas that boost NW have to work harder tooutperform the untargeted programmes. This is the fourth point: thatgood targeting implies trade-offs in transfer efficiency compared withan untargeted transfer. Fifth, the study’s measure of returns to the com-munity of the asset, a , varied by programme. As indicated above, ittended to be smaller for the more labour-intensive projects of the CAGand WWP programmes. A smaller a would mean lower non-transferbenefits. Sixth, the study’s measure of the value of transferring onerand from the taxpayer to the poor, l , was another parameter that wasaffected by project location. For the PILOT programmes it had a highvalue, reflecting their location in poorer areas. This was also reflectedin a low value of L for these projects and a high NW/W, but it alsomeant that untargeted transfers were efficient in the districts in whichthe two PILOT projects operated. Seventh, the CAG, NEF and CEP/IDT projects did fairly well in terms of raising non-government fund-ing, and this would boost B/G, all things being equal.
The PILOT and TRANSPORT projects present an example ofthe complexities involved in assessing these programmes. They wereboth road and stormwater programmes, but the former was the fourthmost efficient transfer mechanism (3.15 rands per rand) and the latterwas by far the most inefficient (28.83 rands per rand) – see table 4. Whythe difference? First, the PILOT projects offered wages below marketwage (a low L); second, they were located in areas of high unemploy-ment (low P* and hence a higher NW); third, they were located in areasof high poverty areas (high l and hence higher non-transfer benefits);and fourth, their products were valued more highly by the community(higher a ). The two programmes had similar labour intensities, wereroughly the same size on average, and neither generated private funds.The main difference was in the higher l for the PILOT projects, but theother differences were important because they were multiplicativewithin the framework of the study.
What were the key factors in determining some of these perfor-mance indicators? For example, how much of a programme’s successwas due to the asset it chose to generate, or to the institutional incen-

218 International Labour Review
tives embodied in implementing and financing arrangements? These arequestions that require a multivariate analysis, with due attention toendogeneity and unobserved heterogeneity; they are taken up by Hod-dinott et al. (2001). However, a start can be made at addressing thisissue using table 5, which is similar to table 4, but broken down by assettype. The table shows that the performance of the different projects byasset type is similar, except for the road and bridge projects that onlyoutperform the untargeted transfer (with a 20 per cent overhead)63 per cent of the time. Why is this the case, despite having low leakageto the non-poor? It is due to three factors: (a) l is relatively low indica-ting their location in better-off districts, (b) the percentage of costs tolabour are low and (c) the project cofinancing levels are low. Interest-ingly the clean-up and water/sanitation projects do equally well in out-performing the untargeted transfer, but they have very different labourintensities (0.69 vs. 0.37 respectively) .
Given that one of the objectives of the labour-intensive pro-grammes was to improve employment prospects for women, what canbe said about the transfer performance of the programmes that weremore successful at doing so? On average, 39 per cent of the employ-ment days generated went to women (Adato and Haddad, 2002). TheTRANSPORT and WWP programmes were by far the most successfulin attracting women workers, with 44 and 51 per cent of employmentdays, respectively, going to women. All of the 14 WWP projects outper-formed the hypothetical untargeted cash transfer, while only two out ofsix of the TRANSPORT projects did so. The WWP projects were soeffective because they were very labour intensive and fairly well tar-geted at areas of unemployment. The TRANSPORT projects were theleast labour intensive on average, but their saving grace in terms of thisstudy’s performance indicator is that they were fairly well targeted atareas of great poverty. From the bivariate perspective, there seems tobe no correlation between the percentage of women participating in the
Table 5. Deconstructing performance by asset, e = 1, overhead = 20 per cent
Activityor type of asset constructed
%of wage bill tonon poor
(L)
%of coststo labour
(W+L)/(G+C)
Meannet wage to poor/wage billto poor (NW/W)
Gov. rands to give1 randto poor, untargeted
a l %of PW cost from NGO source C*100/(G+C)
Gov. rands to give1 randto poor
(G/B)
Proportion of PW projects outperformingtheuntargeted programmes
Number of public works projects
Clean-up 4.64 0.69 0.92 7.98 1.05 3.75 4.80 1.29 0.96 28
Roads/bridges 1.58 0.21 0.92 7.50 1.07 2.69 0.23 11.65 0.63 19
Clinics/schools 4.55 0.34 0.88 6.58 1.07 3.47 10.7 4.06 0.82 11
Community centres 3.18 0.22 0.88 9.40 1.12 2.79 12.8 3.35 0.91 22
Water/sanitation 3.33 0.37 0.90 7.22 1.07 2.89 0.12 2.81 0.95 21
Total 3.47 0.39 0.90 7.89 1.07 3.13 5.35 4.31 0.87 101
Maximizing benefit transfers to the poor 219
projects and the programme’s ability to transfer resources to the poor.Clearly, however, a multivariate framework is required to test thisproposition. However, given that the worker selection mechanism atthe community level was an important determinant of the employmentshare of women as well as of the programme’s ability to target the poor-est (Adato and Haddad, 2002), obtaining an unbiased estimate of theeffect of women’s participation on the programme’s ability to transferbenefits to the poor will be a challenging task.
ConclusionsThe study examined the ability of 101 public works projects in
South Africa’s Western Cape Province to transfer resources to thepoor. The projects represent the situation obtaining in these projects in1995-97 with a set of objectives mirroring those of the NPWP. Theseobjectives included short-term job creation; the creation of assets orenvironmental improvement through labour-intensive means; sustain-able job creation through skills training; and local institutional capacity-building and community empowerment through participation in infra-structure projects.
Ravallion’s (Ravallion, 1999) framework for appraising workfareprogrammes was applied to the projects and was fleshed out in theprocess. Fortunately, several detailed sources of quantitative and qual-itative information were available at both project and district levels.Despite these data a number of fairly crude assumptions had to bemade as regards some of the costs and benefits involved.
On the basis of these assumptions, between 83 and 92 per cent ofpublic works projects outperformed an untargeted transfer scheme,depending on the scenario. Not surprisingly, the performance of theprojects improved when a higher value was placed on a transfer fromtaxpayers to workers and when an administrative overhead was appliedto the benchmark untargeted transfer. Despite these high rates of per-formance compared with hypothetical cash transfers, they probablyrepresent a lower bound on the effectiveness of public works at trans-ferring resources to the poor. That is because the study probably under-estimated the indirect benefits from the public works programmes.Certainly the estimates of l were low because a high total income levelfor project workers was assumed. One could also argue that the esti-mates of a were low, too, being based on subjective assessments fromthe community and then on the authors’ subjective assessments of rel-ative rates of return. Communities probably also underestimated theindirect benefits, because many of these had yet to be fully realized atthe time of asking. Moreover, the rates of return assumed by the studywere low relative to other scattered estimates of infrastructure rates ofreturn in the literature (World Bank, 1994).

220 International Labour Review
A number of lessons can be drawn from the analysis. First, theperformance of public works projects as public sector anti-poverty ini-tiatives compared with untargeted transfers depends on the interplayof numerous factors. Projects are more likely to perform well if: (a)they offer wages that do not exceed the comparable market wage,assuming that they are not too low as to be exploitative or to generatelabour conflict; (b) they are located in areas that have a high unem-ployment rate among the poor; (c) they have a labour intensity highenough to generate a sizeable transfer income; (d) they create assetsthat generate non-transfer benefits valued by the poor; (e) they arelocated in areas that are poor, but not so poor that an untargeted trans-fer is inevitable; and (f) they leverage additional non-governmentalfunds.
However, it is important to note the trade-offs between these fac-tors. For example, if labour intensity is too high, an insufficient amountof the project budget will go to an asset that can generate non-transferbenefits. Similarly, if a project is located in an area in which nearly eve-ryone is poor, an untargeted transfer may be more appropriate. At pro-vincial level, the extent to which it is possible to locate the programmesin areas of relative poverty and unemployment is particularly crucial totheir performance. Doing so reduces leakage of the transfer benefits tothe non-poor, increases the capture of non-transfer benefits by thepoor, and increases the social value of income transfers from taxpayerto worker. But Adato and Haddad (2002) found that for these projectsthere was little relationship between the district-level share of publicworks activity and the district-level share of poverty, unemploymentand infrastructure need. This is despite the wide availability of repeatedsurveys of living standards in South Africa, and it is also a reflection ofthe principle that the location of these projects should be communityled. More developed communities have better connections to skilledand influential people who help them apply for public works resources,hence the trade-off with targeting objectives.
Interestingly, the performance of the programmes does not seemto be excessively dependent on the type of asset being created, althoughthis conclusion is based purely on the bivariate comparisons in table 5and will be subject to confirmation from a multivariate analysis. If pro-gramme characteristics such as assets and institutional arrangementsare found to be important for the anti-poverty performance of theprojects, this has implications for the mechanisms used by the govern-ment involved to select proposals for projects. For example, if projectsled by community-based organizations are found to be more effectivein transferring benefits to the poor, this could lead to a higher propor-tion of projects being awarded to community-led proposals. This issueis being pursued further in a study being conducted by Hoddinott et al.(reported on in Hoddinott et al. (2001)).

Maximizing benefit transfers to the poor 221
Second, the study described here has demonstrated the value ofcollecting a key set of indicators for project monitoring and evaluationpurposes. These include: total costs, labour costs, duration, wage rates,number of days of employment, the number of project workers wholeave for non-project employment, and the area wage rate for compar-able work. Such data collection protocols need to be developed by theprogrammes. Also at the programme level, poverty, employment andinfrastructure maps need to be generated and used when alternatives forproject location present themselves. Unfortunately, such protocols as doexist are generally inadequate and non-standard. Moreover, there arefew incentives for them to be adequately completed (Adato et al., 2000).
Finally, the analysis presented in the study has many limitations.All the assumptions and guesses made are open to challenge. More-over, the study focused on poverty reduction measured by incometransfers as the performance yardstick, despite the other stated goals ofthe public works projects. In particular, the comparisons with hypothet-ical untargeted transfers did not adequately capture the sizeable non-transfer benefits created for the non-poor by the assets the projectsgenerated. Moreover, it was not possible to capture skills developmentand community empowerment effects that did affect the poor otherthan those captured by the measure of a used. Nevertheless, the studyattempted to make conservative guesses and to base its assumptions ondetailed knowledge of the area. The database available was muchricher than any similar database known of. It is to be hoped that otherswill similarly merge quantitative project-level data with extant district-level data, reinforced and supplemented by qualitative data, includingthose which bring out contextual social and political factors affectingprogramme outcomes, and which consider locally specific developmentobjectives and priorities. In this way, the dialogue on the anti-povertyeffectiveness of public expenditures will be enriched, both within coun-tries such as South Africa and in the wider international context.
ReferencesAdato, Michelle; Haddad, Lawrence. 2002. “Targeting poverty through community-based
public works programmes: Experience from South Africa”, in Journal of DevelopmentStudies (London), Vol. 38, No. 3, pp. 1-36.
—; —; Horner, D.; Ravjee, N.; Haywood, R. 2000. From works to public works: The perform-ance of public works in Western Cape Province, South Africa. Final Report. Washing-ton, DC, International Food Policy Research Institute.
Braun, Joachim von (ed.). 1995. Employment for poverty reduction and food security. Wash-ington, DC, International Food Policy Research Institute.
—. 1995. “Employment for food security: Synthesis and policy conclusions”, in von Braun,pp. 303-319.
Central Statistical Service (CSS). 1998. Employment and unemployment in South Africa,October Household Survey 1994-1997 . Statistical Release P0317.10. Pretoria, Statis-tics South Africa.

222 International Labour Review
Department of Trade and Industry. 2002. Recent employment data from the Labour ForceSurvey. Available on ‹http://www.dti.gov.za/econdb/eoverviewlfsweb.doc›. Updated4 July 2002. Visited 25 July 2002.
Haveman, Robert; Wolfe Barbara. 2000. “Welfare to work in the U.S.: A model for otherdeveloped nations?”, in International Tax and Public Finance (Boston, MA), No. 7,pp. 95-114.
Hoddinott, J.; Adato, Michelle; Besley, Tim; Haddad, Lawrence. 2001. Participation and pov-erty reduction: Issues, theory and new evidence from South Africa. Food Consumptionand Nutrition Division Discussion Paper No. 98. Washington, DC, International FoodPolicy Research Institute.
Klasen, S. 1997. “Poverty, inequality and deprivation in South Africa: An analysis of the 1993SALDRU Survey”, in Social Indicators Research (Dordrecht, NL), Vol. 41, pp. 51-94.
Little, I. M. D.; Mirrlees, J.A. 1974. Project appraisal and planning for developing countries.New York, NY, Basic Books.
Majeres, Jean. 1995. “Implementation of employment programs: Key issues and options”, invon Braun, pp. 275-302.
Mills, B.; Alwang, J.; Hazarika, G. 2000. The impact of welfare reform across metropolitan andnonmetropolitan areas: A nonparametric analysis. Working Paper. Blacksburg, VA,Department of Agricultural and Applied Economics, Virginia Tech.
National Coordinating Committee of the National Economic Forum (NCC). 1996. NewFramework Agreement for Labour-Intensive Construction in Civil Engineering Crit-eria and Guidelines. Draft 10. Cape Town.
National Economic Forum Technical Committee on a Public Works Programme (NEF).1994. National Employment Creation Programme for the Provision of Public Infra-structure using Labor-intensive Methods (National Public Works Programme). Pre-investment Investigation: Report of the Technical Focus Group. Johannesburg.
OHS. 1995. October Household Survey, 1995. Pretoria, Statistics South Africa.Peck, Jamie; Theodore, N. 2000. “‘Work �rst’: Workfare and the regulation of contingent
labour markets”, in Cambridge Journal of Economics (Oxford), Vol. 24, pp. 119-138.Project for Statistics on Living Standards and Development (PSLSD). 1994. South Africans
rich and poor: Baseline household statistics. Cape Town, South African Labour andDevelopment Research Unit, School of Economics, University of Cape Town.
Ravallion, Martin. 1999. “Appraising workfare”, in World Bank Research Observer (Wash-ington, DC), Vol. 14, No. 1 (Feb.), pp. 31-48.
—; Datt, Gaurav. 1995. “Is targeting through a work requirement ef�cient? Some evidencefrom rural India” in van de Walle and Nead, pp. 413-442.
Reconstruction and Development Programme (RDP). 1994. White Paper on reconstructionand development: Government strategy for fundamental transformation. RDP WhitePaper Discussion Document. Pretoria, Sep.
Statistics South Africa (SSA). 1999. The 1996 Census. Pretoria.Subbarao, Kalanidhi. 1997. “Public works as an anti-poverty program: An overview of cross-
country experience”, in American Journal of Agricultural Economics (Ames, IA),Vol. 79, No. 2 (May), pp. 678-683.
—; Bonnerjee, Aniruddha; Braithwaite, Jeanine; Carvalho, Soniya; Ezemenari, Kene; Gra-ham, Carol; Thompson, Alan. 1997. Safety nets programs and poverty reduction: Les-sons from cross-country experience. Directions in Development Series. Washington,DC, World Bank.
Walle, Dominique van de; Nead, Kimberly (eds.). 1995. Public spending and the poor: Theoryand evidence. Baltimore, MD, Johns Hopkins University Press.
World Bank. 2000. “Attacking poverty”, in World Development Report 2000/2001. OxfordUniversity Press.
—. 1994. “Infrastructure for development”, in World Development Report 1994. Oxford Uni-versity Press.
Maximizing benefit transfers to the poor 223
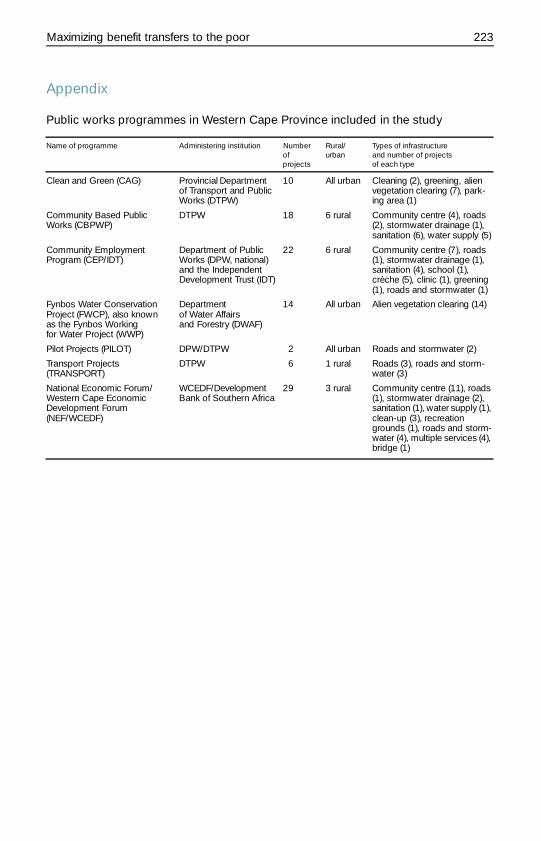
Appendix
Public works programmes in Western Cape Province included in the study
Name of programme Administering institution Number of projects
Rural/urban
Types of infrastructureand number of projectsof each type
Clean and Green (CAG) Provincial Department of Transport and Public Works (DTPW)
10 All urban Cleaning (2), greening, alien vegetation clearing (7), park-ing area (1)
Community Based Public Works (CBPWP)
DTPW 18 6 rural Community centre (4), roads (2), stormwater drainage (1), sanitation (6), water supply (5)
Community EmploymentProgram (CEP/IDT)
Department of Public Works (DPW, national) and the Independent Development Trust (IDT)
22 6 rural Community centre (7), roads (1), stormwater drainage (1), sanitation (4), school (1), crèche (5), clinic (1), greening (1), roads and stormwater (1)
Fynbos Water Conservation Project (FWCP), also knownas the Fynbos Workingfor Water Project (WWP)
Departmentof Water Affairsand Forestry (DWAF)
14 All urban Alien vegetation clearing (14)
Pilot Projects (PILOT) DPW/DTPW 2 All urban Roads and stormwater (2)
Transport Projects(TRANSPORT)
DTPW 6 1 rural Roads (3), roads and storm-water (3)
National Economic Forum/Western Cape Economic Development Forum(NEF/WCEDF)
WCEDF/Development Bank of Southern Africa
29 3 rural Community centre (11), roads (1), stormwater drainage (2), sanitation (1), water supply (1), clean-up (3), recreation grounds (1), roads and storm-water (4), multiple services (4), bridge (1)