maximizing the value and recovery of oil and gas resources ccop-lemigas rev2.pdf · maximizing the...
TRANSCRIPT

Maximizing the Value and Recovery of Oil and Gas Resources
Research and Development for Oil and Gas Technology “LEMIGAS”Ministry of Energy and Mineral Resources
Republic of Indonesia
CCOP-DMF Project on Petroleum Resources/Reserves Classification and Reporting System (S5)
Bangkok - Thailand8 – 10 September 2015

Page 2
CONTENT
1. INDONESIA RESERVES DEFINITION AND CLASSIFICATION
2. OBTAINING DATA FROM OIL/GAS COMPANIES
3. POD/POFD
4. POTENTIONALITY TO GAIN MORE ADDITIONALRESERVES

Page 3
INDONESIA Reserve ClassificationReserves Classification that is used by Indonesian Government (SKK Migas and Oil and Gas General Directorate) refer to SPE 2001 and it have been modified based on the reservoir character in Indonesia.
Commercial
Reserves
Proved Estimate
ProbableEstimate
Developed Undeveloped
PossibleEstimate
90%P1 + 50%P2 Or 90% P1
Sub -Commercial
Annu
al R
eser
ves
Rep
ort
POD
Source: SKKMIGAS

Page 4
Reserves Classification (More detailed)
Oil and Gas Reserves
Primary
Secondary
Proven
Probable
Possible
Developed
Not yet Developed
Active
Inactive
Production Phase Probability Level
Development Status
Productivity Level
Reserve classification that is more detail can be done by each formation
Source: SKKMIGAS

Page 5
The Summary of Hydrocarbon that originally in the reservoir that can be produced by current available technology until certain times.
Cumulative Production
Reserve Left in Reservoir
Oil Potention in IOR/EOR Phase
Oil Reserves in Natural Recovery
Original OIL In Place (OOIP)
Reserves Definition
Source: SKKMIGAS

Page 6
(”Proven Reserve”) :Summary of Hydrocarbon that is found in Reservoir Rock and proven to be produced by using current available technology with trust/acceptance level in about 90% based on well log, geological and reservoir engineering and it is backed up by actual production data or production flowing test.
Proven = P1 ≠ P90
Reserves Criteria Classification
Source: SKKMIGAS

Page 7
(”Probable Reserve”) :Summary of Hydrocarbon that is found in Reservoir Rock and proven to be produced by using current available technology with trust/acceptance level in about 50% based on well log, geological and reservoir engineering and it is not yet backed up by actual production data or production flowing test.
Probable = P2, 2P = P1 + P2, 2P ≠ P50
Reserves Criteria Classification
Source: SKKMIGAS

Page 8
(”Possible Reserve”) :
Summary of Hydrocarbon that is found in Reservoir Rock and proven to be produced by using current available technology with trust/acceptance level in about 10% based on the correlation of geological and geophysical data, Reservoir Engineering but without any well log.
Possible = P3, 3P = P1 + P2 + P3, 3P ≠ P10
Reserves Criteria Classification
Source: SKKMIGAS

Page 9
• Boundary of P1 vertically (Proven) : Based on the level of Oil Water Contact (OWC) or Gas Water
Contact (GWC) where the determination of fluid level contact must be supported by production flowtest, petrophysics interpretation, and pressure gradient analysis.
If OWC or GWC can be certainly determined, then there is no boundary of P2 or P3 vertically in the same reservoir.
If Fluid Contact can not be determined, then the vertical boundary of P1 is the lower level of production test (DST).
If the resistivity profile below the production test (DST) interval shows the bigger value and also supported with good reservoir properties, then the vertical boundary of P1 is allowed to reach the Lowest Known Oil (LKO) or Lowest Known Gas (LKG).
Reserves Criteria Classification
Source: SKKMIGAS

Page 10
• Boundary of P2 vertically (Probable) :
The boundary between P1 (lowest tested interval) till edge of (LKO/LKG).
If the boundary of P1 is at LKO/LKG (lowest tested = LKO/LKG), then the boundary of P2 is between P1 andhalf of vertical edge of spill point or Highest Known Water (HKW).
• Boundary of P3 vertically (Possible) :
The area boundary between P2 and Spill Point or Highest Known Water (HKW)
Reserves Criteria Classification
Source: SKKMIGAS

Page 11
Classification of Reserve Category based on Well (Vertically)
GWC
Prod. TestGas Flowing
Proven
Illustration - 1Edge of P1 could be determined vertically based on fluid level (OWC/GWC), where it should be supported by production test (DST), Petrophysics Interpretation, and Pressure gradient.
Prod Test. Water Flowing.
Source: SKKMIGAS

Page 12
RTGR
A
B
tes prod.
Proven
Probable
Illustration- 2
LKO
Probable
Classification of Reserve Category based on Well (Vertically)
Source: SKKMIGAS

Page 13
• Lateral/Areal Boundary of P1 (Proven) 1.5 x of Radius Investigation from flowing production test (DST) at the
representated Zone 1.5 x of depletion radius that is counted by decline analysis of production
profile from well that have been produced. If there is no DST data available, then the approximation of the edge of
area P1 is 250 metres maximum for Oil reservoir with API > 300, and for gas Reservoir, the maximum area is 750 m.
• Lateral/Areal Boundary of 2P (Proven + Probable) 2.5 x Radius area P1 (Proven). If the area P1 is restricted by different facies or there is fault, then the
area in which there is no well available, is categorized as P2
• Outside the area 2P in the same structure, is categorized as Possible (P3).
Classification of Reserve Category based on Well (AREA)
Source: SKKMIGAS

Page 14
OBTAINING DATA FROM OIL/GAS COMPANIES
• ANNUAL RESERVES REPORT WHICH CONTENT
WHAT OPERATOR SHOULD SUBMIT TO THE GOVERNMENT?
I. COVER LETTER- Brief Explanation- Revision of Reserves- Revision of Map- Reclasification of Reserves- New Discovery
II. CONTRACT AREA MAP- Oil Field Location- Gas Field Location- Undeveloped Field Location
III. RESERVES AND PRODUCTION SUMMARYA. Estimated Reserves By Field By Reservoir
B. Revision of Reserves
C. Production
Source: SKKMIGAS

Page 15
OBTAINING DATA FROM OIL/GAS COMPANIES
I IV. APPENDICES / ATTACHMENTS1. Individual Reservoir Data - Form : D-2
GEOLOGICAL DATA ENGINEERING DATA PRODUCTION AND INJECTION DATA RESERVOIR RESERVES CALCULATIONS
Method of Calculation Type of Reservoir Drive
2. Top Structure Map 3. Net Isopach Map 4. Production Performance Figures5. Other Supporting Data : Estimated Economic Limit, Gas
Composition, Gas Utilization, Platform Location Map, Structure Cross Section, Type Well Log Section - Etc.
ANNUAL RESERVES REPORT CONTENT
Source: SKKMIGAS

Page 16
OBTAINING DATA FROM OIL/GAS COMPANIES
Reporting Resources from oil/gas Companies (KKKS):
• 2013 – now : Reporting using Online Website
• Before 2013 : Manual reporting using MS Excel
Standar format reporting on Resources from each oil/gas companies (PSC) will make the analisis and calculation of resources more accurate.

Page 17
1. Reporting Preparation2. Filling form “PLAY” 3. Filling form “ LEAD”4. Filling form “ DRILLABLE PROSPECT”5. Filling form “ POST DRILL PROSPECT”6. Filling form “ DISCOVERY POSPECT”7. Uploading Map, figures and diagram8. Printing out Report “PORTFOLIO ASSET”9. Sending hardcopy to SKK MIGAS
On-line websiteSKK Migas
Reporting resources online stages:

Page 18
The reporting online website:

Page 19
The reporting online website:

Page 20
The reporting online website:

Page 21
The reporting online website:

Page 22
The reporting online website:

Page 23
The reporting online website:

Page 24

Page 25
The reporting online website:

Page 26
AVAILABILITY INFORMATION PLAY LEAD DRILLABLE POST DRILL DISCOVERY
NAME √ √ √ √ √
GEOGRAPHIC COORDINATE √ √ √ √ √
BASIN √ √ √ √ √
ROCK / FLUID PROPERTIES FROM ADJACTION √ √ √
WELL DATA √ √
GEOLOGY SURVEY √ √ √ √ √
GRAVITY SURVEY √ √ √ √ √
GEOCHEMISTRY SURVEY √ √ √ √ √
ELECTROMAGNETIC SURVEY √ √ √ √ √
RESISTIVITY SURVEY √ √ √ √ √
OTHERS SURVEY √ √ √ √ √
SEISMIC 3D SURVEY √ √ √
WELL TESTING √
WELL PETROPHYSIC √
ROCK PROPERTIES √
GAS DEVIATION FACTOR √
INITIAL FVF √
OIL VISCOSITY √
GCF DESCRIPTION √ √ √ √ √
GRA √ √ √ √ √
CLOSURE AREA √ √ √ √
VOLUMETRIC √ √ √
Data requirement for reporting:

Page 27
PLAY AdministrationGeographical BlockBasinProvinceGeologicalBy Analog toDistance to Analog Exploration methodEnvironmentOnshore/offshoreTerrainAdjacent ActivityDistance Nearby FieldDistance Nearby InfrastructureGCFSource rockReservoir rockTrappingDynamic
LEAD AdministrationLink PlayStructure NamaLead NameClarified byLead Name Initiation DateCenter CoordinateEnvironmentOnshore/offshoreTerrainAdjacent ActivityDistance Nearby FieldDistance Nearby InfrastructureSurvey Data AvailabilityAcquisition YearTotal Crossing lineAverage Spacing Parallel Interval2D Closure Low, Best, and High Estimate
Mandatory data requirement for reporting:

Page 28
DRILLABLE Prospect AdministrationLink PlayStructure NamaDrillable NameClarified byLead Name Initiation DateCenter CoordinateEnvironmentOnshore/offshoreTerrainAdjacent ActivityDistance Nearby FieldDistance Nearby InfrastructureAdjacent Well DataPorosity P90, P50, P10Water Saturation (Sw) P90, P50, P10Year AcquisitionGross ReservoirThicknessNet Pay Thickness P90, P50, P10Area Closure Estimation P90, P50, P10
POSTDRILL Prospect AdministrationLink PlayStructure NamaPostdrill NameClarified byLead Name Initiation DateCenter CoordinateEnvironmentOnshore/offshoreTerrainAdjacent ActivityDistance Nearby FieldDistance Nearby InfrastructureYear AcquisitionGross ReservoirThicknessNet Pay Thickness P90, P50, P10Area Closure Estimation P90, P50, P10Well DataWell NameCoordinateWell ResultWell TypeOnshore/OffshoreTerrainWell StatuesFormation TargetHydrocarbon IndicationOil Show ReadingGas Show ReadingBoi (Max – Mean – Min)Bgi (Max 0- Mean – Min)Well Data Clastic/non-clasticGross Res. Thickness, Res. Vshale, NTG, Porosity , Saturation (P90, P50, P10)GRT, Res. DTC., Res. Total Pore. Porosity, Saturation (P90, P50, P10)
Mandatory data requirement for reporting:

Page 29
DISCOVERY AdministrationLink PlayStructure NamaDiscovery NameClarified byLead Name Initiation DateCenter CoordinateEnvironmentOnshore/offshoreTerrainAdjacent ActivityDistance Nearby FieldDistance Nearby InfrastructureYear AcquisitionGross ReservoirThicknessNet Pay Thickness P90, P50, P10Area Closure Estimation P90, P50, P10
Well DataWell NameCoordinateWell ResultWell TypeOnshore/OffshoreTerrainWell StatuesFormation TargetNumber Penetrated Production ZoneZone NameWell TestWell RadiusHydrocarbon IndicationOil Show ReadingGas Show ReadingBoi (Max – Mean – Min)Bgi (Max 0- Mean – Min)Well Data Clastic/non-clasticGross Res. Thickness, Res. Vshale, NTG, Porosity , Saturation (P90, P50, P10)GRT, Res. DTC., Res. Total Pore. Porosity, Saturation (P90, P50, P10)
Mandatory data requirement for reporting:

Page 30
• Original reporting must be submitted before 31 Juli every year.
• Revised reporting must be submitted before end of year.
Type of Reporting and Schedule:

Page 31
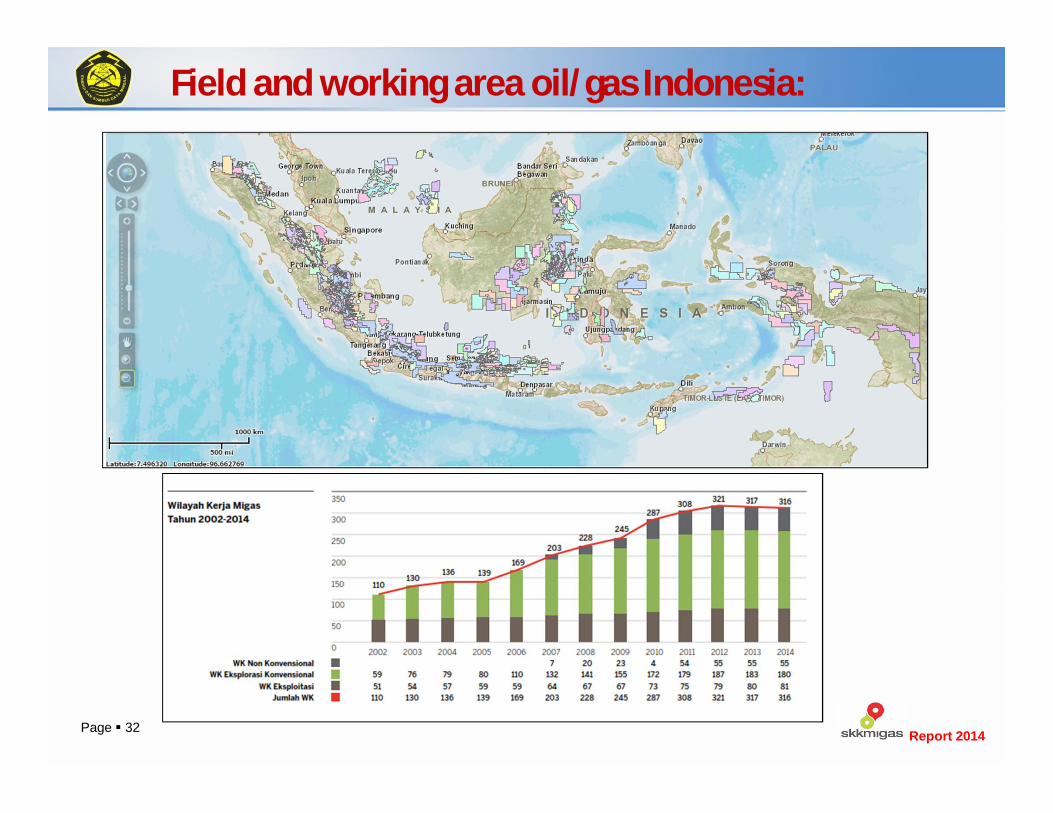
Country borderLand of Indonesia
Land of neighboring countriesBasin with oil production
Basin with hydrocarbon discovery
Basin with hydrocarbon indication
Basin no hydrocarbon discovery yet
Basin no exploration
Oil and gas working areas
Working Area Map of Indonesia
Symbol
259 Company Operators
Field and working area oil/gas Indonesia:
Report 2014
Page 32
Field and working area oil/gas Indonesia:
Report 2014

Page 33
Classification of POD (Plan of Development)
Plan of Development I
Plan of Development I is the first POD in a working area to get the Minister of Energy Approval, by recommendation of SKK Migas, after consulting the local Government.
Remarks: This POD marks the changing between a working area from exploration phase into Exploitation/Production Phase

Page 34
Classification of POD

Page 35
Classification of POD
Plan of Development II
POD II (etc) is the next type of POD from the different reservoir structure at the same working area that has been approved before (POD I).
Remarks : This type of POD should/must get approval from the Head of SKK Migas.
POD SecRec/EOR is the development of field to produce oil with SecRec/EOR methods. Proposed POD is only contains the production that has same number with the production from that field minus baseline production that is agreed by SKK MIGAS and PSC Company.

Page 36
Classification of POFD (Plan of Further Development)
•POFD is the next plan of development for a field that has been produced in the same reservoir structure , where all of the establishment of production facilities and drilling plan that has been approved on the previous POD is done.•For some fields that has been produced for a long time with no POD before, if there is a plan for next development, then the POFD is a must.

Page 37
Classification of POD
•Field P,Q,R,S is in Working area A•Field U and V is in Working area B•Field U and Field P have facility that can be used by Field S•Field W is in Working Area A and B, it needs utilization•POD I in Field P as First Field, in reservoir X and Y•POFD in field P includes Reservoir Z•POD II in field R as the second Field in Working Area A, After P•POP in Field S, using facilities in Field U , or other facilities around it•X,Y,Z is the reservoir from field P

Page 38
Time
Data
High
Most likely
LOW DevelopmentDecision
P1
P2P3
Reserves for POP and POD/POFD
POD
• Reserves is calculated from the producing zone. If the predicted production time is limited by contract, therefore reserves calculation is counted untill the contract is over.
• Reserve Classification that used for POD Proposal is already using the classification for P1, P2 and P3. Reserves Calculation is referring to Iso-HPV (Hydrocarbon pore volume) map or Net Pay.
Page 39
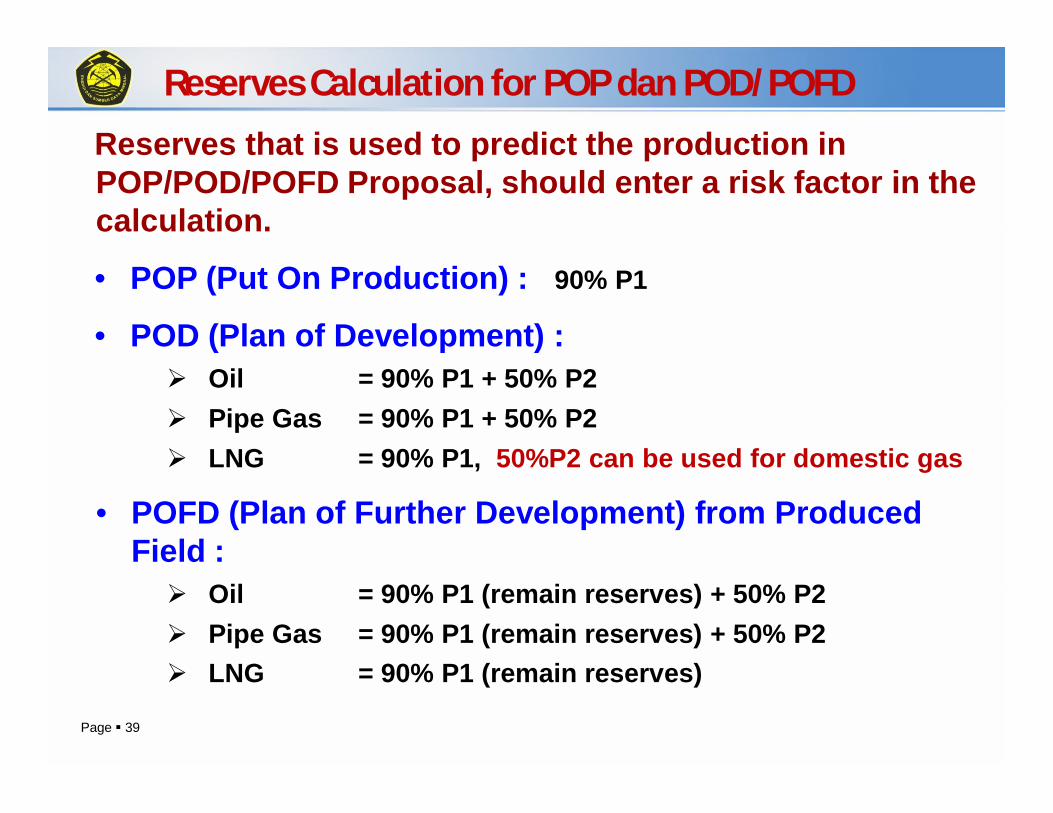
Reserves Calculation for POP dan POD/POFD
Reserves that is used to predict the production in POP/POD/POFD Proposal, should enter a risk factor in the calculation.
• POP (Put On Production) : 90% P1
• POD (Plan of Development) : Oil = 90% P1 + 50% P2 Pipe Gas = 90% P1 + 50% P2 LNG = 90% P1, 50%P2 can be used for domestic gas
• POFD (Plan of Further Development) from Produced Field : Oil = 90% P1 (remain reserves) + 50% P2 Pipe Gas = 90% P1 (remain reserves) + 50% P2 LNG = 90% P1 (remain reserves)

Page 40
CHANCE OF GETTING ADDITIONAL RESERVES
Indonesia still have potentiality to gain additional reserves by:
• re-activating a number of ancient wells;• increasing production from fields with still
have low withdrawal rate (WR < 8%) or low recovery factor;
• Intensify the activities of getting additional reserves from marginal/small fields and brownfields;
• IOR/EOR Project.• Conducting unconventional oil/gas research
such as shale gas

Page 41
CHANCE OF GETTING ADDITIONAL RESERVES
Source: SKKMIGAS
Chemical/Sulfactan
Steam Flood
Chemical/Sulfactan
Steam Flood

Page 42
thank you
Ministry of Energy and Mineral ResourcesR&D Centre for Oil and Gas Technology
Republic of Indonesia LEMIGAS