maximum casting speed for continuous cast steel...
TRANSCRIPT

C. Li and B. G. Thomas, Paper will be presented in 2002 ISS Conference, Nashville, TE, USA
1
MAXIMUM CASTING SPEED FOR CONTINUOUS CAST STEEL BILLETS
BASED ON SUB-MOLD BULGING COMPUTATION
Chunsheng Li and Brian G. Thomas
Mechanical and Industrial Engineering Department University of Illinois at Urbana-Champaign
1206 W. Green St., Urbana, IL 61801 Tel.: 217 244 2859, 217 333 6919
E-mail: [email protected], [email protected]
INTRODUCTION
As the steel industry continues to improve quality and reduce cost, there is growing interest to maximize the productivity from a single continuous casting machine. Many different processes are currently competing, from conventional thick slab and blooms to thin slabs and strip casting, whose economic feasibility depends on their eventual productivities. Considering the high cost of plant experiments, it is appropriate to apply computational modeling to explore the theoretical limits of continuous casting speed and productivity. Productivity increases with increasing casting speed and increasing cross-section area. The casting speed is limited by several different phenomena, listed below.
1. Excessive level fluctuations and waves at the meniscus become worse with greater casting speed [1, 2]. This can cause surface quality problems and even sticker breakouts. This problem can be addressed by changing nozzle design (directing the flow more downward, or possibly by adding a bottom vertical port), applying electromagnetic forces, changing mold flux, and using other methods to control the flow pattern in the mold.
2. Excessive axial strains may be caused by the oscillation and withdrawal forces needed to overcome friction at the interface between the solidifying shell and the mold. The associated transverse cracks and breakouts may limit casting speed, especially if there is misalignment, excessive taper, or a discontinuous liquid flux layer. Stresses are small if the liquid layer of the mold flux can be kept continuous over the entire mold surface[3] and alignment is good.
3. Excessive membrane strains may be generated in the thin shell by the ferrostatic pressure of the liquid pool below the mold. This can lead to cracks and breakouts if the shell is not thick enough at mold exit. The critical shell thickness was predicted by C. Li[4] to be on the order of 3mm for most grades. This is easily achieved by any feasible casting speed, which shows that other criteria are more important.
4. Any local nonuniformity in the shell growth can lead to locally hot and thin regions in the shell, which can initiate longitudinal cracks and breakouts even if the shell is above the critical thickness on average. This problem, which has been investigated by Brimacombe and others[5], can be addressed by optimizing mold flux behavior during initial solidification, oscillation practice, and taper design, such

C. Li and B. G. Thomas, Paper will be presented in 2002 ISS Conference, Nashville, TE, USA
2
that flux lubrication is continuous, the initial heat flux is low and uniform, and the mold wall taper matches the shell shrinkage profile[6]. Peritectic steel grades and austenitic stainless steel are most susceptible to this problem[7]. Superheat delivered from the flowing steel jets can also contribute to this problem, especially near the faces where the jet impinges when casting with submerged bifurcated nozzles[8, 9].
5. Excessive bulging of the strand below the mold can lead to a variety of internal cracks and even breakouts if the bulging is extreme. Fig. (1) shows a sample transverse section of a 175mm square billet with an off-corner subsurface crack due to excessive bulging below the mold. Bulging can be controlled by choosing enough support rolls, maintaining roll alignment, controlling spray cooling below the mold, and by avoiding sudden changes in roll pitch, sprays, or casting speed.
Fig. 1: Continuous-Cast Billet Section after Breakout showing Off-corner Subsurface Crack 6. The distance below the meniscus of the point of final solidification of the center of the strand increases
in direct proportion with casting speed for a given section thickness and limits the maximum casting speed in a given steel plant. The torch cut-off and roll support system must extend to accommodate this increase in metallurgical length. Contrary to intuition, this metallurgical length cannot be significantly shortened by increasing the spray cooling intensity[10].
7. Reheating of the strand below the end of the spray cooling zones generates internal tensile stress and hot-tear cracks, which grow in severity with casting speed. This understanding is incorporated in the pioneering work of Brimacombe and coworkers to provide design criteria for spray zones[10, 11]. The spray cooling zone must be extended to avoid these cracks.
8. Finally, there are many other special quality concerns, which sometimes impose limits on casting speed. For example, in ultra-low carbon steels, a relatively slow upper limit in casting speed is required in order to reduce pencil pipe and other blister defects due to argon bubble entrapment on the inner radius of curved mold casters[12, 13]. Casting speed can only be increased in such situations by careful changes in operating conditions that avoid the specific defects of concern.
Clearly, to increase the casting speed of a continuous casting process requires careful consideration of many different phenomena. The above list shows that at least eight separate criteria must be satisfied, any of which
C. Li and B. G. Thomas, Paper will be presented in 2002 ISS Conference, Nashville, TE, USA
3
could limit the casting speed for a given operation. This work focuses on quantifying criterion 5 by applying a finite-element thermal-mechanical model to predict temperature, bulging, strain, stress and fracture in billets, in the absence of any sub-mould support. The results are then used to find the critical casting speeds to avoid quality problems related to bulging below the mold as a function of section size and mould length.
MODEL DESCRIPTION
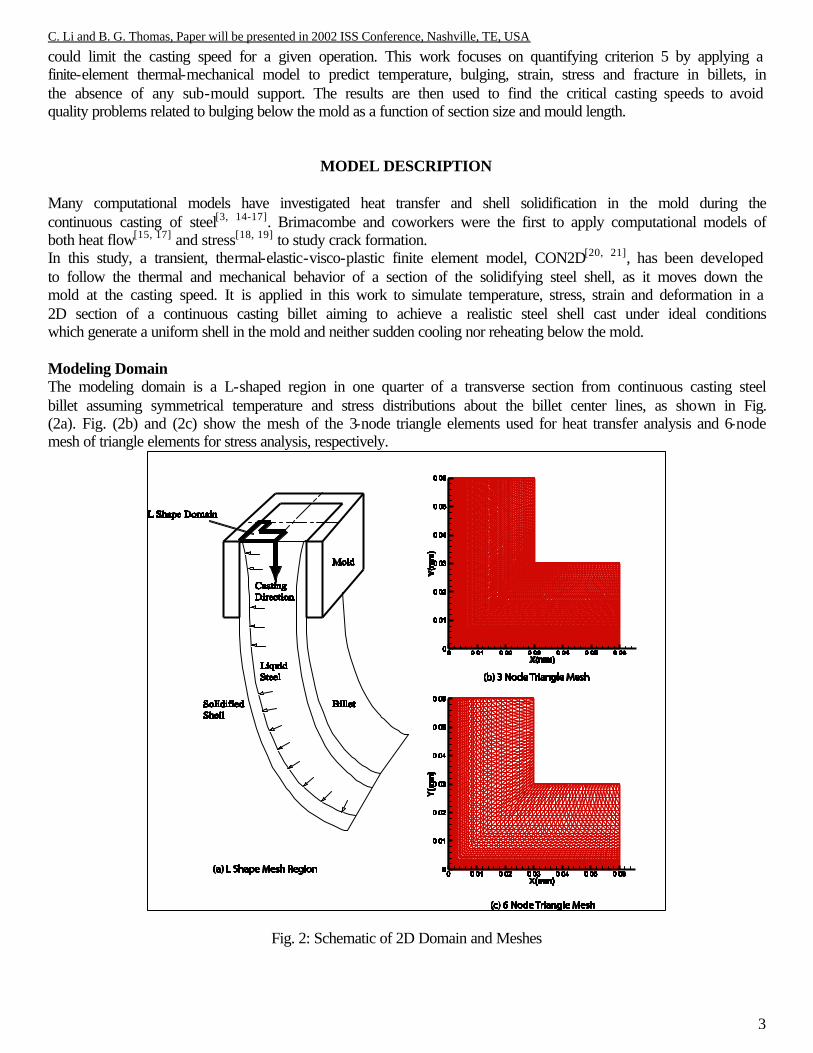
Many computational models have investigated heat transfer and shell solidification in the mold during the continuous casting of steel[3, 14-17]. Brimacombe and coworkers were the first to apply computational models of both heat flow[15, 17] and stress[18, 19] to study crack formation. In this study, a transient, thermal-elastic-visco-plastic finite element model, CON2D[20, 21], has been developed to follow the thermal and mechanical behavior of a section of the solidifying steel shell, as it moves down the mold at the casting speed. It is applied in this work to simulate temperature, stress, strain and deformation in a 2D section of a continuous casting billet aiming to achieve a realistic steel shell cast under ideal conditions which generate a uniform shell in the mold and neither sudden cooling nor reheating below the mold. Modeling Domain The modeling domain is a L-shaped region in one quarter of a transverse section from continuous casting steel billet assuming symmetrical temperature and stress distributions about the billet center lines, as shown in Fig. (2a). Fig. (2b) and (2c) show the mesh of the 3-node triangle elements used for heat transfer analysis and 6-node mesh of triangle elements for stress analysis, respectively.
Fig. 2: Schematic of 2D Domain and Meshes

C. Li and B. G. Thomas, Paper will be presented in 2002 ISS Conference, Nashville, TE, USA
4
This domain includes the entire solid shell in the upper portion of the caster, but ignores some of the liquid near the billet center to save on computation requirements. Smaller size elements, 0.1mm, are used near the surface to produce more accurate thermal stress/strain prediction during the initial solidification period. Larger size elements, 1.0mm, are used near the center to reduce computational cost substantially, without sacrificing much accuracy. This choice is validated by comparing with an analytical solution discussed later. Heat Transfer Model The heat transfer model solves the 2D transient conduction equation, using a fixed Lagrangian grid of 3-node triangles. Latent heat is evaluated using the spatial averaging technique suggested by Lemmon[22]. Axial heat conduction is ignored. A non-equilibrium phase transformation model for certain plain carbon steels1 suggested by Young Mok WON[23] is incorporated to produce realistic phase fraction evolution between solidus and liquidus temperatures. Fig. (3) shows the fractions of solid phases and liquid for 0.27%C carbon steel, which is investigated in this work. The steel composition and important temperatures are shown in Table I.
T e m p e r a u t r e ( o C )
Pha
seF
ract
ions
(%)
8 0 0 1 0 0 0 1 2 0 0 1 4 0 00
1 0
2 0
3 0
4 0
5 0
6 0
7 0
8 0
9 0
1 0 0
F r a c t io n o f A lp h a F e r r i teF r a c t io n o f D e l ta F e r r i t eF r a c t io n o f A u s t e n it eF r a c t io n o f L i q u i d
Fig. 3: Phase Fraction versus Temperature for Steel with 0.27%C, 1.52%Mn, 0.015%S, 0.012%P, and 0.34%Si
Table I: Material Details Steel Composition (wt%) 0.27C, 1.52Mn, 0.34Si, 0.015S, 0.012P Liquidus Temperature (oC) 1500.72 70% Solid Temperature (oC) 1477.02 90% Solid Temperature (oC) 1459.90 Solidus Temperature (oC) 1411.79 Austenite? a-Ferrite Starting Temperature (oC) 781.36 Eutectoid Temperature (oC) 711.22
The instantaneous interfacial heat flux profile down the mold is usually found from thermocouple measurements in the mold. The profile is then integrated to find the average heat flux in the mold, which should match a global heat balance with the cooling water. In this work, the procedure is reversed to estimate the instantaneous heat flux profile. The average heat flux data points measured by many investigators[4, 10, 24-27] and its fitted average heat flux curve, which is expressed by Eq. (1), are shown in Fig. (4). Slab caster data with mold flux is seen to be lower than billet cast means lubricated with oil. Thus, this function is on the low side of billet measurements.
1 Other compositions besides carbon are: 1.52%Mn, 0.015%S, 0.012%P, 0.34%Si

C. Li and B. G. Thomas, Paper will be presented in 2002 ISS Conference, Nashville, TE, USA
5
0
1
2
3
4
5
0 10 20 30 40 50 60
Kapaj[11]
Wolf fitted Eqn for slag casting: 7.3*t(s)-0.5 [32]
Wolf fitted Eqn for oil casting: 9.5*t(s) -0.5 [32]Thin Slab [24]
Brimacombe fitted Eqn: 2.68-0.222t(s) 0.5 [1]
C LI fitted Eqn for Slab casting: 4.05*t(s) -0.33 [17]
C LI fitted Eqn for Billet Casting -9.5779t -0.504
Lorento fitted Eqn: 1.4*Vc(m/min) 0.5 with 700mm Mold [19]Other Sources: 0.1%C, Billet [19]Other Sources [19]
Dwell Time (s) Fig. 4: Measured Average Heat Flux and Fitted Average Heat
Flux Curve
0
1
2
3
4
5
0 10 20 30 40 50 60
Time Below Meniscus (sec.) Fig. 5: Instantaneous Heat Flux Curve
( ) ( ) 0.5043/ 9.5779 sec.q MW m t−
= (1)
The instantaneous heat flux function of distance down the mold, which is needed in the model, was obtained by differentiating Eq. (1). At short times, the instantaneous heat flux drops linearly with time, which was indicated by strip casting research[28, 29]. This assumption also avoids the unrealistic high instantaneous heat flux produced by differentiation. The instantaneous heat flux function is given in Eq. (2) plotted in Fig. (5).
( ) ( )( )
30.504
5 0.2444 sec. 1.0sec./
4.7556 sec. 1.0sec.
t tq MW m
t t−
− ≤= >
(2)
The instantaneous heat flux is assumed to be uniform around the perimeter of the billet surface. This corresponds to the assumptions of ideal taper and perfect contact between the shell and mold. After the billet leaves the mold, its surface temperature is kept unchanged from its circumferential profile at mold exit. This eliminates the effect of spray cooling practice on sub-mold reheating or cooling and the associated complication for the stress/strain development. Fluid flow in the liquid pool may create non-uniform removal of the superheat[9]. The effect is minor when the pouring temperature is close to liquidus temperature and is ignored in this work, which treats superheat in the liquid with simple conduction. Stress Model Starting with stress-free liquid at the meniscus, the stress model calculates the evolution of stresses, strains, and displacements, by interpolating the thermal loads onto a fixed mesh of 6-node triangle finite elements[20]. The elastic strain rate vector, { }eε& , is related to the total strain vector, { }ε& , via:
{ } { } { } { } { }e T in fε ε ε ε ε= − − −& & & & & (3)

C. Li and B. G. Thomas, Paper will be presented in 2002 ISS Conference, Nashville, TE, USA
6
Where { }Tε& is the thermal strain rate, { }inε& is the inelastic strain rate including creep and plasticity, { }fε& is the pseudo-strain rate representing fluid flow of the liquid. Friction between the mold and shell surface is ignored by assuming there is no excessive mold taper in this work. Assuming there is no sticking of the shell to the mold, the maximum coefficient of friction is 1. Then, the maximum friction stress in a mold with 1000mm working mold length is: gz = (1)(7000kg/m3)(9:81m/s2)(1m) = 68700Pa = 0.07MPaρ . For shorter molds, friction is even smaller. This stress is negligible relative to the thermal stress at least for times above 0.5 sec.. Thus, ignoring friction is consistent with the ideal taper and mold operation assumption made above. Thermal Strain Thermal strain is calculated from the temperature changes calculated by the heat transfer model and from the unified state TLE, thermal linear expansion, function which reflects the volume change of materials under temperature change and phase transformation. The thermal strain can be expressed by Eq. (4).
( ) ( )( )0{ }T TLE T TLE T= − dε (4)
Inelastic Strain A realistic plasticity/creep constitutive model is the foundation of successful simulation of material behavior especially under high temperature. The inelastic strain in the continuous casting shell is dominated by creep, which is very sensitive to strain rate at high temperature. Creep is significant at high temperature even during a tensile test and cannot be distinguished from plastic strain. Thus, the constitutive behavior for solidifying plain-carbon steel is simulated using the rate-dependent, elastic-visco-plastic model III of Kozlowski[30] given in Eq. (5).
( ) ( ) ( ) ( )( ) ( )( ) ( )( ) ( )( )
( )( ) ( )( )( ) ( )( )( ) ( )
( )
32
41
1
31
32
33
24 4 5
4.465 101/sec. % exp
130.5 5.128 10
0.6289 1.114 10
8.132 1.54 10
(% ) 4.655 10 7.14 10 % 1.2 10 %
oo
of T Kf T Ko
o
o o
o o
o o
Kf C MPa f T K
T K
where
f T K T K
f T K T K
f T K T K
f C C C
−
−
−
−
× = − −
= − ×
= − + ×
= − ×
= × + × + ×
&ε σ ε ε
(5)
( ) ( )( )
( ) ( )( )
( )
2
5.52
5.56 1 04
5
4
1/sec. 0.1
(% ) (1 1000 )300
:
% 1.3678 10 %
9.4156 10 0.3495
11.617 10 0.06166
n
om
o
o
MPa
T Kf C
where
f C C
m T K
nT K
σε
ε
−
−
− ×
−
−
= +
= ×
= − × +
=× −
&
(6)

C. Li and B. G. Thomas, Paper will be presented in 2002 ISS Conference, Nashville, TE, USA
7
This model was developed to match tensile test measurements of Peter Wray[31] and the creep data of Suzuki over a range of strain rates, temperature, and carbon contents to model austenite under continuous casting conditions. An enhanced power law model[20] was extended to simulate delta ferrite phase with relatively higher creep rate than austenite phase. Eq. (6) shows the details of the enhanced power law model.
0.1
1
10
1200 1250 13001350 1400 1450 1500 1550
dε/dt 2.8e-5 s- 1
dε/dt 2.3e-2 s- 1
ELEC FEFE-0.028CFE-0.044CFE-3.0SI
Temperature (Degree C)
Wray Data
Constitutive Model
γ δ+γ
δ+
δ
L
10% δ
Fig. 6: Comparison of Model Predicted and Measured (Wray[31]) Stresses
Fig. (6) compares the constitutive model with measured stresses under 5% strain and 52.8 10 1/sec.−× and
22.3 10 1/sec.−× strain rate from 1200oC to 1600oC. Predicted stresses match the measurements decently. Flow Strain In this model, the liquid elements are generally given no special treatment regarding material properties and finite element assembly. The only difference between solid and liquid is choosing a constitutive equation that provides an extremely rapid creep rate in the liquid phase, which is shown in Eq. (7), to enforce negligible liquid strength and stress.
( )5810
0yield yield
yield
σ σ σ σε
σ σ
− >=
≤& (7)
This constitutive equation is equivalent to an elastic-perfect plastic material model with a yield stress, yieldσ , which is chosen for liquid in this mold to be 0.01MPa. The disadvantage of using this high creep rate function to model liquid is increasing the computational difficulty at the solidifying front. This necessitates the use of a very robust local iteration algorithm[20]. This fixed-grid approach avoids difficulties of adaptive meshing and allows strain to accumulate in the mushy region. The inelastic strain accumulated in the liquid region represents fluid flow, so is denoted as "flow strain". Positive flow strain indicates fluid feeding into the simulated region. Shell Thickness Definition The alloy studied here has a wide mushy region indicated in Table III. This makes shell thickness an unclear concept. Y. M. WON and others suggest that at 70% solid, the adjacent dendrite arms begin to touch each other and prevent flow of liquid[32]. Thus, shell thickness results are presented at the 70% solid position in this study.

C. Li and B. G. Thomas, Paper will be presented in 2002 ISS Conference, Nashville, TE, USA
8
Generalized Plane Strain Assumption The out-of-plane stress and strain in the casting direction are characterized by the generalized plane strain assumption. This allows the 2-D simulations to reasonably estimate the complete 3-D stress state, for a long, wide, thin shell. This is an accurate in the absence of bending or friction in the casting direction. Each slice is constrained by the rest of the shell to remain straight as it moves down the mold. Ferrostatic Pressure Ferrostatic pressure is applied to those nodes just below solidus temperature as an internal load that pushes the shell toward the mold wall. The ferrostatic pressure, Fp, is calculated by Eq. (8).
pF hzρ= (8) where z is the distance of the current slice from the meniscus found from the casting speed and the current time. Mold Constraints Mold constraints are applied to prevent the billet from expanding freely because of the ferrostatic pressure. Care is taken not to apply non-physical restraint to limit shell shrinkage. An efficient contact algorithm described elsewhere[21] is used to achieve this goal. Material Properties To be as realistic as possible, temperature dependent material properties are used in current study. Thermal Properties The temperature dependent conductivity function for plain carbon steel is fitted from measured data by R. D. Pehlke et. al.[33] in Fig. (7). The enthalpy curve used to relate heat content and temperature in this study, H(T), is obtained by integrating the fitted specific heat curve from measured data of R. D. Pehlke et. al.[33] which is shown in Fig. (8). Density was assumed constant at this work, in order to maintain constant mass.
Fig. 7: Thermal Conductivity for 0:27%wtC Plain
Carbon Steel
Fig. 8: Enthalpy for 0:27%wtC Plain Carbon Steel
Thermal Linear Expansion Fig. (9) shows the thermal linear expansion curve for 0:27%wtC plain carbon steel used in this study, which is obtained from solid phase density measurements compiled by R. D. Pehlke et. al.[33] and Jablonka[34] and liquid density measurements by Jimbo and Cramb[35] via Eq. (9),

C. Li and B. G. Thomas, Paper will be presented in 2002 ISS Conference, Nashville, TE, USA
9
03( )
1( )T
TLET
ρρ
= − (9)
where the arbitrary reference state T0 is chosen to be the solidus temperature. Note the three relatively sharp changes which are caused by liquid to solid transformation near solidus temperature, α-ferrite to austenite transformation at 1380oC and austenite to δ-ferrite transformation at 900oC.
Fig. 9: Thermal Linear Expansion for 0:27%wtC Plain
Carbon Steel
Fig. 10: Elastic Modulus for Plain Carbon Steel
Elastic Properties Elastic modulus generally decreases as the temperature increases, although its value at high temperatures is uncertain. The temperature dependent elastic modulus curve used in this model was fitted from measurements from Mizukami et. al.[36] by Kozlowski[30] as shown in Fig. (10). Unlike in other models, the elastic modulus of the liquid here was given the physically realistic value of 14GPa. This value also avoids numerical trouble from excessively small values in the stiffness matrix. Actually, the value of the elastic modulus in the liquid has little effect on the stress results, due to the extremely high creep of the liquid. Poisson ratio is 0.3 constant.
MODEL VALIDATION
Weiner and Boley proposed an analytical solution of thermal stress model in an unconstrained solidifying plate[37], which is an ideal validation problem for solidification stress models. The constants used in this validation problem are listed in Table II.
Table II: Constants Used in Boley and Weiner Analytical Solution Conductivity (W/mK) 33.0 Specific Heat (KJ/m3K) 0.661 Elastic Modulus in Solid (GPa) 40.0 Elastic Modulus in Liquid (GPa) 14.0 Thermal Linear Expansion Coefficient (1/K) 0.00002 Density (Kg/m3) 7500.0 Poisson's Ratio 0.3 Liquidus Temperature (oC) 1494.48 Solidus Temperature (oC) 1494.38

C. Li and B. G. Thomas, Paper will be presented in 2002 ISS Conference, Nashville, TE, USA
10
The material in this problem has elastic-perfect plastic behavior. The yield stress linearly drops with temperature from 20MPa at 1000oC to 0MPa at solidus temperature 1494.38oC. For the current model, this constitutive equation was transformed into a computationally more challenging from of the highly nonlinear creep function of Eq. (7). A very narrow mushy region, 0.1oC, is used to approximate the single melting temperature assumed by Boley and Weiner. The same 3-node and 6-node triangle elements, used in the heat transfer and stress models of the real problem, were used in the validation problem with a uniform element size of 0.1mm. This element size is the same as the element size used in the real problem near the billet surface. The surface elements need to be small enough to produce accurate results, because the surface region begins to solidify just below meniscus and quickly develops stresses and strains due to temperature drop, contact with mold wall and ferrostatic pressure. The element size near the center of the billet is much lager, 1.0mm, since those elements are liquid state during most of the simulation. Fig. 11) and (12) show the temperature and the stress distributions across the solidifying materials at different solidification times. The numerical representations of the analytical solutions were with MATLAB[38]. CON2D produces almost identical results to the analytical solution. This demonstrates that the model is numerically consistent and has an acceptable mesh.
Fig. 11: Comparison of Boley and CON2D
Temperature Distributions
Fig. 12: Comparison of Boley and CON2D Stress
Distributions
FAILURE CRITERIA
Predicting casting speed limits from the stress mold results requires a reasonable failure criterion. However, there is no widely acceptable damage criterion for steels at high temperature. Two different criteria were used in the present work. Maximum bulging displacement below the mold exit was used as the first failure criterion. The maximum normal bulging was chosen to be 1mm relative to the corner of the billet section, and was found at the billet centerline. Secondly, a hot tearing crack criterion is adopted. This allows the model results to predict the specific crack defects that limit casting speed. Many investigators have measured strain and strength of solidifying steel shells. This work adopts the empirical critical-strain criterion given in Eq. (10).
0.3131 0.8638
0.02821c
BTε
ε=
∆& (10)

C. Li and B. G. Thomas, Paper will be presented in 2002 ISS Conference, Nashville, TE, USA
11
This failure criterion was suggested by Y. M. WON[39] and fitted from experimental data as a function of strain rate, ε& , and brittle temperature range, ∆TB. The brittle temperature range is defined between the temperatures when 90% of solid and 99% of solid form. The strain rate is the average inelastic strain rate within ∆TB. The model accumulates "damage strain" at every node in the grid by summing the flow strain and inelastic strain components during the time steps while the nodal temperature is in the brittle temperature range, ∆TB. This provides a relative measure of crack potential. Furthermore, comparing these damage strain components with the critical strain given in Eq. (10) allows the model to predict crack formation and orientation.
PARAMETRIC STUDY AND COMPUTATIONAL DETAILS
To investigate the maximum casting speeds under different mold lengths and section sizes, nine sets of simulations were performed for the 3 mold lengths and 3 section sizes shown in Table III.
Table III: Parametric Study Conditions Billet Section Size (mm× mm) 120× 120, 175× 175, 250× 250 Working Mold Length (mm) 500, 700, 1000 Total Mold Length (mm) 600, 800, 1100 Taper (%m) 0.75 (on both face) Time to turn on ferrostatic pressure (sec.) 0.3 Mesh Size (mm× mm) 0.1× 0.1 - 1.4× 1.0 Number of Nodes (varies with section size) 7381, 10797, 15433 Number of Elements (varies with section size) 7200, 10560, 15120 Time Step Size (sec.) 0.001 - 0.5 Pouring Temperature (oC) 1540.0
For each section size and working mold length, simulations were performed with various casting speeds and evaluated using both failure criteria to determine whether the failure of the shell occurs. The case with 120mm section size and 700mm working mold length, which is highlighted in Table III, is chosen as a base case to analyze since it is widely used at many casters. Mesh size continuously changes from 0.1mm to 1.4mm from slab surface to the center. Time step size stepwisely changes from 0.001 sec. to 0.5 sec.. Each simulation is divided into two parts, one within the mold and the other below the mold. It takes approximately 4 hours to complete a single simulation with around 4000 time steps on a dual Pentium III 933MHz CPU workstation with 1GB RAM running Windows 2000 Pro OS.
TYPICAL RESULTS
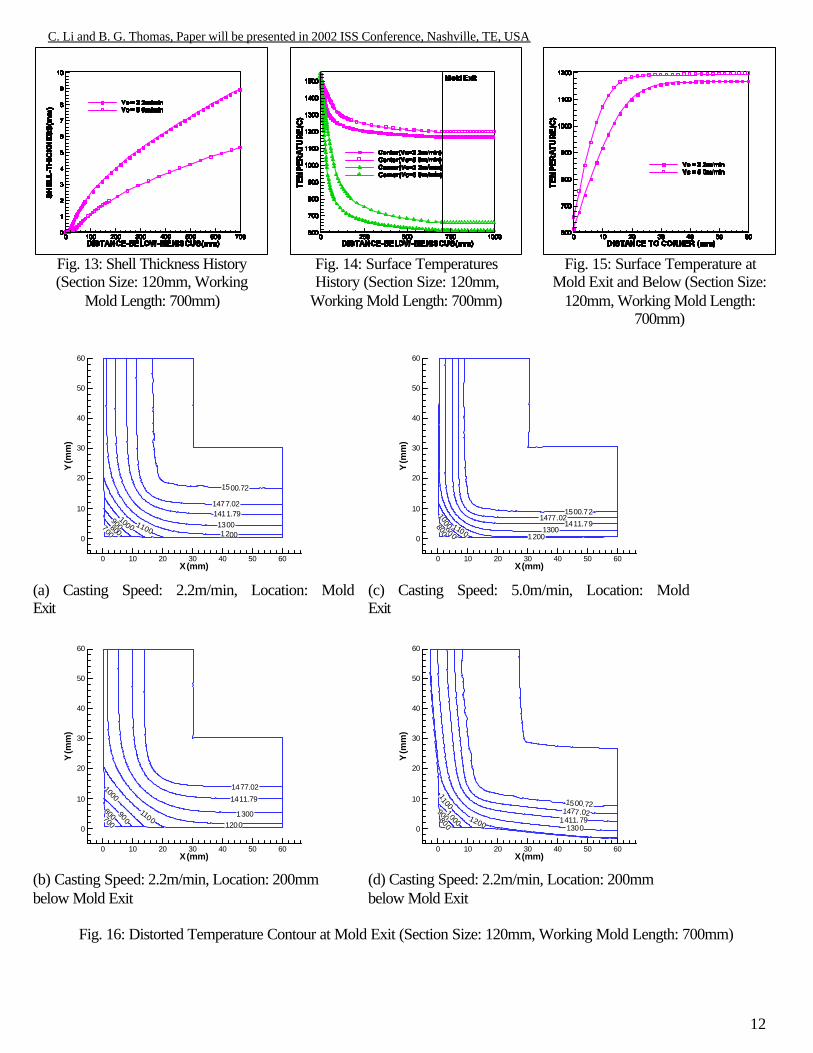
Heat Transfer Model Results Fig. (13) shows the shell thickness histories of the base case under 2.2m/min and 5.0m/min casting speed. The shorter dwell time in the mold leads to less total heat extracted. Thus, the shell thickness at the mold exit is thinner at higher casting speed.
C. Li and B. G. Thomas, Paper will be presented in 2002 ISS Conference, Nashville, TE, USA
12
Fig. 13: Shell Thickness History (Section Size: 120mm, Working
Mold Length: 700mm)
Fig. 14: Surface Temperatures History (Section Size: 120mm,
Working Mold Length: 700mm)
Fig. 15: Surface Temperature at
Mold Exit and Below (Section Size: 120mm, Working Mold Length:
700mm)
1500.72
1477.021411.7913001200
1100
1000
900800
700
X(mm)
Y(m
m)
0 10 20 30 40 50 60
0
10
20
30
40
50
60
(a) Casting Speed: 2.2m/min, Location: Mold Exit
1500.721477.02
1411.791300
12001100
1000
900
800
X(mm)
Y(m
m)
0 10 20 30 40 50 60
0
10
20
30
40
50
60
(c) Casting Speed: 5.0m/min, Location: Mold Exit
1477.02
1411.79
13001200
1100
1000
900
800700
X(mm)
Y(m
m)
0 10 20 30 40 50 60
0
10
20
30
40
50
60
(b) Casting Speed: 2.2m/min, Location: 200mm below Mold Exit
1500.721477.02
1411.791300
1200
11001000
900800
X(mm)
Y(m
m)
0 10 20 30 40 50 60
0
10
20
30
40
50
60
(d) Casting Speed: 2.2m/min, Location: 200mm below Mold Exit
Fig. 16: Distorted Temperature Contour at Mold Exit (Section Size: 120mm, Working Mold Length: 700mm)

C. Li and B. G. Thomas, Paper will be presented in 2002 ISS Conference, Nashville, TE, USA
13
Fig. (14) shows the corresponding billet surface temperatures. Naturally, higher surface temperature is produced by higher casting speed, due to the shorter time at any given distance down the mold. However, the increase is not very large because of the higher heat flux produced at shorter times (high speed) as given in Fig. (3). Fig. (15) shows the surface temperature at mold exit which is assumed to stay unchanged below the mold exit. Surface temperature far from the corner is approximately constant due to one-dimensional heat transfer. Temperature drops toward the corner despite the constant heat flux profile around the perimeter. This is due to 2D heat transfer at the corner. Stress Model Results Fig. (16) shows the distorted temperature contours at mold exit and 200mm below the mold exit for both casting speeds. It is observed that the thinner, hotter, and weaker shell bulges more at high casting speed under the ferrostatic pressure.
0
4 40 -4-6-6
6
-6
-6
- 40
4
46
X(mm)
Y(m
m)
0 10 20 30 40 50 60
0
10
20
30
40
50
60
(a) Casting Speed: 2.2m/min,Location: Mold Exit
4
4
0
-2
-6 -6-4-88
8
-8
-6
-6
X(mm)
Y(m
m)
0 10 20 30 40 50 60
0
10
20
30
40
50
60
(c) Casting Speed: 5.0m/min, Location: Mold Exit
-10 -6-8-6
0 44
8
8
10
10
8
4
6
0-10
- 8-6
-4
X(mm)
Y(m
m)
0 10 20 30 40 50 60
0
10
20
30
40
50
60
(b) Casting Speed: 2.2m/min, Location: 200mm
below Mold Exit
12
12
12
12
12
12
-12
-12
0
0
0
0
8-48
8- 4
X(mm)
Y(m
m)
0 10 20 30 40 50 60
0
10
20
30
40
50
60
(d) Casting Speed: 5.0m/min, Location: 200mm
below Mold Exit
Fig. 17: Hoop Stress Contours (Section Size: 120mm, Working Mold Length: 700mm)
C. Li and B. G. Thomas, Paper will be presented in 2002 ISS Conference, Nashville, TE, USA
14
0.6
-0.6-0.4-0.
200.40.2
-0.8-1
-1
-0.6
-0.4-0.2
00.2
0.4
0.6-0.8
-0.4
-0.4
X(mm)
Y(m
m)
0 10 20 30 40 50 60
0
10
20
30
40
50
60
(a) Casting Speed: 2.2m/min, Location: Mold
Exit
-1-0.6
-0.8-0.2
-0.6
-0.2-0.4
-0.8 -0.4
-0.6
-0.8
-1
-1
-0.8
-0.6
-0.4
-0.4
0
0.40.40.4
0.2
0
-0.4
-0.4
0.4
0.2
-0.6
X(mm)
Y(m
m)
0 10 20 30 40 50 60
0
10
20
30
40
50
60
(c) Casting Speed: 5.0m/min, Location: Mold
Exit
-1.6
-1.6
0
0
-1.2
-0.8
-1.2 -0.8-0.8
-0.8
-0.4
-0.4
1
1
0.8
0.6
X(mm)
Y(m
m)
0 10 20 30 40 50 60
0
10
20
30
40
50
60
(b) Casting Speed: 2.2m/min, Location: 200mm
below Mold Exit
2
2
0 .4
-1
-1
-1
-1
0.4
0.4
-1
-1
2
2
1.6 1.2
1.61.2
0
0
X(mm)
Y(m
m)
0 10 20 30 40 50 60
0
10
20
30
40
50
60
(d) Casting Speed: 5.0m/min, Location: 200mm
below Mold Exit
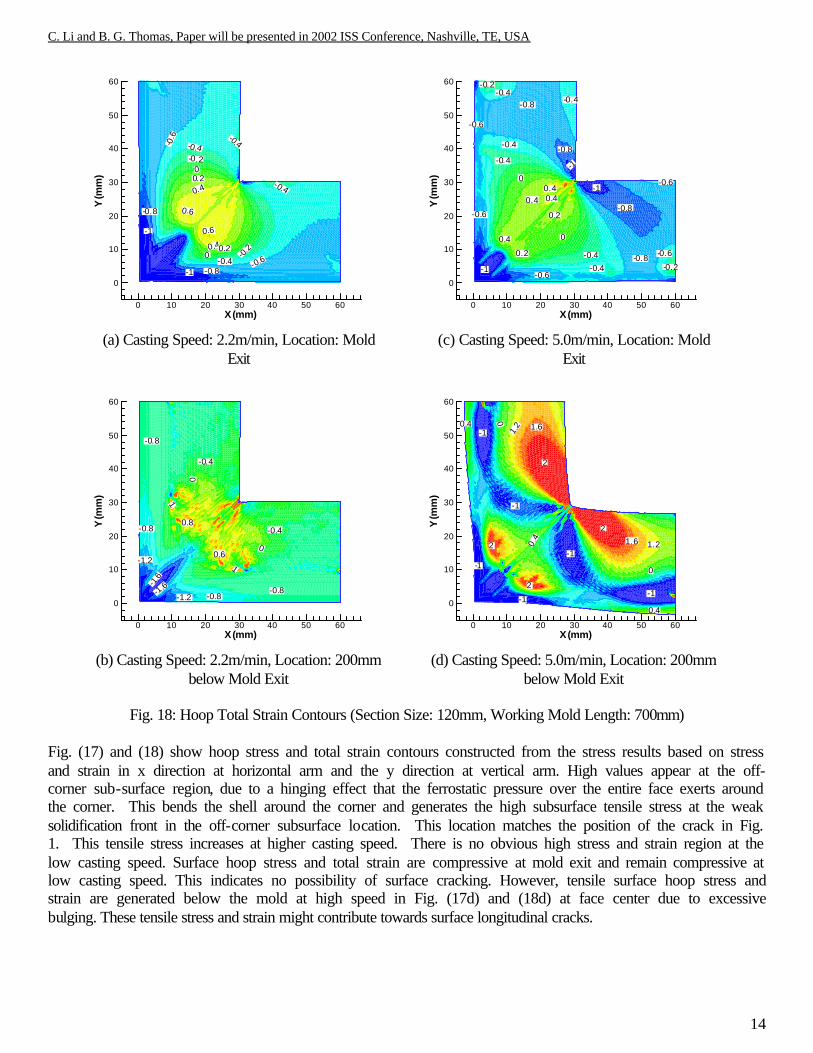
Fig. 18: Hoop Total Strain Contours (Section Size: 120mm, Working Mold Length: 700mm)
Fig. (17) and (18) show hoop stress and total strain contours constructed from the stress results based on stress and strain in x direction at horizontal arm and the y direction at vertical arm. High values appear at the off-corner sub-surface region, due to a hinging effect that the ferrostatic pressure over the entire face exerts around the corner. This bends the shell around the corner and generates the high subsurface tensile stress at the weak solidification front in the off-corner subsurface location. This location matches the position of the crack in Fig. 1. This tensile stress increases at higher casting speed. There is no obvious high stress and strain region at the low casting speed. Surface hoop stress and total strain are compressive at mold exit and remain compressive at low casting speed. This indicates no possibility of surface cracking. However, tensile surface hoop stress and strain are generated below the mold at high speed in Fig. (17d) and (18d) at face center due to excessive bulging. These tensile stress and strain might contribute towards surface longitudinal cracks.

C. Li and B. G. Thomas, Paper will be presented in 2002 ISS Conference, Nashville, TE, USA
15
Fig. (19) quantifies the extent of surface displacements at mold exit and 200mm below mold exit for both casting speeds. This shows that bulging increases rapidly after a threshold has been crossed in either excessive temperature or insufficient shell thickness.
DISTANCE TO CORNER (mm)
V-D
ISP
LAC
EM
EN
T(m
m)
0 10 20 30 40 50 60-4
-2
0
Vc = 2.2m/min, Mold ExitVc = 5.0m/min, Mold ExitVc = 2.2m/min, 200mm below Mold ExitVc = 5.0m/min, 200mm below Mold Exit
Fig. 19: Surface Displacements at Mold Exit and 200mm Below (Section Size: 120mm, Working Mold Length: 700mm)
Fig. 20: Histories of Strains at (6.7mm,17.4mm) (Section Size: 120mm, Working Mold Length:
700mm, Speed: 2.2m/min)
Fig. 21: Histories of Strains at (6.7mm,17.4mm) (Section Size: 120mm, Working Mold Length:
700mm, Speed: 5.0m/min) Fig. (20) and (21) show the evolution of the strains for the point at (6.7mm, 17.4mm), which is in the high strain region (off-corner subsurface), for the two casting speeds. Little plastic strain is developed when the billet exits the mold at normal casting speed, 2.2m/min. Substantial plastic strain is developed at higher casting speed, 5.0m/min. Moreover, much more inelastic strain, flow strain and plastic strain, is developed during the brittle temperature range, ∆TB. Inelastic strain developed here could contribute to longitudinal hot tearing cracks at the off-corner subsurface location. The strain histories also indicate that most of the inelastic strain develops just below mold exit. As the billet moves farther below mold exit, the shell thickens and becomes strong enough to withstand the ferrostatic pressure, as the average temperature across the billet section drops.
C. Li and B. G. Thomas, Paper will be presented in 2002 ISS Conference, Nashville, TE, USA
16
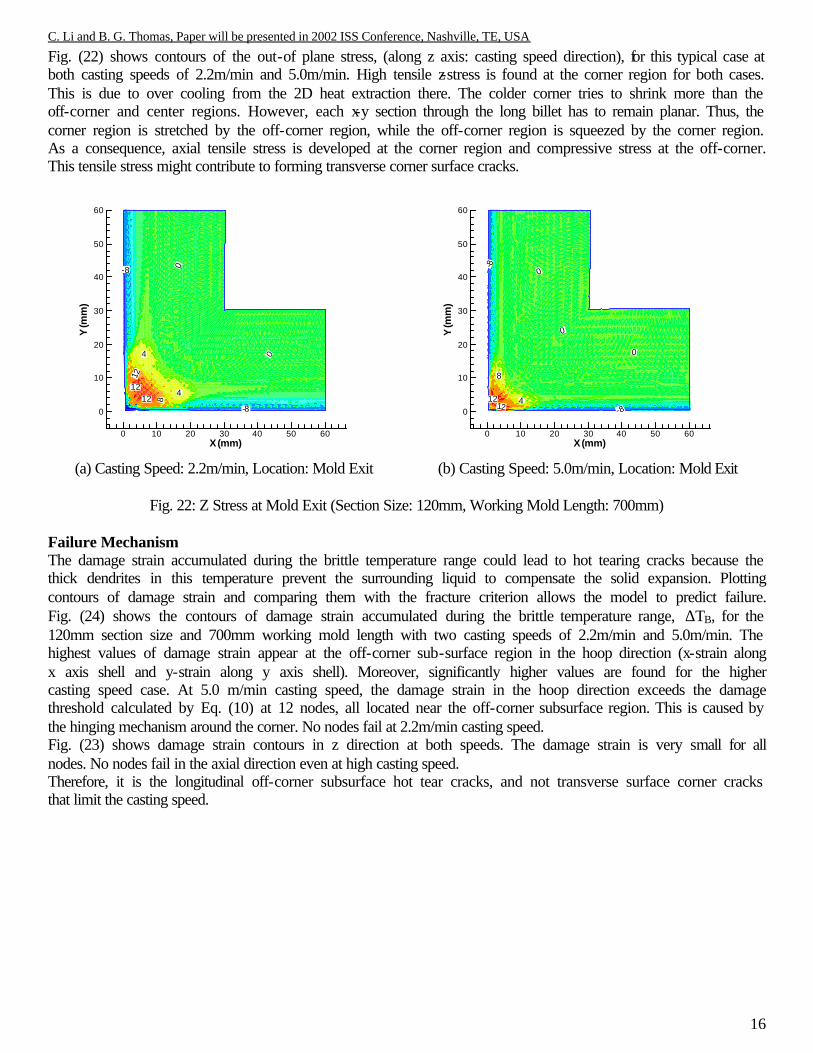
Fig. (22) shows contours of the out-of plane stress, (along z axis: casting speed direction), for this typical case at both casting speeds of 2.2m/min and 5.0m/min. High tensile z-stress is found at the corner region for both cases. This is due to over cooling from the 2D heat extraction there. The colder corner tries to shrink more than the off-corner and center regions. However, each x-y section through the long billet has to remain planar. Thus, the corner region is stretched by the off-corner region, while the off-corner region is squeezed by the corner region. As a consequence, axial tensile stress is developed at the corner region and compressive stress at the off-corner. This tensile stress might contribute to forming transverse corner surface cracks.
0
04
4
12
8
1212
-8
-8
X(mm)
Y(m
m)
0 10 20 30 40 50 60
0
10
20
30
40
50
60
(a) Casting Speed: 2.2m/min, Location: Mold Exit
8
41212 -8
-8
0
0
0
X(mm)Y
(mm
)0 10 20 30 40 50 60
0
10
20
30
40
50
60
(b) Casting Speed: 5.0m/min, Location: Mold Exit
Fig. 22: Z Stress at Mold Exit (Section Size: 120mm, Working Mold Length: 700mm)
Failure Mechanism The damage strain accumulated during the brittle temperature range could lead to hot tearing cracks because the thick dendrites in this temperature prevent the surrounding liquid to compensate the solid expansion. Plotting contours of damage strain and comparing them with the fracture criterion allows the model to predict failure. Fig. (24) shows the contours of damage strain accumulated during the brittle temperature range, ∆TB, for the 120mm section size and 700mm working mold length with two casting speeds of 2.2m/min and 5.0m/min. The highest values of damage strain appear at the off-corner sub-surface region in the hoop direction (x-strain along x axis shell and y-strain along y axis shell). Moreover, significantly higher values are found for the higher casting speed case. At 5.0 m/min casting speed, the damage strain in the hoop direction exceeds the damage threshold calculated by Eq. (10) at 12 nodes, all located near the off-corner subsurface region. This is caused by the hinging mechanism around the corner. No nodes fail at 2.2m/min casting speed. Fig. (23) shows damage strain contours in z direction at both speeds. The damage strain is very small for all nodes. No nodes fail in the axial direction even at high casting speed. Therefore, it is the longitudinal off-corner subsurface hot tear cracks, and not transverse surface corner cracks that limit the casting speed.

C. Li and B. G. Thomas, Paper will be presented in 2002 ISS Conference, Nashville, TE, USA
17
0
0
0.075 0.075 0.05
0
0.025
0
0.0 5
-0.05
X(mm)
Y(m
m)
0 10 20 30 40 50 60
0
10
20
30
40
50
60
(a) Casting Speed: 2.2m/min, Location: Mold Exit
0
0
0
0.0 5
0. 02 5
0.025 0.075 0.05
0
0
X(mm)
Y(m
m)
0 10 20 30 40 50 60
0
10
20
30
40
50
60
(b) Casting Speed: 5.0m/min, Location: Mold Exit
Fig. 23: Z Damage Strain (Section Size: 120mm, Working Mold Length: 700mm)
0.08
0.06
0.04
0
0 0.08
0.06 0.04
0.1
0.1
0.080.04
0
X(mm)
Y(m
m)
0 10 20 30 40 50 60
0
10
20
30
40
50
60
(a) Casting Speed: 2.2m/min, Location: Mold Exit
0.10.1 0.1
0.04
0
0
-0.04
0.1
0.1
0.02
0.04
0.08
0.08
X(mm)
Y(m
m)
0 10 20 30 40 50 60
0
10
20
30
40
50
60
(c) Casting Speed: 5.0m/min, Location: Mold Exit
0.2
0.2
0.05
0.05
0
0
0
0.05
0.05
X(mm)
Y(m
m)
0 10 20 30 40 50 60
0
10
20
30
40
50
60
(b) Casting Speed: 2.2m/min, Location: 200mm
below Mold Exit
0.4
0 .4
0
0
0
-0.4
-0.4
0.05
0.05
0.0 5
0.05
0
X(mm)
Y(m
m)
0 10 20 30 40 50 60
0
10
20
30
40
50
60
(d) Casting Speed: 5.0m/min, Location: 200mm
below Mold Exit
Fig. 24: Hoop Damage Strain (Section Size: 120mm, Working Mold Length: 700mm)

C. Li and B. G. Thomas, Paper will be presented in 2002 ISS Conference, Nashville, TE, USA
18
Critical Casting Speed Using the damage criterion described by Eq. (10), casting speed limit to avoid crack initiation can be obtained by running many cases with various casting speeds. The minimum speed having failed nodes is the critical speed limit for that section size, mold length and steel grade. For the base case, with 120mm section size and 800mm mold length, the critical casting speed is close to 5.0m/min. This indication matches the experimental findings[40]. From the previous discussion, higher casting speed leads to higher plastic strain at off-corner sub-surface region as well as larger bulging, as indicated by Fig. (25). It indicates that sub-mold bulging will eventually stop increasing due to the shell growth. The maximum bulging is plotted versus casting speed in Fig. (26). This reveals how the maximum bulging increases with casting speed. The maximum bulging increases sharply as casting speed increases near the critical casting speed indicated by hot tear criterion. This sharp threshold indicates that the critical casting speed is not particularly sensitive to steel grade.
Fig. 25: Displacement Histories at Surface Center
(Section Size: 120mm, Working Mold Length: 700mm)
Fig. 26: Maximum Bulging vs. Casting Speeds
Fig. (26) could be used to determine casting speed limit under any specific maximum bulging criterion. Maximum bulging of 4mm to 10mm corresponds to off-corner sub-surface longitudinal crack formation. The critical speeds to avoid cracks, thus, are higher than the critical speeds to satisfy the 1mm maximum bulging criterion, given the same section size and mold length. Effect of Section Size and Mold Length Fig. (27) and (28) show the critical speed for different section sizes and working mold lengths, based on the hot tear criterion and the 1mm maximum bulging criterion, respectively. The critical casting speed increases as the working mold length increases for a given section size. For example, the critical casting speed based on the cracking criterion increases from 3.75m/min. to 6m/min. as the working mold length increases from 500mm to 1000mm for 120mm square section size. This is due to colder and thicker shell at mold exit for the longer dwell time in the mold. The critical speed decreases as the section size increases in a given mold length. For example, the critical casting speed based on the cracking criterion decreases from 5m/min. to 1.8m/min. as the section size increases from 120mm to 250mm for 800mm mold. It is very sensitive to the mold section size because the larger surface subjected to ferrostatic pressure provides a lever arm for much bending around the corner.

C. Li and B. G. Thomas, Paper will be presented in 2002 ISS Conference, Nashville, TE, USA
19
Note that the critical casting speeds in the larger section size mold, 250mm× 250mm, were underestimated in this study. This error is due to neglecting the axial support provided by mold bottom, which is not included in the 2D model. Thus the critical casting speed predictions in this work are expected to be slightly conservative.
1
2
3
4
5
6
7
100 120 140 160 180 200 220 240 260
(WML = 500mm)(WML = 700mm)(WML = 1000mm)
Section Size (mm x mm) Fig. 27: Critical Speeds Based on Off-Corner
Longitudinal Crack Criterion
0
1
2
3
4
5
6
100 120 140 160 180 200 220 240 260
Maximum Casting Speed - WML=500mm (m/min)Maximum Casting Speed - WML=700mm (m/min)Maximum Casting Speed - WML=1000mm (m/min)
Section Size (mm) Fig. 28: Critical Speeds Based on 1mm Maximum
Bulging Criterion
IMPLICATIONS
Productivity is always a consideration interest for caster designers and operators. The critical casting speed plots developed in this work are useful guidelines for casting engineers in choosing safe casting speeds. Table IV predicts the corresponding productivity limits, based on both the off-corner longitudinal crack criterion and 1mm maximum bulging criterion.
Table IV: Productivity Limits (tonne/min2) Longitudinal Off-Corner Crack Criterion 1mm Maximum Bulging Criterion
Section Size (mm) Section Size (mm) Mold Length (mm) 120× 120 175× 175 250× 250 120× 120 175× 175 250× 250
600 0.4 0.7 0.7 0.4 0.5 0.4 800 0.6 0.9 0.9 0.5 0.6 0.5 1100 0.7 1.0 1.2 0.6 0.8 0.7
The intuitive productivity benefit from large section size is almost offset by the lower casting speed limits to avoid excessive bulging or off-corner cracks. Casting at the desired cross section size to minimize rolling cost will not lose much productivity. Longer mold length increases the productivity limits. This is because the thicker, colder shell allows higher casting speed before bulging below the mold becomes excessive. Based on this finding, extra sub-mold support, such as properly aligned foot rolls, should also allow increasing productivity. The latter approach avoids the problems associated with longer molds, as surface temperature can be easily controlled by sprays and the shorter mold is less sensitive to mold taper problems.
2 Steel Density is assumed to be 7800Kg/m3

C. Li and B. G. Thomas, Paper will be presented in 2002 ISS Conference, Nashville, TE, USA
20
CONCLUSIONS
• A finite element thermal mechanical model was developed and applied to investigate the maximum casting speed for continuous casting of steel billets with square sections sizes and mold lengths, assuming uniform heat flux around the mold perimeter and no sub-mold support. This model solves 2D finite element equations to predict 3D stress and strain states with the generalized plane strain assumption in the out-of-plane direction. An accurate creep constitutive model, temperature dependent material properties, and non-equilibrium phase transformation temperatures are features of this model.
• Higher casting speed leads to a thinner and hotter shell at mold exit and more bulging below the mold. Excessive bulging below mold exit may generate subsurface off-corner longitudinal hot tear cracks due to subsurface tension on the weak solidification front due to hinging around the corner, especially just below mold exit.
• Fig. (26) is a tool for mold designers or operators to determine critical casting speeds for any chosen maximum bulging criterion. For the 0.27%C steel, an empirical fracture criterion for hot tearing based on strain, strain rate and mushy zone temperature range corresponds to 4-10 mm maximum bulging. This indicates critical casting speeds of 5 m/min for a 120mm square section and 800mm mold and 1.5m/min for a 250mm square section and 500mm mold.
• As section size increases from 120mm to 250mm, the critical casting speed decreases from 5.0m/min. to 1.8m/min. for a 800mm mold, due to the higher off-corner subsurface tensile strain caused by larger ferrostatic bending force.
• As mold length increases 600mm to 1100mm, the critical casting speed increases from 3.75m/min. to 6m/min. for 120mm section size, due to the colder and thicker shell at the mold exit.
• High tensile stresses build up at the billet corner may contribute to transverse corner cracks due to high corner cooling with the ideal taper and alignment assumed here, these cracks appear not to limit casting speed.
• Billet casting productivity is limited by off-corner subsurface hot tear cracks to around 1 tonne/min. Increasing section size billet does not produce a significant advantage in productivity. Longer mold length and sub-mold support, such as properly aligned foot rolls, are recommended to achieve higher productivity.
REFERENCES
1. J. Herbertson, Q.L. He, P.J. Flint, R.B. Mahapatra, "Modelling of Metal Delivery to Continuous Casting Moulds," Steelmaking Conference Proceedings, (Washington, D.C., USA), Iron and Steel Society, Inc., 410 Commonwealth Dr., Warrendale, Pennsylvania 15086, USA, Vol. 74, 1991, 171-185, 216.
2. J. Kubota, K. Okimoto, A. Shirayama, H. Murakami, "Meniscus Flow Control in the Mold by Travelling Magnetic Field for High Speed Slab Caster," Steelmaking Conference Proceedings, (Washington, D.C., USA), Iron and Steel Society, Inc., 410 Commonwealth Dr., Warrendale, Pennsylvania 15086, USA, Vol. 74, 1991, 233-241, 217.
3. K. Schwerdtfeger, "Benefits, challenges and limits in new routes for hot strip production," ISIJ International, Vol. 38 (8), 1998, 852-861.
4. C. Li and B.G. Thomas, "Analysis of the Potential Productivity of COntinuous Cast Molds," Brimacombe Memorial Symposium, (Vancouver, Canada), Canadian Inst. Min. Metall., Montreal, Canada, 2000, 17, 201.
5. J.K. Brimacombe, F. Weinberg and E.B. Hawbolt, "Formation of Longitudinal, Midface Cracks in Continuously-Cast Slabs," Metallurgical and Materials Transactions B, Vol. 10B, 1979, 279-292.
6. R.B. Mahapatra, J.K. Brimacombe and I.V. Samarasekera, "Mold Behavior and Its Influence on Quality in the Continuous Casting of Steel Slabs: Part II. Mold Heat Transfer, Mold Flux Behavior, Formation

C. Li and B. G. Thomas, Paper will be presented in 2002 ISS Conference, Nashville, TE, USA
21
of Oscillation Marks, Longitudinal Off-corner Depressions, and Subsurface Cracks," Metallurgical and Materials Transactions B, Vol. 22B (6), 1991, 875-888.
7. M.M. Wolf, Continuous Casting: Initial Solidifcation and Strand Surface Quality of Peritectic Steels, Vol. 9, I.a.S. Society, ed., Iron ans Steel Society, 1997, 221.
8. B.G. Thomas, R. O'Malley, T. Shi, Y. Meng, D. Creech, D. Stone, "Validation of Fluid Flow and Solidification Simulation of a Continuous Thin Slab Caster," Modeling of Casting, Welding, and Advanced Solidification Processes, (Shaker Verlag GmbH, Aachen, Germany), Vol. IX, 2000, 769-776.
9. X. Huang, B.G. Thomas and F.M. Najjar, "Modeling Superheat Removal During Continuous Casting of Steel Slabs," Metallurgical Transactions B, Vol. 23B (3), 1992, 339-356.
10. J.K. Brimacombe, "Design of continuous casting machines based on a heat-flow analysis: state-of-the-art review," Canadian Metallurgical Quarterly, Vol. 15 (2), 1976, 163-175.
11. J.K. Brimacombe, P.K. Agarwal, L.A. Baptista, S. Hibbins, B. Prabhakar, "Spray Cooling in the Continuous Casting of Steel," ISS, Iron and Steel Society, Inc., Warrendale, PA, Vol. 2, 1984, 105-123, 101.
12. B.G. Thomas, A. Denissov and H. Bai, "Behavior of argon bubbles during continuous casting of steel," 80th Steelmaking Conference, (Chicago, IL, USA), Iron and Steel Society/AIME, 410 Commonwealth Drive, Warrendale, PA 15086-7528, USA, Vol. 80, 1997, 375-384.
13. J. Knoepke, M. Hubbard, J. Kelly, R. Kittridge, J. Lucas, "Pencil blister reduction at Inland Steel Company," Steelmaking Conference, (Chicago, IL, USA), Iron and Steel Society/AIME (USA), 410 Commonwealth Dr.P.O. Box 411, Warrendale, PA 15086-7512, USA, Vol. 77, 1994, 381-388.
14. J.K. Park, J. Choi and C.H. Yim, Report, Iron & Steel Making Research Team, Technical Research Labs., POSCO, Pohang, Korea, 1996.
15. J.E. Lait, J.K. Brimacobe and F. Weinberg, "Mathematical modelling of heat flow in the continuous casting of steel," Ironmaking and Steelmaking, Vol. 1 (2), 1974, 90-97.
16. J.-P. Birat, M. Larrecq, J.-Y. Lamant, J. Petegnief, "The Continuous Casting Mold: a Basic Tool for Surface Quality and Strand Productivity," Steelmaking Conference, (Washington, D.C., USA), Iron and Steel Society, Inc., 410 Commonwealth Dr., Warrendale, Pennsylvania 15086, USA, Vol. 74, 1991, 39-50.
17. A. Grill, K. Sorimachi and J.K. Brimacombe, "Heat Flow, Gap Formation and Break-Outs in the Continuous Casting of Steel Slabs," Metall. Trans. B, Vol. 7B (2), 1976, 177-189.
18. K. Sorimachi and J.K. Brimacombe, "Improvements in Mathematical Modelling of Stresses in Continuous Casting of Steel," Ironmaking Steelmaking, Vol. 4 (4), 1977, 240-245.
19. A. Grill, J.K. Brimacombe and F. Weinberg, "Mathematical Analysis of Stresses in Continuous Casting of Steel," Ironmaking Steelmaking, Vol. 3 (1), 1976, 38-47.
20. H. Zhu, "Coupled Thermal-Mechanical Finite-Element Model with Application to Initial Solidification," Ph.D. Thesis, University of Illinois at Urbana-Champaign, 1996.
21. A. Moitra, "Thermo-Mechanical Model of Steel Shell Behavior in Continuous Slab Casting," Ph.D. Thesis, University of Illinois at Urbana-Champaign, 1993.
22. E. Lemmon, "Multi-dimentional Integral Phase Change Approximations for Finite-Element Conduction Codes," Numerical Methods in Heat Transfer, 1981, 201-213.
23. Y.M. Won, K.-h. Kim, T.-j. Yeo, K.H. Oh, "Effect of Cooling Rate on ZST, LIT and ZDT of Carbon Steels Near Melting Point," ISIJ International, Vol. 38 (10), 1998, 1093-1099.
24. D. Lorento. Unpublished casting speed measurements. (2001), 25. M.M. Wolf, "Mold Length in Slab Casting - A Review," Ironmaking and Steelmaking, Vol. 23 (2),
1996, 47-51. 26. J.K. Park, I.V. Samarasekera, B.G. Thomas, U.S. Yoon, "Analysis of Thermal and Mechanical Behavior
of Copper Mould During Thin Slab Casting," 83th Steelmaking Conference Proceedings, (Pittsburgh, PA), Iron and Steel Society, Vol. 83, 2000, 9-21, 061.

C. Li and B. G. Thomas, Paper will be presented in 2002 ISS Conference, Nashville, TE, USA
22
27. N. Kapaj, M. Pavlicevic and A. Poloni, "Exceeding the casting speed of bloom CC machines by three times," 84th Steelmaking Conference, (Baltimore, MD, USA), Iron and Steel Society/AIME, 186 Thorn Hill Road, Warrendale, PA 15086-7528, USA, Vol. 84, 2001, 67-78.
28. L. Strezov and J. Herbertson, "Experimental studies of interfacial heat transfer and initial solidification pertinent to strip casting," ISIJ International (Japan), Vol. 38 (9), 1998, 959-966.
29. G. Li and B.G. Thomas, "Transient thermal model of the continuous single-wheel thin-strip casting process," Metallurgical and Materials Transactions B, Vol. 27B (3), 1996, 509-525.
30. P.F. Kozlowski, B.G. Thomas, J.A. Azzi, H. Wang, "Simple Constitutive Equations for Steel at High Temperature," Metallurgical and Materials Transactions, A, Vol. 23 (March), 1992, 903-918.
31. P.J. Wray, "Plastic Deformation of Delta-Ferritic Iron at Intermediate Strain Rates," Metallurgical and Materials Transactions A, Vol. 7A (November), 1976, 1621-1627.
32. Y.M. Won and B.G. Thomas, "Simple Model of Microsegregation during Solidification of Steels," Metallurgical and Materials Transactions A, Vol. 32A (July, 2001), 2001, 1755-1767.
33. R.D. Pehlke, A. Jeyarajan and H. Wada, "Summary of Thermal Properties for Casting Alloys and Mold Materials," Report No. NSF/MEA-82028, Department of Materials and Metallurgical Engineering, University of Michigan, 1982, PB83 211003.
34. K. Harste, A. Jablonka and K. Schwerdtfeger, "Shrinkage and Formation of Mechanical Stresses During Solidification of Round Steel Strands," 4th International Conference Continuous Casting. Preprints. Vol. , ,, (Brussels, Belgium), Verlag Stahleisen, P.O. Box 8229, D-4000, Dusseldorf 1, FRG, Vol. 2, 1988, 633-644.
35. I. Jimbo and A. A. W. Cramb, "The Density of Liquid Iron--Carbon Alloys," Metallurgical Transactions B (USA), Vol. 24B (1), 1993, 5-10.
36. H. Mizukami, K. Murakami and Y. Miyashita, Tetsu-to-Hagane (J. Iron Steel Inst. Jpn.), Vol. 63 (146), 1977, S-652.
37. J.H. Weiner and B.A. Boley, "Elasto-Plastic Thermal Stresses in A Solidifying Body," J. Mech. Phys. Solids, Vol. 11, 1963, 145-154.
38. I. The Mathworks, MATLAB User Manual, Ver. 5.3, 3 Apple Hill Dr., Natick, MA 01760, 1999. 39. Y. WON, T.-j. YEO, D. SEOL, K. OH, "A New Criterion for Internal Crack Formation in Continuously
Cast Steels," Metallurgical and Materials Transactions, Vol. 31B (4), 1999, 779~794. 40. J. Lu, J.T. Wang, B.Z. Ding, S.L. Li, "Cooling Rate Effect on the Anelastic Properties and Young's
Modulus of Amorphous FeBSi Alloys," Scripta Metallurgical et Materialia, Vol. 24, 1990, 1879-1883.