maximum likelihood estimator of proportion let {s 1,s 2,…,s n } be a set of independent outcomes...
TRANSCRIPT

Maximum Likelihood Estimator of Proportion
• Let {s1,s2,…,sn} be a set of independent outcomes from a Bernoulli experiment with unknown probability.
• The likelihood function of probability p is
ii
ii
sns
n
i
n
i
ssi
pp
pppsfpL
1
1;1 1
1

n
ii
n
ii
ii
sns
isns
i
sp
sn
p
psnpsp
pL
ppsnppsp
pLiiii
1
1
11
n
1is ofestimator likelihood maximum theTherefore,
1
010d
d
11d
d

Unbiased Estimator• Let G( X1,X2,…,Xn) be an estimator of a
parameter r in a distribution. If E[G( X1,X
2,…,Xn) ]=r, then G( X1,X2,…,Xn) is called an unbiased estimator of r.
• For example,
is an unbiased estimator of the probability in a Bernoulli distribution, since
n
iiX
nX
1
1
n
ii
n
ii pXE
nXE
nXE
11
.11

Estimation of the Expected value of a Normal Distribution
• is a unbiased estimator of μ, since
n
iiX
n 1
1
n
ii
n
ii XE
nX
nE
11
.11

Estimation of the Variance of a Normal Distribution
n
i jiji
n
ii
n
i
n
ii
n
i
n
iii
n
ii
n
ii
XXn
Xn
XE
XnXE
XXXnXE
XXXXEVE
Xn
XwhereXXVLet
i
i
i
1
2
1
2
2
1
2
1
2
1
2
1
22
11
2
21
2
2
1 ,
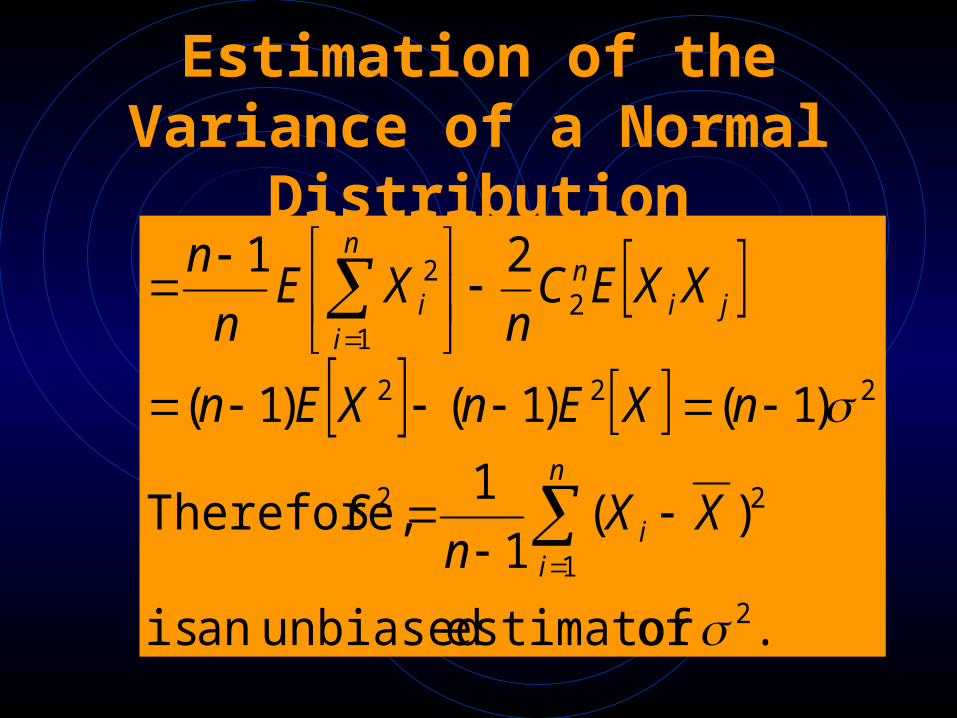
Estimation of the Variance of a Normal Distribution
. of estimator unbiasedan is
)(1
1 Therefore,
)1()1()1(
21
2
1
22
222
21
2
n
ii
jin
n
ii
XXn
S
nXEnXEn
XXECn
XEn
n

Maximum Likelihood Estimators of the Normal Distribu
tions• Let x1, x2,…, xn be random samples from a norma
l distribution with p.d.f
• The likelihood function is
s
rx
es
xf
2)(
2
1
2
1)(
n
i
i
n
i
i
n
i
s
rx
s
rxs
n
s
rxssrL
es
srLi
1
2
1
2
1
2
)(
2
)(2ln
2
2
)(2ln
2
1),(ln
and 2
1),(
2
n
ii
n
i
i
n
i
i
xn
rs
rx
r
srL
s
rx
r
srL
11
1
10
)(0
),(
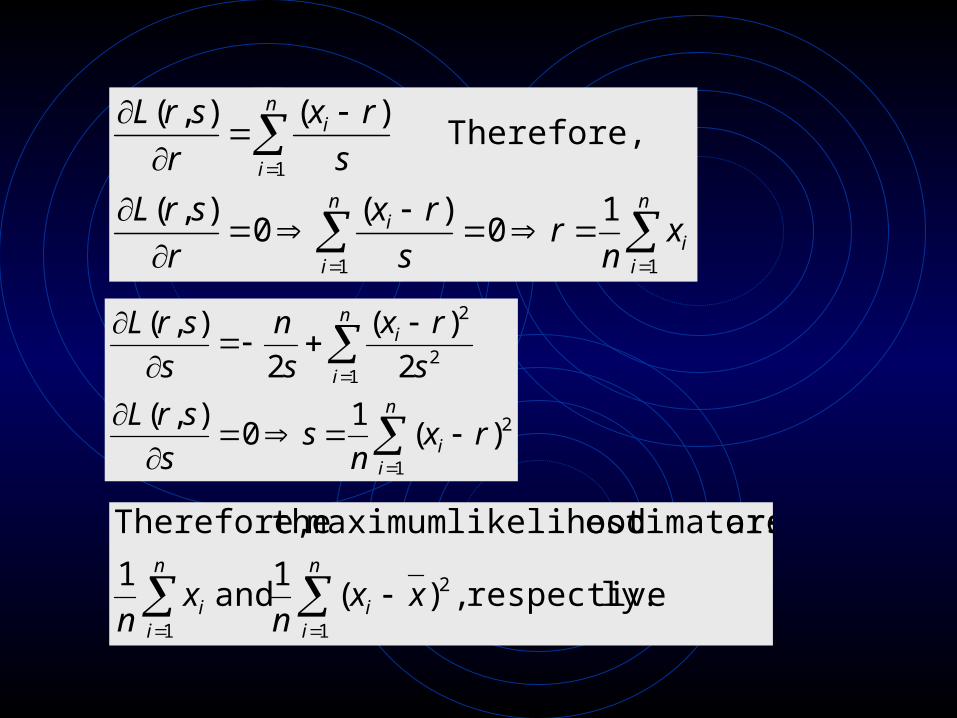
Therefore, )(),(
n
ii
n
i
i
rxn
ss
srL
s
rx
s
n
s
srL
1
2
12
2
)(1
0),(
2
)(
2
),(
ly.respective ,)(1
and 1
are estimators likelihood maximum theTherefore,
1
2
1
n
ii
n
ii xx
nx
n

The Central Limit Theorem• Let X1,X2,…,Xn be random samples from a distrib
ution with mean µ and variance σ2. Then,
• Similarly, we can say
n as 0,1N approaches
1
11
n
nX
n
Xn
Z
n
i
n
i
n as n
, N approaches 1 2
1
n
i
Xn
X
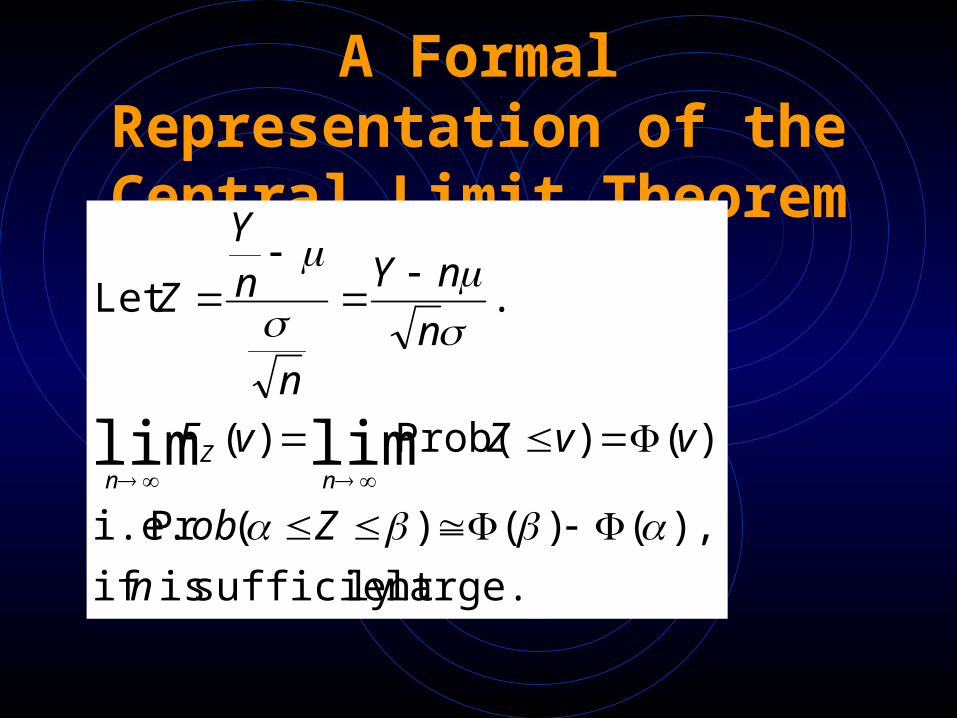
A Formal Representation of the Central Limit Theorem
large.ly sufficient is if
),()()(Pr i.e.
),()Prob()(
.Let
limlim
n
Zob
vvZvF
n
nY
n
nY
Z
nZ
n


Approximations for Discrete Distribution
• The beauty of the central limit theorem is that it holds regardless of the type of the underlining distribution.
• For example, X1,X2,… Xn are random samples from a Bernoulli distribution with μ= p andσ2 = p (1-p). Then, by the central limit theorem,
.0,1N approaches
1
1
11
pnp
npX
n
Xn
Z
n
ii
n
ii
n

Confidence Intervals for a Statistical Estimator
• We know that
is an unbiased estimator of the probability of a Bernoulli distribution. But, how good is it?
• According to the central limit theorem, if n is sufficiently large, then
approaches N(0,1).
n
iiX
nX
1
1
npp
pX
/)1(
)(

One Sided Confidence Interval for Proportions
p
nz
nz
np
np
znz
p
Xpppzppn
znp)p(
pX
zz
znp)p(
pX
2
2
222
22
1
4
ˆˆ
2ˆ
.ˆ where),1(ˆ
/1
.)()(1 where
,1/1
Prob
have We
z

One Sided Confidence Intervals for Proportion
.1
4
ˆˆ
2ˆ
,0
withinis that confidence % 100 have weSimilarly,
.1)( where,1 ,1
4
ˆˆ
2ˆ
withinis that confidence % 100 have weThen, on.distributi
ia Bernoull ofy probabilit theofestimator an be 1
ˆLet
2
2
222
2
2
222
1
nz
nz
np
np
znz
p
pc
cz
nz
nz
np
np
znz
p
pc
xn
pn
ii

Two Sided Confidence Interval for Proportions
n
zn
z
n
p
n
pz
n
zp
p
n
zn
z
n
p
n
pz
n
zp
n
Ypppzppn
zn-p)p(
-pnY
z
zn-p)p(
-pnY
z
22/
2
22/
2
2/
22/
22/
2
22/
2
2/
22/
22/
2
2/2/
2/2/
1
4
ˆˆ
2ˆ
1
4
ˆˆ
2ˆ
.ˆ where),1(ˆ
/1
.1/1
Prob
have weSimilarly,

.2
1)( where
1
4
ˆˆ
2ˆ
,1
4
ˆˆ
2ˆ
withinis y probabilit that the
confidence % 100 have wethen
on,distributi ia Bernoull ofy probabilit theof
estimatior an be 1
ˆ if Therefore,
2/
22/
2
22/
2
2/
22/
22/
2
22/
2
2/
22/
1
cz
nz
nz
np
np
zn
zp
nz
nz
np
np
zn
zp
p
c
xn
pn
ii

Important Observations about Confidence
Intervals• As n increases, we have a smaller confidence
interval.• If we require a higher confidence level, then the
corresponding confidence interval is larger.

An example of Confidence Intervals for Proportions
• If a poll shows that 700 people out of 1000 favors a public policy, then how confident are we when we say that 70% of the population favor the policy?

• According to the standard normal distribution table,
• Therefore, we have 95% of confidence that p 0.6756 and 90% of confidence that p 0.6811.
• Similarly, we have 95% of confidence that p 0.7233.
90.028.1
95.065.1
~continues

Test of Statistical Hypotheses
• Assume that a product engineer is requested to evaluate whether the defect rate of a manufacturing process is lower than 6%. If the engineer observes 5 out of 200 products checked have defects, can the engineer claim that the quality of the manufacturing process is acceptable?
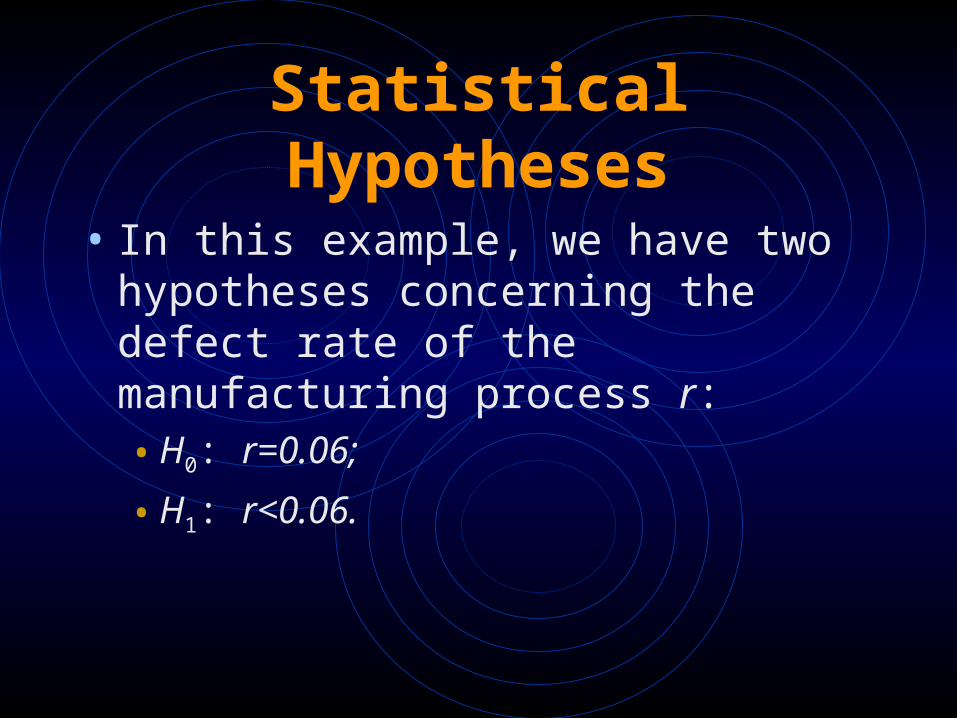
Statistical Hypotheses
• In this example, we have two hypotheses concerning the defect rate of the manufacturing process r:• H0: r=0.06;
• H1: r<0.06.

• H0 is called the null hypothesis and H1 is called the alternative hypothesis.
• There are two possible types of errors:• Type I: Rejecting H0 and accepting H1, when H0 is
true;
• Type II: Accepting H0, when H0 is false.
• The probability that Type I error occurs is normally denoted by and is called the significance level of the test.
• The probability that Type II error occurs is normally denoted by .

Design of a Statistical Test
• Since we do not know exactly what the defect rate of the manufacturing process is, we start with assuming H0 is true, i.e. r=0.06.
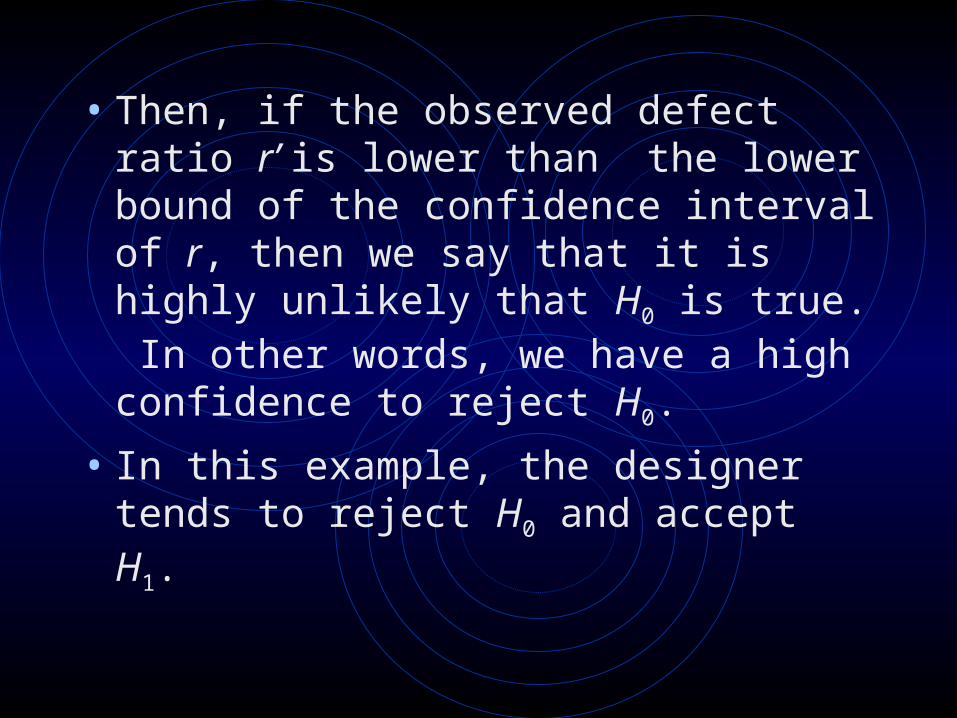
• Then, if the observed defect ratio r’ is lower than the lower bound of the confidence interval of r, then we say that it is highly unlikely that H0 is true. In other words, we have a high confidence to reject H0.
• In this example, the designer tends to reject H0 and accept H1.

• Let X1, X2,… , X200 correspond to whether each of the 200 random samples is defective or not. According to the central limit theorem, approaches N(0.06,0.000282).
• According to the central limit theorem,
X
05.0)0324.0(Pr
05.0)645.1
20006.094.0
06.0(Pr
Xob
Xob

• Since 5/200 = 0.025 < 0.0324, we have over 95% confidence, 98% actually, to reject H0 and accept H1.
• In this example, the significance level of the test, , is 0.02.
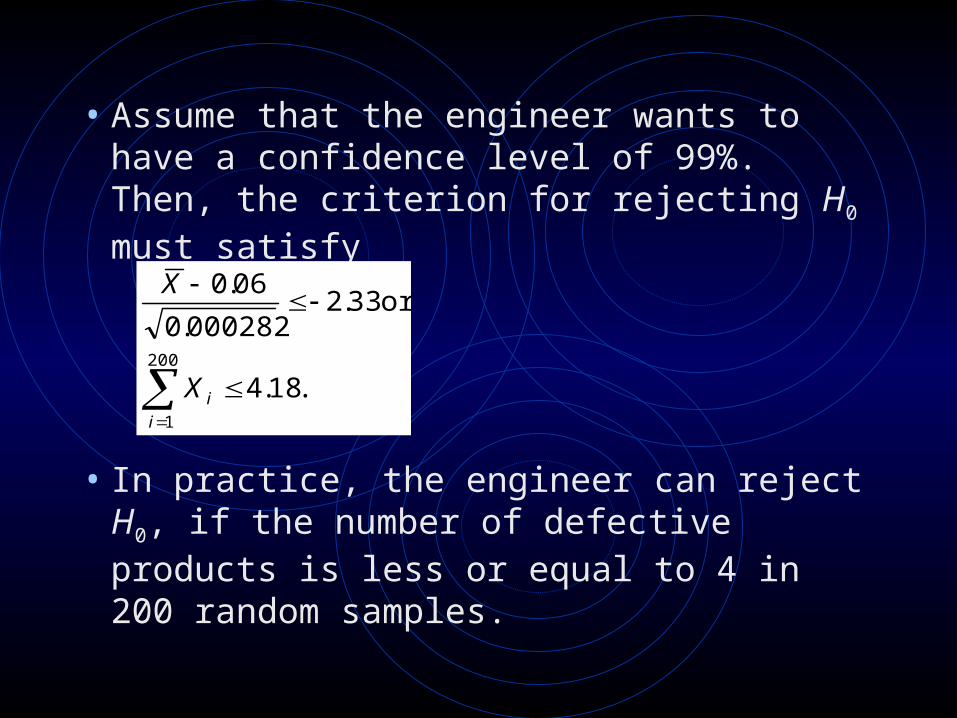
• Assume that the engineer wants to have a confidence level of 99%. Then, the criterion for rejecting H0 must satisfy
• In practice, the engineer can reject H0, if the number of defective products is less or equal to 4 in 200 random samples.
.18.4
or 33.2000282.0
06.0
200
1
i
iX
X

Chi-Square Test of Independence for 2x2
Contingence Tables• Assume a doctor wants to determine
whether a new treatment can further improve the condition of liver cancer patients. Following is the data the doctor has collected after a certain period of clinical trials.
500100400
30070230alConvention
20030170New
ImprovedNot Improved

~continues
• The improvement rate when the new treatment is applied is 0.85 and the rate is 0.77 when the conventional treatment is not applied. So, we observe difference. However, is the difference statistically significant?
• To conduct the statistical test, we set the following hypothesis H0 :“ The effectiveness of the new treatment is the same as that of the conventional treatment.”

Contingence Table with m Rows and n Columns
• The chi-square statistic
has degree of freedom (m-1)(n-1).
m
n
B
B
B
AAA
2
1
21
m
i
n
j jiCTE
jiCTEjiCT
1 1
22
,
,,

~continues
• Applying the data in our example to the chi-square statistic equation, we get
• Therefore, we have over 97.5% confidence that the new treatment is more effective than the conventional treatment.
204.52084.5
6667.14167.05.26250.060
6070
240
240230
40
4030
160
160170
2025.0,1
2222
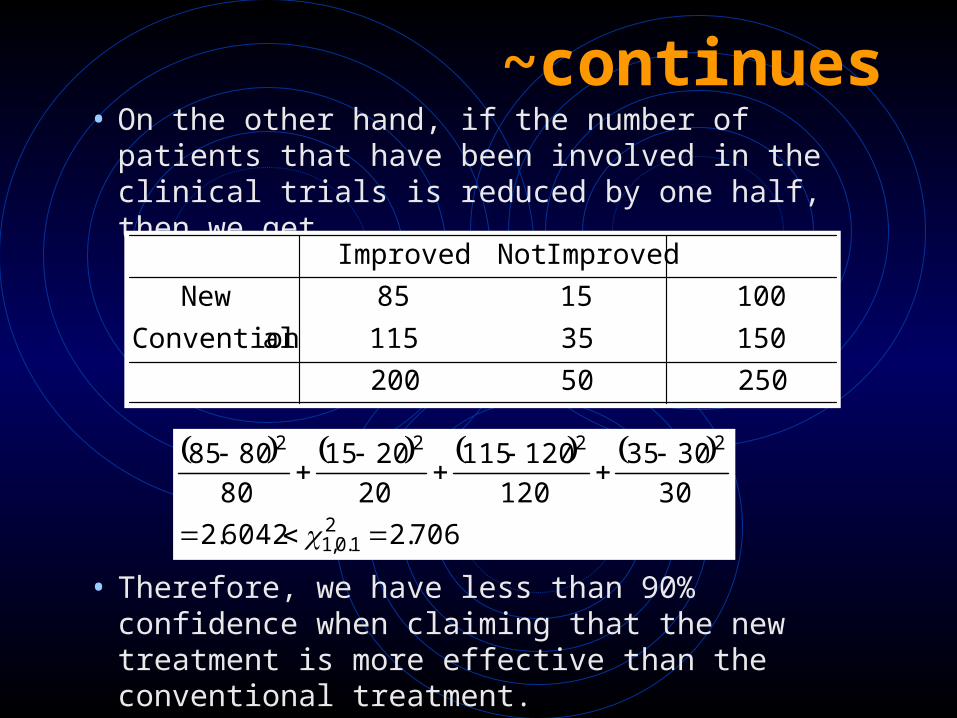
~continues• On the other hand, if the number of patients that
have been involved in the clinical trials is reduced by one half, then we get
• Therefore, we have less than 90% confidence when claiming that the new treatment is more effective than the conventional treatment.
25050200
15035115alConvention
1001585New
ImprovedNot Improved
706.26042.2
30
3035
120
120115
20
2015
80
8085
21.0,1
2222

A Remark on the Chi-Square Test of independence
• The chi-square test of independence only tell us whether two factors are dependent or not. It does not tell us whether they are positively correlated or negatively correlated.
• For example, the following data set gives us exactly identical chi-square value as our previous example.
500100400
30050250
20050150