maximum speed limits - safety€¦ · maximum speed limits a study for the selection of maximum...
TRANSCRIPT
PB 197 373
DOT HS-800 378
MAXIMUM SPEED LIMITS
A Study for the Selection of Maximum
Speed Limits
INDIANA UNIVERSITYINSTITUTE FOR RESEARCH IN PUBLIC SAFETY400 EAST SEVENTH STREETBLOOMINGTON, INDIANA
Final Report
Volume I of IVOctober 1970Contract No. FH-11-7275
PREPARED FOR:
U.S. DEPARTMENT OF TRANSPORTATION
NATIONAL HIGHWAY TRAFFIC SAFETY ADMINISTRATION
WASHINGTON, D.C. 20591Reproduced by
NATIONAL TECHNICALINFORMATION SERVICE
Springfield, Va. 22151
The opinions, findings, and conclusions expressedin this publication are those of the authors andnot necessarily those of the National Highway TrafficSafety Administration.
Reproduced frombest available copy


I---·------------~i
~,---~_._-_._--_._--,------...;
14. Sponsoring Agency Code
I
FH-11-727 5
Final Report, Vol.
11. Contract or Grclnt No.
!"H-11-7 27 513. Type of Report and Period Covered
--------~
I VOLUME I LIMITS , ,6~~~f:~'~geO~go:z:t:o~ Co Ie ------,
I A Study for the Selection of Haximum Speed Ll l tsL-- ~ _~--j
17, Authoeisl Kent B. Joscelyn, Principal Investl- 8, Pe,fo,mlngOegan'zation ReooetNo '
I Ralph K. Jones qatorI Patricia A. Elstonr9 Pedoemlng Oeganozoholl Name and AodeessI Institute for Research in Public SafetyI Indiana University: 400 East Seventh Street, Room 519I Bloominqton, Indiana 47401112~Sponsorin9Agency Name and Address·- ----
, Depart:rrent of TransportationNational Highway Traffic Safety Administration
I Washington, D.C. 20591
I~,",,·m.",..,,.,.,I
16. Abstract
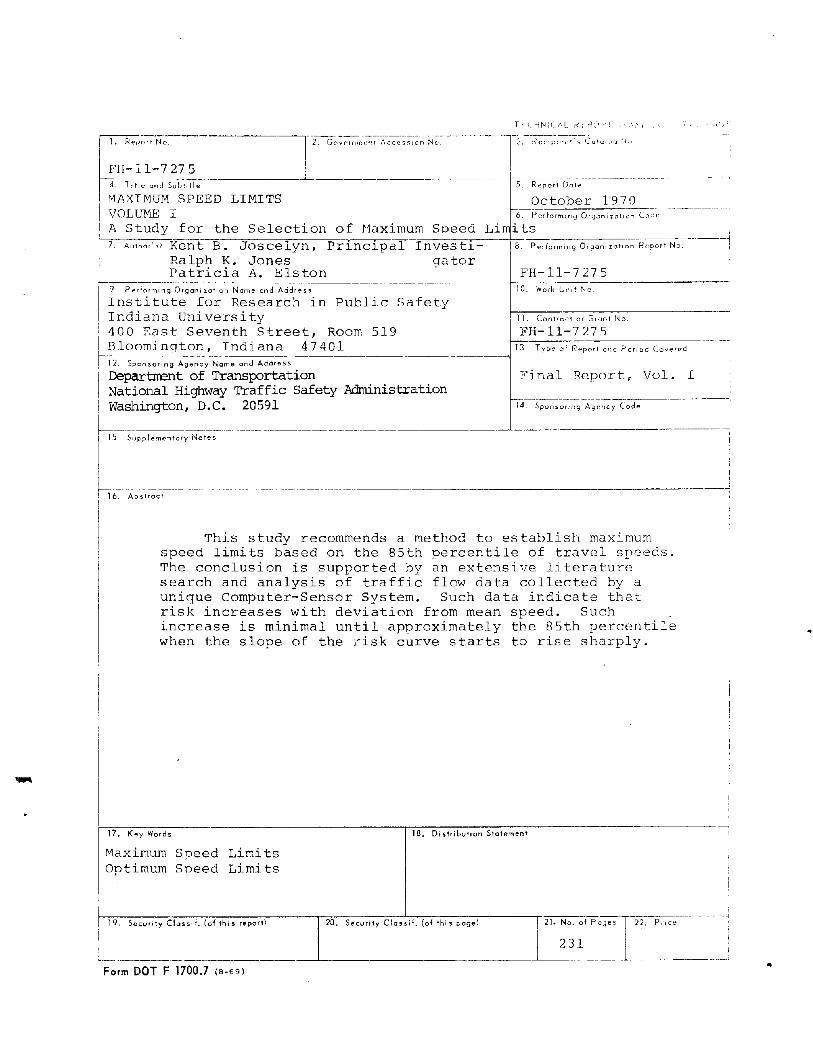
This study recommends a method to establish maximumspeed limits based on the 85th percentile of travel speeds.The conclusion is supported by an extensive literaturesearch and analysis of traffic flow data collected by aunique Computer-Sensor System. Such data indicate thatrisk increases with deviation from mean speed. Suchincrease is minimal until approximately the 85th percentilewhen the slope of the ~isk curve starts to rise sharply.
18. Distribu'~ion Statement
Maximum Sneed LimitsOptimum Speed Limits
1--;-;::-'7'---::::--,-;-~;-;--:-----:-,-----r-;;;;-'7'--:---::::-'-:-;--;-';-'7-:--~---;-----":;-;--7;--',-;;---,.,.-:--=-------.~
'._s_e~~i~~~'_S_if_'_(O_f_t_hi_._,_ep_O_'_D ~_~20_'_s_ec_u_"_.t_y_c_IO_S_S_if_,_IO_'_t_hi_s_P_o,g__el ~~' ,.... •• "n
Form DOT F 1700.7 (8-69)

Kent B. Joscelyn
Ralph K. Jones
Patricia A. Elston
Project Management
Principal Investigator
Project Director
Assistant Project Director
Research Staff
Quantitative Analysis
Computer data collectionand programming
Survey Analysis
Literature Search
Gunda OpferFrancis J. ConnellyWilliam J. Kennedy, Jr.Donald M. Goldenbaum
Robert RockenbaughGary Fox
Linda S. Buczek
Gary R. Cagle

ABSTRACT
This study recommends a method to establishmaximum speed limits based on the 85th percentileof travel speeds. The conclusion is supported byan extensive literature search and analysis oftraffic flow data collected by a unique ComputerSensor System. Such data indicate that riskincreases with deviation from mean speed. Suchincrease is minimal until approximately the 85thpercentile when the slope of the risk curve startsto rise sharply.
iii

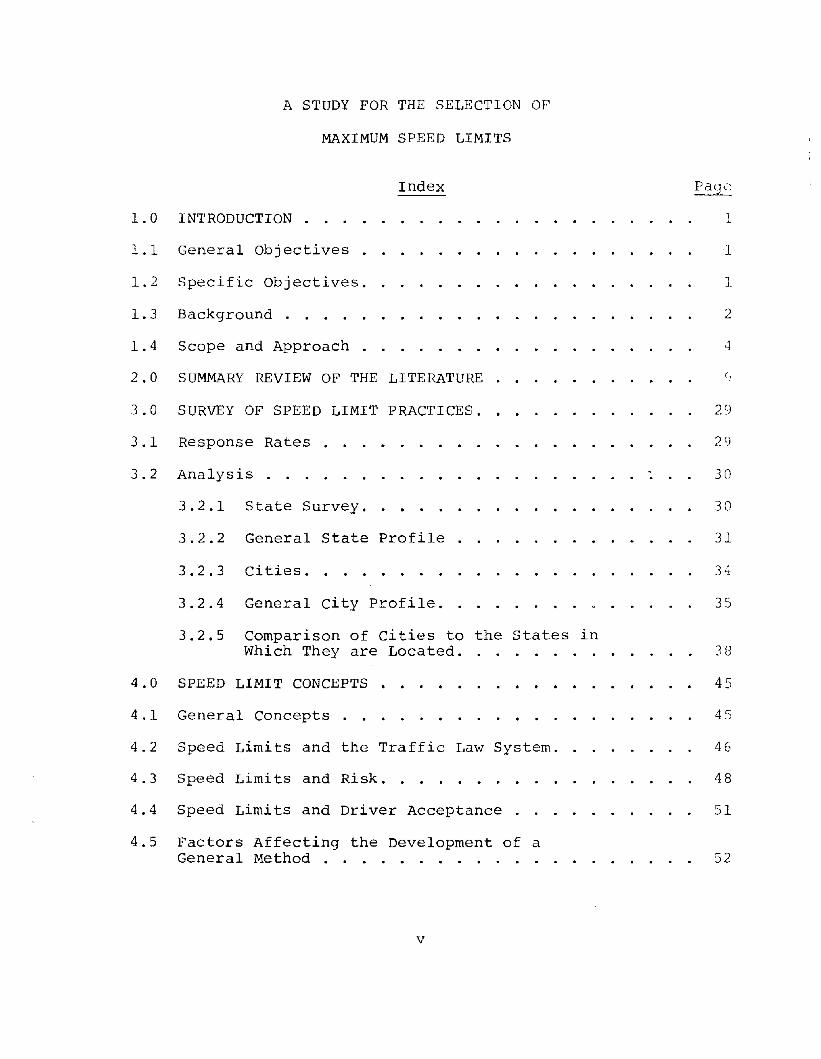
A STUDY FOR THE SELECTION OF
MAXIMUM SPEED LIMITS
Index
1.0 INTRODUCTION ... i
1.1 General Objectives
1.2 Specific Objectives ..
1.3 Background ....
1.4 Scope and Approach
2.0 SUMMARY REVIEW OF THE LITERATUF~ .
1
2
3.0 SURVEY OF SPEED LIMIT PRACTICE~:. . 29
3.1 Response Rates
3.2 Analysis
3.2.1 State Survey..
3.2.2 General State Profile.
.. . .29
30
30
31
3.2.3 Cities. 34
3.2.4 General city Profile.
3.2.5 Comparison of cities to the States inWhich They are Located.
4.0 SPEED LIMIT CONCEPTS.
35
38
45
4.1
4.2
4.3
General Concepts
Speed Limits and the Traffic Law System..
Speed Limits and Risk ....
45
46
48
4.4 Speed Limits and Driver Acceptance 51
4.5 Factors Affecting the Development of aGeneral Method . . . . . . . . . . . .
v
52
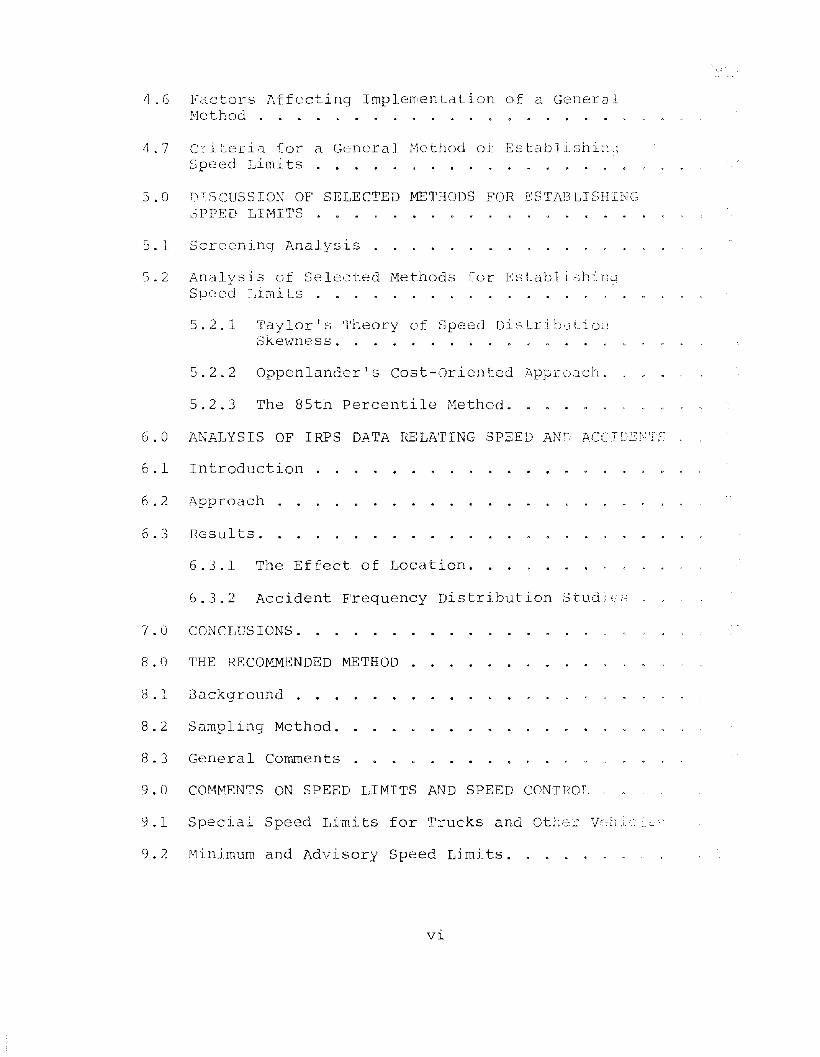
4.6 Factors Affecting Implementation of a GeneralMethod .
4.7 eri teria for a General r!icthod of Establi:3hin'JSpeed Limits . . . . .
5.0 DTSCUSSION OF SELECTED METHODS FOR ESTA13LISHIJ\jC:':;PPED LIMITS .
5.1 Screening Analysis
5.2 Analysis of Selected Methods for EstablishingSpeed Limits .
5.2.1 Taylor's Theory of Speed Di::::trib,ltiOl!Skewness. .
5.2.2 Oppenlander's Cost-Oriented Approach.
5.2.3 The 85th Percentile Method.
6.0 ANALYSIS OF IRPS DATA RELATING SPEED AND l,CelDENTS
6.1 Introduction
6.2 Approach
6.3 Results.
6.3.1 The Effect of Location.
6.3.2 Accident Frequency Distribution StudlCS
7.0 CONCLUSIONS.
8.0 THE RECOMMENDED ~~THOD .
8.1 Background ...
8.2 Sampling Method.
8.3 General Comments .
9.0 COMrvt.ENTS ON SPEED LIMITS AND SPEED CONTROL
9.1 Special Speed Limits for Trucks and Other Veh c
9.2 Minimum and Advisory Speed Limits ...
vi
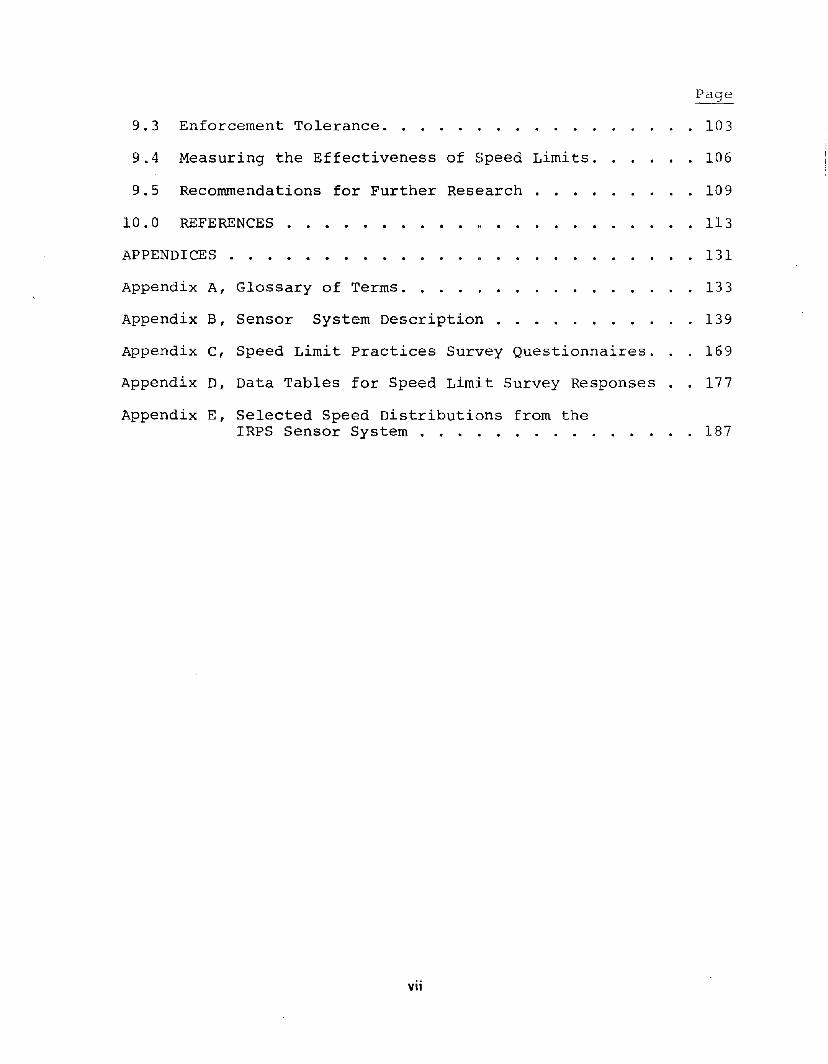
9.3
9.4
9.5
10.0
Enforcement Tolerance.....
Measuring the Effectiveness of Speed Limits ..
Recommendations for Further Research .
REFERENCES .
· 103
· 106
· 109
. . 113
APPENDICES . . . .
Appendix A, Glossary of Terms ..
· 131
· 133
Appendix B, Sensor System Description . · 139
Appendix C, Speed Limit Practices Survey Questionnaires.. 169
Appendix D, Data Tables for Speed Limit Survey Responses .. 177
Appendix E, Selected Speed Distributions from theIRPS Sensor System . . . . . . . . . . . . . . . 187
vii

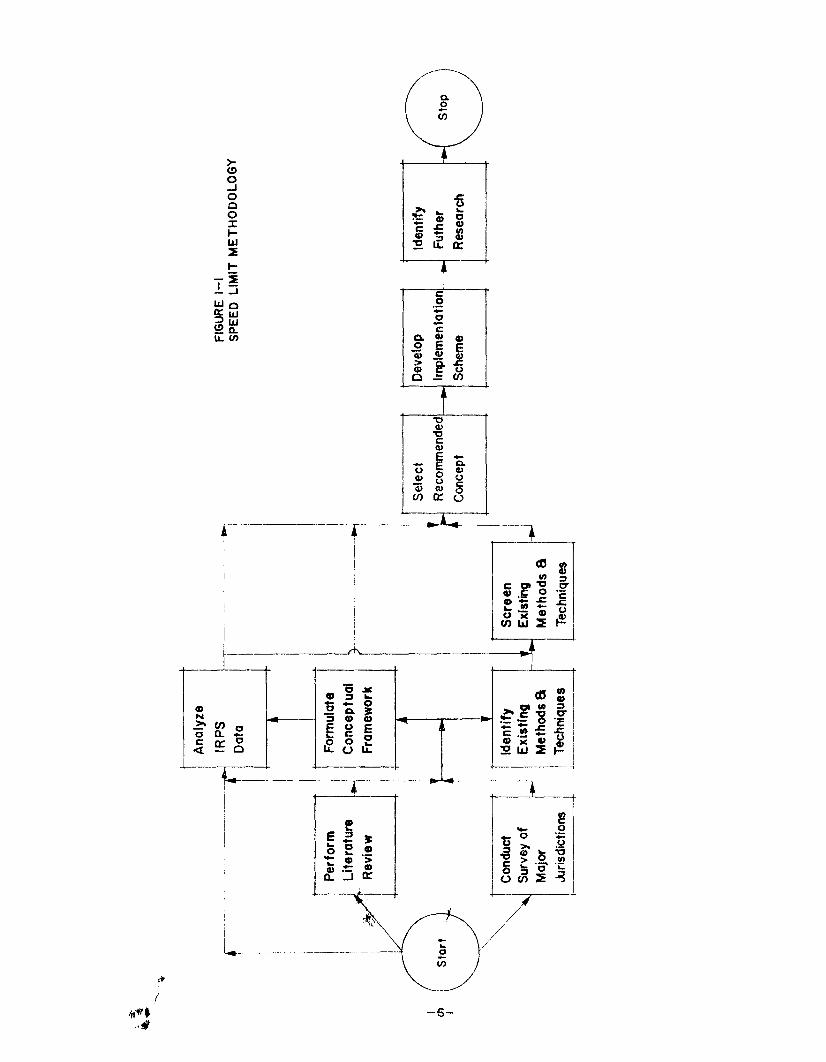
SUMMARY
This report documents work conducted by the Indiana
University Institute for Research in Public Safety under
sponsorship of the National Highway Safety Bureau of the
U.s. Department of Transportation to recommend a method for
establishing maximum speed limits that could be widely imple
mented utilizing existing technology and manpower resources.
The research plan includes an extensive review of exist
ing research literature, an evaluation of identified methods,
collection and analysis of data utilizing a Computer-Sensor
System to validate existing methods, and the development of a
programmed instruction text to implement the recommended
method.
The literature review considered more than 300 docu
ments relating to the history of speed limits; the relation
ship of speed and speed limits; driver speed behavior and
variables, other than speed limits which influence it; the
relationship of speed, speed limits, and accidents; and
methods for establishing speed limits. The review revealed
three major approaches to establishing speed limits, one
based on measure of prevailing vehicle speeds, another
based on characteristics of the speed distribution, and a
third based on cost.
ix
A national survE~Y of practices used by states ,,;nel r~J L <:'
to establish maximum speed limi ts was conducted to clei:crIT'i,lf'
existing methods, technical resources, and the manpower
,involved in establishing speed limits. Questionnai res \<It r,'
sent to traffic engineers of all state highway departmen~s
all cities over 100,000 in population (130), and 52 select((;
cities with populations under 100,000. The response (88 )
indicated that the following items were most frequently con-
sidered in establishing speed limits:
* 85th percentile* ball-bank indicator data* accident experience* length of zone and adjacent zone* design speed* pace* spacing of intersections and driveways* traffic volume* presence and condition of shoulders* average test run speed* presence of pedestrians* traffic signals and controls
The survey also showed the general availability of
radar, vascar, ball-bank indicator, and vehicle counters to
measure vehicle speed, traffic characteristics, and roadway
features.
The various techniques for establishing speed limits
identified as a result of the literature review and the
survey of jurisdictions were subjected to a scrcenlng ana ~
to identify those methods worthy of further consideration
x
for full-scale implementation. The analysis revealed these
such techniques:
* Taylor's theory of speed distribution skewness* Oppenlander's cost-oriented approach* The 85th percentile method
Data collected using the IRPS Computer-Sensor System
were analyzed to provide a further basis for selecting a
recommended technique from ~he three identified by the
screening analysis. The analysis clearly showed the strong
relationship between devia~ion of the speed of the accident-
involved vehicle from the mean speed of the traffic stream.
The analysis also showed that the cumulative accident
involvement rates were acceptably flat (i.e., independent
of speed) until the speed deviat~on reached a point corres-
ponding to the 85th percentile speed plus rounding and
enforcement tolerances, after which it started to rise at a
precipitous rate.
The final result of the study effort was to recommend
that maximum speed limits be established on the basis of the
85th percentile of travel speeds. Such a limit is:
1. Fundamentally fair in the context of the TrafficLaw System.
2. Related to risk of dysfunction in the SurfaceRoad Transportation System.
3. Accepted as reasonable by drivers.4. Applicable to a wide range of highways.5. Capable of being implemented \vi th existing resources.
xi
The recommendation of the 8:.th percen tile i s ~~ I:l,;:'()rt "j
by a substantial portion of the technical literature as weI]
as by the data and analyses of the present study.
The final project report is presented in four volumes.
Volume I contains the technical portion of the report;
Volume II presents an extensive review of the literature;
Volume III provides an imp leme:1tation program for the
reconunended method of establishing a speed limit; and,
Volume IV contains a condensed explanation of the recom
mended method for the experienced traffic engineer.
xii
1.0 INTRODUCTION
This is the final report of research on establishing
speed limits conducted by the Indiana University Institute
for Research in Public Safety (IRPS) under contract FH 11-7275
with the National Highway Safety Bureau of the U.S. Depart-
ment of Transportation.
This report is presented in four volumes. Volume I
contains the technical portion of the report including a
surmnary review of relevant Ii terai:ure. Volume II presents
an extensive review of the literature concerning speed and
speed control. Volume III presents an implementation program
for the recormnended method of establishing an appropriatc:;
speed limit. Volume IV is a brief explanation of the recom-
mended method to be used by the experienced traffic engineer.
This report documents research conducted during the
period June 20, 1969 through August 31, 1970.
1.1 General Objective
The general objective of the study was to recommend a
method for establishing maximum speed limits that could be
widely implemented utilizing existing technology and man-
power resources.
1.2 Specific Objectives
The specific objectives of the study were to:
- 1 -
1. Present. a comprehensi'lE::' summary of existinq ,,";(? Ul')
ology relating to spcp-d control and the cstab i"il~
ment of speed limits.
2. Survey state and local jurisdictions to identifycurrent practices in cstablishment of speed limits.
3. Identify the availability of technical resources(at state and local levels) that could be utili:2,clin establishing speed limits.
4. Develop an operational explanation of the functionand objectives of speed limits.
5. Select the best, real-world conceptual approachfor the establishment of speed limits.
6. Conduct analytical investigations to validatesuch concepts.
7. Develop a statistically valid method of establis ll1
speed limits that can be implemented utilizing"existing technology and manpower resources.
8. Identify such research as may be necessary to further refine the "state of the art" of speed controland the establishment of speed limits.
1.3 Background
At present t.here appear to be three distinct methods
of establishing spee6 limits. They arc: arbitrary methode,
political or constituent pressure methods, and traffic
engineering methods.
Arbitrary methods are generally carried out by count
highway departments or city street commissions that arf--,
handicapped by lack of funds and are generally unable to
secure competent personnel. The result of this handicap
takes the form of speed limits which are posted bv judgm~~t
rather than traffic analysis.
- 2 -
Political pressures, such as driver complaints and
accident pUblicity, often indicate that a speed limit should
be changed. Such pressures, however, give no means for
determining the amount of the change. Political pressures,
furthermore, are highly irregular and do not necessarily
meet the needs of the traffic.
Speed limits determined by utilizing traffic engineer
ing theory take their impetus from the 85th percentile, pace,
and average test run concepts. These methods are rather
widely used and are documented in most traffic engineering
texts. It should be noted that although these methods
are widely accepted the selection of these methods is, in
most cases, arbitrary.
Independent of the method used in determining the
limit, there are three distinct types of speed limits used
in conjunction with a basic speed rule. Every state has a
statute covering what is known as the "basic speed rule."
The substance of such laws is that: a driver shall always
operate his vehicle at a speed that is reasonable and pru
dent under existing conditions.
The three types of speed limits that are used to sup-
plement the "basic speed law" are:: absolute limits, p~ima
facie speed limits, and advisory speed limits. Of these,
- 3 -
it·
," ".-".
}----.
I'
I,I
Con
duct
llJ1I
Ide
nti
fyS
cre
en
Ii
Sur
vey
of
Exi
stin
gExlst~
l-i
Maj
orM
etho
dsa
Me
tho
ds
a,~,,
~diClion
s--LLT
e<:h_n
i_qU•
•_T
echn
ique
s
~Id
entif
y
Fut
her
Re
sea
rch
FIG
UR
EI-
IS
PE
ED
LIM
ITM
ET
HO
DO
LOG
Y
Dev
elop
Impl
emen
tatio
n
Sch
eme
Se
lect
Rec
omm
ende
d
Con
cept
-~
:
-l-I
1_
_-
1r
I !
For
mul
ate
Co
nce
ptu
al
Fra
mew
ork
Ana
lyze
---~----~
IRP
SD
ata
I
r--;
;erf
orm
'[II
Lit
era
ture
~,I
1R.~.
wI
'-"""~
r-----
I I
I (1) I
sponsored study conductec~ b::/ IEP;; on "'l'he: Eff 0(;":'S of Enforce
ment on Traffic Flow Behavior" were utilized in the analytical
phases of this study.
Such data allowed detailed examination of existing
speed limit concepts and validation of the recommended statis
tical method for implementation.
- 7 -

:2.0 SUMMARY REVIEW OF THE .Ll n2ERATURE
This section presents a summary review of selected
literature dealing with the subject of speed and speed con-
trol in the context of high\'v'ay safety.
In excess of three hundred publications were reviewed
during the extensive literature search conducted for the
Optimum Speed Limits study. Several facilities were used
during this search, including the National Safety Council,
Highway Research Board, and North\ves tern Universi ty Trans-
portation Center Library, in addition to the Indiana Univer-
sity Library System.
A number of aspects of speed control have been con-
sidered. Among these are: the history of speed control;
the relationship of speed and speed limits; the variables
which influence driving speeds; the relationship of speed,
speed limits, and accidents; and methods for setting speed
limits.
Deta~led results of this extensive search can be found
in Maximum Speed Limits~ VoZume II~ The DeveZopment of
Speed Limits: A Review of the Literature. h brief summari-
zation of the body of literature in this area follows.
The following chronology of highlights in the history
of speed control in America illustrates the progress that
has been made in this area.
Preceding page blank
Tho hi:; tory of speed lirni ts In the LJni tee! State'; L,::.d:.c:;
back to 1678 when speed restrictions were imposed on horses
in Newport, Rhode Island ( 4 ) European speed control J-Licl
its effect on American policy, and in 1901 tht'? firc;t ::ijJc:f"d
limit for automobiles in the U.S. was enacted in Connecti-
cut. (6)
Early speed control campaigns were colorful and dramatl
But in addition to the radical denunciations of speed and
"speed mania" came more rational argurnc'nts supportinq ',. -1 ~ r
.... 11;-_
adjustment of drivinsr speed and speed requlationr::: to cxic;t;;
condi tions and condemning reckle,os driving rat> r tl1(].n speec
per se.
1I_long v;i t.h speed restrictior: lc,q:isli:1tio,~ C'ITn techno];:
gical developments fC1r speed measureffiC>LL
a need had developed for minimum speed limits in adJition
to maximum limits.
'1 ••• By the 1930's efforts were begun to study SDC
control and take a mc)re realis t:ic aplJroach tC) it ..... 'I ( ·3~ \
The organized traffic safety movement began ii' the rni -30's.
causing both cities and states to institute rigid aCCl
reducticm campaigns, the most notablt, bO.i.119 PTc:vicl<~
Rhode L; 1 and. (63, 65) Already in the 1al=:' Itp0' ' .. '.:
states such as Colorado had speed limits as hi.
- 10 -
During World War II an effort to conserve gasoline and
rubber brought the entire nation under a 35 mph limit. (74)
And in 1948 radar became a part of the traffic control system.
(80)
Tracing the development of the present day speed limit,
it can be seen that many of the ideas which generate contro
versy today were proposed quite early in the history of
automobile regulation.
A study conducted at the University of Illinois in
1947-1948 concluded that traffic ignored speed limits and ran
at speeds which drivers considered safe and that most posted
speed limits were ineffective because they were unreason
able. (79)
J. Edward Johnston suggested in 1956 that the 85th
percentile was reasonable and encouraged uniform speeds. (85)
Since the 1950's several major concepts have prevailed
in the controversy over the effects of speed limits on
driving speeds. The first is that speed limits have little
or no effect -- that drivers ignore them and drive at speeds
which they consider reasonable and safe. (~,~, ~~, 104,
!05, 109) An opposing view states that speed limits do have
an effect (101, 107), however, different studies have shown
varying effects, including decreased pace (97), reduction of
- 11 -
excessively fast or slow speeds causing vehicles to t:Ci:'/ 'i
closer to the same speed (77, 114, 175), and a random
effect. (99)
"For any given road there is an opt:imum speedlimit which will have the greatest effect onspot speed. 'I'his value is usually between the80 and 90 percentile of the free-flowing speedas plotted on a cumulative-frequency curvc,:. Ii (77)
Other articles seem to concur that the 85th or SOL p
centile is a reasonable guide for setting speed limits.
99, 113)
It has been stated that absolute speed limits receive
the highest observance, while advisory limits are excecdcu
more often than either absolute or regulatory limits. (90)
Urban limits appear to be violated more often than rural
limits. (105, 109)
The study of driver speed behavior has illustrated a
number of interesting findings.
A 1954 study found that about a third of all driver
exceeded the 85th percentile of the spot speed distributic
If a set of drivers was observed as many as seven times,
more than half could be expected to exceed the 85th per r
tile speed at least once. (116)
f\ study to inves,tigate drivers I speed perccpt,LOnn"F
the abi Ii ty of eight subj ects to halve or doub lic' thc_lr
- 12 -
on conunand. In this study drivers seemed to underestimate
their speed when decelerating and overestimate it when
accelerating. (119)
A Los Angeles study to assess the effectiveness of
written warnings as compared to citations involved the stop-
ping of motorists who exceeded 40 mph in a 25 mph zone.
By following these drivers after citations or warnings were
issued, the study found that:
(1) Where a citation was issued, accompanied by noconversation between driver and officer, 32 of100 cases recorded exceeded the limit againwithin five miles.
(2) Where a safety message accompanied the citation,33 of 100 cases exceeded the posted speed withinthe next five miles.
(3) Where a written warning and safety message wereissued in place of a citation, 43 of 100 motorists had exceeded the limit within two miles and22 more within five miles, for a total of 65. (122)
Numerous publications discuss the factors which affect
speeds. The following factors and relationships have been
identified:
Studies of driver variables found that speed increased
with trip distance (126, 136, l:~); non-local vehicles trav
eled faster than local vehicles (138, 139, 143, 144, 145);-- -- ----~ -- ---
male drivers drove slightly fas1:er than female drivers (2-36,
137, 143, 145); and, drivers wii:h passengers in the car
drove slightly slower than those without passengers (137,
- 13 .-
L 4 } , lJ', i:'"':" \-L -i ---.J) '"
veL!?; ,--:xp(~cted arrivdl time (1·1\;)
')i,inion of the :;pccd 1 mit (14(;) and ai~1()UI1L 0 f dr i Vl nq ! )
ilcctcd \..jj th the cJrivcr"'3 work (146).
V\c:hicle varialdcs sho\t!cd that v(:hicl(~ type (l37! "
traveling faster than oldi"r Oil0S (126, 13(,).
cla:3sificaLion or road t'/pe (137), ,:;urf'ac!:=, type and con-
di.tion (137, 138, 140, J42, 147') I numL,er of lanes and Id'lc
width 112CJ -3 7\__-=-_' .~.:...~_~_~. f140, 142),
type (h~2, lj_-O, access contLol (137, 139, 1421 ,- frequ(~ncy
f . t .0 .. ln ersect.lons (137, 139, 140, 147), shoulder -vj dth a:li:
condi tion (!.!~. L~_~ r 1:..:1.2), and de~; i qn ,-;peed (.~47)· Other
factors identified include geographic locat.ion (137), siqh~
distance (137_, 13..§.: 139, 140, 142, 143), curvature; (137,
138, 140), gradient (1:}_?), length of grade (137, 140),
lateral clearance (1~;7, 142), horizontal and vertical rC':;i~;.
tance (13~, :!:i~), marginal friction (138), vertiea 1 aod
horizontal alinement (142), traffic signals and control
devices (~Q, .~4? f~.~l) f parking (140 f 147)
of pedestrians (140, 147).
and pre80r1C','
Traffic vari abl(,: s shm'Jn to af fect~ ,,,peeds werC\fO i.~11'l> '
(129, l~O, 138, 140, 142, 147)? pCl3Sinq man(~1:\1(-:rs (137)
opposing traffic (l:}J) , and percentage of commercial vehicles
(137, 142, l11). A study a Iso indicat.ed that veh i cl efi in
each lane tended to adjust their speed to the speed of the
slower parallel lane (107).
A study of environmental factors which affected speeds
found that objects on the road shoulders had little affect
on speeds unless the lane widths were less than 20 feet (132)
Other environmental factors include weather (137, 142, 146),-_.-.~- --
time (133, 13I, 142), and roadside establishment (138, 139/
140, 142, 147).
It can be seen that a number of studies have been con-
ducted to identify the above mentioned variables and that
there is considerable agreement in this area.
Although discussions of the speed-accident relationship
date back to the early use of the automobile, serious
research in this area seems to have begun in the 1930's.
From 1930 to 1939 the speed capability of the average vehicle
sold rose from 55 mph to 84 mph. (126)
A number of the early studies in this area attributed
the occurrence of accidents to speed (252, 151/ 153) while
others did not find a relationship between high driving
speeds and accidents (126, 152). One author even went so far
- 15 -
;.vdY de~~ ign. He \vrote:
"r. t i:o CiS cos c; 8!'LL a 1 to s[)(::nd effort tOe mprovcI he speed of transpor.(tion as it L; to ~3f1end
it to reduce a:"ci(]cn!>~. 'The automobile \4a5
not rna.nuf2ct U',":'l to '3(~V'~ 1 j '.,1e:=;, or the rr);1d-',,' a y b u i 1 t t) P r:: ')en t J 1 u:r: Lc' :'0 • " ( 1 :-, 4 )
;;,tt: opinions are pole,xiz2d on the '1uestil)l1s '::Jf ~:;o"'<l
::ffc:ct.ivc mean" () dccident reductic'J.
caus,:.; at accident,s (4) and cth:':cs ";"0 indi.cat.e that aecider
increase wi th :i ncreased speed ,0; (J 5 7, 1. (,::) •
;\1. Earl Ca.rnpbcl1 prc~scnL:: .,~n L: tc°rC' ting approach to
, . 1 .speea-aCCl(lent comparIsons. 30, 1964 11(~WS rC.l.eas0
from tho California Divisi011 of Hi..qL\·FlY::; statccd that dlthou
1911, this is a fc1tdlity rate of 3,')'1(' n,"-r 10(' m~lJion
T1:i I -.... ). ") ,,1....LJ -.... t 1 ~ '"-j
:",,' ::;ord~; anh,rd of
·j'r.r(1ffi(~
1"1, ~ i)rllj' t}1C~
()f ()T
, ,}
["\ ; f , j nc ;i.j:DU.
" .'~'.~' ,'.
NOT REPRODUCIBLE
:: l"'(; obicct 1_nCre;J~3'-':, i, 11 ;'1'('''(. _ U-" .'lulZ<U(1S bcconK ~rcciaj]v CO :1])1,> il th,' lL;qll(!
ranC1('~~. Speerl and accidc:nt,·, cannot: b(~ rcL:lLc(ito each other simply as a tvw-dimo:::n:;ionalrelationship: the relationship is always multidimensional and may include one hundred otherfactors ... the t:hird diTr(~nsion of traffic denSlty must always be included if any validrelationship is to come out of the analysi~~. II
(1:33)
11'1-1>,,(; haZ(1~CCL ()l fl~(~C!Ll,,>rlc:~/...... is r(-)la.t_(~·; t(~,'-l
t1".:;::'(' conditions: (1) U,-, ~')'ecd of '-:l1c S~l:)j':_
cal'" ~cc' 1 cl tc:;d to tt1e d en~~; J. t.~l p f ~C(~(_~ 1J(~_n_ c>"" d i~: i~ r _1.1 . l' :;. '-)1'
of ~)(,,'(-'.ds of alI th(~ cat-: in Clccc:a]_ trafc:;i:rc'a11', and (2) fixed d)jc~cts ane} oth,r~r rO:l 1 -; L
]l:izLircL3. There arc ot1J::'Y' factors f "',: t thC")c':;'ppC'd2:- to be rno.',; t inport:.an t. :L t ar';'cars aL~C'
t:hat the hazard _[reb: above and bclc\! t:h.-: d'/:::;r,,'!t';-; 1) l,_'~ c~ (} 0 f tra ~ .f i r: f J ()h' in Cl'(~a ~:~ c' s fa, S -t-,("~ 'r- t~'~lc 1'-1. '1 t ~--i ,'-I.
C;hdi.ll~ft~: i11 rat~~ I.)f ,._:,r)i:~c,r-l. 1/ (1~-~~;)
(:I>_~ ct~::) C~:; in 1-1 a 7:~ a.rc1 () f t-:- r-l~;(111CTl C::""27' c) f i. ~'~ \IO 1 \,.7; ~,l n ',~~
i,1j_t.~1 j_rlC~l~c:c1.~~(~l irl spc·c~(J is fOU11(:j in. t:"l l~-!C, -t' ~
records of th(~ :Jing-;e-·v(~hicle acr;ident. ... 'Till:; ]',')[ accident constitl,tc;,; mon' thaD o!','-tJl'Lrc:J c'::t-hc accidents resultinq in fat(11it,ics, and it_ lS
j ncrcClE;ing at i'[ ra tee c;i,s:rni £i can -'-1'. f as tr.-.r thai;t.11 (-; <l\t~:~ l- agt: r a 1:-0 o.f in c rc~ as E.:~ () f -~ cl. t a 1 (J.{~ (::.i.. Ctt~ 1-\ L::', ,cE;pccial1y in urban areas." (l e;3)
A 1956 study stated:
II [:f) as ter dr iver,s hav(~ more ac:cid,:'l1 ts than s} C'i"'2~
drivers, especially when judgpd hy their spep~s
in the afternoon. The inch v:id\Ell speeds of t_h:'drivers wi th accident records are sTirill tTy [ll-,;!H:r:
tha" those for the drive rs wi theiu t accLden t rc c-Or(:l~3; \vhile il1 -ttl(~ mC)l~ning, it .is t;~c: cJl:-:~V(?rs
',vi t:hOll t accidcn t recorcl_~; whose' ,)t'-c€'cb dl-'-' s Li,<;-; t Ivhigher." (158) ",,- ",~~~,;.'
Another idea having sevcro.l propo;-',C:'ilt:S L-; tL~'t lc',--
speed drivers are more likely to he involved in accid?~c
- 17 -
than high-speed drivers. (159, ~65, !~) Chance of being
involved in an accidEmt is lowest about 65 mph, highest
for low-speed dri.vers, and increases over 65 mph. (163)
" •.• [Olnly eight percent of all fatal motor vehicleaccidents are reported to have happened at speedsabove 60 mph in 1962. On the other hand, morethan half of all fatal accidents in urban areasreportedly occurred at speeds under 30 mph, thatsame year." (.!1~)
.,. .'A very rational stand taken by several authors is that
speed is a causal factor in accidents, but it is one of a
number of causes and not necessarily the most important.
( 156)
"Speeding is outrageously overrated as a CAUSEof accidents. The fact is that it is inattentiveness or errors in judgment or lack of driving skillwhich contributes most heavily to the causes ofaccidents. Seldom does a single deficiency causean accident." (178)
The Proceedings of NationaZ Highway Safety Bureau Priori-
ties Seminar gives the following explanation.
"Does speed cause accidents and produce casualties?Obviously, considering speed of itself, theanswer is often no. As a matter of fact thereare occasions when the capacity for speed mayeven aid in the avoidance of a crash or the mitigation of its results (The capacity to passquickly in a suddenly developing tight situationand the minimizing of speed differentials inrear-end collisions, for example). On the otherhand speed can very often compound the task ofaccident avoidance if not precipitate a crash.Further, and without question, speed aggravatesthe consequences of the crash.
- 18 -
"In discussing speed in relation to accidents itis well to delineate the several senses in whichthe term might be used. It is useful to thinkof speed in the following contexts:
"a) very [sic] high speed -- speeds approaching and exceeding 100 mph. Under these conditions,the speed factor dominates as a causative agent,since few if any of the elements of the overallvehicle-driver-highway system have been designedto accomodate travel at thi~3 speed.
"b) Excessive speed for conditions -- speedsranging anywhere from zero to design speeds.This category of speeding encompasses many ofthe speeding citations issued in connection withaccidents.
"c) Differential speed or speed gradients inthe traffic stream -- in part, an overlappingset with excessive speed but: also includes inadequate speed. Differential speed and the relatedvariable "acceleration noisE~" figure prominentlyin the safe and efficient flow of traffic. Largespeed differentials are seldom if ever cited asa contributing cause, the factor being implicitin other improper driving cat.egories such as following too close and reckless driving.
"With these connotations of speed in mind it canbe appreciated that speed is very often not asingular or an explicit variable in the accidentequation. Thus, efforts to treat speed as anaccident cause are often reduced to treatingsymptoms arising from the synergy of speed andmany other system factors." (179)
There are differing views as to the effect of speed zon-
ing on accidents. Some studies have shown that speed limits
reduce accidents either in number or in severity.
164, 168, 170, 172, 174, 176)
(114, 155,
In 1960 John Baerwald wrote: "No evidence exists to
indicate that accidents are increased when speed zones are
- 19 -
d':'n t;; are rna teri alLy H".ducl.;,j by' e stabl ishing zones, al thow);,
'i dOvJ!1vJard trend is indicat:d." (96)
Other studi,~s hav(' sho,..ln that specc:c1 limi t practices
"Jere inc ffecti ve a t reducing accic.1en ts of any type'" (177
()nc: of the newe r theor.l eO) in the area of SPCl~ci and aCC.L-
dents "1 c.'-- ,) that accidents dre related to speed dlftercnc£s.
(189, 191) Probably Ute mo::.;t ricted study to support. this
theory was conducted by David Solomon. He concluded:
1. "The ac<:idc:1t·-involvemcnt, injuc/ .. aridproperty-O(imagc' rates werE: highc~;t. at very10\..] speedE;, lowest at about the aVl'Tdqespeed of all traEf lC, and incl'c"scc] at thevery high speeds, particularly ~t niaht.Thus, the greater the varia~jon in spec'cl ofdny 'leh] cle from the averaqc f3pe(~d of alltraffic, the greater its chance of boinginvolved in an accident."
2. "The severi i:y of accidents increased asspeed increased, especially at speeds exceeding 60 miles per hour."
3. "The fat.alit:y rate was hiS]hest at_ verl hi;,:,spE~eds and low(:st at about thE? c3'Ieraqc ,';i:;c~eCi."
4. "Pairs of :passenger car drive:t":,; invc'lvedin two-car, r('ar-end colli:,i J)", were: mucnmore likelyr.o be tra'JeilJlc:j at. speed (lif-T '·:crencer; CJY::(l·i~ly ir! CXCf':':.: of thnse ()]),~(:rvc
for pair:; (.IF cars in normal traffic ... '.
~~1. "r)ri\lC~rS c)f r\(i:::;S(~nSJl~r CZ1r~~ ,hZ_l\ling l(}\~" hc;.rs(~
[/)wer had ];JJhcr invol Vl,men t- rate::: t:::anelr i ver:, 0 I· car:, havin] hieher horsepower, ...Thi:, may )),-, related to the r,.'l.:ltjVC:~' ''/ l.'Doracceleration capability at hiq!lv/ay speedsof car~.; having 10\-,7 horsepower."
2 "- u

6. "Nearly hEtl f of a] 1 ace: i.dc'i1 t involvcrnentswere either rear-end collision or samedirection sideswipes. However, the proportion of these accident involvements decreasedas travel speed increased. Single vehicle,noncollision accident involvements contributed an increasingly greater proportionof all accident involvements as speedincreased, particularly at speeds of morethan 70 miles per hour. At speeds of 80miles per hour, non-collision acci~ents constituted half of all involvements. Althoughangle collisions usually were less than 15percent of the total, at speeds of less than25 miles per hour they constitutcJ more thanone-third of all accident involvements. Theproportion of head-on collisiuns or oppositedirection sideswipes incroased as speedincreased; but this typo of accident involvement always was less than 20 percont of thetotal regardless of spc'cd dnd (;ay ('1 nightcondi tions . " (167)
A recent study by RTI-IRPS indicated " a lU'-shaped re-
lationship between involvernen t rate and speed. dr,'V j i1 tion ...
These results confirm the hypoth(~sis that: slm<! driving as
well as fast driving increases the like1.ihood of being
involved in an accident. However, the curvature of this U-
shaped relationship is not as pronounced as that given by
Solomon ... "
The RTI-IHPS study also gave suppori to the w:;e of the
85th p\~rc()nti le cri terion ~~; ta tinq:
"'J'ho 3tal1dard dcviatic'1i. of Lh'· speed distributionis from:; to 7 mph. l\pprox.i.mately ~j~:& of thedrivers drive below tll\~ mean plus one o;tandanldeviation. The: driveL; havinq SIH-·(!r)r; bc,tweenthe mE~an and one standard d(~viation abovc~ the
) 1 .-
T"'l' -'-cqion betwe(:"~n on'? ':lnd hie standtll---,j dcvj·:lti_OD
ill )C)"''. th c mean s:Deed cnCU'T',pa~:;~:e,,; approximu tely] () pe I~cpn t a f the' driver:; ;,nd doC's not haV0 asignificantly oreater inv()lvc~pnt rat0 thCln ntmean speed. ~his reqion from the end of thefirst to the end of the ~oconrl standard dov~a
tion is approximately t~p tolerance level allowed~)y police ,"1genoie::-:." (]()U
A 1966 articlc' sho\'7o r1 theit on the fi"c SCcC
(182)
198, 199)
i_D-LD four main catC'o::Jries in the ::1'tic1; "1\:1 lnrorma-
tional Fe'port on Snc'cd Zoninci "
spoen limits should be ha~;ed on
7his article suqqests th ",-
! l ()']
In
(C' ,-
\ .) I
-)', ',-, \) , 20G, 2 () (3 , 209)
I'-inlTu1 I-(essler qj\,(~S the folln\riinq -'1)';(.,[;,' lion fo)
tho 85th nercontile fnr ] i T,j f- C' •"L,,; ..
-- 22-
"The 85th percentile speed is based upon thetheory that the majority of motorists travelingupon a city street or highway are competentdrivers and possess the ability to determineand judge the speed at which they may operatosafely; further, that motorists are responsibleand prudent persons who do not want to becomeinvolved in an accident and desire to reachtheir destinations in the shortest possibletime. " ( 204 )
A 1969 "Resolution of the annual meeting of the American
Association of State Highway Officials" states:
"The review of existing practice revealedthat most of the member departments use, primarily, the 85th percentile speed. Some agencies use the 90th percentile speed, and ofsecondary consideration are such factors asdesign speed, geometric characteristics, accident experience, test run speed, pace, trafficvolumes, development along the roadway, frequency of intersections, etc.
"On the basis of the foregoing review, theSubcommittee on Speed Zoning recommends to theAASHO Operating Committee on Traffic for consideration as an AASHO Policy on Speed Zoning that:
"The 85th percentile speed i.s to be given primaryconsideration in speed zones below 50 miles perhour, and the 90th percentile speed is to begiven primary consideration in establishingspeed zones of 50 miles per hour or above. Toachieve the optimum in safety, it is desirableto secure a speed distribution with a skewnessindex approaching unity." (207)
A California publication "Speed Zoning -- Why and How"
discusses the results that realistic speed zoning may pro-
duce.
- 23 -
"A. Reduce the speed dtffL:;rential in a tLlfficstream when there is a large variution 0,
speeds. This makes driving easier, incronscscapacity and reduces the likelihood [sic] ofaccidents by encouraging most drivers to travelat about the same speed.
D. Give enforcement officials a good guide as towhat a reasonable and prudent speed is undernormal conditions and permits concentrationof enforcement agilinst real traf fj c violators.
C. Give motorists a speed limit which they canrespect and obey. \""hl:~;'i drivers respectspeed limi t:s in arca.~::; with which they arcfamiliar, they are more likely to pay attention to limits in unfamiliar areas.
D. Assist traffic courts by providing a realistic guide as to normal, reasonable andprudent: speeds.
E. Give local residents a realistic pictureof the actual speed of most traffic. Thereis no safety in blind reliance on a 5~eed
~imit inconsistent with speeds actuallytraveled by traffic.
F. [r:.sure t.hat: all speed zone:': ::3atisfy ti,.'requiremc)nts of state law." (208)
More recently developed areas of discussion concern tho
uniformity of speeds or the speed distribut.ion. (85, 214)
William Taylor [las said that assuminq that var Lation oC
speed distribution and hig11 accident rates on cortain cc--
tions of highway arc a result of drivers' i lability to prop-
erly evaluate the driving situation, it seems that the
,>peed di:; tr ibu tion would bc~ helpful in det.ermi'linq '.-Jhc l:('
speed zoning might be effective.
centile may not be lnfluenced by each driver's inahilitv ~G
:2 4 --
make a proper evaluation of conditions in the way that skew-
ness and kurtosis of the speed distribution are. (210 )
Taylor's theory states that a relationship exists
between the rate of occurrence of accidents and the distri-
bution of speeds on a section of rural highway, and that the
effectiveness of speed zoning in reducing accidents depends
on the speed distribution before and after zoning.
His study concluded:
(211 )
"1. There is a strong relationship between therate of occurence of accidents and the speeddistribution on rural state highways.
2. The best parameter to use in determiningnon-normality is the skewness of the distribution.
3. Changing the speed distribution from nonnormal to normal results in an accidentrate reduction which is about twice thatfound under any other set of before andafter conditions.
4. warrants for speed zoning should be established which include the speed distributionas a factor.
5. The 'Before' speed distribution alone isnot adequate as a warrant for speed zoning."(177)
A Tennessee Department of Highways Study based on
Taylor's theory concluded that speed limits below 50 mph
are best represented by the 85th percentile, while limits
of 50 mph and above are best represented by the 90th per-
centile. (212 )
J. C. Oppenlander proposed a cost-based method of
establishing speed controls. His theory entails:
- 25 -
1. The se lect ion of an optimel1 speed th;] t mini·mizes the cost of hiqhway transporLucion,taking into consideration monetary, time,safety, and comfort factors.
2. An adjusted speed is derived from the optimalspeed by subtracting the reduction in speedoccasioned by driver, vehicle, roadway,traffic, and environmental variables thatmodify vehicular speeds.
3. Statistical relationships between upper andlower speed limits and adjusted speed produce t.he posted speed regulat:ion. (200)
Jack C. Marcellis attempted to apply part of Oppenlan-
derls theory, calculating the t.otal cost. of t.raffic movemen,
as the sum of operation cost, time cost, and accident co,;t.
The optimal speed for urban streets was sca.lr:~c1 accordinq
to frequency of stops. For passenger cars, optimal 1.Jrharl
speed ranged from 42 mph for 0 stops per mile to 27 mph for
16 stops per mile during the day. Niqht optimum J. S s l.-:'qh t 1 \."
lower. Commercial vehicles would move at an optimum speed
of ·37.5 mph at 0 stops per mile / and at 8 stop:') per mile
the rYJtimum would he 25 mph. (215)
~hus, it can he seen that there are three major approaci
to establishing speed limits, one based all. measures of prc-
vailing vehicle speeds, another based on characteristjcs of
the speed distribution, and a third based all. cost.
In summarizinq the body of litc~raturc conccrninc! :.:op,' d
and speed control, the reader can probably be certain
only one thing -- the controversial nature of many of the
- 26 -
Llndlngs in this area. However, in considering the most
rational and best supported approaches to various aspects
of the speed problem, the following conclusions would
seem reasonable.
1. Many of the basic premises concerning speedbehavior and its control are not new; they appearearly in the history of speed regulation and theautomobile.
2. Numerous factors relating to the driver, thevehicle, the roadway, "traffic, and the environmenthave a determining effect on driving speeds.
3. The main element in determining whether driversobserve a speed limit is their perception of thereasonableness of the limit.
4. Speed limits, taken as a whole, are beneficial,or at least appear to have no detrimental effecton accident occurrence.
5. Speed may playa large role in the severity ofaccidents, but is merely one of many factors inaccident causation.
6. At present the most widely supported criterionon which to base a speed limit is the 85th percentile speed.
7. The theory that accidents increase as the value ofthe standard deviation increases, i.e., that speeddifferences play a causative role in accidentoccurrence, is a promising one, as evidenced by ahigh accident rate at both low and very high speedsand a lower accident rate around the average ornormal driving speed.
- 27 -

3.0 SUR\IEY OF SPEED LIMI'I' PRACTICES-_._--------
A survey of the practices used by states and cities to
establish maximum speed limits was undertaken to determine
existing methods, technical resources and the manpower in-
volved in actually establishing speed limits throughout the
nation.
Questionnaires (see Appendix C) were addressed to the
Chief Traffic Engineer of the Highway Department of all
states, of all cities over 100,000 in population (130) and
of 52 selected cities with populations under 100,000.
It must be understood that the summary that follows
represents a summary of responses and not necessarily a
summary of actual practice. In general, the 85th percentile
concept has apparent widespread acceptance and speed-
measuring and volume-counting devices are available in
nearly all jurisdictions surveyed.
3.1 Response Rates
An overall response rate of 88% was achieved. Of the
questionnaires sent to each of the 50 states, 48 were
returned as a result of either our initial request or follow-
up letter. One hundred thirteen of the cities of over
100,000 population responded to the survey. All of the
surveys from the states and the larger cities are thus
included in the quantitative response analyses.
- 29 -- Preceding page blank
Tne 45 surveys received from the cities of less than
100,000 population are incJuded in a qualitative evaluation
The responses from these cities were generally of
CllV'st:.l.onahle rel lab! Ii t~y! and they were thus excluded from
the: qucmtitative anal.ysis.
3 ') J\.na1y s.:h~
?_~. 2 ~} ..__ §. t a !:.~_~l~~Y_~Y
Information from the state survey was analyzed in ~wo
ways. Tables of response breakdowns are presented in
Appendix D.
quecotion.
Table I sho,,,,s the numlJer of re-spc~nscs to CtlC}l
For example, on question I, no one selected
response .. l," tnrec selected response ":2 T II and 4(, scI ':: :.J" 1
rcsplJnsc !f 3 . !I In cases where more than one rLsponse wns
pcr;nitted (questions I, II, III, IV, VI! VII, and VIII) ,
res[onses to each alternative were tablllated separately.
For example, if the responses to a partic~llar quc;stion
were 1, G, 18, and 20, each was viewed as a separate rcs-
ponse. The frequency wi th "'lhic11 each such comC.lnatJOn
occurred was not determined, due to the great number of
possible combinations for each question.
~;C'cond, for qucstionsl.n which multIple rC'sponsc:c ':Jeri'
allv..'::'u, t~c avc~raq(' number of respon:,c:3 r'las tabulat_cc11l1d
th~ information presented in Table II .
. 30 ..
question V, for example, this indicates that an average of
10.31 different factors out of a possible 21 are used by
states in setting or altering speed limits.
3.2.2 General State Profile
In an overwhelming majority of states, numerical speed
limits are set by state statute, with provisions for changing
or setting speed limits by other agencies or jurisdictions.
Nowhere, are numerical speed limits set by state statute
without some such provisions allowing other agencies, pri
marily the state highway commission, county, or municipal
administrative agencies, to change or set speed limits.
Most states reported that any changing or setting of speed
limits by local agencies had to be supported by an appro
priate engineering or traffic study.
In 10 of the 12 driving locations listed under question
VIII, the states reported that they relied heavily on
traffic surveys and engineering methods as aids to setting
speed limits. On residential streets, traffic surveys and
engineering methods were used with the same frequency as
local officials or an agency representing a local juris
diction; in business districts local officials were most
commonly used to set speed limits, with traffic surveys a
close second choice. Though few states specified other
locations where speed limits were set, in those cases where
- 31 -
en':1ineerinq m,_,thods were u:;cd by a slim majority as aids
i.n c tdh~j :;hin9 .limits. In all types of driving locations,
citizens' petiLions weI:' rarely used <1:3 aids i;-i the estab-
ilsfllnq of spceci 1 i;Tlits .
1\11 s tat~es but one rf:portcd i:ha t L.he 85th pOTeen ti Ie
15 used in engineering or traffic studios prior to the
alteration or establishing ot a speed limit.
cons idered Wl':!re, in orde:c 0 r dee.n~asing frequency: aeci-
dent. expcric'Ilce at:. that 0:( ':'I.mllar locations, ball-bank
indicator, length of z()ne and l:ffect of dd:iaccnt zone,';,
design ';Dc~pd, pac and spacinq of intersecLi. C',S and Clri'1e-'
ways. Pl':c:;ciltage: oj commercial vehi,' :eo:~ was :::un:::-.i.dcrc'.l
least frequently.
Most state:'; cC}Jorted a eli f f oren j-J a j sp.'ed Iimi t for
trucks and cars, primarily for Lensons of safety. In state
'7here cars at1.d trucks had the'; samc:3pCE.::cl limit, facili tatL
of traffjc flow was the primary considccation. In TIC' case
did any state report that trucking or other ;ndustries
directly lnfluenced truck S;'2i::,d limi t:
l.ndi Cd. '~~or~, .
. ,-- 32
reported that vehicle coun ters were avai lable to th,~m.
Very few states listed additional available devices wlu ch
might aid them in setting speed limits. Where additL'J.dl
devices were listed, computers were most frequent, but by
a very slight margin.
Nost states did report making attempts to evaluate
the effect of new speed limits. Answers as to how this
effect was measured were quite varied, but most contained
similar elements: before and after studies were used
extensively, and were related to other factors such as aCC1-
dent experience, 85th percentile, radar checks, and speed
checks. While reasons for not measuring the effects of
new limits were not requested, one state did provide such
an explanation, namely, that the beneficial effects of
reasonable limits have been well established in numerous
studies.
In summary, responses concE!rning speed limit prac-
tices at the state level may be summarized as follows:
1. State statutes set numerical speed limits and makeprovisions for changing or setting speed limitsby other agencies or jurisdictions.
2. Authority to set or change limits is largelydelegated to two agencies or authorities: thestate highway commission and county or municipaladministrative agencies.
3. When local agencies set or change speed limits,the change must be supported by an engineeringor traffic study.
- 33 -
4. For rC'~;identi()l ~3tn'et_~;, traffic surv,-_'ys anci localofficials set speed limits; in business distrlcLSlocal officials set speed limits; at all otherlocations traffic surveys are used exclusively.
5. The ten elements most frequently considered intraffic or engineering studies of speed limits are,in order of frequency:
85th percentJle speed- accidEmt experi(~nce at that_ or ~~in'cllar
locations- ball-bank indicator data- len(Jth of zone b.nd effect of ad~iaccnt
zones- design speL,d- pace- spacing of intersections and drive-
ways- tra.ffic volume- presence and condi tion of :iC~j ; (1ers- average test run speed.
6. For reason~3 of safety i:h(~rc lS d :3EJccd limit oif£,;(-ential for trucks and cars.
7. Four instruments; radar, vascar, hall-bank indicator, and computer, are generally available tomeasure vehicle speed, traffic characteristics,and roadway features.
8. Attempts to measure the effects of new or alterodspeed limits are made with t.he ~lSC oj beforcand-after studies.
3.2.3 Cities
Information about the cities with population over
100,000 is tabulat0d in Appendix D. Dat~ for cities WIt
populations less than 100,000 were not tabulate~ due'
response size and response validity considerations. As for
t.he states, the responses were counted to obtain the n'lITJ:Jer
\4
of responses to each question. Table III shows this infor
mation. The first two listings on this table show that
there wery 90 "1" (" yes ," in this case) and 15 "2" (" no ,"
in this case) responses for question I. Again, each number
in a combination response was counted individually.
Second, on questions where a combination response was
possible (questions II, II, IV, V, VIII, and IX), the average
number of responses was tabulated. Table IV shows that on
question II, for example, the average number of responses
was 1. 02.
Third, all cities were classified into groups, based
on the state in which they were located. A profile of
each state's cities was then developed by counting the
responses of the cities, and comparing the cities of each
state among themselves to find similarities and differences.
Fourth, the general profile of each state's cities was
then compared to that state to find similarities or dis
similarities in the answers.
3.2.4 General City Profile
A great majority of the cities reported that states
delegate authority to them for establishing or setting
speed limits in their jurisdictions. This authority, granted
- 35 -
\\7il.::h state highway conunissions, county or muniC!_pal traCf"
engineers, and other agencies, such as the city council.
Though each of these three agencies can set speed limits.
most limits are actually established by county or municipo_
engineers.
Ilinimum speed limi ts an:; SE.' t. U1 most, ~"1 t c:ertcLi._ rlly
not all cities. ~heir use is largely confined to express
ways and urban expressways.
All but three ci ties report 1lsing enC.fLi:.":r J."CT s tv' i(
to determi no speed I_imi ts, and the 8 r,th p(~r
important consldcrat:ion in nearly ever,)' (';St'.
tors, including accident experience at that or ~imilar
locations, length of zone and effect of adJacent zones,
presence of pedestrians, and traffic signals ~n
traffic controls, are considered much less eCten trla:l thE'
85th percentile.
That traffi c surveys and engineering stuc1iC'~: an
wide 11' used again reveals itself in the ci tics I repor-t:; tl, \ '
at (~v(:r:l location these methods are most eften uSC'cJ to :-,ct
or chdnge a speed limit.
RalJar was ~lvailable to every Cl~)! but one, ond t- ct:
city listed it as being helpful for u ,_ure 'N'ork. 'IF:hiclc
counters and ball-bank indicators were also avallabl~ to
- 36 -
many cities. While there was no extensive listing of desired
but unavailable instruments helpful in dealing with speed
limits, computers and road sensors were most requested.
Most cities did report attempting to learn the effects
of new speed limits, relying heavily on before-and-after
studies for work in this area.
In general, a typical city had the following character-
istics:
1. Authority to set or change speed limits, as providedto the city by the state legislature throughstatute.
2. County or municipal traffic engineers having thisauthority and actually setting most of the speedlimits within the jurisdiction.
3. Use of minimum speed limits, primarily on expressways.
4. Use of engineering studies in setting or changingspeed limits.
5. Eight factors commonly used in such engineeringstudies are, in order of frequency:
- 85th percentile- accident experience at that or similar
locations- length of zone and effect of adjacent
zones- presence of pedestrians- traffic signals or other traffic controls- traffic volume- design speed- spacing of intersections and driveways
6. At every location, traffic surveys and engineeringmethods are most commonly used to set speed limits.
- 37 -
7. Radar, vehicle counters, and Lcd L-[) lnkidj,:a;are available for use in measurin~1 vf:hl eTc p''''(traffic characteristics, and roadway features.
8. Effects of new speed limi ts are studic'c' bv !-<",and-after tests and surveys.
Although spe:cific questions on thE~ state and ci ::::tn'
vel's vary sligh tly, the qusstionnai l:"t::o rc:que~~L ver-y ,,1 E' L·.
kinds of information.
For purposes of this comparison r r'spcl',;"'''' L' t::
lowing questions are discussed:
II
IIIIIIII
IVV
VIIIIX
IIII'
VIVI IIVIII
VIIIX
For convenience in the remainder of this di,,;cus~~i::;;
stat.e questions are preceded by "s," and cj t'.' qUC"'tiUL
a "c."
vvhen the ci t.ics of a s t~ate were ;;o·lipa.;:'\?d teo ,1,
dgreement was found in the following cas,,,s:
- 38 -,
c i
sI .... cI
sI .... cII
sII .... cIII
sI II .... cVI
sIll .... cVIll
There was agreement when the statereplied "1" (no delegation ofauthority to set speed limits), forall such cit1es replied "2" (no delegation of authority to set speedlimits). There was also agreementwhen the state replied "2" or "3"(delegation of authority to setspeed limits), for all such citiesreplied "1" (delegation of authorityto set speed limits).
There was agreement when the statereplied "2" or "3" (delegation ofauthority to set speed limits), forall cities replied "I," "2," or "3"(specification of the agency whichgrants authority to set speed limits).
There was a'Jreement when the state andall cities specified the same agenciesto whom authority to set speed limitswas delegab~d. (Since in sII, "I" 1Sno delegation of authority, stateresponse "2"' matches city response"I," state response "3" matches cityresponse "2," etc.).
There was aqreement when the stateresponded "5" (cities must use engineering methods to set speed limit),for all cities responded "1" (engineering studies are used). If thestate responded "2," "3," or "4"(specification of other constraintson the cities) in addition to "5" andall cities responded "1," there wasstill agreen~nt, for the other stateconstraints do not conflict with therequirement of an engineering study.
There was agreement when the stateresponded "5" (cities must use engineering methods to set speed limits),for the city responded "2" (use ofengineering methods to set speed
- 39 -
sIV .... cVIII
sV .... cVIII
sVIII .... cIX
sIX .... cX
limits) in every case a-m. If thestate responded "2," "3," or "4"(specification of other constraintson the city) in addition to "5," andall ci ties responded "1," "3," "4,"or "5" (other factors considered insetting speed limits) in addition to"2," there was still agreement, forthe other constraints or methodsdo not conflict with the state requirement or the city use of engineeringmethods in setting speed limits.
There was agreement insofar as thestate and all cities considered thesame factors or used the same methodsin setting speed limits (parts a-mwere considered separately: stater(~sponse "1" matches ci ty response"1," state response "2" matches cityresponse "2," etc.).
There was agreement insofar as thestate and all cities considered thesame factors in setting speed limits.(State response "1" matches cityresponse "1," state response "2"matches city response "2," etc.).
There was agreement insofar as thestate and all cities used the sameinstruments to measure vehicle speeds,roadway characteristics, etc. (stateresponse "1" matches ci ty response "1 f"
state response "2" matches city response "2," etc.).
There was agreement when the stateresponded "1" (s tl.ldy of the ne\v speerllimi ts is made), for all c1 ties re~;pon(>
ed "1" (study of new speed limits i~;
made). There was also agreement whenthe state responded "2" (no study ofnew limits), for all cities responded"2" (no study of new limi ts) .
- 40 -
A comparison of sI (state question I) to cI (city ques
tion I) and cII shows general agreement between states and
cities. A great majority of states report that authority to
set or alter speed limits has been given to the cities by
statute. The cities corroborate this information, for they
report in appropriate cases that the states have, in fact,
delegated this authority to them. Further, cities most
commonly report that this authority has been statutorily
granted.
In sII the states report that the authority for setting
or changing speed limits is most often deleg~ted to the state
highway commission, and then to the county or municipal
administrative agencies. Cities are in slight disagreement on
this point, however, for they indicate in cIII that first,
county or municipal traffic engineers, and second, the state
highway commission, most often have this responsibility. Only
one state selected county or municipal traffic engineers as
having this authority; the cities indicated the authority of
county or municipal administrative agencies with about medium
frequency.
In sIll the states reported that the cities must support
speed limit changes or alterations by engineering or traffic
studies. Cities do, correspondingly, follow this constraint.
In cVI all responding cities reported using engineering
.- 41 -
studies ln the determination of speed limits.
cVIII, cities reported that at every location traffic and
engineering methods were used more commonly than other
methods of setting or changing speed limlts. In addition, in
eX most cities indicated that the effects of new limits were
stucied, usually by engineering or traffic study methods.
Answers from the states and cities on questions sIV and
cVI II are virtually identical. As mentioned, ci t.ies prefer
to do traffic surveys and engineering methods at every loca
tion. States preferred these methods in every case but two;
of these two, engineering methods were used either as often
as local officials and agencies or were a close second choice.
Citizens' petitions were rarely utilized by states or cities.
with the exception of engineering methods and citizens'
pet.ition, then, all other choices were selected with similar
degrees of frequency.
With regard to factors included in engineering or
traffic studies, states included an average of 10 factors and
cities an average of 8. Using the information from sV and
eVIl, the fact.ors in this question can be ranked. The factcr
selected the most frequently is assigned rank number 1, the
factor selected next most frequently is rank number 2, etc.
wi th a few exceptions, the rankings are not simi lar. S tate~)
-- 42 -
and cities ranked 85th percentile and accident experience at
the location, first and second, respectively. In both cases,
fac":ors least often considered were ranked identically. For
example, slipperiness of pavement, roughness of pavement,
percentage of commercial vehicles, and other factors were
ranked 18, 19, 20, and 21, respectively. With these excep
tions, the rankings vary widely, as Table V illustrates.
Responses to sVIII and cIX were similar in two ways.
First, both states and cities indicated that an average of
three of the instruments cited were available to them.
Second, both selected the same kinds of instruments as being
most commonly available. Radar was most frequently available
to both states and cities. In order of availability, the
states then selected ball-bank indicators and vehicle
counters; for the cities the availability of these two was
reversed. States and cities did not report that the remaining
instruments were equally available, however.
In response to sIX and cX, most cities and states indi
cated that the effects of new speed limits were studied.
Similar methods, such as before-and-after studies of accidents,
85th percentile, etc. I were utilized in both cases.
In general, states and cities agreed in their responses
to most of the survey questions.
- 43 -

4.0 SPEED LIMIT CONCEPTS
The following discussion of tht2 objectives and func-
tions of speed limits and the establishment of speed limits
is intended to provide the reader with conceptual framework
necessary for critically examining the literature and under-
standing the arialytical objectives of this study.
4.1 General Concepts
Certain generalizations can be made that highlight
the interplay of factors that constrain the development of
a methodology for the establishment of speed limits:
1. Speed limits are established by the operation ofthe legal system. Such establishment must beconsistent with the objectives of the TrafficLaw System.
2. Speed limits are intended to reduce risk withinthe Surface Road Transportation System. Thus,the speed limit must be related to hazard.
3. Drivers tend to ignore limits that are perceivedas unreasonable. Thus, an effE~ctive limit mustbe perceived by the majority of drivers asreasonable.
4. There are an almost unlimited range of variablesarising from the man-machine-highway mix thatimpact on the determination of a reasonable speedlimit.
5. Few jurisdictions have manpower resources ortechnology to permit implementation of a methodfor establishing speed limits requiring sophisticated data collection and analysis.
- 45 - Preceding page blank
The above-m(~ntioned factors are di scusscd in more
detai.l in the following sections. It is hoped that the
reader will realize the complexity of issues presented,
and '.vi 11 accept the inherent di fficul ty accompanying a
short dissertation on a complex subject.
_,±-~~pced Limi ts an(~__-t:l1e~£~f~i.~ Law ~y~stem
The establishment of speed limits may be regarded as
an operational act of the Traffic Law System (TLS) consis
tent with the basic objective of the TLS -- risk management
of the Sur face Road Transportation Sys tem (SRT).
The TLS is the basic social control system applied to
manage risks within the SRT system. The TLS operates in
four basic functional components; Rule Making, Enforcement,
Adjudication, and Sanctioning.
Thus, when the operation of a motor vehicle at a speed
inappropriate for existing conditions is identified as a
risk to the basic operation of the SRT System, the TLS 15
called upon to operab2 in risk management mode. In general,
this is done by the establishment of a speed limit, the
enforcement of such a rule with appropriate adjudication
and sanctioning of offenders. Theoretically, sanctions
act to correct the offender and serve as a deterrent to
others similarly inclined.
- 46 -
If the TLS is to effectively function as a risk manage
ment system, the rule making component must precisely and
correctly identify risk. If this is not done, the remain
der of the system inefficiently allocates resources in
dealing with individuals who technically violated a rule
but in fact did not engage in hazardous activity.
An examination of enforcement activity indicates that
the bulk of traffic citations are given for speeding offenses.
Accordingly, the bulk of court activity is taken up with
speeding offenses and the bulk of sanctions are imposed for
speeding.
If it were clearly established that all speed zones
were precisely established to define risk, the above-mentioned
allocation of resources could be defended as appropriate for
a risk management system. Regrettably, the opposite seems
to be the case in many instances.
Speed limits which are improperly posted, particularly
those which are set artificially 101117, tend to be ignored
by the majority of drivers and thus have little effect on
SRT risk. At the same time the limit makes technical
violators of a high percentage of drivers. Frequently, the
high number of violators draws enforcement presence and
concurrent citations.
- 47 -
Such action violates the basic concepts of risk manage
ment inasmuch as resources are being diverted to deal with
low risk behavior when they should be focused on high risk
behavior as a priority. Not only are enforcement resources
diverted but the resources of the courts and administrative
agencies are also clogged.
Perhaps more important than the damage to the TLS
system in a sheer cost sense is the damage to the TLS as a
control mechanism. The TLS, as part of the Criminal Justice
System of our society, is dependent upon public support and
must maintain a position of fundamental fairness to operate
e ffecti ve ly. Inappropriate rule making which creates
fundamentally unfair enforcement, adjudication and sanction
ing constitutes a detriment to society.
The impact of such improper setting of speed limits
can be evaluated only when one recognizes that more citizens
have contact with the Criminal Justice System and its con
stituent agencies through traffic violations than through
any other single cause.
4.3 Speed Limits and Risk
The basic objective of the Surface Road Transportation
:':;i'stem is to facili..tate the flow of goods and people from
.- 48 --
point to point as safely as is possible. It might be more
appropriate to think of the basic objective as having two
components~
1. Maximize Flow
2. Maximize Safety
It should be obvious that some conflict exists in the
concept of the two components. The flow rate would theoret
ically increase as speed increased. Similarly, it could be
hypothesized that safety would decrease as speed increased.
Examination of the real world reflects that a trade
off has occurred as drivers have made heuristic judgments
in arriving at the speed they travel. Thus, it appears
that a discussion of the risk of flow disruption or the
risk of an accident or other potential safety threat must
consider such real-world activity. One could picture the
concept of risk as a curve with a minimum point as shown in
Figure 4-1. Available data indicates that the slope of the
curve is quite flat near the minimum point indicating that
there lS a range of speeds with nearly the same risk value.
It would seem desirable to encourage drivers to operate
their vehicles at speeds within the speed band with minimum
risk.
Theoretically, maximum speed limits could be set at
the upper end of the speed band, minimum speed limits at
- 49 -
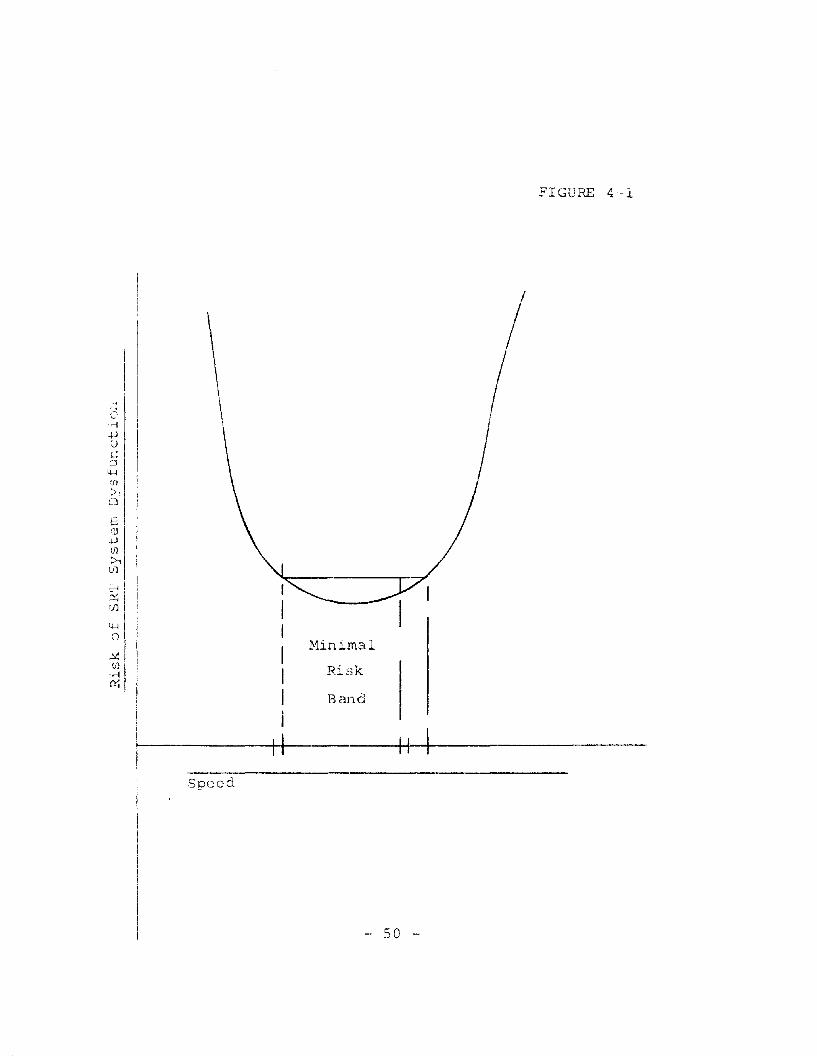
FIGURE 4-1
/!
_. 50 -
Risk
Band
Minimal
Speed
t:' I I~I4-~ I' i Io ! I
i~ I I-~ I~j I :
I I\r---Hr-----f+-I-----!i
I
II
~11o
SC.J
-W(j)
>-.(f)
the lower end of the speed band, and advisory speed limits
at the middle of the speed band.
Establishment of enforceable maximum limits lower than
the upper end of the minimum risk band would not act to
reduce risk within the SRT system and would be inconsistent
with the objectives of the TLS system.
Thus, it appears that a method for establishing a
maximum speed limit should result in the selection of a
value for the speed limit that would fall at or near the
upper end of the minimum risk band.
4.4 Speed Limits and Driver Acceptance
There has been a tendency on the part of many indi
viduals associated with rule-making and highway safety to
assume that the correct met.hod of dealing wi th a particular
problem is to enact a law making the undesirable behavior
illegal and it would cease. The illusory nature of this
concept is perhaps nowhere better illustrated than in the
case of speed limits.
While it is quite possible to compel response to
unreasonably low speed limits by the presence of over
whelming enforcement resources, such a level of resources
simply does not exist in the Uni ted States. 1'he chances of
a violator being detected and apprehended are so low that
- 51 -
travel speeds are selected by most drivers quite independent
of considerations of the illegality of exceeding a speed
limi t. Studies have reflected that unreasonably low or
high speed limits are ignored.
Unfortunately, all drivers do not ignore unreasonable
speed limits. The net result of improperly selected speed
limits appears to be a widely dispersed mix of speeds.
Some drivers ignore the limits others obey them. The
resulting speed distributions are often characterized by
wide differences in travel speeds.
This result is inconsistent with the studies that
indicate risk increases with deviations from a mean speed.
It is also inconsistent with those studies which indicate
that a normal distribution with a small standard deviation
is desirable.
Thus, it appears that for a speed limit to minimize
risk effectively, the speed limit must be accepted by the
majority of drivers as reasonable and must be voluntarily
obeyed.
4.5 Factors Affectina the Development of a General Method______ _ :...2__________________________ . ,_. _
The search for a general method to establish speed
limits has occupied the attention of traffic specialists
- 52 -
since the wheel was invented. The literature is replete
with discussions and methods.
Most discussions recognize the almost infinite set of
variables arising from the man-machine-highway mix that
interact to influence the choice of an appropriate speed
limit for a particular highway. The type of drivers, the
mix of vehicles, the geometry of the particular highway are
just a few of the factors that could be considered.
While a method for establishing speed limits for a
particular class of highways might be based on a complex
evaluation of such variables such as number of intersections
per road mile or nature of roadside development or any
other number of physical characteristics, such an approach
would be incapable of being widely generalized.
Researchers in the field of speed control have generally
recognized the futility of attempting to base a general
method on characteristics of a particular highway environ
ment. Instead, they have recognized that the general behavior
of the driver mix serves as an indicator of the influences
of highway environment. Each driver considers, consciously
or unconsciously, a range of factors and selects an appro
priate travel speed for a particular highway. An examination
of the distribution of travel speeds of a sample of safe
- 53 -
drivers appears to serve as the best indicator of an appro
priate speed limit. The impact of the innumerable other
variables are reflected in distribution of vehicle speeds.
'['lie weight of expertise supports the concept of such
a general approach and accepts that a value selected by such
a method represents a best estimate. Such an estimate would
then be judgmentally evaluated in light of local conditions
and minor corrections made if warranted by factual data.
A general method has definite value for the overall high
way safety field. It promotes consistency in a wide range
of jurisdictions which In turn could be expected to produce
better driver response or compliance.
While such an approach is accepted by the majority of
researchers, the literature still contains references to
"optimal methods" which are conceptually inconsistent with
the approach of a general method. If one accepts the
common scientific interpretation of the term "optimal" as
the single best value, one must also conclude that it canno·t
be appropriately applied to a general method designed to
select a value at or near the best value. Thus, this report
focuses on a general method for the establishment of a
"reasonable" or "appropriate" speed limit as opposed to an
"optimal" speed limit.
- 54 -
4.6 Factors Affecting Implementation of a General Method
If the hypothesis that wide implementation of a general
method of establishing speed limits is desirable to promote
commonality and consistency within the SRT system is accepted,
one must be concerned with the development of an implemen
tation scheme that can be widely used.
Two basic considerations underlie implementation of any
technique in the highway safety field. One, can it be
implemented by existing manpower resources? Two, can it be
implemented utilizing existing technology?
In general, the manpower available for the establish
ment of speed limits possesses limited scientific education
and training. Major urban areas and state highway depart
ments are usually staffed by compe'tent traffic engineers.
Smaller urban areas often assign traffic engineering duties
to individuals without formal education or training.
The actual mechanical establishment of speed limits,
even in the major jurisdictions, is often assigned to non
engineering personnel. The range of judgment exercised by
such individuals is evident in the mix of speed zones on
our highways. It is not uncommon to discover the function
of speed zone establishment assigned to law enforcement
officials. While there are notewor-thy exceptions, in
- 55 -
general, such individuals are not familiar with traffic
engineering practices and tend to rely on intuitive judg-
ment. Such judgment is often conditioned by years of con-
cern with speed as a primary perc~ived accident factor.
Frequently, the result is a speed limit lower than appro-
priate for existing conditions.
The implementation of a general concept will be
dependent upon its presentation in terms that can be easily
understood by an individual without engineering or scien-
tific training.
Speed measuring devices and traffic counters are
almost universally available in most jurisdictions. The
cost of such devices is relatively low so that acquisition
or expansion of existing equipment could be accomplished
with minimal difficulty. More sophisticated equipment is
not generally available nor is the manpower available that
could use such equipment.
The method developed for implementation must rely on
data that can be coll,ected by existing manpower utilizing
presently available or easily acquired instrumentation.
4.7 Criteria for a General Method of Establishing SpeedLimits
The discussions in the prior sections have indicated
certain factors and constraints which structure the
- 56 -
development of a general method of establishing maximum
speed limits.
A general method should meet the following criteria:
1. Be fundamentally fair in the context of theTraffic Law System.
2. Be related to risk of dysfunction in the SurfaceRoad Transportation System.
3. Be accepted as reasonable by drivers.
4. Be capable of general use on a range of highways.
5. Be capable of being implemented by existingresources.
Such criteria have been considered in the analyses that
led to the development of the recommended general method.
- 57 -

'i.o DISCUSSION OF METHODS FOR ESTABLISHING SPEED LiJ'll.., ..>
In previous sections of this report numerous techni,:!uc.
for establishing maximum speed limits have been described.
The present section is concerned with:
1. Screening these techniques to eliminate thosewhich clearly fail to meet the five criterialisted in section 4.7.
2. Further analysis of the techniques surviving thepreliminary screening process.
5.1 Screening Analysis
A total of thirteen techniques for establishing maximULi
speed limits were identified in the literature review and
the survey of jurisdictions. The screening analysis matched
each of these techniques against the five criteria listed
in section 4.7. Those techniques which clearly failed to
meet anyone of the five criteria were eliminated from further
analysis. The results of the screening analysis are
summarized in Table 5-1. Note that numbers 6, 7, 8, 9, II,
12, and 13 in the matrix are only elements that may affect
driving speeds, and thereby fail to meet all the necessary
criteria.
In considering this presentation, the reader should
bear in mind that the criterion "Be related to risk
of dysfunction in the SRT system" means that a causal rela-
tionship between dysfunction and speed must be shown to
- 59 - Preceding page blank
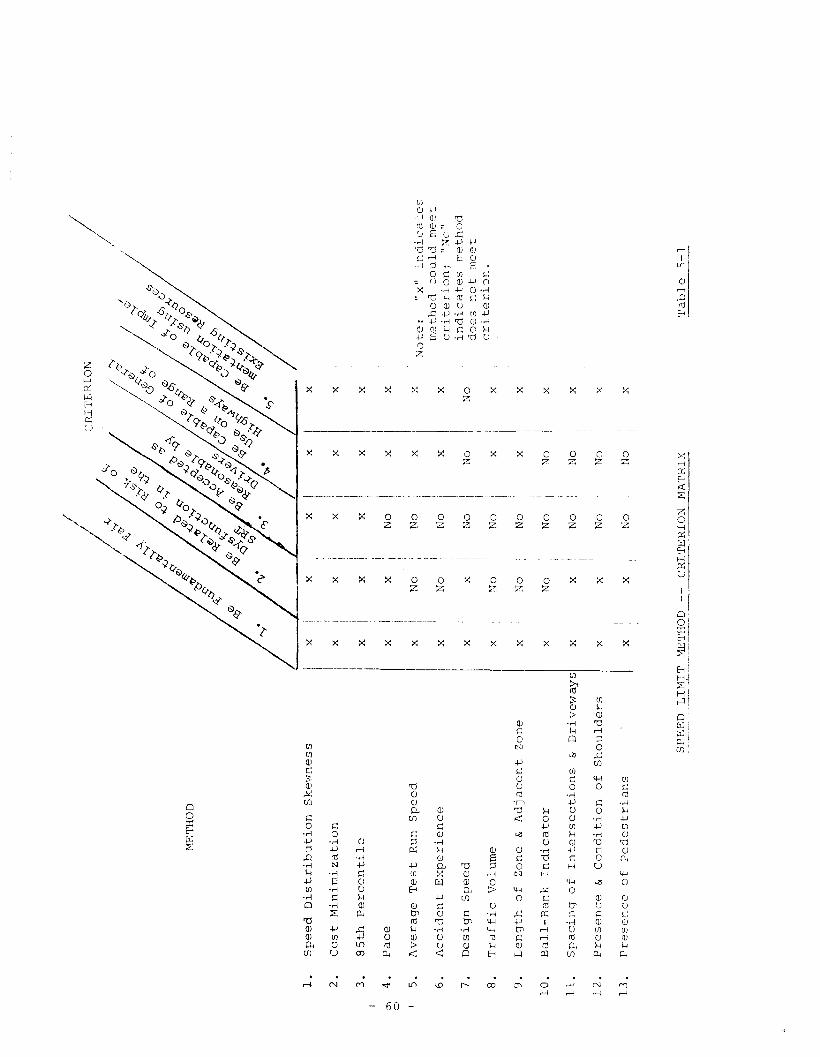
MET
HO
D
CJU
1'E
1UO
N
Ie:
~.o:
t;>"Y
'2;
.0
,u
oY-;
''Y.t:::
'§ru
,,0
0'"
yfl0
~O.t
:::'q
;~
'''1
0,
v'O'
~·.t
:::'
-<.;
-<.;"
1
n-,(
[;ru.
t:::'.
0y~
+"1
.<q
/
/
l.S
peed
Dis
trib
uti
on
Sk
ew
ness
!x
xx
xI
x
2.
Co
st
Min
imiz
ati
on
x;
xx
xx
!
3.
85
thP
ercen
tile
xx
xx
x)
0'\
4.
Pace
xx
No
xx
0
5.
Av
era
ge
Test
Ru
nS
peed
Ix
!N
oN
ox
xn
Xli
i_n
clic
ate
sI
No
te:
Accid
en
tE
xp
eri
en
ce
II
meth
od
co
uld
meet
6.
xN
oN
ox
Ix
crit
erio
n;
"N
u"
7•
Desi
gn
Sp
eed
Iin
dic
ate
srr
.eth
od
Ix
xN
oN
oN
od
oes
no
tT
Dee
t
8.
Traffic
Vo
lum
e
II
crit
erio
n.
xN
oN
ox
iX
9.
Len
gth
of
Zo
ne
&A
dja
cen
tZ
on
ex
No
No
xI
x
10
.B
all
-Ban
kIn
dic
ato
r
Dri
vew
ay
J
xN
oN
oN
oI
x
lI.
Sp
acin
go
fIn
ters
ecti
on
s&
xx
No
No
x
12
.P
resen
ce
&C
on
dit
ion
of
Sh
ou
lders
r
xx
No
No
x
13
.P
resen
ce
of
Ped
estr
ian
sx
xN
oN
ox
SP
EE
DL
IMIT
MET
HO
D--
CR
ITE
RIO
NM
AT
RIX
Tab
]e
5-1
exist by the present body of evidence. Further, the
criterion "Be accepted as reasonable by drivers" is intencicu
to imply acceptance by a larg~ ~aj~)ri~ of drivers.
The table shows that, based on elementary considera-
tions, only three of the techniques: can be considered to be
generally in consonance with all five criteria:
* Taylor's theory of speed distribution skewness
* Opperlander's cost-oriented approach
* The 85th percentile method
It is noted that criteria 2 and 3 are the ones most
conunonly not met by the various techniques.
The pace speed failed the screening test by the
narrowest margin. It was rejected because, by definition,
it is accepted as reasonable only by m~!e drivers than
any other speed increment. Thus, the drivers traveling
within the pace speed do not necessarily comprise a !?rge
majority of the drivers, and criterion 3 is not met.
5.2 Analysis of Selected Methods for Establishing SpeedLimits
The three approaches for establishing speeds limits
which survived the initial screening process are subjected
to further analysis in this section.
- 61 -
Taylor's theory (177) states that accldent frequency
increases with increasing deviation of the speed distri-
bution from normality, where the deviation is increased by
the non-symmetry of the speed distribution. Thus, a speed
limit may be said to be "effect1ve' 1£ the skewness of the
resulting speed distribution is small.
The Tennessee Department of Highways has applied this
theory in a study which undertook to define a method for
determining speed limits and to presc~nt proof that th.c
recommended speed leads to a speed limit which scrvcs its
stated purpose, namely t.he reduction of accident rates. To
do this, speed data were collected at many speed zones.
Those zones with a small value of skewness (i.e., non-
symmetry) were selected as having effective speed limits.
Next, the Tennessee study attempted to determine which
characteristics of the speed distribution (i.e., 85th per-
centile, 90th percentile, mean speed, or median speed) wus
most clearly represented by the posted speed limit. The
result of this investigation, based on 384 locations, 189 of
which showed normally distributed speeds, was that speed
limits below 50 mph are best represented by the 85th per-
centile, and those above 50 mph are best represented by the
62 -
90th percentile. From this result the conclusion was drawn
that the 85th or 90th percentile should be reconunended where
the appropriate conditions prevail.
Several questions arise regarding Taylor's theory and
its application by the Tennessee group. The first is a
basic one regarding the nature of speed distributions.
Taylor states that:
In a situation where all drivers are able todetermine and evaluate the conditi.ons that existat that time and at that location, the resultingspeed distribution is normal with no skewnessand no kurtosis. (177)
unfortunately, no data supporting this statement can be
found nor has there been any analysis of how the probability
distribution is influenced by speed, traffic obstacles,
roadway obstacles, and other factors. For example, there
is evidence that speed distributions may be bimodal in the
vicinity of intersection. This effect is shown most vividly
by the IRPS data collected in Monroe County, Indiana.
Figure 5-1 represents data collected on SR 37 over a two-
hour period. The sensor site was located within 50 feet of
an intersection. A distinct bimodality is noted with peaks
occurring at 24 and 40 mph. Figure !;-2 indicates bimodality
may occur also at locations where there are other types of
traffic flow impediments. The sensor site was located near
a bridge under repair where traffic vIas being s lowed by a
flagman.
- 63 -
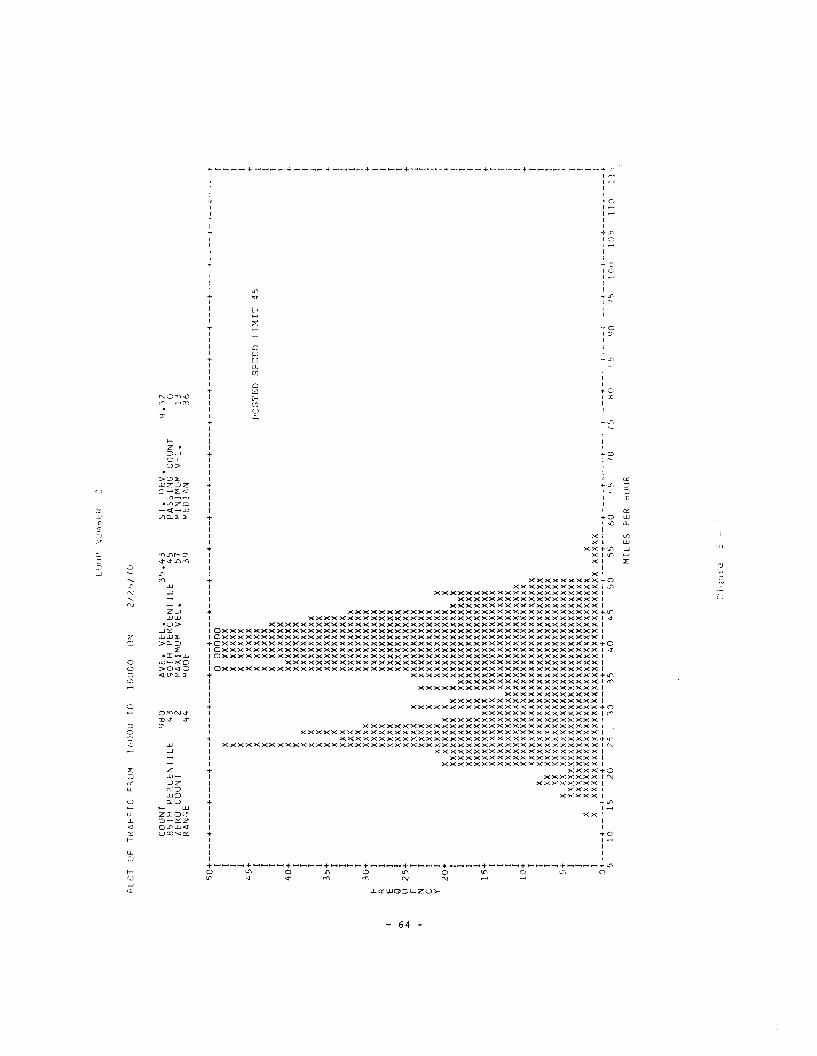
l.P
\Ufv
1'itK
[)
PLO
TO
FT
RA
FF
ICFR
UM
Ihl)
()U
TUI8
lJO
OliN
2/2
10
/70
CO
UN
T85
TH
PE
RC
EN
TIL
EZE
RO
CO
UN
TR
AN
GE
98
04
3 24
4
AV
E.
VE
L.
35
.43
90T
HP
ER
CE
NT
ILE
45
MA
XIM
UM
VE
L.
57
MO
DE
39
ST
.!)
FV
.P
AS
SIN
GC
OU
NT
MIN
IMU
MV
EL
.M
ED
IAN
8.3
2 o1
33
6
+ + ! T i I + I I I !I I I ! + I---
;.1
1'>
lID
10
5
50+----+----+----+----+----+----+----+----+----+----+-
---+----+----+----+----+----+----i----+----+----+----~
----+
Ia
00
00
0I
IX
XX
XX
XX
II
XX
XX
XX
XI
IX
XX
XX
XX
I4
5+
XX
XX
XX
X+
1X
XX
XX
XX
P')
ST
ED
SP
EE
DLl~IT
45
II
XX
XX
XX
XI
IX
Xxx
xxxx
i1
XX
XX
XX
XX
I4
0+
XX
XX
XX
XX
X+
1X
XX
XX
XX
XX
II
XX
XX
XX
XX
XX
II
Xx
XX
XX
XX
XX
XI
1X
XX
XX
XX
XX
XX
13
5+
XX
XX
XX
XX
XX
X~
IX
Xxx
xxxx
xxx
IX
XX
XX
XX
XX
XX
XI
XXX
XX
XX
XX
XX
XX
IX
XX
XX
XX
XX
XX
XX
30
+X
XX
XX
XX
XX
XX
XX
XF
IX
XX
XX
XX
XX
XX
XX
XR
1X
XX
XX
XX
XX
XX
XX
XE
IX
XX
XX
XX
XX
XX
XX
XQ
IX
XX
XX
XX
XX
XX
XX
XU
25
+X
XX
XX
XX
XX
XX
XX
XE
1X
XX
XX
XX
XX
XX
XX
XX
XN
IX
XX
XX
xX
XX
XX
XX
XX
XX
CI
XX
XX
Xx
XX
XX
XX
XX
XX
XY
1X
XX
XX
Xx
XX
XX
XX
XX
XX
XX
20
+X
XX
XX
XX
xx
XX
XX
XX
XX
XX
XX
Ixx
xxxx
xxXX
xX
XX
XX
XX
XX
XX
XX
IX
XX
XX
XX
XXX
XX
XX
XX
XX
XX
XX
XX
XX
IX
XX
XX
XX
XXX
XX
XX
XX
XX
XX
XX
XX
XX
1X
XX
XX
XX
XXX
XX
XX
XX
XX
XX
XX
XX
XX
15
+X
XX
XX
XX
XX
XX
XX
XX
XX
XX
XX
XX
XX
XX
IX
XX
XX
XX
XX
XX
XX
XX
XX
XX
XX
XX
XX
XX
IX
XX
XX
XX
XX
XX
XX
XX
XX
XX
XX
XX
XX
XX
IX
XX
XX
XX
XX
XX
XX
XX
XX
XX
XX
XX
XX
XX
XI
XX
XX
XX
XX
XX
XX
XX
XX
XX
XX
XX
XX
XX
XX
X1
0+
XX
XX
XX
XX
XX
XX
XX
XX
XX
XX
XX
XX
XX
XX
XI
XX
XX
XX
XX
XX
XX
XX
XX
XX
XX
XX
XX
XX
XX
XX
IX
XX
XX
XX
XX
XX
XX
XX
XX
XX
XX
XX
XX
XX
XX
XX
IXX
XX
XX
XX
XX
XX
XX
XX
XX
XX
XX
XX
XX
XX
XX
XX
IXX
XX
XX
XX
XX
XX
XX
XX
XX
XX
XX
XX
XX
XX
XX
XX
5+X
XXX
XX
XX
XX
XX
XX
XX
XX
XX
XX
XX
XX
XX
XX
XX
X1
XX
XX
XX
XX
XX
XX
XX
XX
XX
XX
XX
XX
XX
XX
XX
XX
XX
XI
XX
XX
XX
XX
XX
XX
XX
XX
XX
XX
XX
XX
XX
XX
XX
XX
XX
XI
XX
XX
XX
XX
XX
XX
XX
XX
XX
XX
XX
XX
XX
XX
XX
XX
XX
XX
XI
xxx
xxxx
xxxx
xxxx
xxxx
xxxx
xxxx
xxxx
xxxx
xxX
XX
XX
0+
----+
----+
----+
----+
----+
----+
----+
----+
----+
----+
----+
----+
----+
----+
----+
----+
----+
----+
----4
----+
----
5ID
15
20
25
3D3
54
04
55
05
510
0~5
707
5KO
85uO
Q~
10
0
'"...
MIL
ES
PER
HD
IJR
I'i
q',;
-1
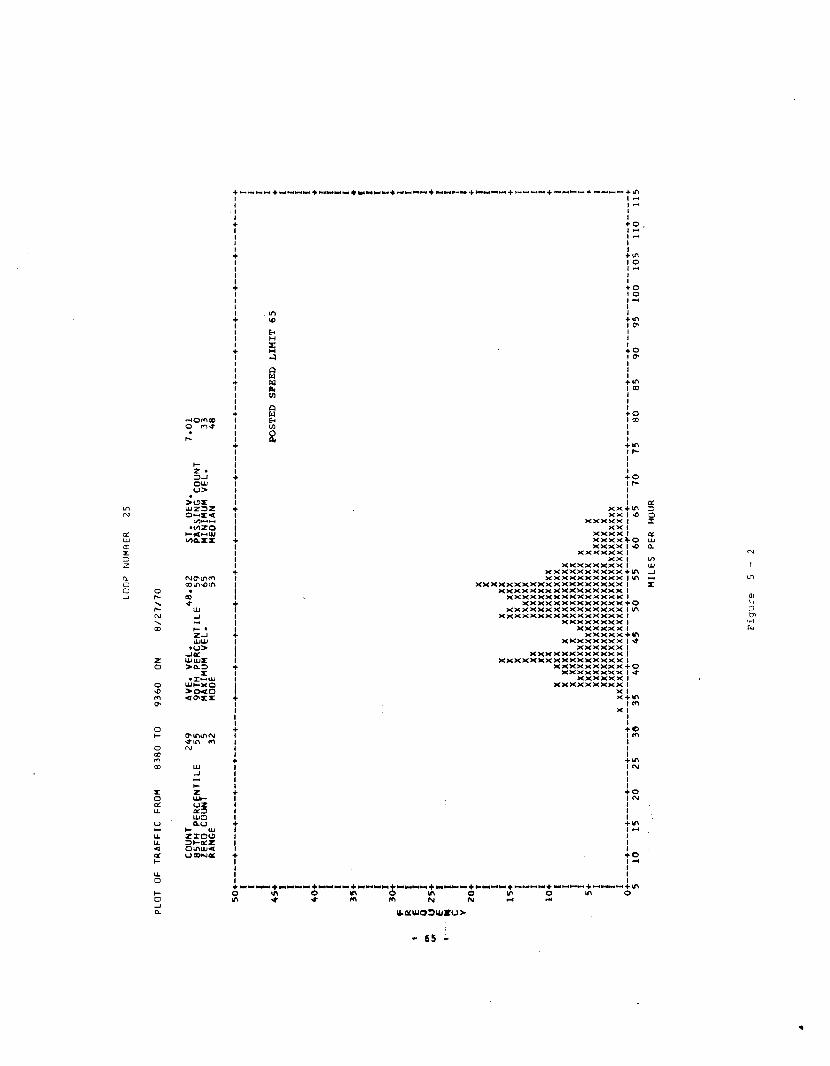
PLO
TO
FT
RA
FF
ICFR
OM
83
80
TO9
36
0O
N
LOO
PN
UM
BER
25
6/2
71
70
CO
UN
T85
TH
PE
RC
EN
TIL
EZ
ER
OC
OU
NT
RA
NG
E
24
95
5 53
2
AV
E.
VE
L.
48
.82
90T
HP
ER
CE
NT
ILE
59
MA
XIM
UM
VE
L.
65
MO
DE
53
ST
.D
EV
.P"
ASS
ING
CO
UN
TM
INIM
UM
VEL
.M
ED
IAN
7.0
1 o3
34
8
..
... VI ,--
-
50
+----+
----+
----+
----+
----+
----+
----+
----+
----+
----+
----+
----+
----+
----+
----+
----+
----+
----+
----+
----+
----+
----+
II
II
II
45
!P
OS
TE
DS
PE
ED
LrM
IT6
5!
II
II
II
II
40
++
II
I(
I(
II
35
+•
I!
II
II
II
30
.•
FI
[R
II
EI
(g
I(
U2
5+
+E
I(
NI
IC
IY
I(
20
+•
,)(
Ii
X(
(X
(I
XX
XX
I1
5+
XXX
XX
X+
IX
XXX
XX
II
XX
XX
XX
XI
IXX
XX
XX
XX
I1
XXX
XX
XX
XI
10
+XX
XX
XX
XX
XX
+(
Xxx
xX
XX
XX
XX
XI
IX
XX
XX
XX
XX
XX
XX
XX
XI
IX
XXX
XX
XX
XX
XX
XX
XX
II
XX
XX
XX
XX
XX
XX
XX
XX
XX
XX
I5
+X
XX
XX
XX
XX
XX
XX
XX
XX
XX
XX
X+
IX
XX
XX
XX
XX
XX
XX
XX
XX
XX
XX
XX
XX
II
XX
XX
XX
XX
XX
XX
XX
XX
XX
XX
XX
XX
XI
IX
XX
XX
XX
XX
XX
XX
XX
XX
XX
XX
XX
XX
XX
XX
II
XX
XX
XX
XX
XX
XX
XX
XX
XX
XX
XX
XX
XX
XX
XX
XX
I0+----+----+----+----+----+----+----+----+----+----+----~----+----+----+----+----+----+----+----+----+----+----+
51
01
52
02
53
e3
54
04
55
05
56
06
57
07
58
08
59
09
51
00
10
51
10
11
5
MIL
ES
PER
HO
UR
Fig
ure
5-
2
It i~ apparent, then, that before Taylor's assumptlo~~
regarding normality, skewness, and kurtosis can be accepted,
we will need more data descrlbing the probability distri-
bution.
jnc appllcatlon of the theory by the Tennessee group
als n raises a question. The Tennessee study used as the
mea:)ure of rear-mali ty the skewness index S. I., where S. I.
is deflned as
_ 2 (P 9 3 - P 5 0) andS . r. - --p 9 3--------pr
P7 = 7th percentile speedP50 = 50th percentile speedP93 93rd percentile speed
Till S lndex provide s a mr=" as ure of symme try, not nor:nali ty .
For example, applying the skewness index to a normal dlstri-
bution will result ln a skewness index of 1.00, but the
same result will also be Obtained for any other symmetric
probability distribution.
It is also important to note that Taylor's theory
does not provide a measure for distinguishing the effects
of left skewness from the eftects of rlght skewness. A
curve skewed to tne right (i.e., with most of the probabilit
distribution to the right of the peak of the distribution)
will have more cars going faster than will one skewed to
the left, and it would seem that the severity, if not the
- 66 -
frequency, of accidents would be greater for a right skew
than for a left skew. It is believed that this factor
should be considered in any theory of speed distribution.
Thus, considerable work needs to be done before Taylor's
thf:ory can be accepted as a basis for a methodology for
determining speed limits. One believes that considerable
insight could be gained by analysis of those 195 Tennessee
locations which showed non-normal distributions. The Ten
nessee study does support the concept that for symmetric
speed distributions, speed limits below 50 mph are best
represented by the 85th percentile, those of 50 mph and
higher, by the 90th percentile.
5.2.2 Oppenlander's Cost-oriented Approach
A major criterion of a speed limit is the degree to
which it results in a reduction in accident rate. Oppen
lander's approach takes this factor into account, along
with several others, all of which are reduced to a common
denominator, cost. He seeks the spE~ed limit which mini
mizes total cost, where the cost components are the opera
tion cost, the time cost, the accident cost, and the cost
of comfort and convenience. Operation cost is assumed to
be a decreasing function of speed; accident cost is assumed
to be very small relative to the other two and is assumed
- 67 -
,lear]',' const.ant; and LlI" Cr)st of comfort and convc;nicnc('
J:; d,::~umcd Lo lH; non--quanLlli,1h]p. vJi Ii, these' ass umpt Lons ,
i)pl'enl<lnc1cr creat.os a total cost function and finds its mini-
mum at some "optimum speed." He then selects upper and
lo\vcr speed limits "in such Cl. manner that the average speed
()f travel on the roadway section being speed-zoned coincides
with the adjusted (for roadway environment conditions)
speed."
The advantage to Oppenlander's approach is that it makes
the problem of determining optimum speed limits a proble;n
of public choice, with the cost function beinq the cost to
the: pub1i c as a whole. Tn such a CO;1t~(;xt it is pc:~sibJ('
t.u analyze such questions as the track·-of-f ,:; b:~tW,;C:'l costs
of increased la"v enforcement and benefits of increased traffic
flow, if increased traffic flow is shown to be the result of
more stringent law enforcement. It is also possible to
analyze the costs and benefits of conducting speed surveys
in order to determine the speed limit which most facilitates
traffic flow, if such a speed limit does indeed exist.
Tllus, Oppenlander's approach is regarded as having
considerable interest conceptually and one deserving of
fclture study. Such fu·ture efforts must place a heavy EJ,>
phasis on the determination of the cost components. The cost
of the political and emotional impact of high accident rates,
- 68 -
as well as vJays of assessillg f,lOr(' accu.cat.ely the relative!}'
concrete cost components (e.g., vehicle, loss ot earni~gs,
insurance) must be treated.
IN If,USt, nevertheless, concJude that Oppenlander's
approach is not sufficlently developed to serve as a baSlS
for present lmplementation. Future research may change thlS
.:::onclusion.
5.2.3 The 85th Percentlle Method
The 85th percentile speed is mentioned in most of the
Ilterature dealing with the establishment of speed limits.
It is a speed which uses the speed data usually collected
by traffic specialists; it is a speed easily calculated
once data has been obtained; and it is a number which
reflects the judgment shown by most drivers in their reac-
tions to the environmental conditions of the roadway.
Further, a substantial body of data has been collected
which indicates that the method may be consistent with the
oDjective of low accident involvement rate (number of
accidents per 100 million vehicle-miles).
A study by Solomon (167) shows that 85th percentile
speed is in the speed range where the accident involvement
rate (number of accidents per 100 million vehicle-miles) is
lowest. This conclusion has been given added weigHt by d
- 69 -
:::e.1" YeCt.l~t. study pc,rformcc1 1)\· U
Lute ~nd supported by IRPS. 'l'hi <; studv c"'.;nclude~;:
Tn"x' \·;a::.' not :~uf f i..cicnt delta ava.llable toallow a full analysis but it appears that thisstud~ reinforces the setting of speeds [8ic]liwits at the i:35th pcrccnLilC' sp(-;ed. The standard dc'vi,J.tion of L-:.he speed di:3tribution is from:) t.o -;' mph. l\.pprox imate 1y 8 S% of the' driversdrive helow the mean plus one standard deviation.Ttl" '[1: ;vr:r:.--, havinq speeds b(·t\,v~cn thc' mean anden ~.~ ~:; -:._ ;111 (~(.'~ .r(] (lev i cl t: i Cj 11 a l.JC)\f(~ t 11 c~ rn(~ a a r c_ elf:: f 1
nit.cly III d lcn,y-involvcmcnt group. 'l'hc r<)giol,,~tv,7(',:n ')11(' and t.wo:::tan<1dn.: dc'vLatio0s clbovctl',; m"cJJl speed (,ncompasc:-;cs ajJprox i..mc:tTe ly 10 :'cy"cnL r)f the driver::; and does not have: d ~;ignif.i..
cantly greater involvement rate thai') at r;lc~an
speed. This region from the end of th~ :irstto the end of the second standard deviat~on lS
approxin'latcly the tolerance level a.llow('c] Lvpolice agencies.
It minimum speed limits are set a simllarargumc" I. h'8uld lead to the conj ecturc' that trwliilJi t c:hould be placed at about the' 15th percentile speed with enforcement at ahout the5th percentile" (191)
)lew:<-, C'.lrn'nt Ii tera::'ure indicates that the 8Sth perccnti.i..c
c;pE,,'ci limi t i~j one fallinq- in the speed in terval wi thin
\iuch few accid(;nL3 occur.
The 8Sth percentile, by definition, also reflects the
J,-.lCJi'lent of lTlljSt dri\lers. This fact is hrought out in
"Spc~ed Zoning -- ~-vhy and How":
This [the 85th percentil~ speed] is the speedat or below which 85 percent of the traffic
is moving. Experience has S;lO\07n that this isthe one characteristic of traffic speeds whichmost nearly conforms to a reasonable limit.Speed limits set higher than the critical speedwill make very few additional drivers "legal"for each five mile per hour increment of speedincreased. Speed limits set lower than thecritical speed will make a large number ofrec-sonable drivers "illegal" for each five mileper hour increment by which the speed isreduced. (208)
It seems remarkable that the speed range which 85%
of the drivers do not exceed is also the safest. Appar-
ently the public's perception of hazard is a valid one.
The arguments, then, for the use of the 85th percentile
speed as a speed limit are that, first, the 85th percentile
speed is a speed below which the probability of occurrence
of an accident is low; second, the 85th percentile reflects
the safe speed for given environmental and traffic con-
ditions as reflected by the judgment of most drivers. The
85th percentile has the additional advantage that it is
easily obtained with present equipment and with a minimum
of computation.
- 71 -

6.0 ANALYSIS OF IRPS DATA RELA'l'ING SPEED AND ACCIDENTS
6.1 Introduction
This section of the report introduces data collected
by the ~RPS Computer-Sensor System. Analyses of the data
are presented in order to provide a further basis for
choosing a method for establishing maximum speed limits.
The three methods discussed in the previous section will
then be re-examined in light of these analyses, and a
recommended method will be presented.
Since May of 1969, IRPS has been collecting extensive
speed and accident data in the vicinity of the Indiana
university in Monroe County, Indiana. The speed data were
collected auton:atically by sensor loops lnstalled at
seven locations on Highway SR 37, near Bloomington, Indiana,
and at four locations within Bloomington. The sensor
loops are connected with an IBM 1800 computer. T11e arrival
time and speed of each car which crosses a sensor loop are
stored on magnetic tapes. These data are availaole begin
ning in May, 1969, up to the presen1: time. A detailed
description of the sensor loop system is given in Appen
dix B.
In addition to these speed data, there are accident
files for SR 37 as well as for the areas surrounding two of
- 73 - Preceding page blank
the four locatlons wi t~hi n Bloomingi:oYl.
Ii!' C' n ;-;: cpt sinc e th e beq inn i n Ci 0 t 19 6 8 .
These files n~ve
Among other infor-
;-n3 Lion, the exact posi t.ions of the accidents are lis ted.
6.2 roacn
The analytical investigations were conducted in two
Fart.s. F1.rst, the interrelationshLp bebveen the paramet(?r"
vihich define speed distribution and accident frequency we,re
studied from the viewpoirlt of sensor location. For each
of the seven sensor Sltes on SR 37, these parameters were
computed, and statistical comparisons were made. Thu5,
for each pair of parameters studied (e.g., mean speed and
accident frequency), seven data points were available.
The other approach taken was to lump the data from
all sensor sites and examine the parameters derived from
the aggregate. In thlS approach, it was possible to study
the accident rate distribution as a function of speed.
6.3 Results
6.3.1 The Effect of Locatlon
For each of the seven sensor sites on SR 37, SlX
characteristics describlng vehicle speed distribution were
computed using standard statistical techniques.
parameters are defined as follows:
v Average speed
0 V Standard deviation of speed
- 74 -
These

v = Coefficient of variation
V85 = 85th percentile speed
V85- l5 = Difference between 85th percentile and15th percentile speeds
Sk = Pearsonian coefficient of skewness
The results of these calculations, plus the number of acci-
dents occurring within 0.4 miles of each sensor site are
summarized in Table 6-1. Statistical analyses of these
data led to the following conclusions:
- 75 -
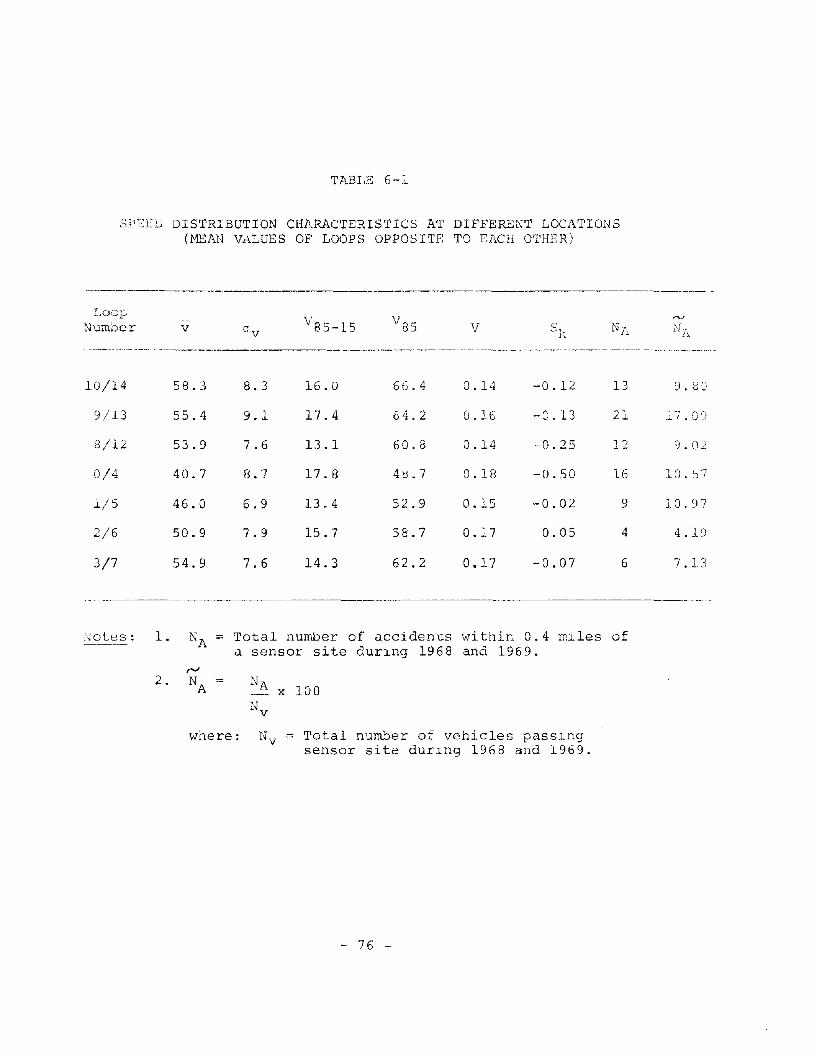
TABLE 6-1
SPEED DISrrRIBUTION CHARAC'fERIS'.rICS AT DIFFERENT LOCATIONS(MEAN VALUES OF LOOPS OPPOSITE TO EACH OTHER)
LoopNLlJ.'11ber v
v _8~ V NA
-~_.~ -- +--'-,'--'---" ------.--_.__._---- ._0___'_"---"- _____.'_._.. _ .•.. _..._______ -----,-'--- _. __._--_..._.__._--_ .._...._._-
10/14 58.3 8.3 16.0 66.4 0.14 -0.12 13 9.80
9/13 55.4 9.1 17.4 64.2 0.16 -0.13 21 17.09
8/12 53.9 7.6 13 .1 60.8 0.14 --0.25 12 9.02
0/4 40.7 8.7 17.8 4ti.7 0.18 -0.50 16 10. ,- ...,::ll
1/5 46.0 6.9 13.4 52.9 0.15 -0.02 9 10.97
2/6 50.9 7.9 15.7 58.7 0.17 0.05 4 4.19
3/7 54.9 7.6 14.3 62.2 0.17 -0.07 6 7.13
Notes: 1. = Total number of accidenLs within 0.4 miles ofa sensor site durlng 1968 and 1969.
where: = 'I'otal number of vehicles pasSlngsensor site durlng 1968 and 1969.
- 76 -
1. Parameters which measure speed spread (e.g., a)
tend to increase with increasing number of acci
dents.
2. There is no apparent relationship between traffic
mean speed and number of accidents.
3. The speed distributions at all of the sensor
sites are nearly normal.
4. A large increase was noted in numbers of accidents
with increasing absolute value of speed distribu
tion skewness. This increase was observed even
though the maximum skewness that occurred was only
0.5. These findings are consistent wlth Taylor's
theory. (177)
Thus, it seems clear that speed distributions containing
a large spread of speeds may be associated with high acci
dent rates. An analysis of the fine structure of accident
speed distributions was conducted next to determine the
amounts of spread that may be tolera"t:ed as relatively" safe,"
and that which the traffic law system should seek to eliminate
by the implementation of suitable speed limlts.
6.3.2 Accident Frequency Distribution Studies
This analysis considered how accident involvement rate
varies with the deviation of the speed ot the accident-
- 77 -
involved vehicle (AIV) from the mean speed of the traffic
stream. The ratlonale followed was that in order to achieve
a high level of trafflc flow, the highest possible speed
limit would be sought consistent with acceptably low acci
dent rates. Thus, the speed limit would not necessarily
h~ve to occur at the speed which resulted in absolute mini
mum accident involvement but could be higher, if the accident
involvement did not increase more than a few percent. Speed
limits occurring in regions of rapidly increasing accident
invol'Tement w'ere not permitted.
The basic data used were those collected by IRPS in
Monroe County, Indiana, and reduced and presented by RTI in
reference 191. Since we were seeking a maximum speed liml t
rather than a minimum limit, a cumulative distribution was
used which showed accident involvement rates at all AIV speed
deviations less than a given value.
The data are presented in Figure 6-1. Curves are shown
for SR 37; SR's 45, 46, 48 (total); and all SR's in Monroe
County. Turning vehicles nave been excluded to make the data
applicable to our purpose. Note that regardless of which
roads are being considered, the slopes of the curves are
nearly constant and :ceasonably low for AIV speed deviations
of less than 10 mph from the mean speed of the traffic stream,
A precipitous rise is noted in accident-involvement rate in
- 78 -
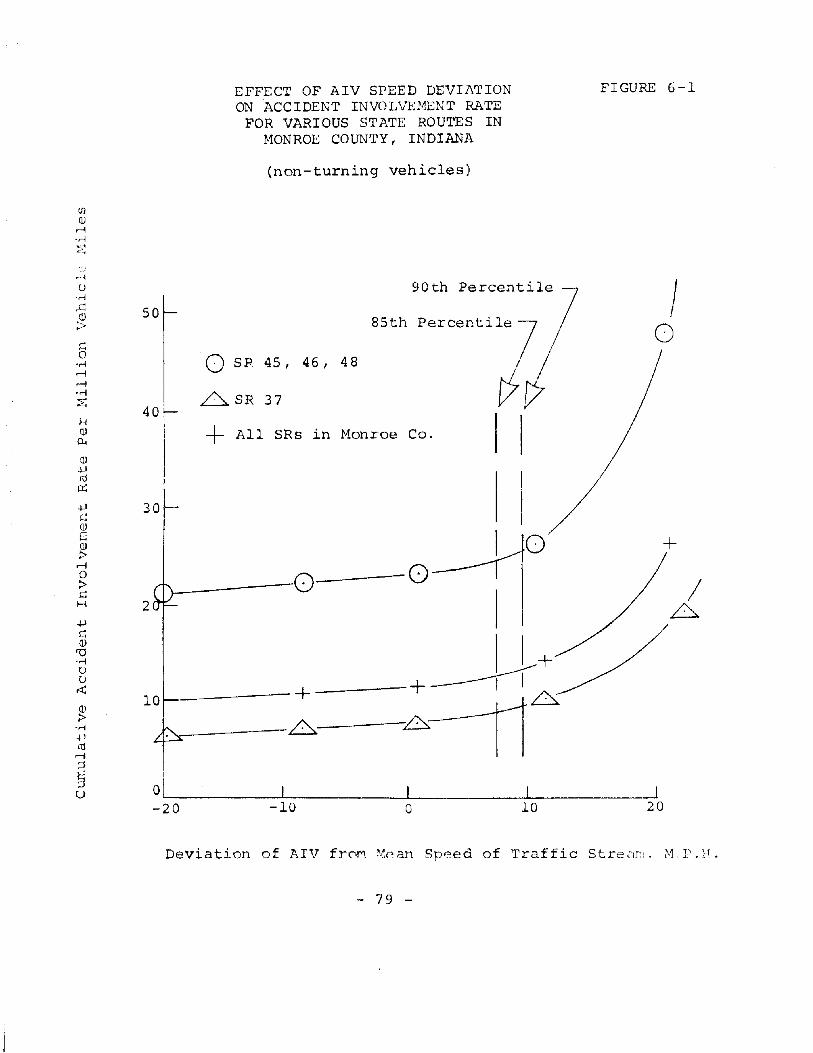
EFFECT OF AIV SPEED DEVIATIONON ACCIDENT INVOLVE~£NT HATE
FOR VARIOUS STATE ROUTES INMONROE COUNTY I INDIANA
FIGURE 6-1
(non-turning vehicles)
/6
+
'--_--0----0 --
o I I_ '-2"":"""0-----_-1=-O:---------lo---------J1
LO----------l
20
II 1+
+ _---+-----t--rlO~-~-_-_---------_-6-_-6---[16
90th Percentile /5085th Percentile7 0
o SP 45 I 46 I 48
t76SR 3740
+ All SRs in Monroe Co. I I
2
30
Deviation of AIV froM ~1p an Sp'?ed of Traffic Stre <'lIn < )\1 P. H .
- 79 -
the speed deviation region 10 .::. \lVAIV < 20 such that, for
example, vehicles traveling at speeds up to 20 mph gr."eater
than the mean have an accident-involvement rate nearly
twice that of vehicles traveling at speeds up to 10 mph
greater than the mean!
It is therefore clearly important that maximum speed
limits be set to reduce the likelihood of travel at speeds
much greater than 10 mph from the mean speed of the traffic
stream.
Consideration of a mei:hod to implement this concept
must take into account bolO real world practices. First,
speed limits are almost universally established in five
mile increments. Thus, the impact of rounding values is a
consideration.
Second, enforcement practices allow a tolerance, that
is a range above the posted limit before enforcement action
is taken. This is justified partially on the basis of
possible measurement error either by the officer or the
driver. The fact that actual travel speeds vary so that a
well-intentioned driver may slightly exceed an absolute
limit is also considered.
Thus, any value selected as a function of speed dis
tributions is llkely to be altered in implementation. ~vhile
the impact of a lower implemented value may not have great
- 80 -
risk significance due to the relatively flat slope of the
risk curve, the opposite is true of a higher value.
The 85th percentile speed (85, 77, 98, 22., 113, 140,
203, 204, 205, 206, 208, 209) appears ideally suited for
such a speed limit. First of all, it. is a speed which, by
definition, 85% of all drivers do not exceed, so that
enforcement action need be targeted at a maximum of 15% of
the drivers. If, however, enforcement is set at the 85th
percentile plus 5 mph (i. e., mean spE~ed plus 12 mph), only
about 4% of the drivers will be enforcement targets. Further,
the resultant accident-involvement rate will still be
acceptably close to the region of lo~rest accident involve
ment.
The case for a 90th percentile speed limit is not as
persuasive. It is, to begin with, uncomfortably close to
the high accident involvement region, which is also a region
of great sensitivity to small changes in speed deviation.
Additionally, even a small enforcement margin places one too
high up on the accident involvement curve.
Some researchers have stated that a 90th percentile
limit may be more attractive in situations where the mean
speed of the traffic stream is greatE!r than or equal to
50 mph (207). At first glance, the Honroe County data seem
- 81 -
to confirm this (figure 6-2). However, if percentage in
crease in accident-involvement rate is th~:> cri terion, then
the 90th percentile limi t: fares no better for mean speeds
over 50 mph than it does for those less than 50 mph. Con
sider; for example, t.he percentage increase in accident-
nvolvement rates obt.ained from increasing the enforcement
speed from 85th percentile plus 5 mph to 90th percentile
plus 5 mph. For mean speeds of less than 50 mph, there is
an 11% increase in accident-involvement rate, while at
mean speeds of greater than 50 mph, a practically identical
10% increase is noted. Thus, the 90th percentile limit
would appear to be preferable for speeds over 50 mph only
if absolute accident-involvement rate is the criterion and
accident-involvement rate, rather than accident-involvement
disutility, is to be minimized.
Actually, in any real world application, the effect of
setting a speed limit at the 90th percentile rather than the
85th percentile would be difficult to detect. In the first
place, IRPS data indicate that the speeds associated with
these points will not in all likelihood differ by more than
2 to 3 mph (see appendix E). Secondly, the practice of
rounding speed limits upward to the nearest 5 mph provides
a band of tolerance which, if the limit were set at the 85th
percentile, would include the 90th percentile .
.- 82 -
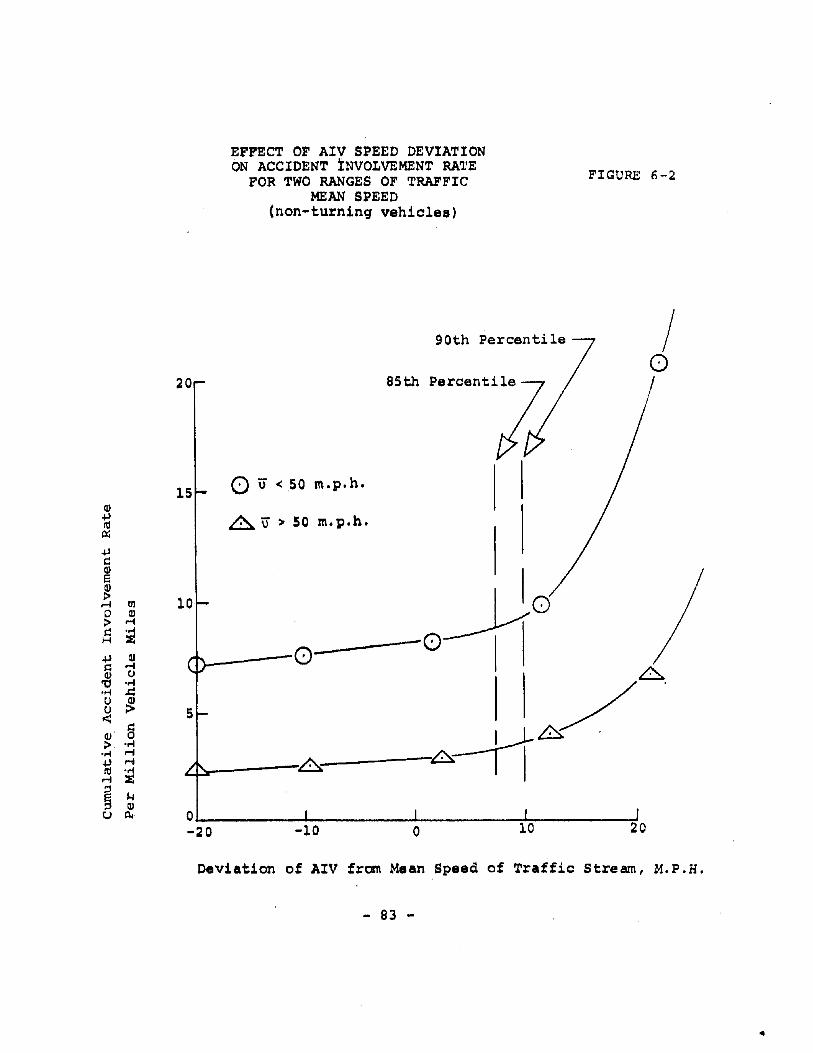
EFFECT OF AIV SPEED DEVIATIONON ACCIDENT INVOLVEMENT RATE
FOR TWO RANGES OF TRAFFICMEAN SPEED
(non-turninq vehicles)
FIGURE 6-2
O~ ---'L..- -..J --J, -..,.I
-20 -10 0 10 20
/o
90th Percentile
85th
o u <SO m.p.h.
~ u > 50 m.p.h.
~.------6----~ I
5
20
15Q)+Jttl~
+Js::Q)e~M III0 Q)
> Ms:: ~H
+J Q)
s:: MCD u'0 0.-10.-1 ~U
~U~
§Q)
> 0.-10.-1 r-i+J r-ittl 0.-1M X
§ ~Q)
U IJ.l
Deviation of AIV from Mean Speed of Traffic Stream, M.P.H.
- 83 -
..

7.0 CONCIJUSIONS
The concept of establishing a maximum speed limit on
the basis of the 85th percentile of travel speeds on a
highway is recommended. Such a maximum speed limit meets
the risk management objectives of a speed law and can be widely
implemented utilizing existing manpower resources and tech-
nology.
Such a limit is:
1. Fundamentally fair in the context ofthe Traffic Law System.
2. Related to risk of dysfunction inthe Surface Road Transportation System.
3. Accepted as reasonable by drivers.
4. Applicable to a wide range of highways.
5. Capable of implementation with existingresources.
The recommendation of the 85t:h percentile speed limit
concept is supported by a substantial portion of the technical
literature as well as the data and analyses of the present
study.
A method for implementation of the 85th percentile
concept is explained in the next chapter and presented in
detail in Volume III of this report.
- 85 - Preceding page blank

8.0 THE RECOMMENDED METHOD
This section discusses in detail the recorr~ended imple
mentation method for setting a speed limit and the rationale
behind various aspects of the method.
8.1 Background
In order that the findings of this study might be trans
lated into a usable form, it was decided that an implemen
tation manual would be structured to apply to any level of
traffic personnel involved in the setting of speed limits,
but primarily it would be directed toward those people without
a college engineering background who are responsible for
setting speed limits in smal.ler communities and jurisdictions.
As was stated in section 3.0, the survey results indicated
that often an enforcement or public works official is res
ponsible for determining speed limits in such jurisdictions.
Since the findings of this study indicate that at
present the best speed limit is a "reasonable" one, this
manual is an implementation of the 85th percentile method.
According to the conclusions of this research, the 85th per
centile criterion produces an appropriate speed limit value
in terms of the objectives of a speed limit defined in
section 4.0. Also the literature and the survey indicate
- 87 - Preceding page blank
that the 85th percentile criterion is not only reasonable
but is also familiar and acceptable to numerous people in
the traffic field. Among those who responded to the question
naire survey, awareness of the 85th percentile criterion
was nearly universal.
Because the 85th percentile is familiar to many traffic
specialists, it is undoubtedly put to use in various ways
throughout the country. The purpose of this manual, then,
is twofold. First, it is to teach traffic specialists how
to correctly derive a speed limit from the 85th percentile
criterion using statistlcally valid procedures. Secondly, It
is to promote uniformity throughout the country in the
setting of speed limits.
Before discussing t.he implementation method, itself,
it is important to understand how the method will be presented
to the individual traffic specialists. Since one of the
primary objectives of the implementation package is to promote
uniformity throughout the country, it is obvious that the
implementation method must be distributed to a widely dis
persed audience. It is also desirable that the presentation
be relatively simple and understandable, as well as low in
cost. Because of these three qualities, ease of distri
bution, ease of understanding, and low cost, a self-instructic),;
-- 88 -
educational method -- programed learning -- was chosen. It
was decided that the educational tool would be most effec
tive if presented in two parts. Thus, the manual consists
of first, a programed educational tE~xt which teaches the
traffic specialist the 85th percentile method, and second,
a field workguide for him to use as a checklist while
actually setting a speed limit. This package has the addi
tional advantages that no special instructors are needed and
that the educational program can be worked at the convenience
of the individual traffic specialist. The programed imple
mentation text can be found in Volume III of the report.
In addition, a brief presentation of the recommended
method can be found in Volume IV of the report. This manual
was designed for the experienced traffic engineer, and
contains a short discussion of the recommended implementation
of the 85th percentile method, plus the field workguide
that is presented in Volume III.
- 89 -
8.2 Sampling Method
The recommended method of setting a speed limit is
based on a statistical procedure known as systematic samplinc:.
The choice of a sample da.ta method is based on a real-world
constraint of utilizing existing instrumentation to collect
speed data. Devices available to local jurisdictions are
normally radar, VAS CAR , or switch-actuated timing devices.
The use of these instruments makes it literally impossible
to measure the speed of every vehicle under many traffic con-
ditions.
The systematic sampling technique best meets our requl-cc'
ments for a sampling method for determining the 85th per
centile speed, namely, that it be feasible, accurate, easy
to use, and easy to understand. The data for use in systematic
sampling is a speed sample the traffic specialist can collect
in a reasonable time interval using readily available instru
ments. The accuracy of systematic sampling in yielding an
85th percentile speed which closely approximates the 85th
percentile speed of the population is shown elsewhere in this
report. Systematic sampling is easy to use -- only simple
hand calculations are required. Finally, the method of
systematic sampling is easily understood -- it is, if any
method can make that claim, the natural ·.Nay to take a sample.
- 90 -
To take a systematic sample from a list it is necessary
to determine the number of units to be skipped. This number
is usually determined by the desired size of the resulting
sample. For example, if a sample of size ten is desired from
a list of one hundred speeds, a logical skip size would be
ten, i.e., after the first speed in the list is chosen,
every tenth speed thereafter is also chosen, the sample of
speeds being made up of all such selected speeds. Such a
sample will have ten speeds, as desired. The position in the
list of the first speed chosen can be determined arbitrarily
or with the use of a random number table, so long as that
position is in the first ten at the beginning of the list.
In this example, the first speed in the sample might be the
seventh speed in the list. Then the other speeds chosen
would be those occupying positions 17, 27, 37,. , 97 in
the list. Choosing the speeds in this way gives a "syste
matic" sample.
A gOOd discussion of systematic sampling is given in
Hansen, Hurwitz, and Madow, Sample Survey Methods and Theory,
(John Wiley & Sons, Inc.: New York, 1953) Vol. I, pp. 503
505. There it is pointed out that systematic sampling is a
simple and proven technique when periodicities do not exist
in the data or when no multiple of the interval between
samples is a multiple of the period of the data. In the data
- 91 -
collected in this study, no problems arose with SUGh pcrj0~'
ities.
To use systematic sampling i.s determi.nj.ng the 85th
percentile, it is first necessary to determine when the sarnpl(
speeds should be taken. It is recorrunended that this deci.~lon
be based on a plot of traffic volume versus time, a plot of
data easily obtained through the use of a traffic counter.
With this plot, the traffic specialist can determine whlc
time intervals correspond to the traffic volumes of inter~s~.
Such a plot is given in Figure 8-1. The traffic speci3l~
must use his own judgment to classify the traffic flow i:-ILC:
high, average, and low 'Jolume.
From each of the time intervals corresponding to the
desired volume of traffic, the traffic specialist mca~ures
speeds in the hour falling in the middle of the period or,
if the period is less than an hour long, for the entire
period. Data from each time interval with the same volume
are kept separately. The traffic specialist counts the
number of speeds measured during each intervaJ. He the
divides the number of speeds of each intervaJ either by IG(
or ny the smallest ;HImber of speeds in uny interval if
number is less than 100, und rounds the result of nis
division down to the next intE::>ger.
- 92 -
'l'his i"tpQer ;.5 thc· " kl
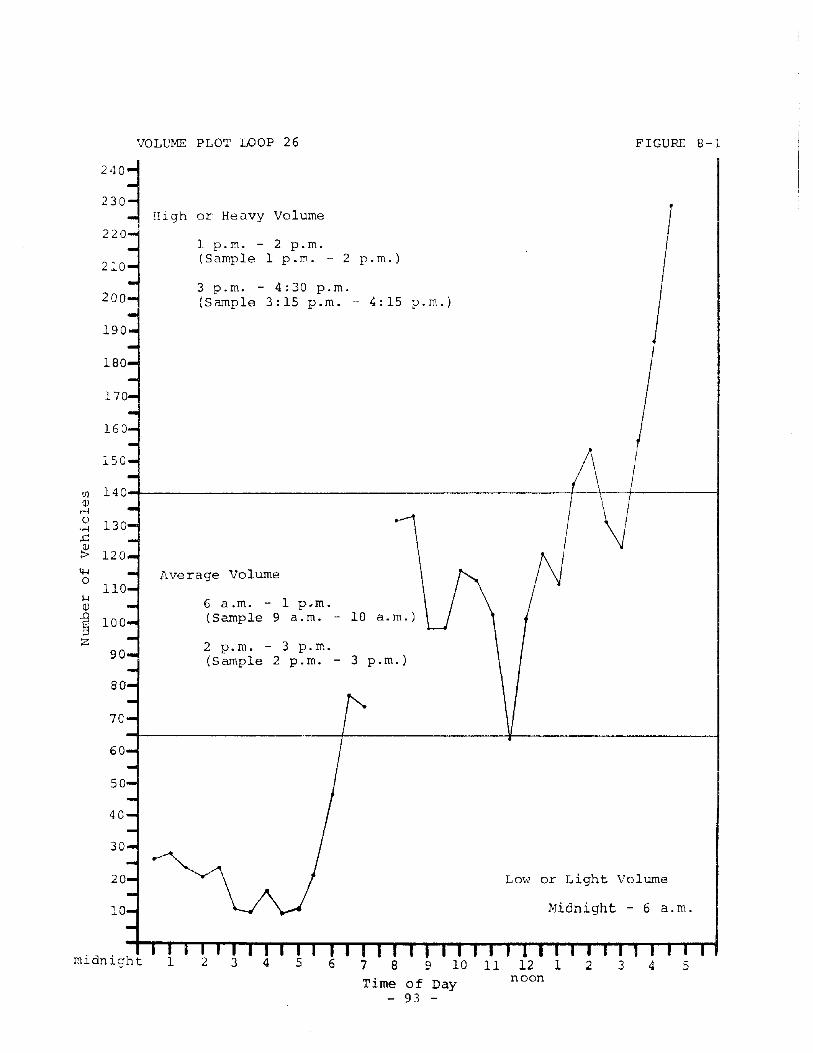
5432
FIGURE 8-1
Midnight - 6 a.m.
Low or Light Volume
11 12 1noon
7 8 9 10Time of Day
- 93 -
6543
2 p.m. - 3 p.m.(Sample 2 p.m. - 3 p.m.)
6 a.m. - 1 p.m.(Sample 9 a.m. - 10 a.m.)
1 p.m. - 2 p.m.(Sample 1 p.m. - 2 p.m.)
3 p.m. - 4:30 p.m.(Sample 3:15 p.m. - 4:15 p.m.)
Average Volume
90
VOLUME PLOT LOOP 26
:::~j High or Heavy VolumeI
220 .
50
70
60
150
200
210
30
40
Ul(lJ
..-1o
•.-1
.c& 1204-lol-i(lJ
§ 100z
31212" referred to above. \\lJth this skip sizi?, the' traffic
specialist takes a systematic sample from U1C speeds he has
collected and calculates the 85th percentile speed. Figure
3-2 and Figure 8-3 give tabulations of both sample and popu-
lation speeds and the resulting 85th percentile speeds.
Figure 8-2 is for the average volume part of Figure 8-1;
Figure 8-3 is for the high volume part of Figure 8-1.
In Figures 8-2 and 8-3 the difference between the 85th
percentile speed when calculated using systemJtic sdmplinq
and when calculated using the entire speed population (as
gathered with the corr~uter sensor system
dix B) differ by only one mile per hour.
..., • 1 ., •
QC;SC.Cl[)(:::O In
The Institute has applied the technique iust describeD
to data from loops in traffic zones with speed limits of 20,
40, and 55 mph, for high and avernge traffic volumes. In
In every c~se, the 85th percentile speed ci\lculated fr~nl
--:ystema-:,ic -aTnpli;~'c:; differed uy no more tr-:·l: -'t.'r
high and medium volumes the difference '1J(l:~ nc'I< mol"" L.llc:-1
one mile per hour.
In summary, the 85th percentile speeC:Ls a good lnCi-
~a~or of an appropriate speed limit, and the method of
systematic samplinG 2? presented above has been shown to
- 94 -
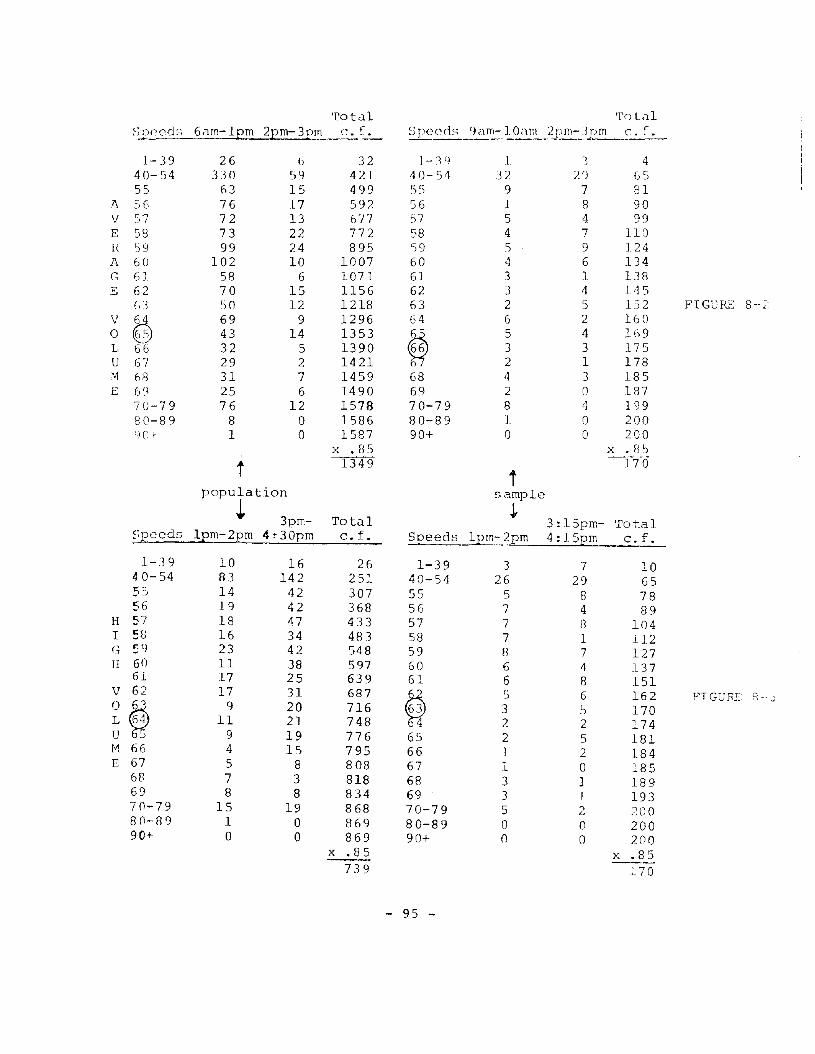
Total Total~;~ed:,> 6am-lpm 2pm-3pm~G- SP(~cds _~ ,1 n:.=-_!-O i1n..1-? p m-]1~:.:5...:-
1-39 26 6 32 ] -1 f) 1 -) 4}
40-54 330 ')9 421 40- 54 32 29 6555 63 15 499 S5 9 7 81
7\ 56 76 17 592 56 1 8 90V 57 72 13 677 57 5 4 99E 58 73 22 772 58 4 7 110E 59 99 24 895 S9 5 9 124A 60 102 10 1007 60 4 6 134G 6J 58 6 1071 61 3 1 138E 62 70 15 1156 62 3 4 145
63 50 12 1218 63 2 5 152 FIGURE 8 --
V 64 69 9 1296 64 6 2 1600 0 43 14 1353
~5 4 169
L 66 32 5 1390 3 3 175U 67 29 2 1421 2 1 178M 68 31 7 1459 68 4 3 185E 69 25 6 1490 69 2 0 187
70-79 76 12 1578 70-79 8 4 19980-89 8 0 1586 80-89 1 0 200') () + 1 0 1587 90+ 0 0 200
x .85 x .85
f 1349 170
fpopulation sample
~ 3pm- Total ~3:15pm- Total
Speeds Ipm-2pm 4~30pm c. f. Speeds Ipm-2pm 4: 15pm c. f.
1-39 10 16 26 1-39 3 7 1040- 54 83 142 251 40-54 26 29 6555 14 42 307 55 5 8 7856 19 42 368 56 7 4 89
II 57 18 47 433 57 7 8 104I 513 16 34 483 58 7 1 112G 59 23 42 548 59 8 7 127II 60 11 38 597 GO 6 4 137
61 17 25 639 61 6 8 151V 62 17 31 687
~5 6 162 FIGURE 8 -'. ..)
0 @ 9 20 716 3 5 170L 11 21 748 2 2 174U 9 19 776 65 2 5 181M 66 4 15 795 66 1 2 184E 67 5 8 808 67 1 0 185
68 7 3 818 68 3 1 18969 8 8 834 69 3 1 19370-79 15 19 868 70-79 5 2 20080-89 1 0 869 80-89 0 0 20090+ 0 0 869 90+ 0 0 200
x .85 x .85739 170
- 95 -
a s tatis tically sound and accurate method for c]etcLc, j '1 t, ';
the 85th percentile speed.
8.3 General Comments
Several addi tional points included in the recom.rnendc(,
method must be discussed.
No specific equipment is recommended for measuring
speeds, however, it is critical that the measurements be
taken in a manner that is not obvious to the drivers on the
roadway. It should be noted that the survey results of this
study indicated that nearly all jurisdictions have access
to radar units. It was also shown that most jurisdictions
had traffic counters, and, of course, if in any case such
counters are not available, a manual vehicle count is
possible.
It is recommended that in most cases speeds be measurec.
during clear, dry weather and average volume condition8.
Generally the traffic specialist will want to set a spr20
limit to deal with the driving situation most conducive to
the faster speeds that could be expected on the road. Most
drivers will automatically be slowed down by poor weather
conditions and by increasing traffic volume. As volume
inc"::·'.~ases on a road, the driver tends to flow with the
traffic stream rather than obey the speed limit. It is, of
- 96 -
course, stated in the educational manual that predominant
weather conditions and specific problem volumes may be used
when appropriate.
After the 85th percentile speed has been computed, the
speed limit is determined by rounding to the next higher
S-mph. The purpose of this is to include as many vehicle
speeds as possible under the speed limit consistent with
the discussion in section 6.0 of risk.
In its application the method put forth in the imple
mentation package is not to be viewed as rigid. Much of
the substance of the programed unit consists of common
sense and good judgment. There are no hard, fast rules for
such activities as selecting a representative measurement
site; however, the purpose of the text is to alert the
traffic specialist to the factors which should be taken into
consideration. Thus, the entire method should be employed
with careful judgment and good sense. The speed limit
resulting from the application of this method should be
subject to evaluation in terms of the traffic situation with
which the limit was to deal. If, for example, the new limit
creates an entirely new traffic speed pattern or increases
the accident picture, additional studies must be conducted
and a more appropriate speed limit reached. It must be
- 97 -
clearly understood that traffic behavior is dynamic, not
static, and that a new speed limit may change traffic
patterns enough to require additional changes in the limi
In any case, the speed limit must meet the need created
by the individual traffic situation.
- 98 -
9.0 COMMENTS ON SPEED LIMITS AND SPEED CON'l'ROL
Prior sections of this report have presented recommenda
tions and conclusions that the authors believe are supported
by data, the analyses, and the literature. In this chapter
certain concepts and recommendations are discussed which the
authors deem appropriate for consideration but are not supported
by sufficient emperical data to warrant advocacy as proven.
In essence such commentary represents the authors' insight
into the problems of speed limits and speed control.
9.1 Special Speed Limits for Trucks and other Vehicles
Particular interest was expressed by the Sponsor in the
rationale for separate maximum speed limits for trucks and
other vehicles.
The survey conducted of various jurisdictions and reported
in section 3.0 contained questions focused on this issue. In
general jurisdictions with the same maximum limit for all
vehicles responded that this was done to avoid impeding the
flow of traffic. Those jurisdictions with lower maximum
speed limits for trucks, buses etc., responded that this was
done in the interests of safety. No jurisdiction gave any
indication that any empirical data were available to support
any position.
Conceptually, an argument can be made against a separate
speed limit on the grounds that it would produce a separate
- 99 -
s~eed distribution which mlght resLlt in the low end of the
distribution heavily represented in the high risk area of the
overall traffic distribution. In the same sense it miqht be
said that the lower limit would produce platooning on two
lane highways which would impede flow and generate passing
activity which in turn might increase the potential for acci
dents.
An argument can be made for a lower limit if it can be
established that trucks and other like vehicles can not travel
safely at or near normal maximum limits. This is in effect
stating that the risk curve for trucks rises more sharply for
speeds above a mean speed than does the curve for cars and like
vehicles.
The data collected in this study do not provide an answer
to these issues. Examination of truck speeds at those points
where free flow was possible does not indicate a significant
difference between truck speeds and that of other vehicles.
Lower speeds are noted on grades. It should be noted
that speed limits would have little impact on such behavior as
it stems from vehicle limitations not driver choice.
One is led to suspect that concern over maximum limits for trL
buses, etc., may be a misallocation of "worry". Our data, and oV,c
studies (159, 165, ;1-90) indicate the slow moving vehicle to
be of high risk. It would appear more satisfactory to con~;jr3er
- 100 -
the problem of the slow moving truck. Pragmatically road
geometry may provide the basic speed control mechanisms. Thus,
some response is required to identify the slow moving truck
on grades. New York and some eastern states have required
vehicles traveling on limited access roads at speeds lower
than 25 mph below the speed limit to flash both rear blinkers.
It would seem this simple practice could be widely implemented
with probable risk reduction.
At the same time it would appear relatively simple to
gather basic data on speed behavior of trucks on highways
(1) with the same maximum limit (2) with different maximum
limits for trucks and cars. The distribution of speeds of
trucks and all traffic should be compared for bot.h sets of
highways.
If it were apparent that the result of a lower maximum
limit were to cause a significant number of trucks to travel
at a lower speed so that the overall distribution of traffic
was skewed or the standard deviation significantly larger,
one would conclude that the lower limit was inappropriate.
It is perhaps more probable that the distribution of
truck speeds would be more narrow and fall within the minimum
risk range of general traffic. It is also possible that one
would find that the lower maximum limit did not fall at the
actual 85th percentile of truck speeds.
- 101 -
In absence of sound emperical data we would neither
support nor deny the reasonability of lower limits for truck~
and buses but would require those seeking to impose a lower
limit to preseIlt clear evidence that risk management is serve
by such action. Imposition of the limit without such persuasl~
evidence can only be regarded as an inappropriate act that wjl
cause misallocation of Traffic law system resources.
9.2 Minimum and Advisory Speed Limits
The establishment of minimum and advisory speed limits
was not included within the scope of the study. fIowever, it
was impossible not to review the literature on such limits or
to consider them in the context of the theoretical hierarchy
of speed control. Adequate data collection elements were not
included within the research design to allow the formulation
of supportable emperical conclusions concerning such limits.
Certain insights are suggested by both the literature
and theoretical considerations. First, if one accepts the
concept that it is desirable to have as many vehicles as posslr
travel at or near the speed which is associated with the
minimum risk, it would appear logical to set advisory speed
limits at that value. The best evidence available suggests
that the minimum risk value is the mean speed of traffic.
Accordingly, it would seem that advisory speed limits should
be established at the mean speed of traffic.
- 102 -
Secondly, the litc:rature and the HTI-IRPS study clearly
indicate the danger created by slow moving vehicles. In fact
there is some evidence to indicate such vehicles constitute
as much or more risk than do those traveling faster than the
maxim~~ speed limit. Examination of the risk curves indicate
that the risk starts to rise at about one standard deviation
below the mean speed and rises sharply at two standard devia
tions below mean speed. It would seem logical to place
minimum speed limits at the value associated with two standard
deviations below the mean speed.
9.3 Enforcement Tolerance
The practice of allowing some range of speeds above the
posted speed limit before enforcement action is initiated
is well known in law enforcement circles and equally well
perceived by most drivers.
Unfortunately, the precise nature of the reasoning which
governs the formulation of police on tolerances is not well
established or widely known. Attempts to encourage law en
forcement policy makers to write or speak on the subject have
not met with much success. The precise tolerance allowed in
a particular jurisdiction is a function of many factors not
the least being the mood of the particular enforcement
officer observing the violation.
- 103 -
It appears quit\~ clear that-the naSJ,C concept :lnij"Ct
the decision not to make an arrest in every possible instan
when a speed limit is exceeded is sound. The problem lies",-~:
deve.Loping a general rule that can be consistently and widej
applied.
If once accepts the fact that enforcement ro Durces arr
quite scarce and should be selectively assigned against
highest risk some of the data takes on particular significano
Examination of the risk curves indicates that while the risk
starts to increase at approximately t.he 85th percentile (wh
is approximately one standard deviation from the mean speed I
increases even more sharply at blO standard deviations from i:h
mean speed. Thus, drivers traveling at a speed 'two standard
deviations from the mean speed are a clear risk and should b
subject to enforcement response. In the cases examined the
standard deviation had a value of about 7 mph. Thus, a typical
distribution would have a mean speed of about 58 mph, a speec
limi t at the 85th percentile of 65 mph, and the second stand:n
deviation would fall at about 72. The risk curves would
suggest 72 mph as a resonable point to ini tiate enforcern(~nt
action.
What is of perhaps more interest is the fact that the us
of the two standard deviation concept gives a rule that can
be applied as traffic flow behavior on a particular roadway
- 104 -
changes. Traffic at 8 am or ~ pm will have a different mean
speed than will traffic at 3 am. Examination of mean speeds
might result in the decision to enforce at or close to the
posted limit during times when the mean speed dropped and to
allow a much wider tolerance during low volume hours when
mean speeds are higher.
The data are not sufficient to allow a precise conclusion
that the tolerance should be established at the value associa
ted with two standard deviations from mean speed. What should
be understood is that for a particular highway the risk does
vary as a function of mean speed. A single tolerance does
not satisfy the concept of risk management and selective
assignment of scarce law enforcement resources.
- 105 -
9. 4 Meas ur ing the~_ff~~t:i:.2i:.,=-nc:.::o:~__~~ f __§..2..~t:~~_~imi ts
A great deal has been written and said about the impact
of speed limits but almost no empirical data exists that can
be used to quantitatively establish the precise effect of a
speed limit. In the absence of such knowledge it becomes
equally impossible to state quantitatively a method to measure
the effectiveness of a speed limit.
If one thinks of the objective of a speea limit 28 reau-
lating traffic in the risk management sense to achieve the
objectives of the traffic law system and the SRT system, tKC-
measures of effectiveness are suggested. One, has the flow
rate increased? Two, has the accident rate increased'?
The measurement of flow if thought of in terms of through
put may be evaluated in terms of increase in average or mean
speed. Readings of speed distributions before and after alter-
ation or establishment of the speed limit may be expected to
give some insight.
much more complex.
However, the issue of accident reduction lS
Accidents are infrequent events no matter
how numerous they may seem. Further, the factors involved in
accident causation are numerous and many variables are at play
that cannot be influenced by a speed limit. The accident experl-
ence might actually rise following a change to precisely the
best speed limit due to the action of intervening varlable~:':.
Thus, dependency upon accidents for an evaluation of the
effectiveness of a speed limit on a particular highway is at
- 106 -
best a lengthy process of uncertain reliability.
Obviously, some interinl measure must be identified. The
work of Taylor and the Tennessee Department of Highways is
most promising in this regard. Consideration of the shape of
the resultant distribution and accompanying parameters holds
perhaps the best clue for a measure of effectiveness.
Conceptually, it would be ideal if all vehicles traveled
at or near the same speed. This would minimize the potential
for conflict of traffic traveling in the same direction. This
concept is limited in the real world by differences in the
capabilities of vehicles and drivers as well as the speed dif
ferentials that are created by entering and leaving the highway.
For a given highway there exists some set of vehicles at
any instant of time that must travel at a speed lower than the
mean speed of traffic simply because of vehicle condition or
driver destination. Thus every distribution of speeds will have
a definite set of vehicles to the left of the mean. The extent
of the distribution to the right of the mean is more difficult
to identify. The decision to travel faster than the average
speed is a function of individual driver judgment and includes a
mix of risk perception, time pressure/ individual driving confi
dence, vehicle confidence, familiarity with highway, etc. Such
decision-making process may be more susceptible to influence by
speed limits but the extent, mode or manner is not now clear.
It would seem generally desirable to reduce the nw~er of
- 107 -
drivers traveling at ~;oceds eli. f"fcr(~nt than the mean spfc;ccL.
Thus, a speed limit which produced a distribution that was
more nearly normal with a smaller standard deviation would
seem morc desireable or more effective. Unfortunately,
data are not available to clearly support this position no
matter how logical we may perceive it.
We believe tha.t considerable effort should be made by
the leaders in the field of Traffic Safety to encourage the
implementation of the 85th percentile concept. Such imple
mentation should be accompanied by post-implementation evalu
ation to determine the change in the parameters of the speed
distributions. Such changes should be correlated against
throughput and accident experience over a lengthy period of
time with every effort made to identify the impact of inter
vening variables. Accident experience may be regarded as a
poor indicator for a single highway, but should be useful
for evaluation over a broad highway set over an extended period
of time. Local jurisdictions should be required to collect
post-implementation data at periodic intervals in a common
manner to allow cross-correlative evaluation.
- 108 -
9.5 Recommendations for further Research:
It is a characteristic of every research report that it
concludes with a recommendation for further research which is
needed to solve the question the project was originally funded
to answer. It would indeed be difficult to fly in the face of
tradition and hope to maintain any status as a researcher.
However, we are constrained to question the wisdom or
feasibility of conducting relatively small scale research
projects on the subject of speed limits or speed control. The
research to date has pointed quite conclusively to a method that
can be broadly implemented and may be expected to have desirable
results. It seems pointless to engage in further research
unless it can clearly advance the state of the art.
The "state of the Art" stops at the point one asks the
question "what is the effect of a speed limit". Such a question
can not be answered by a small scale research project. One must
either alter the speed limits on a fantastically large set of
highways while measuring the effects or settle for a smaller
set of highways and engage in continuous variation of the speed
limit. The first prospect staggers the imagination when one
considers the real world problems inherent in implementation.
The second prospect which would involve instrumenting a
set of representative highways and measuring the response to
variable speed limits is not an impossibility but the cost
- 109 -
f3ctors associated
certainly be wi thin tJle milliorl dc)11ar :r'ange.
One would question the value of such an expenditure
Vlirl-JiCl"l at best could, })(? (~xpec:t:.(~d t() adcl anly sliglltl~l greater
precision to the 85th percentile method. If the cost could
be justified it would likely to be terms of increased flow
and in such case would be relevant to only a minimal set of
the highway system, primarily urban expressways or feeder
highways where maximizing volume is a critical issue.
The issue can probably be better met in t'C':.:rms of the
need for a general information system for the nations highwayc.
The use and value of process control computer systems has been
adequately demonstrated in the private sector: Initial efforts
in the utilization of computer systems for signalization have bec~
successful but have represented relatively trivial demands on
the inherent capability of computer technology.
It would be far more logical to think in terms of develo;:
ment of a comprehensive computer based information system for
a highway set. Such a system would collect basic data, evalua.
it, provide information to highway users, and those respons i i·
for highway safety, traffic control etc. Such a system waul
logically include internal measures of effectiveness that we
evaluate driver respcmse to a range of stimuli merely one of
which would be speed limits.
- 110 -
The cost of such a system would not greatly exceed that
required for evaluation of a single variable such as speed
limits and holds considerable prom.ise for overall traffic
safety management.
It is also believed that cost-oriented methodologies
offer promise as a longer range approach to determining opti
mal speed limits. Properly directed, this techniques could
place a large complement of highly developed and widely applied
analytical tools in the hands of highway analysts, planners,
and operational personnel. These tools could be of great
value not only to the establishmen"t of speed limits, but could
also be applied to a host of other highway problems. Perhaps
even more importantly, the approach could provide a means for
determining SRT priorities and of allocating resources among
them. Certainly, such a model would be most useful in struc
turing and designing a highway information system such as that
described above. A considerable research effort will be
required, however, to develop the cost-oriented approach to the
point of practical utility.
- III -

1. Scott-Montague, ,John, "Automobile Legislation: ACr i ticism and Review," North American Revie'N, Vol.179, No. 573, pp. 168-177, August 1904.
2. "Regalation of Motor Cars," Quarterly Review, Vol. 205,No. 409, pp. 511-530, October 1906.
3. "Photographic Methods of Determininq Speed of Automobiles,"Scientific American, Vol. B3, p. 262, October 27, 1900.
4. Ladd, Walter D., Organizing for Traffic SafetyCommunity, Charles C. Thomas, Publisher:pp. 10, 63, 132-133, 1959.
in YourSpringfield,
5. "The Electric Car," Atlantic Monthly, Vol. 89, No. 536,p. 802, June 1902.
6. Labatut, Jean and Wheaton J. Lane, Highways in Our NationalLife: A Symposium, Princeton University Press:Princeton, p. 95, 1950.
7. "The Road and the Automobile," 'J'he Outlook, Vol. 71, :~o.
7, pp. 445-446, June 14, 1902.
8. "Time to Stop," The Outlook, Vol. 91, p. 852, April 17, 1909.
9. Underwood, Henry, "Speed Mania and How to Cure It," Harper'sWeekly, Vol. 51, No. 2623, Pt. I, p. 470, ~arch 30, 1907.
10. "The Lost Liberty of the Road," Living Age, Vol. 258, pp.249-252, July 1908.
11. "Regulating Speed of Automobiles in the District of Columbia,Etc." 59th Congress, 1st Session, Senate, Report No.2386, pp. 2-3, April 9, 1906.
12. "Automobile Regulation," rrhe Outlook, Vol. 84, pp. 903-904,December 15, 1906.
13. Baldwin, H.M., "Speed Problem," Country Life, Vol. 19, p.200, June 1909.
14. Humphrey, Seth K., "Automobile Selfishness," AtlanticMonthly, Vol. 102, pp. 679-682, November 1968.
15. Norris, C.O., "The Cause of Automobile Accidents," CountryLife, Vol. IS, No.4, p. 375, February 1909.
- 113 - Preceding page blank
16.
17.
87, Nc) .. 19, "[-\:') '.
"A Novc: 1 Speed I ndlcat.or f)c Automoh j ! cs ; ,. Sci-en t iAme:r::.ican, Vol. 41, No. 19, p. 313, Novemh:r S,
LC
19'04.
18. Chatburn, George H., lligh',vaY'3 and Hj9hwaY~~L~1]2.:Sp_~E.ta~j--:)!1,
Thomas Y. Crowell Co.:' New York, pp 362-363, 192J.
,. r-, -) COl ~i
"...L ..
20. McClintock, Miller, Street Traffic Control, McGraw-Hi]Book CO.: J'.Jew Y~)rk, -~'P -.-86 -94 , j.-;r25-~
21. B.ichards, l\arl 1'1., 'DC':3lgn 0,' Aut.cO':nc); 1,' andProceeding~;of t.he Uhi dl(Jhway E1952, Engi J:ieer~l.n~J-F;:xp:~-:L·imE;I:lt E;-t:,:1',-."'.-()·.n···- ..· ... -·--,c-'"--·c-----..-~-. ",
Ohio State University, Vol. 21 r rio. 4, pp1952.
22. "Speed Control to S104, p. 17, March
Aut.o Dca'=hs, II
1930.Litercll (~~::3- t. r
23. "Speed Curb: Reck less Dri vers in :ic':.1 York }'orc(~cJ LaGovernors on Their Cars, II Liter(1~y Di'jcst, 'Jol. 122,p. 12, October 24, 1936.
24. Glazier, L. Gordon" "Instrument for Detecting Violationsof the Speed Laws," Scientif ic Amer_ican, Vol. 52, No.11, p. 217, March 12, 1910.
25. Rollins, Montgomery, "Sane Iv1otoring -- or Insane?"Outlook, Vol. 92, pp. 275-282, May 29, 1909.
T~n(;
26. Knight, A.W., Iffrh(~
Weekly, Vol.I .. awmakc r and the Au tomobile ," lIarpcl 's
:>4, :-Jo. 2768, p. 38, ,JanuAry 8, I9l0.
19JO.27. Ommen, l\lfred E.,
44, No. 17,"The Right of
Section 2, pp.the Road I 11 Coll ier 's! \'11,13, ,JdnuzJXy·lS,
28. "Better l\ntomob i_lc la\'Ii~'5, II Country Llfc p \7oJ..p. 4 (,7, Apr i 1 15, 191-1.
29 . :c 11 swa th, G~'orge L., "'I'h'c' Au tomab i Ie and the !.;d'';, "
Enaland. ]\~aqazi,-ne, Vol. 42,1\)0.1, pp. 49--51,
30. Johnston, Charl(~s, "The Mot.orist and the Lav,i," BarWeekly, Vol. 54, Pt. 3, pp. 12-13, September
- 114 -
31. Kirby, Edwin, "Let's Be ReZllistic About Speed Limits,"Traffic Safety, Vol. 62, pp. 8-10, June 1963.
32. Bruce, A. G., "'rhe Effect of Increased Speed of Vehicleson the Design of Highways," Public Roads, Vol. 10,p. 11, March 1929.
33. "A 'Careful and Prudent Speed' The New Limit on MichiganHighways," The American City, Vol. 37, pp. 518-519,October 1927.
34. Dayton, Thaddeus S., "The Motor is t and the Law," ~Iarper ' sWeekly, Vol. 56, p. 12, March 2, 1912.
35. Highway Research Board, Bibliogr aP0Y : ~trcet and High\vaySafety.
36. Jenkyns, Edgar, "A Little Law for the ]'-totorist," ':1'he Outing,Vol. 59, No.4, pp. 479-489, January 1912.
37. "Motoring Rules and Regulations in t~he :Jational Parks,"The Outing, Vol. 72, No.5, pp. 334-335, August 1918.
38. "Two Hational Necess i ties: Uniform )\1otor rrruck Laws andUniform Hotor Truck Roads," The Independent, Vol. 93,p. 282, February 16, 1918.
39. ViThiting, B.S., "Regulating the Driver," Harper's Weekly,Vol. 57, No. 2925, p. 28, January 11, 1913.
40. "The Speed Factor in Collisions," Scientific American,Vol. 109, p. 138, August 23, 1913.
41. "Haste Makes Waste," 'rhe Independent, Vol. 94, p. 216,May 4, 1918.
42. "Auto-Killing Now at the Rate of Two an Hour," LiteraryDigest, Vol. 67, No.6, p. 80, I'Jovember 6,1920.
43. "Trying to Squelch the Speed Maniac in New York," LiteraryDigest, Vol. 68, No.8, pp. 49-52, February 19, 1921.
44. "Shall We Do Away with the Speed Limit for Motorists?"Literary Digest, Vol. 95, pp. 62-66, December 3,1927.
45. "Traffic Signals Set for 20 Miles an Hour on ProgressivePlan in Detroit," The American City, Vol. 37, p. 639,November 1927.
46. Hoover, Herbert, Secretary of Commerce, First ;~ational
Conference on Street and Highway Safety, WashingtonD.C., p. 18, December 15-16. 1924.
- lIS -
47.i\JLl(; ric all (~i t
48. :'1cClintock, )~jil1 r, "~,pceu C~)[itro:l ithout a 'Prima Facie:'Rulc;," The Z\mc:ricanCity, Vol. 44, :Jo. 7, pp. 137···: ') c ]. ; ~ n---;j--:::-y.-;:--'Cj"""'·-l-1--"--,,.---I. ,J U t \. ,--I. ~ \ (1. ....... ,j L J ..J -'-- '"
49. "::~\y Standard Speed lJ<.-l.Vl
Vol. 43, no. 1, p.Prol.Joscd," The i\merican City,8.3, Ju J. y 19 30 .------~-'----
Taylor, Clarence p~, Trafflc Of~ficerr; ~'rcinj_
iJa t iOT"'"tc:ll S(J.ff:? -,,··":i ca.cf()! PF~. (') ~-O
51. II Mo_rc: SI)(?ed,1I 2~Jat.l_C)I1) \/01. --,_31, ~'·JC). ~';402t pr)~ 287'--288(September- 1 7 ;-'"19 30.
52. O'Shea, PeterArnerican .Review, Vo].
11'"L~ 1
r-) "~l ,-'"L .)u ,
cdDp.
IJCl ;..1 S 1 il ;rLl C~ I'-J () r tIl') G1- 56 () r -··:0C)i.Jemb(?~r
53. 'reale, Edwin, '" Heasonablc ;:,pet~a' :--;i qn~'; Rc·d :1('" Ilighi-layAccidents," The lunerican City, Vol. 48, p. 69,October 1933-.--- ------
54. Howe, Vaslet L., Director, Phoc1e Island Hi.,;h'~la~~,_~Iaff!:.::-:......Survey, pp. 22-32, 193~-'----""---"--'-"-
55. Tazewell, L.W., A Traffic Survey of the CityVirginia, 193~-1936, pp. 79-80, 1936.
,,-...+:'01.. Norfolk,
l\cview ofS6. Newton, G.O., "30,Reviews, Vol.
40,90,
50p.
I'1iles Per Hour," .--------_.,---4, December 1934.
c:, 7.... , . "Speed l\es tr iction jl.1easures P.ecommc:ndf"d,"City, Vol. 53, p. 97, ,June 1938.
The ;\mcrL can
58. Mattson, J.O.,"The Private Sector in Traffic ,-;afety,"Traffic Quarterly, Vol. 21, p. 4, 1967.
') 9 . Hoffmall, PaLll G8' "rrhc'}City, Vol. 52, p,.
'1'raf f :i.e:: !;nqinec r ,"
109, l1arch 1937.
60. "Are Traffic Accidents CausedCitz, Vol. 52, No.6, p.
LJ~! Sl)12ed? (i 1"'hc= !\.rnerican12 9, J UTi e 1. .~ '3 7 OJ ~.
61. McClintock, Miller, "Speed," Review of 1~evi8':I:::; (origiin Public Safet~y), Vol. 96, No.1, pp. 49-'r:;O, ,July1937.
62. "\-Jhat Do You Pay for ~;peed}"
October 9, 1937.Colli2r's! Vol. / it .1
-- 116 -
63. 1{auch, Walter E., "The Driver is Human," Commonweal, Vol.30 , No.7, P P • 1 7 7- 1 7 8 , ,June 9, 19 3 9 •
64. Seburn, F.J., "Lower Speed Limit at Night," The AmericanCity, Vol. 54, No.6, p. 163, June 1939.
65. Stearns, Myron M., "Warning -- Slow Down~" Collier's,Vol. 103, pp. 19, 45-46, May 6, 1939.
66. Eaton, Ralph, "Providence Goes III Days without a Fatality,"The American City, Vol. 53, p. 81, July 1938.
67. Hoffman, Paul G., Seven Roads to Safety, Harper and Brothers:New York, pp. 51-52, 1939.
68. "Safe Speed Signs Make Ohio Curves," The American City,Vol. 54, p. 13, April 13, 1939.
69. Moriarty, John B., "Hunicipal Traffic Problems on StateRoutes in Indiana," The American Citx., Vol. 55, No.9, pp. 103-105, September 1939.
70. Tilden, C.J., "Vehicle Speeds on Connecticut Highways,Public Roads, Vol. 18, pp. 75-77, 1937-1938.
71. Eames, Edward H., "Signal Discourages Speed at Crossroads,"The American City, Vol. 54, pp. 95-97, August 1939.
72. "No Speed Traps," The American Ci ty, Vol. 55, No. 10, p. 89,October 1940.
73. Johnson, Emory R., Transportation Facilities,Policies, D. Appleton-Century Co.; Inc.:p. 229, 1947.
Services, andNew York,
74. Baerwald, John E., "Current Characteristics of Rural MotorVehicle Speeds," Highway Research Board, ProceedingsThirty-fourth Annual Meeting, National Research CouncilPublication 362, Vol. 34, p~. 473-482, 1955.
75. Kreml, P.M., "Traffic Enforcement in Wartime," The AmericanCity, Vol. 57, No.7, p. 73, July 1942.
76. "Fitting Traffic Control to Wartime," The American Cit'l,Vol. 58, pp. 79-83, May 1943.
77. Matson, T.M., W.S. Smith, and F.W. Hurd, Traffic Engineering,McGraw-Hill Book Co.: New York, 1955.
78. "25-Mile Speed Limit for Night Driving," The American City,Vol. 58, No.7, p. 77, July 1943.
- 117 -
79.
80.
II'"V"Jh a t Do S1.)8 ed IJ l [~~~L .~::"5 f·IIc"
<'~ o. 11 1 p.. 1. 2 1
','Tard, I\cnncth lJ", !, i~adar
and__ Rc?vicw" Vol, 14,
;.h c, ;\lnc:r -; C l~ln. C~ it'-/, \7 C) 1-.. 0 -.!
; 9 'j 0 "
('cd Detection," Traffic Di9C?stNo .. 9" p. :3, September 1966.-
81. Griffin, Garnet M.,Traffic Digest~
November 1955.
"Detro:i. t I Speed--~'JJtchcs' Tr·:lf f:i.e y "
aE~c:J. Rf::'y i(~~-.!... 'lcl1.3 , No" 11 .' PI'. L2 - J G J
82. "New Machine Cat.che~3 SpeedcJ::', II TrafLLc :~
No.2, p. 23, AU9ust 196
t3 (, 11 a v i () r -83. MacDonald, Thomas L, I "Hi9hway ~;afc~ --- i)Y'J.V"
:Kc~y tC) SafE?' Tli~T11\·'Ja'/ Des~ qn J'!t r:)U;JTJ_C~ ::~.()ac'.t , '7()1 ..NC) .. 7, l~P.. 13 4 -.,~ 13 .r.:. r .M:=t r c~":1 194 q -------.-,- ~-.----
.-,~ rL) r
84. American Automobi1(~, .I"s:30ci"Li:::m ,. ui. '.'lob:Jr La'.v",19 53 . ...---.'-..- ..--.----.....----...--.--------
85. Johnston, J. :edward ":-;]0\\7 'I'l:afLic LdVJS Wast,· [';l."t Roae! ,Nation's Business, Vol. 44, pp. 32-33, 66-67, April1956 (Also foun6 in Traffic Engineerinq, Vol. 27, No.10, pp. 447-45 , LTuly 1956 .. ) ..
86. Lorentzen, Kay, "Speed Traps and Safety f" ~~ra~!ic Engineerj~,~_,
pp. 167-168, January 1956.
87. L~ational Committ:ee on Uniform TraffLc Laws and Ordinance,;,Uniform Vehicle Code, pp. 127-130, 1963.
88. "The Speed Problem," 'fraf f ic Safet.y, \/0 L 51, :'~o. 2, pp.14-15, August 19~)7. --------
89. "News Briefs," Traffic Digest and Hevie\:i, Vol.p. 3, May 196 5-~-·--------·----_·,·-- -_..
13, ~.Jo. C..J ,
90. Webs ter, Lee A., and vvayne 'I. Gruen f [\ Summary 0 f thi..c,
Vehicular Speed Eegu1ation Research Projec:t! ---~jeFl'ic1l1aJ'
Speed Requlatlcm Research piojecT~Dep-t:-·r:~TvilEnginecjng, University of Illinois: Urbana, June 1966.
91. C1C':'veland, Dona1d L., "SpC':'ed and Speed Control,." TrafficControl and Roadway Elements Their Relationshij:;---to Highway Sa~!,tY.. / Revisec~, p. 1 ~- 1970.
92. National Committ:ee on Uniform Traffic '.Jd\vS and Urdi;lan~:c.
Uniform Vehicle Code: Rules of the Road WItt}S ta tutory )~2:.1j2~2~~a~:.Lon~:. Pi? 42 7'::' 4FT,-- ], () G-(:----
- 118 -
93. H.eeder, Eobert H., "A Report: Major Changes made inUnif0rm Vehicle Code::, " Traff.ic Digest and ;).cvic\V,Vol. 16, No.9, p. 5, ~eptember 1968.
94. Parry, Meyer H., Aggression on the Road, TavistockPublications: London, pp. 9-10, 1968.
95. "City Motorists Ignore Posted Speed Limits, Drive FasterSafely," Science Digest, Vol. 27, No.3, p. 19,March 1950. .
96. Baerwald, lJohn E. ,. "Speed as a Ca.use of Traff ic Accidents,"October 1960.
97. Mohr, Harvey W., "Results of Speed Zoning on Eural High\-'lays," Highway Research Board, Proceedings Thirtythird Annual Meeting, National ResearchCouncilPublication 324, Vol. 33, pp. 429-446, 1954.
98. City of Nashville Traffic Commission, "Effectiveness ofSpeed Limit Signs," Nashville, Tennessee, 1956.
99. Avery, Eugene V., "Effect of Raising Speed Limits on UrbanArterial S·treets," Highway Research Board Bulletin244: Effects of Traffic Control Devices, NationalResearch Council Publication 730, pp. 88-97, 1960.
100. Wenger, Deane H., "Effects of Revising Urban Speed Limits,"Dept. of Public Works, Bureau of Traffic Control, Cityof St. Paul, Minnesota, June 1960.
101. Coleman, Robert R., "The Effect of Speed Limit Signs,"Traffic Engineering, Vol. 27, No.4, pp. 176-177,185-186, January 1957.
102. Jackman, William cr., "Driver Obedience to Stop and SlowSigns," Highway Research Board Bullctin_161: Investigating and Forecasting Traffic Accidents, NationalResearch Council Publication 521, pp. 9-17, 1957.
103. Report of Hayor's Traffic Advisory Committee as Deliveredto the Honorable Rolland B. Marvin, Mayor of Syracuse,pp. 28-29, January 31, 1935.
104. Elmburg, Curt M. and Harold L. Hichael, "Effect of SpeedLimit Signs on Speed on Suburban Arterial Streets,"Reprint from Bulletin 303, Highway Research Board,July 1962.
105. "News Briefs," Traffic Di9.t?st and Review, Vol. 11, No.7,p. 3, July 1963.
- 119 -

106. 11tJews B.ricfs, 'I !=~~_r,:lf'~~i.,~~ r\~
I}. 13,1 ..
107. Keese, Charles .~T .. aflct Rct)c'rt H. SChLcidcr f "(~()1~~l~c'I.-]t·i()rl
of Design and Operational Characteris~ics of Expross\Vays in Texas" '1 t{i(Jhway Re3carch Board Bullet-in 170;'Traff ic Behavior --as- Re1ated to Several l;iqh~:;a\;-Dt?s-'.Gr;
_____ . .• __..• .."'-.. ",. .. J_.
Features, Na tJ_onal Research Counci 1 :~Lb 1.i ca t.; c·n 530!pp. 1- 23, 19 ':> 7.
,::1'/5 :sion of Hi1966.
Wingerd, [Jorman C. I ~\:inirnuiTI.__••••-, _••_-_ ••__._--",-_ •.•. _ •••_ .•.•---_.. _<
Sta.tc of Call_fi~rn
i,,~) 0 •
109. Oga~"va, T., B.S ..Fj.s}-lcr, ci11'--J ~i.C:,~ ()ppe~':l{_lrl(j(~r, ~?r.-~:~~~
Behavior Study _..- I:;£luence or S;;e d ',ir:-'J_Ls on SpotS?eed Charact_ccistlcs In a' Serles--c7tC-cntigu-ous-1F_,r-ciJ(2nd Url)ar~~>.r~~~3 '. \reh.i.::u].3~:-··-~~;)ee-c1~l~c~S1L1.1c)tI·on I~e-s ar{=-h-~
Project, Dept. Civil 211ginE~er Drl verslt~J 0Illinois, June 1963.
110. Bezkorovainy, Georgy, Effects of Adviaory Speed ~imits ~t
H0 r i Z 0 n tal Cu 1''1e ,3 -01--;1\."o-L~lnE::- I~ur-=-a-fITi i] hl.Vi-iY~i, VeDl-Ci:llSpeed rzeCjuta.tion Researcn Project-;- :Jel:)t~--l~_'/~1 If)(:'
ing, Univec::it:l of Illinois, August 1965.
111. Bezkorovainy, Georgy and Chih-Cheng K~, The InfJuence ofHorizontal Cur've Advisory Speed Lim-its em Spot-Speeds r
Veh l· C u 1arC' ') -,:-,:, (" ]:;> -, 9 u 1 ':d- l' 0 n-- TO C> sea r ~ ]-, ---=-.1:),::-:':'-J'-c':-:::-t - Dp n t -- -.----...- Io-:Jt l __ ~=_.J.. .... t::. Lt.,- J,. l\.C .... .- \.. .. 1.. ..L l...-_\....--., '--1:"". ~
Civil Engineerinq, Univers:cty of IllinoLs, August: ]9C.
112. Fisher, Ewen Stuart, An Appraisal of a Theory of VehiculaSpeed Regulation~, Ve11icular Sp'eed -i:Zeq~~C;t-i.on -ResearchProject, Dept. CLvil EngineerinQ, University of IllincJanuary 1963.
113. Roberts, Robert E., "'::'he Influence ofUrban Speed Distribution Parameters, !I~: :1.'),,'
to Traffic En:;L22.~.:.e~..:'01_(}, Seph:-mher ] q -,
-,',<
114. Road Research Laboratory,Majesty's Stationery1963.
115. 'rho. Eno Foundation for Ui "ra'[ic ");;'1-']
Characteristics of ~cid~n- --_. --_. --"'_.__...~"'_--_.-.._... ,... -- .._...-
39-40, 1948.
- 1.20--
116. Lefeve, B. A. / "Speed Babi ts Observed 011 a r~ural High'J'lay, "Highway Research Board, Proceedings Thirty-thirdAnnual Meeting, t'Jal_ -ionai Eesearch Council Publ ication324, Vol. 33, pp. 409-428, 1954.
117. Michaels, R.M. and David Solomon, "Effect of Speed ChangeInformation on Spacing Between Vehicles," HighwayResearch Board, Bulletin 330: Driver Characteristics,National Research Council Publioation 1010, pp. 26-39,1962.
118. Ritchie, MaJcolm L., William K. McCoy, and William L. WeIde,"A Study of the Relation between For"lard Velocl ty andLateral Acceleration in Curves Durlng Normal Driving,"Human Factors, Vol. 10/ No. 3/ pp. 255-258/ 1968.
119. Denton, G.G., "A Subjective Scale of Spe\~d when Driving aMotor Vehicle," Ergonomics, Vol. 9/ >Jo. 3/ pp. 203210, 1966.
120. Gutshall, Robert W., Charles Harper, and Donald Burke,"An Exploratory Study of the Interrelations amongDriving Ability, Driving Exposure, and SocioeconomicStatus of Low, Average, and High Intelligence Males,"Exceptional Children, Vol. 46, No.1, pp. 43-47,September 1968.
121. "i~ews Briefs," Traffic Digest and Review, Vol. 11, No. 9/p. 24, September 1963.
122. Ennis, Hugh P., "What About Written Warnings?" TrafficDigest and Review, Vol. 15, No.7, p. 16, July 1967.
123. Hejal, Salim S., Traffic Speed Report No. 86, JointHighway Research Project, Purdue University: Lafayette,Indiana, September 1968.
124. Hejal, Salim S./ Traffic Speed Report No. 87, JointHighway Research Project, Purdue University: Lafayette,Indiana, November 1969.
125. Missouri Traffic Survey of 1934/ pp. 105-118, 1934.
126. DeSilva, Harry R., Why We Have Automobile Accidents, JohnWiley and Sons, Inc.: New York, pp. 33-55, 1942.
127. Lefeve, B.A., "Speed Characteristics on Vertical Curves,"Highway Research Board Proceedings #271, NationalResearch Council, pp. 395-413/ 1953.
128. Taragin, A. / "Driver Performance on Horizontal Curves,"Highway Research Board, Proceedings Thirty-thirdAnnual ~1eeting, National Research Council Publication324, Vol. 33, pp. 446-466, 1954.
- 121 -
129. Zic.'glcr, Chi)rlc,::; H., "Ane;.f'.1i ell j_ SJ clfl S -;" d t(7, Decemrx: r n
7
130. I'orbes, T.VJ., "Speed" Headv!dy, and Volume Fe1atlonship,~
C)fl Ei Freewa.j! r 'II l~~51_.l~rr .. J~.:_~)_r0c:c~f~d lI1gS, Ins t.l. t utof Transportation and Traffic Engineering, U~ivcrsit
of California: Los Angeles, p. lOS, 1951.
53 Normann, 0.1\. I
Studies,"1939.
'T· '" (.> L .,
132. Taraqin, A., "Driver 8;cc'hav.Jcr as Affe:ctc'(::l O!.)ject~; enIf i g Il't.,v a l' S h. () tIl. (} e r S f II Il.t \1:;~1\-v (J. ')' }~e ~-; c~ Z:~l I~ C:'1 j3c, eJ. r ,j
Thirty'-fourth 7\.nnual fvloc-t '~)' ~'J;i'i 1 nnPublication 362, \10 f~'--3~r--;'-";r; 4 s- t; 7 q 55 .
n \lC;:blic~!133. Heyer, Robert L., ";Icuc]ySpeeds OD a Rural HIp. 345, July 1951
andD-J i.a.'y ( r1
'/ \/ar (it
rL'ra£flC....__... . ,J_..... _ ...__..._._-"".
134.
135.
136.
137.
138.
Schmidt, Robert I~ .. I' f. ::-ligh'\,vaj/ S'pc;ecl \I .. il()l"
Traffic Quarterly, Vol. 8, No.3, pp. 34J u 1y 19 5 4 ..----
Rudy, Burton M., "LimitatioDE-: 0:: Siqnal Spacinq in aCoordinated SY~3 tem on a Hiqh Speed, Dual Hiqhway,"Traffic Enqineering, Vol. 28, No.1, pp. 20-25,October 1957. ---
Lawshe, C.H. ,Tr .. , "Studies iD Automobile Speed on theHighway," Journal of Applied Psychology, Vol. 24,pp. 306-307, 1940.
Oppenlander, J.e., Variables Influencing Spot-SpeedCharacteristicE3 Review of Li tcr.ltu ;~(, ,--,.3;)(?clalEeport 89, Higl1w~lY Research Boa:rl:----\~;:ishinqt:on, D. C.1966.
Oppe n 1 a nde r, ,J. C., 1~L.L.__!-i ''Z2;:~) ate l~!:!:,'i1X:~;.~__._~) :.Li cu l.e'.!:-.Speeds, Vehicular Speed ~egulation Research Project,Dept. Civil Engineering, University of II i~ois,
April 1962.
139. Wortman, Robert H.. , !i_ Mul!..l vari_~~·te L~~~lJ...)~~~~ .._..Speeds on FOlJr_._~::.~~ne Fural i[lgl2.Yv,,~_.. \7
Requ1ation Rr'scarch Pre') c'ct. '),'p, CiUniversity of Illinois, May 196~ .
.- j22 -.
140. Wilson, James E., "Speed Zon:inCj cn California Highways,"California Division of Highways, originally preparedJanuary 26, 1956, revised Allgust 20, 1964.
141. Onsi, Mohamed, Evaluation of Statistical Methods forDetermining Significant Variables in Rural Vehicular~pot-Speed Prediction Equations, Vehicular SpeedRegultion Research Project, Dept. Civil Engineering,University of Illinois, October 1965.
142. Bunte, William F., Methods for Evaluating Highway Featureswhich Influence Vehicular Speeds, Vehicular SpeedRegUlation Research Project, Dept. Civil Engineering,Univers i ty of Illinois, Sept.ember 1959.
143. Horkay, A.T., Effect of Horizontal Resistance on VehicularSpeeds, Vehicular Speed Reg~lation Research ~roject,
Dept. Civil Engineering, University of Illinois,June 1962.
144. Oppenlander, J.C., Influence of Out-af-State PassengerCars on Spot-Speed Characteristics, Vehicular SpeedRegUlation Research Project, Dept. Civil Engineering,University of Illinois, May 1962.
145. Ku, Chih-Cheng, Driver Characteristics Correlated withSpeeds Observed on Horizontal Curves of Two·-LaneRural Highways, Vehicular Speed Regulation ResearchProject, Dept. Civil Engineering, University ofIllinois, May 1965.
146. Webster, Lee A., Driver Opinion and CharacteristicsRelated to Measured Rural Spot Speeds, VehicularSpeed Regulation Research Project, Dept. CivilEngineering, University of Illinois, July 1965.
147. Fields, Marvin, "Speed RegUlation," Traffic EngineeringHandbook, Third Edition, Institute of TrafficEngineers: Washington, D.C., pp. 530-549, 1965.
148. "Stop Sign Speed Control," Traffic Engineering, Vol. 34,No. 12, p. 41, September 1964.
149. Coburn, T.M., "Trends in Speeds on British Main Roads,"Reprinted from the Proceedings of the Third Conference of the Australian Road Research Board, Vol. 3,Part 1, pp. 593-603, 1966.
- 123 -
150.
151.
\'liah1 ::Jren, Otto, The [h":
Dif£ercflt .E1'~~l(~~·., .. ji:r~0 - Lan c__ tlIi;I~~~6'~~-3' "-".-.'-_-._:.",_:-c.;-:-2·)-""" -C'l':'-_::;-'-_:'--~'--'::"--:-r:,: a;;
ot Technology:: 3els JnKl., :::>C1 en t If lC l~e sc arche s No.22 1967.
nS~;.1/~t?d as a CauE;e ():[ ITraffi,:: l:.c(=:Ldc:~l·tE; J It rrl~lC' l\Irl(;T--_._._.._ _..-._---_ =.Vol. 50, p. 73, February 1933.
2" A Survc;"}t of Tra:~:fic C'(J t.iCJ113 .tT: thE' C~l,,·t ·-)f :=;~J113~~· 'v,l
Checks of Obedience t~ ~ra~fic 1,2JWS s~)(:)nsDrod
City of .Dal1E~\s P()l.icE~ DCI='c;J:.'"tTIlent, ;-}939J" r-)~ 90.
153.
155.
156.
157.
158.
159.
Fitzgerald, JamE?S 1\ ~, l~arl l~.. I~[()_f" tJTL~in: dnc] \]"()'l--Jn :R"Bayston, DJ:-i'\IC~ an.d Li-',/c
i_,<) i;"_~ T?:-ll)1l~.:)1-'j.j_llg CC).
Richmond, I)-:-':riYr~- 19 J C'7--
Halsey, Maxwell, Traffic ~ stlon, John-- ..•. __•.--.... --_..•.-..•..-.-.-.--.-----..- ...---,~.-.-:-"...--...- ..--- ..
~';iley and ~30ns
Hurd, Fred, "Highway Design, Traffic C(.);",tro!, c\lld Drivinq,The Motor Vehicle Driver -- His Nature ani Improvement"1.'he Rna F01.J'1d··., 4-l' r),~ -F" yo Pl' .,11'·;aV----;:c;-r a-F'- "-C---;;(~;~,~~t->-.-~-----....
.l....J .~ C-4.l_ \.J.! ..L. ...../.)_ ,J..l, "j ... (V ..1 .1 ....... .LJ..,. \ __._,. __ 1....L ..
Saugatuck, Connecticut, pp. 80-99, 1949.
Raff, Morton S." "The Interstate Highway !\cclc1en-c: Study,"Public Roads, Vo1.27, No. El, p. 1.70, June 1953.
Belmont, D.M., "Effect of AveraCjc Speed and Volume or:Motor Vehicle Accidents on Two-Lane Tangents," P,eprincfrom Proceedings Thirty-second Annual Meeting, Highw2VResearch Board ,--2ranuary 1953. ----.----
Lefeve, B.A., C.E. Billion, and E.C. Cross, Jr. "i?c;latJ nof l\ccidents to Speed Habi ts and OLIlcr Dr ·.\TCr
Characteristic~;," Highway Hesearch Boar:] Bulletin ]?OTraffic Accidents and Vi.olcltions, Natlo"l";::'I-'Rcc,,::,archCouncil Publ.iccLti()n 4(Y~FJt;-:-6:::-30, 195f, <
Sielski, Mathew C., "1.'.fhat :;h()ul(~: t.he J'fldXllPum",(""'C'd Li.mi tBe?" Traffic Engincc;rinc, Vol. 28, ';, ;)p.C:,46--550, September 1956.-
160.
161.
"The Case of Exit. lCb~amp/" Traffic "uEeL ! Vu,5, pp. 25 - 27, I\fO\lembc r -:'1"9"5'7-'.-.....
Brittenharn, 'r.G. I D .. l\'l. Glartcy-, L.tn.ll L'~~-l ..of In\Tcstig-atir,g di ~L'rat
Research Board Bullet
- 124 -...
r¥l\:~ -1-
162. "Improper Speed a Big Fact.or in 'Traffic Accidents," TrafficSafety, Vol. 52, No.4, p. 36, April 1958.
163. Prisk, C.W., "The Speed Factor in Highway Accidents," TrafficEngineering, Vol. 29, No. 11, pp. 16-17, 25, August1959.
164. Minnesota Department of Highways, "A Comparison of RuralSecondary Road Accidents Before and After theInstallation of Lower Speed Limit Signs and AdvisoryCurve Speed Signs," January 9, 1961.
165. Moore, John 0., "A Study of Speed in Injury-ProducingAccidents: A Preliminary Report," Traffic Safety,Vol. 54, No.6, pp. 16-21, June 1959.
166. Case, Harry W., and Roger G. Stewart, "Inventory SpeedResponses and Prior Traffic Records as Predictors ofSubsequent Traffic Records," Highway.Research BoardBulletin 240: Highway Accident Studies, National .Research Council Publication 726, pp. ~3-56, 1960.
167. Solomon, David, "Accidents on Main Rural Highways Relatedto Speed, Driver, and Vehicle," Bureau of PublicRoads, July 1964.
168. Davies, Ernest, Roads and Their Traffic, Blackie and SonLimited: Glasgow and Philosophical Library, Inc.:New York, pp. 107, 118-121, 269-270, 1960.
169. Swedish Council on Road Safety Research, "Report on theResults of Temporary Speed Limit on Road Accidents 1nSweden," Stockholm, no date.
170. Road Safety Committee, Temporary Speed Limits in RoadTraffic During 1961, Stockholm, 1961.
171. Harper, B.S.C., "An Examination of the Effect of Raisingthe Speed Limit in Built-Up Areas in Victoria,"Proceedings of the Third Conference of the AustralianRoad Research Board, 1966, p. 647, 1966.
172. H~kkinen, Sauli, and Urpo Lepp~nen, Speed Limit Trial inHighway Traffic in October-November 1966, TALJA, TheCentral Organisation for Traffic Safety in Finland:Helsinki, 1968.
173. Wadsworth, J., "The Effect of Conventionally EnforcedMaximum Speed Limits on Motor Vehicle Accidents,"National Research Council of Canada, Motor VehicleAccident Study Group: Ottawa, Technical Note No.9,November 1966.
- 125 -
174.
175.
176.
1 "7"7..L I I.
178.
179.
1 "j-,. • LJ • ,
FIO',v and Accickn::Traffic i{evic\>i
Prisk, Charles W., "Accident Rates on NotoDvays cspecial1.~'
1-.] i th reference to: (]) Speed Di [ferences (b) ;1inin:uidnd Maximum Speed Limits. Genp~:al Report," Interna c;Eoad Safety and Traif 1 c r<,eview, '/01. XV, 'Jo. -2, --p:::J ~.24- 33, Spr ing 19(') 7 .---~------_._--
Automot i V(? Safety Foundati en, 'fraf f ic Contro:md j~uc',d\~.~z.
Elements: The r Relationshio to Hiqhwav Safety,. --:=-_.,.--;::;-;:----"'J.~.-----.----~---., _=_
Washington, D.-i:=:--, pp. 67-70, 1963.
T a y lor, 1,h 11 i am C., _'"I:',l,,1:..=C'_.-:L,=c:..'.f E.,-:e=-,','::;:__-,c_. _ ,(,)__ f, ~;_.,..±:,-;-,_:_.. .. _._,,-~_,_.,_:..-= -c:~__._ .
Operations,- CIIno Depacmentof Public Eoad,;, FebrJc~ry q(,
"Speed-Related ACCIdent Countermeasurc's ano '':'1:.1: Pr:i:'Proceedings of National rIiqhway :~afety 130r,CluPriorities SeTT~rDi~r!, Vol. ~~t=ecl::-rlcK'smTl:'i-f\~Jrcr:r' ciJuly 18-30, 1969.
180. Willett, T.C., Criminal on the Hoad, Tavistock Put)]jcationo;'London, pp. 20-21, 19~4.
181.
182.
Baker, J. Stannard, "Research and AccIdents," ':;'1'3 f fie Di:;jeand Eeview, Vol. 12, No. 12" p. 12, DecemFer~-r96-~--'-----
"80 m. p. h. Speed Sharply Increaces Acciden t [(isk \vi th LJ, t_ t l
Saving in 'I'ime," Traffic Digest and,_~~:,T:rJ.:~~Y'~' Vol. 11!No.6, p. 16, June 1963.
183. Campbell, M. Earl, "Highway TrafficPossible?" Traffic Quarterlv.3 39 - 3 4 6 r J u 1 Y-I96~5-:--'-------_-d'·
Safety _.. ,; It\Tcll to 19 I\i(~ ~ 3 f
184. Goen, Richard L., "Drastic j\leasun~~;, for ;;:':::ducjnej 'l'raffJcCasual ties," Stanford Eesearch lnsti t:u tc: l\lenl() lacCalifornia, p. 20, June 1960.
Li \]03185. Goen, Richard L., "'1'h,-:' Tradeoff BetweenTinlL," [)(:.tper p~t'f;:::,entc(:i a.t. the 29thof the Operations Research Soci~ty
18, 1966.c)f -", -~, -
-c..:..\(".-'
rl.'VI!19
t_l
186. Poulsen, Roy G.Safety, Vol.
- 126 -
187. National Highway Safety Board Staff, Maximum Safe Speedfor Motor Vehicle~, January 31, 1969.
188. Mitchell, H. Richard, "Freeway Accidents and Slow-MovingVehicles," Traffic Engineering, Vol. 37, No.2, pp.22-25, November 1966.
189. Cirillo, J.A., "Interstate System Accident Research StudyII, Interim Report II," Public Roads, Vol. 35, No.3,pp. 71-76, August 1968.
190. "Traffic Accident Facts, 1969 Edition," Traffic Safety,Vol. 69, No.8, pp. 11-14, August 1969.
191. Research Triangle Institute, ?~~d and Accidents, Vol. II,Final Report, "Summary and Conclusions," May 1970.
192. Reeder, Earl J., "How Slow is 'Slow'?" The American City,Vol. 46, pp. 111-112, May 1932.
193. Carter, F.M., "Speed Zoning," Proceedings of the FirstCalifornia Institute on Street and Highway Problems,Berkeley, California, pp. 151-156, January 31 toFebruary 2, 1949.
194. Smith, Wilbur, and Associates, Report on Traffic, Transit,Parking, Metropolitan Winnipeg: New Haven, Connecticut,pp. 71-73, 1957.
195. Baerwald, John E., "Theory of Speed Zones in DevelopedAreas," Traffic Engineering" Vol. 28, No.3, pp. 2023, 39, December 1957.
196. Ohio Department of Highways, Let1:ers and forms on speedzoning and speed control, 1957, 1960, and 1963.
197. Anonymous, "An Informational Report on Speed Zoning,"Traffic Engineering, Vol. 31, No. 10, pp. 39-44,July 1961.
198. Donigan, Robert L. and Edward C. Fisher, "Know the Law:Speed Zoning," Traffic Digest and Review, Vol. 14,No.9, pp. 19-24, September 1966.
199. Rowan, Neilon J., and Charles J. Keese, "A Study of FactorsInfluencing Traffic Speeds," Highway Research BoardBulletin 341: Accident Analysis and Speed Characteristics, National Research Council Publication 1023,pp. 30-76, 1962.
- 127 -
200.
201.
Oppcnlander, J.e.,Vehicula:r' SpcCivil Engin2cri~g, University
Baerwald, John g., "300 -HorsepO'.ver Roads -- Hors(:BUC~lr,.J'::: Spe"e<'1' "0>,,"" " 'T'raf'fic E'ng;TjO""Y.'l'J1Q \Tell'.• ~I_ _ .L.JC< \ ::, , ~_r, •• ~ ' '_':":.::':.'=._:... _=_' .20-22, June 1964.
a.nd34, [-JIJ ~
202. Kloeker, D.L., "Speed R.ezc~;inq,"
Road School in 1968.
203.
204.
205.
J3randt, Warrerl 11. f II Sl~eed I,irni t._E~~ ._- 1'nc()r.yr anci .:Jre-lct,ic(_:, f?
FBI Law Enforcement aulletin, Vol. 3S, No. na. 2-62 2 - 2 5, i\Ia r c:~--P3 6r;:-------.-----
Kessler, Warren L., The Effect of Speed Zone Modlficati TIS
Occas ioned by i~E(; Ilf·Criofs---~s?e-(2·CCJ~23,.:)·,,·,T{:~t-;T;;1-L3:r-S---
Regulation Res~~arch Project~Dept~:---CivilEngineer in9,University of Illinois, February 27, 1959.
Deen, 1"1.B., "Effect.iveness of S[)eed IJ.in1it ~~,i(Jrl ,II ].lJ:affi~_
Engineerin~, Vol. 29, No.7, pp. 22-24, 62, April 19SQ.
206. Tennessee Department of Highways, Traffic EngineeringDivis ion, 1', Summary of Practi ces in Es t~ab] i sll i ng SpeedZone~, Na s tlV i lJ_ e J~ Jun E~' 19 6 ff:"-------------·- --------------
207. Sub-Committee on SpE~ed Zoning, Flesolut~ion of t.ne AnnualMeeting of the }I,.merican Association of Stah' Highwayuificials, 1969.
208. "Speed Zoning, Why anel How -- A Guide to Es tab 1 i shingRealistic Speed Limits," Automobile Club of SouthernCalifornia and California State Automobile Association.1965.
209. Johnston, J. Ed'j·.rard, "Speed ControJ and ReguLatiun,"I.T.E. Proceedings, Institute of Traffic Engineers,pp. 141-148-;-1965.
210. Taylor, William, If}', New Concept in Speed Zon.i.nq f"
Engineering, Vol. 34, No. 12, pp. 38-39,1964. .
Tr at fie:C?!TIoe.r
211. 'Taylor, William C., "Speed Zoning;Traffic Engineering, Vol. 35,50, ,January .19(5 .~-'
A Theory and its p~
No.4, pp. 17-19, ~18-
212. 'l'ennessee Departmen t of HiglPt!ays, Traf fi.c F'n] .111'." 1.inG
Divisi()rl, I:~"\laltlatic)n elf th(~ 2fft~ L \"' r"' :::;s c,f c.~:ci()u:·;
Spot Sl)ced--Pa-r- ::3.rnE~~ ters -~Used in .f~s t ,:J~~j~~~-_i). n;~J S;;JC~~~-:__0-Zones-~ashv·:'-,·>:;-- M",·· 1 qKQ__> _' l\1 '--... J...1- t:,- f' ',1\.'(,Y ,L._," ,..-,
- 128 -
213. Baerwald, John E., "Needs and Methods of Speed Control,"IJovember 1964.
214. Smith, Wilbur, and Charles S. LeCraw, Jr., Traffic SpeedEnforcement Policies, The Eno Foundation for HighwayTraffic Control, Inc.: Saugatuck, Connecticut, p. 16,1948.
215. Marcellis, Jack C., An Economic Evaluation of TrafficMovement at Various Speeds, Vehicular Speed RegulationResearch Project, Dept. Civil Engineering, Universityof Illinois, pp. 1, 39, 49, 56, October 1963.
216. "Speed Limits May Be Outmoded," Traffic Digest and Review,Vol. 13, No. 11, p. 14, November 1965.
- 129 -

/3[

APPENDICES
Preceding page blank

APPENDIX A
GLOSSARY OF TERMS
Preceding page blank

Sources for this glossary were:
I. TRAFFIC ENGINEERING HANDBOOK, Third Edition,Institute of Traffic· Engineers: Washington,D.C., 1965.
II. DICTIONARY OF HIGHWAY TRAFFIC, J. StannardBaker and william R. ··Stebt;irls, Jr., 'l'rafficInstitute, Northwestern Univ0rsity: Evanston,Illinois, 1960.
III. TRAFFIC ENGINEERING, T.M. Matson, W.S. Smith,and F.w-.-nurd~-·McGia\v-HillBook Co.: New York,1955.
IV. MATHEMATICS DICTIONARY, Second Edition, GlennJames and R~obert C. ~(ames, editors, D. VanNostrand Company, Inc.: Princeton, New Jersey,1959.
absolute speed limi t: "a speed above vvhich it is always ille. gal to drive." Also known as a maximum lawful
limit. (I, p. 538)
advisory speed limit: the maximum safe speed that is postedbelow a warning sign. "In most states, the advisory speeds are not legally enforceable, butin some courts violation of the advisory speedsis admissible as evidence that the driver wasoperating in a reckless manner." (I, p. 541)
average overall speed: "The average of the overall speedsof all vehicles on a given roadway during aspecified period of time." (II, p. 12)
average overall travel speed: "The sum of distances dividedby the sum of overall travel times (a spacemean speed)." (I, p. 159)
average spot speed: "The arithmetic mean of the speeds ofall traffic, or component thereof, at a specifie d po i nt. " (I, p. 159 )
critical approach speed: "At an intersection, that speed abovewhfChial-vehicle does not have sufficient distanceto stop in time to avoid collision with another
- 135 -Preceding page blank
vehicle approaching the lntersection on tnlstreet " (T'" p. 39)
cri tical speed (on cllrve): "The speed above wh ich ,::; veh io]will slide off the curve rather than followaround it." (II, p. 40)
design speed: (of highway) ~ "A speed selected for J=)urpose',of design and correlation of those features fa highway, such as curvature, superelevaticn,and sight distance, upon which the safe operation of vehicles is dependent. It. is the h j=;1:est cc)rlotir}llOUS speed. at v.l}-·!::_ch incl"i'\/ .~l 'J;'~j
hicles can trave' with saFety upon a highwaywhen weather conditions are favorahle, traf~ic
density is low, and the design features of thhighway are t~e governing condItions forsafet_y." (II, p. 413)
85th-percentile speer:!: "That speed di~ or belovJ ,,/hich b'; pE;'"
- -'---cen-t 6:F vc~hicles traveJ." (T J I C 68) ;'l'hr:th c>"""~clt-l- 111i '0(-']...,-', -,.. ,.yo,... r'<;rr-x pc~ \._,,,,1 _l e ,~OU C d..L,).' l1a\. e Cl ,_.' __ ospon,.L,.",.-J
definition.]
free-mov ing vehicle: "One in ",hich the dr i V('C i.co; llDt. restricted in selecting his speed by other v~
hicles ... Some observers classify a free-movingvehicle as one which has not less than 6 - 9sec. headway from the vehicle ahead of it andis making no apparent effort to overtake andpass thE? vehicle ahead of it." (I, p. 539)
b.eadway: "The time intE?rval betwE!en passages of consecut]vehicles measured from head to head, moving lD
the same direction as they pass a given poiY-it,"(II, p. 91) or "The distance, measured frontto front, between consecutive vehicles."(II, p. 92)
maximum law~u~ ~imit: I!! a speed above which it is always iIIgal to drive. II Also known as an abscl 1Jte SDC'
limit. (I, p. 538)
median spe~d (of t~raffic): "That speed belo"v Whlcn 50 pCIC(;r
and above which 50 percent of the speeds 0
curred." (II, p. 128) [the 50th percentile]
modal average: II t.hat. speed at which the g;:-eatest DllIT1Der c)f~
vehicles t.raveL" (III, p. 51)
- 136 -
!"l9m~~~~__~..p~~i (of traffic)' "i\ :nJn:-!inq sp0(::cl at which driver'.:;operate on a glven section of highw~y in the absence of traffic:: interference." (II, p. 140)
?perating speed: "The highest overall speed exclusive ofstops at which a driver can travel on a givenhighway under prevailing conditions without atany time exceeding thl3 design speed."(II, p. 151)
optimum. sp~ed: "The average speed at. wh ich traff ic mUE: t movewhen the volume is at a maximum on a given roadway. An average speed either appreciably higheror lower than the optimum will result in a reduction in volume." (II, p. 152)
overall travel speed: "The speed over a specified section ofhighway, being the distance divided by overalltravel time ... " (I, p. 159)
overall travel time: "The total time of travel, includingstops and delays, except those off the traveledway ... " (I, p. 159)
pace of traffic: "the range of spee:d which includes thegreatest number of vehicles for some nominalincrement in speed, usually 10 mph." (III, p. 51)
prima facie speed limit~ "a speed above which the driver ispresumed to be driving unlawfully but if chargedwith exceeding it, a driver may show cause toprove that his speed was safe for conditionsand, therefore, that he was not guilty of aspeed violation." (I, p. 538)
running speed: "The speed over a specified section of highway, being the distance divided by running time
" (I, pp. 159, 161)
running time: "The time the vehicle is in motion ... " (I, p. 159)
skew distribution: "A non-symmetrical distribution. A dis-.. tribution is skewed to the left (right) if the
longer tail is on the left (right) - also callednegative (positive) skewness ... " (Iv, p. 126)
space-mean speed: "The speed corresponding to the averageo( overall travel times or running times over aspec if ied section of highway." (I, p. 161)
- 137 -
"The speed of a 'Ichicle as it passes a spot orpoint on a s tr(~et or high"Jay." (I, p. 1') 9)
ten-mile-per-hour pace: "The lO-mph speed range containingthe -Tarcrest percentage of vehicles in a sampleof spot speeds." (I, p. 159)
time-mean speed: "ThE~ average of spot speeds of individualoverall travel speed values." (T, p. 161)
- 138 -
APPENDIX B
SENSOR SYSTEM DESCRIPTION

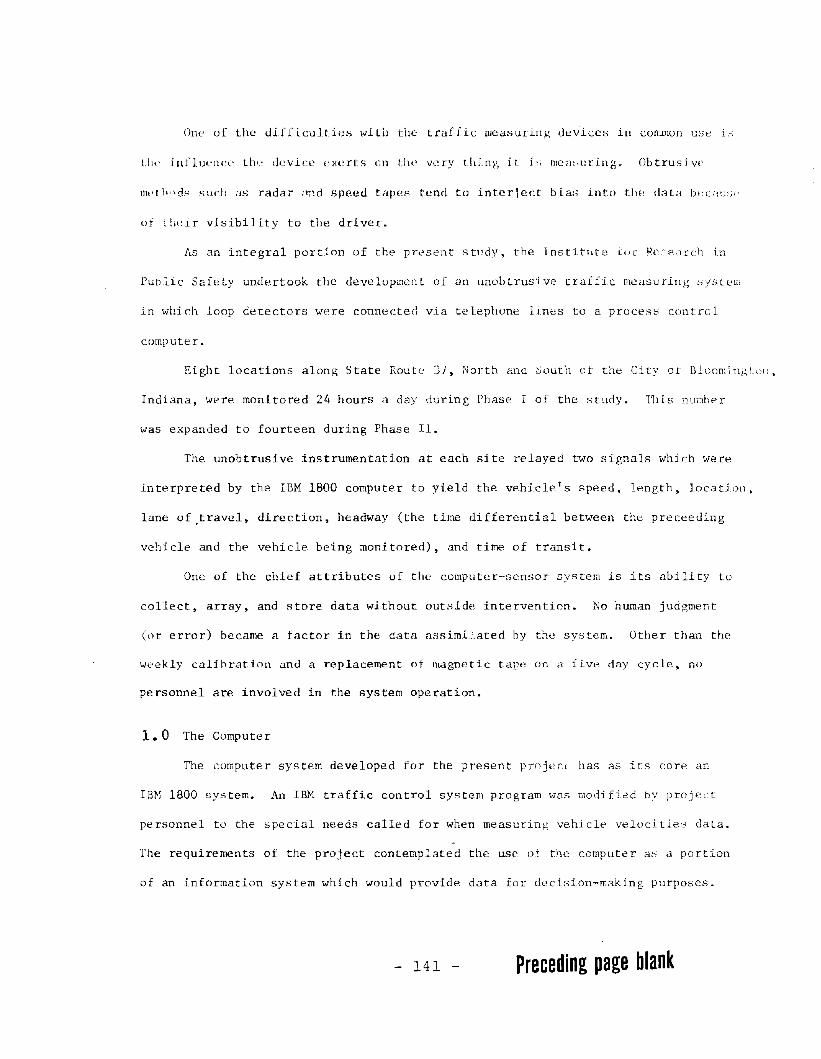
One of the difficult ies wi til the traffic measuring devices in conunon use I
t.ill' influence th" devIce exerts on till' very tlling it i~, mea~-;lIring. Obtrusive
llll,tl"'ds such as radar ,'1;~d speed tapes tend to interject bias into the data bCGlU';('
of tlieir visibility to the driver.
As an integral portion of the present study, the Institute tur Rc:e8rch in
Public Safety undertook the development of an unobtrusive traffic measuring system
in which loop detectors were connected via telephone lines to a process control
computer.
Eight locations along State Route 37, NClrth and South of the City ot BloomingLull,
Indiana, were monitored 24 hours a day during Phase I of the study. This number
was expanded to fourteen during Phase II.
The unobtrusive instrumentation at each site relayed two signals which were
Interpreted by the IBM 1800 computer to yield the vehicle's speed, length, location,
lane of .travel, direction, headway (the time differential between the preceeding
vehicle and the vehicle being monitored), and time of transit.
One of the chief attributes of the computer-'sensor system is its ability to
collect, array, and store data without outside intervention. No human judgment
(or error) became a factor in the data assimilated by the systt,m. Other than the
weekly calibration and a replacement of magnetic tape on a five day cycle, no
personnel are involved in the system operation.
1.0 The Computer
The computer system developed for the present project has as its core an
IBH 1800 system. An IBH traffic control system program was modified bv project
personnel to the special needs called for when measuring vehicle velocities data.
The requirements of the project contemplated the use of the computer as a portion
of an information sys tern which would provide data for deci~;ion-making purposes.
- 141 - Preceding page blank
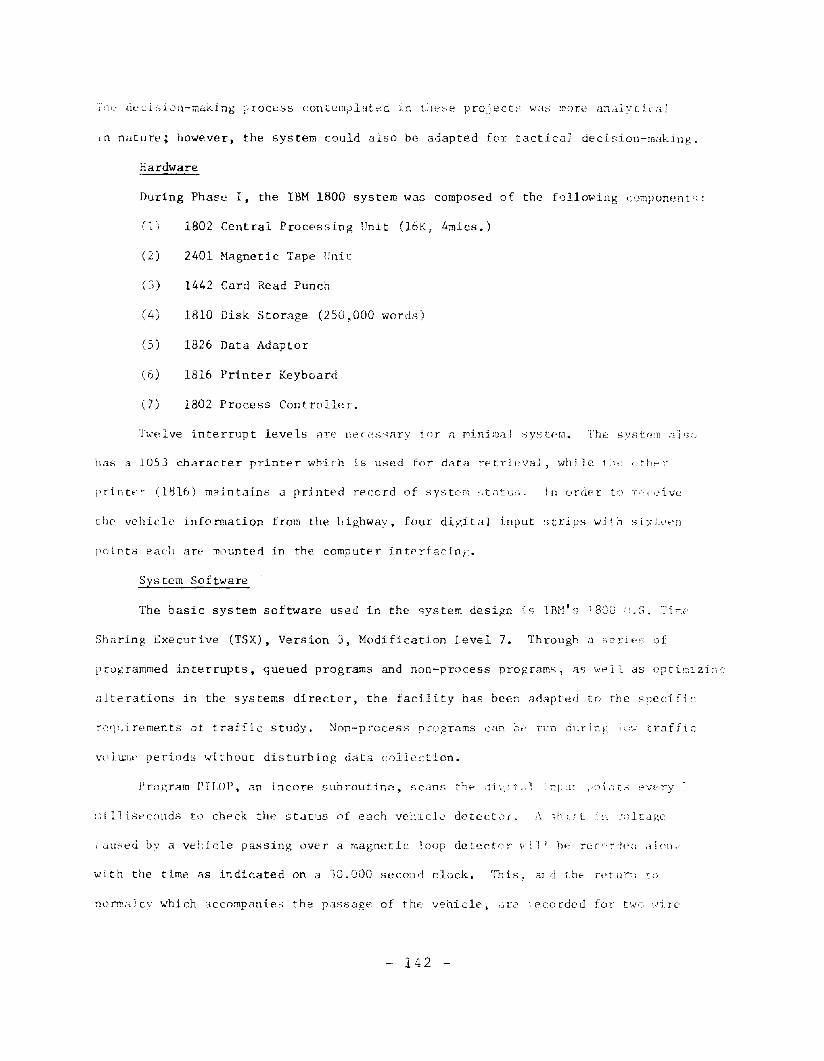
'~'rl~ (iecisi~Jn-rnaking process contemplated i~ t:~lese projectf; was mc)re analyt[ci1J
in nilture; however. the system could also be adapted for tactical decision-making.
Hardware
During Phase I. the IBM 1800 system was composed of the following component';:
(' " 1802 Central Processing Unit (16K, 4mics.), .l..J
(2) 2401 Magnetic Tape [Jnit
(3) 1442 Card Read Punch
(4) 1810 Disk Storage (250,,000 words)
(5 ) 1826 Data Adaptor
(6) 1816 Printer Keyboard
(7) 1802 Process Contro lIe r.
Twelve interrupt levels aTe l1eu',;;ary for a r~ini:11aJ :-;ystPfn. I'he systr;~1.1 a}(.1
has :1 1053 character printer ~\,o\:rhich is used for data retrieval, while t;--;f' t:h~r-
printf-'l- (1816) maintains a printed record of system statLi:,. in urder to ,-(",ivl::
the vehicle information from the highway, four digital input ~;trips with 5i:;:_(·.-n
points each are mounted in the computer interfaciny.
Sys tern Software
The basic system software used in the 5yste!11 design is IBN' f; 1800 .;). -:'i "''''
Sharing Executive (TSX). Version 3. Modification Level 7. Through 3 series of
prugrammed interrupts. queued programs and non-process programs, as ,,'pll as optir.-,lzi:c
alterations in the systems director. the facility has been adapted to the specific
,-~qllirements of traffic study. Non·-process rrograms can nt' run during LOI.' traffiC
v111uru' periods wi~'hout disturbing data collection.
Program PILOT', an incore subroutine, scans t',o ,j; '.') t"
ill LSt'conds to check the status of each vehicle detect,:f. A "!·:.'L :,':nlta;,o
caused by a vd:1cle passing over a magnetic loop det~ct"r v'i l' hp recr'rd"" aloll
with the time AS indicated on a 30.000 second r.lock e This~ (Hid the Tetu',-;-. to
nonr.;ilcv which accompanies the passage of the vehicle, ,ire recorded for t\",C 'iire
- 142
lit' 111 k unit I;1;ly continue to colLect and store vphicle data for a period of theet'
Ll' tOllr hours (depending on traffic dt'nsLty) before requiring a tape backup. During
tili,; timt·, prevj':llsly completed tapt's may be re-examined for retrieval of old data
I,J'rOl~r:llll \':;012), :malvsis or any other task which may require the assistance of a
(,' I ~~:nc' tic tape uni t .
Program NCOll replaces the tape removed by NCOO]. To regain the computer for
dny aIlal \',;is requi rinl~ till: tape uni t, tbe' :;COO]-,\(O" 1 sequence may be rerun as often
as neCl'ssary, up until midnlgbt when Program LNDDAY compute'; t H' daily total.s and
c(:lnintidlizt:'s the system with thl~ ne\.J date.
['roc; the o;ignals rcoceived from each loop set, vehicle sp.:>ed, ],'n"th, d.l rectton
~md .lane of travel are calculate'll. AlsD rlc'corded is the time of and th~: time
bet\>.'cel1 the vehicle in the set and the previous vehicle. In this manner, the system
vicle1:; lane usage information as well as speed relationship data.
2.0 Sensor System and Interface Equipment
I110 sensor consists of an RCA Vehicle Detector Uni 1: h'll Lcll is conrwcted to a
1"CJp of Hire placed into the roadway. The vehicle detector senses the DreSE,nce of
3 vebicle in the loop and closes a relay in the detE,ctor amplifier. The relay is
cOI1r:e,~t:'l to ,] flhone line V>!hich terminates in an interface system specially developed
£0:- t'1Js project bv Indiana University Institute for Research in Public Safety
personnel. The interface system interrogates the relay bv means of an electrical
signal and reports the relav state to t\\e computer in digital input form.
By combining the sensors in groups of four, it if; possible to 11]or;.itor tr:1ffi l'
in live <1Lrcctions and to ckt:crmine the spe",d ,md length Ol~ ",acn vch:ic 1,p ;'lassil1S
throug;l the loop ';c' t. Inasmuch a:; the events are U me relatl'd, traffic densi ties
as \';011 as information on trafftc flo\v composition lTlay also "e determined.
- 143
l()()p.~:, as hoth are necessary to c;llcu~ate ,he vf'hic]p's velocity. length. direct,<)',
headway and time of passage. PILOP senses these timps, and stores them in the
appropriate buffer in INSKEL COM~roN.
Program IROOI, an interrupt: core load, checks the INSKEL COMMON buffers for
each loop set and dumps any Iull buffers to the appropriate disk files. Two 25
vehicle buffers are allotted for each loop set, so that one may be storing data wh i.!
the other is being written to disk. If IROQi :;enses that a disk file is full, it
queues up PC002.
Program PCOOZ, a queued program, checks th., disk fi les and dumps the full
files to magnetic tape. The disk files are then reset, and the magnetic tape is
checked to see if it is almost full. In this fashion, the system monitors traffic
24 hours a day without operator intervention.
Many non-process operations may be conducted utilizing the collected data,
and other computer analysis functions may be performed while the ;;ystem is monitor Lng
traffic. A series of non-process programs have been developed to allow the users
to care for the collection <lcU.vj ty while engaged in other activity. Many of these
programs provide for the maintf'nan(~e of t}w comput"r-sc'l1sor syntem files and its
caLibratio;:. The ::ime-shil'-jllg cCljJability (,I" the :B'l I80!) ',";',X rr"\'ldes tor seeming ..
coincidental data collectlOlJ dr:d analys~,; <1('ll\f11).
Program :"COOJ establishes the disk file,·:, i.nit laJizes tiw tape and allows fo,
parameter entry. When the loop sets are calibrateCl (by radar), adjustments in
velocity and length are accomplished by means of modjfication in one of the conver';!'·:
factors within the program whi ch calcuI.3tpd these items from the four time0 provide j
by PILOT'.
Programs NC004, NC005, and NC006 allow the operator to turn the loop sets on
and off, dnd to enter the Data [nput (interface) time ,;ense base, day of "'-'eeK, \.-"fed i."
and special ccnditions. The traffic at ;1 givpn'~it(' P1°\J be' eX'ln:irkd 'm a real
time basis if desired.
- 144
Description of Loop Installation
At each site, four loop detectors are installed in the configuration shown in
Figure B-1. The cuts are 1/8 inch wide, and originally 2 inches deep for the loop
wires. The wire depth, and the loop dimensions have been subject to some minor
variance in order to optimize response. After the cutting operation, the wire
(19 strand, 14 gauge TIl) is placed in the cuts, making three turns per loop, and
all leads are brought out to the edge of the road. When the \"i re installation is
completed, the cuts are filled with a quick-settlng hydraulic cement.
At the edge of the roadway, each pair 0;: loop wires is spliced to a pre·-twistc·(j
shielded cable, which is buried up to a service pole.
The Service Pole
Mounted on each telephone pole is an equipment cabinet cUld an electric power
meter. The cables from the loops come up the pole in a piece of condui t and into
the equipment cabinet, where they tenninate on a U~rminal strip. On this strip the
loops are connected to the detector amplifiers and the detector output (relay
closure) is connected to the telephone lines, which in turn run to the computer
room of the Institute (FigureB- 2). IISV servi ce is provided to the pole by Public
Service of Indiana for the operation of the Vehicle Detectors.
The Vehicle Detector
"The PCA Multi-Pak Vehicle Detector was designed primarily as an intersection
traffic control device. Its solid state circuitry detects a phase shift in the
loop impedance whenever a metallic vehicle crosses the wire loops embedded in the
roadway. Since each loop at the site requires its own circuitry and relay, the
standard package contains a power supply and four detector modules, grouped together
in a 4-Pak configuration.
To adapt the Ve-Det to the special usages demanded by the research act Lvi ty,
several modifications were required. The original reli\\'s were replaced by fast,:r
mercury wetted relays, and at some sites, the tuning board gain has been increased
by changing two resistors. This may become necessary where the cuts are deep or
- 145 -
th,' r03dway has steel reinforcing. At some installation';, lhe loop induct:mce was
,,0 gn'.lt as to require the addition of external capacitance (0.012 mf, in paralle1
'wi th the loop) to achieve a tuning peak within the range of the Ve-Det' s variable
capacitance. Occasional tuning is required, as the loop sensitivity experiences
minor fluctuations with time and \-leather.
The Computer Interface Circuit
An IBM 1800 Computer with digital voltage input has two input condLtions:
Voltage at input
-1 to +30 volts
-6 to -30 volts
-1 to _. 6 volts
o
The Detector returns a -25 volts signal (sent to the si te via one rvlephcJI1'2 ",;Ln'
to the computer digital input point when no car is in the lOOp. When ~ vehicle
enters the loops, the relay change at the Detector cause" the digital input poi.TIt
to be connected to the computer ground (zero volts). With this information the
computer is able to compute vehicle speed, length, l1I.unber of vehi cles per hour, and
so forth.
The interface connections syster::l useri is of nomina] cost ($200) aQri replacE'S a
svstem DelW in general use, which requires mechanical relays and costs In excess
01' $2,500.
Sensor Sites: Phase I
Each sensor site :la,.; two loop "'iets" ... so called 1.·,eUJ\lH' .'1 :".,·or l,f c,,: ·in·
Inops is required in each lane to gather the nece~:oar:' ; .. t:,rmat; 1.1;L' , :l r ~
rlUlli tared at each sIte, and thIs configuration is narK'd :1 lelop "p.li. ~-", iJun" <
Phast: l, ,iixteen loop se ts were being monitored on Norti. and SO:lt':, StaLe kOUL~' j,',
I'll' ;j total of eight locations, i.e., two lanes of trave] at eight: spu:s. For
I'fdSOnS of programming, these sets are numbered from zero throl1g!l ;'i ftt'ell. ThE
addltional :3ites created for Phase II will be discnssec in :.he tOLlowin section.
146
Loop sets 0-7 are located on State Route 37 South, with sets zero through
three monitoring southbound traffi,', .Illd :;et', four through seven monitoring nortb--
hound t rat fi c. The ~;cquenc(' of l1umheri ng is such that ascending numbers move away
from Bloomington.
Pa~r. 0-4 is located in a 45 mph zone, on a blacktop section of Highway 37. It
is approximately 75 feet North of an intersection with a stop street. For southbound
traff.ic, there is a negative slope of -5.2%. Thie; is a ilJain artery leading into
BLoomington, and some rather high rush hour traffic may he experienced (rate of
900+/hour). Loop set zero monitors southbound traffic, and loop set four monitors
lhll"thbound traffic.
Pair 1-5 is located in a 55 mph zone, enough South of the speed change from
45 mph to 55 mph to be unaffected by the former speed limi to The si te is in the
middle of a short straight stretch which acts as the connector for two curves in a
general "s" configuration. The road is 22' blacktop, and the site is in a no passing
zone. Set one monitors southbound; five monitors northbound.
Pair 2-6 is located in a 55 mph zone, in a 22' blacktop section of Highway 37.
Traffic from the North has good visibility to the site, and its path is straight and
~ffectjvely level. 130' South of the site, traffic experiences a gradual curve to
Ihe right. Set two monitors southbound traffic; six monitors northbound traffic.
Pair 3-7, the southernmost site, is located just beyond the bottom of a long
hill, with good straight visibility in both directions. The road is 22' blacktop,
and the speed limit is 55 mph. Set three monitors southbound and set. seven monitors
northbound traffic.
Loop sets eight through fifteen were installed on State Route 37 North, with
sets of eight through eleven monitoring southbound traffic, and sets twelve through
fifteen monitoring northbound traffic.
Pair 8-12 is located in a 65 mph zone, approximately 0.2 miles North of a
flat curve with a speed limit of 55 mph. The geometry is [ouch that speed would be
- 147 -
Suuthhound Vt';.iclf.:; ,a\'t ~\L'en in ll. f:;S mpll zone tor (Y\lCf l~) m1,ii.·~.
iI,· rO,ld j s concrete, 24' wide. 't'l eight [1l0l1itnrs soutJILH,'Jnrl tr.1ffil., dnd set
twelvp monitors northbound traffic.
r'ili]" 9-13 is located at the nort~]ern end of tIl(' straight-away from Pair 8-12,
,,, ,) Lmg flat curve.
.~lbl~ ~it this site.
The full expanse of the South straight·-;rvJay is not fu1 IV
The speed l;.rr;~t on tbi,', r:oncrete, 2f,' wide "ortjon of the
rOJdwav is 65 mph. Seven h'..ll1dred fe,~t to th,:' l,uTth lie,; OJ ;;;;:;,11 bridge on the' saml'
curve. Set nine mllnitors southbound traffic; ~;E,t thirtt'~'n i!ionitorc; northbol111J
i'ai " 10-14 bon~ers the northern end ~ . .. uphill Jectlon (for
,j'1rt):bound traffic) which contain~; a p;lssing zone fur non:]l: iJu;ld traLii It lie,
mldway through a long curve which terminated in the hiLL secti"n just m('ntiunt'd.
;he road is 24' concrete, and the speed .Limit is 65 :nph.
bound traffic; set 14 monitors northbound traffic.
,'air 11-15 borders the northeDl end of a long level c,Lraight-away, and the
,c:outhern end nf 3 long level curve. The road 1S concri'te, and the ';peed limit is
65 mph.
traffic.
Set eleven monitors southbound traffic and set fifteen monitors l1ortl:bound
Fi i',uTes
~,rofiJes ,.L.''j('l curvature infornatioll as indic3led.
Phase 11
In late July, 1969, a meeting cf project officials, including th6c 'n)~ the
\3tiona1 Highway Safety Bureau, the' l-lesear,:h Triangle Institute, and the inc;tituCi lor
Research in Public Safety, reviewed the system's capahilit~ .,s an instrument of
traffLc data collection. At that ti.me, the system had a dc'cj()n'itrau'd capability of
"peed measurements to within +1 (J mph and length measurements t"wi tn, n +::.0 fee t.
148
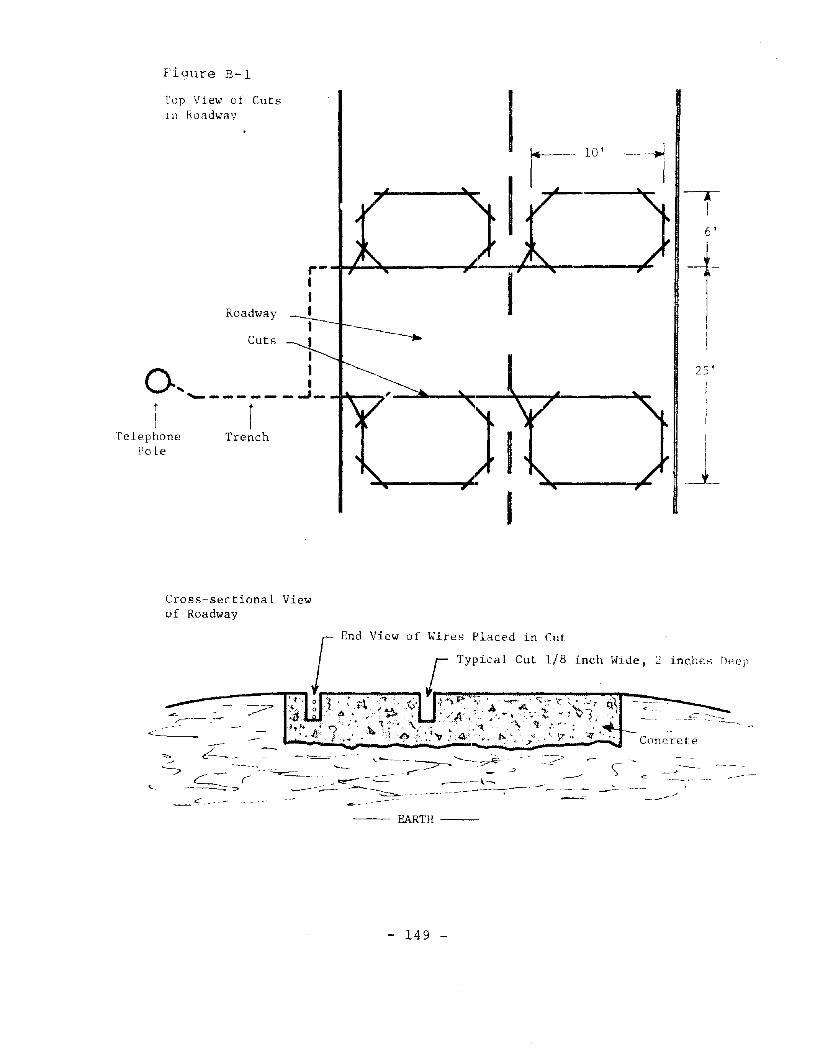
Figure B-1
25'
-+i
!I
I
-rI6'
1
10' --1Top View of CutsIII Roadway
r- -+~4w:~--~~·_......,r--~----rII
Roadway II
Cuts II
~, :r '- - - -f--..J_ -+'r--, _...a.-~"lr")-~I--,tJ'---~
Telephone TrenchPole
....._---~".
I
Cross-sectional Viewof Roadway
c _
Concrete
-- EARTH ---
- 149 -
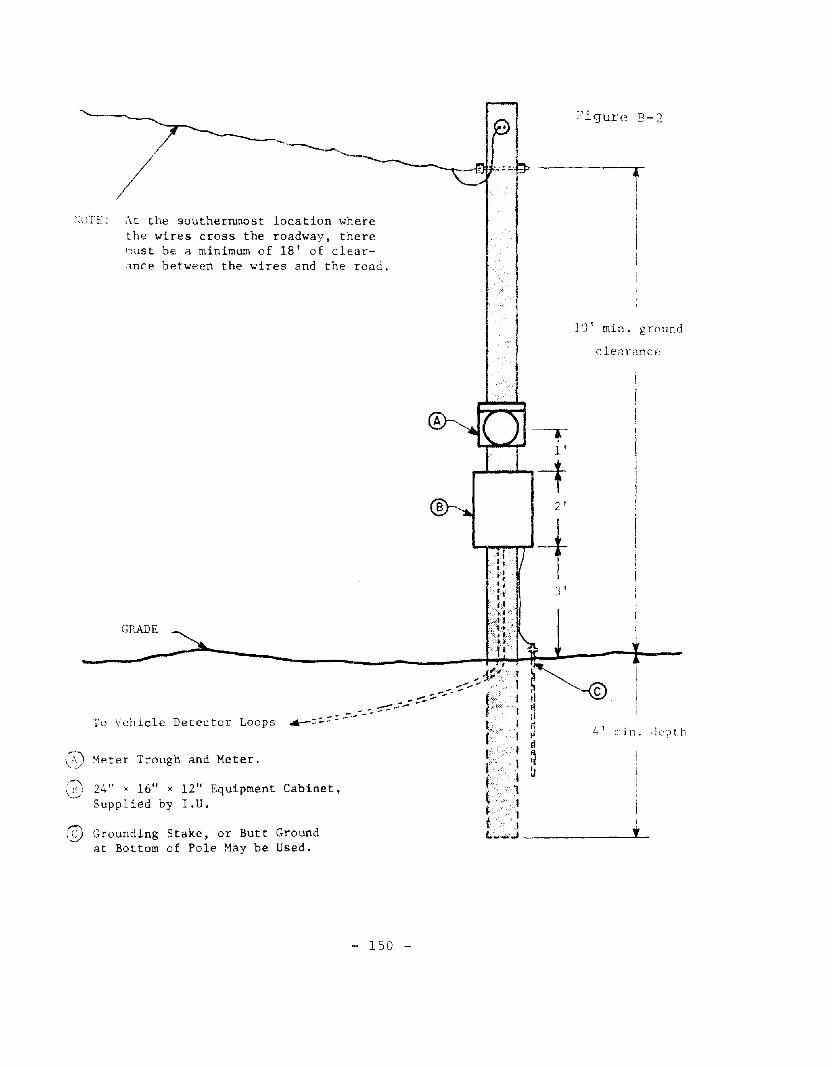
At the southernmost location wherethe wires cross the roadway, there1"Ust be ;l minimum of 18' of clear~nce between the wires and the road.
\()TE:
/
! I
Figure B-2
IiII
] (]' min. ground
I\i
iIi
t
4' ~1 in. de p t h
clearance
3'
... -:;..........- ........ 1
.- -.. .".------.--- -- - -To Vehicle Detector Loops ...--=:.::-:: •.
GRADE ~
-----------------__- __-+H+l:-L----t--
(0) ~eter Trough and Meter.
:D 24" x 16" x 12" Equipment Cabinet,Supplied by IoU.
(1) Grounding Stake, or Butt Groundat Bottom of Pole May be Used.
- 150 -
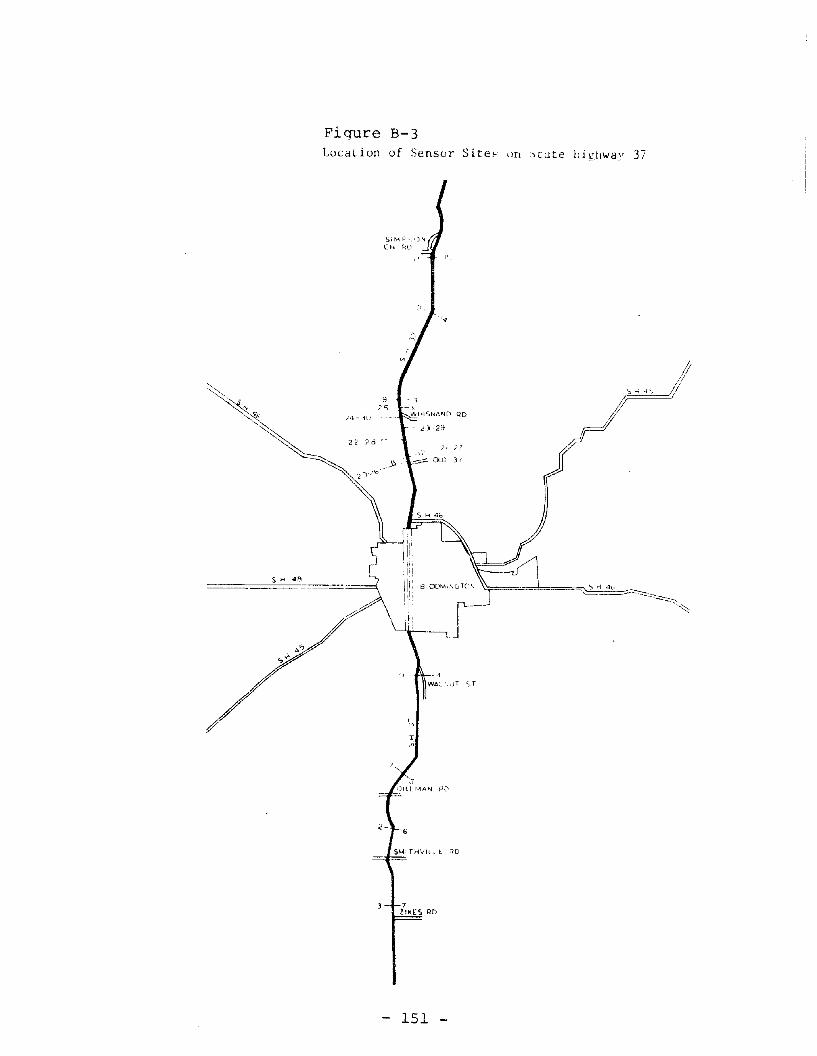
S H 48
Figure B-3h I'l1WaV 37Sites un ,.., t;lte '" .Location of Sensor
~, r
RD
151
j;;j
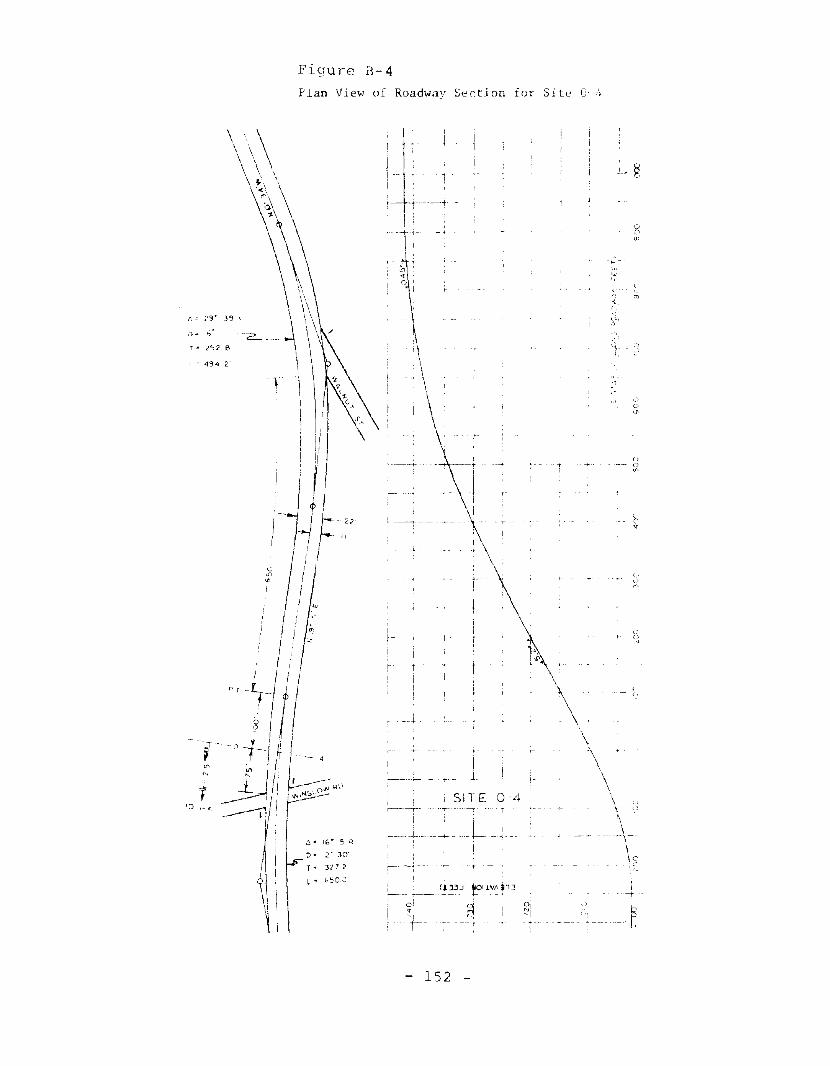
Fi9urc B-4
Plan View of Roadway Section for Site O-~
,(-,~.
\\
\\
\
AI\ (~
o_..-- 0
Ie'
;I
')~----~~II
01:::'1
SITE 0-4
(~TI~I 1\1011"/\ ~lJ
~--.--- r---r--~
.+- -- --- t
~. Ie.- 15 i~
D" 2' 30'
1494 2
IIIIi
I Ii
! IId~r,:'
o IIen I'" II I
I ,
I ,I 1
.' IS, I---- +'! Ii
[--0 ~ -/1 f j-- 4
1. -L 1. 1 r-;;;,,0f ~ I ",'''''':.:-ra 1_". .----Ii!
. - II'
- 152 -
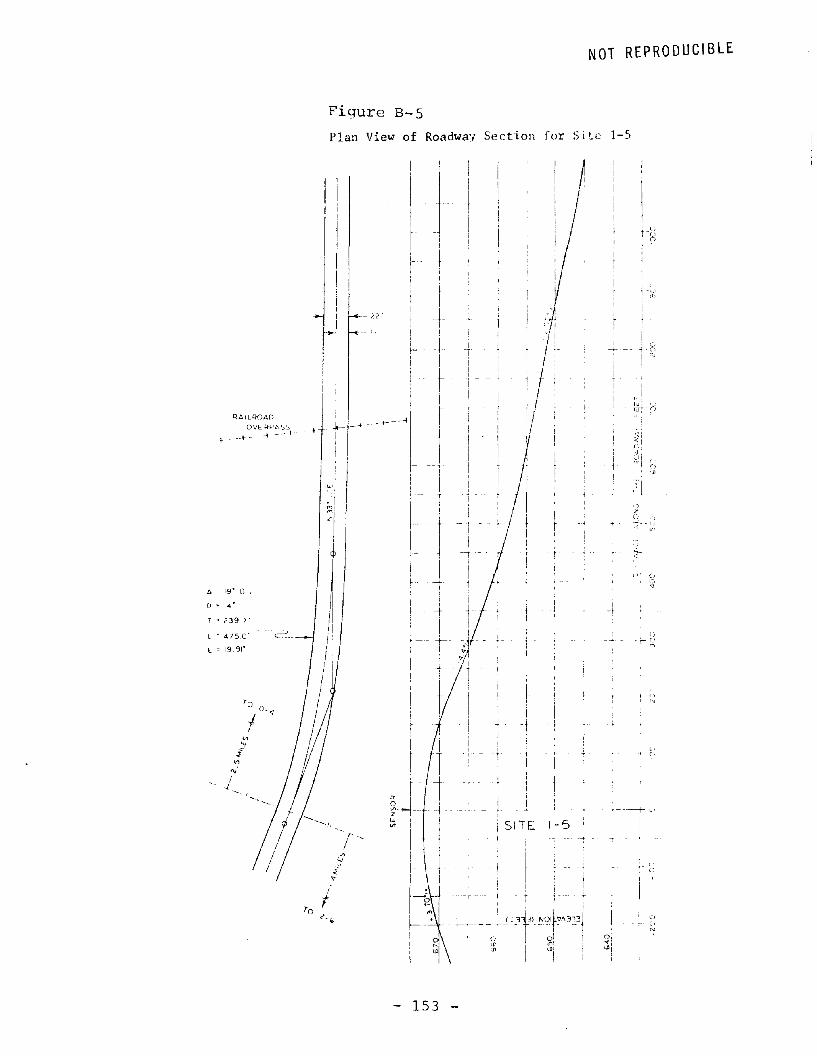
NOT REPRODUCIBLE
Figure B-5
Plan View of Roadway Section for Site 1-5
Gn-:::-,
()
+--0
I) CJ()-,
___ -1 __
I-I
j!
I :_ ~_ _ 1 _ _ ~ .,._ ......-...+--..:.,
SITE 1-5
,- 1 -
I-, - ,
I- t
I
F"RAILROAD
OVE::. APt.. ~si- +_ ..... _---l-
A 19- 0 i..
D' 4
T ' 239 "
-= 4 75,0' ~----e.-:..:.:::__
E = 19,9"
- 153
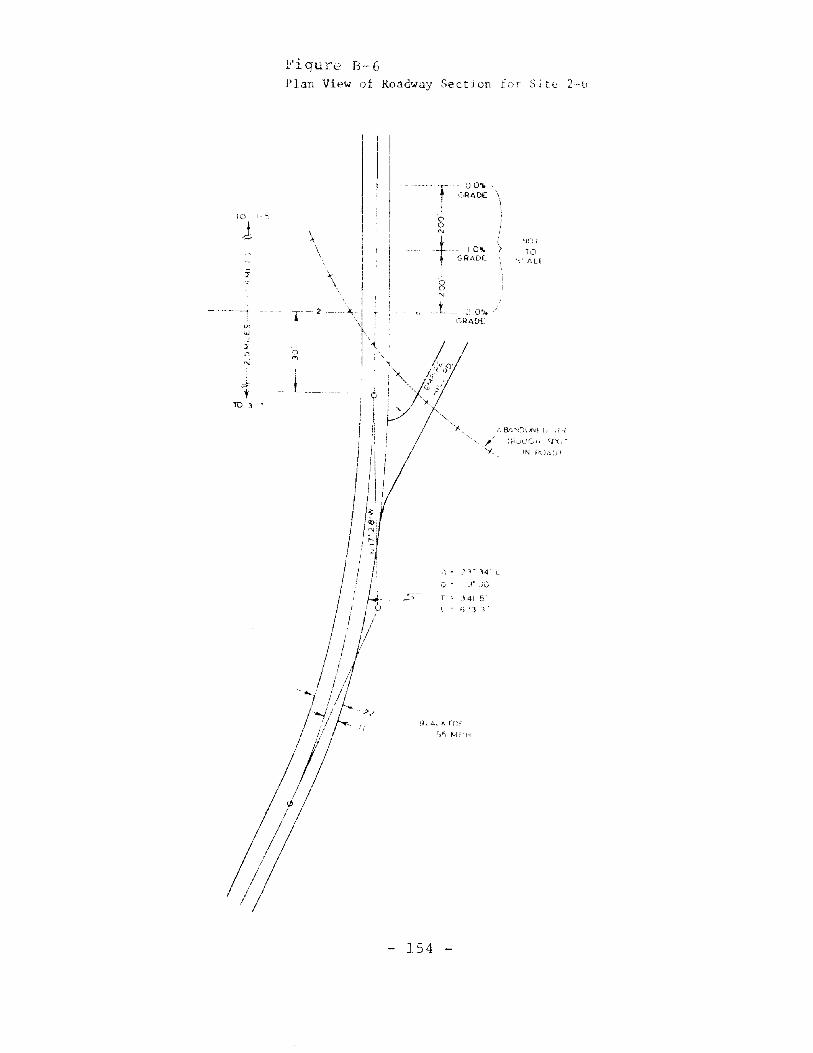
Fiqure 8--6Plan Viel. of Roadway SectJ on for Sl te 2-(,
TO ,- ~
~~
if>W,
,1D3
\\
__ L._
r 0O'""(,RADE
'00N
+ ~jOT
- 1.0'1. TOGRADE. '')( A L~
GRADE
/
t. 8/'... "iD(>Nt LJ ,?~'
(P<~)UC~i <:J,() r
T -. 141 5
55 p....1f'H
- 154 -
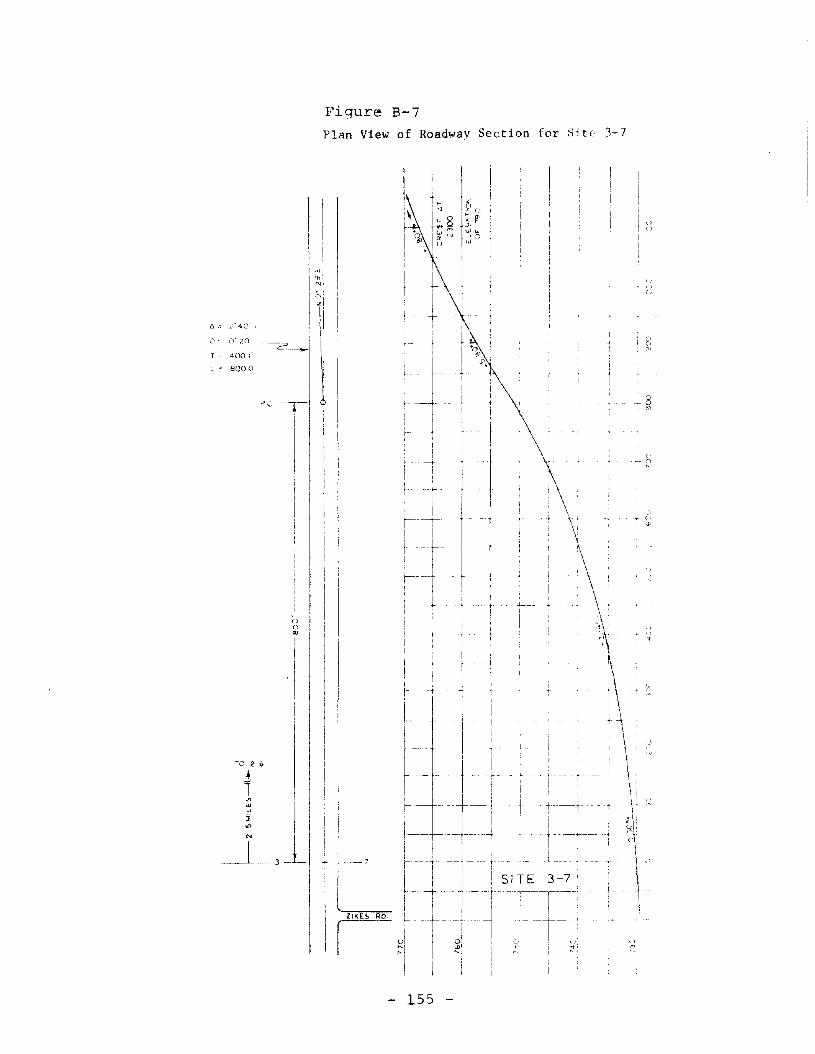
Figure B-7Plan View of Roadway Section for Site 3-7
I
~ ,
,)
o
.- ()
"
co.+ 0
"'
-..---I
SITE 3-7'
!
--1!
I
f~~f- ---
f- --- f·-
f--..----- -- -----
.-
1--- --
I~I
I
oo
'"
TO 2-G
4'"w
N
-~---3
- 155 -
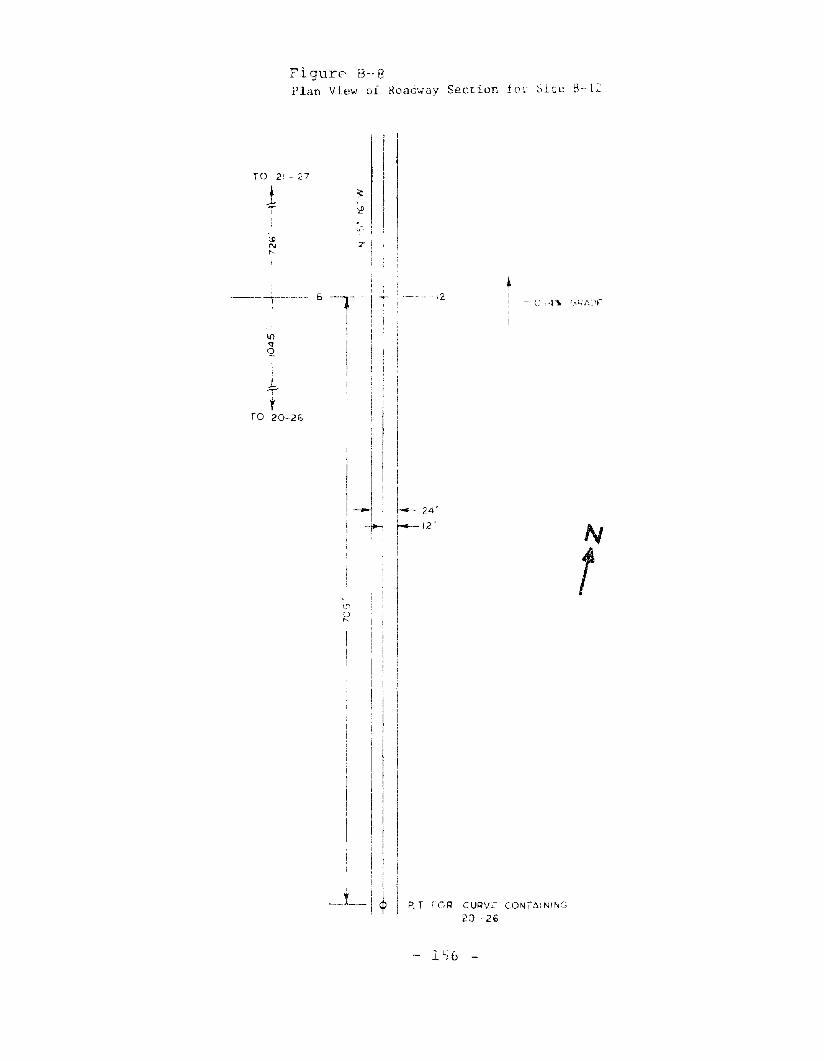
Figure B--8Plan View of Roadway Section for Site 8-12
fa 21 - n
1I,
I-----+------ 6
+tTO 20-26
~
'l!
.-Iz ,
'2
!I
I--I
I-~
IIl.- 24'
t-- 12 '
iI
P, T FOR CURVE CONTt.:NIW;
20 - 26
lS6
N
t
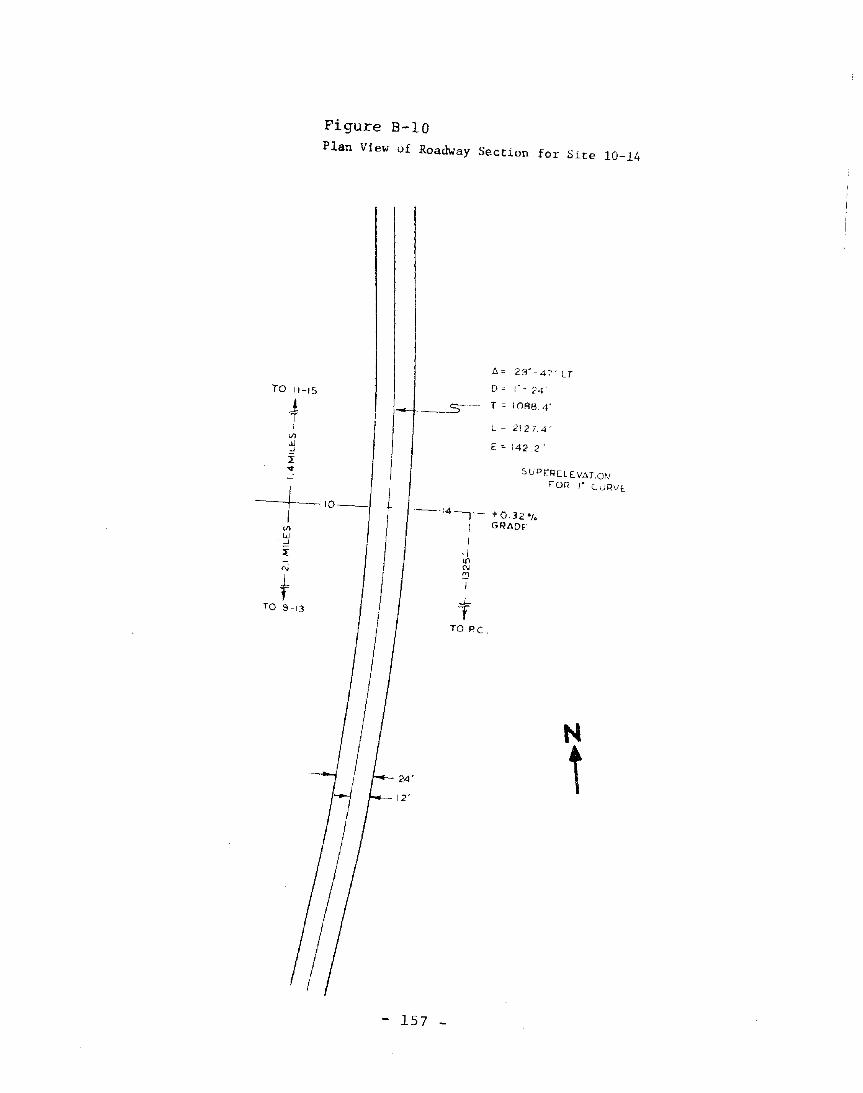
Figure B-IoPlan View of Roadway SecUon for Site 10-14
TO 11-15
t6 = 29' - 4 7' l T
D=I'-24'
T = 1088.4'
l= 2127.4'
E = 1422'
-+-10-
C\i
tTO 9-13
SUPER[lE.VATiO~J
'OR I" C liRv£
- 14 -------r- +0.32 0'.I GRADE
I-/lilN£]
I
tTO PC,
24'
12'
N
t
- 157 -
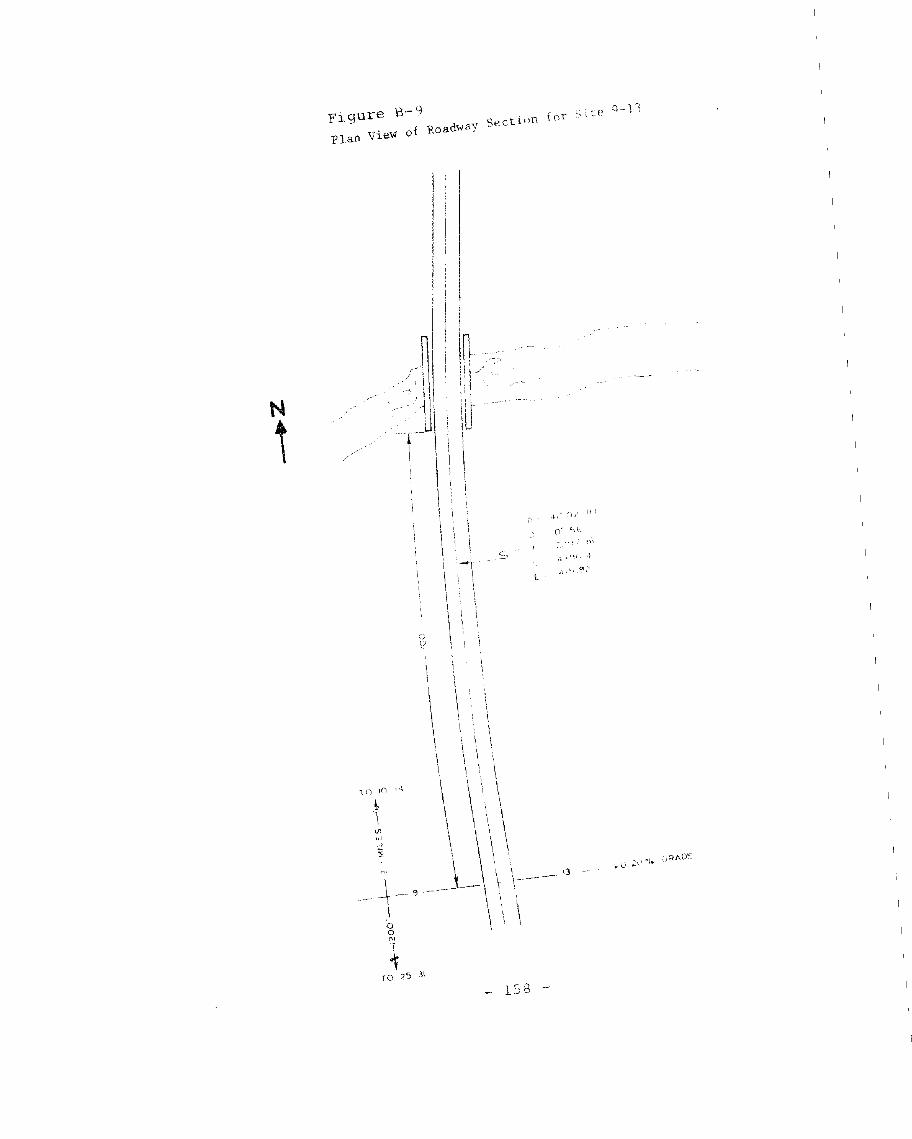
N
\
Fiqure B-9Plan Vie'" of Road\oJay Sectiun for S1 cc Q-13
...\1° () t' () r
t_
ra 2') - 31
_ 158 -
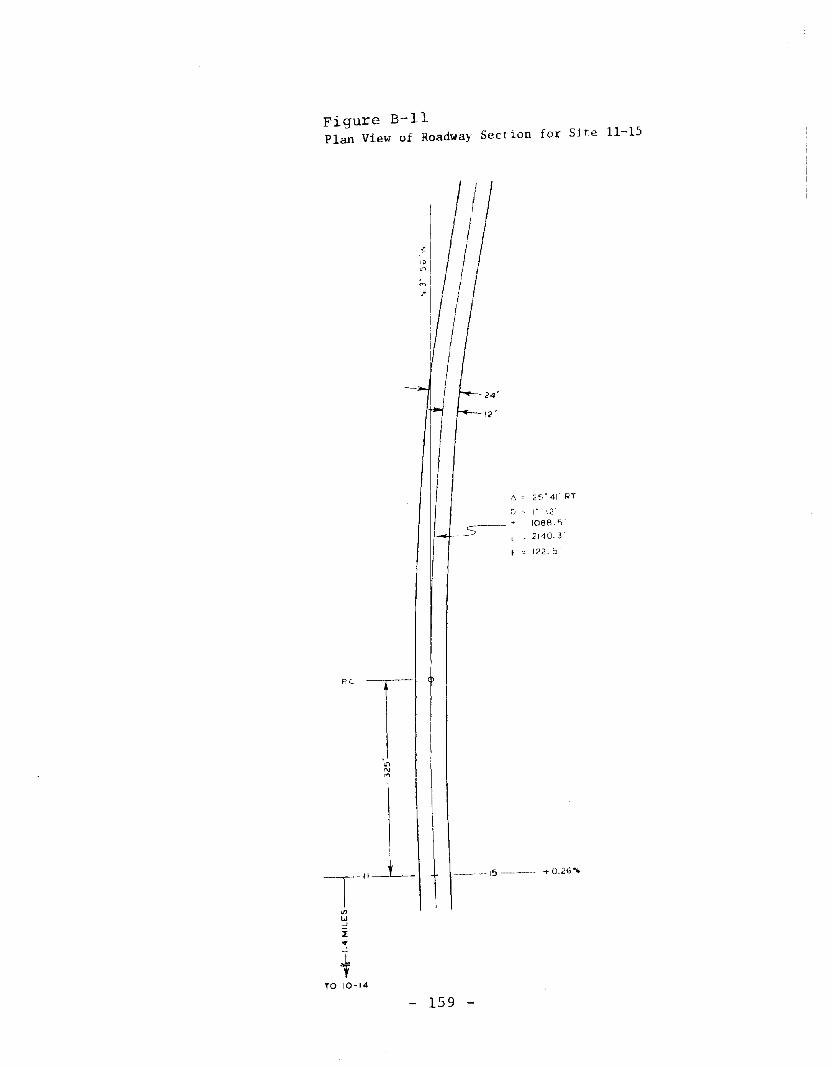
Figure B-llPlan View of Roadway Section for Site 11-15
I' '2'1088 '0'
2140,]'
Pc.
----15 -~- +0,26·..
tTO 10-14
- 159 -
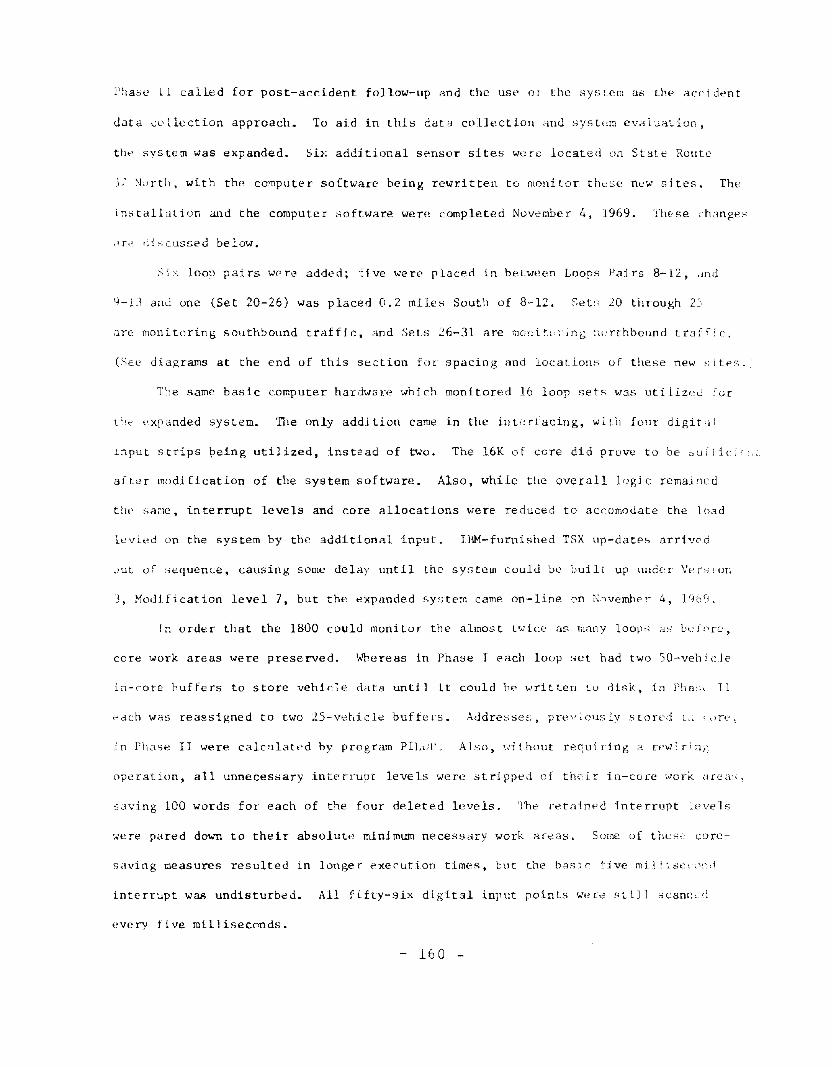
Phase 11 called for post-accident follow-up and the use of the system as the accident
data collection approach. To aid in this data collection and system evaluation,
the svstem was expanded. Six additional sensor sites were located on State Route
37 :Jurth, with the computer software being rewritten to monitor these new sites. The
installation and the computer software were completed November 4, 1969. These change;.'
<ire ,:i scussed below.
Six loop pairs were added; five were placed in between Loops Pairs 8-J2, ,mel
y- L\ and one (Set 20-26) was placl~d 0.2 miles South of 8-12. Set~, 20 through 2~,
are monitoring southbound traffic, and Sets 26-31 are mc;r;itu'Jl1g :lcrthbound traffic,
(See diagrams at the end of this section for spacing and locations of these new ~;ites.
The same basic computer hardware which monitored 16 loop sets was ut i lizl'J for
the l'xpanded system. The only addition came in the interfacing, witb four digit;j]
Input strips peing utilized, instead of two. The 16K Ll[ core did prove to be "ufdc,
after modification of the system software. Also, while the overall logi c remaincd
the same, in terrupt levels and core allocations were reduced to accomodate the load
levied on the system by the additional input. IBM-furnished TSX up-dates arrived
out of sequence, causing some delay until the system could be built up under Vers ior:
3, Modification level 7, but the expanded r,yc;tem came on-line c)n November 4, 1909.
In order that the 1800 could monitor the almost twice as many loops as before,
core work areas were preserved. Whereas in Phase I eacb loop set had two 50-veh Jele
in-rare huffers to store vehic1e data until It could he written to disk, in PhiL-I, TI
Pdch was reassigned to two 25-vehicle buffers. Addresses, previouslv stored in orp,
In Phase II were calculated by progrmn PILul', AJso, ,,,ithout requiring a n>wlrin~;
operation, all unnecessary interrupt levels were stripped of their in-core ,'Jork .'lrea'i,
.saving 100 words for each of the four deleted levels. The cetained -Interrupt levels
we re pared down to their absolute minimum necessary work areas. Some of these core
saving measures resulted in longer execution times, but the basJ_c five millist'('(.1nd
interrupt was undisturbed. All fifty-six digital input points w(~re sri] 1 scam;Ld
every five milliseconds.
- 160 -
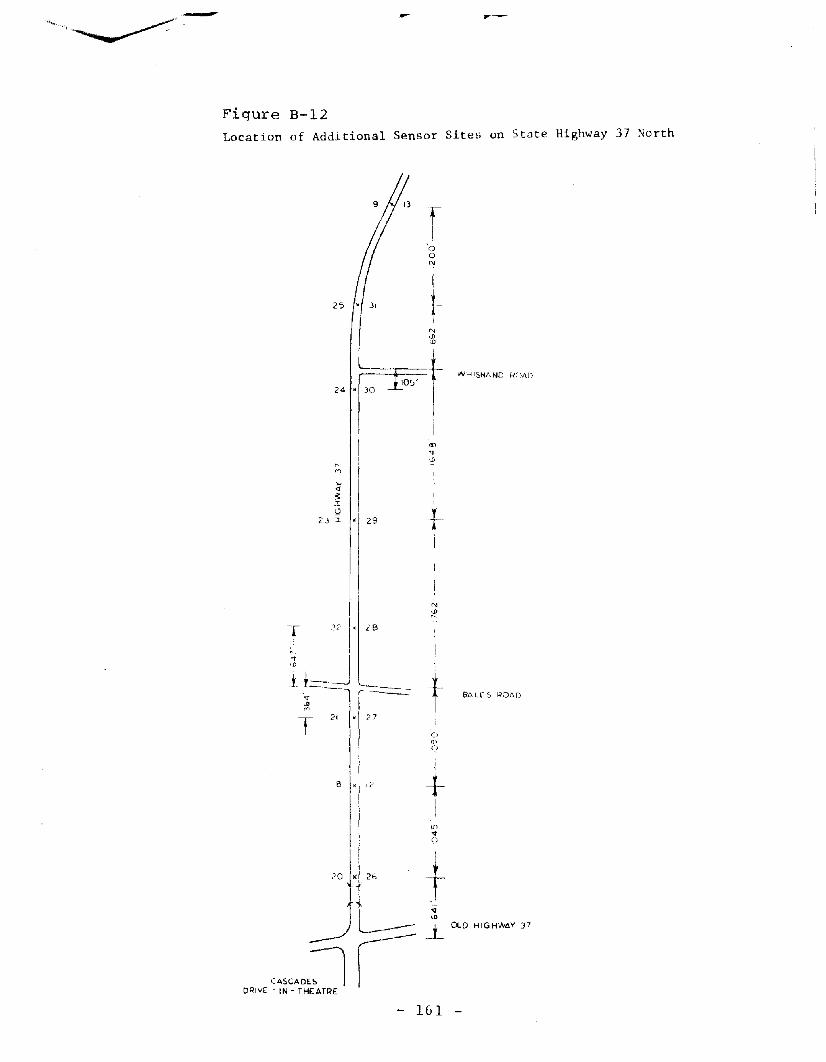
-
Figure B-12Location of Additional Sensor Sites on State Highway 37 North
rI
'0oN
I
N<I!<0
WHISNAND W)AD
ell
""-
'.D~
'" I
::J I~ iI\2 t23 :t . 29
III
IN<I!r"
f22 , 28
r,"t i<0
lJ~ t'" E1llLl' S ~Ol>D
1O...T
21 . 27
0
'"9
8 , 12 t<f)
"Q
20 ){ 26 +q:1O
~OLD HiGHWt.Y 37
ICASCADE:lDRIVE - IN - THEt.TRE
- 161
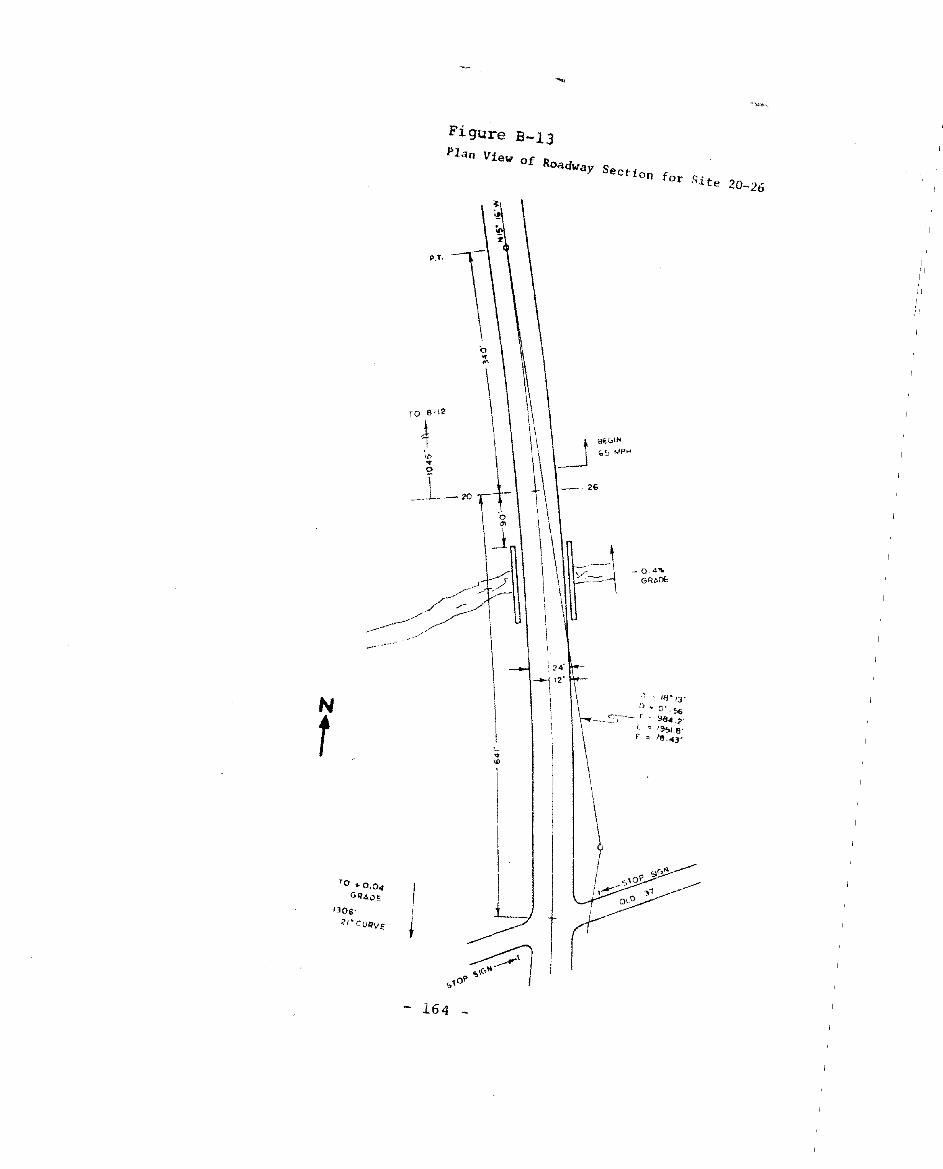
.....
Figure B-13
PIa. View of Roadway Sect'o. fOt
S't. 20-26
----"
N
t
TO .. 0.04G~4/)£
1]06'
2/'CU/:iV€
P.l.
TO 8-12
1
j
.\ ~ 18'13'
D • 0'-56c::-'-- r " ~64.2'
> I. ~ 1951.8', ~ le.4)'
- 164
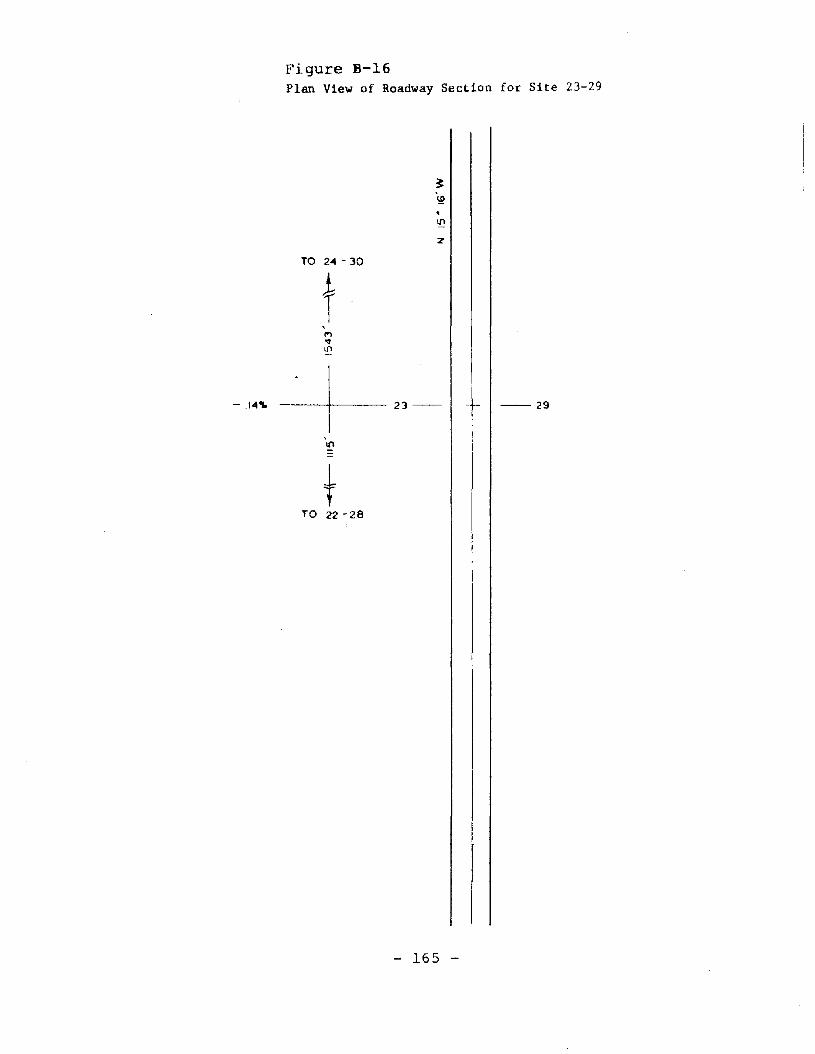
Figure B-16Plan View of Roadway Section for Site 23-29
TO 24 - 30
t,M'IfIf)
- .14"
+TO 22-28
23--
- 165 -
--29
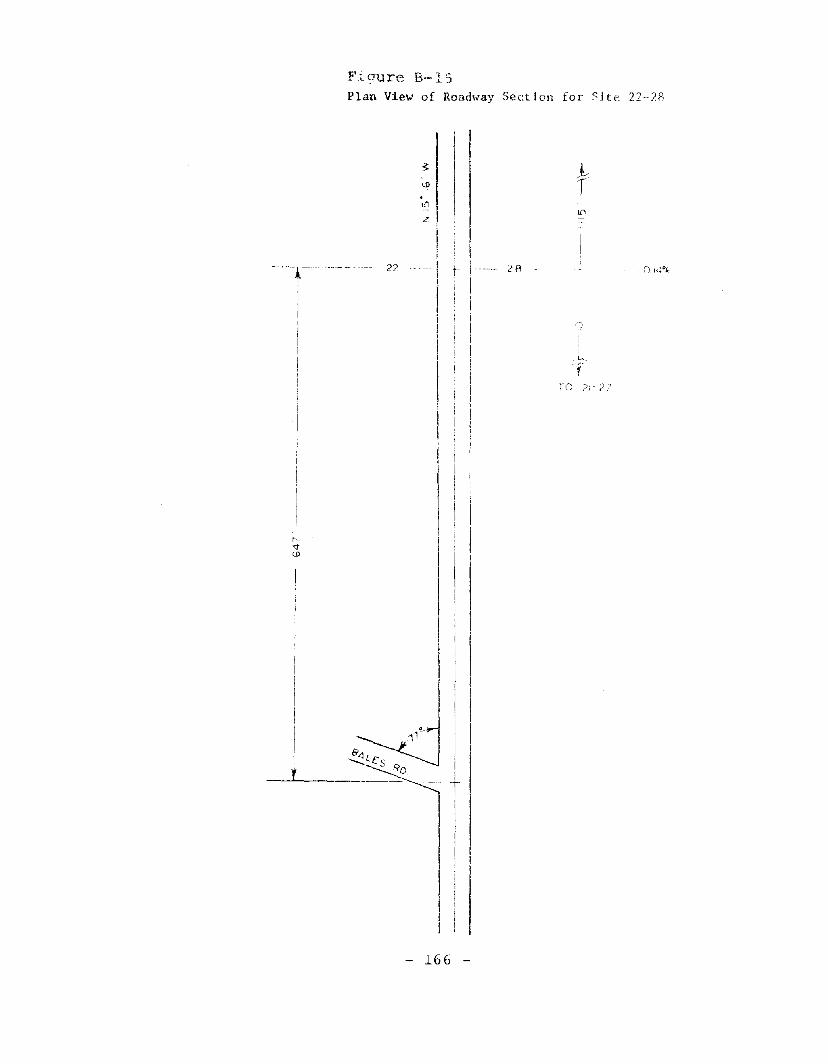
F'i STure B-15Plan View of Roadway Section for Site 22-28
---t- ---- -- -I
III
22 ----- 28
ro 2: ?7
- 166-
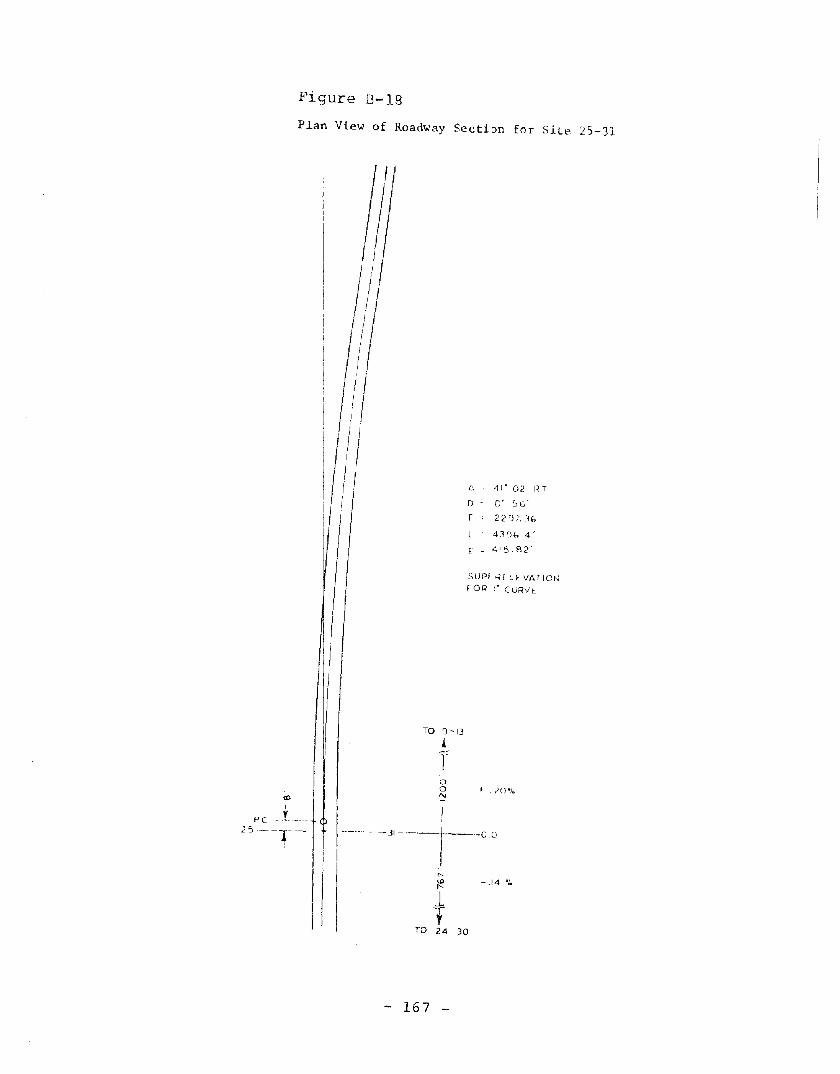
Figure B-18
Plan View of Roadway Section for Site 25-31
(', 41" 02 FIT
o 0" :,b'r 22'J7.3"
43'1'" 4'
E 0 415,82'
SUPERl c f VArlON
FOR I' CURVl
II
oo t ,20'1.N
TO ') -13
JT
"-~ -.14 .;.
tTO 24 - 30
I----]1--1 -0 ,0
II I
peL 125 -- --.r --I
I
- 167 -
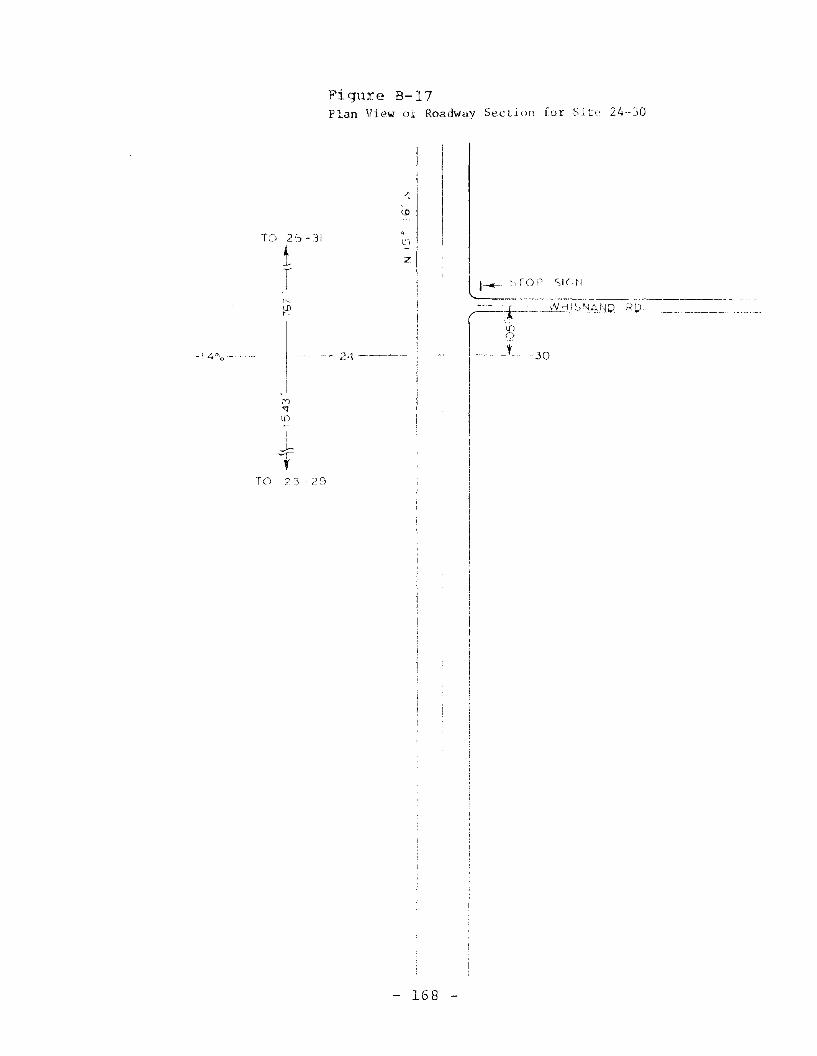
Fiqure B-17Plan View of Roadway Section for Silt, 24--30
TO 2'='-31
•J..-T:n I'z
Ii
I
ll---- '_, rop Sl(-~I
30-14°.'0---- ~ ----- ;~4 -----
i
+TO 23 -;~9
--. I__ ,",'H:::' NA~I" ""\,~ ~",,---,_J.L-
I ()i __:tI
I
- 168 -
APPENDIX C
SPEED LIMIT PRACTICES
SURVEY QUESTIONNAIRES

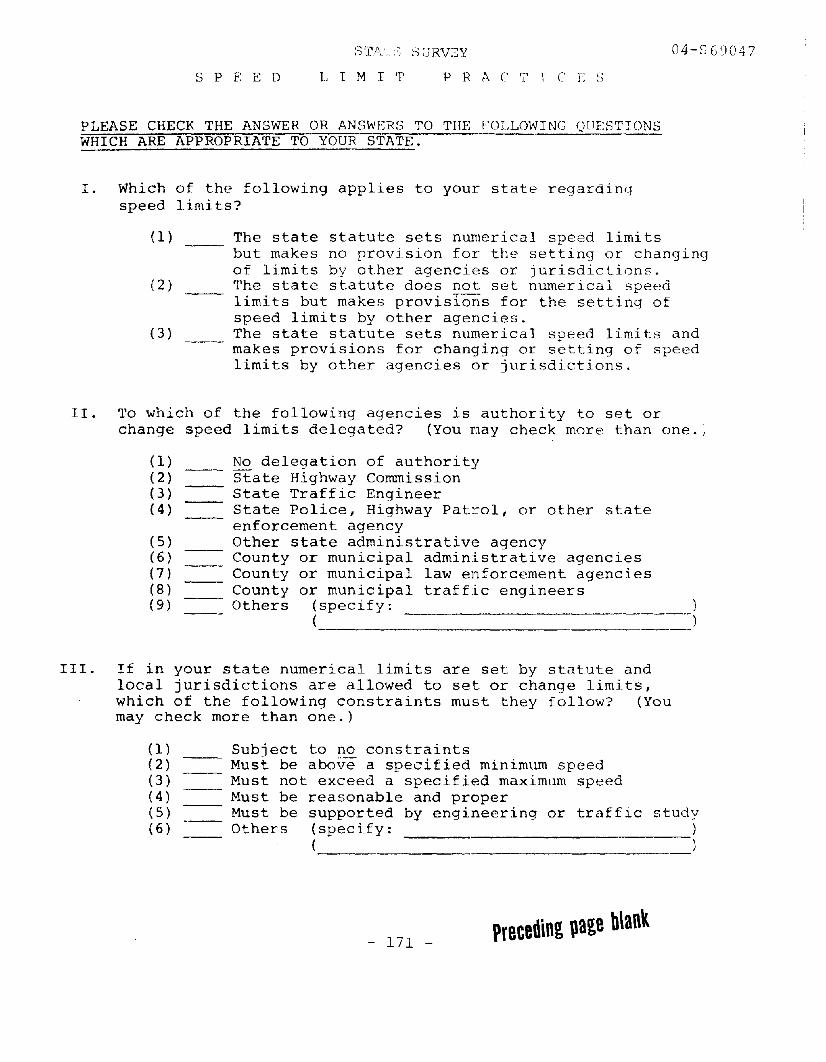
S PEE 0 LIM I T
SGRV2Y
P RAe T 1 C E S
04-S69047
PLEASE CHECK THE ANSWER OR ANSWERS TO THE FOLLOWING QUESTIONSWHICH ARE APPROPRIATE TO YOUR STATE.
I. Which of the following applies to your state regardingspeed limits?
(1) The state statute sets numerical speed limitsbut makes no provision for the setting or changingof limits by other agencies or jurisdictions.
(2) The state statute does not set numerical speedlimits but makes provisloIls for the setting ofspeed limits by other agencies.
(3) The state statute sets numerical speed limits andmakes provisions for changing or setting of speedlimits by other agencies or jurisdictions.
II. To which of the following agencies is authority to set orchange speed limits delegated? (You may check more than one.;
(1) No delegation of authority(2) State Highway Commission(3) State Traffic Engineer(4) State Police, Highway Patrol, or other state
enforcement agency(5) Other state administrative agency(6) County or municipal administrative agencies(7) County or municipal law enforcement agencies(8) County or municipal traffic engineers(9) Others (specify:
(--------------------
III. If in your state numerical limits are set by statute andlocal jurisdictions are allowed to set or change limits,which of the following constraints must they follow? (Youmay check more than one.)
(1) Subj ect to no constraints(2) Must be above a specified minimum speed(3) Must not exceed a specified maximum speed(4) Must be reasonable and proper(5) Must be supported by engineering or traffic study(6) Others (specify: )
( )
- 171 -preceding ~age b\an~
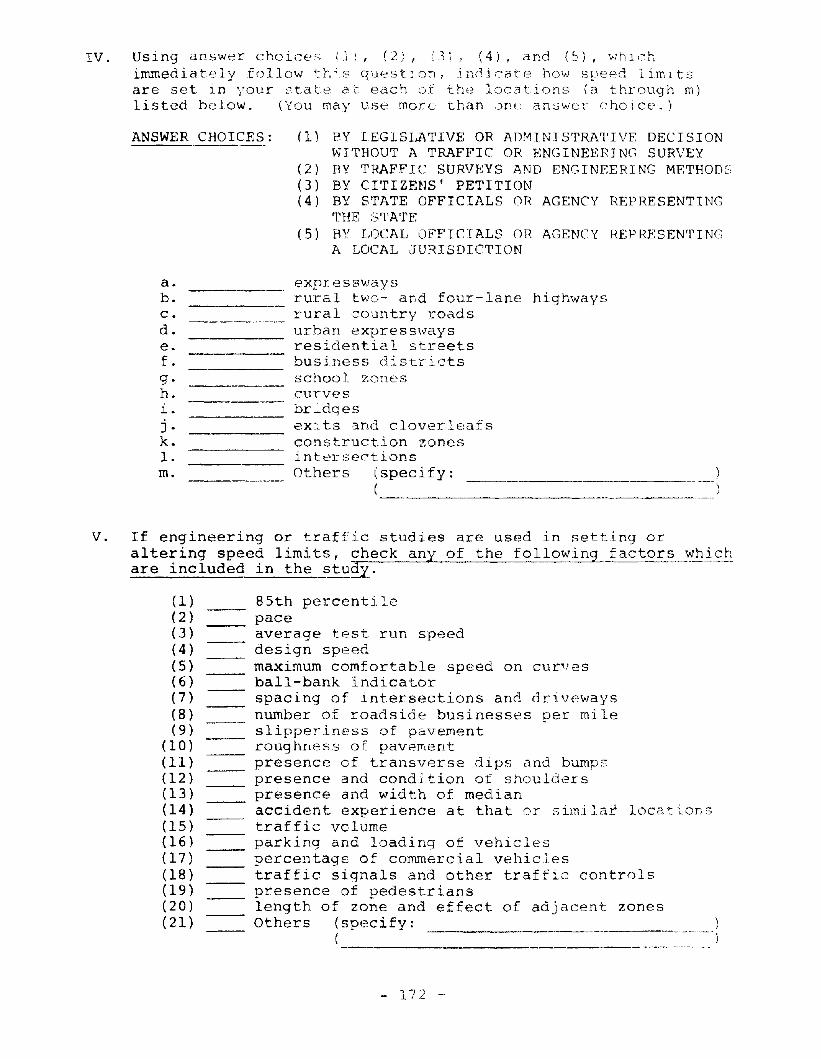
IV. Using answer choice~'; (1:, (2), ,:3), (4), and (5) I WhIChimmediately follow th;::: questJO;l, in0.icate hew speed limLtsare set In your state at each of the locations (a through m)listed below. (You may use more than one answer choice.)
-----------_.__._----_._-~ ..
ANSWER CHOICES:
a.b.c.d.e.f.g.h.i.j .k.l.m.
(1) BY LEGISLATIVE OR ADMINI STRA'l'IVB DECISIONWITHOUT A TRAFFIC OR ENGINEERINC-; SURVEY
(2) BY TRAFFIC SURVEYS AND ENGINEERING METHODS(3) BY CITIZENS' PETITION(4) BY STATE OFFICIALS OR AGENCY REPRESENTING
THE STATE(5) BY LOCAL OFFICIALS OR AGENCY REPRESENTING
A LOCAL JURISDICTION
expres sw,ay S
rural two- and four-lane highwaysrural country roadsurban expresswaysresidential streetsbusiness districtsschool zonescurvesbridgesexits and cloverleafsconstruction zonesintersectionsOthers (specify:
(
V. If engineering or traffic studies are used in setting oraltering speed limits, check any of the following factors whichare included in the stu~.
(1 )( 2 )( 3 )(4 )(5 )( 6)(7 )(8 )(9 )
(10 )(11)(12 )(13)(14 )(15)(16)(17 )(18)(19)(20)(21)
85th percentilepaceaverage test run speeddesign speedmaximum comfortable speed on curvesball-bank indicatorspacing of intersections and drivewaysnumber of roadside businesses per mileslipperiness of pavementroughness of pavementpresence of transverse dips and bumpspresence and condition of shoulderspresence and width of medianaccident experience at that or similat locationstraffic volumeparking and loading of vehiclespercentage of commercial vehic1estraffic signals and other traffic controlspresence of pedestrianslength of zone and effect of adjacent zonesOthers (specify:
(
- 172 -
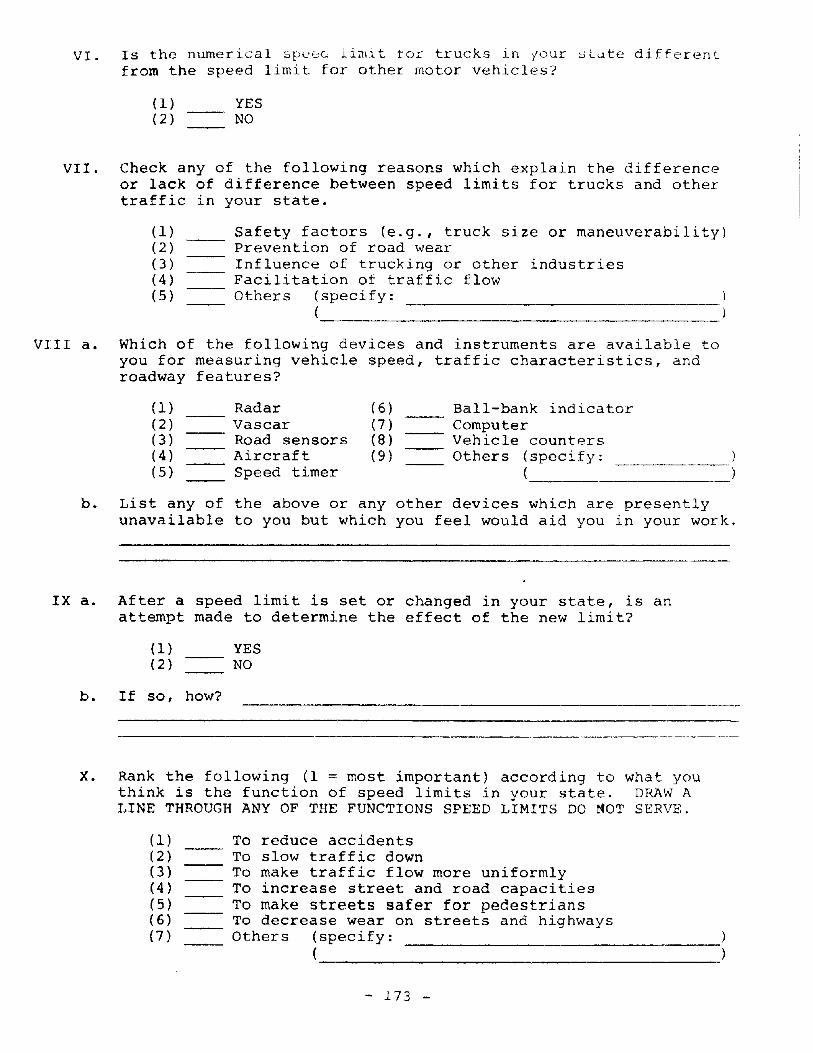
VI. Is the numerical spc,-:;Q limit tor trucks in your st<.1te differentfrom the speed limit for other motor vehicles?
(1) YES(2) NO
VII. Check any of the following reasons which explain the differenceor lack of difference between speed limits for trucks and othertraffic in your state.
(1) Safety factors (e.g., truck size or maneuverability)(2) Prevention of road wear(3) Influence of trucking or other industries(4) Facilitation of traffic flow(5) Others (specify:
(------_._-----------
VIII a. Which of the following devices and instruments are available toyou for measuring vehicle speed, traffic characteristics, androadway features?
(1)(2 )(3 )(4 )(5)
Radar (6)Vascar (7)Road sensors (8)Aircraft (9)Speed timer
Ball-bank indicatorComputerVehicle countersOthers (specify:
(-----------
b. List any of the above or any other devices which are presentlyunavailable to you but which you feel would aid you in your work.
IX a. After a speed limit is set or changed in your state, is anattempt made to determine the effect of the new limit?
(1) YES(2) NO
b. I f so, how?
X. Rank the following (1 = most important) according to what youthink is the function of speed limits in your state. DRAW ALINE THROUGH ANY OF THE FUNCTIONS SPEED LIMITS DO rtOT SERVE.
(1) To reduce accidents(2) To slow traffic down(3) To make traffic flow more uniformly(4) To increase street and road capacities(5) To make streets safer for pedestrians(6) To decrease wear on streets and highways(7) Others (specify:
(--------------------
- 173 -
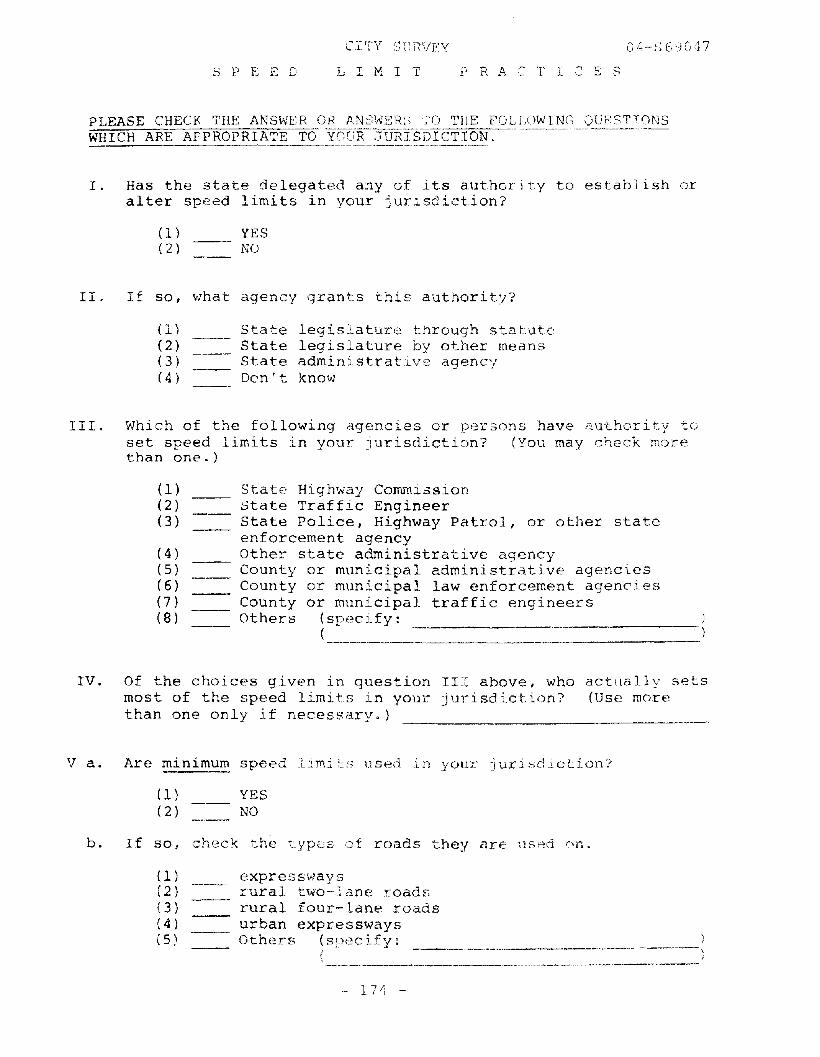
S PEE D LIM I T P R A ~ TIC S S
04-S6JC47
PLEASE CHECK THE ANS~I/ER OR ANSh'ER;; TO THE FOLLOWING OUES'1'TONSWHICH ARE APPROPRIA~E T(5~·YOtTR-~·~:JlTRI SDl~(~TION~-·-···~~-'--·- _ _.__._-_ _--
I. Has the state delegated any of its authority to establish oralter speed limits in your jUTlsdiction?
(1) YES(2) NO
II. If so, what agency grants this authority?
(1) State legislature through statute(2) State legislature by other means(3) State administrative agency(4) Don't know
III. Which of the following agencies or persons have authority toset speed limits in your jurisdiction? (You may check morethan one.)
--_._----------
(1 )(2)(3)
( 4 )( 5 )( 6 )(7 )(8 )
State Highway CommissionState Traffic EngineerState PolicE~, Highway Patrol, or other stateenforcement agencyOther state administrative agencyCounty or municipal administrative agenciesCounty or municipal law enforcement agenciesCounty or municipal traffic engineersOthers {specify:
(
--------------
IV. Of the choices given in question III above, who actually setsmost of the speed limits in your jurisdiction? (Use morethan one only if necessary.)
V a. Are minimum speed limits used .in your- jurisdiction?
(1) YES(2) NO
b. If so, check the types of roads they are used on.
(I) express'i,]ays(2) rural two-lane roads(3) rural four-lane roads(4) urban expressways(5) Others (spec ify: .. __ .. __...._. . _
{
"--_.._-----.- 174 -
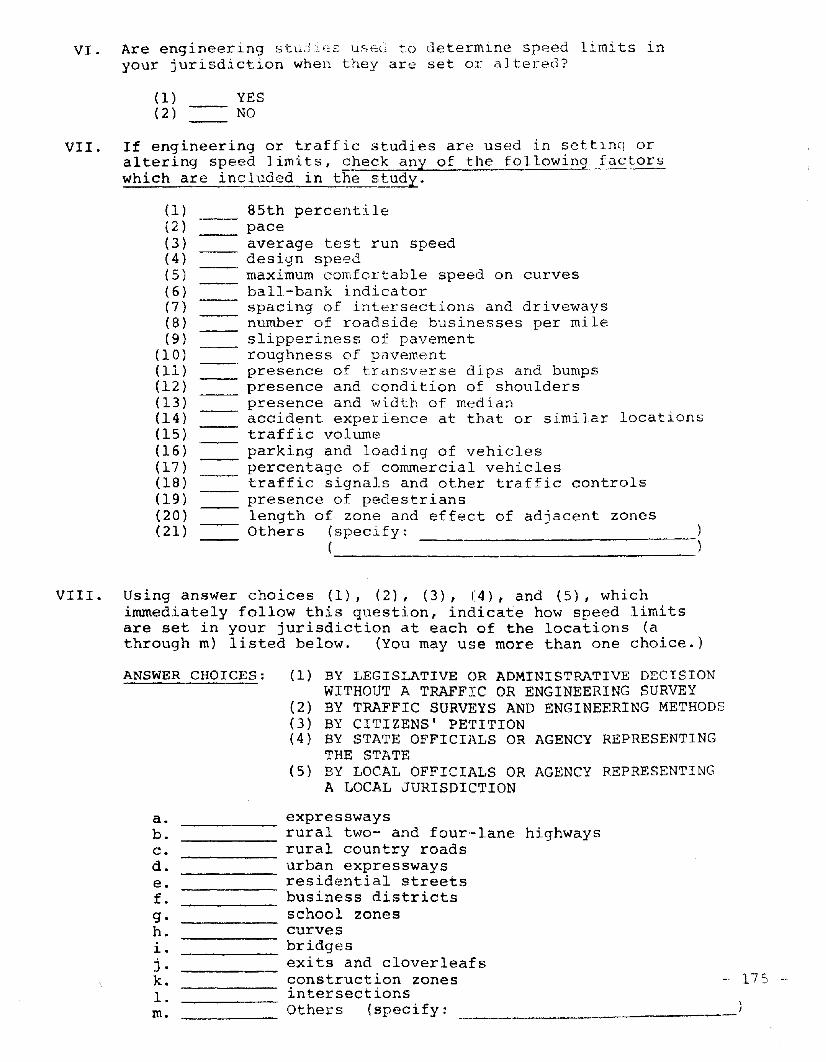
VI. Are engineering studIes useG to determine speed limits 1nyour jurisdiction when they are set or altered?
(1) YES(2) NO
VII. If engineering or traffic studies are used in settinq oraltering speed limits, cheek any of the following factorswhich are in~luded in the study.
(1) 85th percentile(2) pace(3) average test run speed(4) design speed(5) maximum comfortable speed on curves(6) ball-bank indicator(7) spacing of intersections and driveways(8) number of roadside businesses per mile(9) slipperiness of pavement
(10) roughness of pavement(11) presence of transverse dips and bumps(12) presence and condition of shoulders(13) presence and width of median(14) accident experience at that or similar locations(15) traffic volume(16) parking and loading of vehicles(17) percentage of commercial vehicles(18) traffic signals and other traffic controls(19) presence of pedestrians(20) length of zone and effect of adjacent zones(21) Others (specify:
(------------------
VIII. Using answer choices (1), (2), (3), (4), and (5), whichimmediately follow this question, indicate how speed limitsare set in your jurisdiction at each of the locations (athrough m) listed below. (You may use more than one choice.)
ANSWER CHOICES: (1) BY LEGISLATIVE OR ADMINISTRATIVE DECISIONWITHOUT A TRAFFIC OR ENGINEERING SURVEY
(2) BY TRAFFIC SUR~~YS AND ENGINEERING METHODS(3) BY CITIZENS' PETITION(4) BY STATE OFFICIALS OR AGENCY REPRESENTING
THE STATE(5) BY LOCAL OFFICIALS OR AGENCY REPRESENTING
A LOCAL JURISDICTION
a.b.c.d.e.f.g.h.~.
j .k.1.m.
expresswaysrural two- and four·-lane highwaysrural country roadsurban expresswaysresidential streetsbusiness districtsschool zonescurvesbridgesexits and cloverleafsconstruction zonesintersectionsOthers (specify:
- 175 --
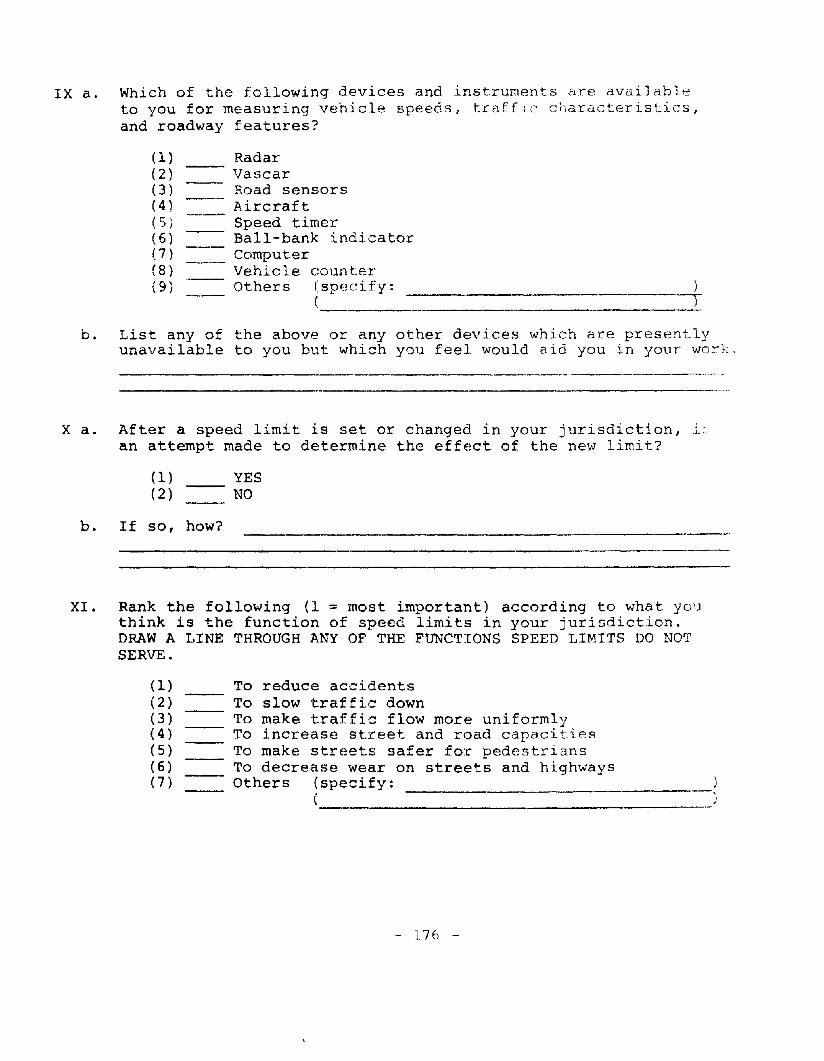
IX a. Which of the following devices and instruments are availableto you for measuring vehicle speeds, traffIc characteristics,and roadway features?
(1)(2 )(3)(4)( 5)(6 )(7 )(8)(9 )
RadarVascarRoad sensorsAircraftSpeed timerBall-bank indicatorComputerVehicle count:erOthers (specify:
(----------)
-j
b. List any of the above or any other devices which are presentlyunavailable to you but which you feel would aid you in your work.
---- -------------
X a. After a speed limit is set or changed in your jurisdiction, l~
an attempt made to dE~termine the effect of the new limit?
(1) YES(2) NO
b. If so, how?
XI. Rank the following (1 = most important) according to what youthink is the function of speed limits in your jurisdiction.DRAW A LINE THROUGH ANY OF THE FUNCTIONS SPEED LIMITS DO NOTSERVE.
(1) To reduce accidents(2) To slow traffic down(3) To make traffic flow more uniformly(4) To increase street and road capacities(5) To make streets safer for pedestrians(6) To decrease wear on streets and highways(7) Others (specify:
(
- 176 -
APPENDIX D
DATA TABLES FOR
SPEED LIMIT SURVEY RESPONSES

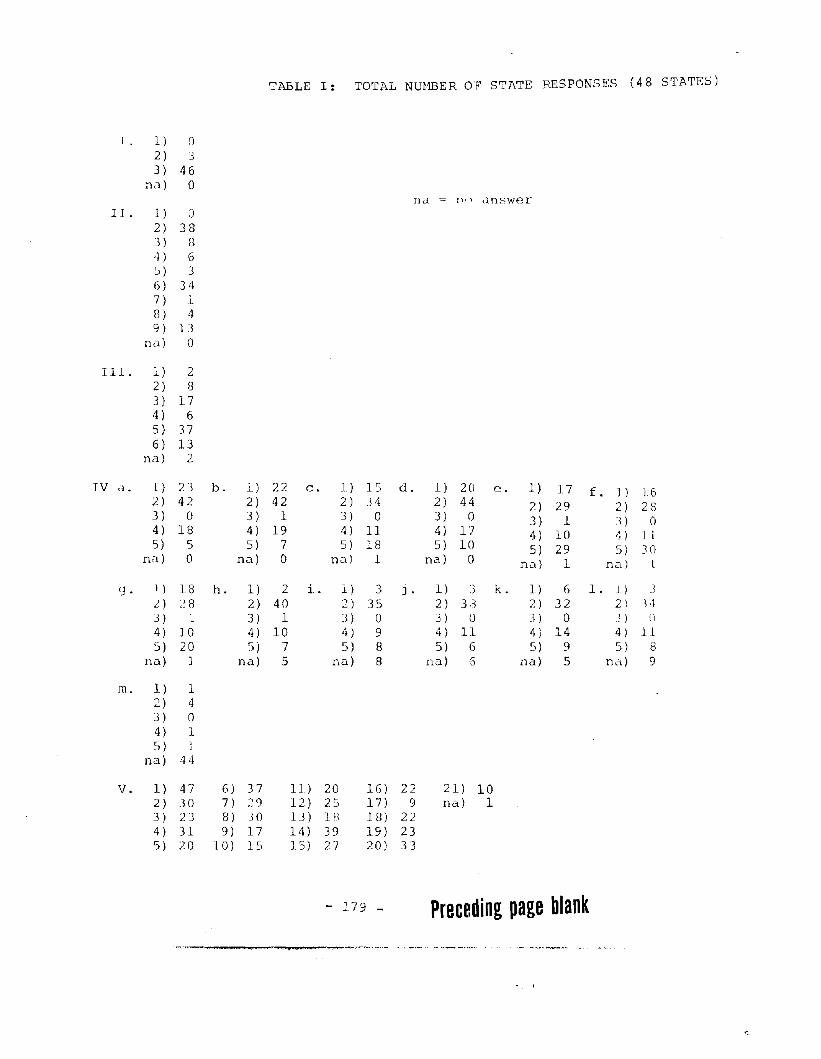
TABLE I: TOTAL NUHBER OF STATE RESPONSES (48 STATES)
I. 1 ) 02) 33 ) 46
nLl) 0na 11' ) answer
II. 1) D2 ) 383) 84 ) 65) 36) 347 ) 18 ) 49 ) 13
na) 0
III. 1) 22 ) 83 ) 174) 65) 376 ) 13
na) 2
IV d. 1 ) 23 b. 1) 22 c. 1) 15 d. 1) 20 e. 1) 17 f. 1 ) 162) 42 2) 42 2 ) 34 2 ) 44 2) 29 2) 283) 0 3 ) 1 3) 0 3) 0 3) 1 3 ) 04) 18 4) 19 4 ) 11 4) 17 4) 10 4 ) 115) 5 5) 7 5) 18 5) 10 5) 29 5) 30
na) 0 na) 0 na) 1 na) 0 na) 1 na) 1
g. 1 ) 18 h. 1) 2 i- 1) 3 j. 1) 3 k. 1) 6 l. 1) J.2 ) 28 2) 40 ')' 35 2) 3:3 2) 32 2 ) 14~ )
3 ) L 3) 1 3) 0 3 ) I) 3 ) 0 3 ) 11
4) 10 4 ) 10 4 ) 9 4) 11 4) 14 4 ) 115) 20 5) 7 5) 8 5) 6 5) 9 5) 8
na) ] na) 5 na) 8 na) 6 na) 5 na) 9
m. 1) 12) 43 ) 04) 15) 1
na) 44
v. 1) 47 6) 37 11) 20 16) 22 21) 102 ) 30 7) :'9 12 ) 25 17) 9 na) 13 ) 23 8) 30 13) 18 18) 224 ) 31 9) 17 14 ) 39 19) 235) 20 10) 15 15) 27 20) 33
- 179 - Preceding page blank
• ,I
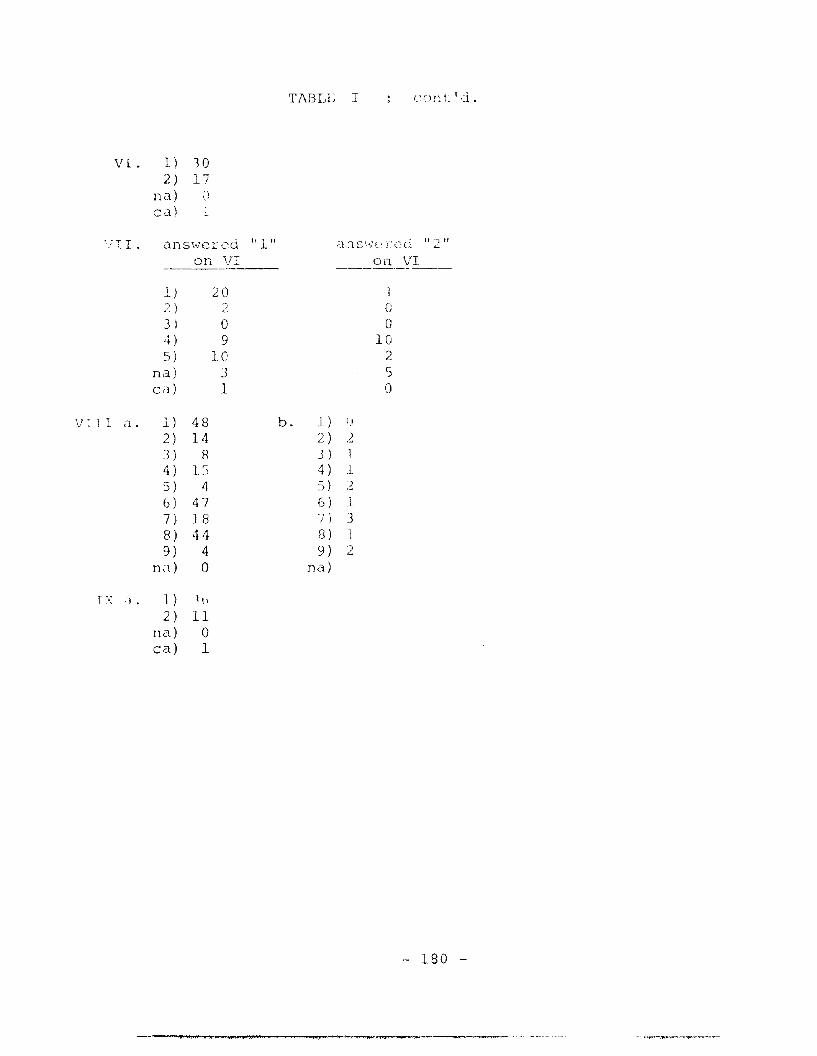
TABLE I cont'd.
VI. 1) 102 ) 17
na) ')u
cal 1
"JT I . ans,"vcrcd "I"on VI
..-
1) 20/ \ 2~ I
J) 04 ) 95) 10
na) 3cal 1
VIII a. 1) 48 b.2) 143 ) 84 ) 155 ) 46 ) 477) 188) 449) 4
n;\ ) 0
TV ,1 • 1) l f)"
2 ) 11na) 0cal 1
'" _iii _"._~IiI.
on VI
oo
102
o
J) I)
2) .23) ]4) 15) :26) 17) 38) 19) :2
na)
- 180 -
to
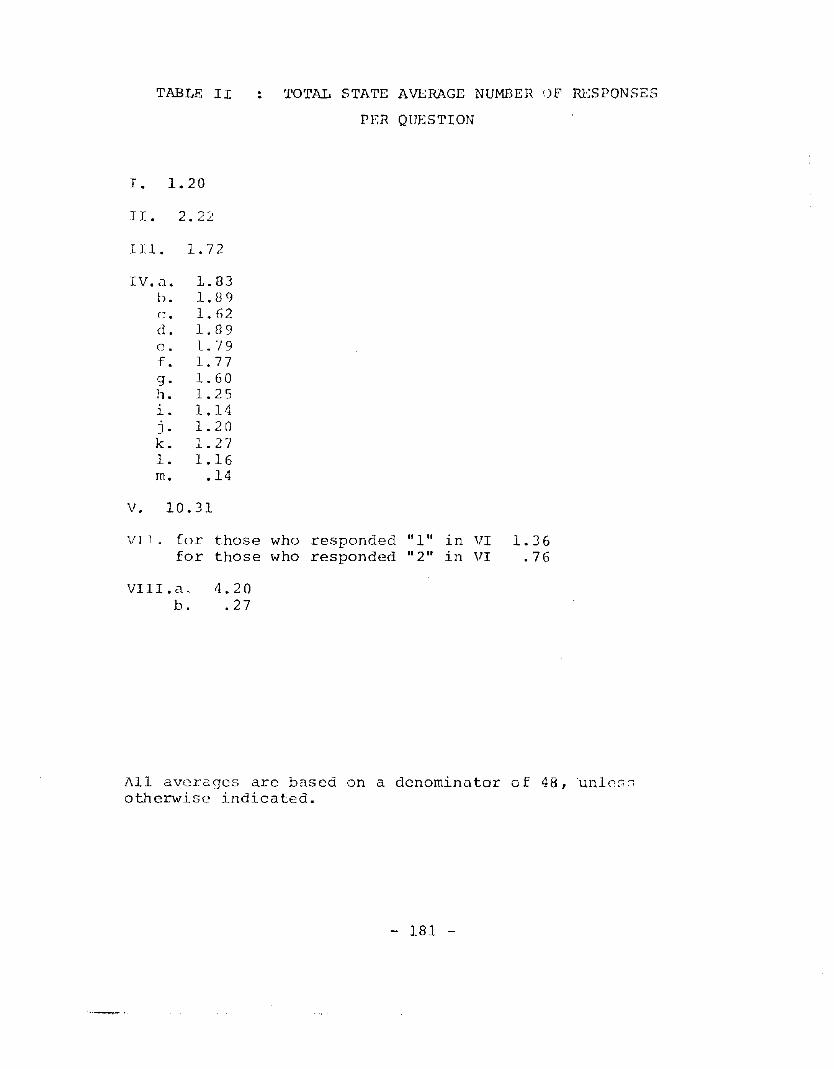
TABLE II
I . 1. 20
II. 2.22
III. 1. 72
IV. u.. 1.83b. 1. 89c. 1. 62d. 1. 89c. 1. 79f- lo 77g. 1. 60h. 1. 25i. 1.14j. 1. 20k. 1. 271. 1.16m. .14
V. 10.31
TOTAL STATE AVERAGE NUMBER UF RESPONSES
PER QUESTION
\111. for those who responded "1" in VIfor those who responded "2" in VI
1. 36.76
VIII. a.,b.
4.20.27
All averages are based on a denominator of 48,unlc~~
otherwise indicated.
- 181 -
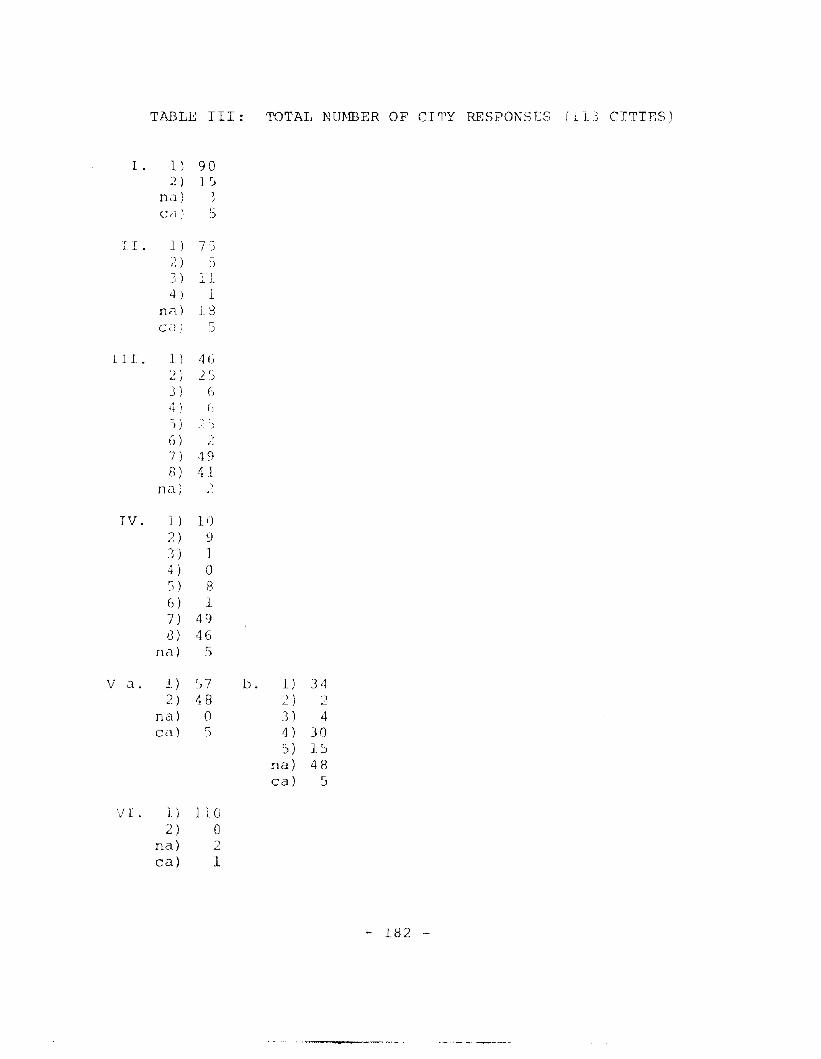
TABLE III: 'roTAL NU]\1BER OF CITY RESPONSES (l13 CITIES)
I . 1 ) 902) 1 r- )
na) 1;
C;l,\ 5
T T 1 ) 7'j...L ,.....
;; ) ~)
] ) 114 ) 1
nn. ) 13Cd: 5
II I . 1) 46:2 ) 2 rj
3 ) 6it ) fJCj) 26 ) ",
~'~
7 ) ,19ti) 41
na) )
TV. 1) 102) 9J) 14 ) 0') ) 8G) 17) 498) 46
na) r-J
V .:1. 1 ) ':J7 b. 1) 312) 48 2 ) 2
na) 0 3 ) 4cal 5 4 ) 30
5) 15na) 48cal 5
V I. 1 ) JI02) 0
na) 2cal 1
- 182 -
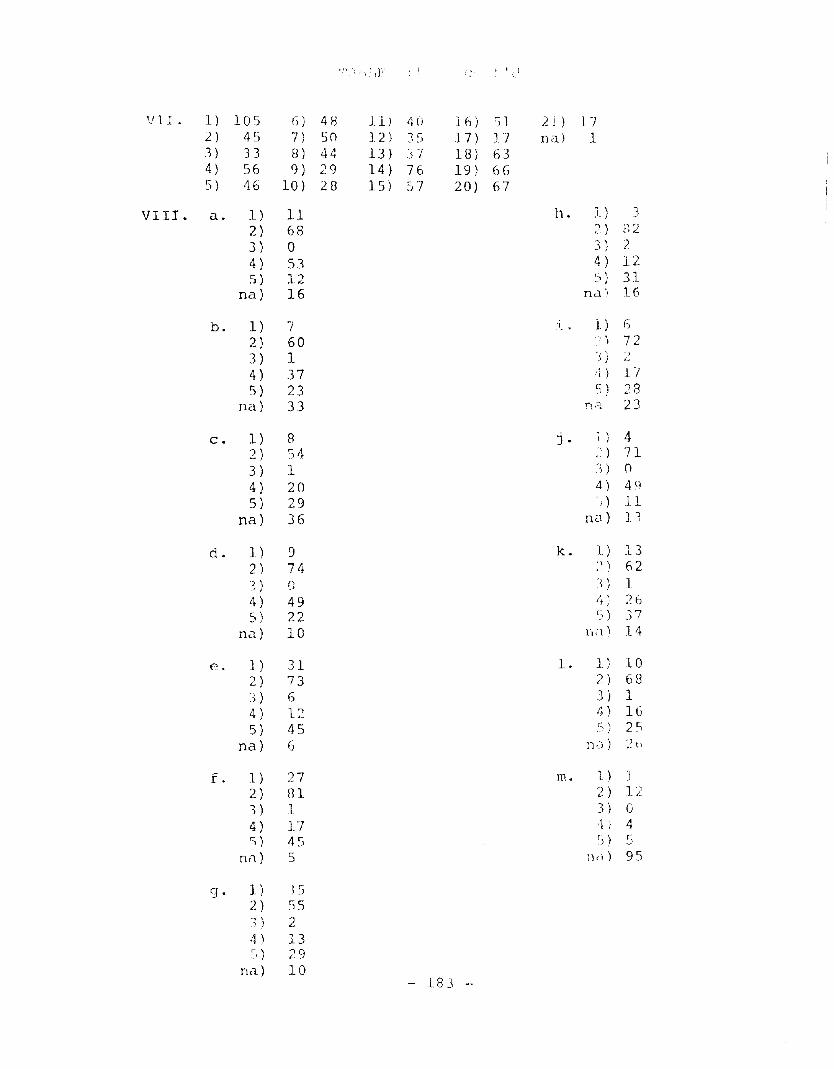
·-r',:). !.;': all' , W,l
VII. 1 ) 105 6) 48 11 ) 4U J 6) ')] 2 J ) 1 "12) 45 7 ) 50 12) 35 17) 17 na) 13 ) 33 8) 44 13) ~n 18) 634 ) 56 9) 29 14) 76 19) 665 ) 46 10) 28 15 ) 57 20) 67
VIII. a. 1) 11 h. 1) :I2) 68 2) () )
c) ~
3) 0 1\ 2- I
4 ) 53 4 ) 125) 12 :':' ) 31
na) 16 na', 16
b. 1) 7 l. 1) G2) 60 ~' ) 723 ) 1
"
) ) ,-4) 37 ,1 ) 175) 23 S) 28
na) 33 '!\;:l 23
C. 1) 8 j . 1 , 4I I
2) 54 " ) 713 ) 1 3 ) ()
4 ) 20 4 ) 4CJ5) 29 '.' ) J1
na) 36 na) 13
d. 1) 9 k. 1) 132 ) 74 :) ) 62
n r; '1) ]
4) 49 ,1 ) 26C,\ 22 r~ ) 37- I
na) 10 11,1 ) 14
c. ] ) 31 1- 1. ) 102) 73 2 ) 683 ) 6 3 ) 14 ) 12 'f ) 165 ) 45
c' , 25._-~ ,;
na) 6 na) 2l.'
f. 1 ) 27 In. 1 )2) 81 2) 123 ) 1 3) 0
4) 17 /1 'i 45) 45
r' \ 5') }
ni'1) 5 nd) 95
g. 1 ) 352) 553 ) 24 ) 13:, ) 29
na) 10- 183 --
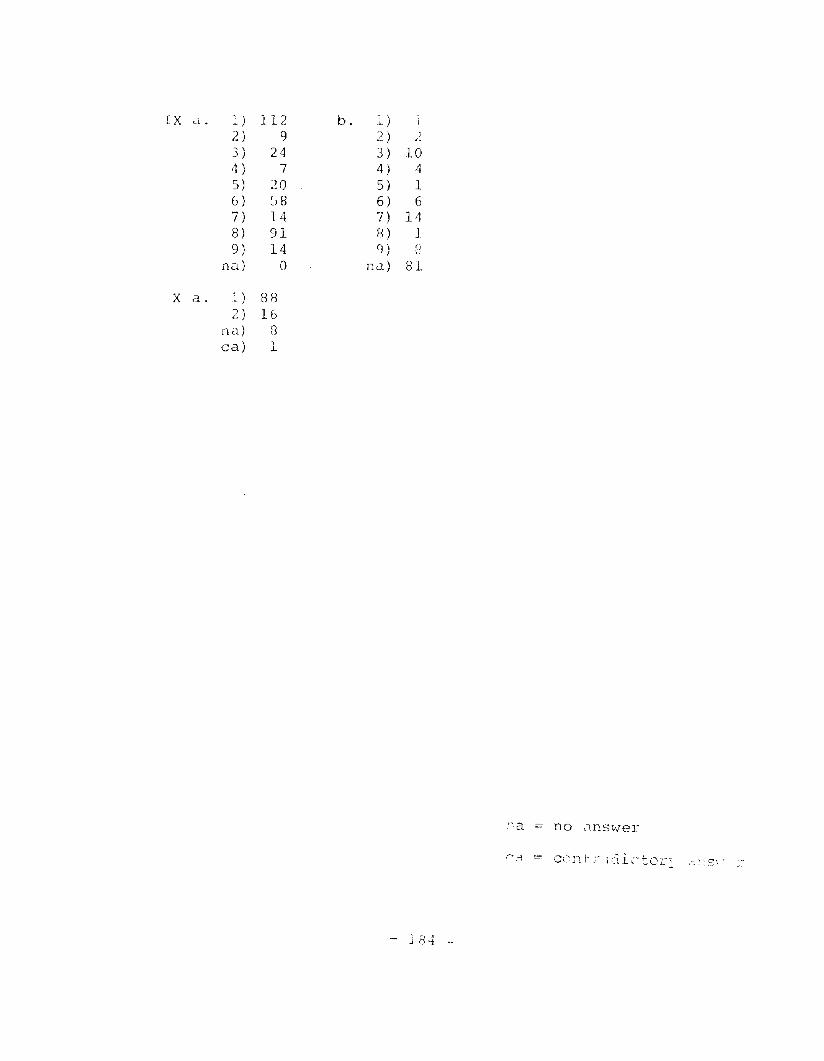
IX u. • 1 ) 112 b. } )2 ) 9 2 ) )
L.
3 ) 24 3 ) 101 ) 7 4 ) 45) 20 5) 16 ) ~) 8 6) 67) 14 7) 148) 91 8) J9) 14 q\ Q
.. I
na) 0 nd) 81
X a. 1 ) 882 ) 16
n21) 8cal
,.L
na == no ,lnswer
C',~ - CC)1-1tr~-1;~lictor-'C. _ s,,' v"
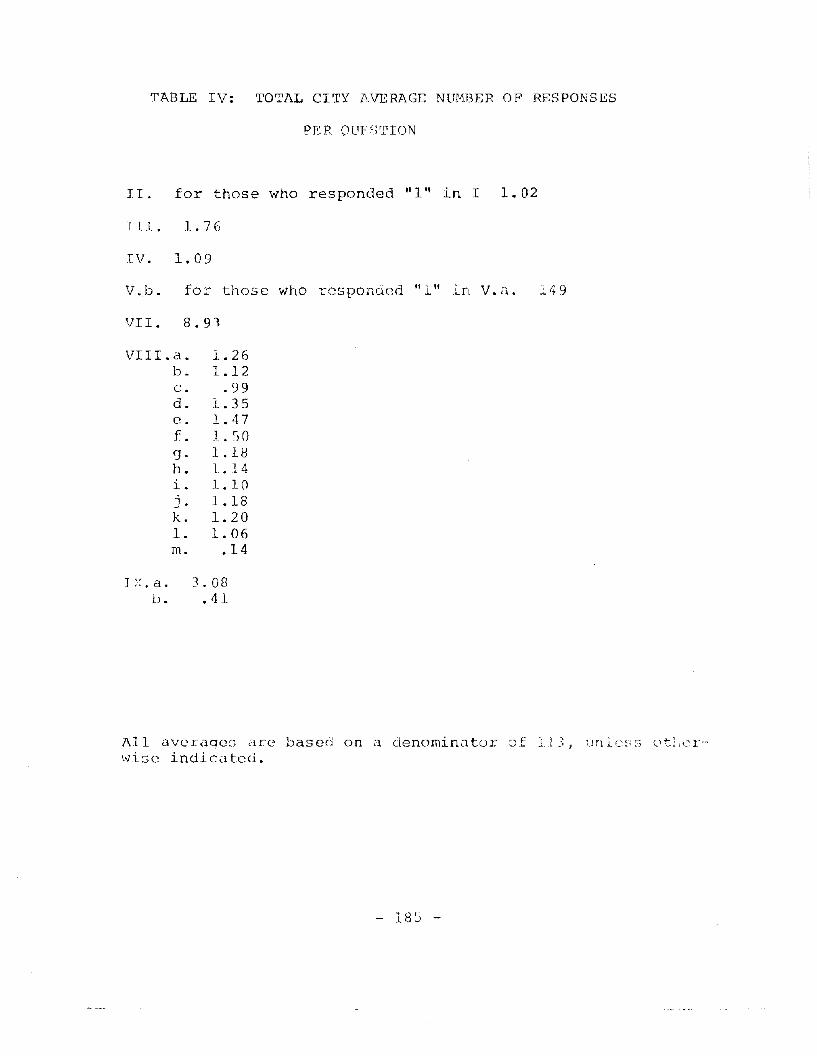
TABLE IV: TOTAL CITY AVERAGe NUMBER or RESPONSES
PER QUFc)TION
II. for those who responded "1" in I 1. 02
1 11 • 1. 76
IV. 1. 09
V.b. for those who responded Ii 1" in V.a.. 149
VII. 8.91
VIII.a. 1. 26b. 1.12c. .99d. 1. 35e. l. 47f. 1. :)0g. 1.18h. 1.14i- l.10j . 1.18k. 1. 201. 1. 06m. .14
I )~ . a. 3.08b. .41
All averages are based on a denominatorwise indicated.
- 185 -
tJ Tl 1C ~-~ ~; otl,,~r--
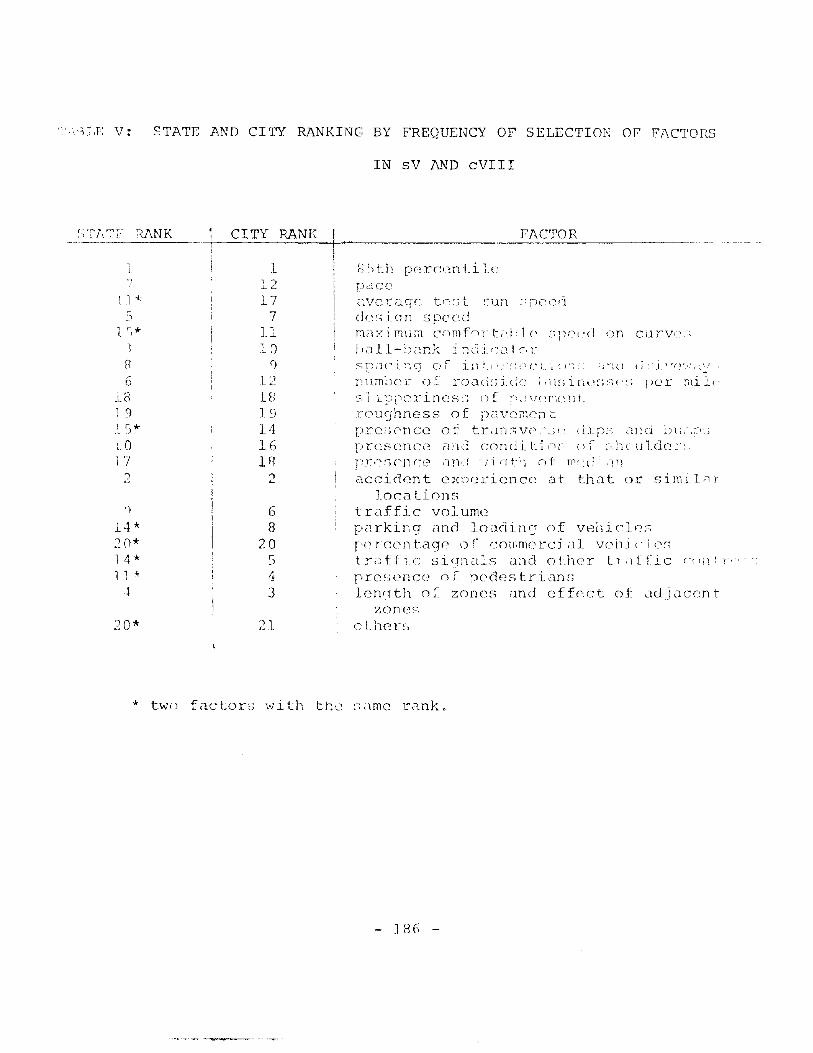
STATE AND CITY RANKHrC BY FREQUENCY OF SELECTION Of' FACTORS
IN sV AND eVIII
FACTOR._--------
roughness of pavcmcncprc:;cncc of trdn:;V0, L)C dLP~; dnu "),L,
presence und coneJition uf :~hc,uldc;
pr'~~,('n(~c: ,In']1icPh of rn,-(] '111
acciaent experience at that or similarlocations
traffic volumeparking and 1oac1in<; of vf:hicle:-;['c'rccntagc of con;mercj ,11 vc:hj (' i C'S
traffic sion,ds and other tr,lffic ('illlt"
presence of ?cdestrians1en0th of zones and effpct of adjacent
zonesot her~;
17
11'"
1 .- *, )
86
j,8
] 9
LO17
2
')
14*20*14*1 1 '"
,~
20*
CITY RANK
11217
71110
C)
121819141618
2
68
20543
21
I-i 85th percentile
paceavcraqc b-::;t run ";"c,-:,d(los icm speednaximum com for tid) 1 c :;1'(" ',l onl)iJ 11-bank j :ldjr'Ll1 ('> l"
~~,r)~1(~in(J of in t.f',:-::{1Ci.._-. '~)il.. ,:.lfl(l
III 1mlJor () f r () a (i ~:) i (1 c' ; I t I ~-~ i Ci t.~ S ~:; ( ~ ~ ~
~::. ]L I) [)(~ l~ i n.c; s:~ () f r) d '/(" rk.!- 11 1..
curve";
d :·.l"'l:1(~·.·,'(i·1
pc'r mil-,·
* two factors with the :C;dmc r<l.nk.
- 186 -
APPENDIX E
SELECTED SPEED DISTRIBUTIONS
FROi·l THE IRPS SENSOR SYSTEH

I.n INTPODUCTION
The purpose of this ~ppendix is to nlve the reader some
insight into traffic flow Lehavior. As described in Appendix
B, the computer sensor system records the speed, headway,
length, and direction of every vehicle passing over a sensor
loop. It is thus possible to obtain histograms showing the
entire population of vehicle speeds for a given time interval.
~ach histogram in this appendix gives the speeds of the entire
population of vehicles passing over one loop durinq one time
interval; the loop and the time interval are shown at the
top of the histogram.
The data are presented ln three groupings. Section 2.0
shows how the speed distributions vary with time at a given
sensor site. Section 3.0 demonstrates how the distributions
;il.rv with sensor site location over a single time period.
Curves showing various other effects of interest are included
_:_" section 4. O.
). 0 TEJ\1PORAL DISTRIBUTIONS
This section shows how speed distributions vary with
time, first hy time of day, then by day of week.
2.1 Distribution by time of day
The speed distributions of Figures £-1 through E-12
;how the speeds in a series of sequential bvo-hour time inter
vals covering the day of November 6 I' 1969, at loop 5i te 10.
Loop 10 measures traffic ln the southbound lane of Indlana
- 189 -Preceding page blank
S t2tC I!lCfhway No. 37, north of Bloomington.
th(~ top of a lonq straiqht downhill scotton (for southbound
trdffic) 'tIhich contain:; a pa~;:;ing zone for northbound trdffic.
It lies 11I1eJ'lldy through a lonq curve which tenninates in the h
section just mentioned. The road is 24' concrete, and the> ,;p,
i.rni t is 65 mph G FiqureE-l
others are sequentially !'!umbC'rC:?d thereaft~er.
:\lovember 6, the road scLeface \las dry.
'1'11 rc) 1.1 ut
Tr1e effects of rll~~:h hOLl~- traffic ~;ho',,'\:'"uF;' c:: (~(J:L-~
also noteworthy that a L::LJ~crer percentaol: of' traffic i~; 1;J1
five mph of the mean speed at the high volume traffic conol
than at conditions of 10\',/ volume traffic.
Rain occurred throuqhout the day on November 11 1'i en: rc:::',
£-13 and E-14 taken on November 13 I in contrast to FiJf\lrcc;
E-5 and £-6 (the same time periods but on November 6) shu,,!
a distinct drop (Smph) in mean speed as well as a distinct
drun in volume (about 60 vehicles durinq this time period ., -
The speed distributions of Figures r:-15throuqh - 21
how the s~eeds vary 1n an Indiana winter week.
{.-lutions, aq~in taken from sensor ~~ite 10, S110W "Lnc sne rjc:
between 0930 and 1130, starting with Sunday, Noverrher ),
and con c 1 udin q \'li th Saturday, ~10\TCrlbF;rl''j, ") i.
during this week was \raried - the roac1~3 were ury !JCp :~unda~'
- 190 -
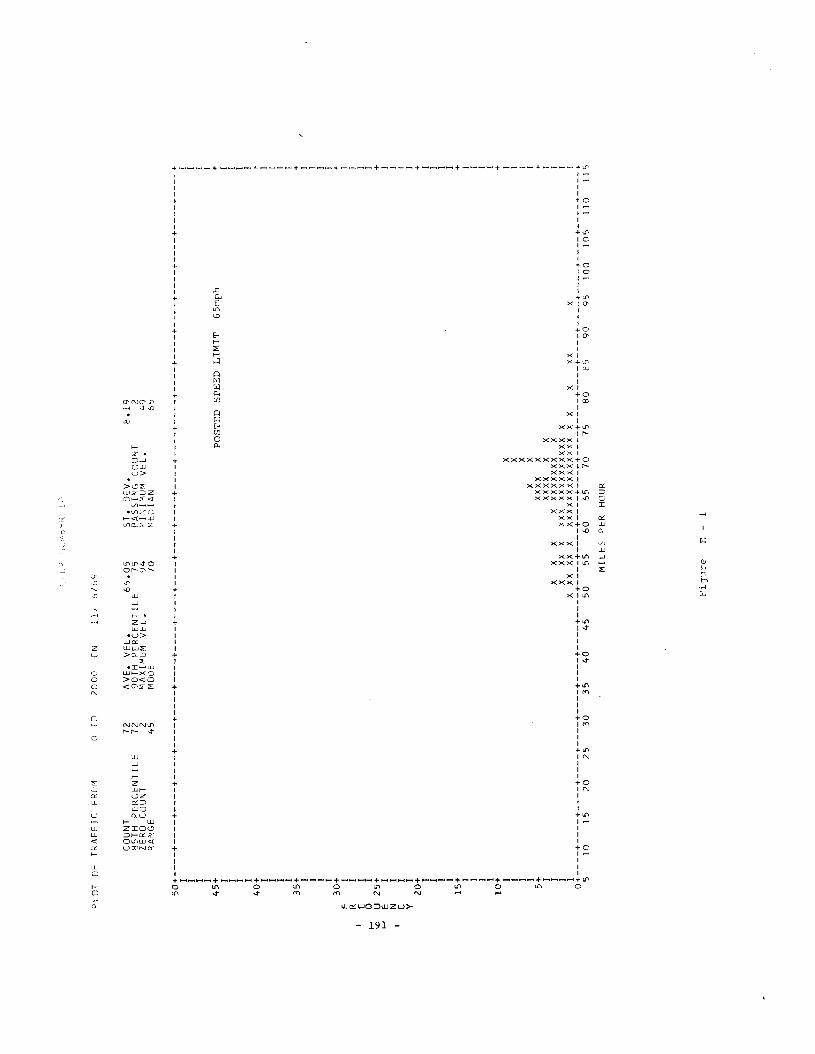
PLO
TO
FT
RA
FF
ICFR
UM
oTD
20
00
ON
LIiL
,t)F>
<.!
('
11
/6
/69
CO
UN
T85
TH
PER
CE
NT
!LE
ZER
OC
OU
NT
RA
NG
E
72 722
45
AV
E.
VE
L.
66
.05
90T
HP
ER
CE
NT
ILE
75M
AX
IMU
MV
EL
.9
4M
ODE
70
ST
.D
EV
.P
AS
SIN
GC
OU
NT
eilN
IHlJ
MV
EL
.flE
DI
AN
8.1
9 249 6
5
e-' '"e-'
50+----+----+----+----+----+----+----+----+----+----+----+----+----+----+----+----+----+----+----+----+-----
+---~+
II
II
II
II
45
+PO
STE
DSP
EE
DL
IMIT
65m
ph+
II
II
II
II
40
++
II
II
I[
II
35
++
II
II
II
II
30
++
FI
IR
II
EI
IQ
II
U2
5+
+E
II
NI
IC
I!
YI
I2
0+
+I
[I
II
II
I1
5+
+T
Ij
II
II
I1
0+
+I
XJ
IX
JI
XI
IX
XJ
5+X
XX
XX
+I
XXXX
XX
JI
XX
XX
XX
XX
XX
XX
JI
XXX
XXX
XX
XX
XX
XX
XX
XX
JI
XXX
XXX
XX
XX
XX
XX
XX
XX
XX
XX
XXX
XI
0+
----+
----+
----+
----+
----+
----+
----+
----+
----+
----+
----+
----+
----+
----+
----+
----+
----+
----+
----+
----+
----+
----+
51
01
52
025
30
35
40
45
50
55
60
657
07
58
085
90
951
00
10
51
10
lIS
MIL
ES
PER
HO
UR
Fig
ure
E-
1
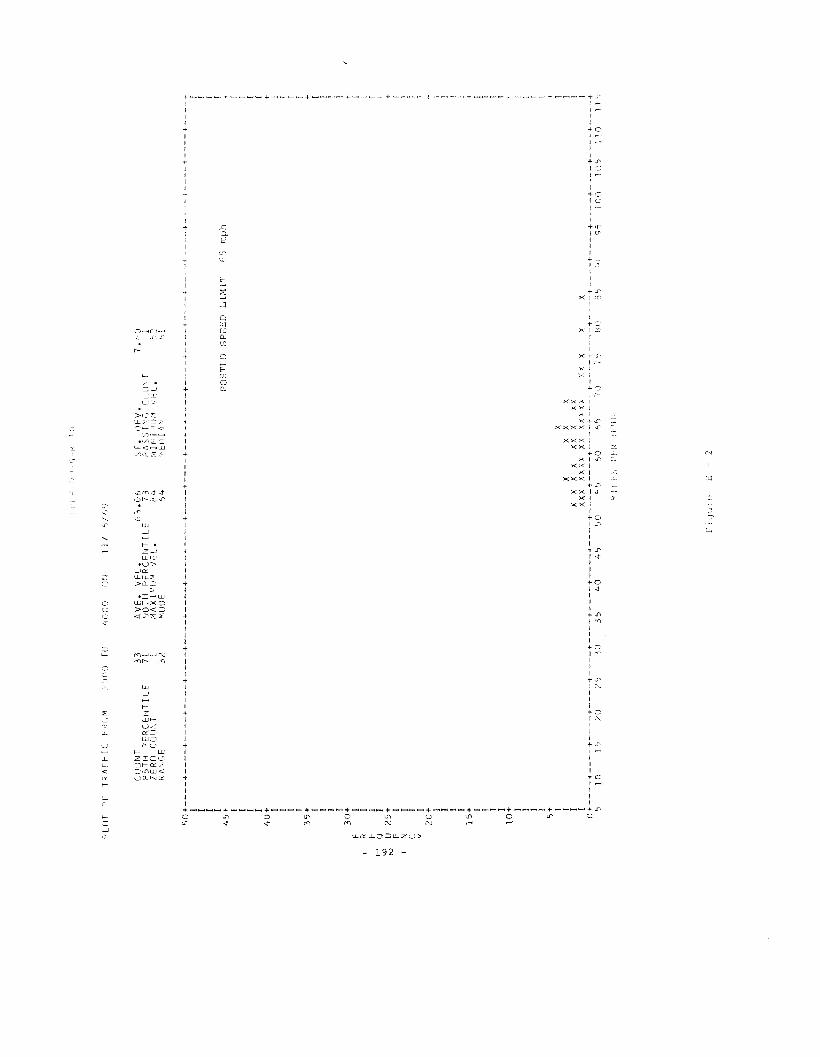
1_-I
III
I~'~"
I!
.;\
1-<~:I
PL
iIT
rlF
TP
AF
FI
CF
1([
JM
/Il(
)()
Til
{to
DO
rl~-J
III
hlh
Y
cnU
NT
R5T
HP
ER
CE
NT
ILE
ZE
RO
CU
IJN
TR
AN
GE
33
71 I
32
AV
E.
VE
L.
h3
.06
90T
HP
ER
CE
NT
ILE
73nA
XIH
lJM
VE
L.
84
~DDE
64
ST
.')
'SC
r~~~,f
'E
:i1I
7.1
'0 1~-
2hI
+ I I IX
XX
X!
t--·-+
----+
----+
----+
----+
----+
-·---+
----+
---·-i·
70
75
15
95
10
0](
)51
10
l)~! 1 + I I I I1 J + j I I I + I r I i ...
-+
----+
----+
----+
I j
POST
LD
SPE
ED
LIM
IT65
mph
55x
XX
XX
XX
xxX
XX
XX
XX
60
50+----+----+----+----+----+----+----+----+----+----+-
---+----+----+----+----+----+----~-----+--
I I I I4
5+ I I I I
40
+ I I I I3
5+ I I I I
30
+F
IR
IE
II-
'Q
I~
U2
5+
EI
NI
CI
YI
20
+ I I I I1
5+ I I I I
10
+ I I I I5
+ I IX
IX
XX
XI
XX
XX
XX
X0
+----+
-----+
----+
----+
----+
----+
----+
----+
----+
----+
--
51
01
52
02
53
03
54
04
55
05
5
M1 !
fP
Fl_
]UL
e1..:
..-
L
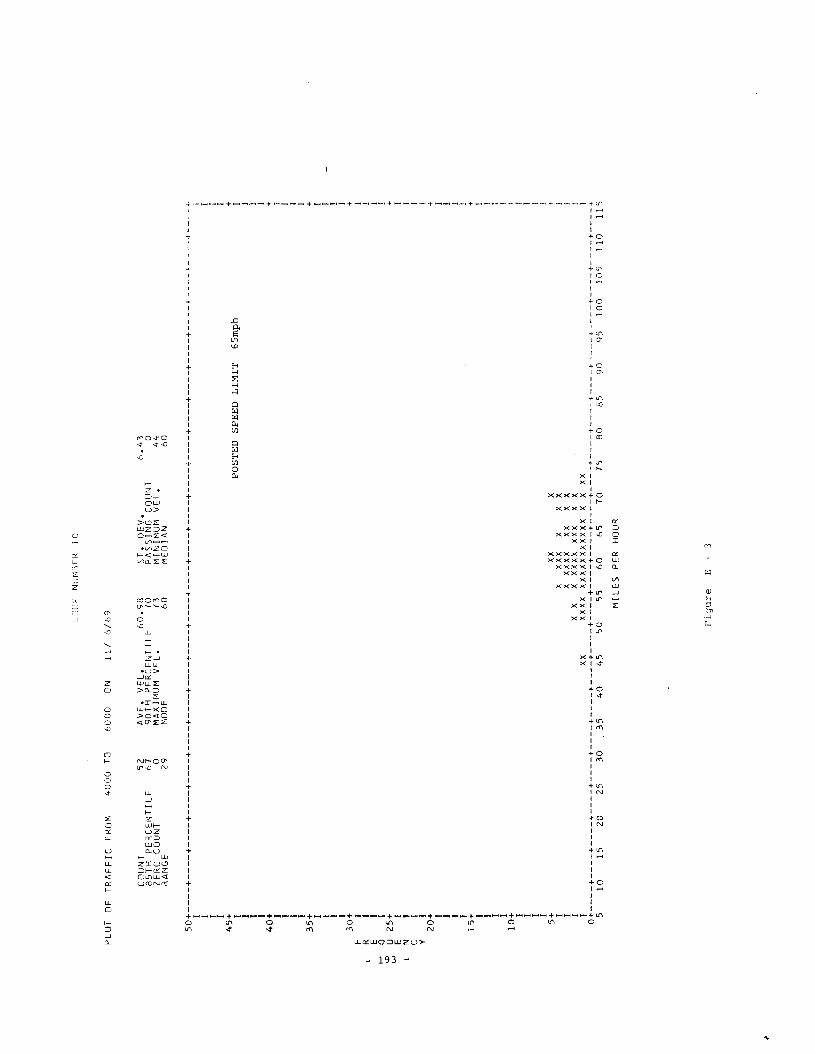
PLO
TO
FT
RA
FF
ICFR
UM
40
00
TO6
00
0O
N
U)[
)PN
Ur',
!jEK
10
ill
6/6
9
CO
UN
T8
5T
HP
ER
CE
NT
!LE
ZE
RO
CO
UN
TR
AN
GE
52
67 o 29
AV
E.
VE
L.
60
.9B
90
TH
PE
RC
EN
TIL
E7
0M
AX
IMU
MV
EL
.7
3M
OD
E6
0
ST
.D
EV
.P
AS
SIN
GC
OU
NT
MINI!~Ur~
VE
L.
ME
DIA
N
6.4
3 o4
46
0
i I I + I I I I + I I I I + I I I I + I I I ! + ] I I
"
50
+----+
----+
----+
----+
----+
----+
----+
----+
----+
----+
----+
----+
----+
----+
----+
----+
----+
----+
----+
----+
----+
--_
..+
I I I I
45
;PO
STE
DS
PE
ED
LIM
IT6
5m
ph
I I I4
0+ I I I I
35
+ I I I I3
0+
FI
RI
EI
t-'
QI
~U
25
+E
IN
IC
IY
I2
0+
•I
II
II
II
I1
5+
+I
II
II
II
I1
0+
+I
II
!I
]I
!5
+XX
X+
IX
XX
XX
XX
II
XX
XX
XXX
XX
II
XX
XX
XX
XX
XX
XX
II
XXX
XX
XX
XX
XX
XX
XX
XX
XX
XX
I0
+----+
----+
----+
----+
----+
----+
----+
----+
----+
----+
----+
----+
----+
----+
----+
----+
----+
·----i·-
---+
----+
----+
----+
51
01
52
02
53
03
54
04
55
05
56
06
57
07
58
0B
59
09
51
00
10
51
10
11
5
MIL
ES
PE
RH
OU
R
Fig
ure
E-
3
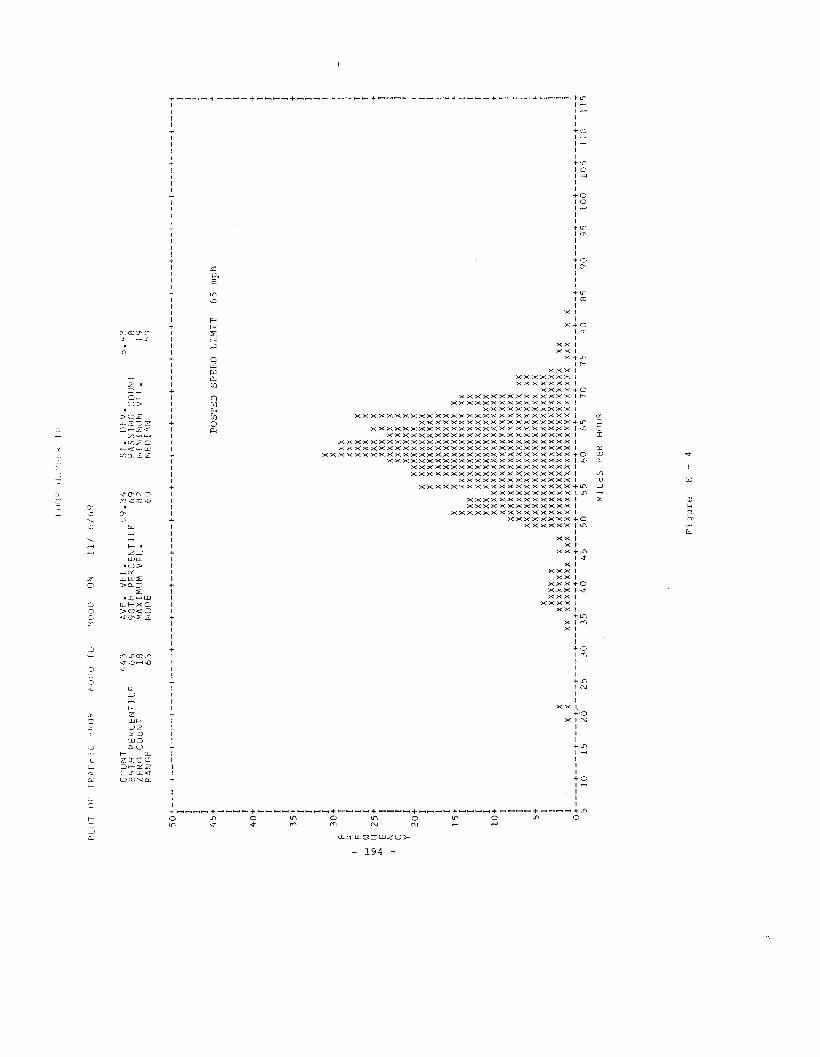
PU
lTII
FT
RA
FFIC
I'RlJi~
hunu
TLJ
'lUO
ODN
LU(;~
i-JlJ
~~k
l()
III
10
/69
CO
UN
TW
iTH
PE
kCE
NT
IL
fZF
ROCO
UN
TR
AN
GE
44
36
61
86
3
AV
E.
VE
L.
~9.34
90T
HP
ER
CE
NT
ILE
69
MA
XIM
IJM
VE
L.
82
MO
DE
60
ST
.D
EV
.P
AS
SIN
GC
OU
NT
MIN
IMU
MV
EL
.M
EDIA
N
d.4
3 819 1;1
)
F p E....
.Q
""U
~E N C y
50
+----+
----i----i------I----+
----+
----+
----t----t-----+
----+
----+
----+
----I----+
----I-----I-----l----1
----+
----i----i
II
II
II
II
451
POST
ED
SP
EE
DL
IMIT
65
mph
rI
II
II
I4
0+
+I
II
II
II
I3
5+
+I
II
II
II
XI
30
+X
•I
XXX
Tv
VV
~A
AA
IXX
XX
Ixx
xx
25
+XX
XX
X+
IX
XXX
XI
IX
XX
XX
XX
II
XX
XX
XX
XI
IX
XX
XX
XX
I2
0+
XX
XX
XX
XX
X•
IX
xxxx
xxxx
xxI
IX
XX
XX
XX
XX
XX
II
XX
XX
XX
XX
XX
X]
IX
XX
XX
XX
XX
XX
I1
5+
XX
XX
XX
XX
XX
XX
X•
IX
XX
XX
XX
XX
XX
XX
xxI
IXX
Xxx
xxxx
xxxx
xxXX
II
XXX
XX
XX
XX
XX
XX
XX
XXI
IXX
XX
XX
XX
XX
XX
XX
XX
XX
I1
0+
XX
XX
XX
XX
XX
XX
XX
XX
XX
X+
IX
XX
XX
XX
XX
XX
XX
XX
XX
XX
II
XX
XX
XX
XX
XX
XX
XX
XX
XX
XX
II
XX
XX
XX
XX
XX
XX
XX
XX
XX
XX
XX!
IX
XX
XX
XX
XX
XX
XX
XX
XX
XX
XX
xXI
5+X
XX
XX
XX
XX
XX
XX
XX
XX
XX
XX
XX+
IX
XX
XX
XX
XX
XX
XX
XX
XX
XX
XX
XX
XX
II
XX
XX
XX
XX
XX
XX
XX
XX
XX
XX
XX
XX
XX
XX
XX
II
XX
XX
XX
XX
XX
XX
XX
XX
XX
XX
XX
XX
XX
XX
XX
XX
XX
XXX
II
XX
XXX
XX
XX
XX
XX
XX
XX
XX
XX
XX
XX
XX
XX
XX
XX
XX
XX
XX
XX
XX
XX
TO+----+----+----+~---+----+----+----+----+----+----+----+----+----+----+----+----+----+----+----+----+----+----+
510
152
62
53
03
54
04
55
05
56
06S
70
75gO
859
09S
10
01
05
11
0IT~
I'll
LEO
,PI
'RH
nllR
Flg
ure
E-
4
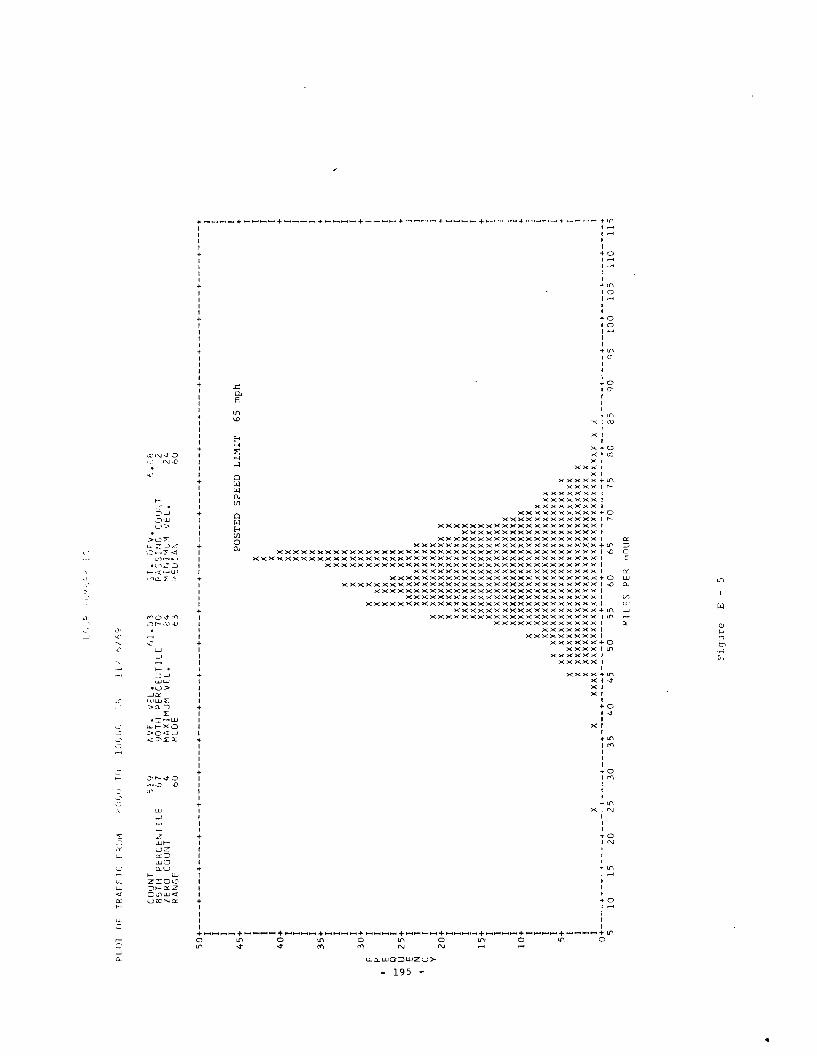
PL
OT
flF
TR
AF
FIC
FRLJI~
;;~(;
(jU
T[J
1()
()U
I).j
l'J
LrJ
_'
:.-
I;,,/
;~~-
'"'1"
)
Iii
,,/"
"
CO
UN
Tfl
5TH
PE
RC
EN
TIL
EZ
ER
OC
OU
NT
RA
NG
E
51<
;6
7 46
0
AV
E.
VE
L.
"1
.03
'lOT
HP
ER
CE
NT
ILE
70
MAXIMU~
VE
L.
24
MC
DE
t3
ST
.,)
FV
.P
AS
SI
,"~r;
CJJ
lj::
T'-
'Pd
"U'I
VE
L.
.,~D
IA
N
6.~.
8 22
46
0
~
50
+----+
----+
----+
----+
----+
----+
----+
----+
----+
----+
----+
----+
----+
----+
----+
----+
----+
----+
----+
----+
----+
----+
II
II
II
451
PO
ST
ED
SP
EE
DL
IMIT
65
mph
1I
II
XI
IX
II
XI
40
+X
X+
IXX
II
XX
II
XXI
IX
XI
35
+XX
+I
XX
XI
IX
XX
II
XX
XX
II
Xxx
xI
30
+X
XX
X+
FI
XX
XX
XI
RI
XXX
XX
XI
IE
IX
XXX
XX
I>-
'Q
IX
XX
XX
XX
I'"
U2
5+
XX
XX
XX
X+
U;
EI
xxxx
xX
XX
IN
Ixx
xxxx
xxxx
IC
Ixx
xxxx
xxxx
IY
IX
XX
XX
XX
XX
XX
I2
0+
Xxx
xxxx
xxxx
xX
+I
Xxx
xxxx
xxxx
xX
II
xxxx
xxxx
xxxx
xX
II
xxxx
xxxx
xxxx
xxx
II
XX
XX
XX
XX
XX
XX
XX
XI
15
+X
XX
XX
XX
XX
XX
XX
XX
+I
xxxx
xxxx
xxxx
xxx
II
xxxx
xxxx
xxxx
xxxx
II
xxxx
xxxx
xxxx
xxxx
xI
IX
XX
XX
XX
XX
XX
XX
XX
XX
I1
0+
XX
XX
XX
XX
XX
XX
XX
XX
XX
+I
XX
XX
XX
XX
XX
XX
XX
XX
XX
XI
IX
XX
XX
XX
XX
XX
XX
XX
XX
XX
XI
IX
XX
XX
XX
XX
XX
XX
XX
XX
XX
XX
XX
I1
Xxx
xxxx
xxxx
xxxx
xxxx
xxxx
xxI
5+
XXX
XX
XX
XX
XX
XX
XX
XX
XX
XX
XX
XX
XX
+I
XX
XX
XX
XX
XX
XX
XX
XX
XX
XX
XX
XX
XX
XX
XX
IX
XX
XX
XX
XX
XX
XX
XX
XX
XX
XX
XX
XX
XX
XX
XX
IX
XX
XX
XX
XX
XX
XX
XX
XX
XX
XX
XX
XX
XX
XX
XX
IX
XX
XX
XX
XX
XX
XX
XX
XX
XX
XX
XX
XX
XX
XX
XX
XX
XX
XX
XX
XX
XI
0+
----+
----+
----+
-----+
----+
----+
----+
----+
----+
----+
----+
----+
----+
----+
----+
----+
----+
----+
----+
----+
----+
----+
51
01
52
02
53
03
54
04
55
05
56
06
57
07
58
08
5GO
G5
10
01
05
11
01
15
MIL
ES
PE
RH
OU
R
Fig
ure
E-
5
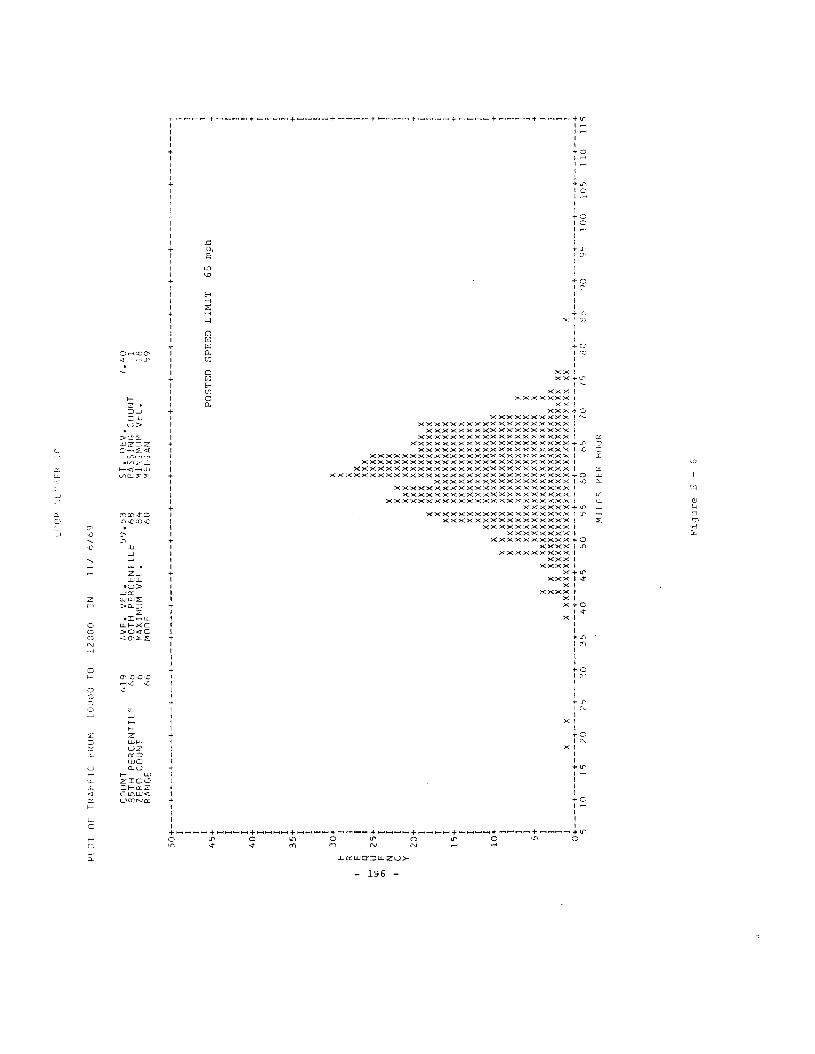
l(lU
Pt'\~_E
in
PLD
TD
FT
RA
FF
ICFR
OM
!O(l
OO
TO1
20
00
ON1
11
6/6
9
CD
UN
T85
TH
PE
RC
EN
TIL
EZE
RO
CO
UN
TR
AN
GE
41
96
6 66
6
AV
E.
VE
L.
59
.53
90T
HP
ER
CE
NT
ILE
68
MA
XIM
UM
VE
L.
84
MO
DE
60
Sf.
DE
V.
PA
SS
ING
c[Ju~n
MINIi~lJ~!
VE
L.
MEI
>I.A
N
7.4
0 118 59
+----+
----+
----+
----
---+
----+
----+I I I T + I I I I + I I I I + I I I I + I i [ I + I I I ] + i I [ I + I I I I + I 1 ! I + I ] I J
·-·-
-"
·4·-
---+
----+
----+
----+
951
00
lOS
11
01
15
65
mph
POST
ED
SP
EE
DL
IMIT
F
50
+----+
----+
----+
----+
----+
----+
----+
----+
----+
----+
----+
----+
----+
----+
I I I I4
5+ I I I I
40
+ I I I I3
5+ I I I I
30
+x
IX
RI
XE
IXX
QI
XX
Xt;:;
U2
5+
XX
XX
cr>
EI
XX
XX
NI
XXX
XXC
IX
XX
XX
XY
IXX
XXX
XX2
0+
XXX
XX
XX
XI
XXX
XX
XX
XX
XX
IX
XXX
XX
XX
XX
XX
XI
XX
XX
XX
XX
XX
XX
XX
IXX
xxxx
xxxx
xxxx
x1
5+
XXxx
xxxx
xxxx
xxx
!xx
xxxx
xxxx
xxxx
xI
XXX
XX
XX
XX
XX
XX
XX
IXX
XX
XX
XX
XX
XX
XX
XI
XXX
XX
XX
XX
XX
XX
XX
X1
0+
XXX
XX
XX
XX
XX
XX
XX
XX
X1
XX
XX
XX
XX
XX
XX
XX
XX
XX
XI
XX
XX
XX
XX
XX
XX
XX
XX
XX
XX
IX
XX
XX
XX
XX
XX
XX
XX
XX
XX
XX
IX
XX
XX
XX
XX
XX
XX
XX
XX
XX
XX
X5+
XX
XX
XX
XX
XX
XX
XX
XX
XX
XX
Xx
IX
XX
XX
XX
XX
XX
XX
XX
XX
XX
XX
XX
XX
IX
XX
XX
XX
XX
XX
XX
XX
XX
XX
XX
XX
XX
XX
XXI
XX
XX
XX
XX
XX
XX
XX
XX
XX
XX
XX
XX
XX
XX
XX
XXI
XX
XX
XX
XX
XX
XX
XX
XX
XX
XX
XX
XX
XX
XX
XX
XX
XX
XX
XXX
x0
+----+
----+
----+
----+
----+
----+
----+
----+
----+
----+
----i-
----t-----+
----+
----+
----
510
1520
253
03
54
04
55
055
60
65
10
75
80
MIU
-S['E
!'H
C1U
R
Fiq
ure
~~-
6
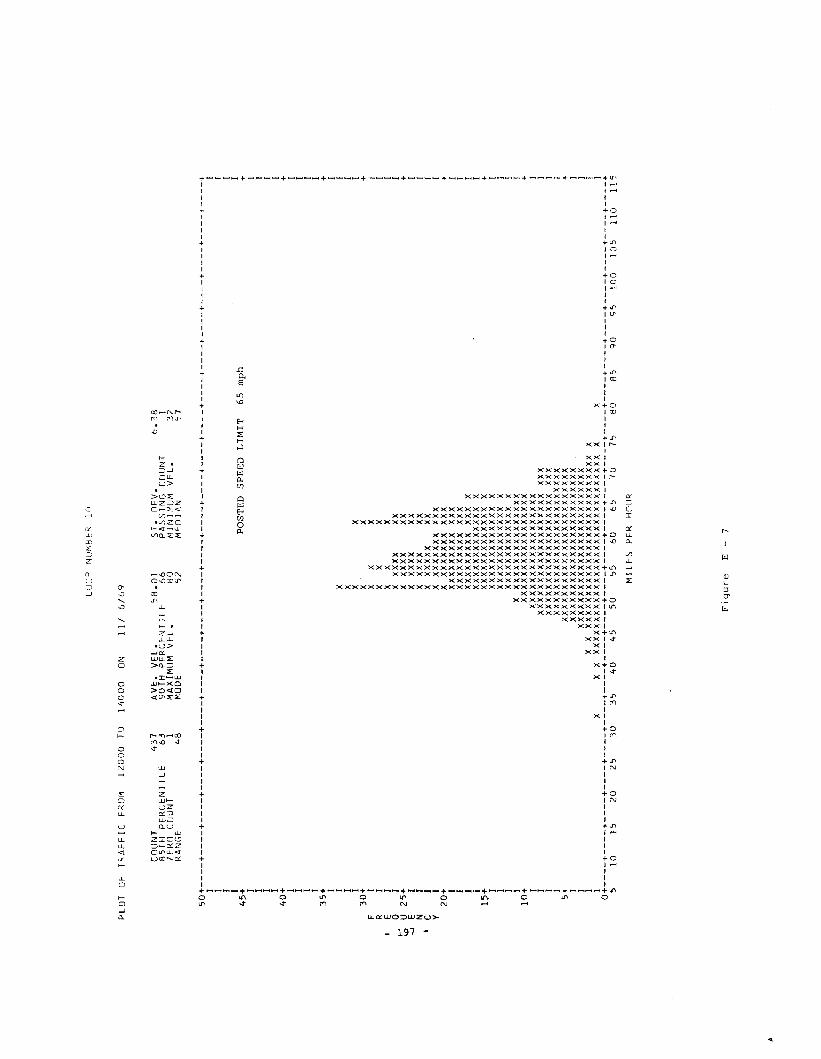
PLO
TO
FT
RA
FF
ICFR
OM
12
00
0TO
14
00
0ON
LfJl
JPN
lW,fJ
I:RIn
III
6/6
9
CO
UN
T4
37
B5T
HP
ER
CE
NT
ILE
63ZE
RO
CU
UN
T1
RA
NG
E4
8
AV
E.
VE
L.
58
.01
90T
HP
ER
CE
NT
ILE
66
MA
XIM
UM
VE
L.
80
MOD
E52
ST
.D
EV
.P
AS
SIN
GC
OU
NT
~1INUjlJM
VE
L.
MED
IAN
6.3
8 13
25
7
~
50
+----+
----+
----+
----+
----+
----+
----+
----+
----+
----+
----+
----+
----+
----+
----+
----+
----+
----+
----+
----+
-----t
----+
II
II
II
451
POST
ED
SPE
ED
LIM
IT65
mph
1I
II
II
II
I4
0+
+I
II
II
II
I3
5+
+I
II
XI
IX
II
XX
I3
0+
XX
+F
IX
XX
1R
IX
XX
IE
IX
XX
IQ
IX
XX
XX
XXI
';;;U
25
+X
XX
XX
XX+
....E
IX
XX
XX
XXI
NI
XX
XX
XXX
II
CI
XX
XX
XX
XXI
YI
XX
XX
XX
XX
XX
XI
20
+X
XX
XX
XX
XX
XX
+I
XX
XX
XX
XX
XXX
XI
IX
XX
XX
XX
XX
XX
XI
IX
XX
XX
XX
XX
XXX
X!
iX
XX
XX
XX
XX
XX
XX
XI
15
+X
XX
XX
XX
XX
XX
XX
X+
.I
XX
XX
XX
XX
XX
XX
XX
II
XX
XX
XX
XX
XX
XX
XX
II
xxxx
xxxx
xxxx
xX
II
XX
XX
XX
XX
XX
XX
XX
XX
I1
0+
XX
XX
XX
XX
XX
XX
XX
XX
X+
IX
XX
XX
XX
XX
XX
XX
XX
XX
XI
IX
XX
XX
XX
XX
XX
XX
XX
XX
XX
XXX
II
XX
XX
XX
XX
XX
XX
XX
XX
XX
XXX
XI
IX
XX
XX
XX
XX
XX
XX
XX
XX
XX
XX
XX
I5+
XX
XX
XX
XX
XX
XX
XX
XX
XX
XX
XX
XX
+I
XX
XX
XX
XX
XX
XX
XX
XX
XX
XX
XX
XX
II
XX
XX
XX
XX
XX
XX
XX
XX
XX
XX
XX
XX
XI
IX
XX
XX
XX
XX
XX
XX
XX
XX
XX
XX
XX
XX
XX
XX
XI
IX
XX
XX
XX
XX
XX
XX
XX
XX
XX
XX
XX
XX
XX
XX
XX
XX
XX
XI
0+
----+
----+
----+
----+
----+
----+
----+
----+
----+
----+
----+
----+
----+
----+
----+
----+
----+
----+
----+
----+
----+
----+
51
015
20
25
30
35
40
45
50
556
06
57
07
58
085
90
95
10
01
05
11
01
15
MIL
ES
PER
HO
UR
Fig
ure
E-
7
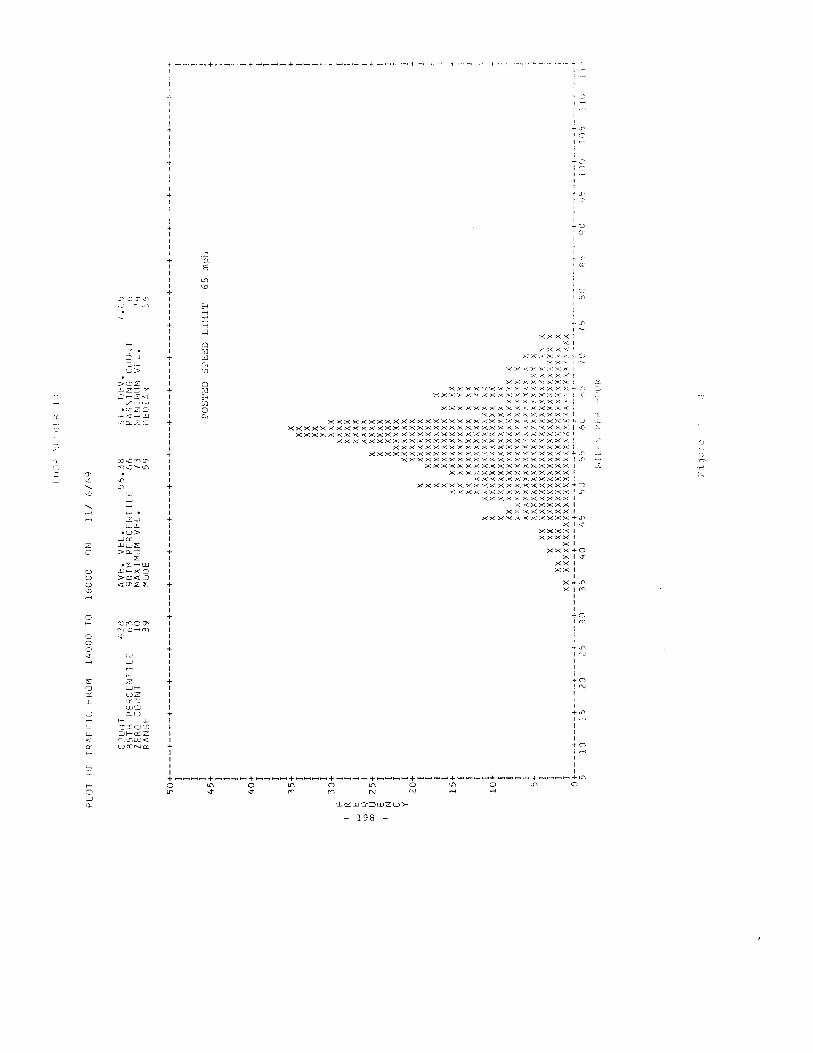
UJU
P~:
ih
<]
PLO
TII
FT
fUF
I'IC
FRor~
1/ ,0
00
III
16
00
0O
N1
1/
6/6
'1
C[iUi~T
R5
TH
PE
i<C
b'iT
IL
EZE
RO
C[}
lIfH
RA
NG
E
43
8 63 10
39
AV
E.
VE
L.
56
.38
90T
HP
ER
CE
NT
ILE
66
MA
XIM
UM
VE
L.
73M
OD
E5
9
sr.
[H'V
.P
,\S
SIN
G'"
I'I
Ir"
Ii~1
I=D
IA'~
.I
•,.1
') 6"4 ~)
(")
11
65
mph
POST
ED
SPE
ED
LIM
IT
50
+----+
----+
----+
----+
----+
----+
----+
----+
----+
----+
----+
----+
----+
----+
----+
----+
----+
---+
----+
----+
----1
I I I I4
5+ I I I I
40
+ I I I I3
5+
XI
XXI
xxI
xxI
XX
30
+X
XX
IX
XX
XI
XX
XX
IX
XX
X!
xxxx
25
+X
XX
XX
IX
XX
XX
IX
XX
XX
!X
XX
XX
XI
XX
XX
XX
X2
0+
XX
XX
XX
XI
XX
XX
XX
XX
IX
XX
XX
XX
XX
IX
XX
XX
XX
XX
XI
XX
XX
XX
XX
XX
X1
5+
XXX
XX
XX
XX
XX
XXX
!xx
xxxx
xxxx
xx
yx!
XXX
XX
XX
XX
XX
XXX
IX
XX
XX
XX
XX
XX
XX
XXI
XX
XX
XX
!XX
XX
XX
XXX
10
+X
XX
XX
XA
XX
XX
XX
XXX
IX
XX
XX
XX
XX
XX
XX
XX
Xxx
IXX
XX
XX
XX
XX
XX
XX
XX
XX
XX
X!
IX
XX
XX
XX
XX
XX
XX
XX
XX
XX
!X
XI
XX
XX
XX
XX
XX
XX
XX
xXX
/XX
X•
I5+
XX
XX
XX
XX
XX
XX
XX
XX
XX
/XX
XX
XX
IXX
XX
XX
XX
XX
XX
XX
XX
XX
XX
X'X
X,
IX
XXX
XX
XX
XX
XX
XX
XX
XX
XX
XX
xx
IXX
XXX
XX
XX
XX
XX
XX
XX
XX
XX
XX
XXX
IXX
XX
XX
XX
XX
XX
XX
XX
XX
XX
XX
XX
XX
XX
'X
IX"
0+
----+
----+
----+
----+
-----+
----+
----+
----+
----+
-----+
-----t-
----{
----+
----+
----+
----i--·---+----+----f----+----~
51
01
52
02~
30
35
40
45
50
~5
60
;570
7~
SOR
"~O
qS1
00
J05
11
F R....
.E
'..0
L)co
U E N C y
fl,Il.
lK
Fi,
!"!,
,

PLO
TO
FT
RA
FF
ICFR
OM
16
00
0TO
18
00
0ON
LOO
PN
UM
BER
10
ill
6/6
9
CO
UN
T6
02
85T
HP
ER
CE
NT
ILE
62ZE
RO
CO
UN
T9
RA
NG
E5
7
AV
E.
VE
L.
57
.51
90T
HP
ER
CE
NT
ILE
64
MA
XIM
UM
VE
l,7
4M
ODE
59
ST
.D
EV
.P
AS
SIN
GC
OU
NT
MIN
IMU
MV
EL
.M
EDIA
N
6.0
6 31
75
7
50
+----+
----+
----+
----+
----+
----+
----+
----+
----+
----+
----+
----+
----+
----+
----+
----+
----+
----+
----+
----+
----+
----+
II
IX
II
XI
IX
I4
5j
~~
XP
OS
TE
DS
PE
ED
LIM
IT65
mph
j
IX
XX
XI
Ixx
xX
II
xxx
XI
40
+X
XX
XX
+I
XX
XX
XI
IX
XX
XX
II
XX
XX
XI
IX
XX
XX
I3
5+
XX
XX
XX
+I
XXX
XX
XX
II
XX
XX
XX
XX
II
XX
XX
XX
XX
II
XX
XX
XX
XX
XX
I3
0+
XX
XX
XX
XX
XX
X+
FI
xxxx
xxxx
xxX
IR
IX
XX
XX
XX
XX
XX
XI
EI
XX
XX
XX
XX
XX
XX
IQ
IX
XX
XX
XX
XX
XX
XI
~U
25
+X
XX
XX
XX
XX
XX
XX
+\0
EI
XX
XX
XX
XX
XX
XX
VI
NI
XX
XX
XX
XX
XX
XX
XI
IC
IX
XX
XX
XX
XX
XX
XX
IY
IX
XX
XX
XX
XX
XX
XX
I2
0+
XX
XX
XX
XX
XX
XX
XX
+I
XX
XX
XX
XX
XX
XX
XX
II
XX
XX
XX
XX
XX
XX
XX
Ir
XX
XX
XX
XX
XX
XX
XX
XI
IX
xxxx
xxxx
xxxx
xx[
15
+X
XX
XX
XX
XX
XX
XX
XX
+I
XXX
XX
XX
XX
XX
XX
XX
XI
IX
XX
XX
XX
XX
XX
XX
XX
XX
II
XX
XX
XX
XX
XX
XX
XX
XX
XX
II
XX
XX
XX
XX
XX
XX
XX
XX
XX
XX
I1
0+
XX
XX
XX
XX
XX
XX
XX
XX
XX
XX
+I
XX
XX
XX
XX
XX
XX
XX
XX
XX
XX
XI
IX
XX
XX
XX
XX
XX
XX
XX
XX
XX
XX
II
XX
XX
XX
XX
XX
XX
XX
XX
XX
XX
X[
IX
XX
XX
XX
XX
XX
XX
XX
XX
XX
XX
I5+
XX
XX
XX
XX
XX
XX
XX
XX
XX
XX
XX
X+
IX
XX
XX
XX
XX
XX
XX
XX
XX
XX
XX
XX
XI
IX
XX
XX
XX
XX
XX
XX
XX
XX
XX
XX
XX
XX
II
XX
XX
XX
XX
XX
XX
XX
XX
XX
XX
XX
XX
XX
XI
IX
X,
XX
XX
XX
XX
XX
XX
XX
XX
XX
XX
XX
XX
XX
XX
XX
XX
[O+----+----+----+----+----+----+----+--~-+----+---_+----+----+----+-----+----+----+----+----+----+----+----+----+
51
01
52
02
53
03
54
04
55
05
56
065
70
758
08
59
095
10
01
05
11
01
15
MIL
ES
PER
HrJ
UR
Fi'
Ju
reE
-9
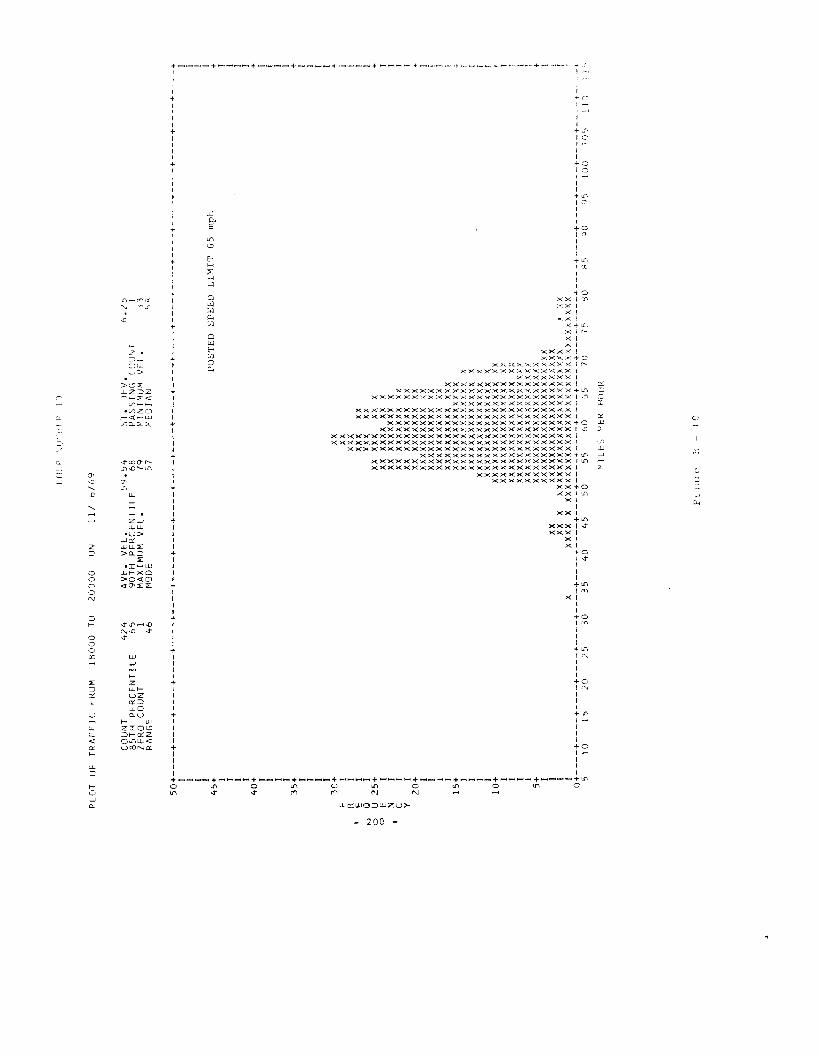
PLO
T(J
FT
RA
FF
ICFR
OM
18
00
0Tl
l2
00
00
ON
UJL
JP"E
Rl!
)
11
/6/
6'-1
CO
UN
T85
TH
PE
RC
EN
TIL
EZE
RO
CO
UN
TR
AN
GE
42
4 65 1
46
AV
E.
VE
L.
59
.54
90T
HP
ER
CE
NT
ILE
68M
AX
IMU
MV
EL
.79
MO
DE
57
ST
.O
FV.
PA
SS
ING
CO
UN
T~lINHIUM
VE
L.
;,jEO
IAN
(-,.
251
33
:)8
1 ! r J + I f
50
+----+
----+
----+
----+
----+
----+
----+
----+
----+
----+
----+
----+
----+
----+
----+
---
-+
----+
-+
----+
----+
----+
----+
II
II
II
451
POST
ED
SPE
ED
LIM
IT6
5m
ph1
II
II
II
II
40
++
II
II
II
II
35
++
II
II
II
II
30
+XX
+F
!xx
IR
Ixx
xf.
EI
XX
XXX
I'"
QI
n:x
xxI
oU
25
+XX
XXX
xxX
+o
EI
XXX
XX
Xxx
XI
NI
XXX
XX
XX
XX
XI
CI
XXX
XX
XX
XX
xxI
YI
XXX
XX
XX
XX
XXI
20
+XX
XX
XX
XX
Xxx
+I
XX
XX
XX
XX
XX
XXI
IX
XX
XX
XX
XX
XXX
II
XX
XX
XX
XX
XX
XXI
XX
XX
XX
XX
XX
XXX
15
+X
XX
XX
XX
XX
XX
XX
XJ
XX
XX
XX
XX
XX
XX
XX
XI
XX
XX
XX
XX
XX
XX
XX
XI
XX
XX
XX
XX
XX
XX
XX
XX
IX
XX
XX
XX
XX
XX
XX
XX
X1
0+
XX
XX
XX
XX
XX
XX
XX
XX
XXI
XX
XX
XX
XX
XX
XX
XX
XX
xxI
XX
XX
XX
XX
XX
XX
XX
XX
XXI
XX
XX
XX
XX
XX
XX
XX
XX
XX
XI
XX
XX
XX
XX
XX
XX
XX
XX
XX
X5+
XX
XX
XX
XX
XX
XX
XX
XX
XX
X+
IX
XX
XX
XX
XX
XX
XX
XX
XX
XX
XX
1I
XXX
XX
XX
XX
XX
XX
XX
XX
XX
XX
XX
!I
XXX
XX
XX
XX
XX
XX
XX
XX
XX
XX
XX
XX
X~:<X
II
XX
XX
XX
XX
XX
XX
XX
XX
XX
XX
XX
XX
XX
XX
XX
XX
XX
XX
XX
r0+----+----+----+----+----+----+----+----+----+----+----+---.-+----+-----~----+----+-----+----+----+----+--
-+-----~
51
015
202
530
35
40
45
50
556
0S5
1015
80
A5
gO95
10
01
05
lIn
1I
,'lI
Lt'
;Pc
KH
iltJR
Fl(~Ure
I:;lC
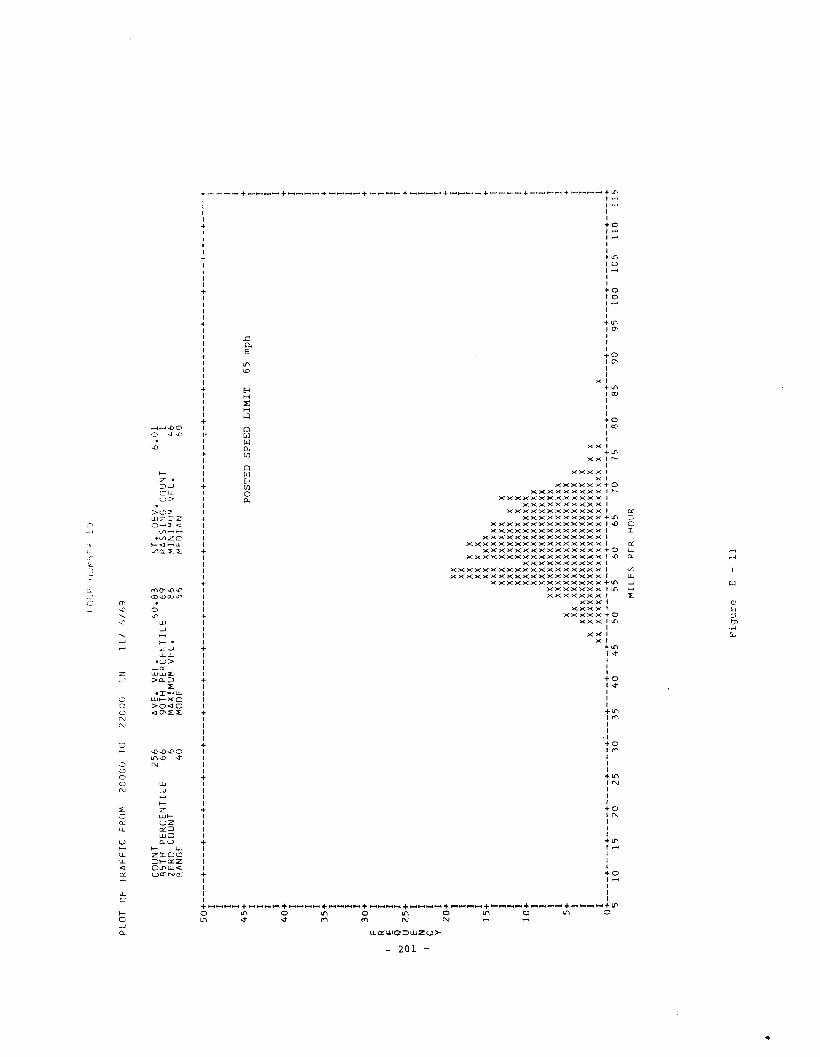
PL
OT
OF
TR
AF
FIC
FRO
M2
00
00
TO2
20
00
ON
LO
UP
IjL'~':;~~,
1tj
11
11
,/1
,9
CO
UN
T8
5T
HP
ER
CE
NT
ILE
ZE
RO
CO
UN
TR
AN
GE
25
66
6 64
0
AV
E.
VE
L.
1,0
.83
90
TH
PE
RC
EN
TIL
E6
9M
AX
IMU
MV
EL
.8
6M
OD
E5
6
Sf.
DE
V.
PA
SS
!'IG
CO
UN
TMI~IMIJM
VE
L.
ME
DI
MJ
6.0
1 14
66
0
•
50+----+----+----+----+----+----+----+----+----+----+----+----+----+----+--~-+----+----+----+----+----~----+--_._+
II
I]
II
II
451
POST
ED
SP
EE
DL
IMIT
65
mph
rI
II
II
I4
0+
+I
II
II
II
I3
5+
+I
II
!I
II
I3
0+
+F
I1
RI
IE
II
..,
QI
Io
U2
5+
+I-
'E
II
NI
IC
II
YI
I2
0+
+I
XX
II
xxJ
IXX
XX
II
xxX
XI
15
+X
XX
XX
X+
IX
XX
XX
XX
XX
II
XX
XX
XX
XX
XX
!I
XX
Xxx
xxxx
XX
II
xxx
XX
XX
XX
XX
!1
0+
xxxx
xxxx
xxxx
xx+
Ixx
xxxx
xxxx
xxxx
xI
Ixx
xxxx
xxxx
xxxx
xI
Ixx
xxxx
xxxx
xxxx
xxx
II
XX
XX
XX
XX
XX
XX
XX
XX
XX
!5
+X
XX
XX
XX
XX
XX
XX
XX
XX
XX
+I
xxxx
xxxx
xxxx
xxxx
xxxx
XI
IX
XX
XX
XX
XX
XX
XX
XX
XX
XX
XX
XX
II
Xxx
xxxx
xxxx
xxxx
xxxx
xxxx
XX
X1
IX
XX
XX
XX
XX
XX
XX
XX
XX
XX
XX
XX
XX
XX
XX
IO+----+----+----+----+----+~---+----+----+----+----+----+----+----+----+----+----+----+----+----+----+----+----+
51
01
52
02
53
03
54
04
55
05
56
06
57
07
58
08
59
09
51
00
10
51
10
11
5
MIL
ES
PE
RH
OllO
<
Fig
ure
E-
11
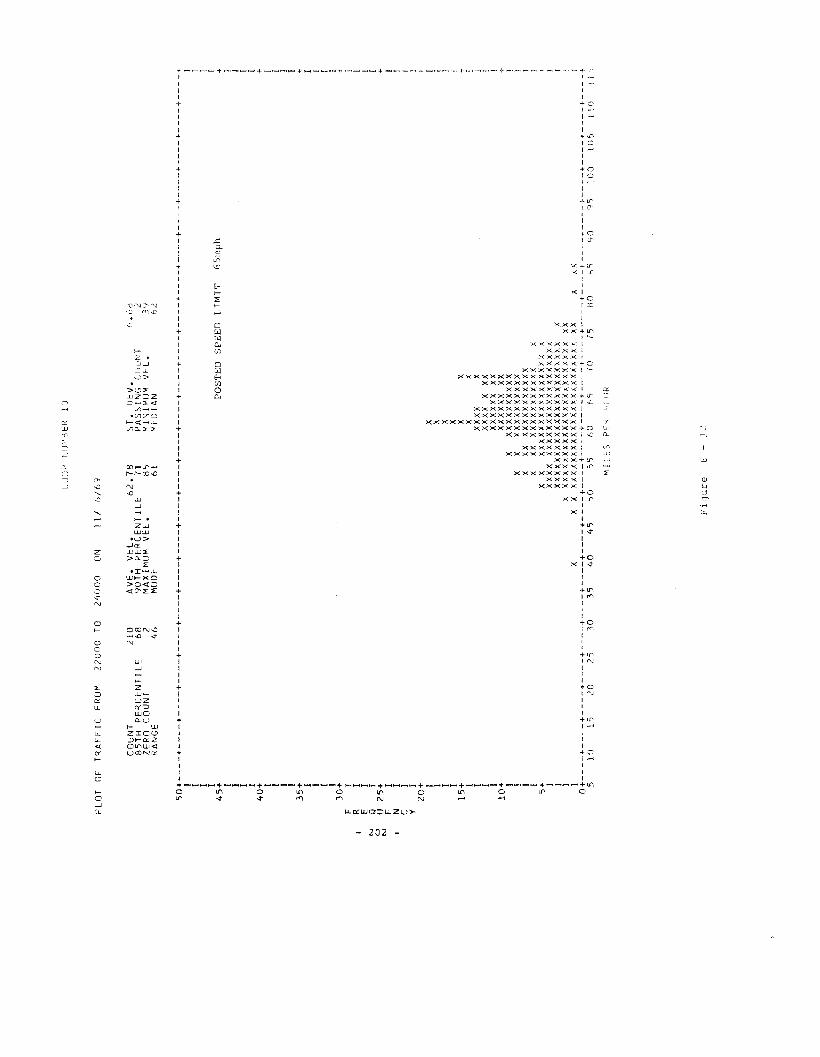
LlH
H'
tIIJH~t'R
1')
PLO
TO
FT
RA
FF
ICFR
OM
22
00
0TO
24
00
0ON
III
6/6
9
CO
UN
T85
TH
PE
RC
EN
TIL
EZE
RO
CO
UN
TR
AN
GE
21
0 68 2
46
AV
E.
VE
L.
62
.78
90T
HP
ER
CE
NT
ILE
71
MA
XIM
UM
VE
L.
85
MO
DE
61
ST
.D
EV
.P
AS
SIN
Gcr
lUN
TM
INIM
UM
VF
L.
MED
IAN
(1.6
:3 23
'1 62
I r I + I i I i+
-+
----+
----+
----+
----+
I I I [ + I I I I + I I I I + I I [ I + i I I I + I I [ I • [ I i [
GS
mp
h
--+
._.-
-_._
+_
.-
POST
ED
SPE
ED
LIM
IT
X X X X XX
XX
XX
XX
XX
Xxx
XXX
XX
XX
XX
XXX
XX
XX
XXX
XX
XX
XX
XX
XX
XX
XX
XX
XX
XX
XX
XX
XXx
xx
xx
xx
xx
xx
Xxx
XX
XX
XX
XX
XX
XX
XX
XX
XX
XX
XX
XX
XX
XX
Xx
XX
XX
XX
XX
XX
XX
XX
XX
XX
XX
XX
xX
XX
XX
XX
XX
XX
XX
XX
XX
XX
XX
XX
XX
XX
XX
XX
XX
XX
XX
XX
XX
XX
XX
XX
XXX
XX
XX
XX
XX
XX
XX
XX
XX
XX
XX
XX
XX
XX
XXX
XXf
---t----+
----+
----+
----+
----+
----+
----+
--
-+
--.-
-+
----+
----+
----t----+----+----~,----+-----+
30
35
40
45
bO5
56
0A
S70
75SO
8S9
09S
10
01
05
LIO
II'
25
20
I~
10
50
+----+
----+
----+
----+
----+
----+
----+
----+
----+
----+
----+
----+
----i
I I I I4
5+ I I I I
40
+ I I I I3
5+ I I I I
30
+F
IR
IE
Io
IU
25
+E
IN
IC
IY
I2
0+ I I I I
15
+ I I I I1
0+ I I I I
5+ I I I I
0+
----+
---,-
+----+
----+
5
o IVtv
~~llf:S
PE
l,,p
Fiq
ure
E-
J?
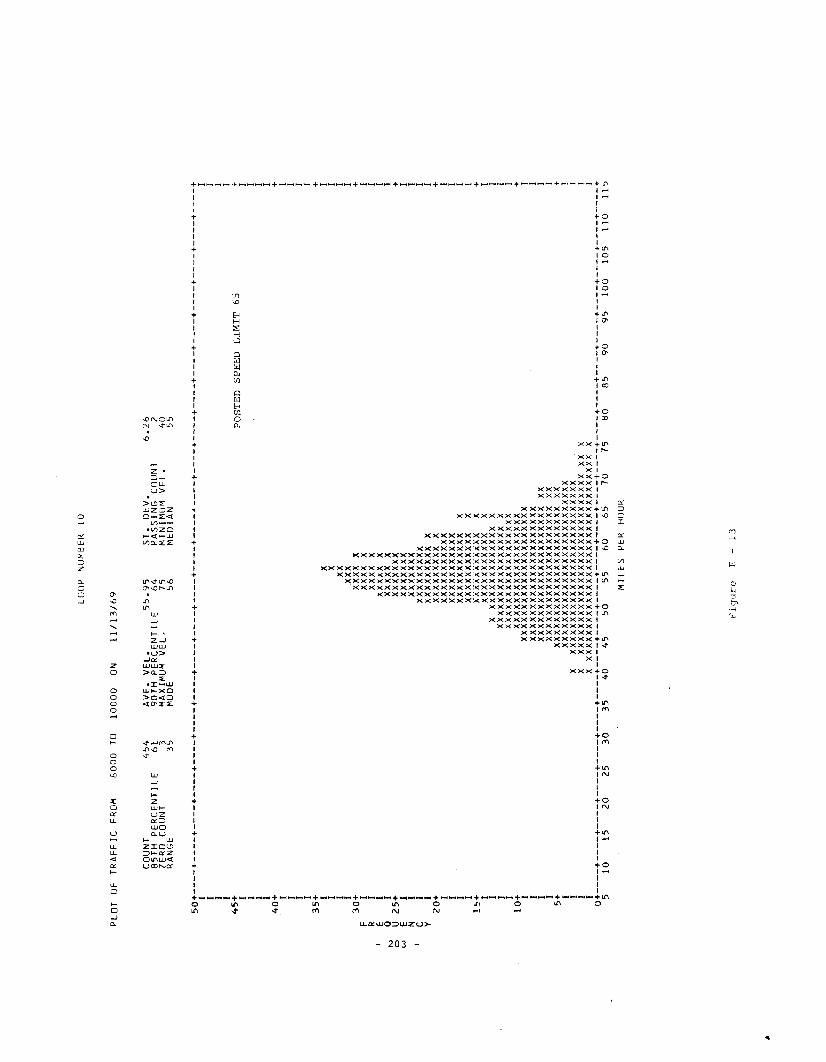
PLO
TO
FT
RA
FF
ICFR
OM
80
00
TO1
00
00
ON
LOO
PN
UM
BER
10
11
11
3/6
9
CO
UN
T4
54
85T
HP
ER
CE
NT
ILE
61
ZE
RO
CO
UN
T3
RA
NG
E3
5
AV
E.
VE
L.
55
.95
90T
HP
ER
CE
NT
ILE
64
MA
XIM
UM
VE
L,
75
MO
DE
56
ST
.D
EV
.P
AS
SIN
GC
OU
NT
MIN
IMU
MV
EL
.M
ED
IAN
6.2
6 24
0 55
A
'"o w
50
+----+
----+
----+
----+
----+
----+
----+
----+
----+
----+
----+
----+
----+
----+
----+
----+
----+
----+
----+
----+
----+
_._
--+
II
II
II
II
45I
POST
ED
SPE
ED
LIM
IT6
5r
II
II
II
40
++
II
II
II
II
35
++
IX
II
XI
IXX
II
XX
XI
30
+X
XX
XX
+F
IX
XX
XX
IR
IX
XX
XX
IE
IX
XX
XX
XI
oI
XX
XX
XX
IU
25
+X
XX
XX
XX
+E
IX
XX
XX
XX
IN
IX
XX
XX
XX
IC
IX
XX
XX
XX
XX
IY
IX
XX
XX
XX
XX
XI
20
+X
XX
XX
XX
XX
X+
IX
XX
XX
XX
XX
XX
II
XX
XX
XX
XX
XX
XI
IX
XX
XX
XX
XX
XX
XI
IX
XX
XX
XX
XX
XX
X!
15
+X
XX
XX
XX
XX
XX
X+
IX
XX
XX
XX
XX
XX
XI
IX
XX
XX
XX
XX
XX
XX
XX
II
xxxx
xxxx
xxxx
xxxx
XI
Ixx
xxxx
xxxx
xxxx
xxxx
I1
0+
XX
XX
XX
XX
XX
XX
XX
XX
XX
+I
XX
XX
XX
XX
XX
XX
XX
XX
XX
XX
XI
IX
XX
XX
XX
XX
XX
XX
XX
XX
XX
XX
II
XX
XX
XX
XX
XX
XX
XX
XX
XX
XX
XXX
II
XX
XX
XX
XX
XX
XX
XX
XX
XX
XX
XXX
I5
+X
XX
XX
XX
XX
XX
XX
XX
XX
XX
XX
XXX
+I
XX
XX
XX
XX
XX
XX
XX
XX
XX
XX
XX
XX
XX
!I
XX
XX
XX
XX
XX
XX
XX
XX
XX
XX
XX
XX
XX
XX
II
XX
XX
XX
XX
XX
XX
XX
XX
XX
XX
XX
XX
XX
XX
XXX
XI
IX
XX
XX
XX
XX
XX
XX
XX
XX
XX
XX
XX
XX
XX
XX
XX
XX
XI
0+
----+
----+
----+
----+
----+
----+
----+
----+
----+
----+
----+
----+
----+
----+
----+
----+
----+
-----+
----+
----+
----+
----+
51
01
52
02
53
03
54
04
55
05
56
06
57
07
58
08
59
09
51
00
10
51
10
11
5
MIL
ES
PER
HO
UR
Fig
ure
E-
13
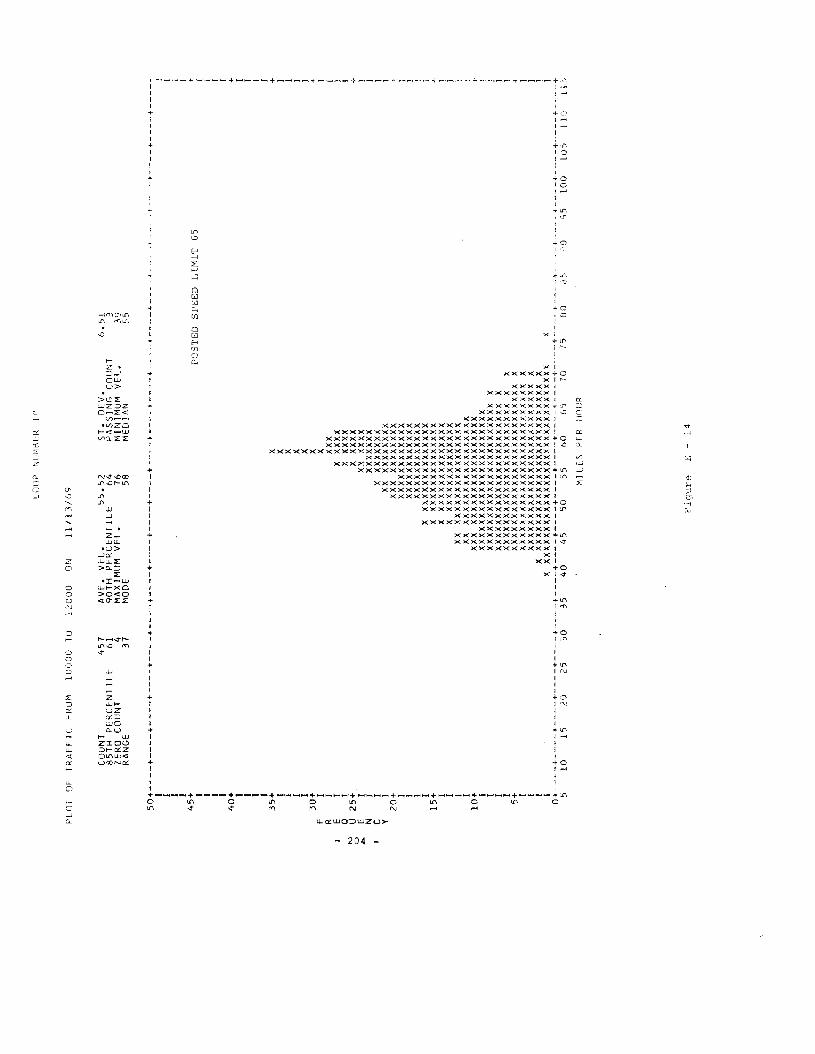
PLO
TO
FT
RA
FFIC
FRU
MlU
OO
OTO
12
00
0ON
LOO
PNi)I~KER
In
11
/13
/69
CO
UN
T85
TH
PE
kCE
NT
ILE
ZER
OC
OU
NT
RA
NG
E
45
761
43
7
AV
E.
VE
L.
55
.52
90T
HP
ER
CE
NT
ILE
64
MA
XIM
UM
VE
L.
76
MO
DE
58
ST
.D
EV
.P
AS
SIN
GC
OU
NT
MIN
IMU
MV
EL
.M
EDIA
N
6.5
1 33
95
5
x_.
+-
..."._
..+.._-~._.+
~-+
.__
..+~----+-"-'_._+._----f
75
liGiJ
5:>
!J9
51
00
10
'>ll
C
PO
ST
ED
SP
EE
DL
IMIT
65
IV o ...
50
+--
--+
----
+--
--+
----
+--
--+
---·
·+--
--+
----
+--
--+
----
+--
--+
----
+--
--+
----
+--
--+
---
•I I I I
45
+ I I I I4
0+ I I I I
35
+X
IX
IX
IX
IX
30
+X
FI
XR
IXX
XE
IX
XX
XX
Q!
XX
XX
XU
25
+X
XX
XX
EI
XXX
XX
Xiii
jX
XX
XX
XX
CI
XX
XX
XX
XX
YI
xxX
XX
XX
XX
X2
0+
XX
XX
XX
XX
XX
XI
XX
XX
XX
XX
XX
XX
IX
XX
XX
XX
XX
XX
XI
XX
XX
XX
XX
XX
XX
IX
XX
XX
XX
XX
XX
XX
XX
15
+X
XX
XX
XX
XX
XX
XX
XX
IX
XX
XX
XX
XX
XX
XX
XX
IX
XX
XX
XX
XX
XX
XX
XX
1xx
XX
XX
XX
XX
XX
XX
XX
XX
1xx
XX
XX
XX
XX
XX
XX
XX
XX
X1
0+
XX
XX
XX
XX
XX
XX
XX
XX
XX
XX
IX
XX
XX
XX
XX
XX
XX
XX
XX
XX
XX
XI
XX
XX
XX
XX
XX
XX
XX
XX
XX
XX
XX
XX
IX
XX
XX
XX
XX
XX
XX
XX
XX
XX
XX
XX
XI
XX
XX
XX
XX
XX
XX
XX
XX
XX
XX
XX
XX
X5+
XX
XX
XX
XX
XX
XX
XX
XX
XX
XX
XX
XX
XX
XI
XX
XX
XX
XX
XX
XX
XX
XX
XX
XX
XX
XX
XX
XI
XX
XX
XX
XX
XX
XX
XX
XX
XX
XX
XX
XX
XX
XI
XX
XX
XX
XX
XX
XX
XX
XX
XX
XX
XX
XX
XX
XX
IX
XX
XX
XX
XX
XX
XX
XX
XX
XX
XX
XX
XX
XX
XX
XX
X0
+----+
----+
----+
----+
-----+
----+
----+
----+
----+
----+
-----+
----+
----+
-.
'>1
01
520
2530
354
04
55
055
60
6~
70
-i-
,-·-
-+
----+
----·f
----+
j I f I + ! I I I + I I I I + I I I I + I I I I + I i I I [ + ! , I I 4 I I , i +II
',
HI
LES
PER
HD
UR
Fiq
ure
E-
14
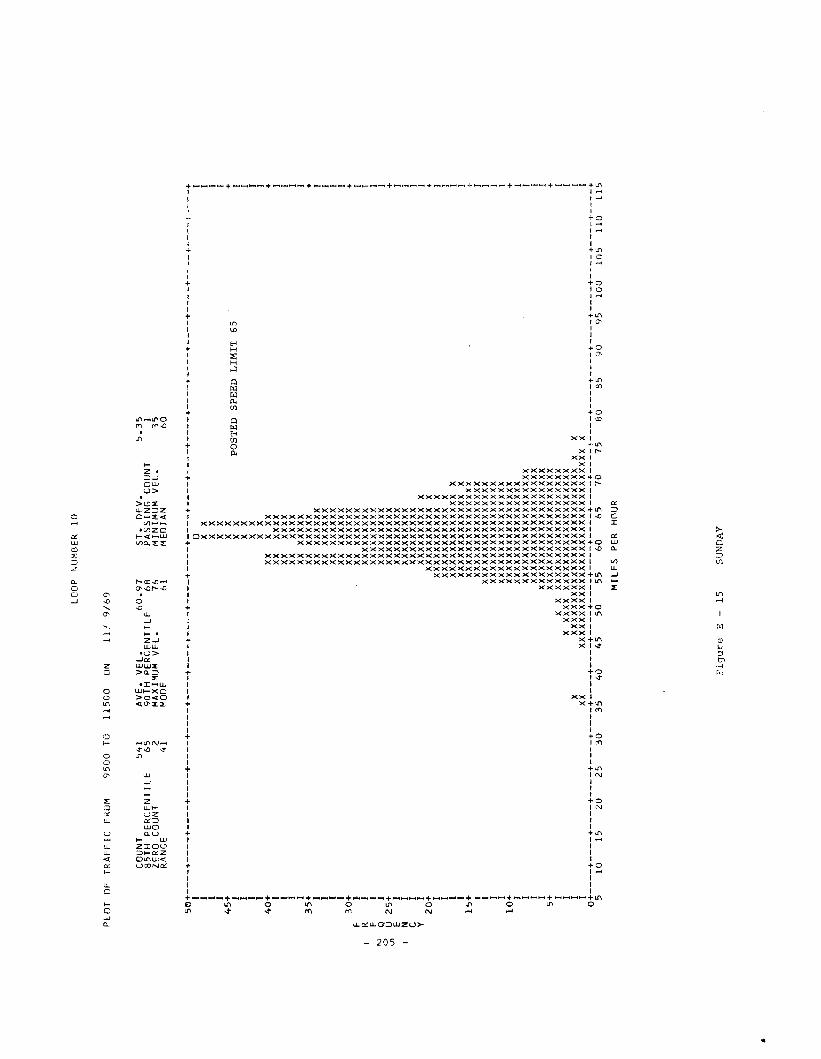
PLO
TO
FT
RA
FF
ICFR
OM
95
00
TO1
15
00
ON
LOO
PN
UM
BER
10
11
.'9
/69
CO
UN
T5
41
85T
HP
ER
CE
NT
ILE
65
ZER
OC
OU
NT
2R
AN
GE
41
AV
E.
VE
L.
60
.97
90T
HP
ER
CE
NT
ILE
68
MA
XIM
UM
VE
L.
76
MO
DE
61
ST
.D
EV
.P
AS
SIN
GC
OU
NT
MIN
IMU
MV
EL
.M
EDIA
N
5.3
5 13
56
0
56
+--
--+
----
+--
--+
----
+--
--+
----
+--
--+
----
+--
--+
----
+--
--+
----
+--
--+
----
+--
--+
----
+--
--+
----
+--
--+
----
+--
--+
----
+1
01
IX
XI
IX
XI
IX
XI
45
!~
~P
OS
TE
DS
PE
ED
LIM
IT6
5;
IX
XI
IX
XI
IX
XI
40
+XX
XXX
+I
XXX
XX
XI
IXX
XX
XX
II
XXX
XX
XI
IXX
XX
XX
XI
35
+XX
XX
XX
X+
IXX
XXX
XX
XI
IXX
XXX
XXX
II
XXX
XX
XX
XI
IXX
XX
XX
XX
I3
0+
XXX
XX
XX
X+
FI-
XXX
XX
XX
XI
RI
XX
XX
XX
XX
XJ
EI
XX
XX
XX
XX
XI
'"Q
IX
XX
XX
XX
XX
I~
U2
5+
XX
XX
XX
XX
X+
EI
XX
XX
XX
XX
XI
NI
xxxx
xxxx
xI
CI
XX
XX
XX
XX
XJ
YI
XX
XX
XX
XX
XX
I2
0+
XX
XX
XX
XX
XX
X+
IX
XX
XX
XX
XX
XX
XI
Ixx
xxxx
xxxx
xX
II
XX
XX
XX
XX
XX
XX
XX
II
XX
XX
XX
XX
XX
XX
XX
I1
5+
XX
XX
XX
XX
XX
XX
XX
X{
IX
XX
XX
XX
XX
XX
XX
XX
II
XX
XX
XX
XX
XX
XX
XX
XX
II
XX
XX
XX
XX
XX
XX
XX
XX
II
xxxx
xxxx
xxxx
xxxx
I1
0+
XX
XX
XX
XX
XX
XX
XX
XX
+I
XX
XX
XX
XX
XX
XX
XX
XX
II
XX
XX
XX
XX
XX
XX
XX
XX
XX
II
xxxx
xxxx
xxxx
xxxx
xxI
IX
XX
XX
XX
XX
XX
XX
XX
XX
XX
I5+
XX
XX
XX
XX
XX
XX
XX
XX
XX
X+
IX
XX
XX
XX
XX
XX
XX
XX
XX
XX
XX
II
XX
XX
XX
XX
XX
XX
XX
XX
XX
XX
XX
XX
II
XX
XX
XX
XX
XX
XX
XX
XX
XX
XX
XX
XX
XX
XX
XI
IXX
XX
XX
XX
XX
XX
XX
XX
XX
XX
XX
XX
XX
XX
XX
XX
XX
I0
+----+
----+
----+
----+
----+
----+
----+
----+
----+
----+
----+
----+
----+
-----t----+
----+
----+
----+
----+
----+
----+
----+
510
152
025
30
35
404
55
05
56
06
57
07
58
08
59
095
10
01
05
11
01
15
MIL
ES
PER
HO
UR
"
Fig
ure
E-
15
SUN
DA
Y
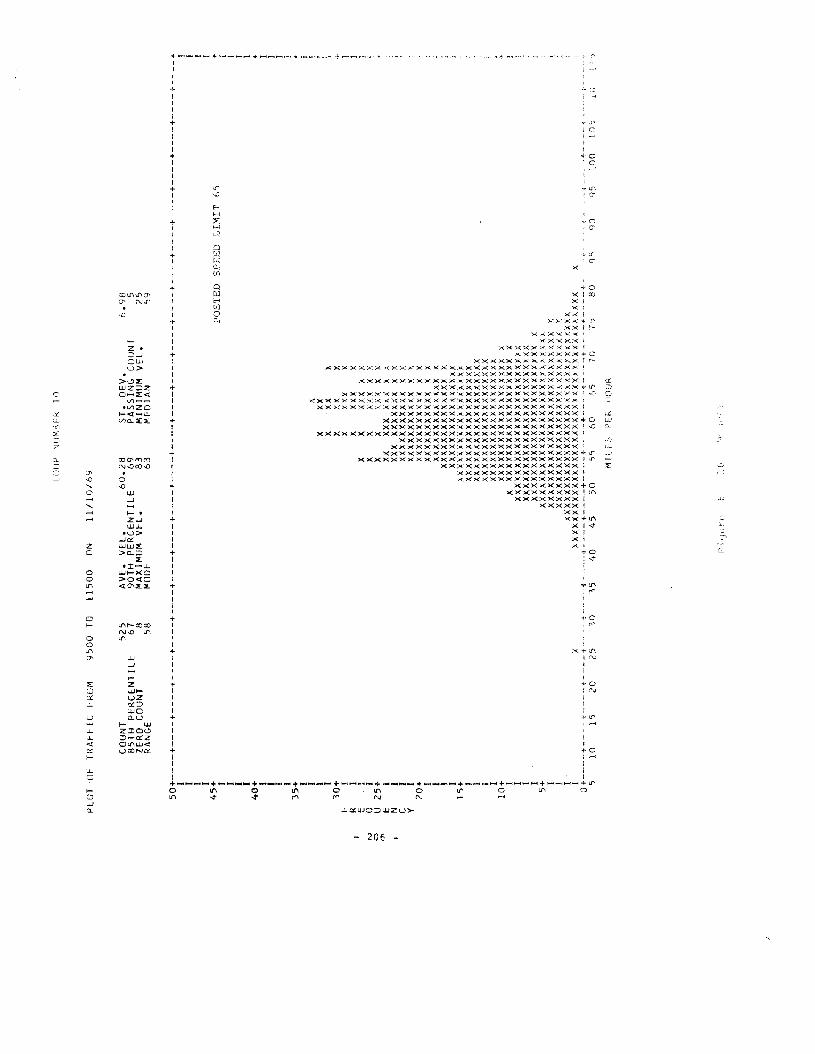
PLO
T-O
fT
RA
fFIC
FRIJ
M9~00
TO1
15
00
ON
LOIJ
PN
UM
Kfk
10
11
11
0/6
9
CO
UN
T5
25
85T
HP
ER
CE
NT
ILE
67
ZER
OC
OU
NT
8R
AN
GE
58
AV
E.
VE
L.
60
.28
90T
HP
ER
CE
NT
ILE
69
MA
XIM
UM
VE
L.
83
MO
DE
63
ST
.D
EV
.P
AS
SIN
GC
OU
NT
MIN
IMU
MV
EL
.M
EDIA
N
6.9
8 52
55
9
j'"
'"o '"
50
+----+
----+
----+
----+
----+
----+
----+
----+
----+
----+
----+
----+
----+
----+
----+
--
,-+
----
+--+
----+
----+
----t-
---
I I I I45~
PO
ST
ED
SP
EE
DL
IMIT
6~
I I I4
0+ 1 I 1 I
35
+ I iX
1X
XXI
Xx
x"-
30
+X
XX
XF
IX
xxx
XR
IX
xxx
XE
IX
XX
x.x
;\X
()i
XX
P.X
X,;
U2
5+
XX
xxx
XX
EI
XXXX
XY
AX
XX
NI
XXX
XX
XX
XX
XX
XC
IX
XX
XX
XX
Xxx
xX
XY
IX
XX
XX
XX
XX
X)(
XX
20
+X
XX
XX
XX
XX
XX
XX
IX
XX
XX
XX
XX
XX
XX
IX
XX
XX
XX
XX
XX
XX
XI
XX
XX
XX
XX
XX
XX
XX
XI
XX
XX
XX
XX
XX
XX
XX
XX
l~+
XX
X)(
)(X
XX
XX
XX
XX
XX
XX
IX
XX
Xxx
XX
XX
XX
XX
XX
XX
IX
XX
XX
XX
XX
XX
XX
XX
XX
XX
IX
XX
XX
XX
XX
XX
XX
XX
XX
XX
IX
XX
XX
XX
XX
XX
XX
XX
XX
XX
10
+X
XX
XX
XX
XX
XX
XX
XX
XX
XX
X~
IX
XX
XX
XX
XX
XX
XX
XX
XX
XX
XX
IX
XX
XX
XX
XX
XX
XX
XX
XX
XX
XX
XX
XI
XX
XX
XX
XX
XX
XX
XX
XX
XX
XX
Xxx
xI
XX
XX
XX
XX
XX
XX
XX
XX
XX
XX
XX
XX
X5+
XX
XX
XX
XX
XX
XX
XX
XX
XX
XX
XX
XX
XX
XI
xx
xx
xx
xx
xx
xx
xx
xx
xx
xx
xx
xx
xx
xX
IX
XX
XX
XX
XX
XX
XX
XX
XX
XX
XX
XX
XX
XX
XI
XX
XX
XX
XX
XX
XX
XX
XX
XX
XX
XX
XX
XX
XX
XX
XX
IX
XX
XX
XX
XX
XX
XX
XX
XX
XX
XX
XX
XX
XX
XX
XX
XX
XX
XX
XX
XX
G'f'--~"--"··+--'·"-
~..."
.".,-"
-+_.
_,._
-,,+
t,o'..
,-I
",+_·,,~-~-+-,,-,-""-,+_·_·"--,t,·_·"
_.,,~+-"'--
"~i···~·_·_,,~,-t·_~
•.~.,+-
-_..{
t-'-~--'--'----'-i"'-~"---"'.f
I
51
01
52
02
5'3
03
54
04
55
05
56
0&
57
07
58
0OC
-9
095
iOO
JO')
1.:)
MIL
FS
PE
R'~I:JUR
i-':
jdre1
'f~
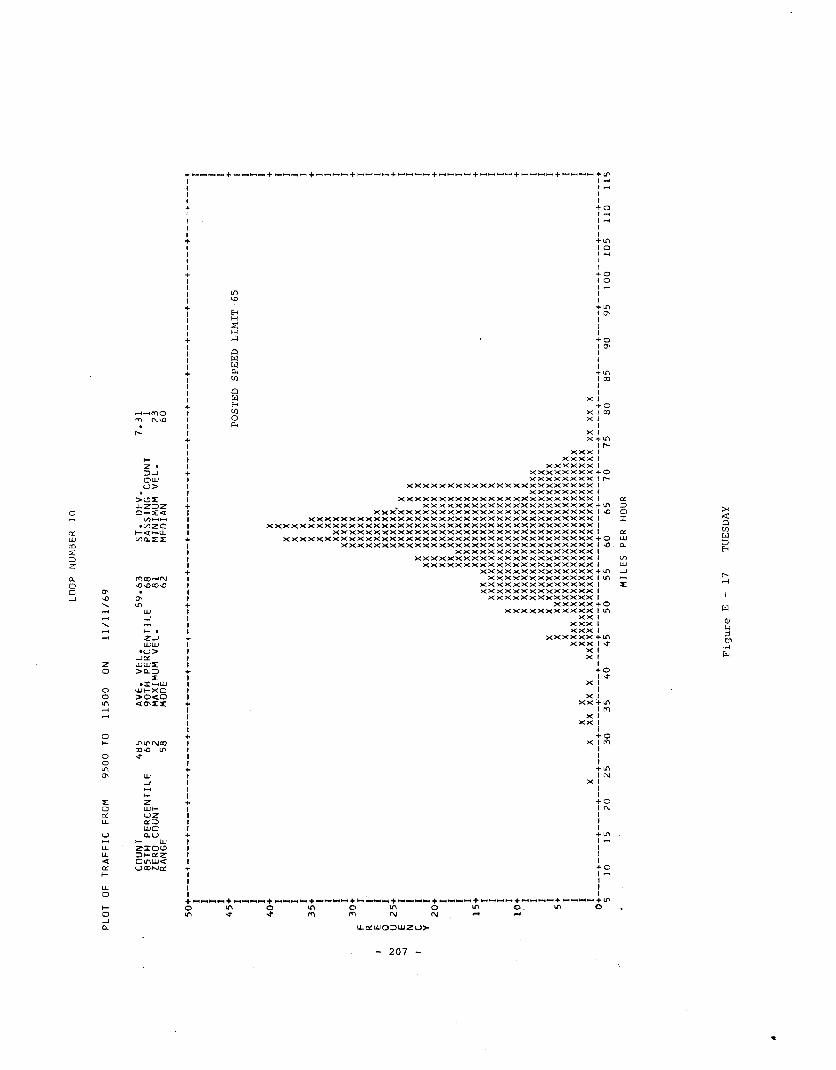
PL
OT
OF
TR
AF
FIC
FR
OM
95
00
TO1
15
00
ON
LOO
PNU~lBER
10
11
/11
/69
CO
UN
T4
B5
85
TH
PE
RC
EN
TIL
E6
5Z
ER
OC
OU
NT
2R
AN
GE
58
AV
E.
VE
L.
59
.63
90
TH
PE
RC
EN
TIL
E6
8M
AX
IMU
MV
EL
.8
1M
OD
E6
2
ST
.D
EV
.P
AS
SIN
GC
OU
NT
MIN
IMU
MV
EL
.M
ED
IAN
7.3
1 12
36
0
IV o ....
50
+----+
----+
----+
----+
----+
----+
----+
----+
----+
----+
----+
----+
----+
----+
----+
----+
----+
----+
----+
----+
----1
-----+
II
II
II
II
45
!P
OS
TE
DS
PE
ED
LIM
IT6
5r
II
II
II
40
+X
+I
XI
IX
XI
IX
XI
IX
XI
35
+X
XX
+I
XX
XI
IX
XX
II
XX
XX
II
XX
XX
XI
30
+X
XX
XX
+F
rX
XX
XX
IR
Ixx
xxx
IE
IX
XX
XX
XI
QJ
XX
XX
XX
IU
25
+xxxxx~
+E
IX
XX
XX
XX
IN
IX
XX
XX
XX
XI
CI
XX
XX
XX
XX
Xr
YI
XX
XX
XX
XX
XX
XI
20
+X
XX
XX
XX
XX
XX
+I
XX
XX
XX
XX
XX
XI
IX
XX
XX
XX
XX
XX
II
XX
XX
XX
XX
XX
XX
II
xxxx
xxxx
xxx
XI
15
+X
XX
XX
XX
XX
XX
X+
JX
XX
XX
XX
XX
XX
XX
XX
I1
xxxx
xxxx
xxxx
xxxx
XI
Ixx
xxxx
xxxx
xxxx
xxX
II
Xxx
xxxx
xxxx
xxxx
xxX
I1
0+
XX
XX
XX
XX
XX
XX
XX
XX
XX
+I
XX
XX
XX
XX
XX
XX
XX
XX
XX
II
XX
XX
XX
XX
XX
XX
XX
XX
XX
XX
XI
IX
XX
XX
XX
XX
XX
XX
XX
XX
XX
XX
II
XX
XX
XX
XX
XX
XX
XX
XX
XX
XX
XX
XI
5+
XX
XX
XX
XX
XX
XX
XX
XX
XX
XX
XX
XX
+I
Xxx
xxxx
xxxx
xxxx
xxxx
xxxx
xxI
JX
XX
XX
XX
XX
XX
XX
XX
XX
XX
XX
XX
XX
XX
XX
II
XX
XX
XX
XX
XX
XX
XX
XX
XX
XX
XX
XX
XX
XX
XX
XX
II
XX
XX
XX
XX
XX
XX
XX
XX
XX
XX
XX
XX
XX
XX
XX
XX
XX
XX
XX
Xxx
xxX
I0
+----+
----+
----+
----+
----+
----+
----+
----+
----+
----+
----+
----+
----+
----+
----+
----+
----+
----+
----+
----+
----+
----+
51
01
52
02
53D
35
40
45
50
55
60
65
70
75
80
85
90
95
10
01
05
11
01
15
MIL
ES
PE
RH
OU
R
"
Fig
ure
E-
17
TU
ES
DA
Y
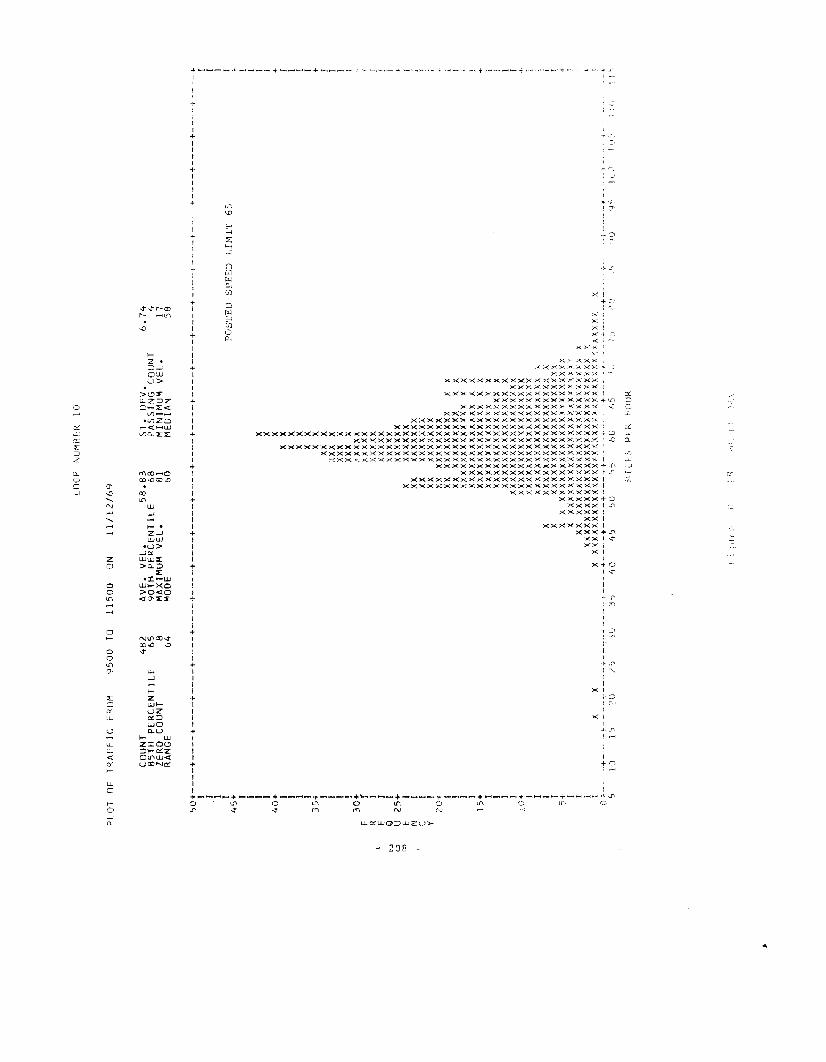
1I10
PN
UM
iHk
10
PLO
TO
FT
RA
FF
ICFR
OM
95
00
TO1
15
00
ON
11
/12
/69
CO
UN
T4
82
85T
HP
ER
CE
NT
ILE
65
ZER
OC
OU
NT
8R
AN
GE
64
AV
E.
VE
L.
58
.83
90T
HP
ER
CE
NT
ILE
68
MA
XIM
UM
VE
L.
81M
OD
E6
0
ST
.O
EV
.P
AS
SIN
GC
OU
NT
MIN
IMU
MV
EL
.M
ED
IAN
6.7
4 41
75
8
1 I I I + I 1 I I + J I I I
-,~
"
.---
-+--
--+
----
-1--
+ I I I r •
--,/J~
I
':0
·_·t
--_
·
"
POST
ED
SP
EE
DL
IMIT
6S
x X (XX
XXX
X+
----+
-_
..!)
X X XX
XX
XX
XX
XX
X
vv
vv
'V1
\/\1
'./\"
XXX
XXX
XXX
XX
XXX
X,<
XX
XX
XX
XX
X
50
It5
~XxXX
XX
XX
XX
XX
XX
XX
XX
XX
XX
XXX
XX
XX
XX
XXX
XX
XX
XX
XXX
XX
XX
XX
xxX
XX
XX
XX
XXX
XX
XX
XX
XX
XX
XXX
XX
XX
XX
XX
XX
XX
XX
XX
XX
XX
XX
XX
XX
xx
xx
xx
xx
xX
XX
XX
XX
XX
XX
XX
XX
XX
XX
XX
XX
XX
XX
XX
XX
XX
XX
XX
XX
XX
XX
XX
XX
XX
XX
XX
XX
XX
XX
XX
XX
XX
XX
XX
XX
XX
XX
XX
XX
XX
XX
XX
XX
XX
XX
XX
XX
XX
XX
XX
XX
XX
XX
XX
XX
XX
XX
XX
XX
XX
XX
XX
XX
XX
XX
XX
XX
XX
XX
X,
XX
XX
XX
XX
XX
XX
XX
XX
XX
XX
Xxx
xxxx
xxxx
xxxx
xxxx
xxX
Xxx
xxxx
xxxx
xxxx
xxxx
xxx
XX
XX
XX
XX
XX
XX
XX
XX
XX
XX
XX
XX
xx
XX
XX
XX
XX
XX
XX
XX
XX
XX
XX
Xxx
XX
XX
XX
XX
XX
XX
XX
XX
XX
XX
XX
XX
XX
XX
XX
XX
XX
XX
XX
XX
XX
XxX
XX
XX
XX
XX
XX
XX
X-+
----
+",
----
-."!
--".
"---
..+.-+
,----
-·i
S~
60
/,5
'1·0
--:
.",-+,
.,...._.
~..
1-.~"-"
')~)
,?,~)
x
~o
x
1"
y
50
+----+
----+
----+
----+
----+
----+
----+
----+
----+
----+
----+
----+
----+
----+
----+
----
I I I I4
5+ I I I I
40
+ I I I I3
5'" I I I !
30
+r
rR
IE
IQ
IU
25
+E
IN
Ir
I !')
(H<
,~
I I I i1
5+ I ! I !
0+ I I I I
:5+ I ! I !
~..+
--i
-
S1
0
l'~
a .::0
i"I
Lt
SP
tR
HU
UR
;'J'
tI"
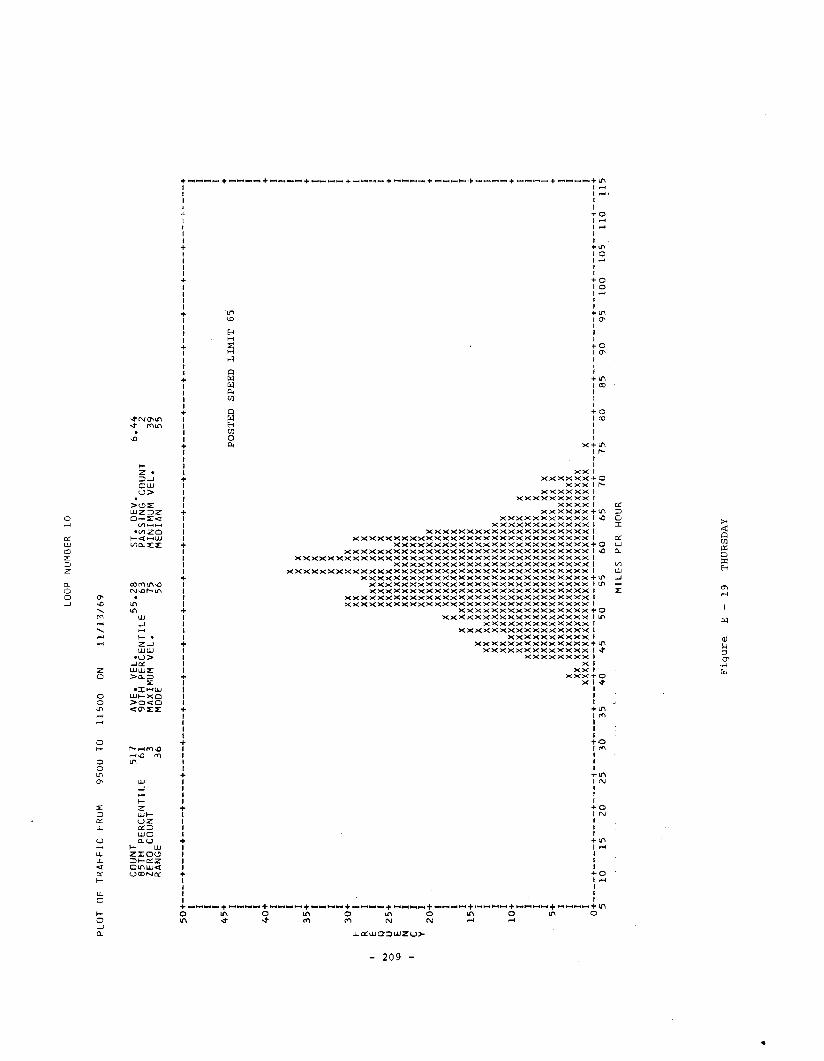
PLO
TO
FT
RA
FF
ICFR
OM
95
00
TO1
15
00
ON
LOO
PN
UM
BER
10
11
/13
/69
CO
UN
T5
17
85T
HP
ER
CE
NT
ILE
61
ZE
RO
CO
UN
T3
RA
NG
E3
6
AV
E.
VE
L.
55
.28
90T
HP
ER
CE
NT
ILE
63
MA
XIM
UM
VE
L.
75
MO
DE
56
ST
.D
EV
.P
AS
SIN
GC
OU
NT
MIN
IMU
MV
EL
.M
ED
IAN
6.4
4 23
95
5
~
'"o '"
50
+----+
----+
----+
----+
----+
----+
----+
----+
----+
----+
----+
----+
----+
----+
----+
----+
----+
----+
----+
----+
-----,-
---+
II
II
II
II
45
++
IPO
STE
DSP
EE
DL
IMIT
65
II
II
JI
I4
0+
+I
II
II
XI
IX
XI
35
+X
X+
IX
XI
IX
XI
IX
XI
IX
XI
30
+XX
XXX
+F
IXX
XXX
XI
RI
XXXX
XXX
IE
IX
XX
XX
XXX
XI
QI
XX
XX
XX
XXX
JU
25
+X
XX
XX
XXX
X+
EI
XX
XX
XX
XX
XX
XI
NI
XX
XX
XX
XX
XX
XI
CI
XX
XX
XX
XX
XX
XI
YI
XX
XX
XX
XX
XX
XI
20
+X
XX
XX
XX
XX
XX
X+
IX
XX
XX
XX
XX
XX
XI
IX
XX
XX
XX
XX
XX
XX
II
XX
XX
XX
XX
XX
XX
XI
IX
XX
XX
XX
XX
XX
XX
XX
I1
5+
XX
XX
XX
XX
XX
XX
XX
X+
jX
XX
XX
XX
XX
XX
XX
XX
XJ
IXX
XX
XX
XX
XX
XX
XX
XX
XX
II
XXX
XX
XX
XX
XX
XX
XX
XX
XX
II
XXX
XX
XX
XX
XX
XX
XX
XX
XX
XI
10
+X
XX
XX
XX
XX
XX
XX
XX
XX
XX
XX
+I
XX
XX
XX
XX
XX
XX
XX
XX
XX
XX
XX
II
XX
XX
XX
XX
XX
XX
XX
XX
XX
XX
XX
XI
IX
XX
XX
XX
XX
XX
XX
XX
XX
XX
XX
XX
II
XX
XX
XX
XX
XX
XX
XX
XX
XX
XX
XX
XXX
XI
5+
XX
XX
XX
XX
XX
XX
XX
XX
XX
XX
XX
XXX
X+
IX
XX
XX
XX
XX
XX
XX
XX
XX
XX
XX
XX
XX
XX
II
XX
XX
XX
XX
XX
XX
XX
XX
XX
XX
XX
XX
XX
XX
XI
IXX
XX
XX
XX
XX
XX
XX
XX
XX
XX
XX
XX
XX
XX
XX
XI
Ixx
xxxx
xxxx
xxxx
xxxx
xxxx
xxxx
xxxx
xxx
XI
0+
----+
----+
----+
----+
----+
----+
----+
----+
----+
----+
----+
----+
----+
----+
----+
----+
----+
----+
----+
----+
----+
----+
51
01
52
02
53
03
54
04
55
05
56
06
57
07
58
08
59
09
51
00
10
51
10
11
5
MIL
ES
PER
HO
UR
Fig
ure
E-
19
THU
RSD
AY
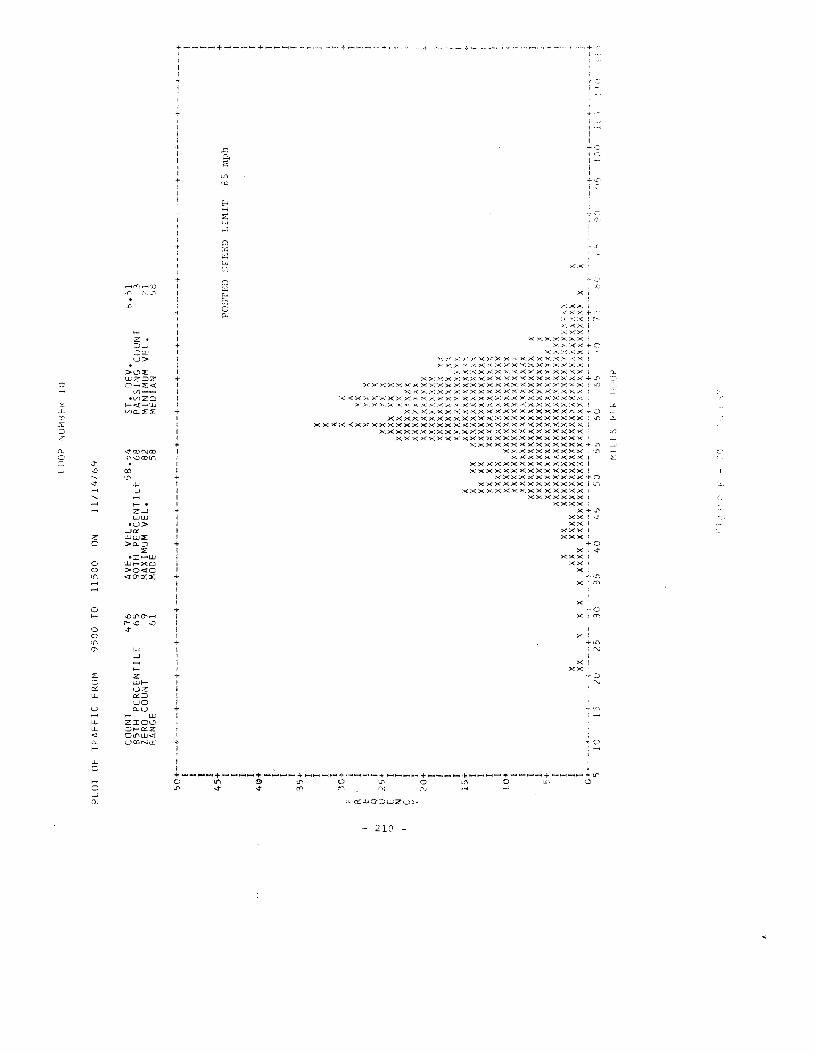
LlJO
P''J
UH
lll-k
10
PLO
TO
FT
RA
FFIC
FRO
M9
50
0TO
11
50
0ON
11
/14
/69
CO
UN
T85
TH
PER
CE
NT
ILE
ZER
OC
OU
NT
PAN
GE
47
66
5 96
1
AV
E.
VE
L.
58
.54
90T
HPE
RC
EN
TIL
E68
MA
XIM
UM
VE
L.
82
MOD
E5
8
ST
.D
EV
.PA
SSIN
GC
OU
NT
MIN
IMU
MV
EL
.t~EDIAN
K.5
1 3?l
'.)B
POST
ED
~PEED
LIM
IT
1(\
F,5
mph
+._
--.-
--+
..._
--t
''-is
10
0
---+--,--+----,~
+--
-
;
A X
(·_1
i()
-+--
--+
----
+--
._--
-+--
--
X X X XX
AX
X(X
vvv
V,'
.1'\
'"x
X~
XXX
X~
XX
XX
XXX
XX
XX
XXX
XX
XX
X"X
XX
XX
XX
XX
iXX
XX
XX
XX
XX
XX
.Y.X
XX
.x,,
\XX
XX
XX
XX
XX
XX
XX
,,,
XX
XX
XX
XX
XX
XXX
XX
XX
iXX
XX
XY
XX
AX
AX
AA
AX
AX
XX
\X
XXX
XX
XX
XX
XX
XX
XX
XXX
XXX
XX
XX
XX
XX
XX
XX
XXX
XXX
XX
XX
XX
XX
XX
XX
XX
XX
XX
XX
XX
XX
XX
XX
XX
XX
XX
XX
XX
XX
XX
XX
XX
XX
XX
XX
XX
XX
XX
XX
XX
XX
XX
XX
XX
XX
XX
XX
XX
XX
XX
XX
XX
XX
XX
XX
XX
XX
XX
XX
XX
XX
XX
XX
XX
XX
XX
XX
XX
XX
XX
XX
XX
XX
XX
XX
XX
XX
XX
XX
XX
XX
XX
XX
XX
XX
XX
XX
XX
XX
XX
XX
XX
XX
XX
XX
XX
XX
XX
XX
XX
XX
XX
XXX
XXX
XX
XX
XX
XX
XX
XX
XX
XX
XX
XX
XX
XXX
XXXX
XX
XX
XX
XX
XX
XX
XX
XX
XX
XX
XX
XX
XX
XX
XX
XX
XX
XX
XX
XX
XX
XX
XX
XX
XX
XX
XX
XX
XX
XX
XX
XX
XX
.~.,~,.."
+-
.",.-
+"-,
-~.,
..-f-
I·i·
-_..
+--
-_
,-+4
04
55
05
56
06
5
x XXX
XX
Xj,
20
75
30
35
1.'j
15
+ I I I I1
0+ I I I I
5+I r I I
0+
-,-._~.
.,1
0
f R t y
50
+----+
----+
----+
----+
----+
----+
----+
----+
----+
----+
----+
----+
-
I I I I4
5+ I I I I
40
+ I I I I3
5+ ! I I I
30"} I I !
Qj
U2
5+
EI
NI
CI r
20
+ I I I r
'.J 1-'
o
~;I
L[S
!)f
F.
#
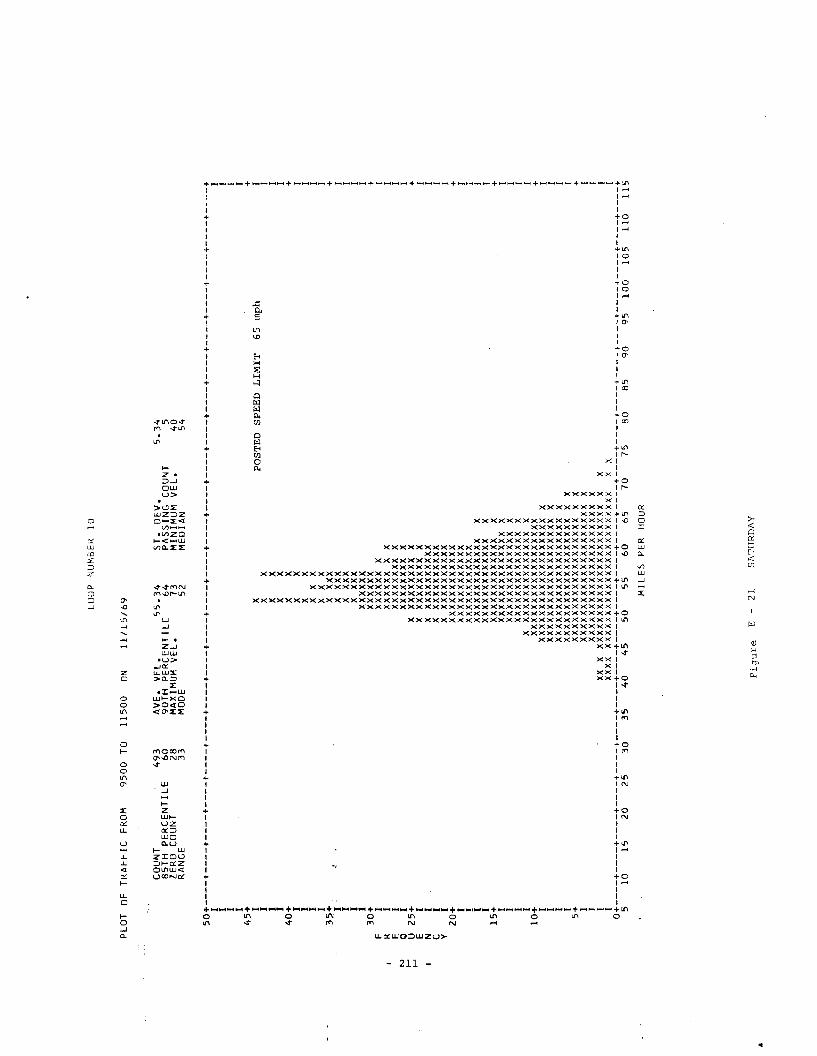
PLO
TO
FT
RA
FFIC
FRO
M9
50
0TO
11
50
0ON
LOO
PN
UM
BER
10
11
11
5/6
9
CO
UN
T85
TH
PER
CE
NT
ILE
ZER
OC
OU
NT
RAN
GE
49
3 60 28 33
AV
E.
VE
L.
55
.34
90T
HPE
RC
EN
TIL
E6
4M
AX
IMU
MV
EL
.73
MO
DE
52
ST
.O
EV
.P
AS
SIN
GC
OU
NT
MIN
IMU
MV
EL
.M
EDIA
N
5.3
4 54
0 54
'".... ....
50
+--
--+
----
+--
--+
----
+--
--+
----
+--
--+
----
+--
--+
----
+--
--+
----
+--
--+
----
+--
--+
----
+--
--+
----
+--
--f-
---+
----
+--
--+
II
II
II
II
45
++
IX
PO
ST
ED
SP
EE
DL
IMIT
65m
ph
II
XX
II
XX
II
XX
I4
0+
XX
+I
XX
II
XX
II
XX
XI
IX
XX
I
35.;
~~
~~~
;I
XX
XX
II
XX
XX
II
XX
XX
XX
I3
0+
XX
XX
XX
+F
IX
XX
XX
XX
IR
IX
XX
XX
XX
XI
EI
XX
XX
XX
XX
XI
QI
XX
XX
XX
XX
XI
U2
5+
XX
XX
XX
XX
XX
+E
IX
XX
XX
XX
XX
XI
NI
XX
XX
XX
XX
XX
XI
CI
XX
XX
XX
XX
XX
XI
YI
XX
XX
XX
XX
XX
XI
20
+X
XX
XX
XX
XX
XX
X+
IX
XX
XX
XX
XX
XX
XI
!X
XX
XX
XX
XX
XX
XI
IX
XX
XX
XX
XX
XX
XX
XI
IX
XX
XX
XX
XX
XX
XX
XI
15
+X
XX
XX
XX
XX
XX
XX
X+
IX
XX
XX
XX
XX
XX
XX
XX
II
XX
XX
XX
XX
XX
XX
XX
XI
IX
XX
XX
XX
XX
XX
XX
XX
II
XX
XX
XX
XX
XX
XX
XX
XX
I1
0+
XX
XX
XX
XX
XX
XX
XX
XX
XX
+I
xxxx
xxxx
xxxx
xxxx
xxx
XI
IX
XX
XX
XX
XX
XX
XX
XX
XX
XX
XI
IX
XX
XX
XX
XX
XX
XX
XX
XX
XX
XI
IX
XX
XX
XX
XX
XX
XX
XX
XX
XX
XX
I5+
XX
XX
XX
XX
XX
XX
XX
XX
XX
XX
X+
IX
XX
XX
XX
XX
XX
XX
XX
XX
XX
XX
XI
IX
XX
XX
XX
XX
XX
XX
XX
XX
XX
XX
XI
IXX
XX
XX
XX
XX
XX
XX
XX
XX
XX
XX
XX
XX
XI
IX
XX
XX
XX
XX
XX
XX
XX
XX
XX
XX
XX
XX
XX
XX
XI
0+
----
+--
--+
----
+--
--+
----
+--
--+
----
+--
--+
----
+--
--+
----
+--
--+
----
+--
--+
----
+--
--+
----
+--
--+
----
+--
--+
----
+--
--+
510
1520
25
30
35
40
45
50
55
60
657
07
58
085
9095
10
01
05
11
011
5
MIL
ES
PER
HO
UR
..F
igu
reE
-2
1SA
TUR
DA
Y
mornlng until Monday niyllt. when rain was recorded. Tuesdav
and Wednesday, the roads were d~v; Thursday it rained all day.
About 1300 on Friday, Ute rain turned to snm·l,. and Saturday
night some snow was still present.
IT· ;fl\'Jay 37 is heavily travc,llc:,c], and the roads dry
rapidly once precipitation was stopped. Precipitotion dGe~
not seem to have: h2':c) Flue'l c:E f:< during c:his peri \j()te r
also that the volume oj: \.'c' lC.iC~: during t-Lj3 time pc'ciod
shows surprisingly little var ation from 541 on Sunday to 4'
on Friday.
3.0 SPATIAL DISTRIBUTIONS
Figures E-22 through E-34 demonstrate how speed distribu-
tions vary with location. The locations chosen are those in
the northbound lanes of Indiana Highway 27 and include loops
7, 6, 5, 4, 26, 12, 27, 28, 29, 30, 13, 14, and 15. Loop 7
is the southernITlost loop, and the rest are in their spatial
order north of loop 7. These 10005 are described in more
detail in Appendix B. The date chosen was November 6, 1969,
a dry day, between 1600 and 1800.
The volume increases noticably from loop 7 through loop 4,
as Bloomington is apprcY:Lc'ned fn)l1l the south, and decreases
from loop 26 through loop 15, as Bloomington is left by
vehicles going north. Loop 4 shows a distinct skew to the
- 212 -
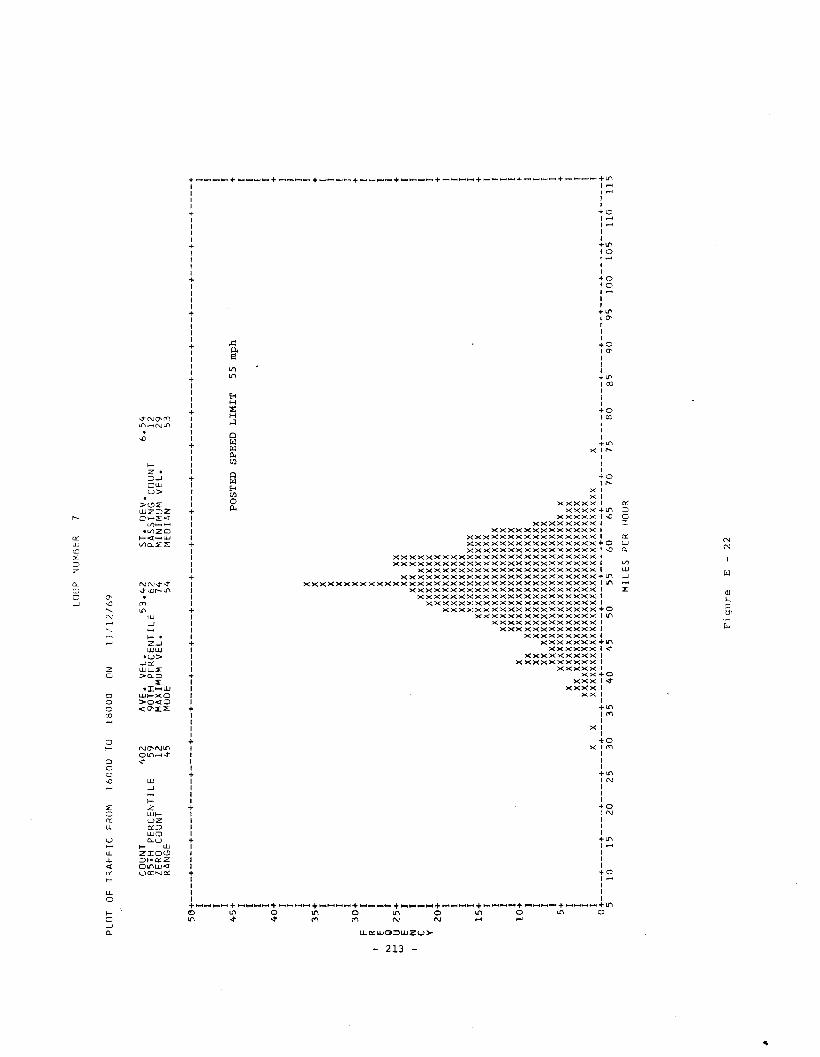
PLO
TO
FT
RA
FFIC
FRO
M1
60
00
TO1
80
00
ON
LOO
PN
UM
BER
7
11
/12
/69
CO
UN
TA
5TH
PER
CE
NT
ILE
ZER
OCO
UN
TRA
NG
E
40
2 59 12 45
AV
E.
VE
L.
53
.42
90T
HPE
RC
EN
TIL
E62
MA
XIM
UM
VE
L.
74
MOD
E5
4
ST
.D
EV
.PA
SSIN
GCO
UN
TM
INIM
UM
VE
L.
r~EDIAN
6.5
4 12 29 53
,.
56
+--
--+
----
+--
--+
----
+--
--+
----
+--
--+
----
+--
--+
----
+--
--+
----
+--
--+
----
+--
--+
----
+--
--+
----
+--
--+
----
+--
--+
----
+I
II
II
II
I4
5+
PO
ST
ED
SP
EE
DL
IMIT
55m
ph
+I
II
II
II
I4
0+
+I
II
II
II
XI
35
+X
+I
XI
IX
II
XI
IX
I3
0+
X+
FI
XI
RI
X1
EI
XI
IVQ
IX
I....
.U
25
+X
XX+
wE
IXX
XXI
NI
XXX
XXI
CI
XX
XX
XX
XI
YI
XX
XX
XX
XX
I2
0+
XX
XX
XX
XX
+I
XX
XX
XX
XX
XI
IX
XX
XX
XX
XX
II
XX
XX
XX
XX
XI
!X
XX
XX
XX
XX
XX
Xi
15
+X
XX
XX
XX
XX
XX
XX
+I
XX
XX
XX
XX
XX
XX
XI
IX
XX
XX
XX
XX
XX
XX
XX
II
XX
XX
XX
XX
XX
XX
XX
XX
II
XX
XX
XX
XX
XX
XX
XX
XX
I1
0+
XX
XX
XX
XX
XX
XX
XX
XX
X+
IXX
XX
XX
XX
XX
XX
XX
XX
XX
XI
IXX
XX
XX
XX
XX
XX
XX
XX
XX
XX
II
XXX
XX
XX
XX
XX
XX
XX
XX
XX
XX
II
xxxx
xxxx
xxxx
xxxx
xxxx
xxI
5+X
XX
XX
XX
XX
XX
XX
XX
XX
XX
XX
XX
XX
+I
XX
XX
XX
XX
XX
XX
XX
XX
XX
XX
XX
XX
XX
XI
Ixx
XX
XX
XX
XX
XX
XX
XX
XX
XX
XX
XX
XX
XX
II
XX
XX
XX
XX
XX
XX
XX
XX
XX
XX
XX
XX
XX
XX
XX
II
XX
XX
XX
XX
XX
XX
XX
XX
XX
XX
XX
XX
XX
XX
XX
XX
XX
XI
o+----+----+----+----+----~----+----+----+----+----+----+----+----+----+----+----+----+----+----+----+----+----+
510
1520
2530
35
40
45
50
55
60
657
075
80
859
095
10
01
05
11
01
15
MIL
ES
PER
HO
UR
Fig
ure
E-
22
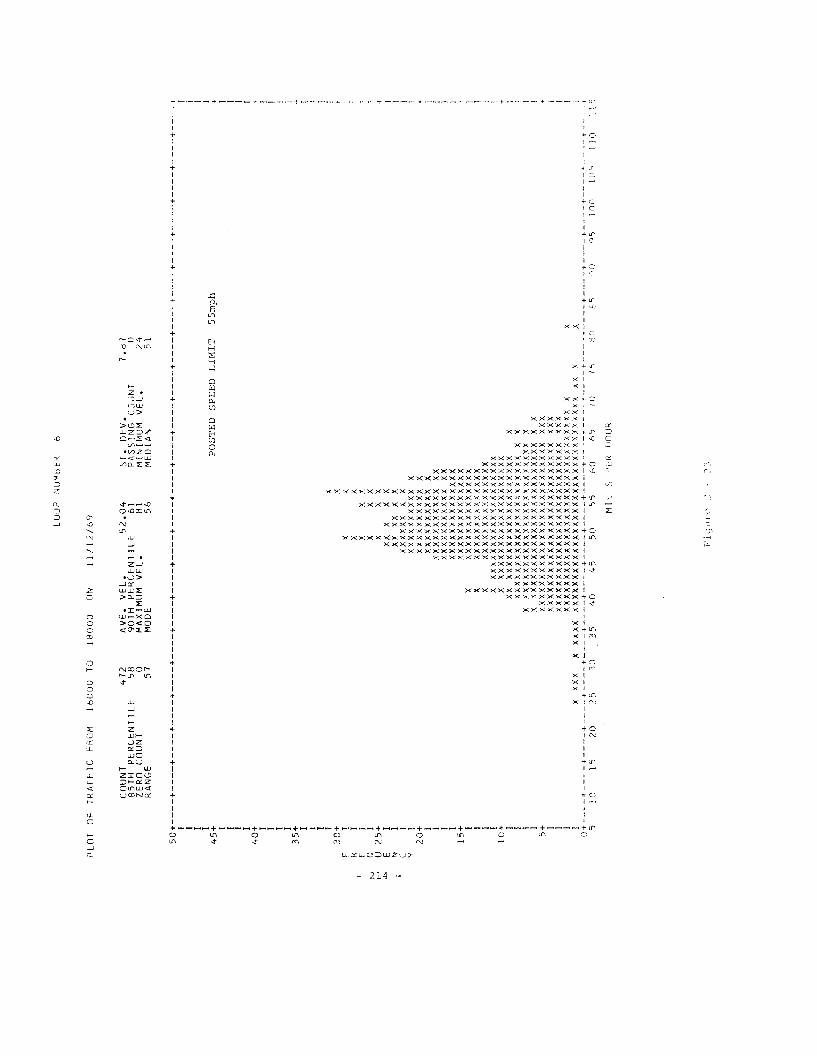
LUU
PN
UM
tH'k
6
PLO
TO
FT
RA
FF
ICFR
UM
16
00
0TO
18
00
0ON
11
11
2/6
9
CO
UN
T85
TH
PE
RC
EN
T!
LEZE
RO
CO
UN
TR
AN
GE
47
2 58o
57
AV
E.
VE
L.
52
.04
90T
HP
ER
CE
NT
ILE
61M
AX
IMU
MV
EL
.81
MO
DE
56
51
.D
EV
.P
AS
SIN
GC
OU
NT
tHNII~U"1
VE
L.
MED
IAN
7.
81 o
24
51
55
mp
hPO
STE
DSP
EE
DL
IMIT
F R
50
+----+
----+
----+
----+
----+
----+
----+
----+
----+
----+
----+
----+
----+
----+
----+
----t-
---t-
---+
---+
----+
----+
----
I I I I4
5+ I I I I
'+0
+ I I I I3
5+ I I I 1
X3
0+
X!
XX
IX
XE
IX
XX
()I
xX
XU
;,5+
XX
XE
Ixx
XX
XN
IXX
XXX
XC
IX
XX
XX
XX
XY
IX
XX
XX
XX
XX
XX
20
+X
XX
XX
XX
XX
XX
IX
XX
XX
XX
XX
XX
I/.X
XX
XX
XX
XX
XXX
IX
XX
XX
XX
XX
XX
XXI
XX
XX
XX
XX
XX
XX
XX
15
+X
XX
XX
XX
XX
XX
XX
XI
XX
XX
XX
XX
XX
XX
XX
XI
XX
XX
XX
XX
XX
XX
XX
X1
XX
XX
XX
XX
XX
XX
XX
XX
IX
XX
XX
XX
XX
XX
XX
XX
XX
XX
X1
0+
XX
XX
XX
XX
XX
XX
XX
XX
XX
XX
IXX
XX
XX
XX
XX
XX
XX
XX
XX
XX
XX
IX
XX
XX
XX
XX
XX
XX
XX
XX
XX
XX
XX
X1
X'X
XX
XX
XX
XX
XX
XX
XX
XX
XX
XX
XX
XI
XX
XX
XX
XX
XX
XX
XX
XX
XX
XX
XX
XX
XX
X5+
XX
XX
XX
XX
XX
XX
XX
XX
XX
XX
XX
XX
XX
XXX
IX
XX
XX
XX
XX
XX
XX
XX
XX
XX
XX
XX
XX
XXX
XI
XX
XX
XX
XX
XX
XX
XX
XX
XX
XX
XX
XX
XX
xxx
IX
XX
XX
XX
XX
XX
XX
XX
XX
XX
XX
XX
XX
XX
XX
XX
XX
IX
XXX
XX
XX
XX
XX
XX
XX
XX
XX
XX
XX
XX
XX
XX
XX
XX
XX
XX
XX
XX
xxX
X0
+----+
----+
-----+
----+
----+
----+
----+
----+
----+
----+
----+
----+
----+
----+
----i·-
---+
----+
----+
-----+
----+
---._
+5
1015
202
5)0
35
40
'.5
50
556
01,
510
h:-!
O5
'()'1
51
00
lc;
1]0
]1
tv 1-.,,' ...
MlL
iSI'
!Yii[l
UR
'F'i
qlt
tJ""
73
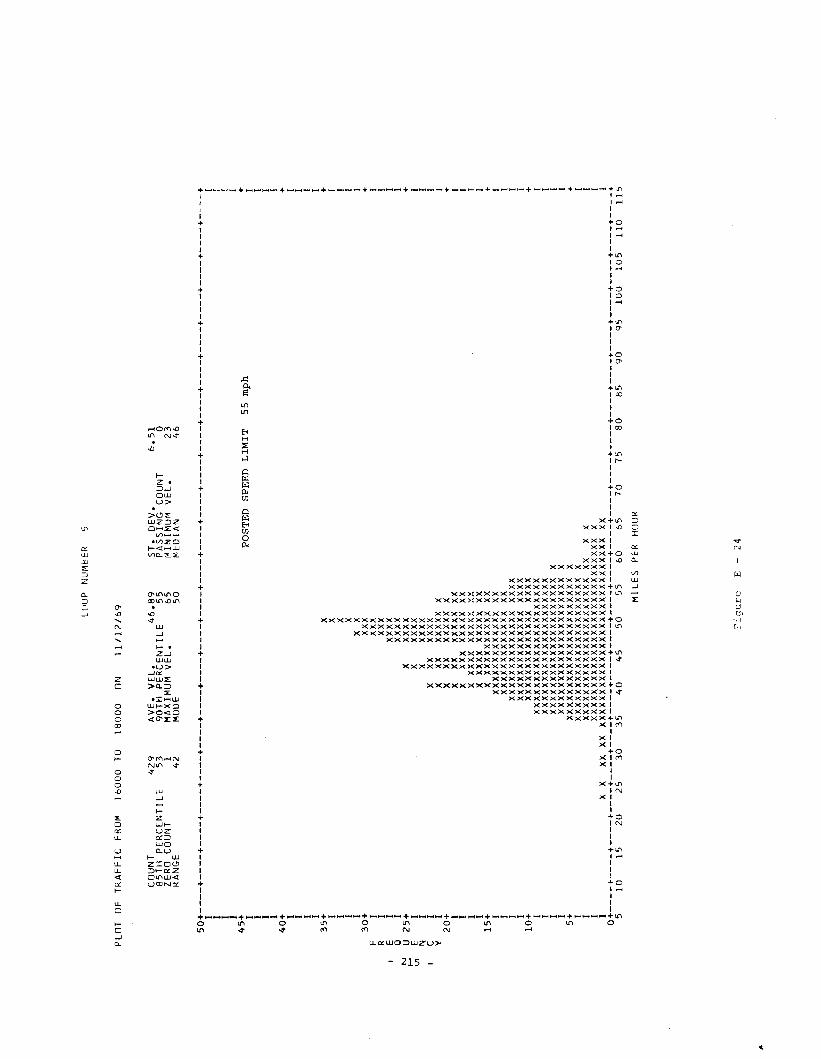
PLO
TO
FT
RA
FF
ICFR
OM
16
00
0TO
18
00
0O
N
LOO
PN
UM
BER
5
11
/12
/69
CO
UN
TB
5TH
PE
RC
EN
T!
LEZ
ER
OC
OU
NT
RA
NG
E
42
95
3 14
2
AV
E.
VE
L.
46
.89
90T
HP
ER
CE
NT
ILE
55
MA
XIM
UM
VE
L.
65
MO
DE
50
ST
.D
EV
.P
AS
SIN
GC
OU
NT
MIM
IMU
MV
EL
.M
ED
IAN
6.5
1 o2
34
6
,.
'"..... VI
50
+----+
----+
----+
----+
----+
----+
----+
----+
----+
----+
----+
----+
----+
----+
----+
----+
----+
----+
----+
----+
----+
----+
II
II
I!
II
451
PO
ST
ED
SP
EE
DL
IMIT
55
mp
h1
II
II
1I
40
++
II
II
II
II
35
+X
+I
XI
IX
II
XI
IX
XI
30
+X
XX
+F
Ixx
xI
RI
XX
XI
EI
XX
XX
IQ
IX
XX
XI
U2
5+
XX
Xx
X+
EI
XX
XX
XI
!III
XX
XX
XI
CI
XXX
XX
XX
IY
IX
XXXX
XX
XX
I2
0+
XXX
XX
XX
XX
+I
XXX
XX
XX
XX
XI
IX
XX
XX
XX
XX
XXI
IX
XX
XX
XX
XX
XXX
II
XX
XX
XX
XX
XX
XXI
15
+X
XX
XX
XX
XX
XX
XX+
IX
XX
XX
XX
XX
XX
XX
XXI
Ixx
xxxx
xxxx
xxx
XX
II
XX
XX
XX
XX
XX
XX
XX
XX
XX
II
XX
XX
XX
XX
XX
XX
XX
XX
XX
I1
0+
XX
XX
XX
XX
XX
XX
XX
XX
XX
+I
XX
XX
XX
XX
XX
XX
XX
XX
XX
XX
XI
IX
XX
XX
XX
XX
XX
XX
XX
XX
XX
XX
II
XX
XX
XX
XX
XX
XX
XX
XX
XX
XX
XX
II
XX
XX
XX
XX
XX
XX
XX
XX
XX
XX
XX
I5
+X
XX
XX
XX
XX
XX
XX
XX
XX
XX
XX
XX
+I
XX
XX
XX
XX
XX
XX
XX
XX
XX
XX
XX
XI
IX
XX
XX
XX
XX
XX
XX
XX
XX
XX
XX
XXX
XX
II
XX
XX
XX
XX
XX
XX
XX
XX
XX
XX
XX
XX
XX
XX
XI
IX
XXX
xx
XX
XX
XX
XX
XX
XX
XX
XX
XX
XX
XX
XX
XX
XX
XX
XI
0+
----+
----+
----+
----+
----+
----+
----+
----+
----+
----+
----+
----+
----+
----+
----+
----+
----+
----+
----+
----+
----+
----+
51
01
52
02
53
03
54
04
55
05
56
06
57
07
58
08
59
09
51
00
10
51
10
11
5
MIL
ES
PER
HO
UR
Fig
ure
E-
24
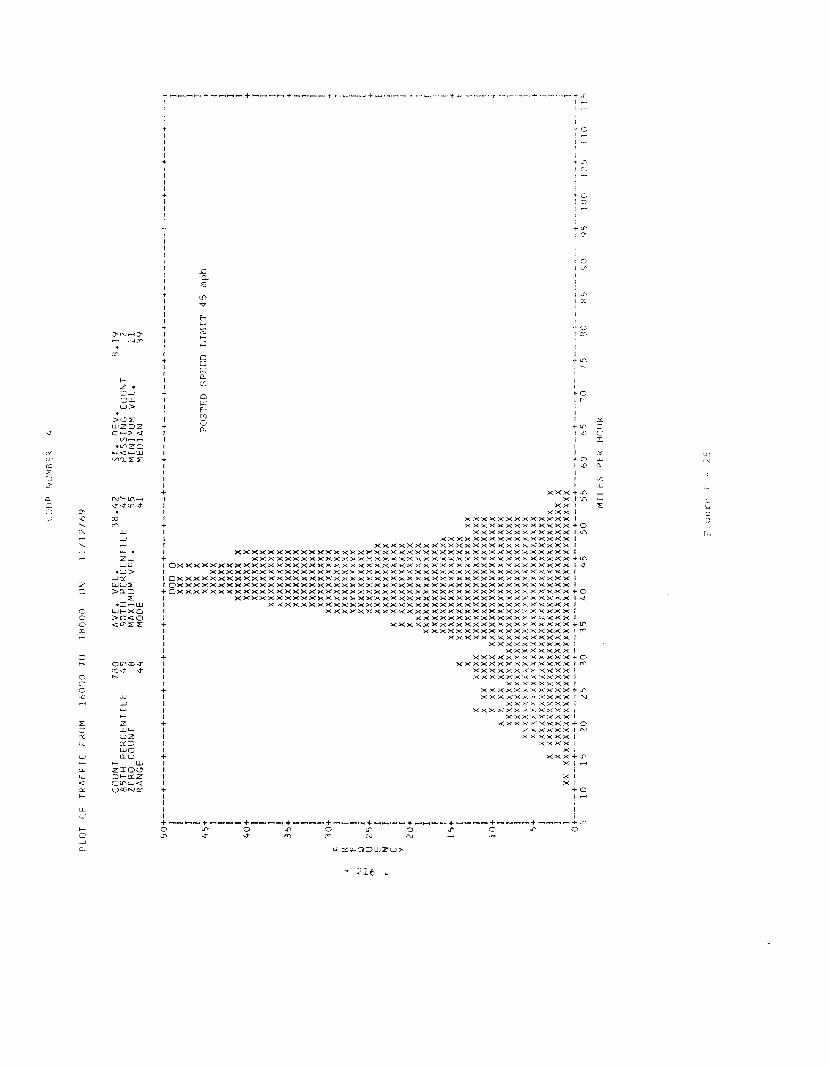
run
OF
TR
flF
FIC
FR
[lM
16
00
0TO
18
00
0U
N
Llm
pNU~IBtR
I,
11
/l2
/69
CO
UN
T8
5T
HP
ER
CE
NT
ILE
ZE
RO
CO
UN
TR
AN
GE
78
04
5 e4
4
AV
E.
VE
L.
38
.42
90
TH
PE
RC
EN
TIL
E4
7M
AX
IMU
MV
EL
.5
5M
OD
E4
1
ST
.O
FV
.P
AS
SIN
GC
OU
NT
MIN
I'IU
MV
EL
.M
ED
IAN
8.1
9 ? II 39
F R
~v
EI-
'Q
cr-,
U f ~ C Y
50
+----+
----+
----+
----+
----+
----+
----+
----+
----+
----+
----+
----+
----+
----+
----+
----+
-----+
----1
---+
----+
----+
---
I0
00
0I
XXX
XI
xxx
XI
XXX
X45
+XX
XX
POST
ED
SPE
ED
LIM
IT4
5m
phI
XX
XX
XI
xx
xx
xI
XX
XX
XI
XX
XX
XX
X4
0+
XX
XX
XX
XI
XX
XX
XX
XX
IX
XX
XX
XX
XI
XX
XX
XX
XX
XI
XX
XX
XX
XX
X3
5+
XX
XX
XX
XX
XI
XX
XX
XX
XX
XI
XX
XX
XX
XX
XI
XX
XX
XX
XX
XI
XX
XX
XX
XX
X3
0+
XX
XX
XX
XX
XX
IX
XX
XX
XX
XX
XI
XX
XX
XX
XX
XX
IX
XX
XX
XX
XX
XI
XX
XX
XX
XX
XX
25
+X
XX
XX
XX
XX
XI
XX
XX
XX
XX
XX
XJ
XX
XX
XX
XX
XX
XI
XX
XX
XX
XX
XX
XX
IX
XX
XX
XX
XX
XX
X2
0+
XX
XX
XX
XX
XX
XX
IX
XX
XX
XX
XX
XX
XX
IX
XX
XX
XX
XX
XX
XX
XI
xxxX
XX
XX
XX
XX
XX
IX
XX
XX
XX
XX
XX
XX
XX
15
+X
XX
XX
XX
XX
XX
XX
XX
XI
XX
XX
XX
XX
XX
XX
XX
XX
XI
XX
XX
XX
XX
XX
XX
XX
XX
Xxx
IX
xx
xx
xx
xx
xx
xx
xx
xx
xx
xx
xx
xI
XXX
XX
XX
XX
XX
XX
XX
XX
XX
XX
XX
XX
X1
0+
XXX
XX
XX
XX
XX
XX
XX
XX
XX
XX
XX
XX
XX
IX
Xx
xX
XX
Xx
xx
xx
xx
xx
xx
xx
xx
xx
xx
xI
XX
XX
XX
XX
XX
XX
XX
XX
XX
XX
XX
XX
XX
XX
XX
XX
IX
XX
XX
XX
XX
XX
XX
XX
XX
XX
XX
XX
XX
XX
XX
XX
XI
XXXXXXXXXXXXXXXXXXXXXXXXXXX~XXXXXX
S+
X/X
XX
XX
XX
/XX
XX
XX
XX
XX
XX
XX
XX
XX
XX
XX
XX
IX
XX
XX
XX
XX
XX
XX
XX
XX
XX
XX
XX
XX
XX
XX
XX
XX
XX
IX
XX
XX
XX
XX
XX
XX
XX
XX
XX
XX
XX
XX
XX
XX
XX
XX
XX
XX
XI
XX
XX
XX
XX
XX
XX
XX
XX
XX
XX
XX
XX
XX
XX
XX
XX
XX
XX
XX
XI
XXX
XX
XX
XX
XX
XX
XX
XX
XX
XX
XX
XX
XX
XX
XX
XX
XX
XX
XX
XX
XX
X0
+----,+
----+
-----+
----+
----+
----+
----+
----+
----+
----+
----+
----+
-----+
----
-~_.-
'-i
t+
_.
-+
-5
10
15
20
25
30
35
40
45
50
55
60
AS
70
75
30
85
gOq
5lO
G1
05
11
0II
MIL
ES
PE~
HnU
R
Fi9
urt
"'25
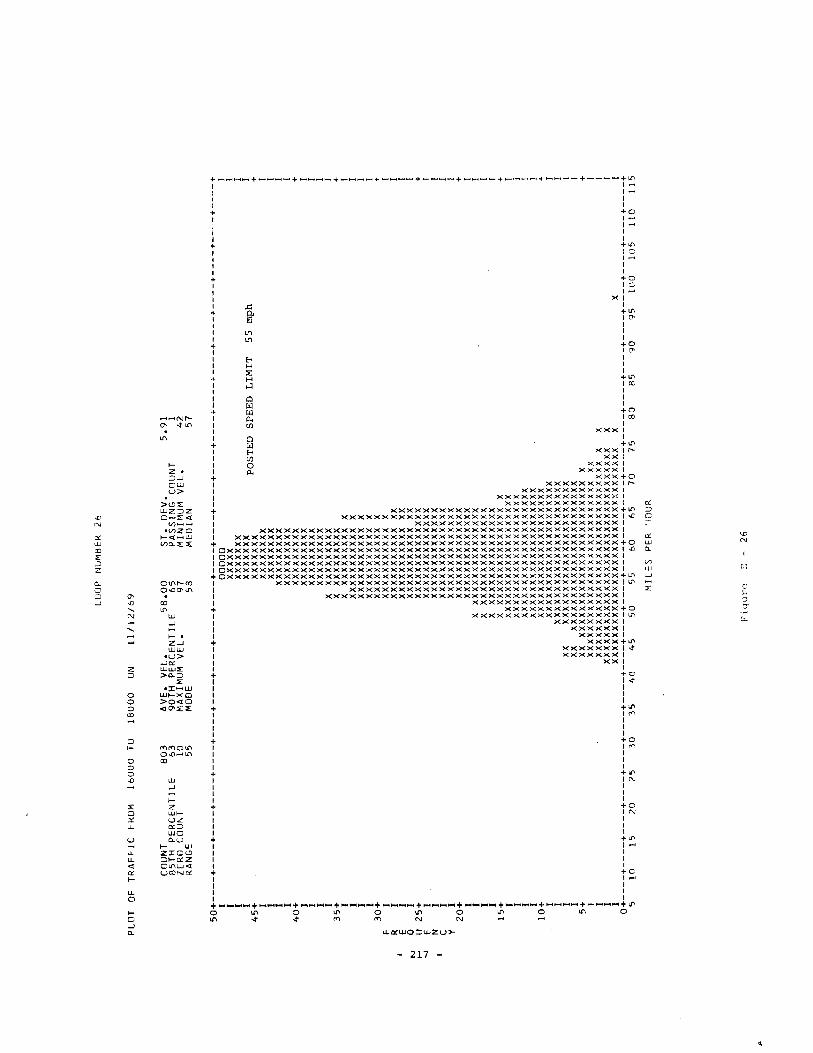
PLO
TO
FT
RA
FF
ICFR
OM
16
00
0TO
18
00
0ON
LOO
PN
UM
BER
26
11
11
21
69
CO
UN
T8
03
85T
HP
ER
CE
NT
ILE
63
ZER
OC
OU
NT
10R
AN
GE
55
AV
E.
VE
L.
58
.00
90T
HP
ER
CE
NT
ILE
65
MA
XIM
UM
VE
L.
97
MO
DE
58
ST
.D
EV
.P
AS
SIN
GC
OU
NT
MIN
IMU
MV
EL
.M
EDIA
N
5.9
1 14
2 57
..
IV ..... "
50
+--
--+
----
+--
--+
----
+--
--+
----
+--
--+
----
+--
--+
----
+--
--+
----
+--
--+
----
+--
--+
----
+--
--+
----
+--
--+
----
+--
---+
----
-+I
00
00
0I
Ixx
xxx
II
xxxx
xxx
I
451
~~~~~~~
POST
ED
SPE
ED
LIM
IT5
5m
phI
Ixx
xxxx
xxI
IX
XX
XX
XX
XI
IX
XX
XX
XX
XX
II
XX
XX
XX
XX
XI
40
+X
XX
XX
XX
XX
+I
xxxx
xxxx
xI
IX
XX
XX
XX
XX
II
XX
XX
XX
XX
XI
IX
XX
XX
XX
XX
XI
35
+X
XX
XX
XX
XX
X+
IX
xxxx
xxxx
xX
II
xxxx
xxxx
xxx
XI
IX
XX
XX
XX
XX
XX
XI
IX
XX
XX
XX
XX
XX
XI
30
+X
XX
XX
XX
XX
XX
X+
FI
XX
XX
XX
XX
XX
XX
IR
IX
XX
XX
XX
XX
XX
XXI
EI
XX
XX
XX
XX
XX
Xxx
IQ
IX
XX
XX
XX
XX
XX
XXI
U2
5+
XX
XX
XX
XX
XX
XX
XX
+E
IX
XX
XX
XX
XX
XX
XX
XI
NI
XX
XX
XX
XX
XX
XX
XX
IC
IX
XX
XX
XX
XX
XX
XX
XI
YI
XX
XX
XX
XX
XX
XX
XX
I2
0+
XX
XX
XX
XX
XX
XX
XX
+'I
'Y
YV
YY
Vy
vv
vv
vv
vT
iX
xxxx
xxxx
xxxx
xxx
iI
XX
XX
XX
XX
XX
XX
XX
XX
II
XX
XX
XX
XX
XX
XX
XX
XX
I1
5+
XX
XX
XX
XX
XX
XX
XX
XX
X+
IX
XX
XX
XX
XX
XX
XX
XX
XX
XX
II
XX
XX
XX
XX
XX
XX
XX
XX
XX
XI
IX
XX
XX
XX
XX
XX
XX
XX
XX
XX
XI
IX
XX
XX
XX
XX
XX
XX
XX
XX
XX
XI
10
+X
XX
XX
XX
XX
XX
XX
XX
XX
XX
X+
IX
XX
XX
XX
XX
XX
XX
XX
XX
XX
XX
II
XX
XX
XX
XX
XX
XX
XX
XX
XX
XX
XX
II
XXX
XX
XX
XX
XX
XX
XX
XX
XX
XX
XX
XI
IXX
XX
XX
XX
XX
XX
XX
XX
XX
XX
XX
XX
XI
5+
XXX
XX
XX
XX
XX
XX
XX
XX
XX
XX
XX
XX
XX
+I
XX
XX
XX
XX
XX
XX
XX
XX
XX
XX
XX
XX
XX
Xxx
II
XX
XX
XX
XX
XX
XX
XX
XX
XX
XX
XX
XX
XX
XX
XX
XX
II
XX
XX
XX
XX
XX
XX
XX
XX
XX
XX
XX
XX
XX
XX
XX
XX
XX
II
XX
XX
XX
XX
XX
XX
XX
XX
XX
XX
XX
XX
XX
XX
XX
XX
XX
XI
0+
----+
----+
----+
----+
----+
----+
----+
----+
----+
----+
----+
----+
----+
----+
-----+
----+
----+
----+
----+
----+
----+
----+
51
01
52
025
30
35
40
45
50
55
60
65
70
75
80
85
90
95
10
01
05
11
01
15
MIL
ES
PER
HO
UR
Fig
ure
E-
26
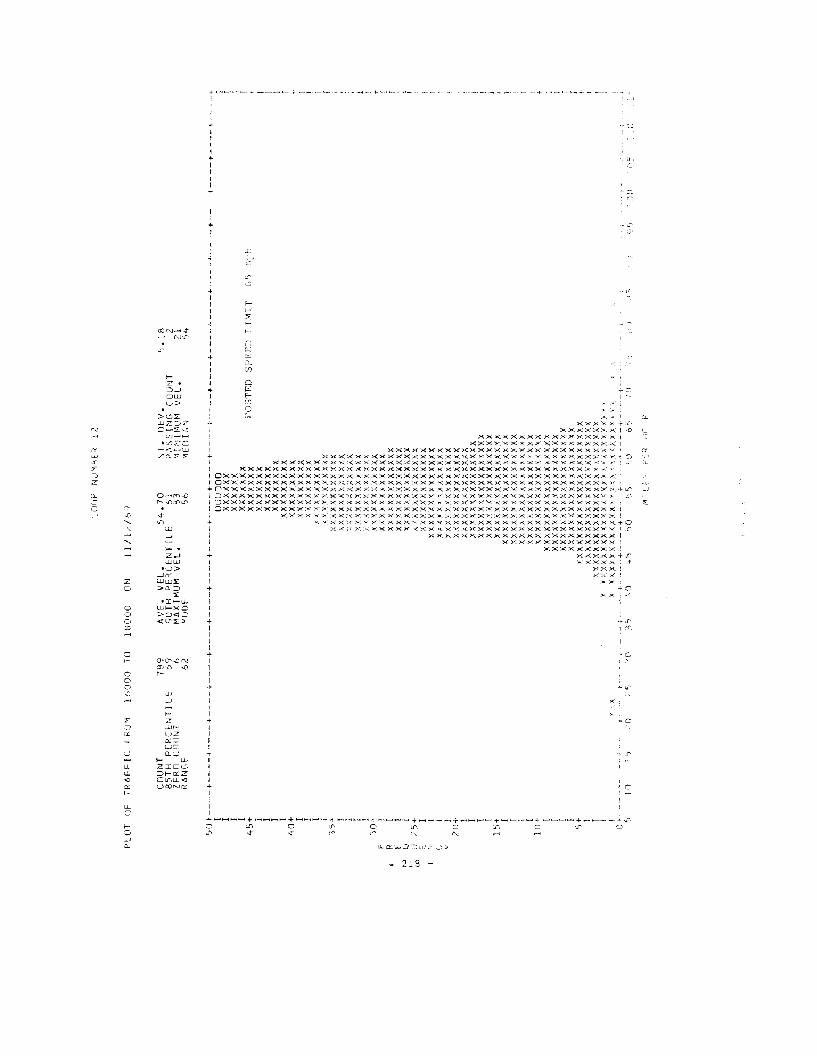
co (\J.-I-:j"......... r...;"'.....
Z~...J
ou.:u>
>c'):::Ewz=>z
N C-~«-, l/"j __
.1.1)20c< f--.-:r-~
LL Via...:ZL::.~
"'::JZ
"'- O ......... r<i"'OCJ r- ..C:::Dl.00...J -D -j
..... c'O~' Ll.J
....."""' f-
"""' Z...JUJW
·u>-JCL
Z i.UUJ~
G >Cl.=:J~
-I-l..LJ0 U..H-XC0 >0<1::::'0 <:(O'LL:JO
0f- 0'0'. ....0 N
:O'.f"\ -00 ~
00-C 'J.
...J
f-:>: Z0 l.i.,lf--
'" uZL.L CX::='woU CLU
I- WLL zIGl.OLL :::>t-a.:Z<l CI.f\W<lc< UOONCfe-
LL2
I-0...J"'-
+I,I
!
L.,i
C-
.c
+I
+
x 'XXXX')< +I'
XXXX,X><.X! '-0XXXXXXXXXXXXXXXXXj
XXXXXXXXXXXXXXXXXXIXXXXXXXXXXXXXXXXXXXXXXXXXXX~
XX~XXXXXXXXXXXXXX)<XXXXXXX)(XXXXxxxx:<x~·o
XXXXXXXX~;<~XXXXXXXXXXXXXXXXXXXXXXXXXXXXX~ :xx~xxxxxxxxxxxKxxxxxxxxxxxxxxxxxxxxxxxXXXXXXK:~
OXXXXXXXXXXXXXXXXXXXXXXXXXX~XX)(XXXXxxxxxxxxxxxxxx
Oxxxxxxxxxxxxxxx;<x~:xxxxxxxxxxxxxxxxxxxxxxxxxxxxx~
OxxxxxxxxXXXXXXX)<xxxxxxxxxxxxxxxxxxxxxxxxxXXXXXXX4~
oxxxxxxxxxxxxxxx)<x~:xxxxxxxx~xx~xxxxxxxxXXXXXXKXX~
OXXXXXXXXXXXX>:XKXXXXxxxK~XX~XXXXXXXXXXXXXXXXXXX:~X
OxxxxxxxxxXXXXX~)<X~xxxxxxxxxxxXXXXXXXKXXXXXXXXXXXI
xxxxxxxx~<xxxxxxxXXXXXX)<xxxxxxxxxxxxxxxxxxl
XXX~-(X~:~XXXXXXXXKXXXXXXXXXXXXXXXXXXXX+O
XK X~:X~XXXXXX~XX)(XXXXXXXXXXXXXXXXXX!~
XXXX)(XXXXXxxxxxxxxxxxxxix x X xx: )O"~>< xxxxxx x
X X X X X x: X><. X ;xxxx><+..rXXXXX; .,:t
xx >0( 1><X' >( !
.>c' ,y' ~
i~ + + '_+ ~. + +~ + __ h~_+ + .~
o ~ 0 ~ 0 m C ~ G ~ 0~ ~ ~ ~ (~ ~
- 218 -
c
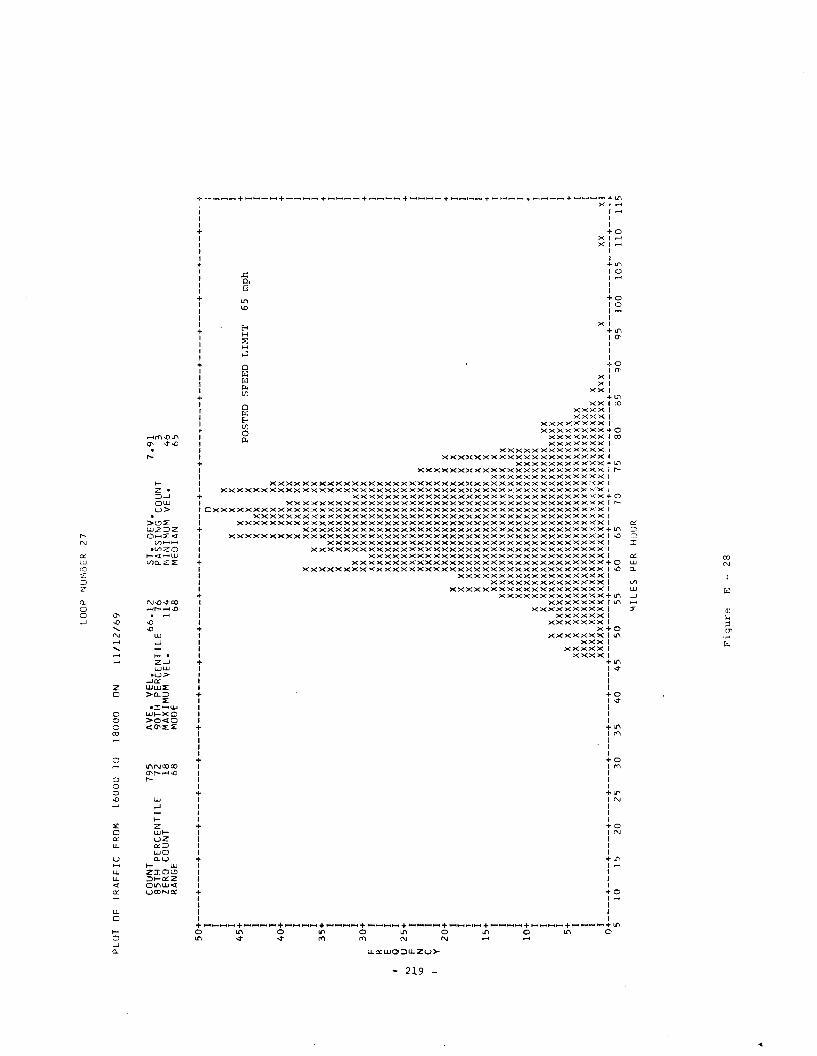
PL
OT
OF
TR
AF
FIC
FRO
M1
60
00
TO1
80
00
ON
LO
OP
Nur
·18E
R2
7
11
11
2/6
9
CO
UN
T7
95
85
TH
PE
RC
EN
TIL
E7
2Z
ER
OC
OU
NT
18
RA
NG
E6
8
AV
E.
VE
L.
66
.12
90
TH
PE
RC
EN
TIL
E7
6M
AX
IMU
MV
EL
.1
14
MO
DE
68
ST
.D
EV
.P
AS
SIN
GC
OU
NT
MIN
IMU
MV
EL
.M
ED
IAN
7.9
1 34
66
5
J,
'"I-' '0
50
+----+
----+
----+
----+
----+
----+
----+
----+
----+
----+
----+
----+
----+
----+
----+
----+
----+
----+
----+
----+
----+
---o
fI
01
IX
jI
XX
II
XX
XI
45
+X
XX
XPO
STE
DSP
EE
DL
IMIT
65m
ph+
IX
XX
XI
IX
XX
XX
II
XX
XX
XI
IX
XX
XXX
I4
0+
XX
XX
XX
+I
XX
XX
XX
XI
IX
XX
XX
XX
II
Xxx
xxxx
XXI
IX
XX
XX
XX
XX
XI
35
+X
XX
XX
XX
XX
X+
IX
xxxx
xxxx
XX
II
Xxx
xxxx
xxX
XI
IX
xxxx
xxxx
XX
II
XXX
XX
XX
XX
XX
XX
I3
0+
XX
XX
XX
XX
XX
XX
X+
FI
xxxx
xxxx
xxxx
xxI
RI
XX
XX
XX
XX
XX
XX
XX
IE
IX
XX
XX
XX
XX
XX
XX
XI
QI
xxxx
xxxx
xxxx
xxI
U2
5+
XX
XX
XX
XX
XX
XX
XX
+E
Ixx
xxxx
xxxx
xxxx
IN
Ixx
xxxx
xxxx
xxxx
XI
CI
xxxx
xxxx
xxxx
xxX
IY
IX
XX
XX
XX
XX
XX
XX
XX
I2
0+
XX
XX
XX
XX
XX
XX
XX
XX
+I
XX
XX
XX
XX
XX
XX
XX
XX
XI
IX
XX
XX
XX
XX
XX
XX
XX
XX
XI
!X
xxxx
xxxx
xxxx
xxx
XX
iI
Xxx
xxxx
xxxx
xxxx
xX
XI
15
+X
XX
XX
XX
XX
XX
XX
XX
XX
X+
Ixx
xxxx
xxxx
xxxx
xxxx
xX
II
xxxx
xxxx
xxxx
xxxx
xxxx
XX
II
XX
XX
XX
XX
XX
XX
XX
XX
XX
XX
XX
II
xxxx
xxxx
xxxx
xxxx
xxxx
xxx
I1
0+
XX
XX
XX
XX
XX
XX
XX
XX
XX
XX
XX
X+
IX
XX
XX
XX
XX
XX
XX
XX
XX
XX
XX
XX
XI
IX
XX
XX
XX
XX
XX
XX
XX
XX
XX
XX
XX
XX
XI
IX
XX
XX
XX
XX
XX
XX
XX
XX
XX
XX
XX
XX
XX
XX
XX
II
XX
XX
XX
XX
XX
XX
XX
XX
XX
XX
XX
XX
XX
XX
XX
XX
I5
+X
XX
XX
XX
XX
XX
XX
XX
XX
XX
XX
XX
XX
XX
XX
XX
XX
+I
XX
XX
XX
XX
XX
XX
XX
XX
XX
XX
XX
XX
XX
XX
XX
XX
XX
XX
II
XX
XX
XX
XX
XX
XX
XX
XX
XX
XX
XX
XX
XX
XX
XX
XX
XX
XX
XI
IX
XX
XX
XX
XX
XX
XX
XX
XX
XX
XX
XX
XX
XX
XX
XX
XX
XX
XX
XX
II
xxxx
xxxx
xxxx
xxxx
xxxx
xxxx
xxxx
xxxx
xxxx
xxx
XX
XX
XXX
I0
+----+
----+
----+
----+
----+
----+
----+
----+
----+
----+
----+
----+
----+
----+
----+
----+
----+
----+
----+
----+
----+
----+
51
01
52
02
53
03
54
04
55
05
56
06
57
07
58
08
59
09
51
00
10
51
10
11
5
MIL
ES
PE
RH
DU
R
Fig
ure
E-
28
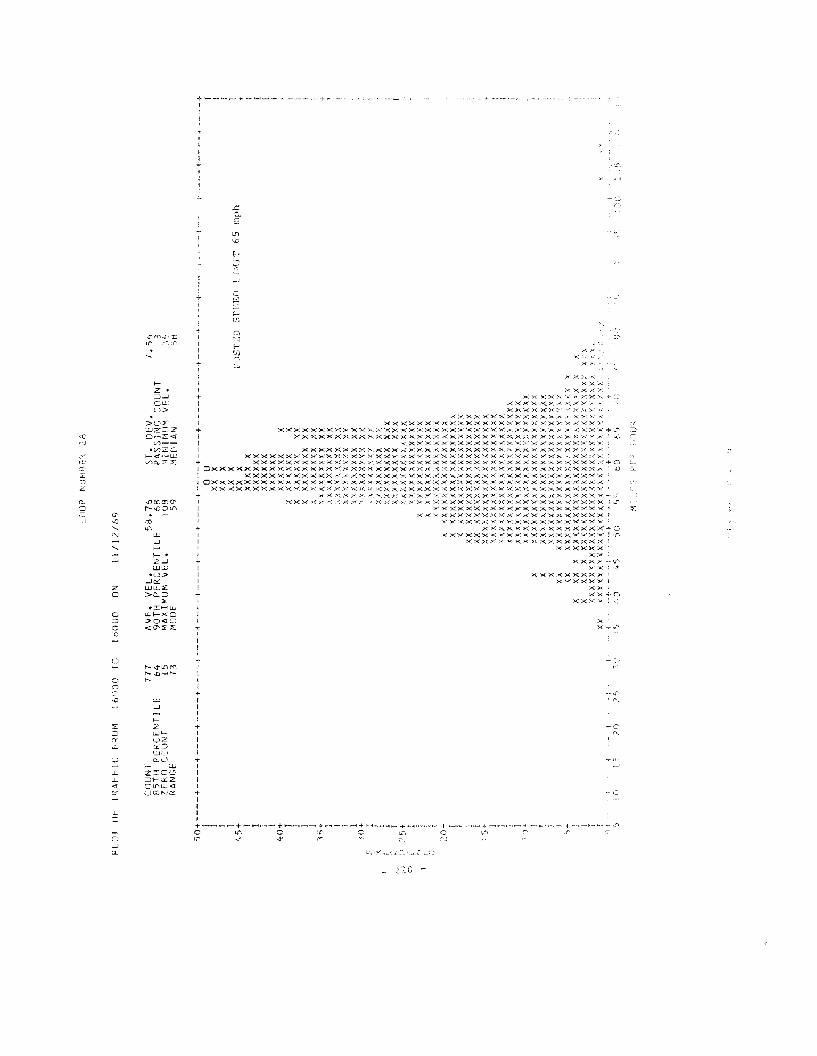
r--.j-UiMr-..c....-r-r-
I+ .~ ..I'
W I , ,
-J II
>-- ,Z T ,-"wI- I c'....UZ I~:::. i!..LJOCLU "'"f- W I
,"~
ZICc.:, I~I-;:(Z ICl,{'\LL<! ,ua::,r--JCf- +
IIIt
or:':'J
LI::LL'
""":<:::JZ
!l
:::J0'
-J -0"-N
"-~
.-.
Z0
00000
0f-
a0::J-0
:;:
a:u.
0
LLU.<lX>--
U.C
~
C)-J"-
..c".... ,r..£;.ll" C'"lU
>-Z':::>-JCu...:u>
>l?~
WZ=ZC_~<1
v)-
_l/IZGI--<I:-u...:V'\~:z_~
w
f- •Z.....Jl.l.il..LJ
-u>-lcLUJll..IL>0..:::>
:>:.:r-w
U.JI-X 0>0<0<l0'~:L
+ -_\-.. -.- + --'-'-'--:"" '-"-'-',.~.
~
~
E:tn'-0
~
Y
+ ".'
~
;:.:...:J:'
0r:..::r-rQ
;":X)(
xxx;>(yX X xX>-<>< ,x~ y_x>,~ j~
xxxx :'>o(X. ~A: Y:X'x ">,
XXXXX)<)". "':x:'"'xxxxxxxxxxxxxx XX~~
xxxxxxxxxxxxxxXXXXXXxy:x?(xx>'xxxxxxxx~XXXXXXXXXXXXXXXXXXXXXXXXXYxxxxx+~
XXXXXXxxxx>(XXxxxx>(XXXXXXxxxx~xxxxxxx~ ~
XXXXXXXXXXXXXXXXXXXXXXYX>xxxxx~XXXxxxxxxxxxxxxxxxxxxxxxxxxxxxx
XXXXXXXXXXXX~xyxxxxxX~xxxxxxxxxxxxxxxxx~;xxx>
+ xxxxxxxxxXKXxXXXXXxxxxXXXXXX)<xxxxxxxxxxxxxx+oIOXXXXXxxxXXXXXXXYxXXXXxxxxXX:<xxxxxxxxxxxXXXXXXXXY"0I XXXXX~XXXXX>(xXXXX~Xxxxxxxxxxxxxxxxxxxxxxxxxx
IOxxxxxxXXXXXXKX~XXxXxxxxxxxxxxxxxxxxxxxxxxxxxxxx~
I Xxxxxxxxxxxxxxxxxx~~xxxxxxxxxxxxxxXxXXXKXXXXXxxx
KXXY~XXY xxxxxxxxx~xxxxxxxxxx~~
xxx xxx xxx XXXXXXXXXXXXXXX·XxxXXI~
XXXXXXXXXXXXXXXXXXXXX~
xxxxxxxxxxxxxxxxxxxxxxxXX:(XXXKXXKXXXXXXXXXX
+ XKXXxXX~xxxxxxx·O
I .x)<"><><XXxX:XXXXXXXxxxXx ;,-"I xxxxxxxx~xxxxxxxx
f xxxXXxI xx+ xxxy"";"iJ\I XX~·~
I XXXKXXXX~
! XYXXXXI XX!+ xx~C
I XX:>(;x , ....,
+----+--~~~+----+~~---+~~---+~~---+----+----~----+~~--~~~,~o ~ 0 ~ 0 ~ C ~ ~ J
l.i" -.::- "" ~,
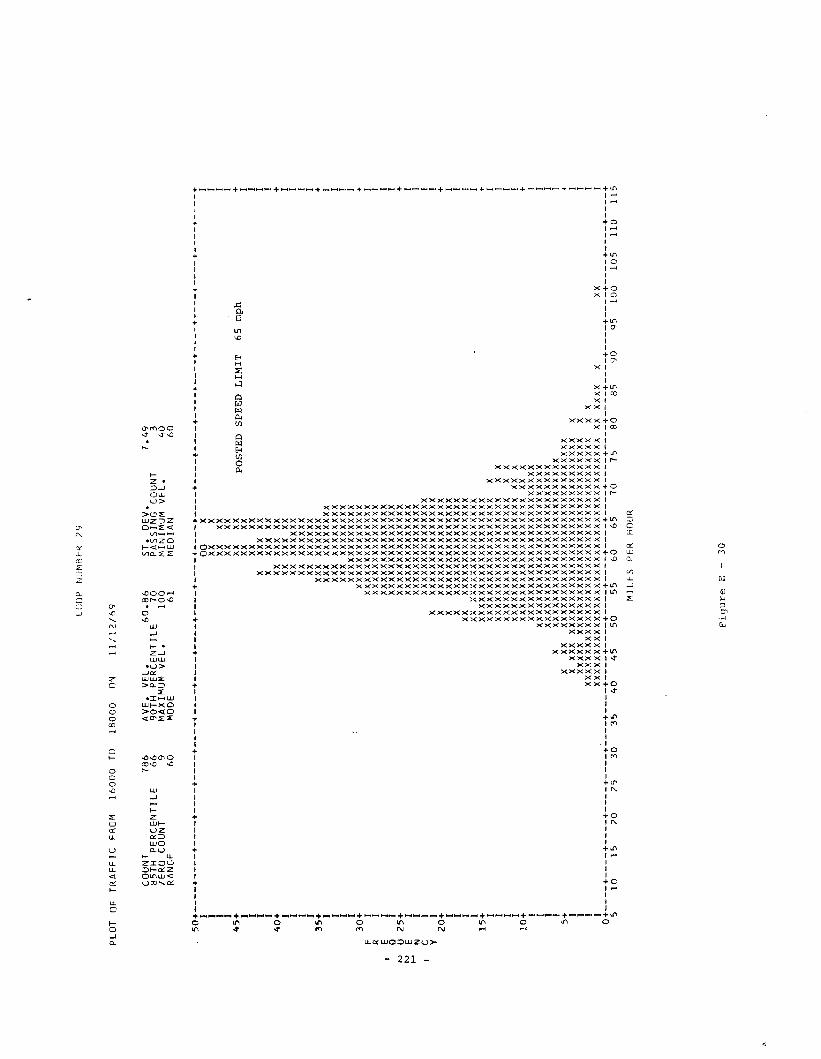
PL
OT
OF
TR
AF
FIC
FR
OM
16
00
0TO
18
00
0O
N
LOO
PN
UM
BE
R.
29
11
/12
/69
CO
UN
T7
86
85
TH
PE
RC
EN
TIL
E6
6Z
ER
OC
OU
NT
9R
AN
GE
60
AV
E.
VE
L.
60
.86
90
TH
PE
RC
EN
TIL
E7
0M
AX
IMU
MV
EL
.1
00
MO
DE
61
ST
.D
EV
.P
AS
SIN
GC
OU
NT
MINH~UM
VE
L.
r~ED
IA
N
7.4
9 34
06
0
"
50
+----+
----+
----+
----+
----+
----+
----+
----+
----+
----+
----+
----+
----+
----+
----+
----+
----+
----+
----+
----+
----+
----+
I0
0X
II
XX
XI
IX
XX
XI
IX
XX
XI
45
i~~
~~
POST
ED
SP
EE
DL
IMIT
65
mp
hr
IX
XX
XI
IX
XX
XX
XI
IX
XX
XX
XI
40
+X
XX
XX
XX
+I
XX
XX
XX
XI
IX
XX
XX
XX
XI
IX
XX
XX
XX
XI
IX
XX
XX
XX
XI
35
+X
XX
XX
XX
XX
+I
XX
XX
XX
XX
XX
XI
IX
XX
XX
XX
XX
XX
II
XX
XX
XX
XX
XX
XI
IX
XX
XX
XX
XX
XX
XI
30
+X
XX
XX
XX
XX
XX
XX
+F
IX
XX
XX
XX
XX
XX
XX
XI
RI
xxxxxxxxxxxxxx
IE
IX
XX
XX
XX
XX
XX
XX
XI
QI
xxxxxxxxxxxxxx
Itv
U2
5+
XX
XX
XX
XX
XX
XX
XX
+tv
EI
xxxxxxxxxxxxxx
If-
-'N
IX
XX
XX
XX
XX
XX
XX
XI
CI
XX
XX
XX
XX
XX
XX
XX
XI
YI
XX
XX
XX
XX
XX
XX
XX
XX
I2
0+
XX
XX
XX
XX
XX
XX
XX
XX
+I
XX
XX
XX
XX
XX
XX
XX
XX
II
XX
XX
XX
XX
XX
XX
XX
XX
II
XX
XX
XX
XX
XX
XX
XX
XX
XI
Ixx
XX
XX
XX
XX
XX
XX
XX
XX
I1
5+
XX
XX
XX
XX
XX
XX
XX
XX
XX
X+
IX
XX
XX
XX
XX
XX
XX
XX
XX
XX
XI
Ixxxxxxxxxxxxxxxxxxx
XX
II
XX
XX
XX
XX
XX
XX
XX
XX
XX
XX
XI
IX
XX
XX
XX
XX
XX
XX
XX
XX
XX
xx
XI
10
+X
XX
XX
XX
XX
XX
XX
XX
XX
XX
XX
X+
IX
XX
XX
XX
XX
XX
XX
XX
XX
XX
XX
XX
XI
IX
XX
XX
XX
XX
XX
XX
XX
XX
XX
XX
XX
XX
II
XX
XX
XX
XX
XX
XX
XX
XX
XX
XX
XX
XX
XI
IX
XX
XX
XX
XX
XX
XX
XX
XX
XX
XX
XX
XX
XX
I5
+X
XX
xxxxxxxxxxxxxxxxxxxxxxxxxxxxx
+I
XX
XX
XX
XX
XX
XX
XX
XX
XX
XX
XX
XX
XX
XX
XX
XX
XX
XI
IX
XX
XX
XX
XX
XX
XX
XX
XX
XX
XX
XX
XX
XX
XX
XX
XX
XX
XI
IX
XX
XX
XX
XX
XX
XX
XX
XX
XX
XX
XX
XX
XX
XX
XX
XX
XX
XX
XX
XI
I.
XX
XX
XX
XX
XX
XX
XX
XX
XX
XX
XX
XX
XX
XX
XX
XX
XX
XX
XX
xx
XX
XX
XX
XI
0+
----+
----+
----+
----+
----+
----+
----+
----+
----+
----+
----+
----+
----+
----+
----+
----+
----+
----+
----+
----+
----+
----+
51
01
52
02
53
03
54
04
55
05
56
06
57
07
58
08
59
09
51
00
10
51
10
11
5
MIL
ES
PE
RH
OU
R
Fig
ure
E-
30
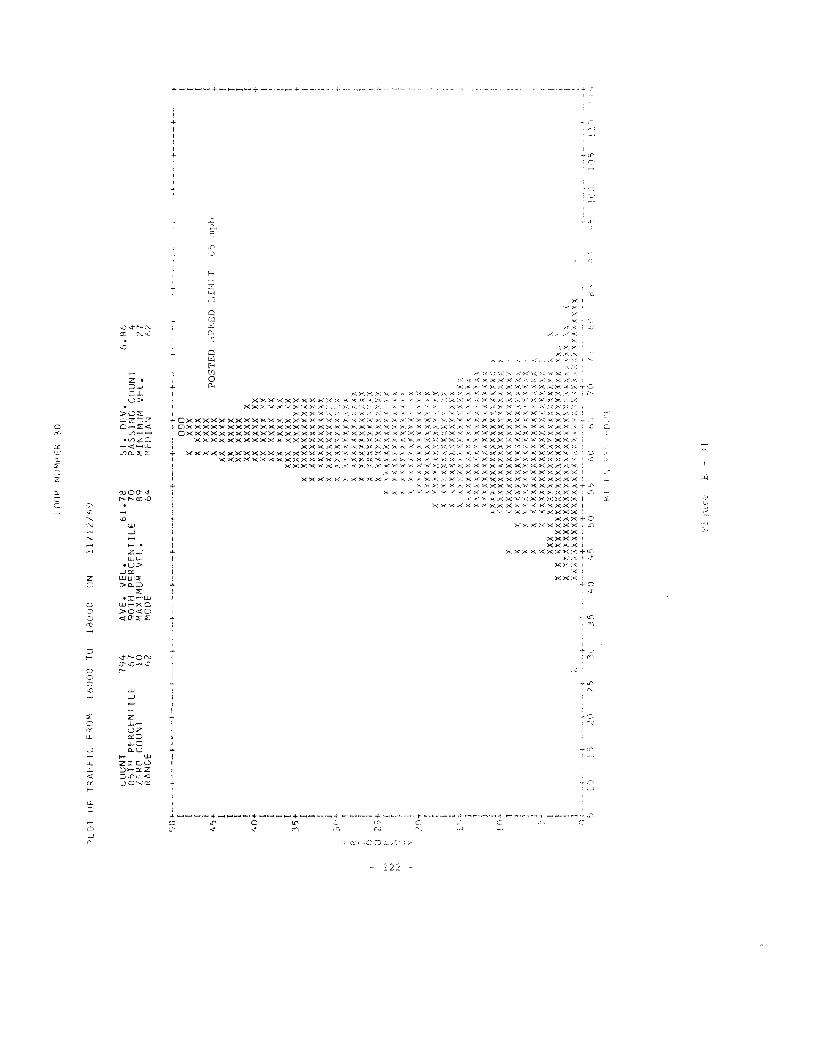
LOU
PNlI~1Ht'K
30
[OLO
I(IF
TR
AF
FIC
FRO
MJ6
0(J0
TO
IRU
IJO
(IN
11
11
2/6
9
CO
UN
T85
TH
PE
RC
EN
TIL
EZE
RO
CO
UN
TR
AN
GE
79
46
7 10
62
AV
E.
VE
L.
61
.78
90T
HP
ER
CE
NT
ILE
70
MA
XIM
UM
VE
L.
R9
MO
DE
64
SI.
DE
V.
PA
SS
ING
CO
UN
TM
INU
1LJM
VE
L.
MEO
IA
r"
6.R
6 "2
7(,
2
POST
ED
~PI~EI)
IIIM
.I'r
50
+-
-+--
--+
----
i---
·-.
I I I I4
5+ I I J I
40
+ I I I I3
5+
--+
.---.-
+---o
-t-
----·+
----+
++
I-+
--
')m
ph
-+._
,---
,+--
----
-+.+
I 1 I ! + [ I I r + I ! { I + 1 I i
l.'-~
)+ J I
li1
+ I I 1
"1
~)5
e,"
I.;~;
'.,o
/,,~
:'.,
)(.'
/Xi(
,'f,
X,X
:XX
X,
A A
X .~:
xX
XX
7,'
XX
Xl
'l'1
X).x
xx(
X\
X)(
.\X
Xx:
X:<
J:X
\(),
A•
XXXXXXXXXXXXXX~XX
XXX
XX
XX
XX
XX
XX
)l.
XX
XX
XX
X).
',X
XX
X(
XX
XX
XX
XX
XX
XX
XX
XX
XX
X,X
XX
XX
XX
XX
XX
XX
XX
,X
X)
\\\XXXXXXXXXxX~
XX
XXXXXXXXXX~XXXX>
XX
(XX
XX
XX
XX
XX
XX
XX
,YX
XX
XX
XX
XX
XX
XX
XX
XX
XX
XX
XX
XX
XX
XX
XX
XX
XX
XX
XX
XX
XX
YX
XX
XX
XX
XX
XX
XX
XX
XX
XX
XX
XX
XX
AX
XX
XX
XX
XX
XX
XX
XX
XX
'yY
...+
-,.._
...
+.'.
-"_.'
-".+
..<
:to/t~,
:,0
fj')
61
,)r.
35
3C'
I
/5,::~
)
._{
1..
--~
10
-~+ I I ! I
(1i ~)I
pI I 1
US~·
FIt>
.....l
~\ Y
HIt
>
_}l.
~r·~
F--
JI
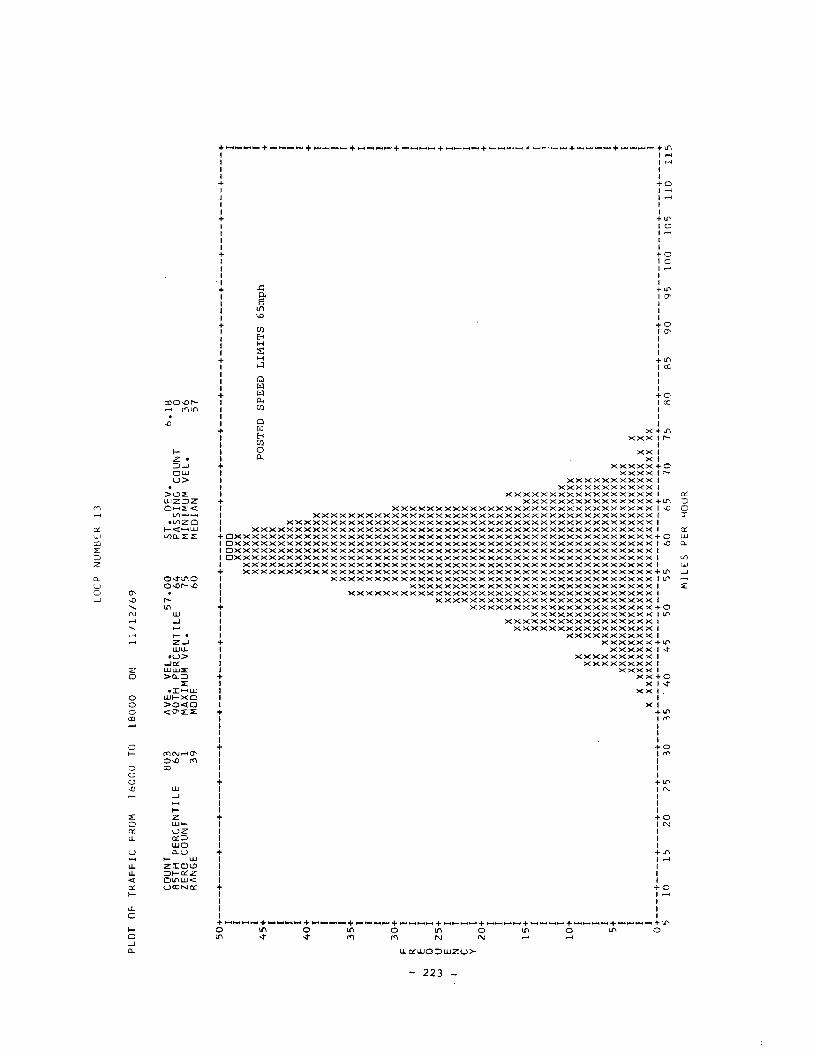
PLO
TO
FT
RA
FF
ICFR
OM
16
00
0TO
18
00
0ON
LOO
PN
UM
BER
13
L/1
2/6
9
CO
UN
T85
TH
PE
RC
EN
TIL
EZE
RO
CO
UN
TRA
NG
E
80
36
2 13
9
AV
E.
VE
L.
57
.00
90T
HPE
RC
EN
TIL
E6
4M
AX
IMU
MV
EL
.7
5M
ODE
60
ST
.D
EV
.P
AS
SIN
GC
OU
NT
MIN
IMU
MV
EL
.M
EDIA
N
6.1
8 o3
65
7
IV IV W
50
+--
--+
----
+--
--+
----
+--
--+
----
+--
--+
----
+--
--+
----
+--
--+
----
+--
--+
----
+--
--+
----
+--
--+
----
+--
--+
----
+--
--+
----
+I
00
00
II
XX
XX
II
XX
XX
XX
II
XX
XX
XX
X6
5I
45
+X
XX
XX
XX
POST
ED
SPE
ED
LIM
ITS
mph
+I
XX
XX
XX
XI
IX
XX
XX
XX
II
XX
XX
XX
XX
II
XXX
XXX
XXI
40
+X
XX
XX
XX
X+
IX
XX
XX
XX
XX
II
XX
XX
XX
XX
XI
IX
XX
XX
XX
XX
XI
IX
XX
XX
XX
XX
XI
35
+X
XX
XX
XX
XX
XX
+I
XX
XX
XX
XX
XX
XI
IX
XX
XX
XX
XX
XX
II
XX
XX
XX
XX
XX
XI
IX
XX
XX
XX
XX
XX
I3
0+
XX
XX
XX
XX
XX
XX
+F
IX
XX
XX
XX
XX
XX
XI
RI
XX
XX
XX
XX
XX
XX
XI
EI
XX
XX
XX
XX
XX
XX
XI
QI
XX
XX
XX
XX
XX
XX
XI
U2
5+
XX
XX
XX
XX
XX
XX
XX
+E
IX
XX
XX
XX
XX
XX
XX
XI
NI
XX
XX
XX
XX
XX
XX
XX
IC
IX
XX
XX
XX
XX
XX
XX
X!
YI
xxxx
xxxx
xxxx
xxx
I2
0+
XX
XX
XX
XX
XX
XX
XX
X+
Ixx
xxxx
xxxx
xxxx
xI
Ixx
xxxx
xxxx
xxxx
xI
IX
XX
XX
XX
XX
XX
XX
XX
XX
II
XXxx
xxxx
xxxx
xxxx
xX
I1
5+
XXX
XX
XX
XX
XX
XX
XX
XX
XX
+I
XX
XX
XX
XX
XX
XX
XX
XX
XX
XX
II
XX
XX
XX
XX
XX
XX
XX
XX
XX
XX
II
XX
XX
XX
XX
XX
XX
XX
XX
XX
XX
II
XX
XX
XX
XX
XX
XX
XX
XX
XX
XX
XI
10+
XX
XX
XX
XX
XX
XX
XX
XX
XX
XX
XX
X+
IX
XX
XX
XX
XX
XX
XX
XX
XX
XX
XX
XX
XI
IXX
XX
XX
XX
XX
XX
XX
XX
XX
XX
XX
XX
XI
IXX
XX
XX
XX
XX
XX
XX
XX
XX
XX
XX
XX
XI
IXX
XX
XX
XX
XX
XX
XX
XX
XX
XX
XX
XX
XX
I5+
XX
XX
XX
XX
XX
XX
XX
XX
XX
XX
XX
XX
XX
XX
+I
xxxx
xxxx
xxxx
xxxx
xxxx
xxxx
xxxx
xxI
IX
XX
XX
XX
XX
XX
XX
XX
XX
XX
XX
XX
XX
XX
XX
XX
II
XX
XX
XX
XX
XX
XX
XX
XX
XX
XX
XX
XX
XX
XX
XX
XX
XX
II
XX
XX
XX
XX
XX
XX
XX
XX
XX
XX
XX
XX
XX
XX
XX
XX
XX
XX
XXI
0+
----
+--
--+
----
+--
--+
----
+--
--+
----
+--
--+
----
+--
--+
----
+--
--+
----
+--
--+
----
+--
--+
----
+--
--+
----
++
++
510
1520
2530
35
·40
45
50
55
60
65
70
758
08
59
095
10
01
05
11
01
15
MIL
ES
PER
HO
UR
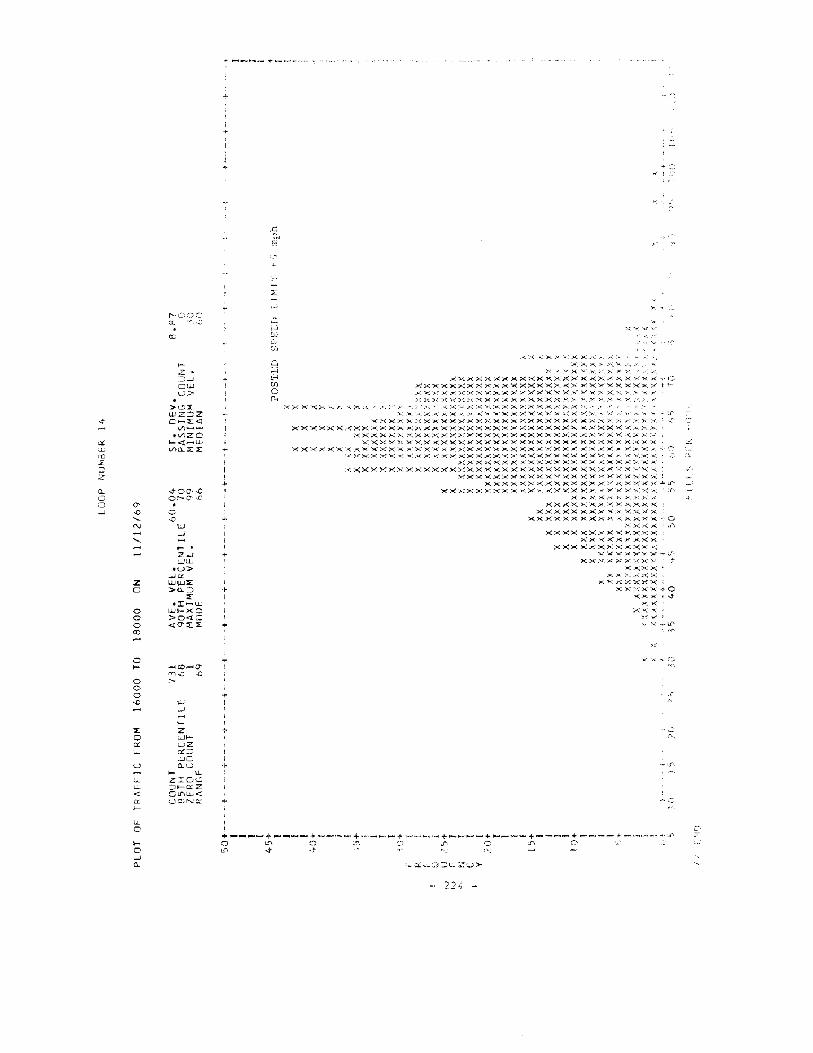
4·· +_'-_ ....,..
+
i..;11
oj.jo,- I
t_-+~ + +_~~I__ +'_~__ + __ ~4'_+_~M__ +~ + + ~_'_•. ~,~~
o ~ 0 ~ _ ~ 0 ~ cv~ ~ \,j ,-.!
~.-<
c:Lwco.L:::JZ
CL00 0'...J -0
"-N
"-.-<....
Z0
000<:C
0f-
000-0
~
0CLLL
U
LLLL«CLf-
LL0
f-0...JCL
.r:c,~::
"~
L:
~ ..2!~CC)C
:r; ~ ...;:: ~
~lJ
o::J :..w,.. w.;
'~i2
.~
Z 8:::>-Jow If)
w> 00 Ii.
>l9X:wz=z ~
C-~<r,
\/1-- IeViZO I
1-<t-lLi i\/1CL:L::E ...
II
oj.
..:tOO'...{J Ior-O'-1) I
0 10-1)
ill...J !
If- . I
Z...J ...UJUJ I
oW>-JCLWill::;: i>o...::J +
::E I.:c-w
WI-XC)>0<10~O'L~ .;-
-4C:O~O"
"'-1) -1)r-
w...J
....Z ...WI-uZ<r:Jcl.JCc....u
f- LLzro<.C:J .... CLZO",LL<UC:Na::
>< ><,""_~ X ;-...: ~< X Xx, >(
;:r< _,'0(, "J-":;;< >-: .:"". ;>-~ p
~>(xxxxxxxxxxxxxxxxxxxx~x~·(:
xxxxx>(xxxxxxxxxxxxxxxxxxxxxxKXXXX~(XXXXXXYXXXXXXxxxxxx~xx
>< X)-·~:><:: X~(>.( X X X >< X >C, xx XX x)ot: .)of.:)< y. ,x :....~ y'XX x :>(:X:~()- ,,'»cPt: _'"' >< >-<,>-, '.< ><;...:: -< x>( >< X)< xXX xx.xx;;<><x »- >- :~- >:;>0
xxxx~xx>,xxxxxxxxxxxxxxxxx:~ .r~xxxxxx~xX>(XxxxxxxxxxxxxXXXxx~xxxr
xxxxx~;<xxxxxxxxxxxX>(XXXXXXxxxxxxxxxxxxxxxx
xxxxxxxxxxxx>(Xxxxxxxxxxxxxxxxxxxxxxxxxxxxxx~xx>(XXxxxxxxxxxxxxxxxxxxxx ~
xxxxxx:<xwxxx~xxxxxx>(xxxxxxxxxxxxxxxxx~xxxx
'<xxxxxxx~x~xx>(xxxxxxxxxxxxxX~XXX:<xx~ ~
>(XXXXXKXXXXXXxxxxxxxxxx>( x>( X XXX xxxx xx>< X X>-:': XX XX XX X XXX X XXX :;.~~ x :,..:x ~"'.,.
>~xxxxxxxxxxxxxxxxxxxxxx
xxxxxxxxxxxxxx~xxxxx~~
xx>~xxxxxxxx~.xxxxxx/xxxxx:~
X.)-( X ><;"" >< x:. ~";'_)o..:.' xXX)(X XX X.X X xxx. X
xxx>(x ><XXXX~xxxxxxxxxxxxxxxxxxx~o
x><><x .11xx XX xX X >< X X x><:)(
xxxxx)<)o(x>-::xXX XX XX: xx ;:.<::a: •.-<
X.)(:-.(XYX.x ... ~,~-
xX><X.Xx,x.:>( .+xx:xx
XX><::KXXX"J-:;:' >-;: ~< XX >(
xX>(xx-tOx: :joC~ )o.~ -.t
X;X
x
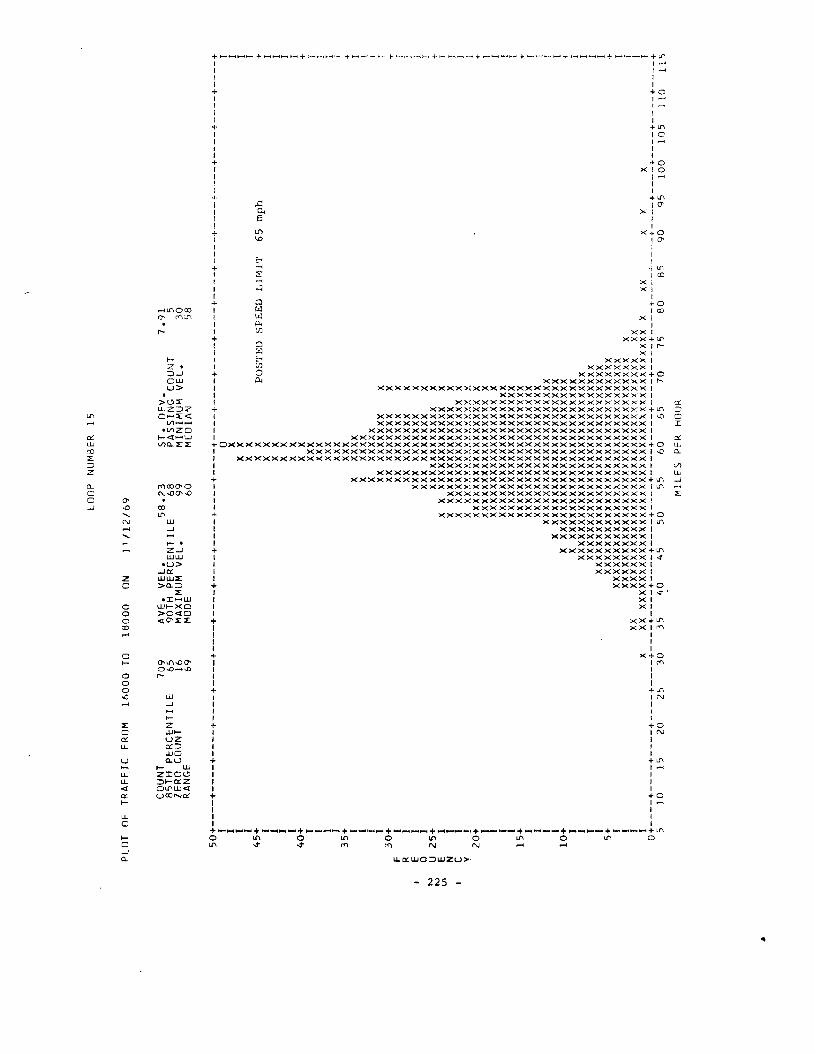
PLO
TO
FT
RA
FF
ICFR
OM
16
00
0TO
18
00
0O
N
LOO
PN
UM
BER
15
]1/1
2/6
9
CO
UN
T70
985
TH
PE
RC
EN
TIL
E65
ZER
OC
OU
NT
16R
AN
GE
69
AV
E.
VE
L.
58
.23
90T
HP
ER
CE
NT
ILE
68
MA
XIM
UM
VE
L.
99
MOD
E6
0
ST
.O
EV
.P
AS
SIN
GC
OU
NT
MIN
IMU
MV
EL
.M
EDIA
N
7.9
1 53
058
..
'" '" lJl
50
+--
--+
----
+--
--+
----
+--
--+
----
+--
--+
----
+--
--+
----
+--
--+
----
+--
--+
----
+--
--+
----
+--
--+
----
+--
--+
----
+--
--+
----
+I
0I
IX
II
XX
II
XX
I4
5+
XX
POST
ED
SPE
ED
LIM
IT65
mph
+I
XX
II
XX
II
XX
II
XX
I4
0+
XX
+I
XXX
II
XXX
II
XXX
1I
xxx
I3
5+
XXX
+I
XX
XX
XI
IX
XX
XX
TI
Xxx
xxx
IXX
XX
XX
XX
XX
30
+XX
XX
XX
XX
XX
FI
XXX
XX
XX
XX
Xr
RI
XXX
XX
XX
XX
X!
EI
XXX
XX
XX
XX
XX
IQ
IXX
XX
XX
XX
XX
Xr
U2
5+
XX
XX
XX
XX
XX
XX
X+
EI
XX
XX
XX
XX
XX
XX
XX
Xf
NI
Xxx
xxxx
xxxx
xxxx
XI
CI
XX
XX
XX
XX
XX
XX
XX
XX
XI
V!
XX
XX
XX
XX
XX
XX
XX
XX
XI
20+
XX
XX
XX
XX
XX
XX
XX
XX
XX
+I
xxxx
xxxx
xxxx
xxxx
xX
]I
xxxx
xxxx
xxxx
xxxx
xX
]I
XX
XX
XX
XX
XX
XX
XX
XX
XX
XI
IX
XX
XX
XX
XX
XX
XX
XX
XX
XX
I15
+X
XX
XX
XX
XX
XX
XX
XX
XX
XX
+I
xxxx
xxxx
xxxx
xxxx
xxx
TI
xxxx
xxxx
xxxx
xxxx
xxx
IX
XX
XX
XX
XX
XX
XX
XX
XX
XX
XX
IX
XX
XX
XX
XX
XX
XX
XX
XX
XX
XX
XI
10
+X
XX
XX
XX
XX
XX
XX
XX
XX
XX
XX
XX
X+
IX
XX
XX
XX
XX
XX
XX
XX
XX
XX
XX
XX
XI
IX
XX
XX
XX
XX
XX
XX
XX
XX
XX
XX
XX
XX
XX
II
XX
XX
XX
XX
XX
XX
XX
XX
XX
XX
XX
XX
XX
XX
II
xxxx
xxxx
xxxx
xxxx
xxxx
xxxx
xxxx
xxI
5+X
XX
XX
XX
XX
XX
XX
XX
XX
XX
XX
XX
XX
XX
XX
XX
+I
xxxx
xxxx
xxxx
xxxx
xxxx
xxxx
xxxx
xxxx
xI
IX
XX
XX
XX
XX
XX
XX
XX
XX
XX
XX
XX
XX
XX
XX
XX
XX
XI
IXX
XX
XX
XX
XX
XX
XX
XX
XX
XX
XX
XX
XX
XX
XX
XX
XX
Xxx
II
Xxx
xxxx
xxxx
xxxx
xxxx
xxxx
xxxx
xxxx
xxxx
xxxx
xxxx
XXX
XX
XI
0+----+----+----+----+----+----+----+----+----+----+----+----+----+----+----+----~----+----+----+----+----+---_+
510
1520
253
03
54
045
50
556
06
57
075
80
859
095
10
01
05
11
01
15
MIL
ES
PER.
HO
UR
left, due in part to an intersection fifty feet from loop 5.
With the exception of loop 4, the distribution of traffic
speeds conforms remarkably well to a normal distribution.
4.0 ADDITIONAL EFFECTS
The computer sensor system enables a detailed examina
tion of the effects of many factors on the speed distribu-
tions. The specific effects demonstrated in Figures E-35 through
E-40 are those of an intersection, some bridge repair, and a
fatal accident.
4.1 Effect of an Intersection
Figures E-35 and E-36 show the speed distributions on
February 26, 1970 for loop sites 7 and 8. These loops are
both located in a 45 mph zone, on a blacktop section of
Highway 37 immediately south of Bloomington, with loop 7
measuring the southbound traffic and loop 8, the northbound
traffic. This loop pair is approximately 50 feet north of an
intersection with a heavily travelled stop street. For
southbound traffic, there is a negative slope of -5.2o/~
This is a main artery leading into Bloomington, and some
rather high rush hour traffic may be experienced (900+/hour)
Both figures show a bimodal speed distribution, the lower
mode presumably corresponding to the speeds of those drivers
who are turning or are behind those who are turning, the upper
mode corresponding to the speeds of the other drivers.
- 226 -
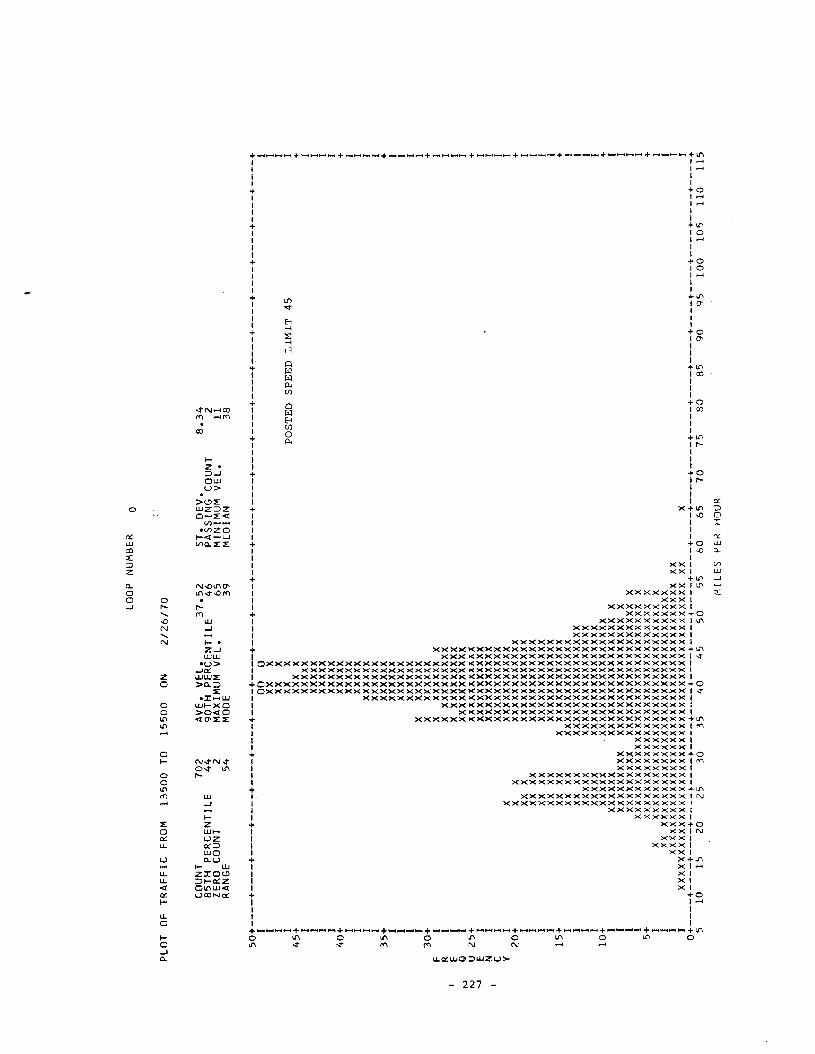
PLO
TO
FT
RA
FF
ICFR
OM
13
50
0TO
15
50
0O
N
LOO
PN
UM
BER
0
21
26
17
0
CO
UN
T7
02
85T
HPE
RC
EN
TIL
E4
4ZE
RO
CO
UN
T2
RA
NG
E5
4
AV
E.
VE
L.
37
.52
90T
HPE
RC
EN
TIL
E4
6M
AX
IMU
MV
EL
.6
5M
OO
E3
9
ST
.D
EV
.PA
SSIN
GC
OU
NT
MIN
IMU
MV
EL
.M
EDIA
N
8.3
4 21
1 38
r-.>
r-.>
--I
50
+--
--+
----
+--
--+
----
+--
--+
----
+--
--+
----
+--
--+
----
+--
--+
----
+--
--+
----
+--
--+
----
+--
--+
----
+--
--+
----
+--
--+
----
+I
00
0I
IXX
XI
IXX
XI
IXX
XP
OS
TE
DS
PE
ED
LIM
IT4
5I
45
+XX
XX
+I
XX
XX
XI
IX
XX
XX
II
XX
XX
XI
IX
XX
XX
I4
0+
XX
XX
X+
IX
XX
XX
II
XX
XX
XI
IX
XX
XX
XI
IX
XX
XX
XI
35
+xx
xXXX
+I
XX
XX
XX
II
XX
XX
XX
II
XX
XX
XX
II
XX
XX
XX
XI
30
+X
XX
XX
XX
+F
IX
XXX
XXX
XI
RI
XX
XX
XX
XX
XX
IE
IX
XX
XX
XX
XX
XI
QI
XX
XX
XX
XX
XX
XI
u2S
+X
XX
XX
XX
XX
XX
+E
IX
XX
XX
XX
XX
XX
IN
IX
XX
XX
XX
XX
XX
IC
IX
XX
XX
XX
XX
XX
IY
IX
XX
XX
XX
XX
XX
XI
20
+X
XX
XX
XX
XX
XX
XX
X+
IXX
XX
XX
XX
XX
XX
XX
XI
Ixx
XXX
XX
XX
XX
XX
XX
XI
IXX
XXX
XX
XX
XX
XX
XX
XI
Ixx
xxX
XX
XX
XX
XX
XX
XI
15
+XX
XXX
XX
XX
XX
XX
XX
XX
+I
XXXX
XX
XX
XX
XX
XX
XX
XX
II
XXXX
XX
XX
XX
XX
XX
XX
XX
XX
II
xxxx
xX
XX
XX
XX
XX
XX
XX
XX
XI
IX
XX
XX
XX
XX
XX
XX
XX
XX
XX
XX
I1
0+
XX
XX
X.X
XX
XX
XX
XX
XX
XX
XX
XX
+I
XX
XX
XX
XX
XX
XX
XX
XX
XX
XX
XX
XX
II
XX
XX
XX
XX
XX
XX
XX
XX
XX
XX
XX
XX
XX
XI
IX
XX
XX
XX
XX
xxxx
xxxx
xxxx
xxxx
xxx
XI
Ixx
xxxx
xxxx
xxxx
xxxx
xxxx
xxxx
xxxx
xX
I5+
XX
XX
XX
XX
XX
XX
XX
XX
XX
XX
XX
XX
XX
XX
XX
XX
+I
XX
XX
XX
XX
XX
XX
XX
XX
XX
XX
XX
XX
XX
XX
XX
XX
XI
Ixx
XX
XX
XX
XX
XX
XX
XX
XX
XX
XX
XX
XX
XX
XX
XX
XX
XX
II
XX
XX
XX
XX
XX
XX
XX
XX
XX
XX
XX
XX
XX
XX
XX
XX
XX
XX
XX
Xxx
II
xxxx
xxxx
xxxx
xxxx
xxxx
xxxx
xxxx
xxxx
xxxx
xxxx
xxxx
XXX
I0
+--
--+
----
+--
--+
----
+--
--+
----
+--
--+
----
+--
--+
----
+--
--+
----
+--
--+
----
+--
--+
----
+--
--+
----
+--
--+
----
+--
--+
----
+5
1015
2025
30
35
40
45
50
556
065
70
75
80
85
9095
10
01
05
11
01
15
MIL
ES
PER
HO
UR
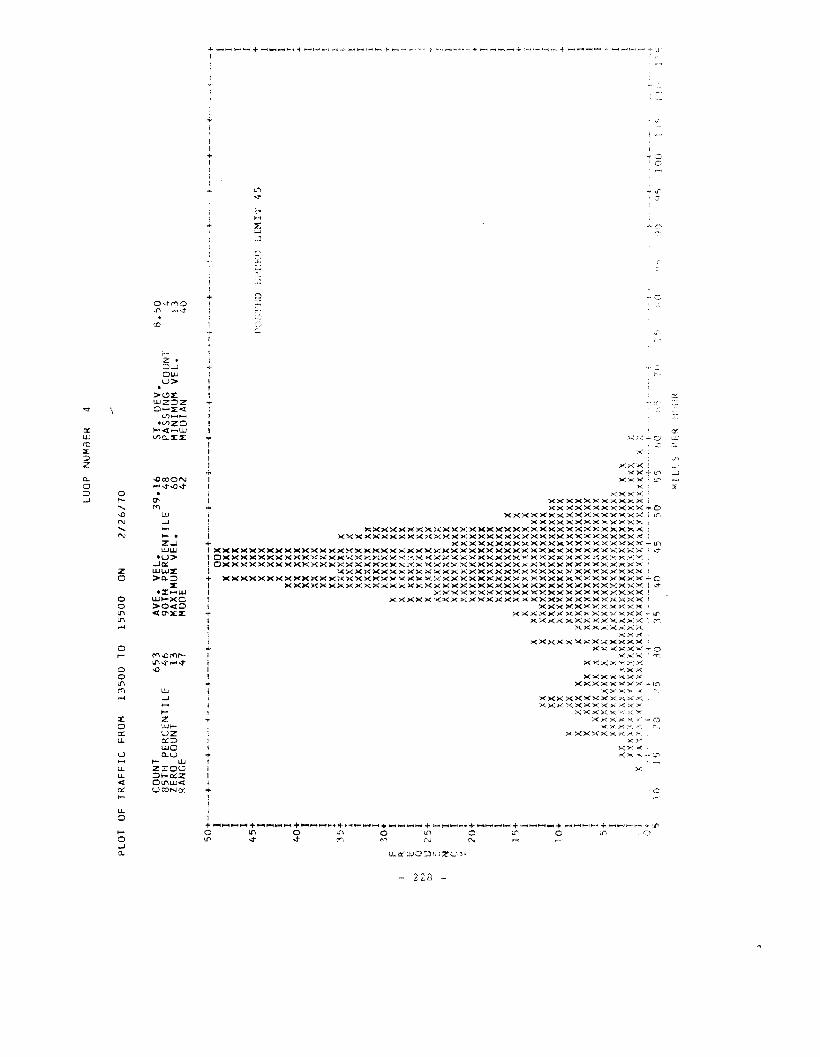
LOO
PN
UI'1
BER
4
PLO
TO
FT
RA
FF
ICFR
OM
13
50
0TO
15
50
0O
N2
12
61
70
x:i\
II
;!
.,6
0,.
c:if
)()~
00
..
CO
UN
T6
53
85T
HP
ER
CE
NT
ILE
46
ZER
OC
OU
NT
13
RA
NG
E4
7
t----+
----+
----+
----+
----+
----t-
---+
----+
---_
++
-f--
--.-
-
~ 1 I J ! ,.->
.-+
. I I I I + I I I ! +
..+
.,I·
····
-+--
,._
+..
....-,.
8.5
0 41
34
0
1'~:;1'ED
Si1
Lf:
IJL
IMIT
45
ST
.D
EV
.P
AS
SIN
GC
OU
NT
MIN
IMU
MV
EL
.M
EDIA
N
AV
E.
VE
L.
39
.16
90T
HP
ER
CE
NT
ILE
48M
AX
IMU
MV
EL
.6
0M
OD
E4
2
OOX
XXX
XX
XXX
XXX
XX
XXX
XXX
XX
XXX
XXX
XXX
XXX
XXXX
XX
XXX
XXX
XXX
XXXX
XXX
XXX
)OD
O,X
XX
vv
vv
",,
',v
......
~..
.,~
~~
';',
'"
F;,
XX
XX
XX
Xy'r
Y'Y
'f:Y
YY
XXXX
XXXX
x.XXX
XXXX
XX
XX
XX
XXX
Xxx
xxxx
XXX
XXX
XXX
XXX
x,xx
xxx
XX
Xxx
xxxx
XX,:':
,XX
)()(X
KX
XI'
XX
XX
XX
XX
XXX
XX
XX
)(XX
XX
XX
XX
XX
XX
XX
XX
XX
XX
XX
XX
XX
XX
XX
XX
XX
XX
XX
XX
XX
XX
XX
XX
XX
XX
XX
XX
XX
XX
XX
XX
XX
XX
XX
XX
XX
XX
XX
XX
XX
XX
XX
XX
XX
XX
XX
XX
XX
XXX
xxxx
xxxx
xxxx
xXX
XX
XX
XX
XX
XX
XX
XX
XX
XXX
XX
XX
XX
XX
XX
XX
XX
XX
XX
XXX
XX
XX
XX
XX
XX
XX
XX
XX
XX
XXX
Xxx
xxxx
xxxx
xxxx
xxxx
XXX
XX
XX
XX
XX
XX
XX
XX
XX
XX
XX
XXX
XXX
XX
XX
XX
XX
XX
XX
XX
XX
XX
XX
XX
XX
XXX
XXX
XX
XX
XX
XX
XX
XX
XX
XX
XX
XX
XX
XX
XX
XxX
XX
XX
XX
XX
XX
XX
XX
XX
XX
XXX
XXX
XXX
xxxx
xxxx
xxxx
xxxx
xxxx
xxxx
xXX
XX
XX
XX
XX
XX
XX
XX
XX
XX
XX
XX
XX
XX
XX
XX
XX
XX
XX
XX
XX
XX
XX
XX
XX
XX
XX
XX
XXX
xxx_
xxxx
XX
XX
XX
XX
XX
XX
XX
XX
XX
XX
XX
XX
XX
XX
•;
'I-
,~~-~·I
-·-1
-,.".
~,+
53
03
54
04
55
05
5~?
01
5
x X X X X X ~
~..~
X~,xo
n
50
+--
--+
----
+--
-·I I 1 I
45
+ I I I I4
0+ I I I I
3:,+ • • I I
30+ I I I I
25
+ i I I T
20
+ I I I I1
'i+ I I I I
1.0
+ ! I r I5
+ I ! 1
F I{
i'.»E
t\_l
QC
!ju N c
iVol
L[~
i'FR
:;r;
i!i<
•
4.2 Effect of an Accident
Figures E-39 and E-40 demonstrate the effect of a fatal
accident on speed distributions. Figure E-39 shows the speed
distribution at loop 12 on March 20, 1970, a rather normal
Friday afternoon, for the time interval 1430-1530. At 1345 on
March 27, 1970 an automobile accident occurred five miles
north of this loop. One person was killed and nine injured,
and there was a considerable traffic jam along the road.
The effects of this accident are shown in Figure E-40. The
time covered in Figure E-40 includes the time when traffic
was stopped as well as that when the traffic was beginning
to move more normally. The traffic jam and the subsequent
speed increase both show up clearly.
4.3 Effect of Highway Maintenance
Figures E-37 and E-38 show the effects of a road ob
struction - in this case painting on a bridge with a flagman
present. Figure E-37 shows the distribution of speeds of
southbound traffic immediately south of the bridge; figure
E-38 shows the distribution of speeds of northbound traffic
immediately south of the bridge.
As expected, the traffic corning off the bridge is going
slowly (the speed limit here is 65mph) and somewhat irregularly,
whereas that going northward shows two distinct peaks, one
peak presumably corresponding to those vehicles who were slowed
appreciably by the flagman, the other corresponding to those
who were waved on through without much hesitation.
- 229 -
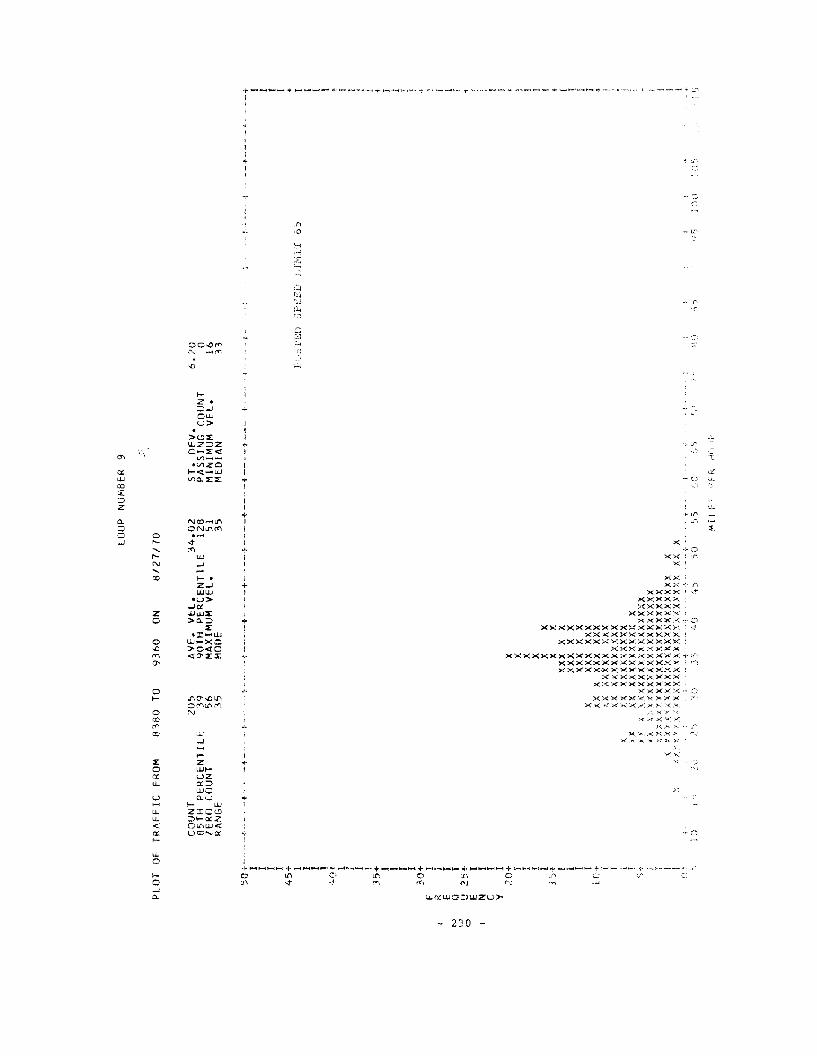
PLO
TO
FT
RA
FF
ICFR
OM
83
80
TO9
36
0O
N
LOO
PN
UM
BER
9
81
27
/70
CO
UN
T85
TH
PER
CE
NT
Iu:
IER
OC
OU
NT
RA
NG
E
20
53
95
63
5
AV
E.
VE
L.
34
.02
90T
HP
ER
CE
NT
ILE
12
8M
AX
IMU
MV
EL
.5
1M
OD
E3
5
ST
.D
EV
.P
AS
SIN
GC
OU
NT
MIN
IMU
MV
EL
.M
ED
IAN
6.2
0 o1
63
3
Hx
,TE
D;P
EE
DL
It·L
i'r
65
50~.-----·+----+---"-+
I I I I4
5+ I I I I
~O~
.~-}
----
,-.+
----
-+-
..,-
-+..
.--+
--
..•.
+--
--+
----
,I
---
+.
I..
,'"
---
I--
t---
-,·
.-.+
I I I I + I I I I +
IV t...J a
! I I3
5... 1 I I I
30
+F
IR
IE
IQ
IU
2~1+
E1
NI
CI
YI
20
+ I I ! I1
'>t I I I [
10
+ f I
")+
x X X X XX
XX
xxx
XX
XX
XX
XXX
XX
XX
XXX
XXX
XXX
XXX
XX
X'.X
)(XX
XX
XXX
XXX
XX
XX
XX
XX
),X
XX
XX
XX
XX
XX
XXxx
xxxx
xxx
X,
XX
XX
XX
XX
XX
XX
XX
XX
Xxx
~X
XX
XX
XX
XX
XX
XX
XX
XX
XX
X)
YX
XX
XX
XX
XX
XX
XX
XX
XX
xxX
J.XX
XX
XX
XX
XX
XX
XX
XX
XX
XXXy~XX~
KX
XX
XX
XX
XX
XX
XX
XX
XX
XXX
X
I I + l ! I [
CJ}
')-.
0(('
)+
j:;;
':'0
It5
0I·
··I
55
(,0
fJ")
::-l')
s0
0.\
,"~
:l,l
~II..F
UF
R!~
>,
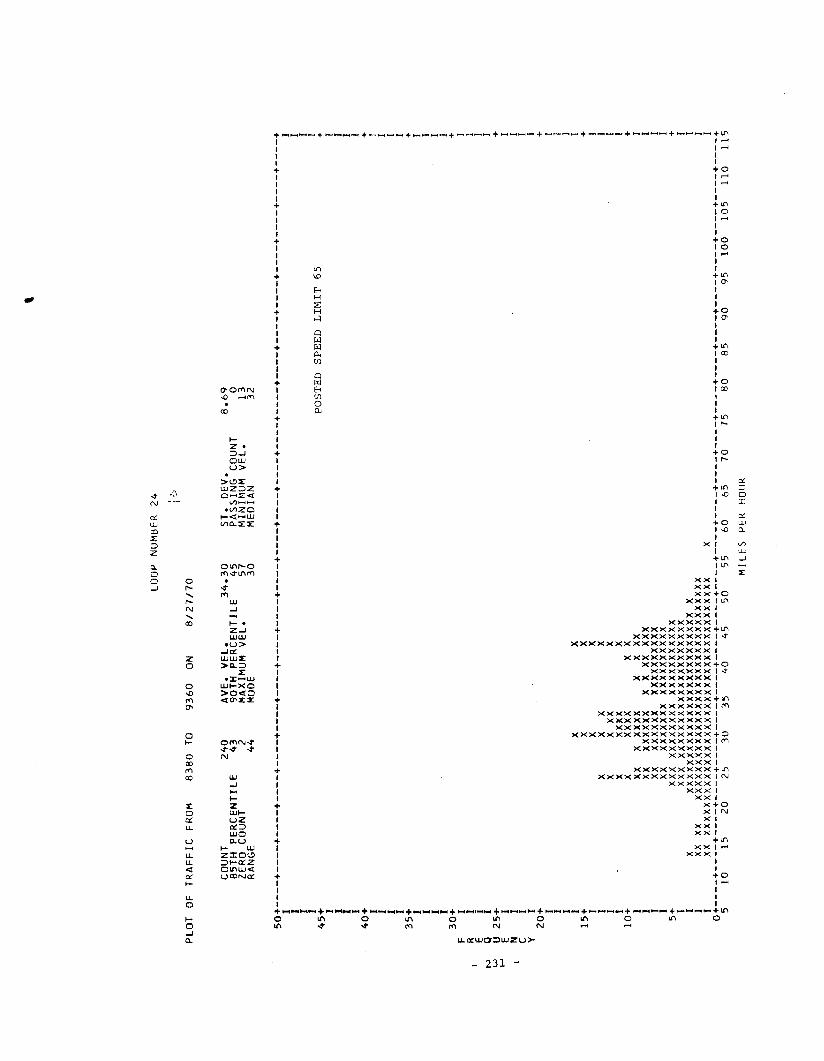
,
LOO
PN
UM
BER
24 [?
PLO
TO
FT
RA
FF
ICFR
OM
83
80
TO9
36
0O
N8
/27
17
0
CO
UN
T2
40
85T
HP
ER
CE
NT
ILE
43
ZE
RO
CO
UN
T2
RA
NG
E4
4
AV
E.
VE
L.
34
.30
90T
HP
ER
CE
NT
ILE
45
MA
XIM
UM
VE
L.
57
MO
DE
30
ST
.D
EV
.P
AS
SIN
GC
OU
NT
MIN
H'U
MV
EL
.M
ED
IAN
8.6
9 o1
33
2
50
+----+
----+
----+
----+
----+
----+
----+
----+
----+
----+
----+
----+
----+
----+
----+
----+
----+
----+
----+
----+
----+
----+
II
II
II
45
!P
OS
TE
DS
PE
ED
LIM
IT6
51
II
II
II
II
40
++
II
II
I[
II
35
++
II
II
II
II
30
++
FI
IR
II
Ei
IN
QI
IV
JU
25
++
t-'
EI
IN
II
CI
IY
II
20
++
II
II
II
IX
XI
15
+X
X+
IX
XI
IX
XX
XI
IX
XXX
XI
IX
XX
XX
X[
10
+X
XX
XX
XX
+I
XXX
XX
XX
XX
XX
II
XXX
XX
XX
XX
XXX
XX
XI
Ixx
xxxx
xxX
XX
XX
XX
XX
XI
IXX
XX
XX
XX
XX
XX
XX
XX
XX
XI
5+
XX
XX
XX
XX
XX
XX
XX
XX
XX
XX
XX
+I
XX
XX
XX
XX
XX
XX
XX
XX
XX
XX
XX
XI
IX
XX
XX
XX
XX
XX
XX
XX
XX
XX
XX
XX
XX
XX
XI
Ixx
XXX
XX
XX
XX
XX
XX
XX
XX
XX
XX
XX
XX
XX
XX
XX
XX
XI
IXX
XX
XX
XX
XX
XX
XX
XX
XX
XX
XX
XX
XX
XX
XX
XX
XX
XX
XX
XX
I0
+----+
----+
----+
----+
----+
----+
----+
----+
----+
----+
----+
----+
----+
----+
----+
----+
----+
----+
----+
----+
----+
----+
51
01
52
02
53
03
54
04
55
05
56
06
57
07
58
08
59
09
51
00
10
51
10
11
5
MIL
ES
PER
HO
UR
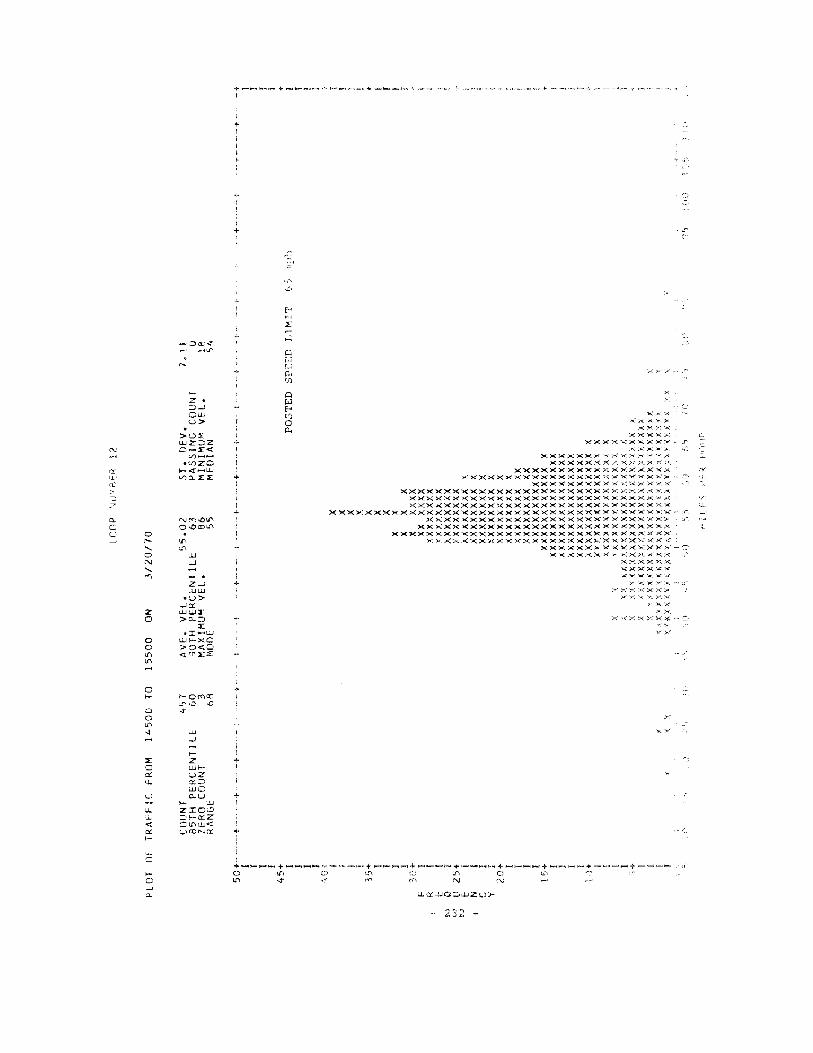
PLO
TO
FT
RA
FFIC
FRO
M1
45
00
TO1
55
00
ON
LOO
PiW
:/3E
R12
3/2
01
70
CO
UN
T85
TH
PER
CE
NT
ILE
ZER
OC
OU
NT
RA
NG
E
41)7 60 3
68
AV
E.
VE
L.
55
.02
90T
HPE
RC
EN
TIL
E6
3M
AX
IMU
MV
EL
.8
6M
ODE
55
ST
.D
EV
.PA
SSIN
GC
OU
NT
MIN
IMU
MV
EL
.M
EDIA
N
7.
11 o
18 54
x X X X X X XX
XX
XX
Xxx
xxXX
XX
XX
XX
XX
XX
XX
x.xx
xxxx
xXX
XXX
Xxx
XX
XX
XX
XX
,..X
)('u
OU
\)(
,.X
XX
XX
XX
XX
XX
XX
XX
XX
XX
XX
XX
XX
XX
XX
XX
XX
XX
XX
XX
XX
XX
XX
XX
XX
XX
XX
XXX
XX
XX
XX
XXX
XX
XX
XX
XX
XX
XX
XX
XX
XX
XX
XX
XX
XX
XX
XX
XX
XX
XX
XX
XX
XX
XX
XX
XX
XX
XX
XX
xxxx
xxxx
xxxx
xxx
XX
XX
XX
XX
XX
XX
XX
XX
XX
XX
XX
XX
XX
XX
XX
XX
XY
XX
XX
XX
xxxx
xxX
XX
XX
XX
XX
XX
XX
XX
XX
\X
XX
XX
XX
XX
XX
XX
XX
XX
XX
XX
XX
XX
XX
XX
XX
XX
XX
XX
XX
XX
XX
XX
XX
XX
XXX
KX
(.XX
XX
XX
XX
XX
XX
XX
XX
XX
XX
XX
X'X
XX
XX
XX
XX
XX
XX
XX
XX
XX
XX
XX
XX
X.x
xxX
X.X
XX
XX
XX
XX
XX
XX
XX
XX
XX
XX
XX
XIX
XX
XX
/XX
XA
XX
XX
XX
XXX
~\XXXXX
:XI
:.1C,_
1-),
)')~.,
~),)
61
){\
POST
ED
SPE
ED
LIM
IT
50j-~·
._._
+._
...
_+-+
..~...
-:
..I I I r
45+ I I ! I
t~,G+ i
3::5
+
,)F
IR
!E
I"-,
\}I
(....U
25
+~.
.:'
E!
NI
CI
yI
20
+ I I I I1
5+ I , I I
;)+
x):
~..J
~;l
!i'
"-
_..
v_
_•
+-_._._+--_.~_~
__._
t-+
65
i'1~
)~i
.'~
+,.'
....-
:
')',
(\()
--+._
_._
---+
_.
j~)
-+ I I I I + I I I 1 i·· ... I [ I I
diLF'~
r'R
r,;'
11
j(
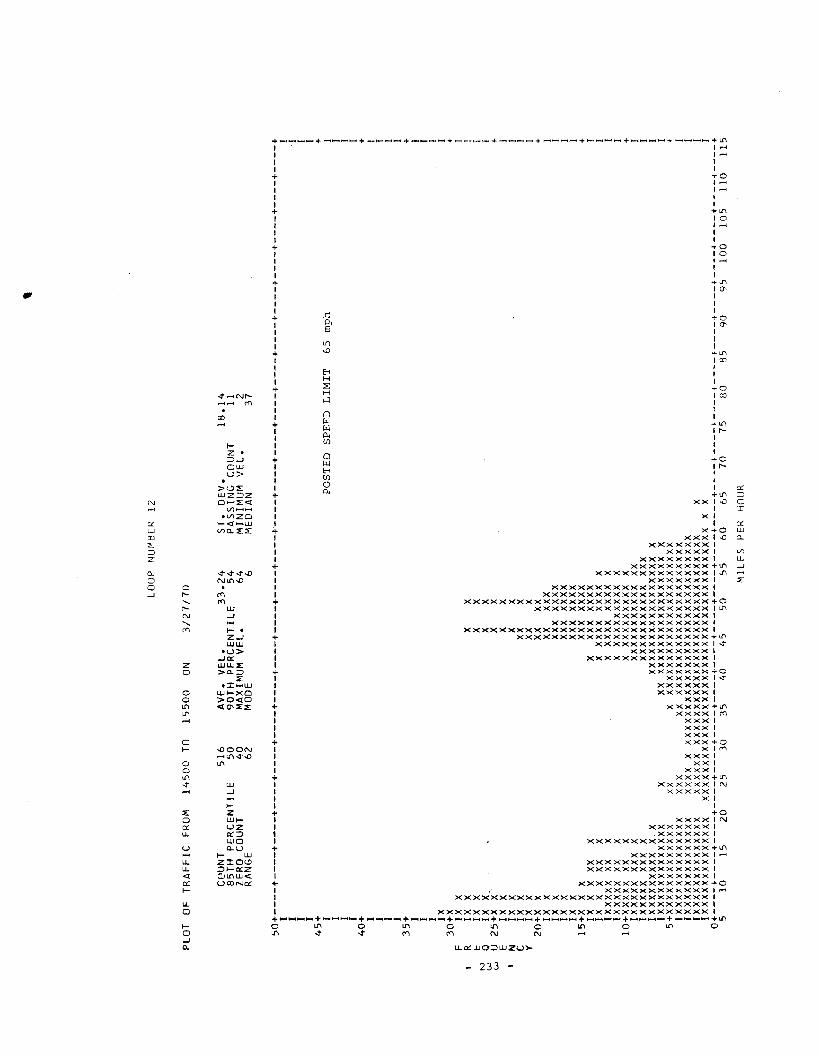
,
LOO
PN
UM
BER
12
PLO
TO
FT
RA
FFIC
FRO
M1
45
00
TO1
55
00
ON3
/27
17
0
CO
UN
T5
16
85T
HPE
RC
EN
TIL
E5
0ZE
RO
CO
UN
T4
0RA
NG
E62
AV
E.
VE
L.
33
.24
90T
HPE
RC
EN
TIL
E5
4M
AX
IMU
MV
EL
.6
4M
OD
E6
ST
.D
EV
.P
AS
SIN
GC
OU
NT
MIN
IMU
MV
EL
.M
EDIA
N
18
.14 112
37
50
+--
--+
----
+--
--+
----
+--
--+
----
+--
--+
----
+--
--+
----
+--
--+
----
+--
--+
----
+--
--+
----
+--
--+
----
+--
--+
----
+--
--+
----
+I
II
II
II
I4
5+
+I
POST
ED
SPE
FDL
IMIT
65
mp
hI
II
II
II
40
++
II
II
II
II
35
++
II
II
II
IX
I30
+X
+F
IXX
IR
IXX
XX
II:
IXX
XX
I'"
QIX
X.
XX
I~
U25
+X
XX
X+
EIX
XX
XI
NIX
XX
XI
CI
XX
XXX
IY
IX
Xxx
XI
20+
XX
XXxx
+IX
Xxx
XXX
IIX
XXX
XX
XX
XI
IXX
XXX
XX
XX
II
XX
XX
XX
XX
XI
15+
XX
XXX
XX
XX
X+
IX
XX
XXX
XXX
XX
XX
XI
IXX
XXX
XX
XX
XX
XX
XX
XI
IXX
XX
XXX
XX
XX
XX
XX
XX
XI
I XX
XX
XXX
XX
XX
XX
XX
XX
XX
I10
+XX
XX
XXX
XX
XX
XX
XX
XX
XX
+IX
XX
xxXX
XX
XX
XX
XX
XX
XX
XXX
IIX
XX
XX
XXX
XX
XX
XX
XX
XX
XX
XXX
IIX
XX
XX
XX
XX
XX
XX
XX
XX
XX
XX
XX
XX
XX
XX
II X
XX
XX
XX
XX
XX
XX
XXX
XX
XX
XX
XX
XX
XX
XX
XX
XX
I5+
XX
XX
Xxx
xxxx
xXXX
XX
XX
XX
XX
XX
XX
XX
XX
XX
XX
XX
X+
IXX
XX
Xxx
xxxx
xxX
XXX
XXX
XX
XX
XX
XX
XX
XX
XX
XX
XX
XX
XI
IXX
XX
XX
xxxx
xxxx
XXXX
XX
XX
XX
XX
XX
XX
XX
XX
XX
XX
XX
XX
XX
XX
XX
XI
IXx
xx
xx
xx
xx
xx
xX
XX
XX
XX
xx
xx
xx
xx
xx
xx
xx
xx
xx
xx
xx
xx
xx
xx
xx
XI
IXX
xxxx
xxxx
XX
XX
xx
xx
xx
xx
xx
xx
xx
xx
xx
xx
xx
xx
xx
xx
xx
xx
xx
xx
xx
xX
XI
0+
----
+--
--+
----
+--
--+
----
+--
--+
----
+--
--+
----
+--
--+
----
+--
--+
----
+--
--+
----
+--
--+
----
+--
--+
----
+--
--+
----
+--
--+
510
1520
2530
3540
45
50
55
60
657
075
80
8590
95
10
01
05
11
01
15
MIL
ES
PER
HO
UR
