may, 1986 - tdl
TRANSCRIPT
PUBLIC EMPLOYEE RETIREMENT SYSTEM REPORTS: A STUDY
OF USER INFORMATION PROCESSING ABILITY
by
STEPHEN D. WILLITS, B.S., M.S. in Acct.
A DISSERTATION
IN
BUSINESS ADMINISTRATION
Submitted to the Graduate Faculty of Texas Tech University in Partial Fulfillment of the Requirements for
the Degree of
DOCTOR OF PHILOSOPHY
Approved
May, 1986
ACKNOWLEDGMENTS
I am forever Indebted to my committee chairman, Dr. Robert J.
Freeman, and to Dr. Donald K. Clancy for their careful and patient
guidance throughout the development of this work; to Dr. Paul H. Munter
for providing numerous helpful suggestions; and to Drs. Larry M. Austin
and James B. Wilcox for serving on my committee.
I am grateful to my wife Kris and my family for their patience,
support and encouragement during the years of my academic career.
11
CONTENTS
ACKNOWLEDGMENTS ii
ABSTRACT v
LIST OF TABLES vli
LIST OF FIGURES viii
1. INTRODUCTION 1
Nature of the Problem 1
General Pension Setting 3
GAAP Controversy 7
Actuarial Status 10
Specific Problem to be Addressed 12
Expected Contributions of the Study 15
Organization of the Study 16
2. LITERATURE ON PENSION PLAN REPORTING 18
Authoritative Statements 18
Previous Pension Research 26
Summary 34
3. FULL DISCLOSURE VS. FUNCTIONAL FIXATION 36
Support for "Full Disclosure" 37
Support for "Functional Fixation" 44
Theoretical Model of PERS Accounting 49
Summary 59
111
4. RESEARCH DESIGN 60
Human Judgment Research 60
Research Instrument and Hypotheses 75
Summary 80
5. HYPOTHESES TESTS, RESULTS, AND IMPLICATIONS 82
Instrument Validation 82
Respondent Demographics 85
Judgments About PERS 93
Judgment Consensus 114
Effects on Judgments of Respondent Demographies . . . 119
Limitations 122
Summary 124
6. CONCLUSIONS 126
The Study: An Overview 126
The Research Results in Perspective 128
Changes in PERS Financial Reporting Practices
Suggested by the Results 129
Implications for Additional Research 137
BIBLIOGRAPHY 139
APPENDICES
A. COMPARISON OF SFAS 35 AND NCGAS 6 147
B. DESCRIPTION OF BRUNSWIK'S LENS MODEL 153
C. RESPONDENT PACKET—NCGAS 6 VERSION 157
D. RESPONDENT PACKET—SFAS 35 VERSION 174
iv
ABSTRACT
Improved accounting reports should result when standards setters
are provided with evidence regarding the ability of public employee
retirement system (PERS) financial report users to (1) interpret
reported pension information, and (2) Impound actuarial data. Accord
ingly, this study was conducted to gain insight into the decision making
process(es) of PERS financial report users and preparers.
A field experiment employing a simulated decision making situation
was used to gather data. Respondents made judgments about a fictitious
PERS and then completed two exercises that (1) measured their knowledge
of the effects of actuarial methods and assumptions on reported data,
and (2) tested their ability to properly consider these effects when
comparing the funding of the fictitious PERS to that of other pension
plans. Two general research questions were addressed: (1) does the
benefit-liability measure used for PERS financial reporting and/or the
amount of supplemental disclosure affect users' perceptions of the PERS
financial condition, and (2) do users of PERS financial statements
understand the effects that actuarial assumptions have on the reported
benefit-liability measure?
Analysis of the responses produced these findings: (1) respondents
appeared to be functionally fixated on the reported funding status of
the PERS and did not properly consider the underlying factors that
affect this status; (2) a significant percentage of respondents under
stood the effects of the assumed rates of (a) salary increase and (b)
return on plan assets on reported pension obligations, but did not
recognize the effects of the actuarial cost methods presented; (3) mean
responses were not affected by the presence of 10-year trend data;
however, the inclusion of 10-year data did result in improved judgment
consensus; (4) fixation on the reported funding status of the fictitious
PERS was not limited to those respondents that had limited actuarial
knowledge, but was found in all respondent groups; and (5) demographic
characteristics had only a limited effect on respondent's decision
models.
These findings indicate (1) that communication between PERS finan
cial report users and preparers needs Improvement, and (2) that
financial report users have difficulty incorporating actuarial
Information in their judgments. Accordingly, standards setters should
standardize PERS reporting practices and/or seek ways to improve PERS
disclosures.
VI
LIST OF TABLES
1. Response Rate by Instrument Version, Type of Employer, and
Size of Employer 87
2. Demographic Characteristics of the Respondents 89
3. Respondents' Knowledge of the Effects of Selected Actuarial Variables on the Reported Benefits Obligation of a PERS . . 92
4. Mean Response and Variance by Financial Statement Version for Each Groups' PERS Judgments 95
5. Effects of Financial Statement Format on the Responses to Questions 1 through 4 97
6. Financial Statement Elements That Were Relied Upon when Answering Questions 1 through 4 as Self-reported by Respondents (NCGAS 6 Recipients) 100
7. Financial Statement Elements That Were Relied Upon when Answering Questions 1 through 4 as Self-reported by Respondents (NCGAS 6—without Statistical Data Recipients) 101
8. Financial Statement Elements That Were Relied Upon when Answering Questions 1 through 4 as Self-reported by Respondents (SFAS 35 Recipients) 102
9. Comparison of Benefit Funding Levels Under NCGAS 6 and SFAS 35 for the Study's Fictitious PERS 103
10. Analysis of Variance Performed on the Combined Data from All Respondents 107
11. Analysis of Variance Performed on the Combined Data from All Respondents (Grouped by Actuarial Knowledge) Ill
12. The Relative Use of the Market Value of Available Assets, the Assumed Salary Increase, the Rate of Return and Their Interactions 113
13. Effects of Respondents' Demographic Characteristics and Actuarial Knowledge on the Responses to Questions 1 through 4 120
vli
LIST OF FIGURES
1. Pension Accounting Environment 4
2. Theoretical Model of Pension Plan Judgments 51
3. Hypothetical PERS Illustrative Asset Targets 53
4. Asset Target for a Hypothetical PERS Under Various Actuarial
Assumptions 55
5. Brunswik's Lens Model 62
6. Indices of Human Judgment 63
7. Research Design 68
8. Empirical Model 69
9. Effect of Dichotomizing Continuous Cues 74
viii
CHAPTER 1
INTRODUCTION
Nature of the Problem
Concern about the relationship between (1) users' information
needs, and (2) the information content of accounting reports has pro
vided the impetus for accountants to re-examine both their perceptions
of users' Information needs and their ability to provide accounting
information that will serve these perceived needs. This concern is
evident throughout the Financial Accounting Standards Board's [FASB's]
conceptual framework project [e.g., FASB, 1976], and stems from observa
tions made by accounting researchers, and others, that may be
summarized:
1. Users of accounting information seek information that will
assist them in their decision making process.
2. The decision making process is complex, thus Implying a diverse
set of Information needs.
3. The accountant emphasizes the measurement of economic
phenomena; accordingly, the importance of relevant and reliable
(objective) information is stressed.
4. Accounting information may lack usefulness for some specific
decision models due to differences in orientation between users and
preparers.
The concern over the objectives of financial statements has not
been confined to the private sector. Both the FASB's Statement of
Financial Accounting Concepts No. 4, "Objectives of Financial Reporting
by Nonbusiness Organizations" [FASB, 1980], and National Council on
Governmental Accounting (NCGA) Concepts Statement 1, "Objectives of
Accounting and Financial Reporting for Governmental Units" [NCGA, 1982],
address the information content required by users of nonbusiness
financial statements.
Accounting researchers have studied the behavior of financial
statement users in an effort to (1) better understand htiman information
processing, and (2) develop some Insight into the more common decision
models. The ultimate objective of such research in accounting is to
Improve decision making [Ashton, 1982]. However, decision making must
be understood before it can be Improved. Thus, human Information
processing research in accounting concentrates on understanding, evalua
ting, and improving decisions based on accounting information.
Although previously published human Information processing studies
have been confined to the private sector [Libby, 1981, ch. 3-5; Ashton,
1982, ch. 7-8], the solution to several accounting and reporting prob
lems in the public sector may come from a better understanding of how
users of financial information make certain judgments. One of these
problems relates to the decision making process(es) of the users of
public employee retirement system (PERS) financial information and the
ability of these users to make judgments based on currently available
PERS financial statements.
General Pension Setting
PERS Growth
The provision of pension benefits is a matter of increasing concern
to many state and local governments because of the growth in PERS
enrollments and plan benefits. The General Accounting Office reports
that ". . . State and local plan enrollment and assets have increased at
an even faster rate than that of all pension plans" [1980, p. 1]. State
and local plan membership stood at 11.4 million persons in fiscal year
1982-83 [U.S. Department of Commerce, 1984]—up from 1.6 million in 1940
[General Accounting Office, 1980]. Further, the U.S. Department of
Commerce reports:
Total State and local government employee retirement system revenues for fiscal year 1982-83 amounted to $57.9 billion while their payments totaled $19.8 billion. In the last month of their 1982-83 fiscal year, these government agencies: . . . had amassed financial assets totaling $289.7 billion; paid recurrent benefits of $1.4 billion to 3.1 million persons for an average monthly payment of $464 per beneficiary. [1984, p. vi]
This growth in government pension plans has occurred, to some extent,
because of the promises of elected officials, as noted by Mautz:
Promises can be made in the present that escape accounting attention in the financial statements until much later. Promises of future pensions may get the waste hauled away or the transit system operating again right now, but those obligations may not be reported as obligations to be met by future taxpayers until much later, if ever. [1981, p. 56]
Pension Environment
The pension reporting environment is complex—in part because of
the variety of pension arrangements used to provide employees with
retirement benefits. Figure 1 diagrams the PERS plan setting that
potentially affects pension accounting and financial reporting
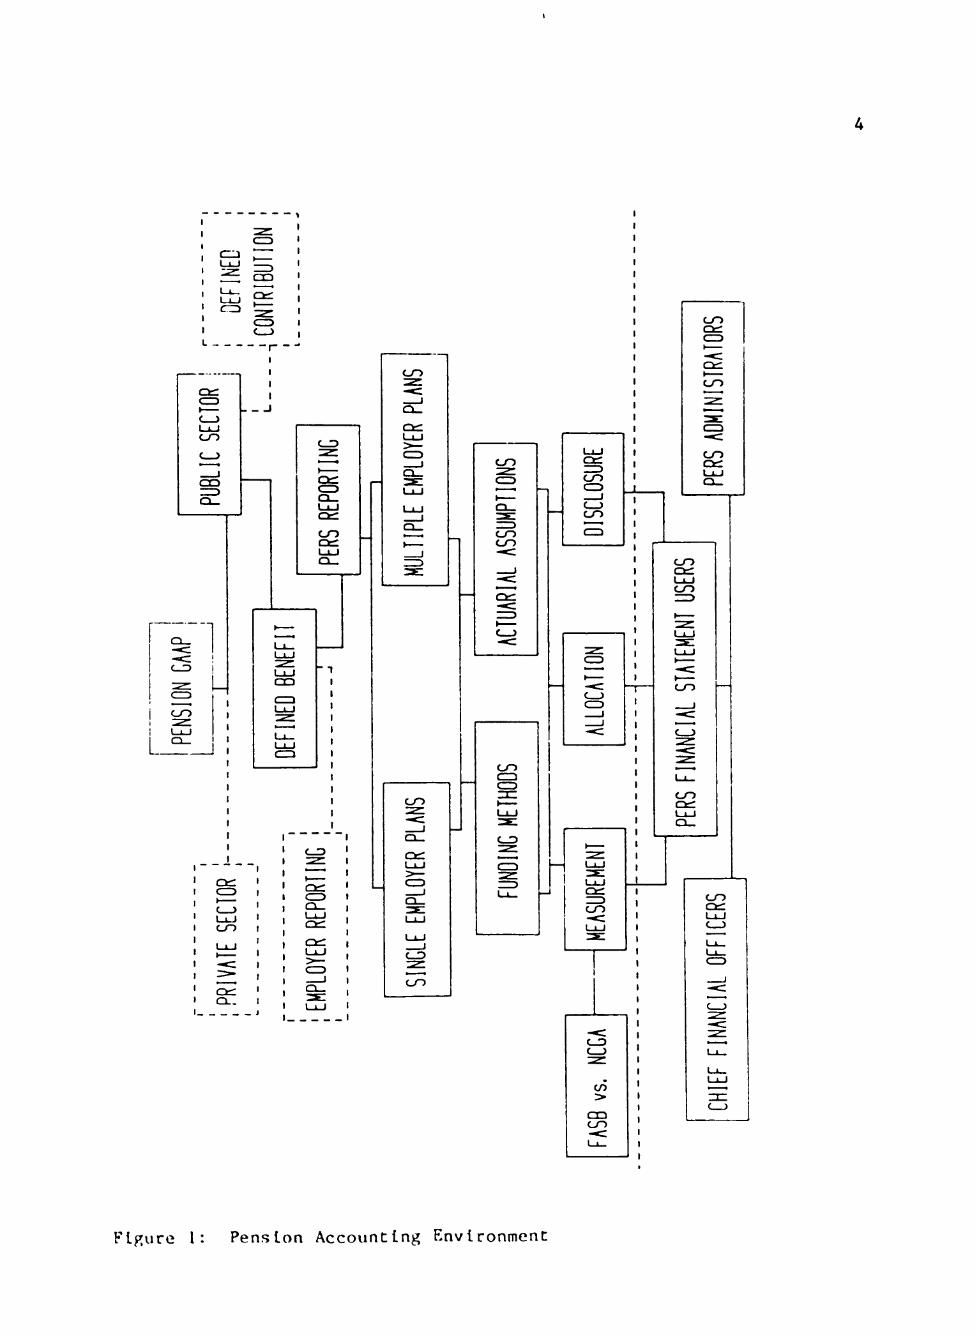
Figure I: Pension Accounting Environment
techniques. In addition to the plan setting presented here, other
potentially material PERS environmental factors Include: legislative
mandates, pressures from public employee unions, legal actions, and the
political climate.
While both defined benefit and defined contribution pension plans
exist in the public sector, defined benefit plans are the most prevalent
in the public sector and are the focus of this study [Engstrom, 1984].
Under a defined benefit plan, each employee is entitled to the level of
benefits specified by the plan. Frequently, such benefits are based on
the length of employment and the employee's salary near the time of
retirement. In contrast, in a defined contribution plan, employee
retirement benefits are based on an allocated share of the plan's
available assets.
The existence of both single-employer and multiple-employer defined
benefit plans adds to the environmental complexity. As the name
Implies, single-employer PERS are sponsored by one employer (city,
county, or state) exclusively for its employees. When more than one
employer contributes to a plan, it is referred to as a multiple-employer
plan. A multiple-employer plan may serve as an Investment and admin
istrative agent for each participating employer or may be a pension
cost-sharing arrangement.
A final, and extremely Important, difference among PERS is the
method of financing the benefits provided by such systems. Unfortu
nately, some PERS are not funded on an actuarial basis [Wlnklevoss and
McGlll, 1979]. Instead, such plans employ either pay-as-you-go or
terminal funding methods, relying on uncertain and often inadequate
legislative appropriations to finance benefit payments during each
fiscal period [NCGA, 1968]. At the opposite end of the scale, a number
of PERS undergo periodic actuarial valuations and all liabilities,
present and prospective, are advance funded [Engstrom, 1984]. Between
these two extremes are numerous PERS that are designed to be actuarially
sound but have "manageable" unfunded actuarial liabilities resulting
from such circumstances as Inadequate provisions for prior service
costs, investment restrictions, or benefit increases too liberal to be
met with existing funding patterns.
The Nature of PERS Liabilities
Two fundamentally different approaches to benefit-liability
measures can be used in reporting the financial status of defined
benefit PERS. The plan-termination liability (PTL)—based on the
assumption that the plan will be terminated on the valuation date—is
the dollar value of each active member's accumulated plan benefit. The
actuarial assumptions used to calculate this liability may differ from
those used in the annual valuation. For example, the appropriate rate
of interest is the rate on which currently available annuity contracts
are based—which may not coincide with the actuarially assumed valuation
rate. Accumulated plan benefits are based on the employee's current
salary level and exclude consideration of ancillary benefits (e.g.,
disability, death, and early retirement benefits) since—if the plan
were actually to terminate—the only benefit the plan members would be
entitled to would be a deferred benefit starting at the plan's normal
retirement age. The PTL also Includes any contributions made by non-
vested employees.
The second approach to benefit-liability measures—termed the
plan-continuation liability (PCL)—Is predicated on the assumption of an
ongoing pension plan. Accordingly, PCL calculations are based on bene
fits allocated to date—including ancillary benefits—and use the
actuary's valuation assumptions. Typically, these allocated benefits
relate to each active member's projected benefit at retirement, and thus
are based on his expected future salary level. Under both approaches,
the liability for benefits attributable to nonactive members equals the
actuarial value of benefits payable to them.
Several arguments favor the PCL as the benefit-liability measure
to use for PERS reporting:
1. The PCL recognizes the effects on reported benefits of
ancillary benefits and future salary increases, both of which are
expected to occur in an ongoing plan.
2. The PCL is preferred by PERS administrators since it is more
conservative than the PTL approach and results in a larger unfunded
pension liability being reported. In turn, this larger reported
liability provides an Incentive for government officials to maintain or
increase levels of plan funding.
3. Few municipalities have defaulted on pension obligations, and
even in those cases the courts have upheld the rights of workers to
receive their benefits [Inman, 1982].
GAAP Controversy
Much of the controversy surrounding PERS accounting and financial
reporting is due to the existence of two conflicting sets of official
8
pronouncements on the topic—one by the FASB, the other by the NCGA.
The FASB and the NCGA disagree about (1) the user(s) and objectives of
PERS financial statements, (2) the amount of Information to provide to
users, and (3) the appropriate benefit-liability measure to use. The
FASB's pronouncement. Statement of Financial Accounting Standards
No. 35 (SFAS 35), "Accounting and Reporting by Defined Benefit Pension
Plans" [March, 1980], Is predicated on the PTL approach. Although
SFAS 35 states that "an assumption of an ongoing plan shall underlie the
other assumptions used . . ." [par. 20], its provisions appear to be
more consistent with a terminating plan assumption. For example, SFAS
35 requires that (1) accumulated plan benefits (based on current salary
levels) and (2) market values for plan investments be used for reporting
purposes; both are consistent with a PTL approach, as is the provision
that permits the use of actuarial assumptions that are Inherent in
commercially available Insurance contracts that could be purchased to
provide employee benefits.
In contrast, the NCGA's Statement 6 (NCGAS 6), "Pension Accounting
and Financial Reporting: Public Employee Retirement Systems and Local
Government Employers," [June, 1983], is predicated on the PCL approach.
For reporting purposes, NCGAS 6 requires (1) the use of credited pro
jected benefits (based on expected future salary levels) and (2) that
Investments be reported at cost (parenthetical disclosure of market
value is also required). NCGAS 6 also requires that the rate of
Interest and other actuarial assumptions used in the actuarial valuation
be disclosed. NCGAS 6 differs further from SFAS 35 in the level of
disclosure required. (Appendix A suimnarlzes the SFAS 35 and NCGAS 6
accounting and reporting requirements.)
As a temporary solution to the problem caused in the public sector
by conflicting official pronouncements, the NCGA and FASB agreed to
mutually defer the effective dates of their respective pronouncements
for PERS reporting. The newly formed Governmental Accounting Standards
Board (GASB) placed two pension projects on its initial agenda and,
until it issues a Statement(s) on the topic, has recognized both SFAS 35
and NCGAS 6 as acceptable sources of GAAP. The GASB also recognizes
Audits of State and Local Governmental Units (ASLGU) as authoritative,
thus potentially adding to the controversy since ASLGU recognizes
Governmental Accounting, Auditing, and Financial Reporting [1968]
(GAAFR68) as the primary source of GAAP for governments. Further, GASB
Statement 1, "Authoritative Status of NCGA Pronouncements and AICPA
Audit Guide" [July, 1984] (GASBS 1), recognizes NCGA Statement 1,
"Governmental Accounting and Financial Reporting Principles" [March,
1979] (NCGAS 1), as authoritative, and NCGAS 1 has been interpreted as
effectively recognizing the GAAFR68 method of pension accounting by
presenting that approach in its illustrative financial statements.
Accordingly, a third alternative exists for PERS accounting and finan
cial reporting. GAAFR68 contains guidance on pension accounting and
reporting that differs from both SFAS 35 and NCGAS 6, emphasizing the
trust fund nature of pension funds. GAAFR68 also provides no guidance on
acceptable (for reporting purposes) actuarial methods and requires no
disclosure of plan benefit provisions, accounting and funding methods,
or actuarial assumptions.
10
Actuarial Status
Actuaries determine the probable future benefits of a particular
plan and advise the PERS and sponsoring employer on the funding policy
to adopt. Thus, actuaries heavily Influence pension accounting and
financial reporting. Both economic assumptions (e.g.. Interest rate,
inflation rate, salary-level increases) and employee related assumptions
(e.g., termination rates, turnover, salary scale, survivor election)
must be made in the process of estimating plan benefits and determining
the required plan funding. These assumptions can materially affect both
reported pension information and plan funding [Wlnklevoss, 1977].
Walker [1984] notes that:
Actuarial assumptions are sensitive to small changes. Some assumptions, such as the interest rate assumption, are extremely sensitive. Even the small changes actuaries make in assumptions to provide safety margins can have a significant effect on pension costs [and PERS financial statements] for a given year. [p. 194]
The correct treatment of these assumptions is the basis for consi
derable controversy among accountants. Some contend that comparabil
ity in accounting and financial reporting will be enhanced if (1) all
PERS are required to use the same actuarial cost method, or (2) the
range of acceptable actuarial assumptions for accounting purposes is
narrowed [Wlnklevoss and McGlll, 1979; Walker, 1984; Schwartz and
Lorentz, 1984]. Schlpper and Weil [1982] state that: ". . . one cannot
measure the present value of future cash outflows for pensions from a
pension accounting that is based on some of the actuarial cost methods
that are allowed under currently accepted accounting principles"
[p. 807]. They also note that: "because the various actuarial methods
11
are based on data and assumptions that may preclude drawing inferences
about other methods not used, even sophisticated users of the data may
not be able to derive their own estimates of the future pension cash
flows" [p. 816]. Thus, they Imply that the range of permissible
actuarial cost methods should be narrowed—given the financial account
ing objective that information useful in assessing future cash flow
prospects should be provided [SFAC No. 1, par. 37]. Similar views were
adopted by the Federal Government.
Uniform reporting for the Federal Government's 50-plus pension
plans is required by Public Law 95-595. This law extends the annual
financial and actuarial reporting requirements of the Employee Retire
ment Income Security Act of 1974 [ERISA]—passed in response to the
rapid growth of the private pension system and concern over the funding
status of many plans [Schwartz and Lorentz, 1984]—to most Federal
pension plans. (However, Federal plans are not subjected to ERISA's
funding, minimum benefit level, or individual participant reporting
requirements.) Webster [1984] notes that:
. . . guidelines [for the Implementation of Public Law 95-595] were Issued that paralleled [SFAS 35]. The guidelines went further, however, specifying a rate of inflation to be used in actuarial computations, disclosing the computation of the unfunded actuarial accrued liability, disclosing the plan's normal cost, presenting a funding method whereby the unfunded liability is amortized in level dollar amounts over 40 years, presenting the future flow of plan assets, and requiring similar statistical data to that reported in ERISA Form 5500— Schedule B. The guidelines also require an opinion of an enrolled
actuary stating that actuarial assumptions used in preparing the report are reasonable and that the report is complete and accurate.
Others believe that the specification of actuarial assumptions or
accounting and reporting requirements similar to those of Public
12
Law 95-595 places an unnecessary burden on PERS and government employers
and would not achieve the desired comparability between plans [Buxbaum
and Quindlen, 1984].
Specific Problem to be Addressed
The amount and type(s) of actuarial reporting and/or disclosure to
require—and the best benefit-liability measure and reporting format—
should be determined only after considering the Information needs of
PERS financial statement users. NCGA Concepts Statement 1—based on a
research study of potential users of government financial statements and
the information necessary to support their decisions—identifies five
basic categories of relevant information:
1. Information concerning short-term financial resources.
2. Information concerning the financial condition of the
governmental unit.
3. Information concerning compliance with legal, contractual, and
fiduciary requirements.
4. Information useful for planning and budgeting.
5. Information concerning managerial and organizational
performance.
The GASB [1985b] enumerates similar uses of governmental financial
reports in its Statement of Governmental Accounting and Reporting
Objectives. In addition to this general discussion of the uses of
governmental financial reports, the GASB [1985a] specifically discusses
PERS reporting and states that:
the primary objectives of pension disclosures are to provide . . . information needed to assess (a) the funding status of a
13
PERS on a going-concern basis, (b) progress made in accumulating assets to pay benefits when due, and (c) whether employers are making actuarially determined contributions to plans, [par. 6]
However, no consensus has been reached regarding the PERS information
set that best meets these user needs.
Some would argue that these needs are best met when accounting and
reporting alternatives are severely limited. Implicit in such arguments
is the belief that users of pension reports benefit (i.e., are able to
make better decisions) if reported pension information is standardized
as to content, form, and underlying assumptions.
On the other hand, others take issue with pension reporting
requirements such as those specified by Public Law 95-595, believing
that "over-regulation" of this kind (1) is unduly expensive and (2)
precludes the selection of an accounting and reporting method that
mirrors the underlying economic aspects of the PERS. Implicitly, they
argue that—because the "market" is efficient—any one of several
pension accounting and reporting approaches should be permitted if the
selected approach is adequately described in the PERS financial
statements.
Those advocating "adequate disclosure" (in lieu of specifying
narrow standards) implicitly assume that users of pension information
are able to make better decisions once they are Informed of the under
lying actuarial assumptions and which of the several alternative
accounting and reporting approaches is being used. For this to be true,
users must have a sufficient grasp of actuarial methods and terminology
to be able to use the information provided in PERS financial statements.
This grasp of actuarial terminology and methods is particularly
14
important if users wish to compare various pension plans considering (1)
the wide variations in actuarial disclosures found in current reporting
practices [Engstrom, 1984], and (2) the differing benefit-liability
measures used by the NCGA and the FASB.
No empirical evidence has been found to indicate that users can, in
fact, identify the effects of actuarial assumptions on reported data. A
comment by Llvnat [1984]—based on a study of the information content of
reported pension liabilities—summarizes a common perception:
It was empirically found in many [business] studies that the earnings signal possesses information content and that it causes share price revisions. Yet, no comparable body of literature exists for pension disclosures. Furthermore, due to the numerous assumptions that are needed to derive pension liabilities, one may question whether the pension signal is sufficiently reliable, [p. 77]
In an effort to provide evidence regarding the ability of PERS
financial statement users to (1) Interpret reported pension information,
and (2) impound actuarial data, the following general research questions
are addressed:
1. Does the benefit-liability measure (i.e., PTL or PCL) and/or
the amount of supplemental disclosure affect users' perceptions of the
PERS' financial condition?
2. Do users of PERS financial statements understand the effects
that actuarial assumptions have on the reported benefit-liability
measure?
A field experiment was used to gather the necessary data. In the
experiment, each participant was given the financial statements of a
fictitious PERS and asked to (1) answer several questions about the
PERS, and (2) identify the financial statement Information that was
15
believed to be the basis for each response. The research design
utilized to answer the study's first question randomly divided the
sample into three groups and then provided each group with a different
version of the PERS' financial statements. Between group response
differences are considered indicative of an effect attributable to the
financial statement version, thus leading to the conclusion that
judgments about a PERS can be affected by the content of the PERS'
financial reports and the accounting methods used to generate the
reported data.
Each participant was also Instructed to complete two exercises
designed to measure (1) their knowledge of the effects of actuarial
methods and assumptions on reported data, and (2) their ability to
effectively consider these effects when making judgments regarding the
pension's financial condition.
Expected Contributions of the Study
This study should contribute to our understanding of the judgment
process employed by PERS financial statement users when analyzing
reported pension data. In turn, this knowledge should lead to financial
reports that are better able to meet the needs of those making decisions
about various PERS attributes.
The accounting profession cannot control an individual's knowledge
level or consistency, but it can affect the "quality" (i.e., Information
content) of PERS financial statements through the standard setting
process. This study provides empirical evidence about the ability of
pension information users to assimilate information about a PERS'
16
economic condition since current GAAP permits varying (1) benefit-
liability measures and/or disclosure levels, and (2) actuarial
assumptions and cost methods. In particular, the research findings
offer guidance to accounting standards setters by determining:
1. Whether the benefit-liability measure (among those in current
use) used by a PERS for financial reporting affects judgments regarding
its financial condition,
2. Whether the presence or absence in a PERS' financial report of
10-year statistical summaries affects users' (a) perceptions about the
PERS or (b) judgment consensus, and
3. Whether there is any basis for prescribing the actuarial
assumptions to use for PERS financial reporting.
Previous human information processing research in accounting has
been limited to the private sector and has principally relied, for
subjects, on (1) surrogates for financial statement users (usually
deemed to be investors), and (2) auditors. This study extends human
Information processing research techniques to the public sector via
research into the decision making of actual PERS financial statement
users and preparers.
Organization of the Study
The first part of the study briefly examines the authoritative
pronouncements that are relevant to PERS accounting and financial
reporting. Next, a review of the academic and professional studies
pertaining to this study is presented. Using these studies as bases,
the theoretical model that supports current PERS accounting and

17
financial reporting is described and conceptual and empirical support
for an alternative approach is given. The research methodology as well
as the operational hypotheses and variables is then developed. Finally,
the results are presented including the implications and limitations of
the study.
CHAPTER 2
LITERATURE ON PENSION PLAN REPORTING
Literature relevant to this study can be divided into two general
areas: (1) authoritative statements on the topic of pension accounting
and financial reporting, and (2) academic and professional studies. The
authoritative literature review traces the recent evolution of pro
nouncements on public employee retirement system (PERS) accounting and
financial reporting. It is followed by a review of several studies of
users' reactions to pension information.
Authoritative Statements
Little mention of pension accounting and financial reporting
appears in the early authoritative literature. Municipal Accounting and
Auditing [1951] briefly mentions pension accounting in the section
dealing with trust and agency funds, but the discussion is limited to a
comment that:
Pension funds should be set up on an actuarial basis and the reserve should equal the actuarial requirements of the fund at the date of the balance sheet. If the assets in the fund exceed the actuarial requirements the difference represents a surplus; if the actuarial requirements are greater than the assets in the fund, the difference represents a deficit. Surpluses and deficits should be reflected in the accounts and on the balance sheet, [p. 101]
GAAFR68
Governmental Accounting, Auditing, and Financial Reporting
(GAAFR68) [1968], issued by the National Committee on Governmental
Accounting, contains the first substantive discussion of PERS accounting
18
19
and financial reporting in the authoritative literature. GAAFR68 was
recognized as authoritative by the American Institute of Certified
Public Accountants (AICPA) in Audits of State and Local Governmental
Units (ASLGU) [1974] and gained widespread acceptance as the primary
authoritative statement on the application of generally accepted
accounting principles (GAAP) to state and local governments. Until
superseded, GAAFR68 provided the only authoritative guidance on
accounting and reporting for pension plans (as opposed to employer
pension costs) in either the private or public sectors.
Public employee retirement funds are a form of expendable trust
fund, i.e., the funds' principal and Income may be expended in the
course of its designated operations. A pension fund operates by
receiving money from general revenues, contributions, and Interest on
Investments and expending these monies on participant benefits, fund
operations (in some cases, expenditures for PERS operations are made
from the general fund), and refunds to terminated employees.
GAAFR68 required several financial statements for each PERS
(balance sheet, statement of cash receipts and disbursements, statement
of changes in fund balances, and analysis of changes in retirement
reserves). These statements were to be prepared on the "accrual"
(modified accrual) basis with revenues recognized when earned and expen
ditures recognized when current liabilities were incurred. The trust
fund nature of PERS resulted in (1) the absence of an income statement
from the required financial statements, and (2) the emphasis on cash
receipts and disbursements.
20
GAAFR68 recognized the Importance of actuarial valuations and
states:
The National Committee on Governmental Accounting recommends that appropriate reserve accounts be set up on the books [and reported on the balance sheet] to reflect not only compliance with applicable legal requirements and actual amounts set aside pursuant to such requirements for pajment of employee benefits but also the amount of assets which, on the basis of competent actuarial evaluation, should be in the fund if sufficient money is to be available to pay retirement annuities and other benefits to employees when they retire or otherwise become eligible, [p. 77]
Under this recommended approach, periodic adjustment of the accounts to
reflect actuarial requirements results in a credit balance in the Fund
Balance account when the retirement system is "fully funded" and a
deficit when an actuarial deficiency exists. A deficit must be financed
at some future date or retirement commitments cannot be met in full on
schedule.
The existence—and magnitude—of a pension plan's actuarial
deficiency, however, depends upon the various assumptions made by its
actuary. Unfortunately, GAAFR68 provided no guidance regarding
acceptable actuarial techniques (for financial reporting purposes). In
addition, it did not require disclosure of (1) the actuarial cost method
used for financial reporting (or funding) purposes, or (2) the actuarial
assumptions used in the valuation. Thus, financial statement users were
without the information needed to judge the reasonableness of the PERS'
apparent funding status.
NCGAS 1
National Council on Governmental Accounting Statement 1 (NCGAS 1),
"Governmental Accounting and Financial Reporting Principles," was issued
21
to "update, clarify, amplify, and reorder GAAFR" [NCGAS 1, 1979, p. 1].
However, the guidance on PERS accounting and financial reporting found
in NCGAS 1 is limited to (1) a statement that ". . . Pension Trust Funds
are accounted for in essentially the same manner as proprietary funds
[p» 6]," (2) a footnote mentioning "pension plan accounting and report
ing . . . is under study by the FASB [Financial Accounting Standards
Board], the AICPA State and Local Government Accounting Committee, and
the NCGA [p. 27]," and (3) the inclusion of a Pension Trust Fund in the
illustrative financial statements provided in Appendix A to the
statement. Although Appendix A was nonauthoritative, the fact that (1)
it illustrated the GAAFR68 approach to PERS financial reporting, and (2)
"GAAFR restatement" was the objective of NCGAS 1 led many governments to
continue to use the trust fund method of PERS financial reporting.
SFAS 35
In 1980, the FASB completed its study of accounting and reporting
by defined benefit pension plans and Issued Statement of Financial
Accounting Standards No. 35 (SFAS 35), "Accounting and Reporting by
Defined Benefit Pension Plans" [March, 1980]. Its release caused con
troversy in the public sector because—believing all pension plans are
similar and should report similarly—the FASB declared SFAS 35 to be
applicable to state and local government PERS. (Indeed, it is the first
measurement standard issued by the FASB or its predecessors made speci
fically applicable to state and local governmental units.) Public
sector pension accounting leaders generally disagree with several of its
provisions—primarily the provision requiring the reporting of an
22
accumulated plan benefit Instead of a projected plan benefit [e.g.,
Flndley, 1981; and NCGA 6].
NCGAI 4
NCGA Interpretation No. 4 (NCGAI 4), "Accounting and Financial
Reporting for Public Employee Retirement Systems and Pension Trust
Funds" [December, 1981], was Intended to "provide interim authoritative
guidance to the proper application of [NCGA] Statement 1 requirements to
PERS and to supplement Statement 1 guidance for pension trust funds"
[p. 1]. It differed from SFAS 35 primarily by requiring footnote
disclosure of "anticipated Increases in accumulated benefits based on
projected salary Increases from the current period to retirement" [p.
1—emphasis added]. Because of this difference, the effective dates for
state and local governments of SFAS 35 and NCGAI 4 were deferred to
fiscal years ending after June 15, 1983 by Statement of Financial
Accounting Standards No. 59, "Deferral of the Effective Date of Certain
Accounting Requirements for Pension Plans of State and Local Govern
mental Units," [April, 1982] and by NCGA resolution so that the two
standard setting bodies might have time to resolve their differences.
NCGA 6
The NCGA's pension project culminated with the issuance of
Statement 6 (NCGAS 6), "Pension Accounting and Financial Reporting:
Public Employee Retirement Systems and State and Local Government
Employers," [June, 1983]. As did NCGAI 4 (which it supersedes), NCGAS 6
intended to provide guidance not found in NCGAS 1 on pension accounting
and financial reporting.
23
NCGAS 6, like NCGAI 4, required that PERS report the effects of
projected salary Increases on plan benefit obligations. However,
NCGAS 6 changed the format of this reporting from a footnote to
disclosure of the actuarial present value of credited plan benefits^ in
the fund balance section of PERS financial statements. NCGAS 6 also
expanded the information required to be disclosed in the notes to PERS
financial statements. This prescribed disclosure includes (1) a
description of the plan, (2) a description of the actuarial cost method
and assumptions, (3) funding requirement determinations and actual con
tributions, (4) a summary of significant accounting and financial
reporting policies, (5) an explanation of actuarial values and changes,
and (6) Information regarding the PERS' investments. Further, 10-year
historical trend information must be presented to disclose progress in
accumulating assets to pay benefits when due. Appendix A more fully
details the reporting requirements of NCGAS 6 and compares them to those
of SFAS 35.
The significant differences between the respective FASB and NCGA
statements have yet to be resolved. These differences primarily regard
(1) the appropriate benefit-liability measure to use for PERS reporting,
(2) the amount of note disclosure to require, and (3) the accounting
treatment of pension obligations by governmental employers. Accord
ingly, the application dates to state and local government PERS of both
statements have been deferred indefinitely [SFAS 75, 1983; NCGAI 8,
1983].
These are the actuarial values determined under the unit credit actuarial cost method with benefits based on projected salary Increases [NCGAS 6, par. 22].
24
GASBS 1
Statement No. 1 of the Governmental Accounting Standards Board,
"Authoritative Status of NCGA Pronouncements and AICPA Industry Audit
Guide," [July, 1984] (GASBS 1) leaves present GAAP in effect until
". . . altered, amended, supplemented, revoked, or superseded by
subsequent GASB pronouncements [par. 8]." The GASB also states:
Pending issuance by the GASB of a Statement or Statements concerning pension accounting and financial reporting, the following pronouncements are considered by the GASB as sources of acceptable accounting and reporting principles for public employee retirement systems (PERS) and state and local government employers . . . : (a) [NCGAS 1] (b) [NCGAS 6] (c) [SFAS 35] [GASBS 1, par. 9].
Thus, PERS financial statements may be prepared in accordance with
either NCGAS 1, SFAS 35, or NCGAS 6. Note the lack of a definitive
article in the phrase "as sources of," thus implying that pension
accounting and financial reporting may be done in other ways as well.
This situation is likely to continue until at least early 1986—when
Section 5.1 of the GASB's pension project is tentatively scheduled for
completion.
GASB Pension Project Section 5.1: Pension Disclosures
This subproject deals with pension disclosure requirements. On
August 20, 1985, the GASB released an exposure draft, "Disclosure of
Defined Benefit Pension Information for Public Employee Retirement
Systems and State and Local Governmental Employers." This exposure
draft agrees with the NCGA's conclusions—expressed in NCGAS 6—
regarding the primary objectives of PERS financial reports. The expo
sure draft also reaffirms the NCGA's conclusions that these objectives
25
cannot be accomplished with current year financial statements alone.
Accordingly, 10-year dollar and ratio analysis historical trend data are
required to be presented. In addition the proposed Statement:
. . . requires standardized computation and disclosure of a measure of the accrued pension benefit obligation that may differ from that produced by the actuarial funding method used by the PERS to determine employer contribution requirements. The prescribed standardized obligation measure . . . considers both salary progressions and steprate benefits. Disclosures about significant actuarial assumptions and the sensitivity of the standardized obligation measure to changes in interest rate and salary projection assumptions are also required. [GASB Exposure Draft, 1985, summary]
GASB Pension Project Section 5.2: Pension Accounting and Reporting
This subproject covers accounting and reporting issues (other than
disclosure requirements) for PERS and governmental entitles from both
the pension plan and the employer perspectives. Among other things, it
is addressing the areas of difference between NCGAS 6 and SFAS 35, such
as the valuation of marketable securities and the valuation of the
pension benefit obligation. It also is dealing with such Issues as the
display of the pension benefit obligation on the employer balance sheet.
SFAS 87
In December 1985, the FASB issued Statement of Financial Accounting
Standards No. 87 (SFAS 87), "Employers' Accounting for Pensions." This
document represents a major milestone in the decade old FASB pension
project and provides financial statement users with improved information
about enterprises' pension costs and liabilities. This improved infor
mation takes the form of (1) enhanced footnote disclosure of pension
data and (2) the balance sheet recognition of at least a portion of
26
organizations' unfunded pension liabilities. Although SFAS 87 does not
require that 10-year historical trend data be reported, its disclosure
requirements are in many respects similar to those of the GASB's
exposure draft. However, there are two major differences between the
documents: (1) SFAS 87 addresses employer accounting Issues as well as
disclosure matters, and (2) SFAS 87 concerns employer—not PERS—
accounting. SFAS 35 would not be affected by its issuance.
Standard Setting in Perspective
Although the economic significance of pensions has steadily evolved
over the past half-century, pension accounting and reporting practices
remained relatively unchanged until recently. The past decade has
witnessed a considerable debate over PERS accounting and reporting
matters and the Issuance of more than several conflicting pronouncements
on the topic. Both the GASB and the FASB are working toward resolving
these conflicts and providing users of PERS financial reports with
Information that fulfills their needs. However, additional research is
needed in order to identify (1) these needs and (2) the information set
that best meets them. This study provides standards setters with
evidence regarding the ability of PERS financial statement users to
analyze the statements when underlying actuarial assumptions are not
prescribed.
Previous Pension Research
The pension accounting controversy has been accompanied by numerous
articles on the topic. Generally, these articles state the author's
position on the issue and present arguments and anecdotal evidence to
27
support that position. Although interesting reading (and relevant when
considering the politics of standard setting), they present little
empirical evidence that might assist standard setters to objectively
determine an appropriate approach to pension accounting. Several
studies were found, however, that are relevant to pension accounting and
financial reporting. Primarily, this research (1) concerns users'
reactions to reported pension information, or (2) identifies the infor
mation that users claim is necessary to support their decisions.
The Market's Reaction to Pension Disclosures
Llvnat
Research question. Llvnat [1984] addressed the question of whether
unfunded vested benefits and unfunded past service costs possess any
information content. He states that "... a signal is said to possess
information content when it changes the market transactors' beliefs
about the distribution of future returns" [p. 78].
Methodology. Llvnat used a research design similar to that
employed by Gonedes [1978], who tested the information content of earn
ings, extraordinary items, and dividend yields. Llvnat tested whether
the means of the returns were revised (i.e., does the signal have infor
mation content) by grouping the sample into portfolios according to
their realizations of the signals (unfunded vested benefits, unfunded
past service costs, and the earnings signal when supplemented by pension
plan signals) and constructing control portfolios with equivalent
degrees of risk. If market participants have not revised their assess
ment of mean returns upon receipt of the signal, the sample portfolios

28
should have the same expected return as the control portfolio since they
have the same degree of risk.
Findings/conclusions. Llvnat summarizes the results of his tests
as follows:
1. The joint earnings and unfunded vested benefits signal
possesses Information content.
2. The joint earnings and unfunded past service costs signal
possesses less information content than the joint earnings and unfunded
vested benefits signal.
3. The joint unfunded vested benefits and unfunded past service
costs signal does not possess information content.
4. Although the earnings signal possesses information content,
the unfunded vested benefits and the unfunded past service costs signals
make the earnings signal more informative, [p. 86]
Relevance to current study. Although Livnat's study was concerned
with employer pension reporting, his findings are relevant to this
study. Llvnat found that the amount reported as unfunded prior service
costs served as an information signal (albeit a weak signal) in the
presence of the earnings signal. Yet, this amount appears to possess
little real information content. The FASB commented that, "the amount
of past service costs can vary considerably or be non-existent depending
on the actuarial cost method selected without any differences in other
facts or circumstances" [SFAS 36, par. 2, emphasis added]. Accordingly,
users must know what actuarial cost method was used if reported unfunded
prior service costs (which may be zero) are to be meaningful. At the
time of Livnat's study, no disclosure was required of the actuarial cost
29
method used. Thus, doubt is cast on the ability of financial statement
users to Interpret the pension signal.
Unfunded vested benefits is reported by Llvnat to be a better
signal than unfunded prior service costs; however, the amount reported
as unfunded vested benefits depends upon which of a variety of actuarial
assumptions are used. Of these assumptions, the interest rate assump
tion is most critical. Webster [1984] notes that seemingly minor (i.e.,
1%) changes in the rate of return assumption result in large differences
in the reported unfunded actuarial accrued liability (of which unfunded
vested benefits is a major component). Further, studies indicate that a
wide range of interest rates are used in practice [Nichols and Morris,
1982; Tierney and Calder, 1985]. Although published in 1984, Livnat's
study covered the pre-1979 period—prior to any promulgation requiring
disclosure of actuarial interest rates. Accordingly, financial state
ment users appear to be basing decisions on a pension signal that could
be considered unreliable in the absence of disclosed actuarial
assumptions.
Daley
Research question. Daley [1984] studied the relationship between
several accounting measures of the cost of defined benefit pension plans
for sponsoring firms and the market value of their equity securities.
The measures considered were (1) unfunded vested benefits, (2) unfunded
prior service costs, (3) pension expense (which serves as an annualized
estimate of future cash flows associated with the pension benefit obli
gation), and (4) the actuarial assumption about Interest rates. He
attempted to determine whether, and to what extent, any of these
30
measures of pension cost are consistent with the value of the pension
cash flow Impounded within equity security prices.
Methodology. Daley used a cross-sectional equity valuation model
to analyze earnings before extraordinary items and total assets (from
the Compustat Annual Industrial File 1961-79) and monthly stock returns
and share prices (on the CRSP return file 1971-79). Actuarial interest
rate data came from Department of Labor filings, FASB's SFAS 36 data
tape. Form lOKs, and annual reports. The sample consisted of the 153
firms for which complete data were available for the years noted. Of
these firms, actuarial interest rate data were available for only 128;
thus, interest rate tests were performed on this subsample.
Findings/conclusions. Daley found that (1) the pension expense is
the "most consistent" measure of the equity market's aggregate pension
cost measure, and (2) cross-sectional differences in actuarially
selected discount rates are not used by the equity markets in evaluating
data on pension costs.
Relevance to current study. The reported pension expense—which
(1) Daley reports as being the "most consistent" measure of aggregate
pension costs, and (2) is a component of reported earnings—depends in
any given year on the actuarial cost method used. Schlpper and Well
[1982] note that:
A nonrandom sample of actuaries have Indicated that actuarial cost methods are chosen to suit the employer's wishes in some regards. One actuary offered a choice of patterns—one with smooth, relatively equal patterns of funding payments independent of earnings and another with smaller payments in years when the income was low and with larger payments in years when Income was high. [p. 816]

31
These observations are significant because financial statement
users (1) appear to be using pension data in an Inconsistent manner
(i.e., reported pension expense may not be a very consistent measure of
aggregate pension cost), and (2) seem to be making decisions about
economic phenomena based on reported pension data when, due to varia
tions in assumptions and actuarial cost methods, the reported data can
vary significantly without any differences in other facts or
circumstances, or vice versa. Again, doubt is cast on the ability of
financial statement users to properly Interpret the pension signal.
PERS Research
Van Daniker and Aldrldge
Research question. Van Daniker and Aldrldge (V&A) [1985] conducted
a study—authorized by the NCGA—to provide empirical data that can be
used in the development of financial reporting requirements for PERS.
V&A assert that a major reason for the controversy over PERS financial
reporting requirements is the difference of opinion as to the users of
PERS financial information and the needs of those users for information.
Accordingly, they attempted to ". . . first, identify some of the users
of PERS financial information; and second, determine the informational
needs of those Identified as users" [p. 14].
Methodology. Data were gathered via a questionnaire that was sent
to plan participants, plan administrators, and legislative/oversight
officials. Reliability tests were performed to determine the accuracy
of the questionnaire used in the study. A mean response and standard
deviation were determined for each question, by individual group and in
32
the aggregate, and were used to test for significant differences between
the groups' responses to each question.
Findings/conclusions. V&A determined that (1) plan participants,
(2) PERS administrators, and (3) legislative/oversight officials are
users of PERS financial Information. (Since PERS data are included in
the comprehensive annual financial report (CAFR) of the sponsoring
governmental employer, users of the CAFR can also be considered to be
users of PERS Information.)
The study found that not all user groups profess the same informa
tional needs. Plan participants are primarily Interested in assessing
the amount of future benefits and the risk associated with future bene
fits. PERS administrators and legislative/oversight officials—while
interested in the amount of future benefits—appear more interested in
information useful for assessing (1) the performance of plan administra
tors and (2) the need for future contributions. All three user groups
indicated a preference for plan reporting based on the same actuarial
method as used for plan funding. The user groups also requested disclo
sure of the actuarial assumptions used in the benefit determination and
disclosure of the actuarial cost method used to determine plan funding.
Relevance to current study. The V&A study makes a valuable contri
bution to this research. The study empirically identifies some of the
users of PERS financial statements and lists the financial information
items that these users state they need to make decisions about the PERS.
The current study draws its sample from among the user groups
identified by V&A, and their findings are the basis for this study's
questionnaire. However, the V&A study leads to the need for, and rele-
33
vance of, the current study. As noted by Abdel-khalik and Keller
[1979]:
The Inability to transfer conceptual knowledge about accounting changes to understanding as to the economic Impact on a firm Implies that questionnaires requesting users to specify information needs for decision making are not likely to be very productive, [p. 52]
This comment is reinforced by several studies of Individuals' judgments
which concluded that individuals typically overestimate (1) the amount
of information, and (2) the relative importance of information items
that actually serve as the basis for a decision [e.g., Ashton, 1974b;
Hofstedt and Hughes, 1977; Joyce, 1976]. Accordingly, it may be inap
propriate to rely on "self-reported" research findings such as those of
Van Daniker and Aldrldge. The current study seeks to determine whether
users of PERS financial information can assimilate the information they
requested when making decisions about a PERS' economic condition.
Engstrom
Research question. Engstrom [1984] studied the pension disclosure
practices of municipalities located in the United States in order to
". . . determine the extent of compliance with authoritative pronounce
ments for both employer and pension funds" [p. 198].
Methodology. Engstrom requested a Comprehensive Annual Financial
Report from each of the 180 cities that had Municipal Finance Officers
Association Certificates of Conformance as of September 1, 1980. The
116 reports that Engstrom received were analyzed and the following data
presented in tabular form: (1) various employee groups covered, (2)
types of pension plans reported, (3) reported unfunded pension liability
per capita, (4) reported unfunded pension liability/general fund assets,
34
(5) reported pension cost per capita, (6) disclosures of accounting and
funding status, and (7) method of reflecting the unfunded liability.
Findings/conclusions. Engstrom found that the cities he studied
made widely varying pension disclosures. For example, some reported
total unfunded liabilities, others reported vested liabilities, and
still others did not disclose whether or not a liability existed. His
frustration about the state of employer pension reporting is summed up
by his statement that, "a further limitation [of the study] is the
inability to extract Information from reports with such widely varying
pension disclosures" [p. 210].
Relevance to current study. Employer pension reporting is
generally reflective of PERS reporting since the latter serves as the
basis for the former. Accordingly, Engstrom's finding of considerable
variation in employer reporting indicates that considerable variation in
PERS reporting is likely. This variation poses a threat to financial
statement users wishing to make between PERS comparisons if, as Engstrom
notes, "financial analysts and others would have difficulty extracting
comparable pension information from the financial reports of U.S.
cities" [p. 210].
Summary
This chapter first discussed the evolution of authoritative state
ments on the topic of pension accounting and financial reporting. The
controversial nature of the subject is evident in (1) the pension
pronouncements Issued by the NCGA and the FASB (and their predecessor
35
organizations), and (2) the two pension projects placed on the GASB's
initial agenda.
Not only are pension accounting and reporting practices in ques
tion, but studies by Llvnat [1984] and Daley [1984] raise doubts about
the ability of PERS financial statement users to adequately evaluate the
pension data that are currently reported. The following chapter (1)
discusses the theoretical support for current pension accounting prac
tices, and (2) presents the results of research that—in conflict with
current practice—supports the findings of both Llvnat and Daley.
CHAPTER 3
FULL DISCLOSURE VS. FUNCTIONAL FIXATION
The theory that supports public employee retirement system (PERS)
financial reporting practices has yet to be clearly identified. State
ment of Financial Accounting Concepts No. 4 (SFAC 4), "Objectives of
Financial Reporting by Nonbusiness Organizations," established the
objectives of general purpose external financial reporting by
nonbusiness organizations. The Financial Accounting Standards Board
(FASB) stated that these objectives
together with the objectives set forth in FASB Concepts Statement No. 1, "Objectives of Financial Reporting by Business Enterprises," will serve as the foundation of the conceptual framework the [FASB] is developing for financial accounting and reporting. Based on its review of the similarities and differences between those two sets of objectives, the [FASB] has concluded that it is not necessary to develop an Independent conceptual framework for any particular category of entitles. [SFAC 4, 1980, par. 1]
Thus, PERS and other organizations share the same generalized conceptual
framework for accounting and financial reporting and have developed
similar reporting standards. However, some question exists as to
whether the pension Information produced in accordance with these
standards adequately meets the financial reporting objectives set forth
in the conceptual framework.
Llvnat [1984] and Daley [1984] found evidence which indicates that
the users of general purpose financial statements have difficulty inter
preting reported pension data. Their findings suggest either (1) that
the generalized conceptual framework developed for nonbusiness account
ing and financial reporting is Inappropriate for PERS use, or (2) that
36
37
PERS are unique entities that depend upon complex funding and actuarial
constructs; consequently, accounting and reporting practices developed
primarily for other categories of entities are not appropriate for PERS'
utilization. The latter alternative postulates—as does this study—
that the same conceptual framework is suitable for both PERS and other
nonbusiness entities. Thus, any financial reporting Inadequacies are
due to inappropriate reporting standards rather than to the objectives
of financial reporting.
This chapter discusses two hypotheses that have been widely tested
in the context of business financial reporting. First, the efficient
market hypothesis is discussed since it appears that current PERS
accounting and reporting standards are predicated on its implications.
Next, the phenomenon of functional fixation is considered since it seems
to offer a plausible explanation for the findings of both Llvnat and
Daley. The discourse considers the capacity of each hypothesis to
serve as a theory regarding how financial statement users process PERS
information. Knowledge of how this information is processed will assist
accounting standards setters to achieve the reporting objectives set
forth in the conceptual framework.
Support for "Full Disclosure"
The efficient market hypothesis [EMH] has important implications
for accounting practice [Deitrlck and Harrison, 1984]. As Ketz and
Wyatt [1983] note, "since the evidence for stock market efficiency seems
abundant, some accountants have argued that controversial topics should
be adjudicated in terms of efficient market theory" [p. 29]. The term

38
"efficient" refers to the way that security prices reflect information—
in an efficient market, security prices react as if they fully and
rapidly incorporate all existing information in an unbiased fashion.
Three forms of the EMH have been delineated:
1. The "weak form" of market efficiency implies that a security's
price at a particular time impounds the information contained in its
sequence of past prices.
2. The "semistrong form" holds that a security price fully
reflects all publicly available information.
3. The "strong form" asserts that all Information—including
information that is not publicly available, i.e., inside information—is
reflected in a security's price.
The EMH presumes that, in the aggregate, users of accounting
information (the securities markets) are (1) rational, and (2) able to
properly interpret accounting signals (and other information), thus
allocating resources to those entities providing the best rate of return
for a given level of risk. In other words, accounting information
serves as evidence regarding underlying economic phenomena.
Beaver [1973] states that EMH research has "several important
implications for accounting in general and for the FASB in particular"
[p. 52]. Although directed at the private sector, his "four major
Implications" of the EMH for the accounting profession are also appli
cable to the public sector. Accordingly, as summarized below, they have
been adapted. They are:
1. Many reporting issues are capable of a simple disclosure
solution and do not warrant an expenditure of standards setters time and
39
resources in attempting to resolve them.
2. The role of accounting data is to prevent superior returns
accruing from inside information and can be achieved by a policy of much
fuller disclosure than is currently required.
3. Financial statements should not be reduced to the level of
understanding of the naive Investor.
4. Standards setters should strive for policies that will
eliminate excessive costs of information.
Here, these implications are relevant in the context of pension
accounting. The objective of the following discussion is to demonstrate
that PERS reporting—as permitted by GASB Statement 1 (GASBS 1) and
proposed in the August 20, 1985 exposure draft, "Disclosure of Defined
Benefit Pension Information for Public Employee Retirement Systems and
State and Local Governmental Employers,"—is based on the presumed
validity of the EMH and its applicability to PERS accounting and finan
cial reporting.
Implications of the EMH for PERS Accounting
Accounting Alternatives
Beaver's first point is based on the assertion that many reporting
issues Involve alternatives, any of which can be adopted with essen
tially no difference in cost to the government. Further, these issues
are characterized as requiring essentially no cost to statement users in
adjusting from one method to another. In such cases, Beaver suggests a
"simple solution: report one method, with sufficient footnote disclo
sure to permit adjustment to the other" [p. 52]. This appears to be the
approach taken by the GASB. Although GASBS 1 does not require
40
disclosure of which pronouncement served as the basis for a PERS'
financial statements, differences in statement format, measurement
basis, and disclosure levels make apparent which standard was applied.
Further, it seems reasonable to presume that the enhanced disclosures
called for in the GASB's exposure draft are supposed to facilitate
comparisons of plans when different assumptions are used (since—under
the exposure draft—the actuarial cost method used for reporting has
been prescribed).
Disclosure Levels
The second implication of the EMH for accounting standards setters
applies when the "semi-strong form" of the EMH is valid—as is widely
held to be the case [Dyckman, Downes, and Magee, 1975]. As Beaver
notes, "merely because prices reflect publicly available information in
no way implies that they also fully reflect inside information" [p. 53].
Inside information has been perceived as a problem for persons inter
ested in the "real" cost of PERS. The conventional wisdom maintains
that an underfunded PERS results in intergenerational wealth transfers,
reduced savings, and future fiscal stress for the sponsoring government.
This view implies that taxpayers and employees are not fully aware of
deferred labor costs [Copeland and Wilson, 1985]. Some place part of
the blame for this "unawareness" on pension accounting practices [Mautz,
1981].
A government's annual pension contribution is normally determined
on the basis of a fixed percentage of total payroll or a fixed
percentage of projected benefits plus an amount sufficient to amortize
any unfunded pension liability [Wlnklevoss and McGlll, 1979]. But as
41
Copeland and Wilson observe, "especially for locally administered plans,
valuation of plan benefits, amortization period for the unfunded
liability, and timing of contributions may be subject to considerable
manipulation" [p. 5].
Beaver recommends that much fuller disclosure be required when
inside information is being used to secure "abnormal returns" for
Insiders (in this case, those responsible for establishing PERS bene
fits, funding policies, and accounting policies). The GASB's response
to this perceived problem has been to propose disclosure levels that are
greatly in excess of those currently found in typical PERS reports
[Engstrom, 1984].
Users' Knowledge Level
The EMH's third Implication for accounting standards setters
relates to the "traditional concern for the naive investor." Beaver
states, "we must stop acting as if all—or even most—individual inves
tors are literally involved in the process of interpreting the impact of
accounting information upon the security prices of firms" [p. 53]. In
the case of pension reporting, the role of the "naive investor" is
assumed by employees—and Indirectly, taxpayers. Unlike the naive
investor in securities, these two groups do not have the opportunity to
diversify. Thus, their eventual welfare is negotiated by plan
administrators and elected officials.
The GASB appears to have concurred with Beaver's conclusion. Para
graph 6 of the exposure draft states:
After considering the needs of users and related reporting objectives, the GASB has concluded that the primary objectives of pension disclosures are to provide persons
42
familiar with financial matters with information needed to assess (a) the funding status of a PERS on a going-concern basis, (b) progress made in accumulating assets to pay benefits when due, and (c) whether employers are making actuarially determined contributions to plans [emphasis added].
The meaning of the phrase "persons familiar with financial matters" is
not clear but does appear to rule out the "typical" PERS participant.
The level of required actuarial disclosure lends credence to this inter
pretation.
Information Costs
The final implication of the EMH pertains to the cost of infor
mation. There is considerable evidence that the EMH adequately
describes the workings of equity securities markets. These markets
react to all publicly available information, of which accounting data
are but a small portion. Given this plethora of data, it is unneces
sarily costly for organizations to act as if their financial reports
constitute the only source of Information about the organization.
Pension financial reports, on the other hand, may constitute the major
source of information about the PERS and its financial condition. If
so, the GASB's position of requiring more, rather than less information
to be disclosed is quite reasonable. In the case of pension reporting,
"underdisclosure" will lead to excessive Information costs since (1)
those Interested in a PERS are forced to obtain their own information—
which is not obtained without cost, or (2) the allocation of resources
in the economy will be suboptlmal.
The preceding discussion has focused on the parallels between
Beaver's EMH implications and the GASB's approach to PERS reporting.
43
However, evidence provided by Llvnat [1984] and Daley [1984]—which
raises questions about the ability of financial statement users to
properly Interpret the pension signal—fosters doubts about the
appropriateness of this theory for pension disclosures.
Does the EMH Apply to PERS?
The efficient market literature maintains that among alternative
methods of accounting or reporting, any are satisfactory to the market
so long as complete disclosure is made of the method used. To be
logically valid for pension reporting, a critical assertion must be
supported: the pension benefit "market" should be efficient; however,
certain market characteristics evoke questions concerning the ability of
this market to be efficient.
Unlike equity markets, the pension benefit market handles few
transactions involving "trades" of benefits. For example, suppose that
employees are given the option of PERS membership or having a contri
bution—equal in amount to the cost of their PERS membership—made to
their Individual retirement accounts. The pension market thus estab
lished permits an analysis of the perceived condition, management, etc.
of the PERS by examining the percentage of employees who opt for PERS
membership. Unfortunately, employees are seldom permitted to change
their plan memberships, and plan membership is usually mandatory thus
precluding any market evaluation of each PERS' perceived condition.
Relatively little information about a PERS may be publicly avail
able. In addition to the annual report. Investors in equity markets
typically have access to a variety of Information that is relevant to
44
their decisions, whereas the annual report is often the only PERS data
available to plan members and other Interested parties.
Adding to the difference between the equity and pension markets,
the latter is characterized by a lack of liquidity. PERS members cannot
withdraw "their" funds at anytime that they so chose. Accordingly,
research findings of market efficiency—based on analyses of equity
markets—are not generallzable to the market for PERS information.
Further, some evidence exists that explains why individuals may
not be able to effectively utilize PERS data. The following sections
summarize some of the research that partially questions the "general-
izablllty" to PERS financial statement users of EMH research.
Support for "Functional Fixation"
Although there is a large body of evidence supportive of the infor
mational efficiency of the securities markets in the semi-strong form,
there is also some evidence questioning the EMH. The results of several
of these studies may be applicable to PERS accounting and financial
reporting.
Harrison
Research Question
Harrison [1977] examined the information content of discretionary
and non-discretionary accounting changes in conjunction with their
Impact on net Income. The theory is that discretionary changes are
unexpected—hence a different managerial signaling (motivation) should
be ascribed to them.
45
Methodology
To test his theory, Harrison used four experimental portfolios.
Each portfolio consisted of stocks that were pair-matched with stocks of
firms that had not changed accounting methods. The firms were pair-
matched for (1) industry membership, and (2) level of systematic risk.
Findings/Conclusions
Harrison's results can be summarized as follows:
1. Stocks of firms with accounting changes that increase income
have mean rates of return significantly different (at alpha = .05) than
the control group.
2. The tests of discretionary and non-discretionary accounting
changes that reduced net income both produced insignificant F-values;
however, the small sample sizes in these two tests render any
Interpretation of these results tenuous.
3. The test results indicate that both discretionary and
non-discretionary accounting changes that Increase net income are
associated with concurrent and unique stock market behavior. The
negative return differences for discretionary changes, however,
contrasted with the positive return differences for non-discretionary
changes, suggest that the discretion available to management in making
the accounting changes possesses Information content.
4. Although the difference level varied with risk level, the
general direction of variance was not altered.
46
Relevance to Current Study
The point of Interest here is that the market reacted to positive
changes in net income when virtually all of the accounting changes
utilized in Harrison's study have no substantive economic effects. In
other words, there appears to be a significant market reaction to
cosmetic accounting changes. This finding has implications for PERS
accounting and reporting.
Current pension GAAP permits several accounting and reporting
alternatives and allows the use of a wide range of actuarial assump
tions. This reporting and actuarial assumption flexibility permits two
PERS having employee groups of equal age and service distribution and
Identical benefit provisions to appear considerably different in their
respective financial statements. If Harrison's findings were general
lzable, then PERS financial statement users will react to these apparent
differences when in fact no difference in economic substance exists.
Abdel-khalik and Keller
Research Question
Abdel-khalik and Keller [1979] studied the phenomenon of functional
fixation, which
. . . suggests that a fixated decision maker attributes a particular semantic content to a number or a process (an information cue) in such a way that he or she would become unable to adapt his or her understanding of the meaning of the number in response to changes in the underlying structure or process which is generating the number, [p. 49]
Functional fixation serves as one explanation for why users receive an
Incorrect signal from an information item even when the item is
correctly coded (i.e., in accordance with GAAP). Functional fixation
47
also renders users unlikely to readily adapt to changes in the method of
Indicator measurement.
Methodology
To test the hypothesis of functional fixation, Abdel-khalik and
Keller designed an experiment with the following characteristics:
1. The decision maker was to provide subjective probability
distributions of expected security prices and to select a portfolio from
among six stocks (two firms were identical) in such a way that expected
rate of return would be maximized.
2. The experiment required sequential decisions and choices over
a series of Information sets. Each set consisted of financial state
ments for the six firms for three successive accounting periods. The
design featured within subject control and within firm control. Thus,
decisions made by a single decision maker at each point in the experi
ment could be compared in order to reduce (or eliminate) differences in
decision models and rules, and decisions regarding identical firms
(except for the measurement rule used to calculate cost of goods sold)
could be compared.
3. The information variables of interest were reported earnings
numbers and cash flows—as impacted by the changes in the accounting
method of valuing inventory. For year one, all six firms were under
FIFO; for year two, one of the two identical firms switched to LIFO
while the other remained on FIFO; in the third Information set (also for
year two), three other firms were on LIFO. Thus, the same decision
maker judged a firm against Itself in the same Information set and over
information sets.
48
4. Using only valid responses (in a post-experiment test, the
analysts indicated an understanding of the impact of switching to LIFO
on reported earnings and cash flows) the results consistently show that
(1) the firm that switched to LIFO was valued lower (or the same) as its
twin firm that continued to use FIFO, and (2) a firm was valued lower
(or the same) when it switched to LIFO in a subsequent period.
Findings/Conclusions
Abdel-khalik and Keller believe the results of their study provide
conflicting evidence. They state that:
. . . decision makers employed in this study have shown that they understand the effect on reported earnings, taxes and cash flows of changing the Inventory method to LIFO. Yet, they judged the expected return from investing in the stock of the firms that switched to LIFO lower than (or the same as) that (1) from Investing in stocks of identical firms that had not changed the method of valuing inventories and (2) from the same firm before changing to LIFO. [p. 50]
These results support the posited hypothesis of functional fixation
since subjects (1) indicated that they understood the favorable impact
of LIFO on cash flows, and taxes, (2) stated that the accounting change
was one of the three variables they had considered to be most important
in forming their expectations, and (3) made judgments consistent with a
fixation primarily on reported earnings.
Relevance to Current Study
Abdel-khalik and Keller draw inferences from their research that
are relevant to this study. They state:
Accountants will probably be unsuccessful in devising ways of communicating the impact of accounting changes on economic activity without an improved understanding of how users Jjn fact assimilate and utilize accounting numbers in judgment
49
formation. This conclusion implies a need for accountants to engage in or to develop a better understanding of research related to the behavior of individuals in the decision making process, [p. 52 ]
A parallel can be drawn between the subjects in the Abdel-khalik
and Keller study and the users of PERS financial statements. Both
groups base decisions about economic phenomena on financial information,
and the financial information reported in both cases may vary because
alternate measurement rules are employed or because underlying assump
tions differ. This highlights the Importance of this parallel research
question: If knowledgeable users of business financial statements are
unable to correctly Interpret the accounting slgnal(s) conveyed by an
accounting change when they fully understand (1) that a change has
occurred, and (2) the beneficial effects of such changes, is it reason
able to asstmie that PERS financial statement users can correctly
interpret the signal conveyed by disclosed actuarial information? This
question assumes added significance since no empirical evidence was
found that indicates whether PERS financial statement users fully under
stand the various benefit-liability measures in use and the effects of
various actuarial assumptions on reported PERS data.
Theoretical Model of PERS Accounting
Van Daniker and Aldrldge [1985] Identified the principal informa
tion needs of two PERS financial statement user groups: (1) plan
participants are primarily concerned with the probability that they will
receive benefit payments when they retire, and (2) plan administrators
and legislative/oversight officials are mainly Interested in assessing
the adequacy of plan funding and in drawing conclusions about the
50
financial soundness of the plan. These information needs relate to
primarily the PERS' funding level. Thus, a major judgment of PERS
financial statement users' should be an assessment of the plan's funding
level.
Each PERS' funding level is embodied in its assets available
relative to its obligation for benefits. Consequently, it is likely
that PERS financial statement users rely on this ratio when making
judgments about the plan's funding status. Figure 2 illustrates a
theoretical model for this judgmental process and depicts the relation
ships that affect the funding level signal that is provided to the
decision maker. If this signal is to be properly Interpreted, the
decision maker must understand the factors that affect the signal, which
Include (1) the assumptions made by the plan's actuary, (2) the
actuary's model, (3) the accounting policies adopted by the plan, and
(4) the plan's reporting policies.
Actuarial Assumptions
Some data appearing in any pension plan's financial report is
dependent upon the actuarial assumptions and/or cost method used in
its preparation; accordingly, their effects must be understood if the
financial report user is to make an informed assessment of the plan's
condition. Further, the financial report user needs some knowledge
of pension funding concepts to analyze the sensitivity of reported
PERS data to changes in these actuarial assumptions and cost methods.
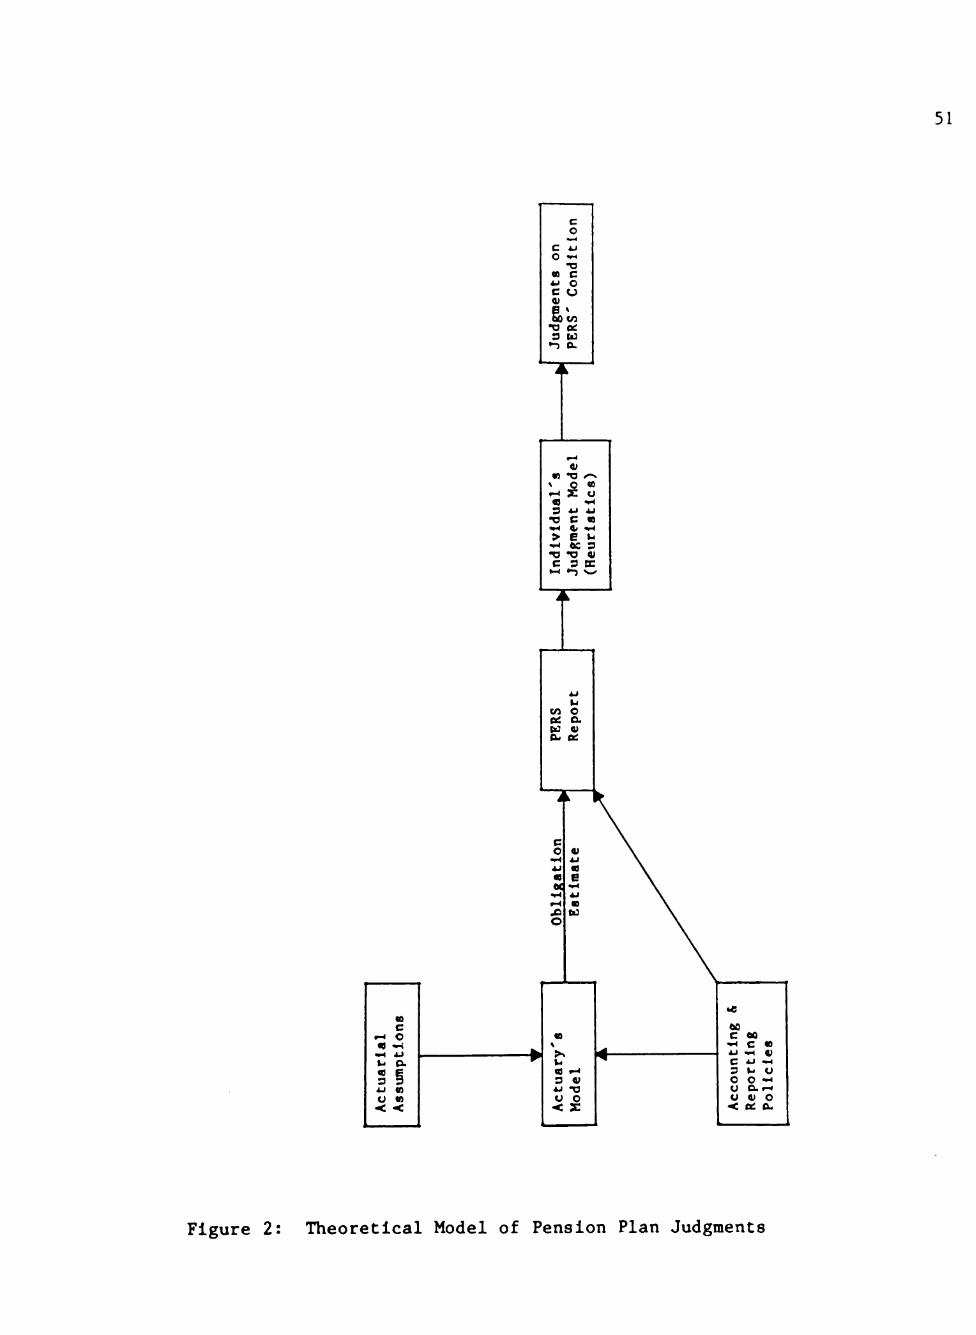
51
c o •v.^
C 4J O -n
t 3 « C *-» o c o 0)
& C 0 •o OC 9 U •n a.
Ind
ivid
ua
l's
Judf
^men
t M
odel
(H
euri
stic
s)
4-1
u M O a a Ii3 V ^ a:
c o • H 4J
« M
• H «H .C o
w c
. H O •9 *^
« E s 5 i J 0)
u « < <
' \ \
« \ 4J \
« \ B \ " \ 4J \
• \ w \
\
«
u 9 .H 3 « *J T3 t ) O < s
^
.« 60 C 00 ^ c « C 4-1 - H 3 ki U O O "H U O. <-i U V o < a: d.
Figure 2: Theoretical Model of Pension Plan Judgments
52
Actuary's Model
Several funding methods may be used to advance-fund pension obliga
tions. Each funding method, however, has its own asset target and cost
pattern. The asset target is the level to which plan assets will
eventually accumulate (if they are not already at this value) and should
be equal to the financial obligation for the accrued benefits of both
active and nonactive plan members. Thus, the "asset target" is actually
a measure of the plan's liability to participants. The following peda
gogical formula illustrates the asset target calculation for a plan that
provides only a retirement benefit at age 65:
AT = B X PS X IR X AF , where
AT = asset target
B = benefits allocated to date
PS = Probability of surviving in employment to age 65
IR = interest discount from current age to age 65
AF = annuity factor at age 65 for $1 payable annually for life
The amount reported as benefits allocated to date (B) depends upon
the actuarial cost method selected and the assumed rate of salary in
crease. Figure 3 Illustrates the asset target for a hypothetical PERS
under the actuarial cost methods required for reporting purposes by the
FASB and the NCGA, that is, respectively, the accumu 1 ated-plan-benefit-
method (APBM) and the level-dollar-benefit-method (LDBM). Benefits
allocated to date are determined under these cost methods as follows (it
is assumed that plan benefits are based on the pensioner's average
salary for some specified number of years prior to retirement):

53
Asset Targets Under Alternative Fundings Methods as a Percentage of the Asset Target at Age 65
100
Age
Asset Targets for Hypothetical Plan During 50-year Period Under Various Funding Methods
Years
LDBM: Level-dollar-beneflt-method APBM: Accumulated-plan-benefit-method
Source: Wlnklevoss [1977]
Figure 3: Hypothetical PERS Illustrative Asset Targets
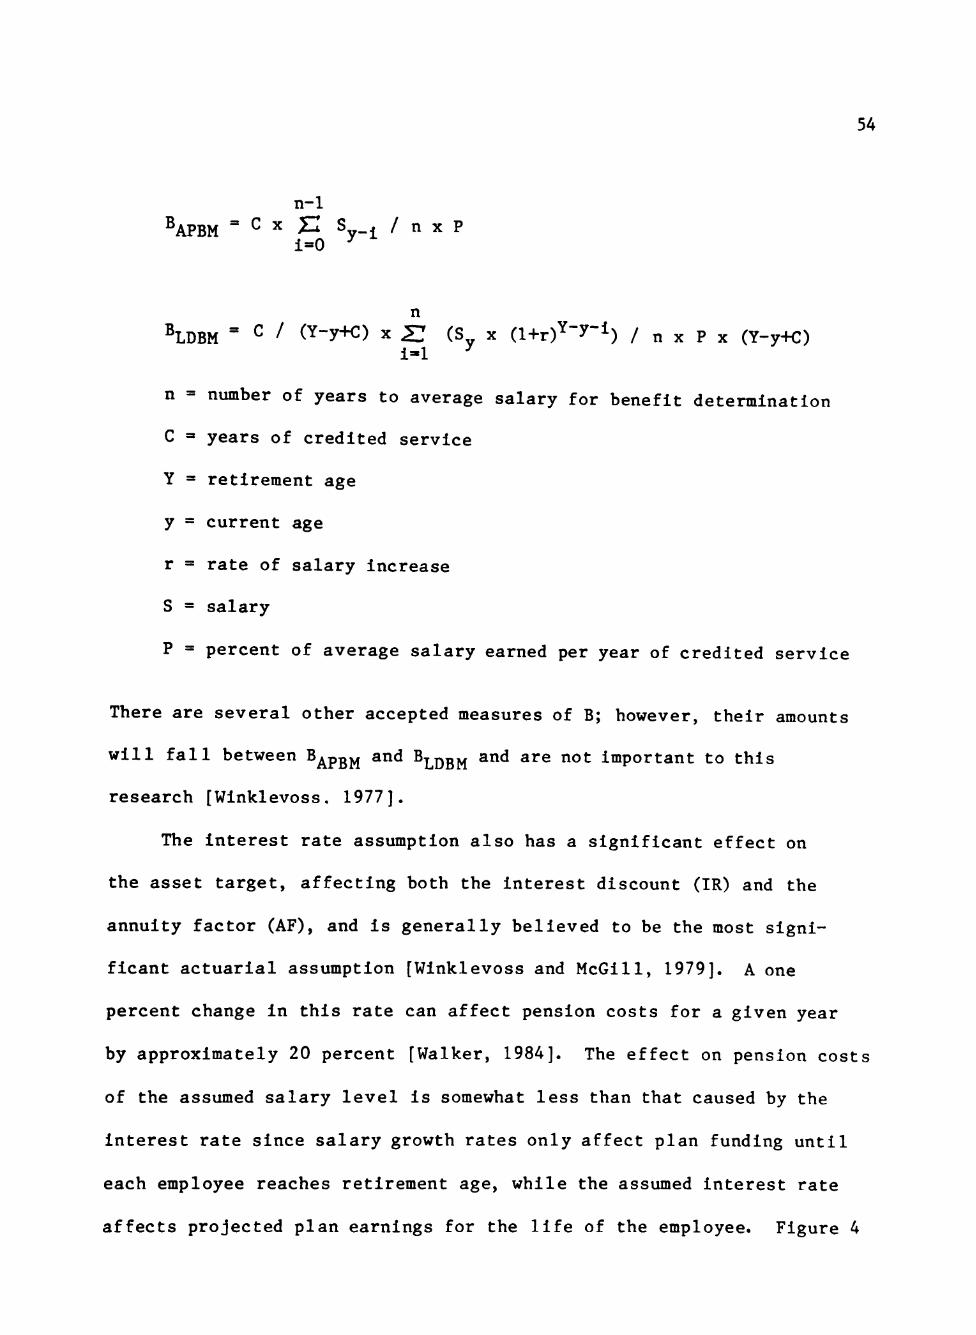
54
n-1 ^APBM = C X ^ S ^ / n X P
1=0
n ^LDBM ' C / (Y-y+C) X (S X (l+r)^-^-^) / n x P x (Y-y+C)
i=-l
n = number of years to average salary for benefit determination
C = years of credited service
Y = retirement age
y = current age
r = rate of salary increase
S = salary
P = percent of average salary earned per year of credited service
There are several other accepted measures of B; however, their amounts
will fall between B^pgj^ and B-j gj and are not Important to this
research [Wlnklevoss, 1977].
The interest rate assumption also has a significant effect on
the asset target, affecting both the Interest discount (IR) and the
annuity factor (AF), and is generally believed to be the most signi
ficant actuarial assumption [Wlnklevoss and McGlll, 1979]. A one
percent change in this rate can affect pension costs for a given year
by approximately 20 percent [Walker, 1984]. The effect on pension costs
of the assumed salary level is somewhat less than that caused by the
interest rate since salary growth rates only affect plan funding until
each employee reaches retirement age, while the assumed Interest rate
affects projected plan earnings for the life of the employee. Figure 4
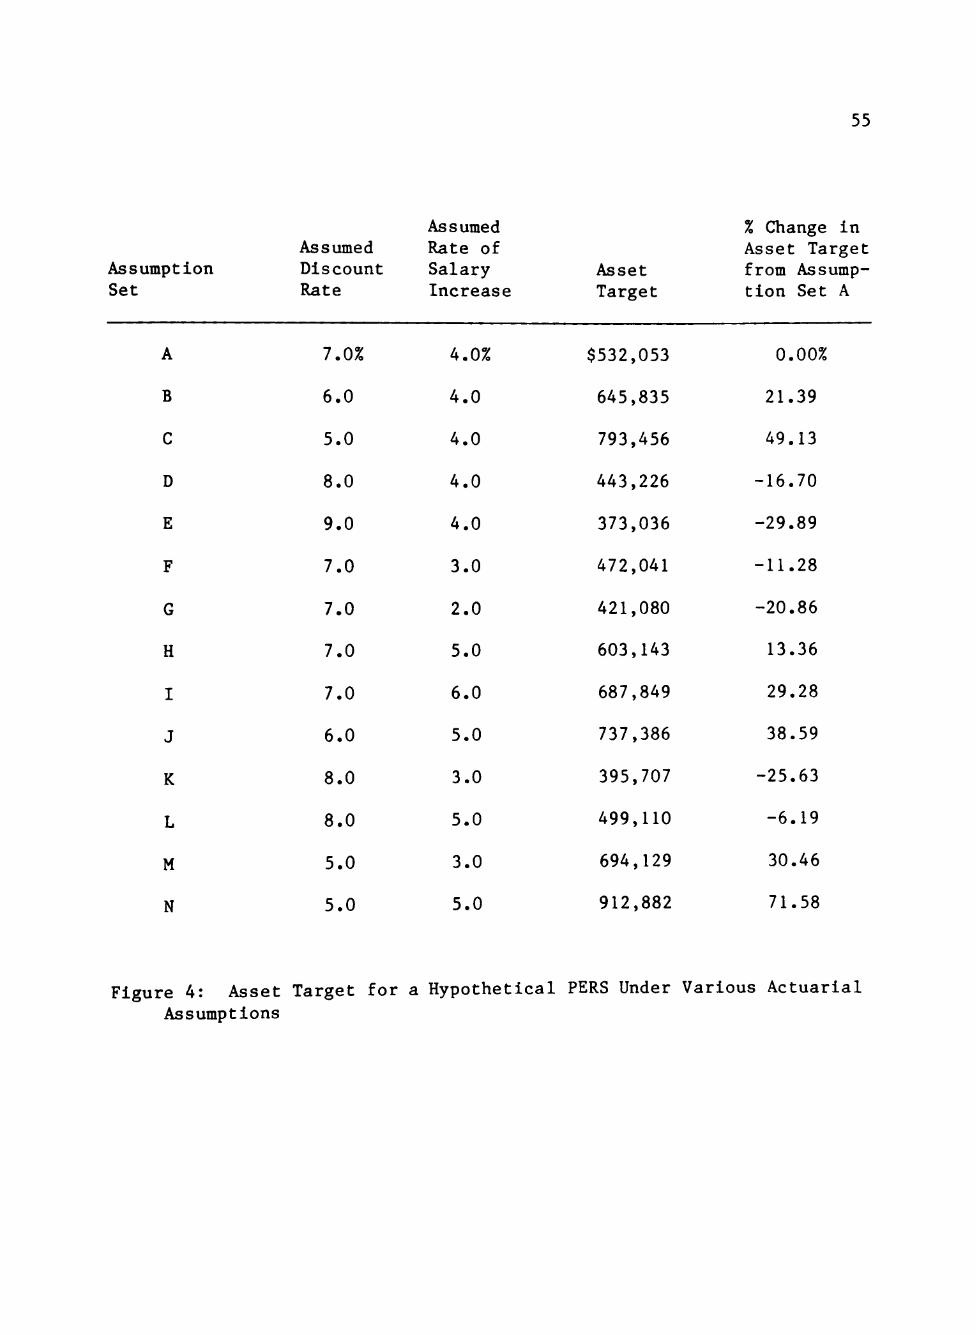
55
Assumption Set
A
B
C
D
E
F
G
H
I
J
K
L
M
N
Assumed Discount Rate
7.0%
6.0
5.0
8.0
9.0
7.0
7.0
7.0
7.0
6.0
8.0
8.0
5.0
5.0
Assumed Rate of Salary Increase
4.0%
4.0
4.0
4.0
4.0
3.0
2.0
5.0
6.0
5.0
3.0
5.0
3.0
5.0
Asset Target
$532,053
645,835
793,456
443,226
373,036
472,041
421,080
603,143
687,849
737,386
395,707
499,110
694,129
912,882
% Change in Asset Target from Assumption Set A
0.00%
21.39
49.13
-16.70
-29.89
-11.28
-20.86
13.36
29.28
38.59
-25.63
-6.19
30.46
71.58
Figure 4: Asset Target for a Hypothetical PERS Under Various Actuarial Assumptions
56
shows the effects—at the time of plan Inception—of various discount
rate and salary increase assumptions on the asset target of a hypothet
ical PERS. The PERS was assumed to have 50 members and was patterned
after an actual PERS (i.e., using the same employee age and service
distributions).
Several actuarial assumptions affect the asset target besides
the Interest and salary rate assumptions. These other assumptions
include projected rates of employee turnover, termination, and survi
vor election.
PERS' Accounting Policies
As noted in Chapter 1, either a plan termination liability (PTL) or
a plan continuation liability (PCL) benefit-liability measure can be
used for PERS financial reporting. Either approach is in accordance
with GASBS 1 and thus is permissible for PERS accounting. However,
these approaches result in different measures of the PERS' obligation
for future benefit payments. For Instance, the benefit obligation for a
given PERS is generally smaller when the PTL is used since the effects
on plan benefits of employees' future salary Increases are ignored.
PERS financial statement users must know which accounting method has
been adopted by the plan and its effects on the plan's reported benefit
obligation if they are to properly judge the plan's funding level.
Reporting Policies
A PERS' financial report is often the major source of financial
information and other data about the pension plan. Accordingly, it
needs to contain sufficient information about the plan's asset-to-
57
benefit ratio—and the factors that affect the ratio—for its users to
properly judge the PERS' level of funding. Such disclosures vary widely
in practice [Engstrom, 1984] and may have an effect on the financial
statement reader's judgment(s). For example, a knowledgeable PERS
financial statement user cannot adequately consider the effects of
actuarial assumptions if they are not disclosed; the same holds true for
the plan's accounting policies.
User Judgment Models
If homogeneous information signals are provided to decision makers,
judgment differences about a PERS can still arise. These differences
can be attributed to decision model differences between judges. Libby
[1981] describes three basic decision models which can help us to
understand the mental process(es) that produce a judgment from a given
set of information inputs.
Compensatory Models
Compensatory models represent the decision process as a linear
additive model. In this type of model, a high score on one cue offsets
a low score on another with the degree of offset being determined by the
relative weights placed on the cues. For example, a government employee
would like to receive above market wages and extraordinary pension
benefits; however, there is usually some trade-off between the two.
In a compensatory model, determining the proper trade-offs is the most
difficult activity in decision making.

58
Noncompensatory Models
In noncompensatory models, a high score on one variable cannot
compensate for a low score on another. Conjunctive and disjunctive
models have received the greatest attention (see Einhorn, 1970).
Conjunctive models require that some minimum level of performance be
exceeded on all variables. For example, a judgment of adequate benefit
security may require that (1) the PERS be well funded, (2) plan assets
are held by an Independent trustee, and (3) legal safeguards exist to
Insure benefit payments. Libby [1981] notes that "such models are often
used for prescreenlng alternatives" [p. 46].
Disjunctive models require outstanding performance on at least one
variable. Continuing with the PERS example, a judgment of adequate
benefit security under a disjunctive model might require either that (1)
the PERS be well funded, (2) plan assets are held by an independent
trustee, or (3) legal safeguards exist to insure benefit payments.
Accounting policy makers can gain relevant insights from
understanding the nature of decision rules. For example, if decisions
about a PERS' funding level were generally dependent upon the value of
one cue, different accounting and disclosure rules would be suggested
than if the decision was based on a compensatory model that utilized
all available cues.
Research Hypotheses
It is hypothesized that a significant proportion of knowledgeable
users are fixated on the relationship between assets and obligations of
pension plans. Thus, users of the financial reports of pension plans
are not able to compensate for either the method of reporting or
59
differences in actuarial assumptions. While knowledgeable users are
able to consider Individual actuarial assumptions when attention is
called to the assumption, they are unable to apply this knowledge in
judgment formation. In summary, a significant proportion of
knowledgeable users apply noncompensatory (disjunctive) models to
judgments about pension plans.
Summary
The efficient market hypothesis is rendered inappropriate for
studies of PERS financial statement users' reactions to reported data by
the lack of an active "PERS market." Yet users' reactions are impor
tant to standard setting bodies, especially given the complex technical
nature of PERS funding and its dependence upon actuarial assumptions and
methods, and considering the incidence of functional fixation reported
in previous studies [Ashton, 1976; Abdel-khalik and Keller, 1979].
Based on these findings, it is hypothesized that financially
knowledgeable users of PERS information will be fixated on the size and
proportion of assets to obligations in their judgments about plan
financial strength. Further, it is hypothesized that while they will
generally be able to understand simpler concepts of interest rate and
salary Increases, they will not be able to apply these concepts in
judgment formation. This study tests these hypotheses by applying human
information processing methodologies to the study of PERS financial
statement users and their judgments.
CHAPTER 4
RESEARCH DESIGN
Human Judgment Research
A considerable body of contemporary accounting research deals with
the accounting information based judgments of decision makers. These
studies are summarized by both Libby [1981] and Ashton [1982]. Ashton
notes that:
A substantial amount of research on judgment and decision making in accounting contexts has been conducted. The most extensive and important part of this work is known as human information processing research. The goals of this research involve understanding, evaluating, and improving decision making as it relates to accounting, [p. 1]
This study, building on the framework of previous human information
processing research, (1) focuses on the relationship between the judg
ments made by PERS financial statement users about the plan's financial
status and the form of the accounting information they receive, and (2)
attempts to determine the level of understanding that PERS financial
statement users have about the effects on the financial statements of
differences in the assumed rate of return on plan assets and/or the
projected level of participant's salaries.
Lens Model
Brunswik's lens model [Brunswik, 1940] provides the conceptual and
methodological framework for this study. The lens paradigm was selected
because it has been applied to a broad range of accounting-related
research questions (see Libby [1981], especially chapters 3-5). These
60

61
methodologies enable the researcher to investigate how much information
is used in judgment formation, and frequently they also permit the
researcher to determine how well Information is used [Ashton, 1982].
Lens Model Description
Figure 5 Illustrates Brunswik's lens model. A more complete
explanation of the model is included as Appendix B. The model is used
to analyze judgments where judgments are dependent on a set of explicit
environmental cues. The right side of the model indicates the relation
ships between the levels of the cues (X^) and the individual's
judgment/prediction in terms of their correlations (r j). The left side
indicates the actual relationships between the levels of the cues (X.)
and the actual environmental state (Y ) in terms of their correlations
(r j). An Individual's judgment about the state of the environment may
differ from the true environmental state if the information (cues) on
which the judgment is based is not perfectly correlated with the
environmental state (i.e., R < 1.0) and/or the individual misinterprets
the information that is available (i.e., Rg < 1.0).
Values of the criterion variable (Y^) and its optimal multiple
regression prediction (Y ), and the individual's judgment (Y^) and its
optimal multiple regression prediction (Y^) can be used to evaluate the
quality of an individual's judgments or predictions [Ashton, 1982].
Figure 6 Illustrates and defines the six judgment indices that can be
computed by correlating every pair of these four sets of values.
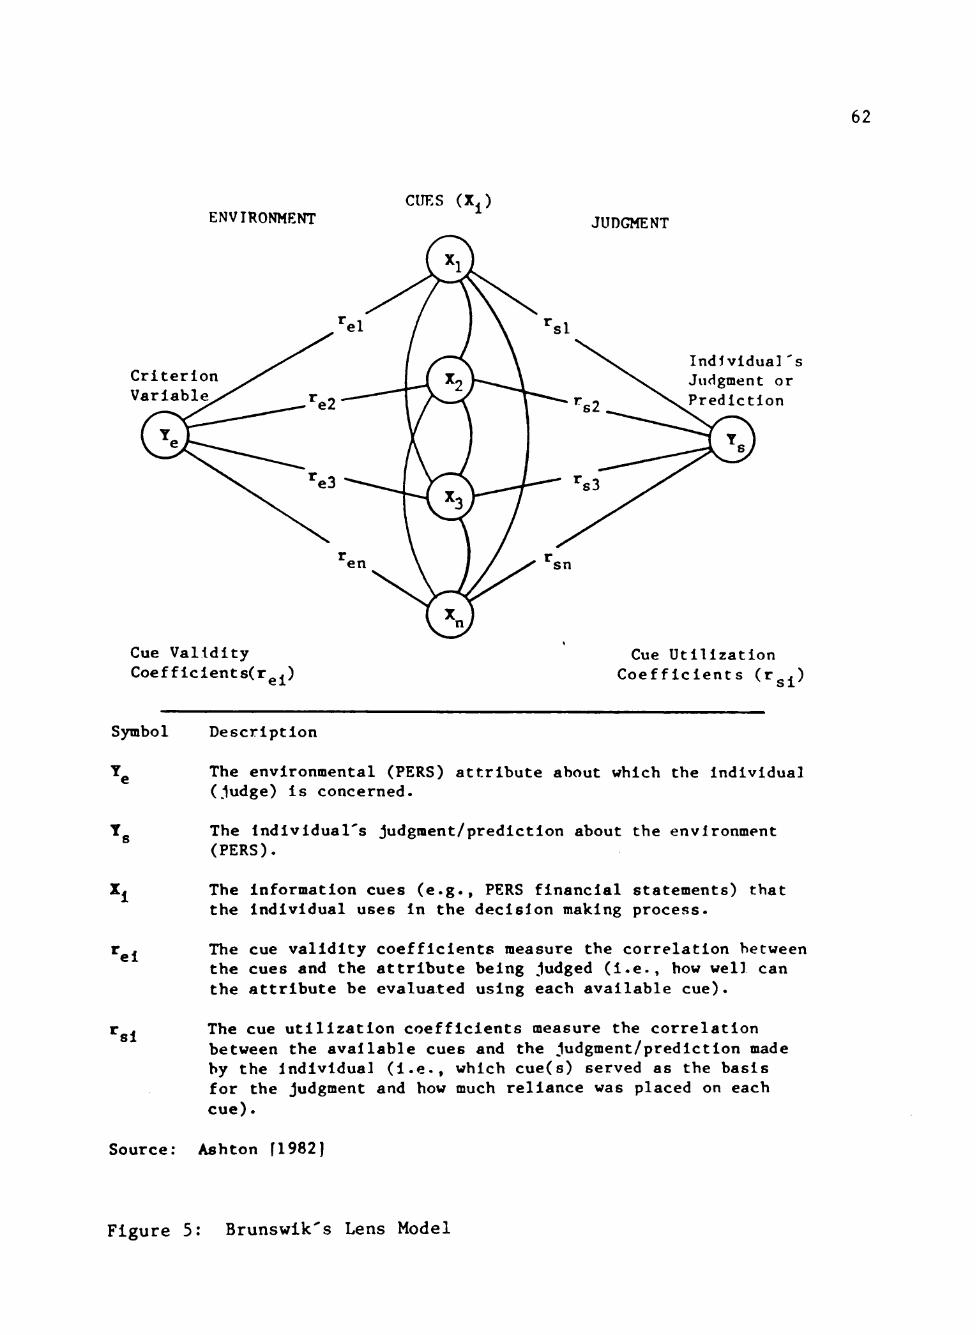
62
ENVIRONMENT CUES (X^)
Criterion Variable
Cue Validity Coefficients(rg^)
JUDGMENT
Individual's Judgment or Prediction
Cue Utilization Coefficients (r j)
Symbol
Y.
el
si
Description
The environmental (PERS) attribute about which the individual (,1udge) is concerned.
The individual's judgment/prediction about the environment (PERS).
The information cues (e.g., PERS financial statements) that the Individual uses in the decision making process.
The cue validity coefficients measure the correlation between the cues and the attribute being judged (i.e., how well can the attribute be evaluated using each available cue).
The cue utilization coefficients measure the correlation between the available cues and the judgment/prediction made by the Individual (i.e., which cue(s) served as the basis for the judgment and how much reliance was placed on each cue).
Source: Ashton fl982)
Figure 5: Brunswik's Lens Model

63
Symbol
R.
Description
The actual value of the criterion variable.
The individual's judgment/prediction about the criterion.
The optimal multiple regression prediction of the criterion.
The optimal multiple regression prediction of the individual's judgment-
The predictive ability of the cues with respect to the criterion.
The extent to which the individual consistently utilizes his Judgment policy as described by a regression equation.
The individual's accuracy in Judging/predicting criterion values.
The degree to which the individual's regression equation can predict criterion values.
The relationship between the Individual's judgment and the optimal regression prediction of the criterion.
The knowledge the individual has acquired in the judgment task.
Source: Ashton [1982]
Figure 6: Indices of Human Judgment
64
Lens Study Objectives
Lens studies may focus on either judgment accuracy and/or agree
ment, or policy capturing. Typically, judgment studies have either (1)
tested the accuracy of individual judgments and/or sought means to
Improve judgment accuracy, or (2) determined the level of agreement
among the judgments of several Individuals.
The opportunities for engaging in applied judgment accuracy
research are generally limited because the absence of a known criterion
value in many "real world" judgment tasks makes it impossible to deter
mine if an individual's judgment/prediction is correct. This study,
however, is designed to permit a limited assessment of the respondents'
judgment accuracy. Past studies of judgment accuracy have investigated
the accuracy of (1) various groups that could be considered experts at
the judgmental task (e.g., Libby [1975a, 1976]; Abdel-khalik and El-
Sheshai [1980]), or (2) students (e.g., Moriarity [1979]; Wright [1977a,
1977b]). This study differs from prior judgment accuracy research in
that many of the experimental subjects—although (1) possibly know
ledgeable of financial and accounting matters, and (2) actual users of
PERS financial statements—are not properly classifiable as expert
judges regarding pension and actuarial concepts.
"Capturing" the judgment/prediction policy of the individual is
another major objective of information utilization research. Typically,
an experimental setting is used that provides the individual with
various combinations of values for each of the variables (X ) that serve
as a basis for judgment/prediction. Once the individual makes a
judgment/prediction based on each combination of values presented.
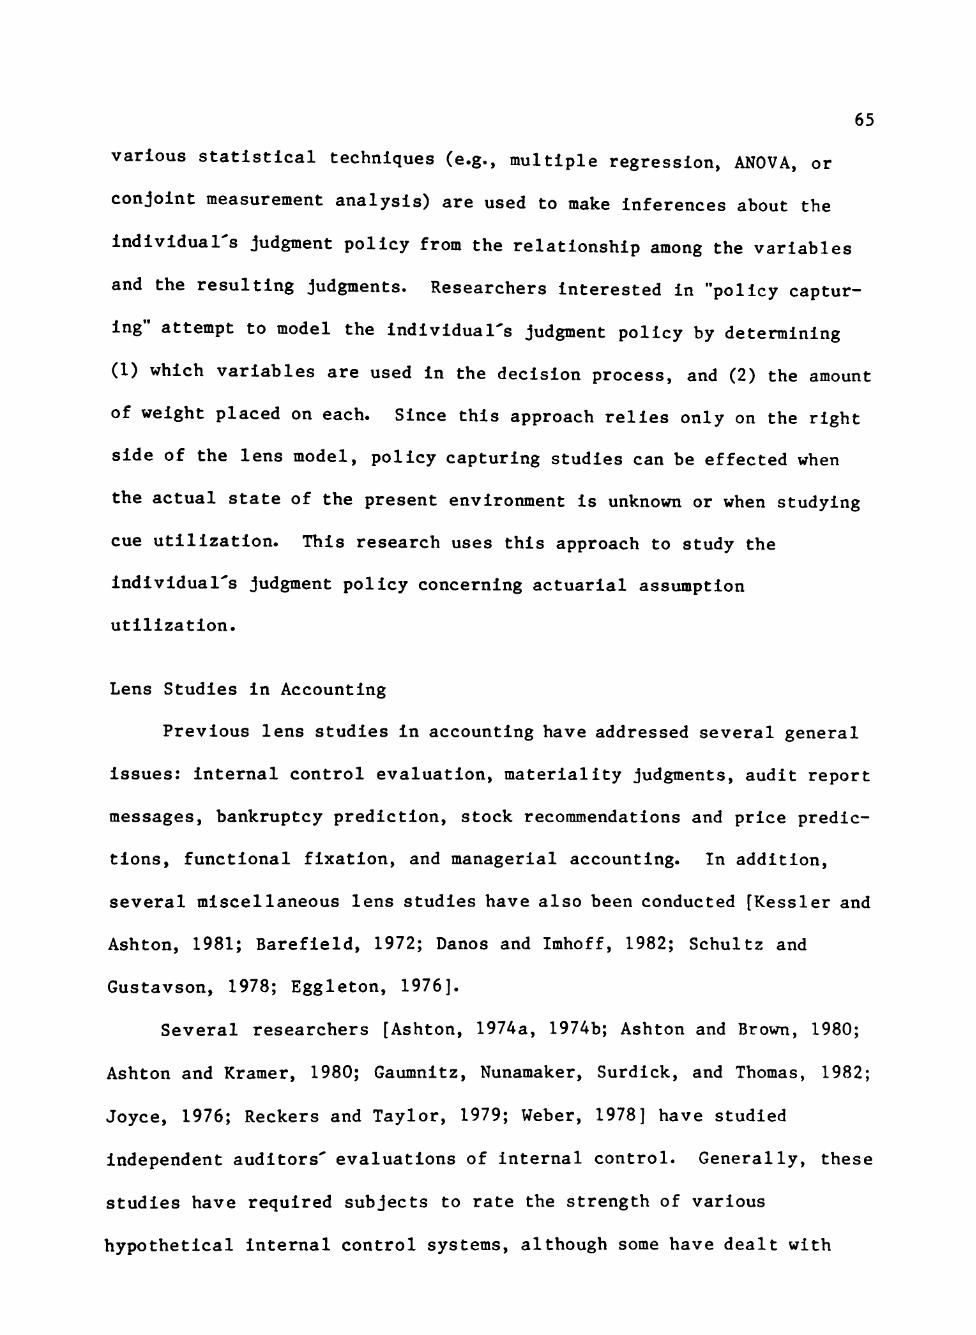
65
various statistical techniques (e.g., multiple regression, ANOVA, or
conjoint measurement analysis) are used to make inferences about the
individual's judgment policy from the relationship among the variables
and the resulting judgments. Researchers interested in "policy captur
ing" attempt to model the individual's judgment policy by determining
(1) which variables are used in the decision process, and (2) the amount
of weight placed on each. Since this approach relies only on the right
side of the lens model, policy capturing studies can be effected when
the actual state of the present environment is unknown or when studying
cue utilization. This research uses this approach to study the
individual's judgment policy concerning actuarial assumption
utilization.
Lens Studies in Accounting
Previous lens studies in accounting have addressed several general
issues: internal control evaluation, materiality judgments, audit report
messages, bankruptcy prediction, stock recommendations and price predic
tions, functional fixation, and managerial accounting. In addition,
several miscellaneous lens studies have also been conducted [Kessler and
Ashton, 1981; Barefleld, 1972; Danos and Imhoff, 1982; Schultz and
Gustavson, 1978; Eggleton, 1976].
Several researchers [Ashton, 1974a, 1974b; Ashton and Brown, 1980;
Ashton and Kramer, 1980; Gaumnitz, Nunamaker, Surdick, and Thomas, 1982;
Joyce, 1976; Reckers and Taylor, 1979; Weber, 1978] have studied
independent auditors' evaluations of internal control. Generally, these
studies have required subjects to rate the strength of various
hypothetical internal control systems, although some have dealt with
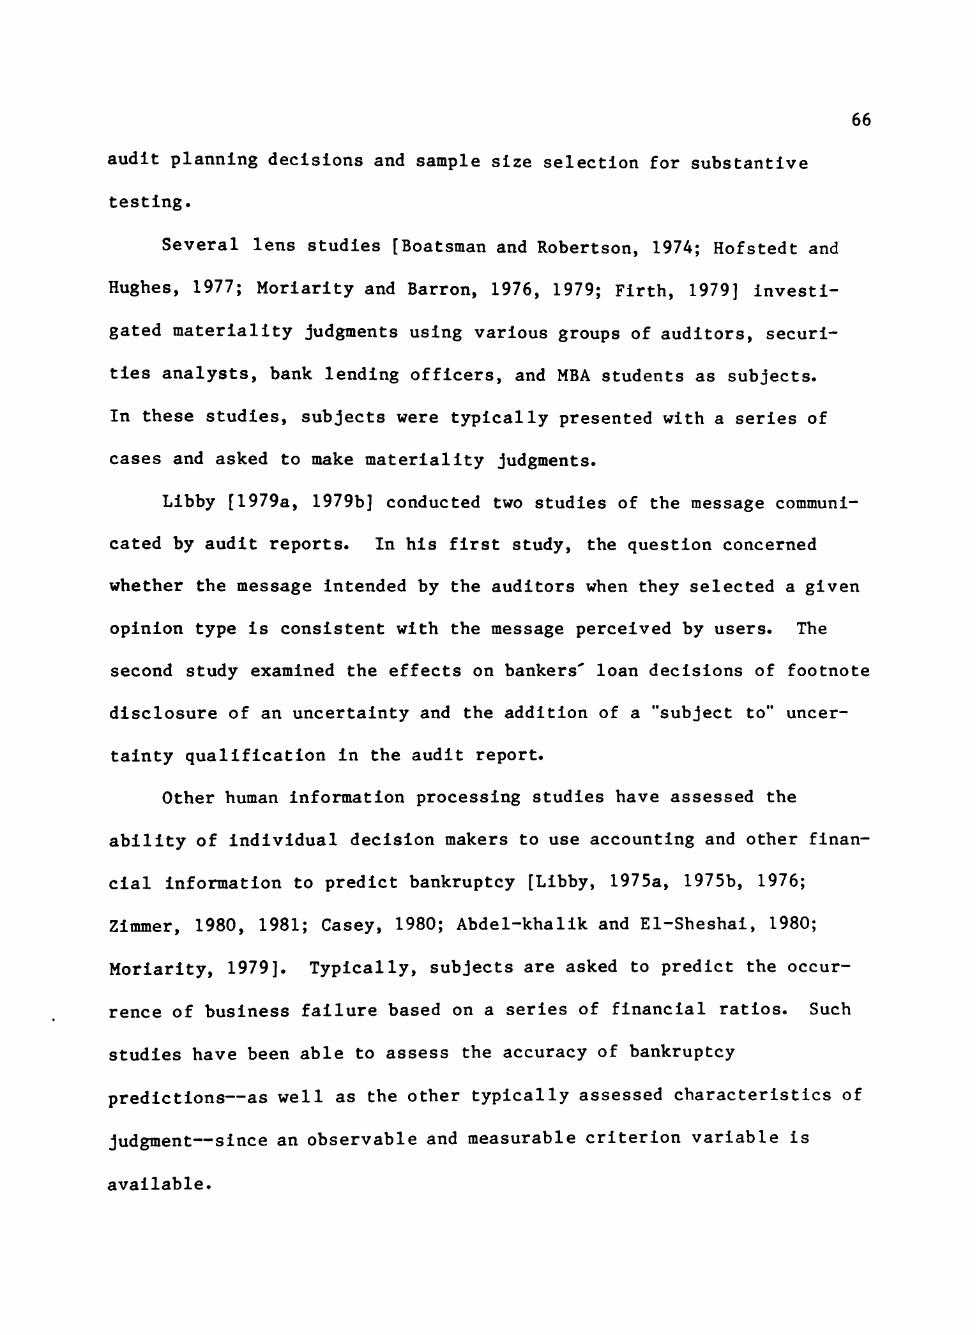
66
audit planning decisions and sample size selection for substantive
testing.
Several lens studies [Boatsman and Robertson, 1974; Hofstedt and
Hughes, 1977; Moriarity and Barron, 1976, 1979; Firth, 1979] investi
gated materiality judgments using various groups of auditors, securi
ties analysts, bank lending officers, and MBA students as subjects.
In these studies, subjects were typically presented with a series of
cases and asked to make materiality judgments.
Libby [1979a, 1979b] conducted two studies of the message communi
cated by audit reports. In his first study, the question concerned
whether the message intended by the auditors when they selected a given
opinion type is consistent with the message perceived by users. The
second study examined the effects on bankers' loan decisions of footnote
disclosure of an uncertainty and the addition of a "subject to" uncer
tainty qualification in the audit report.
Other human information processing studies have assessed the
ability of individual decision makers to use accounting and other finan
cial information to predict bankruptcy [Libby, 1975a, 1975b, 1976;
Zimmer, 1980, 1981; Casey, 1980; Abdel-khalik and El-Sheshai, 1980;
Moriarity, 1979]. Typically, subjects are asked to predict the occur
rence of business failure based on a series of financial ratios. Such
studies have been able to assess the accuracy of bankruptcy
predictions—as well as the other typically assessed characteristics of
judgment—since an observable and measurable criterion variable is
available.
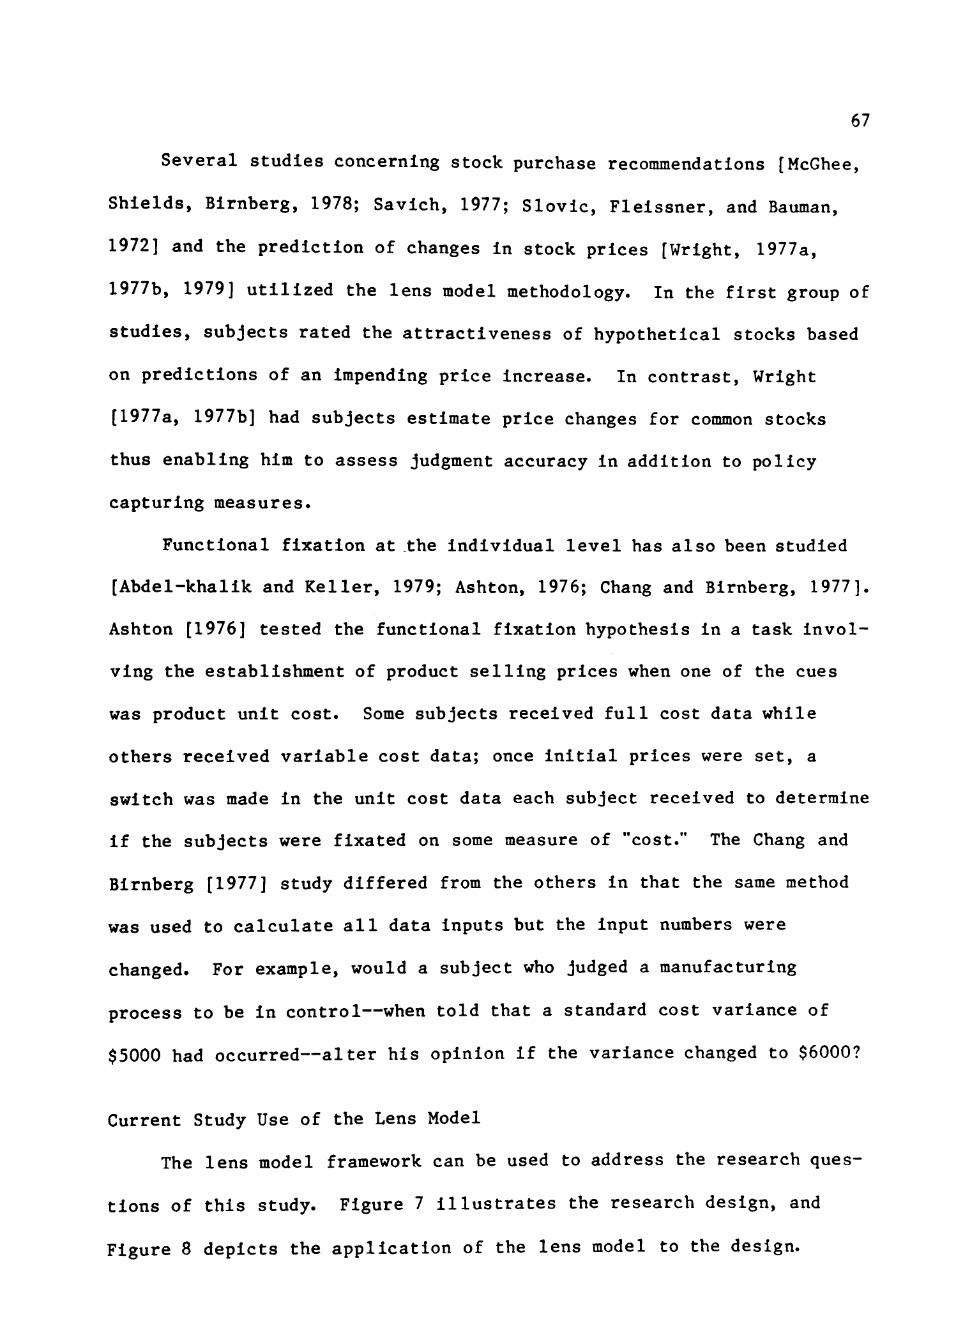
67
Several studies concerning stock purchase recommendations [McGhee,
Shields, Birnberg, 1978; Savich, 1977; Slovic, Flelssner, and Bauman,
1972] and the prediction of changes in stock prices [Wright, 1977a,
1977b, 1979] utilized the lens model methodology. In the first group of
studies, subjects rated the attractiveness of hypothetical stocks based
on predictions of an impending price Increase. In contrast, Wright
[1977a, 1977b] had subjects estimate price changes for common stocks
thus enabling him to assess judgment accuracy in addition to policy
capturing measures.
Functional fixation at the individual level has also been studied
[Abdel-khalik and Keller, 1979; Ashton, 1976; Chang and Birnberg, 1977].
Ashton [1976] tested the functional fixation hypothesis in a task invol
ving the establishment of product selling prices when one of the cues
was product unit cost. Some subjects received full cost data while
others received variable cost data; once initial prices were set, a
switch was made in the unit cost data each subject received to determine
if the subjects were fixated on some measure of "cost." The Chang and
Birnberg [1977] study differed from the others in that the same method
was used to calculate all data inputs but the input numbers were
changed. For example, would a subject who judged a manufacturing
process to be in control—when told that a standard cost variance of
$5000 had occurred—alter his opinion if the variance changed to $6000?
Current Study Use of the Lens Model
The lens model framework can be used to address the research ques
tions of this study. Figure 7 illustrates the research design, and
Figure 8 depicts the application of the lens model to the design.
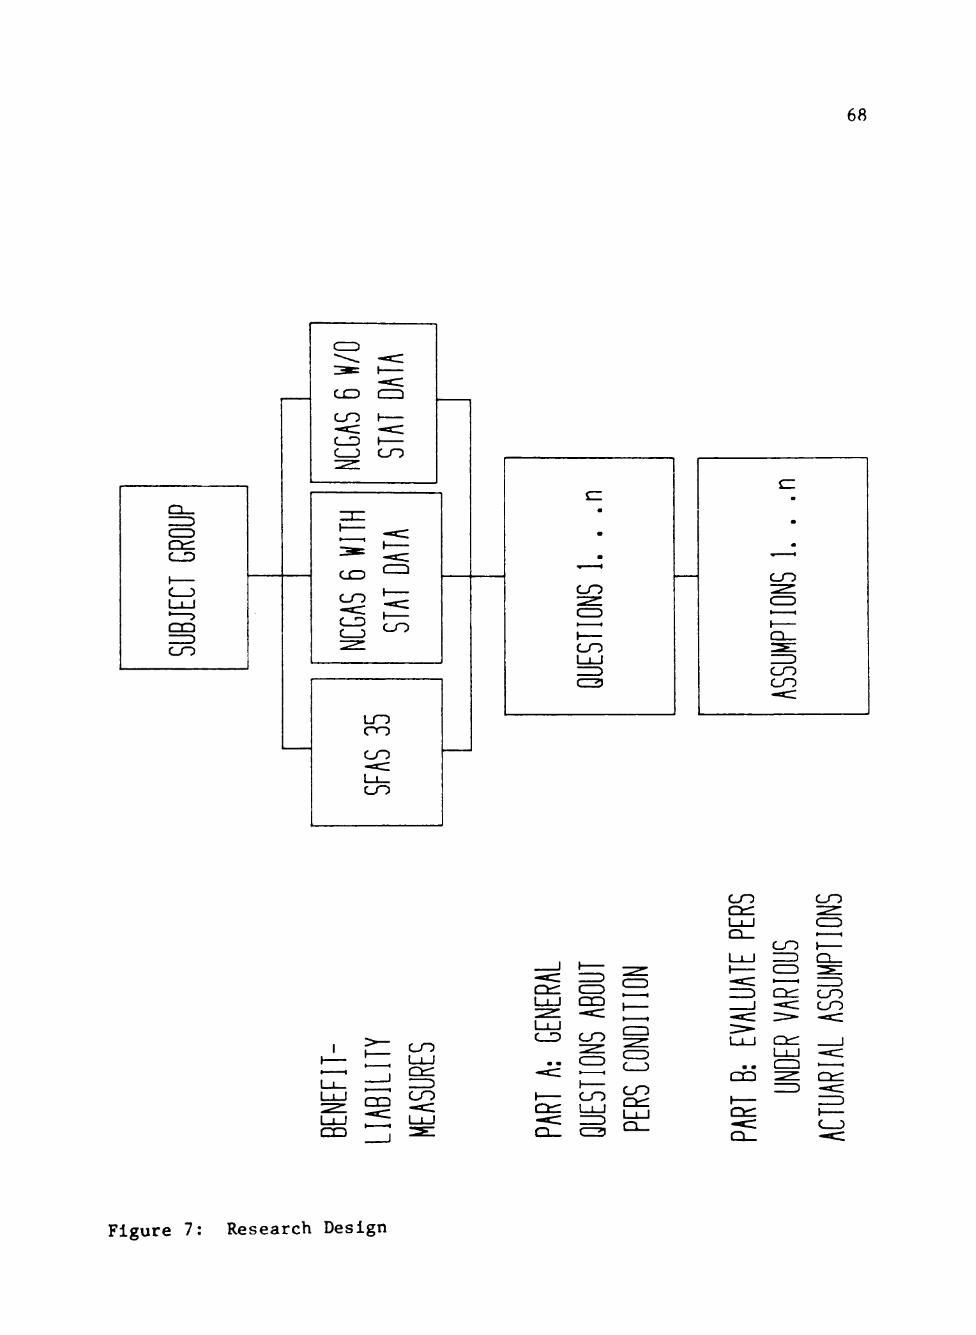
68
C O C O
C O
Q O
CO L_i_l
CO
U_l CD CO
I CO
C ) CO
) 1
• ^ ^ "^^ U - J
• « O Q
C t : : ^ ^ ^ r »
C t l l_i_l cm —^
C O C O . « ^
J . ^ d » «
ct::
C D C 5
Figure 7: Research Design
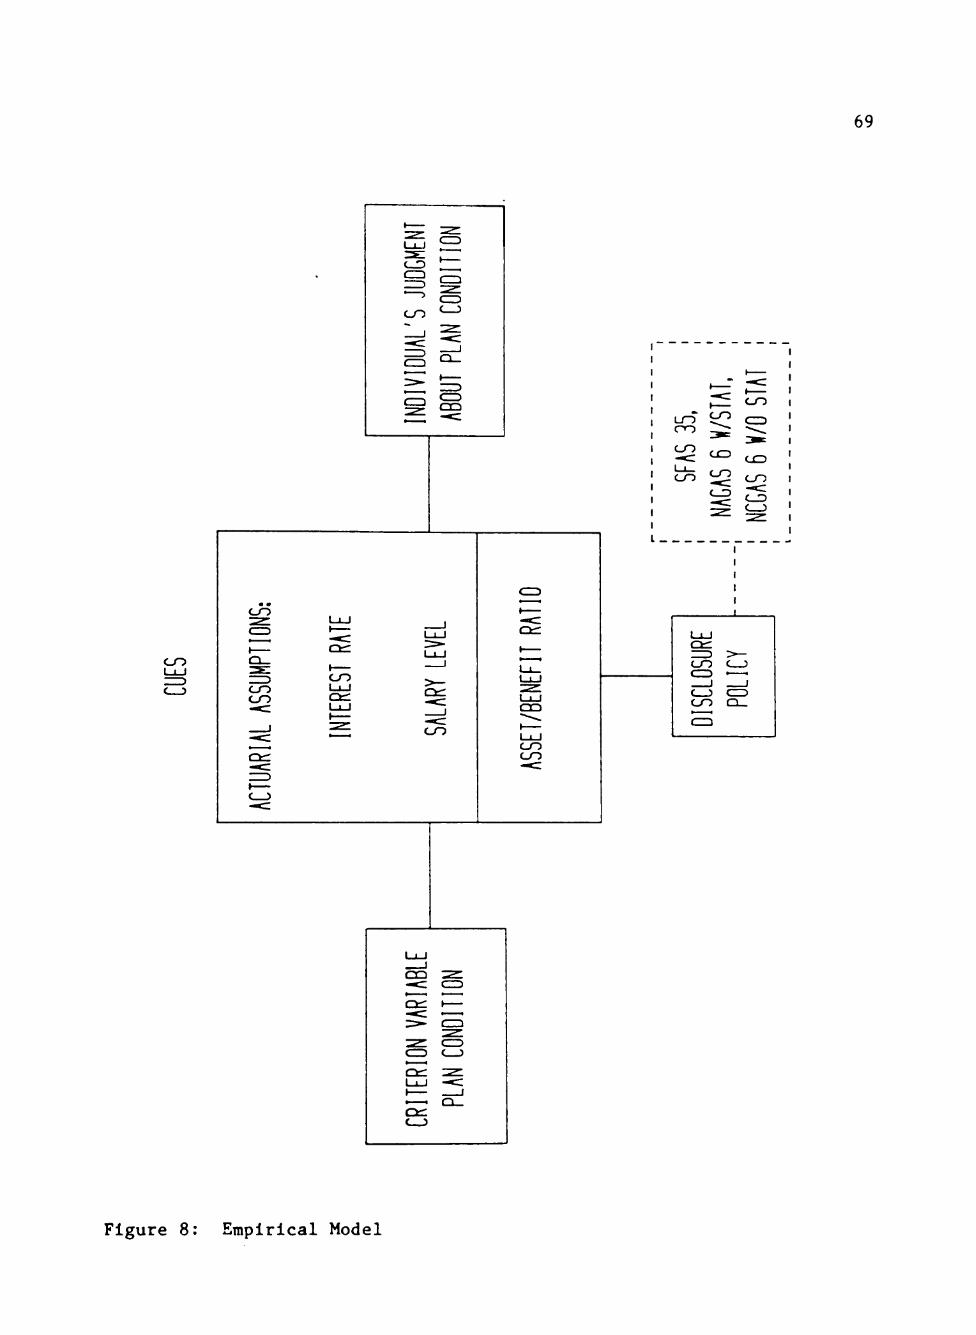
69
C O
C-T)
C O CO CO Ct::
C O
O Q
CO CO
^ CO
LO ^ C 3 tno ^ --
to ^ c^
^ C )
I
C O C 3
C O CZZ) C O Q_
Figure 8: Empirical Model
70
Between Subject Comparisons. Ideally, PERS financial statement
users would like to make "accurate" (r^ = 1.0) assessments about the
various PERS' attributes that interest them. Van Daniker and Aldrldge
[1985] identify several of these attributes: (1) the PERS' benefit
paying ability, (2) future PERS funding requirements, and (3) the per
formance level of PERS management. In this case, judgment accuracy is a
function of (1) the individual's knowledge about pension and general
accounting matters that is brought to the judgment task (G), (2) the cue
"quality" (R^) that is, how well the cues correlate with the environ
ment, and (3) the individual's consistency in making judgments based on
the available cues (R„) that is, how well the cues correlate with the
individual's judgment. Ideally, the "best" cue set is the one that
permits the most accurate judgment of the criterion variable(s) (i.e.,
the set with an R value closest to 1.0). However, the predictive
ability of the cues (Rp) can only be evaluated if objectively measurable
criterion values are available. Unfortunately, many of the PERS'
attributes that interest financial statement users do not have such
measurable criterion values since they represent either future events or
a subjective assessment on the part of the user. Since the accuracy of
individual judgments about these PERS attributes cannot be assessed (at
least not at the time the judgment is made), another approach must be
taken.
When judgment accuracy cannot be directly assessed, researchers
frequently rely on measures of judgment consensus as surrogate measures
of accuracy [e.g., Slovik, 1969; Ashton, 1974a; Hamilton and Wright,
1977]. Judgment consensus is recognized in the accounting profession as
71
being important. Libby [1981] notes:
A major objective of professional training in degree programs and continuing professional education is to promote consensus in professional judgment, and most standard setting in the accounting profession involves the codification of a consensus of expert opinions rather than scientific findings or objective measurements, [p. 31]
Consensus is a necessary, but not sufficient, condition for accuracy
among a group of expert decision makers [Einhorn, 1974]. However, Alice
Ashton [1985] studied the relationship between consensus and accuracy in
two prediction tasks of interest to accounting researchers and found
support for a strong positive relationship between the two attributes.
This study examines the degree of consensus between the various
subject groups concerning the financial condition of a PERS to determine
if one benefit-liability measure or disclosure level is significantly
"better" than the others. In this case, the better approach is the one
that produces the least amount of variance among the respondents.
Within Subject Comparisons. This study was also designed to test
for the effects of different sets of actuarial assumptions on individual
decisions. Accordingly, the research design permitted a comparison of
the judgments made by each subject about a PERS when the reported
actuarial assumptions and accumulated/projected benefit funding levels
differed.
The research structure permitted each decision maker to use his own
decision model without explicitly stating the parameters of this model.
Each person—at any point in time—has a given level of knowledge, and a
given method (decision model) of utilizing information to make deci
sions. It is expected that decisions are based on this knowledge level
and model acting in conjunction to process available information. Thus,
72
any decision changes that occur when the information set is varied are
deemed attributable to the changes in the information structure [Slovic,
Flelssner, and Bauman, 1972]. A major design criterion of this study
required an analysis of repetitive evaluations made by the same decision
maker, thus eliminating the variability inherent in comparing the deci
sions of different decision makers (who have different decision models).
However, this criterion did not solve problems arising from uncontrolled
variations in the information set. For example, the economic condition
of each PERS is affected by such factors as the tax base of the sponsor
ing government employer, the propensity of elected officials to increase
pension benefits without Increasing PERS funding, and the demographic
characteristics of plan participants. In order to control for the
effects of these and similar factors, the research design required each
decision maker to make several judgments about the same PERS under
controlled variations in the information they received about the PERS.
The research design thus reduced a major problem in field experiments:
differences among the alternatives except as introduced by the design.
The effect of this approach was to limit the potential causes for
different decisions to the manipulated information content of the PERS
financial statements. Since each decision maker made judgments on the
basis of his own decision rule for combining and evaluating accounting
information, any significant variation in the evaluation of the PERS
should have been due to differences attributable to changes in the
independent variable(s) signaled by the accounting information.
The experiment consisted of a simulated decision making situation
where PERS financial statement users were requested to evaluate certain
73
financial and other information and to make judgments based on their
evaluations. The structure of the experiment is illustrated by
Figure 8. A 2 factorial design was used to manipulate the variable
levels. Libby [1981] notes that if a continuous variable is dichoto
mized, the measure of relative cue importance will be affected by the
specific values chosen for each variable. For example, suppose that the
relative effects on the subjective probability of receiving benefits on
retirement of (1) the asset-to-benefit ratio and (2) the investment
performance of the PERS are studied. As illustrated by Figure 9, when
the asset-to-benefit ratio is dichotomized, the slope of the function
that represents its effect on judgments may depend on which segment of
the underlying continuous function is utilized. To minimize such
effects in this study, cue levels were utilized that were typical of
those found in PERS reports.
Sample Selection
PERS financial statement users have been variously Identified as
plan participants, plan administrators, legislative/oversight bodies,
management of the sponsoring government, credit market participants, and
citizens of the sponsoring government [Van Daniker and Aldrldge, 1985;
SFAS 35; NCGAS 6]. In order to meet the objections of Beaver [1973],
only those with a high likelihood of being considered "knowledgeable"
were considered. Thus, experimental subjects were selected from both
government management and plan administrators.
Financial officers of city and county governments were selected as
representative of government management. Financial officers were chosen
because (1) they were .believed to be a reasonably informed group of PERS
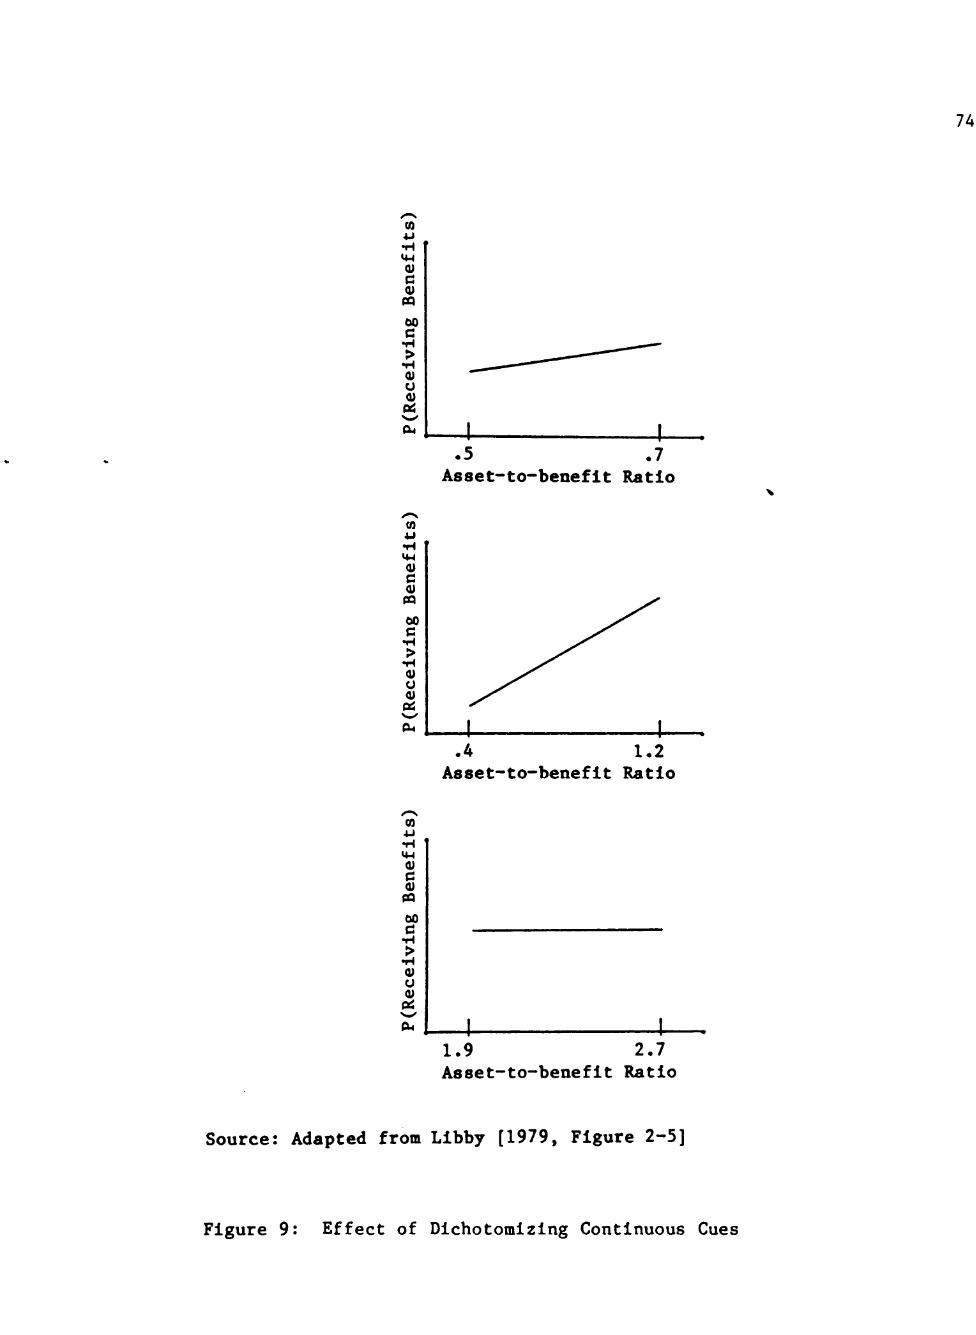
74
CO
C <u PQ
60 C
u 0)
(0
0)
00
0) o
CO 4 J
«4-l (U
00
0)
u PC
4. 4-.5 .7
Asset- to-benef i t Ratio
I I .4 1.2
Asset- to-benef i t Ratio
4- 4-1.9 2.7 Asset-to-benefit Ratio
Source: Adapted from Libby [1979, Figure 2-5]
Figure 9: Effect of Dichotomizing Continuous Cues
75
financial statement users, and (2) it can be argued that they were more
likely to comprise a homogeneous group than other user categories, thus
potentially reducing the variance between their individual decision
models. The homogeneity argument is grounded in the notion that finance
officers are likely to have "business" backgrounds and other similar
experience, whereas other user groups (e.g., plan participants) may
consist of individuals with widely diverse backgrounds. To enhance the
sample's homogeneity, it was drawn from among relatively large
governmental units. Subjects were selected from the membership rolls
of the Governmental Finance Officers Association (GFOA), Names from the
mailing list were randomly assigned to one of three treatment groups,
allowing between-group comparisons to be made. Each group received one
of three versions of the research instrument.
Research Instrument and Hypotheses
Research Instrument
This research tested the effects on the PERS information signal of
(1) benefit-liability measure and disclosure level differences, (2)
various asset-to-benefit ratios, and (3) differences in the actuarially
assumed rate of interest and rate of salary escalation. Mathematical
representations of each respondent's funding level judgments were also
constructed to allow testing for decision model differences.
Three versions of the research instrument (refer to Appendix C)
were produced, each consisting of (1) an introductory letter that
briefly described the study and urged the addressee to participate, (2)
an endorsement letter from the GASB, (3) PERS financial statements

76
prepared in accordance with either SFAS 35, NCGAS 6, or NCGAS 6 with the
statistical data section omitted, and (4) a questionnaire about the
PERS. The financial statements for each version included the following:
(1) an auditors report, (2) all required financial statements, and (3)
notes to the financial statements.
Reporting under SFAS 35—although including the cost of ancillary
benefits in the accumulated plan liability—is reasonably consistent
with the PTL approach, and the provisions of NCGAS 6 produce financial
reports that are generally consistent with a PCL measure. Therefore,
statements prepared in accordance with these two pronouncements served
as surrogates for a PERS' reported PTL and PCL and were used to test
for the effects on decisions of benefit-liability measure differences.
Not only have the NCGA and FASB adopted different benefit-liability
measures, they have also promulgated different disclosure levels as well
(see Appendix A). The effects of the 10-year statistical data required
by NCGAS 6 on user perceptions about the PERS were tested by providing
one of the groups with financial statements prepared in accordance with
NCGAS 6 and another group with like statements except for the omission
of the statistical data.
The PERS financial statements for all versions were adapted from
the illustrative financial statements that comprise Appendix A to
NCGAS 6. This "PERS" was selected (1) because it appeared to be fairly
typical in terms of its benefit provisions, and (2) because 10-year
statistical data were reported for the PERS. The NCGAS 6 version of the
financial statements required additional adaptation for conformity with
SFAS 35.
77
The fictitious PERS' obligation for future benefit payments as
reported pursuant to NCGAS 6 had to be adjusted to be in accordance with
SFAS 35. In addition, the "SFAS 35" plan's assets had to be reported on
the balance sheet at market Instead of cost.
Recall that NCGAS 6 is predicated on a going concern assumption and
that its measure of a PERS' benefits obligation (the actuarial present
value of credited projected benefits [APVCPB]) includes the effects of
projected salary increases; the corresponding SFAS 35 benefit-liability
measure (the accumulated plan benefit [APB]) ignores the salary effect.
Wlnklevoss and McGlll [1979] performed a series of actuarial calcula
tions on a hypothetical plan population and reported that the asset
target (APVCPB or APB) is normally about 20% higher (expressed as a
percentage of payroll—see Figure 6) when the level dollar benefit
method (LDBM) is used in place of the accumulated plan benefit method
(APBM). (The term "asset target" refers to the desired level of plan
assets under the funding method in use.) Accordingly, the asset target
reported under the LDBM was reduced for the SFAS 35 version of the
instrument. Based upon the recommendations of a consulting actuary who
has considerable PERS experience, the APB of the fictitious PERS was set
at 60 percent of the APVCPB.
Hypotheses
The questionnaire consisted of two parts, each of which contained
exercises designed to enable various hypotheses to be tested. It also
collected respondent demographic data that were used to test the effects
of involvement with pension management and length of government service
on respondents' pension judgments. Ashton [1982] made the general
78
observation that "linear models based on a small number of cues are
capable of explaining a large proportion of judgment variance, regard
less of the accounting or auditing context or the type of decision maker
that is studied" [p. 151]. Accordingly, the number of variables manipu
lated by this study was limited.
Part A of the questionnaire asked the respondent to study the
information in the financial statements and then make four judgments
about the PERS. Each judgment concerned an area of interest to PERS
financial statement users as identified by Van Daniker and Aldrldge
[1985]: (1) the level of funding of accumulated/projected plan bene
fits, (2) the investment performance of PERS management, (3) the plan's
benefit level, and (4) the probability of receiving benefits upon
retirement. A seven point Llkert scale was used to record each
judgment. This portion of the questionnaire was designed to enable
testing of these research hypotheses:
HIA: Since the reported asset to benefit ratio is higher under
SFAS 35, the "SFAS 35" respondent group will make higher assess
ments of (1) the PERS' funding level and (2) participants' benefit
security than the two "NCGAS 6" respondent groups.
H2A: There is a difference in judgment consensus that is attribu
table to the presence or absence of 10-year statistical data.
There should be no significant difference between the groups' mean
response to each question if each financial statement version conveys
the same information signal. Likewise, there should be no significant
difference between the groups' response variance for each question if
79
the consensus level is the same. Random assignment was relied upon to
negate the effects of variances in Individual cue utilizations.
Next, Part A requested each respondent to indicate the financial
statement elements that they believed formed the basis for their
response to each question. This exercise was analyzed using descriptive
statistics and indicated the degree of reliance that users believed they
placed on reported actuarial data. Relationships between the judgments
previously made and the financial statement items used (as "self-
reported") were analyzed for each judgment.
Part B dealt with each user's ability to understand the effects
of actuarial assumptions on reported PERS data. The first exercise
identified three actuarial variables and specified two levels for each.
The user was asked to determine which level of each variable will
produce the largest estimate of credited projected benefits. The
percentage of respondents that properly assessed the effects of each
variable were used to estimate population levels of understanding.
Further, a chi-square test was used to test the following hypothesis:
H3A: The percentage of respondents that properly assess the
effects of each variable is significantly different from the
expected level of random occurrence.
The second exercise employed a factorial design to determine (1)
which of the three variables were utilized in decision making and (2)
the level of accuracy displayed by the respondents. The latter was
possible in this case because the effects of each variable could be
analytically determined. A study [Abdel-khalik and Keller, 1979] of
financial statement users' judgments found that users frequently make
80
judgments based on some reported summary measure [e.g., net income] and
disregard the effects on the measure of the accounting methods used in
its determination. PERS financial statement users may be similarly
fixated on a reported measure of the plan's condition—such as the
asset-to-accumulated/projected-benefit ratio—and ignore or misinterpret
the effects of the actuarial assumptions that affect the measure. Thus,
the following hypothesis was tested:
H4A: Respondents are functionally fixated on the reported asset-
to-benefit ratio and will Ignore or misinterpret the effects on this
ratio of changes in the actuarial interest and salary assumptions.
ANOVA was used to test for the significance of main effects and
interactions. In addition, respondents were classified according to
their performance on the preceding exercise to determine if there was an
"actuarial knowledge" effect.
Summary
The data for this research were obtained through a field experiment.
The experimental design required that the sample—which was drawn from
the membership of the GFOA—be divided into three groups. Each group
was furnished with a different version of the research instrument. Each
version included PERS financial statements prepared in accordance with
either SFAS 35, NCGAS 6, or NCGAS 6 with the statistical data section
omitted. This design allowed these hypotheses to be tested:
HIA: Since the asset-to-benefit ratio is higher under SFAS 35, the
"SFAS 35" respondent group will make higher assessments of (1) the
PERS' funding level and (2) participants' benefit security than the
81
two "NCGAS 6" respondent groups.
H2A: There is a difference in judgment consensus that is attribu
table to the presence or absence of 10-year statistical data.
In addition, each research instrument employed two exercises
designed to test the hypotheses listed below. These exercises were
designed to be independent of the financial statement version used in
Part A.
H3A: The percentage of respondents that properly assess the
effects of each variable is significantly different from the
expected level of random occurrence.
H4A: Respondents are functionally fixated on the reported asset-
to-benefit ratio and will ignore or misinterpret the effects on
this ratio of changes in the actuarial interest and salary
assumptions.
The responses to Parts A and B were tested for the existence of
relationships between uncontrollable demographic characteristics and
item responses.
CHAPTER 5
HYPOTHESES TESTS, RESULTS, AND IMPLICATIONS
This chapter (1) discusses the research Instrument validation
process, (2) describes the respondent group, and (3) presents the
results of the study. The results section states the hypotheses tested,
describes the statistical tests used, and presents the results of the
tests.
Instrument Validation
Appendix C contains a copy of the research instrument. Before
fInalization, it was responded to and/or reviewed by several faculty
members, accounting doctoral students, members of the respondent popula
tion, and municipal pension experts to ascertain its appropriateness.
The instrument was also reviewed by the Vice Chairman/Director of
Research of the Governmental Accounting Standards Board (GASB).
Initially, three municipal finance officers (employed by Texas
cities ranging in population from 35,000 to 300,000) were visited. At
the start of each session, the finance officer was given a respondent
packet and asked to complete the instrument as if it had been received
in the mail. He was instructed to take notes or make verbal comments on
areas of the instrument that he found unclear. No other Instructions
were given, and information about the study was limited to the contents
of the respondent packet.
Each respondent was observed while he was completing the Instrument
and his completion time was recorded. In addition, his approach to
82
83
completing the questionnaire was noted; i.e., how carefully he appeared
to read the introductory materials and instructions, how much time he
spent reviewing the financial statements prior to starting the question
naire, and how much time he devoted to each part of the Instrument. On
average, the pretest subjects spent 35 minutes completing the question
naire. Approximately ten minutes were spent reading the participation
request and GASB endorsement letters and in financial statement
familiarization. The subjects made frequent reference to the financial
statements when answering the four general questions about the ficti
tious PERS and appeared to have no trouble with this part of the
questionnaire. They also appeared to be aware of the financial state
ment data that they relied on when making their judgments. However,
most of the respondents experienced some difficulty with the actuarial
exercises. When the questionnaire was completed, the nature of the
study was explained and suggestions for improving the instrument were
requested.
The pretest subjects noted that several of the terms used in the
questionnaire were unclear and expressed their preferences for alterna
tives; their suggestions were considered in revising the questionnaire.
They also were concerned about the actuarial exercises, believing that
to complete them correctly requires a level of knowledge that may not be
Indigenous to the subject group. Further, some respondents opined that
apprehension among potential respondents over actuarial concepts might
be detrimental to the overall questionnaire response. Accordingly, the
introductory letter and the instructions to the actuarial exercise were
modified. The revisions stated that a major purpose of the study was to

84
determine if financial statement users had difficulty dealing with
actuarial information and encouraged participation in the study.
Subjects were asked to do their best to complete the questionnaire, but
to return it even if incomplete. An "insufficient data" response option
was also added to the general PERS questions since some respondents
suggested that the response scale may at times force an apparent
judgment when in fact the respondent felt that he did not possess
sufficient information to respond.
The revised research packet was then extensively reviewed by the
assistant city manager of one of the largest cities in Texas, a
consulting actuary (with considerable PERS experience), and a manager
with the national governmental practice office of a "Big-8" accounting
firm. Each person was asked to comment on the "appropriateness" of the
questions asked in Part A, The questions were to be considered
"appropriate" if they represented the type of information that a PERS
financial statement user typically would be seeking. The subjects also
were asked (1) to comment on the "typicalness" of the fictitious PERS
financial statements, and (2) for suggestions regarding ways to Improve
the instrument so as to elicit a better response rate or to eliminate
any remaining ambiguities. As a result of the reviewers' comments, (1)
the size of the fictitious PERS and its reported funding level was
reduced, and (2) its benefit provisions were slightly altered. In
addition, the two actuarial cost methods listed in the actuarial know
ledge exercise were referenced to NCGAS 6 and SFAS 35, respectively.
85
Respondent Demographics
Sample Selection
The sample was selected from the membership list of the Govern
mental Finance Officers Association (GFOA) as of August, 1985. The GFOA
membership list contained 6,694 names; however, not all of its members
are senior financial managers of city or county governments or PERS
administrators. Persons selected for testing were either (1) employed
by a large governmental unit (in excess of 80,000 population) as the
finance director, treasurer, or controller (or similar job title), or
(2) the administrator of a PERS, These GFOA members were chosen for
testing because they (1) were believed to be interested in PERS
accounting and financial reporting, and (2) were deemed to be reasonably
knowledgeable users of PERS information [Van Daniker and Aldrldge,
1985]. The pretest participants concurred with this assessment. This
selection technique resulted in a sample size of 433.
Assignment to Treatment Groups
As furnished, the GFOA mailing list was sorted by postal zlpcode;
the sample, as selected, was in approximately the same sequence. This
ordering scheme should be approximately random with respect to the
study's demographic variables. The sample list was sequentially sub
divided into three experimental groups. Members in each group received
one of the three versions of the respondent packet. Each questionnaire
was assigned a control number, thus permitting (1) only nonrespondents
to be contacted during the follow-up to the initial mailing, and (2) a
copy of the results to be mailed only to participants. Two weeks after
86
the initial mailing, a telephone call was placed to each nonrespondent
to encourage his or her participation. This approach was considered to
be more effective than a second mailing since respondents' "reasons" for
nonparticlpation could be addressed by the caller. These "reasons"
included membership in multiple-employer PERS only, insufficient
knowledge of pension accounting, or not enough time to complete the
questionnaire. Table 1 lists the quantity of each version that was
mailed and provides response rate statistics.
Non-response Bias
Although the 26.6 percent response rate indicated in Table 1 may
appear low, it is consistent with the response rate that Van Daniker and
Aldrldge [1985] achieved. Oppenheim [1966] states that the Important
issue is not the response rate, but the possibility of nonresponse bias
that results if the returns are not representative of the original
sample selected. Because of the potential seriousness of the problem, a
test for nonresponse bias was made by applying an early/late methodology
as recommended by Oppenheim and used by other accounting researchers
[e.g., Buzby, 1975; Robblns, Apostolou, and Strawser, 1985].
The testing procedure consisted of randomly selecting fifteen
returns from among those received during the first ten days after
mailing the questionnaire. These returns were labeled as the early
responding group. Similarly, the final fifteen returns received were
identified as the late group. The SAS (Statistical Analysis System)
NPARIWAY procedure was used to perform a median test for differences
between the two groups in their responses to the questions in Part A.
The attained level of significance shows the probability of obtaining
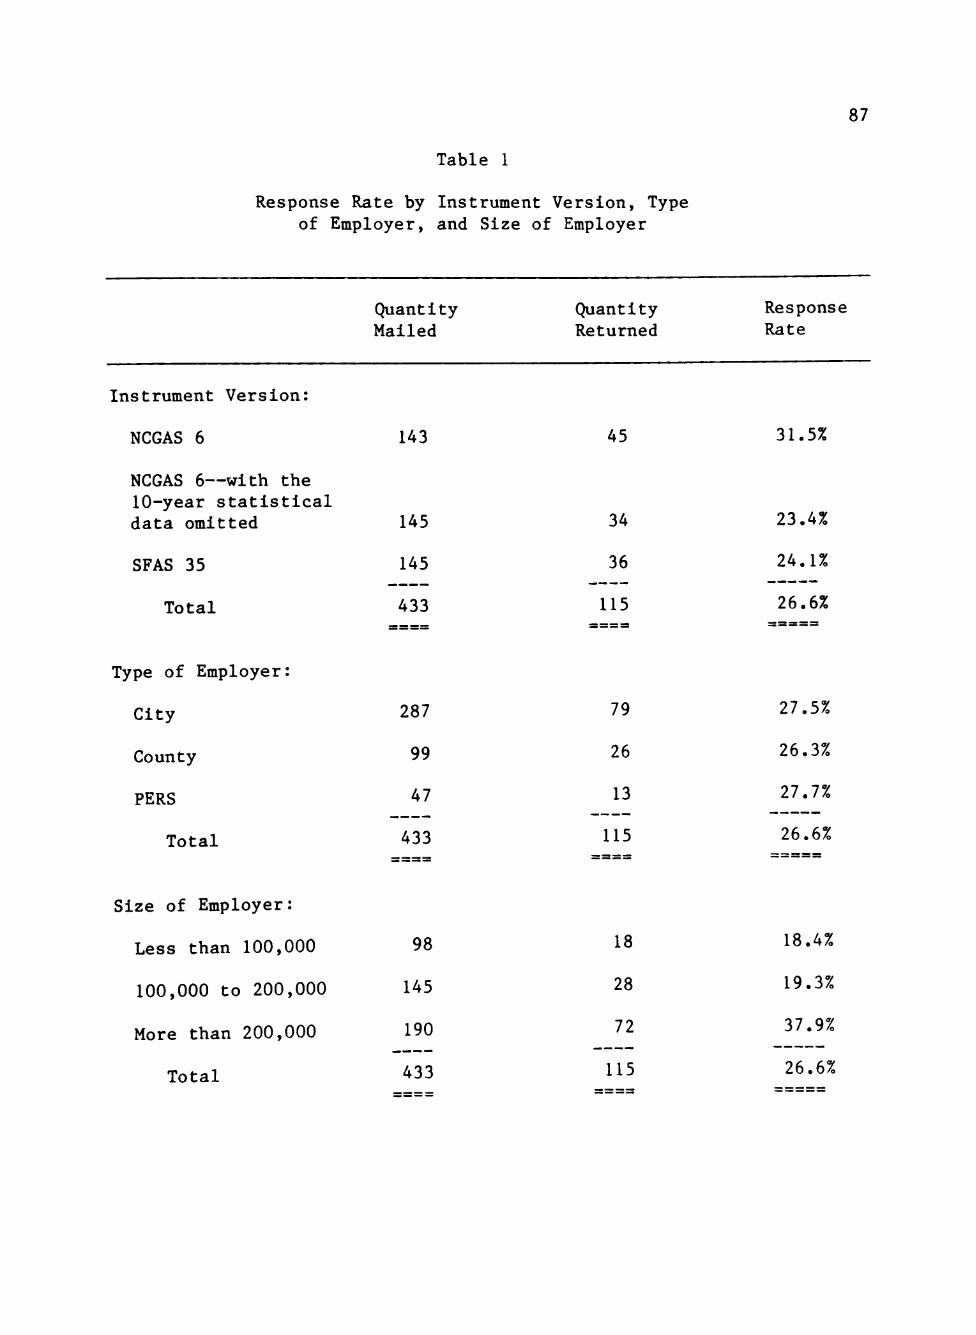
87
Table 1
Response Rate by Instrument Version, Type of Employer, and Size of Employer
Quantity (^antity Response Mailed Returned Rate
Type of Employer:
City
Instrument Version:
NCGAS 6 143 45 31.5%
NCGAS 6—with the 10-year statistical data omitted 145 34 23.4%
SFAS 35 145 36 24.1%
Total 433 115 26.6%
287 79 27.5%
County 99 26 26.3%
PERS 47 13 27.7%
Total 433 115 26.6%
Size of Employer:
Less than 100,000 98 18 18.4%
100,000 to 200,000 145 28 19.3%
More than 200,000 190 72 37.9%
Total 433 115 26.6%
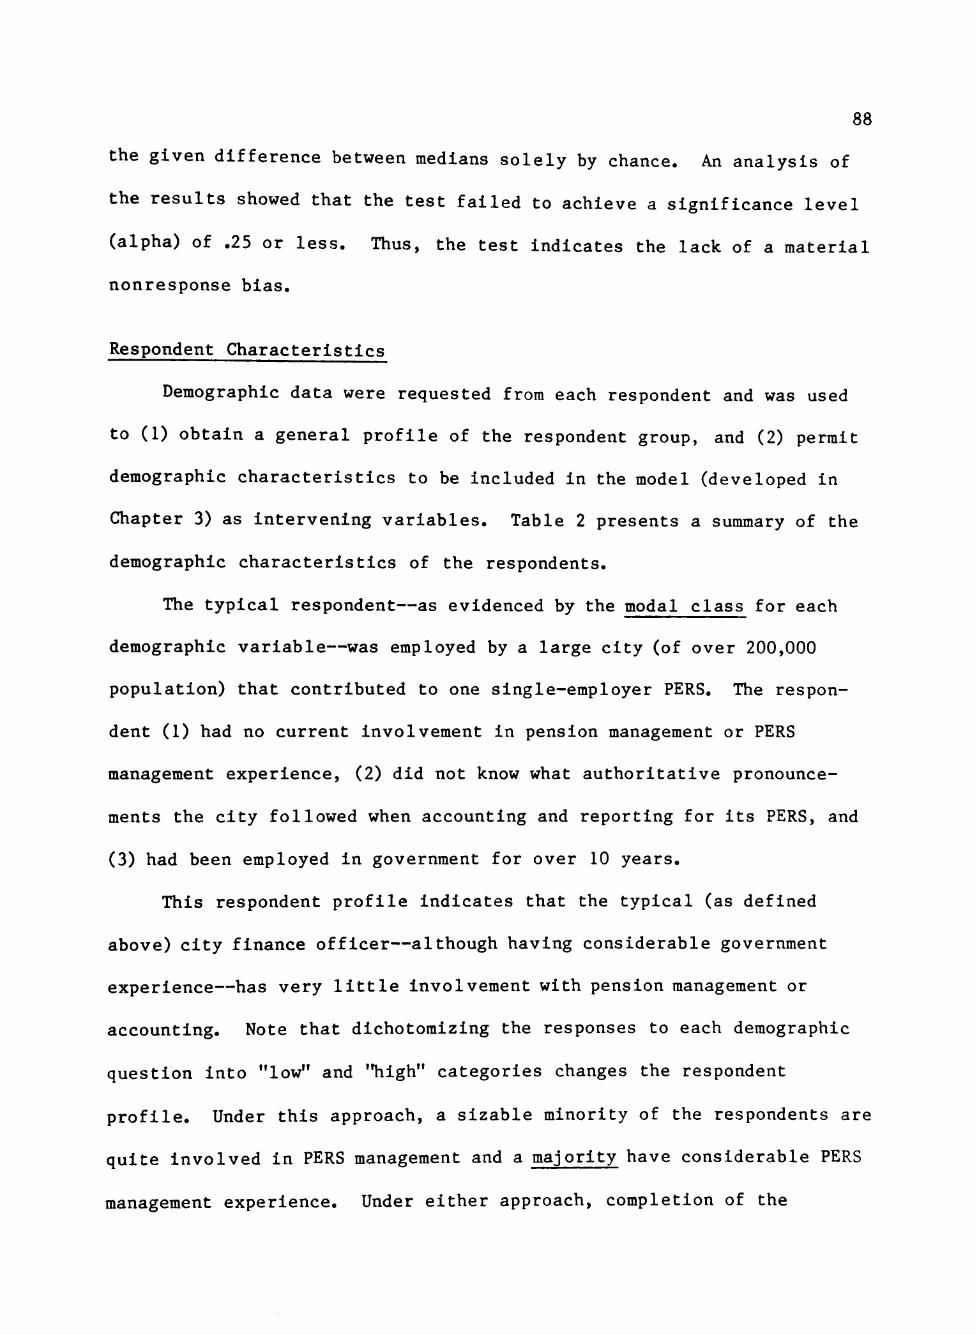
88
the given difference between medians solely by chance. An analysis of
the results showed that the test failed to achieve a significance level
(alpha) of .25 or less. Thus, the test indicates the lack of a material
nonresponse bias.
Respondent Characteristics
Demographic data were requested from each respondent and was used
to (1) obtain a general profile of the respondent group, and (2) permit
demographic characteristics to be Included in the model (developed in
Chapter 3) as intervening variables. Table 2 presents a summary of the
demographic characteristics of the respondents.
The typical respondent—as evidenced by the modal class for each
demographic variable—was employed by a large city (of over 200,000
population) that contributed to one single-employer PERS. The respon
dent (1) had no current Involvement in pension management or PERS
management experience, (2) did not know what authoritative pronounce
ments the city followed when accounting and reporting for its PERS, and
(3) had been employed in government for over 10 years.
This respondent profile indicates that the typical (as defined
above) city finance officer—although having considerable government
experience—has very little involvement with pension management or
accounting. Note that dichotomizing the responses to each demographic
question into "low" and "high" categories changes the respondent
profile. Under this approach, a sizable minority of the respondents are
quite involved in PERS management and a majority have considerable PERS
management experience. Under either approach, completion of the
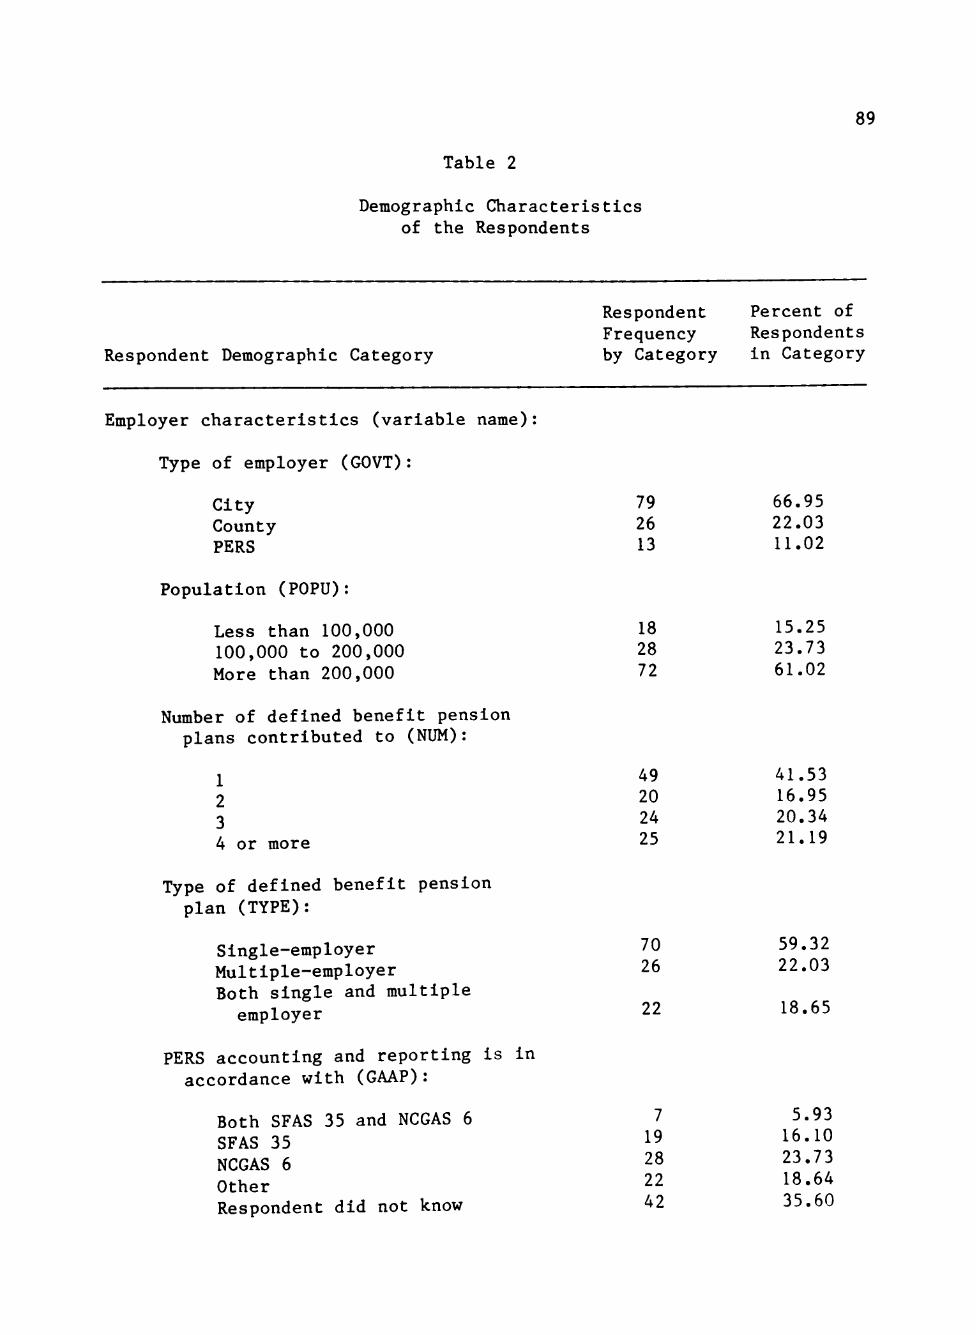
89
Table 2
Demographic (Characteristics of the Respondents
Respondent Demographic Category
Respondent Frequency by Category
Percent of Respondents in Category
Employer characteristics (variable name)
Type of employer (GOVT):
City County PERS
79 26 13
66.95 22.03 11.02
Population (POPU):
Less than 100,000 100,000 to 200,000 More than 200,000
Number of defined benefit pension plans contributed to (NUM):
1 2 3 4 or more
Type of defined benefit pension plan (TYPE):
Single-employer Multiple-employer Both single and multiple employer
PERS accounting and reporting is in accordance with (GAAP):
Both SFAS 35 and NCGAS 6 SFAS 35 NCGAS 6 Other Respondent did not know
18 28 72
15.25 23.73 61.02
49 20 24 25
41.53 16.95 20.34 21.19
70 26
22
59.32 22.03
18.65
7 19 28 22 42
5.93 16.10 23.73 18.64 35.60

Table 2, continued
Demographic (^aracterlstics of the Respondents
90
Respondent Demographic Category
Respondent Frequency by Category
Percent of Respondents in Category
Respondent characteristics (variable name):
Involvement in pension management (INVOL):
None Slight Moderate Heavy
Pension management experience (EXPER):
None Less than 1 year 1 to 5 years More than 5 years
Government employment (EMPLOY):
Less than 1 year 1 to 5 years 6 to 10 years
More than 10 years
Actuarial experience (ACTU):
None
Less than 1 year 1 to 5 years More than 5 years
45 20 15 38
38.14 16.95 12.71 32.20
54 2 27 38
45.76 1.70
22.88 29.66
5 18 29 66
4.24 15.25 24.58 55.93
02 4 4 8
86.44 3.39 3.39 6.78

91
questionnaire indicated at least some Interest in pension accounting
matters.
Only seven percent of all respondents claimed to have any actuarial
experience; however, the questionnaire did not define the term
"actuarial experience." Table 2 indicates that most respondents inter
preted the question to mean "experience as an actuary" and thus replied
"none." Further, a chi-square test showed no significant (alpha = .71)
difference in actuarial knowledge (see Table 3) between respondents
when they were classified according to their claimed actuarial
experience. Accordingly, few—if any—of the respondents appeared to
have any actuarial training.
Actuarial Knowledge of Respondents
The questionnaire included an exercise that indicated the
respondent's level of knowledge regarding the effects of actuarial
assumptions on reported obligations for PERS benefits. The exercise
listed two levels for each of three actuarial variables and Instructed
the respondent to Indicate which level of each variable would result in
the largest estimate of the reported benefits liability of a PERS. The
following actuarial variables were listed: (1) assumed rate of return on
plan assets, (2) assumed rate of salary Increase, and (3) actuarial cost
method used to calculate reported liabilities. Table 3 presents the
results of this exercise. The respondents appeared to best understand
the impact on reported pension obligations of projected salary Increases
and least recognize the impact of the actuarial cost method used for
reporting purposes. This hypothesis was tested:

Table 3
Respondents' Knowledge of the Effects of Selected Actuarial Variables on the
Reported Benefits Obligation of a PERS
92
Number of Incorrect Responses
Number of Correct Responses
Correct Response Percentage
H : p=.5 p(alpha)
Actuarial variables:
Rate of return assumption: 28 67 70.53 .0001
Assumed salary Increase: 13 82 86.32 .0001
Actuarial cost method used to calculate reported PERS liabilities: 57 38 40.00 .02
Distribution of Correct Responses
Zero correct
One correct
Two correct
Three correct
15
41
30
93
H^l: The percentage of respondents that properly assess the
effects of each variable is not significantly different from the
expected level of random occurrence; i.e..
Probability (correct response) = .5 .
The results of this test indicated that none of the response distribu
tions for the variables was consistent with random responses. In
addition, a chi-square goodness-of-fit test (Mansfield, 1980) was con
ducted to determine if the observed distribution of correct responses
conforms to a binomial distribution with a .50 probability of correct
responses. This test rejected (alpha = .001) the null hypothesis that
the discrepancy between the actual and theoretical frequency distribu
tions was due to chance. Thus, it appears that a significant percentage
of respondents do understand the effects of the assumed rates of (1)
salary increase and (2) return on plan assets on reported pension obli
gations, but a significant percentage do not recognize the effects of
the actuarial cost methods listed.
Judgments About PERS
Each respondent was requested (through Part A of the questionnaire)
to make four judgments about a fictitious PERS. These judgments con
cerned (1) the level of funding of accumulated/projected plan benefits—
question 1, (2) the investment performance of PERS management—question
2, (3) the plan's benefit level—question 3, and (4) the probability of
participants receiving benefits upon retirement—question 4. The
respondents were instructed to base their judgments on the financial
94
statements Included with the questionnaire. Although three versions of
the financial statements were prepared, each version reported on the
same PERS in accordance with the provisions of either SFAS 35, NCGAS 6,
or NCGAS 6 with the required statistical data omitted. Accordingly,
there should be no between group differences in the responses to each of
the questions if the respondents' judgments are transparent to format or
benefit-liability measure differences (i.e., the respondents are not
fixated). Null hypothesis 2 states this expectation:
HQ2: There is no difference in information content between finan
cial statements prepared in accordance with either SFAS 35, NCGAS
6, or NCGAS 6 without the statistical data.
If this hypothesis is rejected, some form of respondent fixation is
indicated.
Table 4 presents the mean response and variance for each question
in Part A. These statistics Indicate an apparent (1) mean response
difference to the first and last questions between the NCGAS 6 groups
and the SFAS 35 group, and (2) mean response difference to question 2
between the NCGAS 6 groups. A test for the significance of these
differences was conducted using the SAS GLM (general linear model)
procedure. The following model was tested:
Ql Q2 Q3 Q4 = FORMAT ,
where (1) variables Ql to Q4 represent responses to questions one
through four, respectively, and (2) FORMAT refers to the financial
statement version that the respondent received. By using a multivariate
analysis of variance model, the effects of dependence between
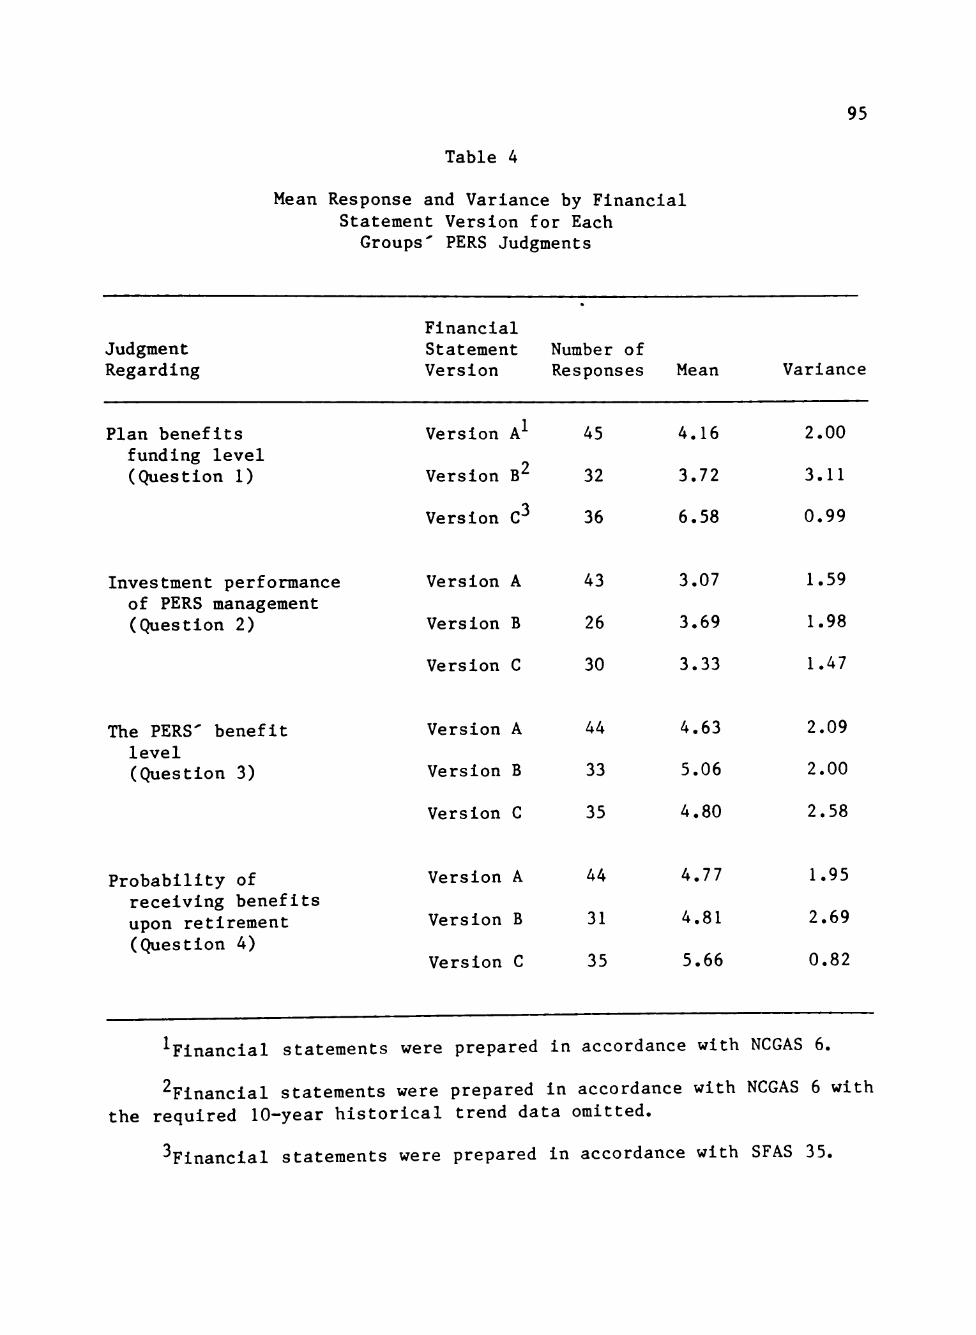
Table 4
Mean Response and Variance by Financial Statement Version for Each Groups' PERS Judgments
95
Judgment Regarding
Plan benefits funding level (Question 1)
Investment performance of PERS management (Question 2)
The PERS' benefit level (Question 3)
Probability of receiving benefits upon retirement (C^estion 4)
Financial Statement Version
Version A
Version B^
Version C"
Version A
Version B
Version C
Version A
Version B
Version C
Version A
Version B
Version C
•
Number of Responses
45
32
36
43
26
30
44
33
35
44
31
35
Mean
4.16
3.72
6.58
3.07
3.69
3.33
4.63
5.06
4.80
4.77
4.81
5.66
Variance
2.00
3.11
0.99
1.59
1.98
1.47
2.09
2.00
2.58
1.95
2.69
0.82
^Financial statements were prepared in accordance with NCGAS 6.
^Financial statements were prepared in accordance with NCGAS 6 with the required 10-year historical trend data omitted.
•^Financial statements were prepared in accordance with SFAS 35.
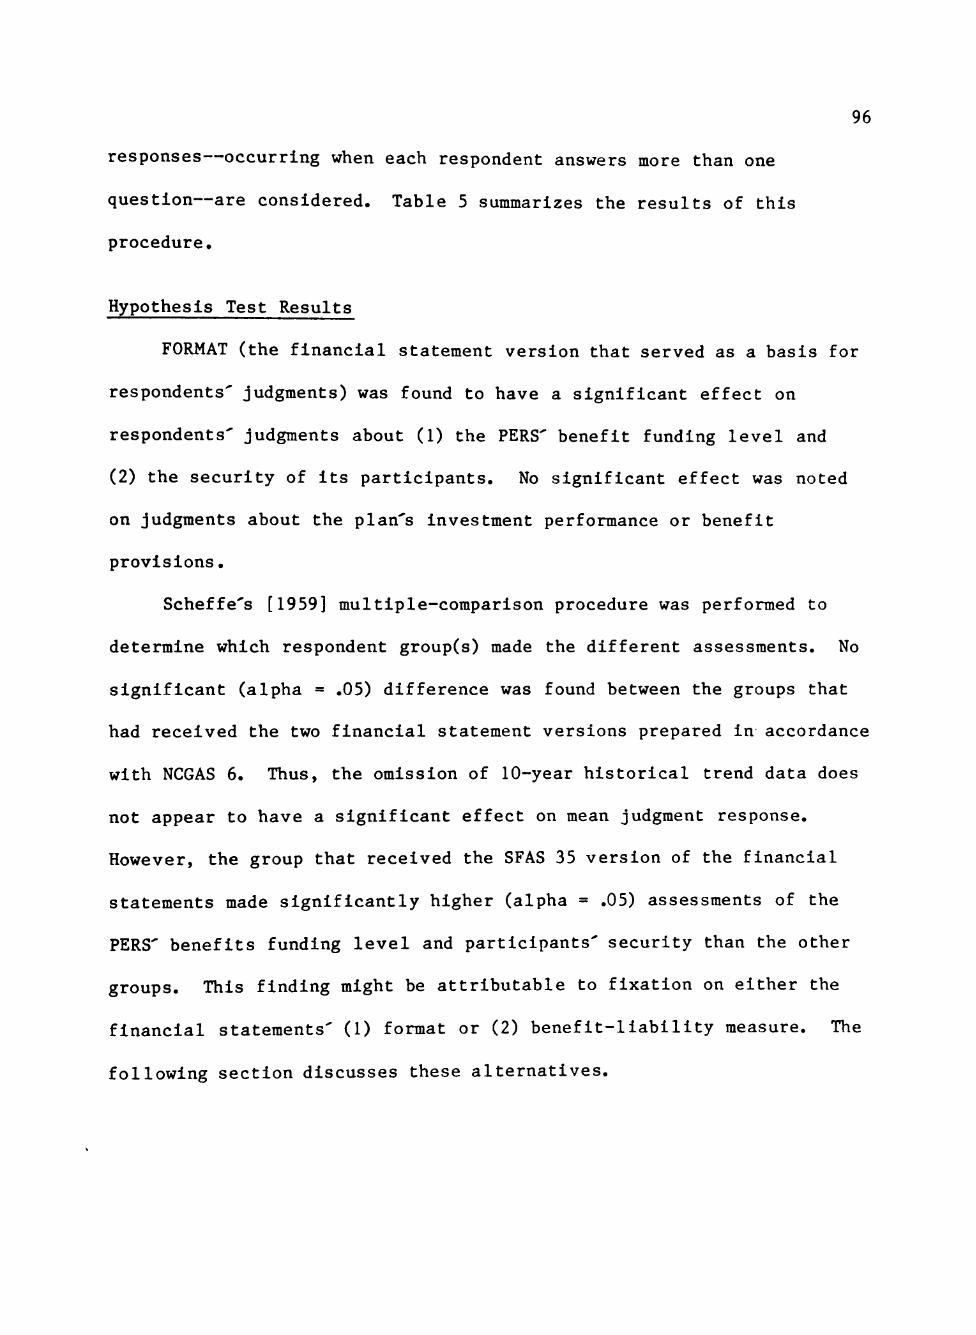
96
responses—occurring when each respondent answers more than one
question—are considered. Table 5 summarizes the results of this
procedure.
Hypothesis Test Results
FORMAT (the financial statement version that served as a basis for
respondents' judgments) was found to have a significant effect on
respondents' judgments about (1) the PERS' benefit funding level and
(2) the security of its participants. No significant effect was noted
on judgments about the plan's investment performance or benefit
provisions.
Scheffe's [1959] multiple-comparison procedure was performed to
determine which respondent group(s) made the different assessments. No
significant (alpha = .05) difference was found between the groups that
had received the two financial statement versions prepared in accordance
with NCGAS 6. Thus, the omission of 10-year historical trend data does
not appear to have a significant effect on mean judgment response.
However, the group that received the SFAS 35 version of the financial
statements made significantly higher (alpha = .05) assessments of the
PERS' benefits funding level and participants' security than the other
groups. This finding might be attributable to fixation on either the
financial statements' (1) format or (2) benefit-liability measure. The
following section discusses these alternatives.
97
Table 5
Effects of Financial Statement Format on the Responses to (^estlons 1 through 4
QUESTION 1 2 3 4
Projected Invest- Plan Security Benefits ment Per- Benefit of Funding formance Provision Employee
F-Value^
Source of variation:
FORMAT 39.80 2.18 0.90 4.71
Probability that the observed variation was due to chance:
PR > F .0001 .1188 .4117 .0111
^The F-Value was determined using the Type III (or partial) sums of squares which have these properties: (1) the hypothesis for an effect does not involve parameters of other effects except for containing effects (which it must involve to be estimable), (2) the hypotheses to be tested are Invariant to the ordering of effects in the model, and (3) the hypotheses to be tested are not functions of cell counts.

98
Discussion of Results
NCGAS 6 requires that PERS financial statements Include (1) a
balance sheet, (2) a statement of revenues, expenses, and changes in
fund balance, and (3) a statement of changes in financial position. The
balance sheet presents totals for net assets available for benefits and
total fund balance. Since the fund balance section includes the total
actuarial present value of credited projected benefits (the PERS'
benefit liability), any excess of this liability over available assets
is reported in the fund balance section as the unfunded actuarial
present value of credited projected benefits. Thus, plan "underfundlng"
(or "overfunding") is called to the attention of the financial statement
reader.
On the other hand, SFAS 35 requires that PERS financial statements
Include (1) a statement of net assets available for benefits, (2) a
statement of changes in net assets available for benefits, (3) a state
ment of accumulated plan benefits, and (4) a statement of changes in
accumulated plan benefits. Under this approach to PERS reporting, the
financial statement user must compare the "bottom line" from the state
ments of available assets and accumulated plan benefits to determine the
plan's funding status. Respondents' failure to make this comparison may
account for the differences found in their judgments when the plan's
funding status was not directly reported.
^Alternatively, SFAS 35 permits the inclusion of (1) a statement of accumulated plan benefits and net assets available for benefits, and (2) a statement of changes in accumulated plan benefits and net assets available for benefits. The "SFAS 35" statements furnished to respondents did not follow this alternative.
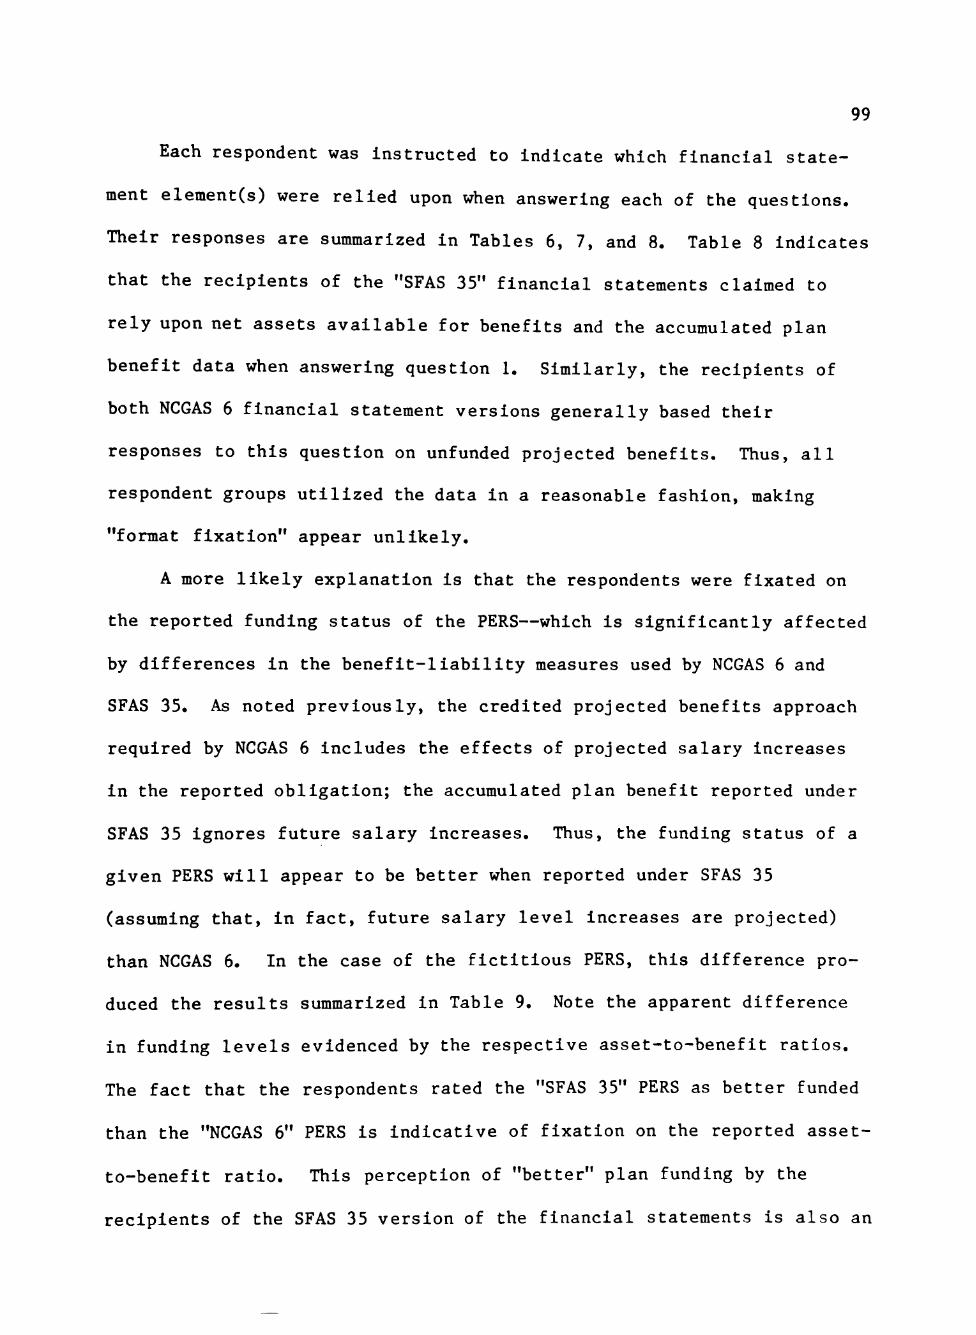
99
Each respondent was instructed to indicate which financial state
ment element(s) were relied upon when answering each of the questions.
Their responses are summarized in Tables 6, 7, and 8. Table 8 indicates
that the recipients of the "SFAS 35" financial statements claimed to
rely upon net assets available for benefits and the accumulated plan
benefit data when answering question 1. Similarly, the recipients of
both NCGAS 6 financial statement versions generally based their
responses to this question on unfunded projected benefits. Thus, all
respondent groups utilized the data in a reasonable fashion, making
"format fixation" appear unlikely.
A more likely explanation is that the respondents were fixated on
the reported funding status of the PERS—which is significantly affected
by differences in the benefit-liability measures used by NCGAS 6 and
SFAS 35. As noted previously, the credited projected benefits approach
required by NCGAS 6 includes the effects of projected salary increases
in the reported obligation; the accumulated plan benefit reported under
SFAS 35 ignores future salary Increases. Thus, the funding status of a
given PERS will appear to be better when reported under SFAS 35
(assuming that, in fact, future salary level increases are projected)
than NCGAS 6. In the case of the fictitious PERS, this difference pro
duced the results summarized in Table 9. Note the apparent difference
in funding levels evidenced by the respective asset-to-benefit ratios.
The fact that the respondents rated the "SFAS 35" PERS as better funded
than the "NCGAS 6" PERS is indicative of fixation on the reported asset-
to-benefit ratio. This perception of "better" plan funding by the
recipients of the SFAS 35 version of the financial statements is also an
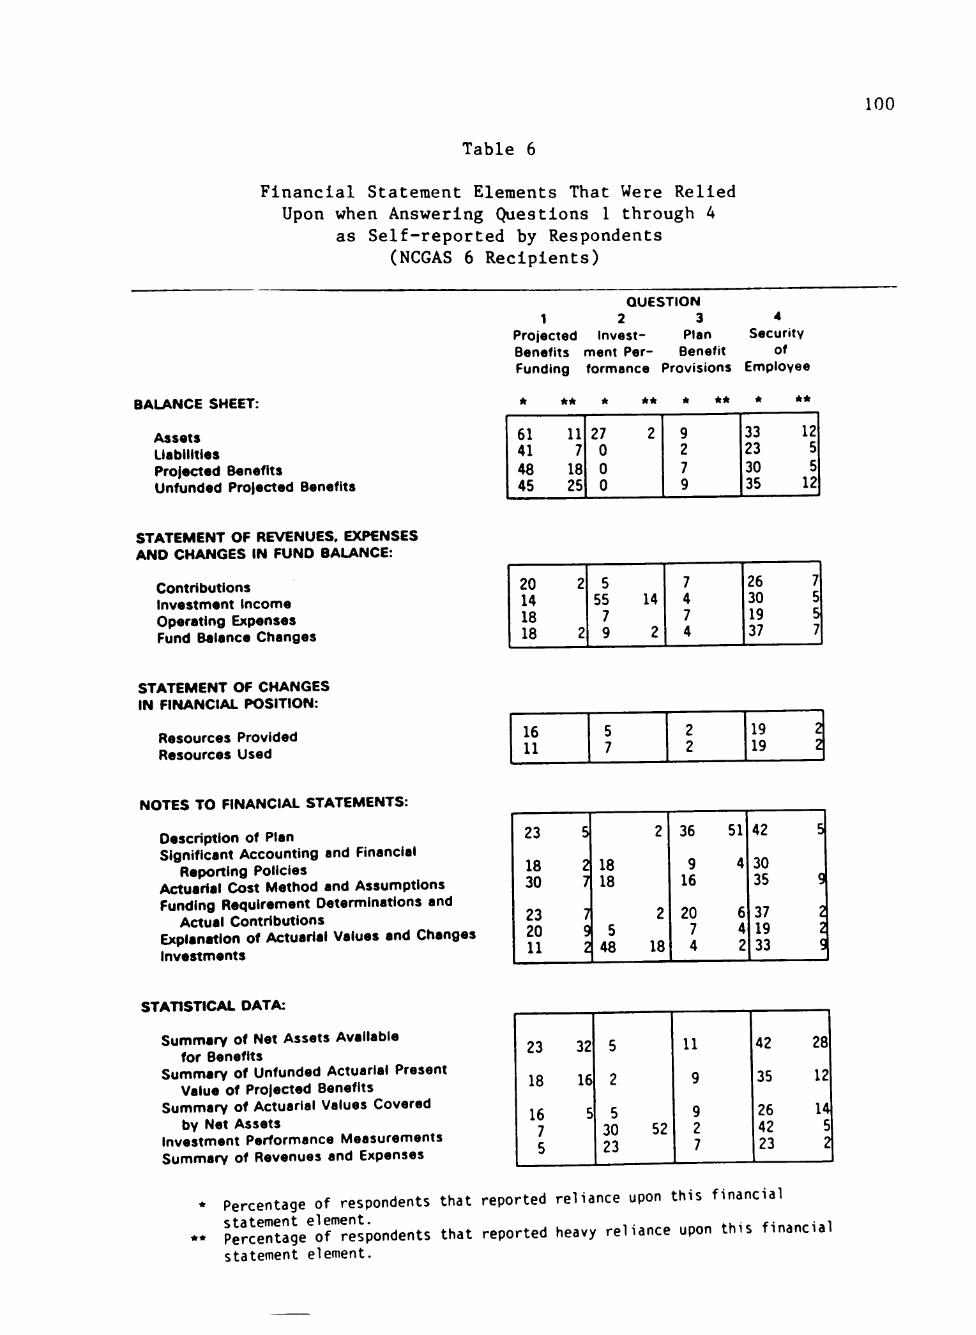
100
Table 6
Financial Statement Elements That Were Relied Upon when Answering (Questions 1 through 4
as Self-reported by Respondents (NCGAS 6 Recipients)
QUESTION 1 2 3 4
Projected Invest- Plan Security Benefits ment Per- Benefit of Funding formance Provisions Employee
BALANCE SHEET:
Assets Liabilities Projected Benefits Unfunded Projected Benefits
*
61 41 48 45
**
11 7 18 25
*
27 0 0 0
**
2
* **
9 2 7 9
*
33 23 30 35
A*
12 5 5 12
STATEMENT OF REVENUES. EXPENSES AND CHANGES IN FUND BALANCE:
Contributions Investment Income Operating Expenses Fund Balance Changes
20 14 18 18
2
2
5 55 7 9
14
2
7 4 7 4
26 30 19 37
7 b 5 7
STATEMENT OF CHANGES IN FINANCIAL POSITION:
Resources Provided Resources Used
16 11
5 7
2 2
19 19
2 2
NOTES TO FINANCIAL STATEMENTS:
Description of Plan Significant Accounting and Financial
Reporting Policies Actuarial Cost Method and Assumptions Funding Requirement Determinations and
Actual Contributions Explanation of Actuarial Values and Changes Investments
23
18 30
23 20 11
5
2 7
7 ^
2
18 18
5 48
2
2
36
9 16
20 7
18 4
51
4
6 4 2
42
30 35
37 19 33
5
9
2 2 '
STATISTICAL DATA:
Summary of Net Assets Available for Benefits
Summary of Unfunded Actuarial Present Value of Projected Benefits
Summary of Actuarial Values Covered by Net Assets
Investment Performance Measurements Summary of Revenues and Expenses
23
18
16 7 5
32
16
5
5
2
5 30 23
52
11
9
9 2 7
42
35
26 42 23
28
12
14 5 2
* Percentage of respondents that reported reliance upon this financial
- Percertagelrrespondents that reported heavy reliance upon this financial statement element.
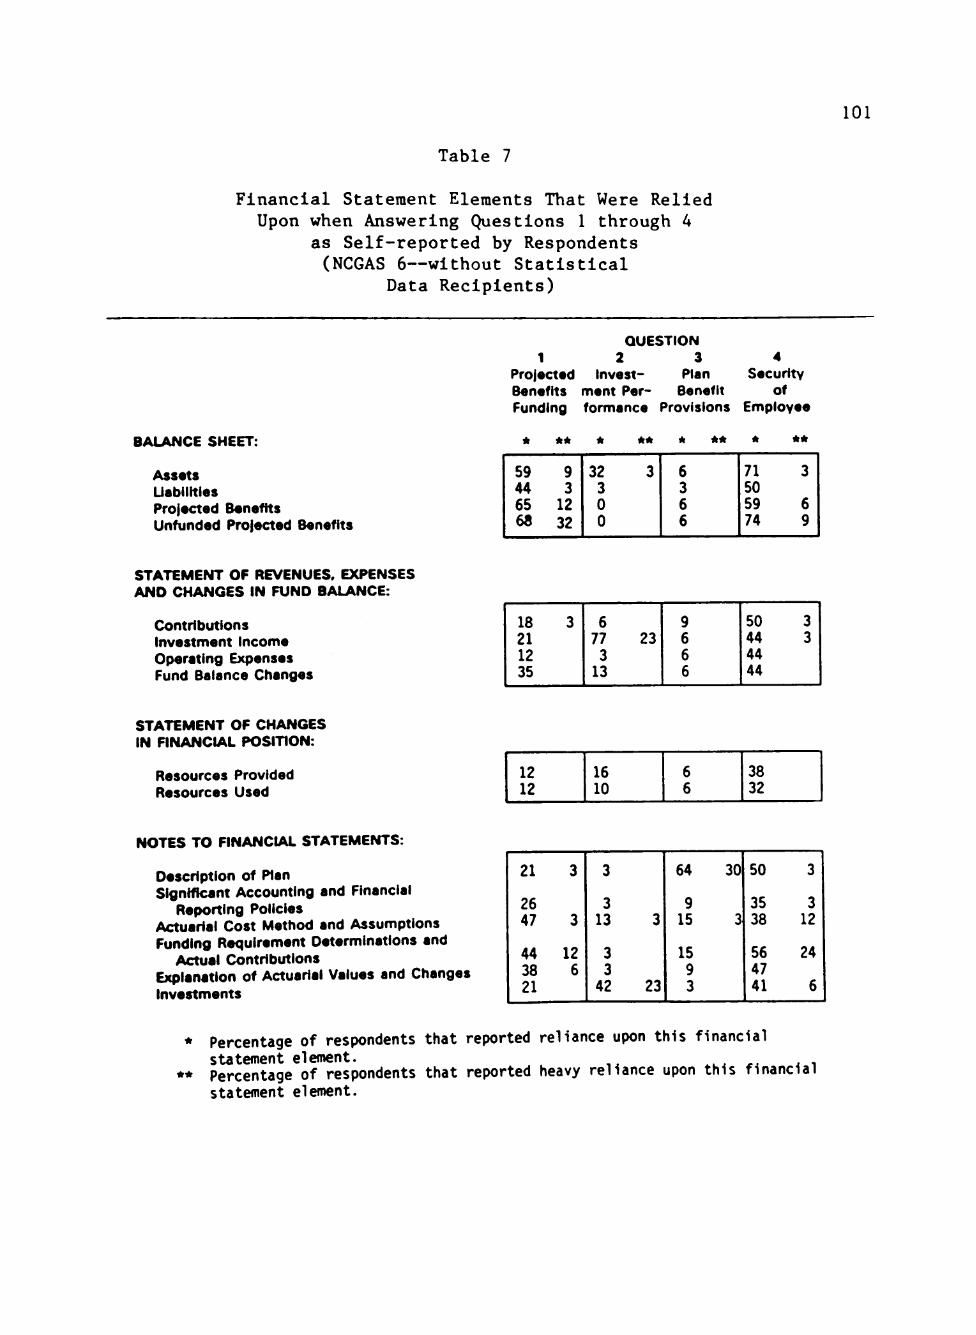
101
Table 7
Financial Statement Elements That Were Relied Upon when Answering Questions 1 through 4
as Self-reported by Respondents (NCGAS 6—without Statistical
Data Recipients)
BALANCE SHEET:
Assets Uabilitles Projected Benefits Unfunded Projected Benefits
QUESTION 1 2 3 4
Projected Invest- Plan Security Benefits ment Per- Benefit of Funding formance Provisions Employee
* * * * * * * *
59 44 65 68
9 3 12 32
32 3 3 0 0
6 3 6 6
71 50 59 74
3
6 9
STATEMENT OF REVENUES, EXPENSES AND CHANGES IN FUND BALANCE:
Contributions Investment Income Operating Expenses Fund Balance Changes
18 3 21 12 35
6 77 3 13
23 9 6 6 6
50 44 44 44
3 3
STATEMENT OF CHANGES IN FINANCIAL POSITION:
Resources Provided Resources Used
12 12
16 10
6 6
00 C
M
CO C
O
NOTES TO FINANCIAL STATEMENTS:
Description of Plan Significant Accounting and Financial
Reporting Policies Actuarial Cost Method and Assumptions Funding Requirement Determinations and
Actual Contributions Explanation of Actuarial Values and Changes Investments
21
26 47
44 38 21
3
3
12 6
3
3 13
3 3 42
3
23
64
9 15
15 9 3
30
3
50
35 38
56 47 41
3
3 12
24
6
* Percentage of respondents that reported reliance upon this financial statement element. .... x.. ^ i
** Percentage of respondents that reported heavy reliance upon this financial statement element.
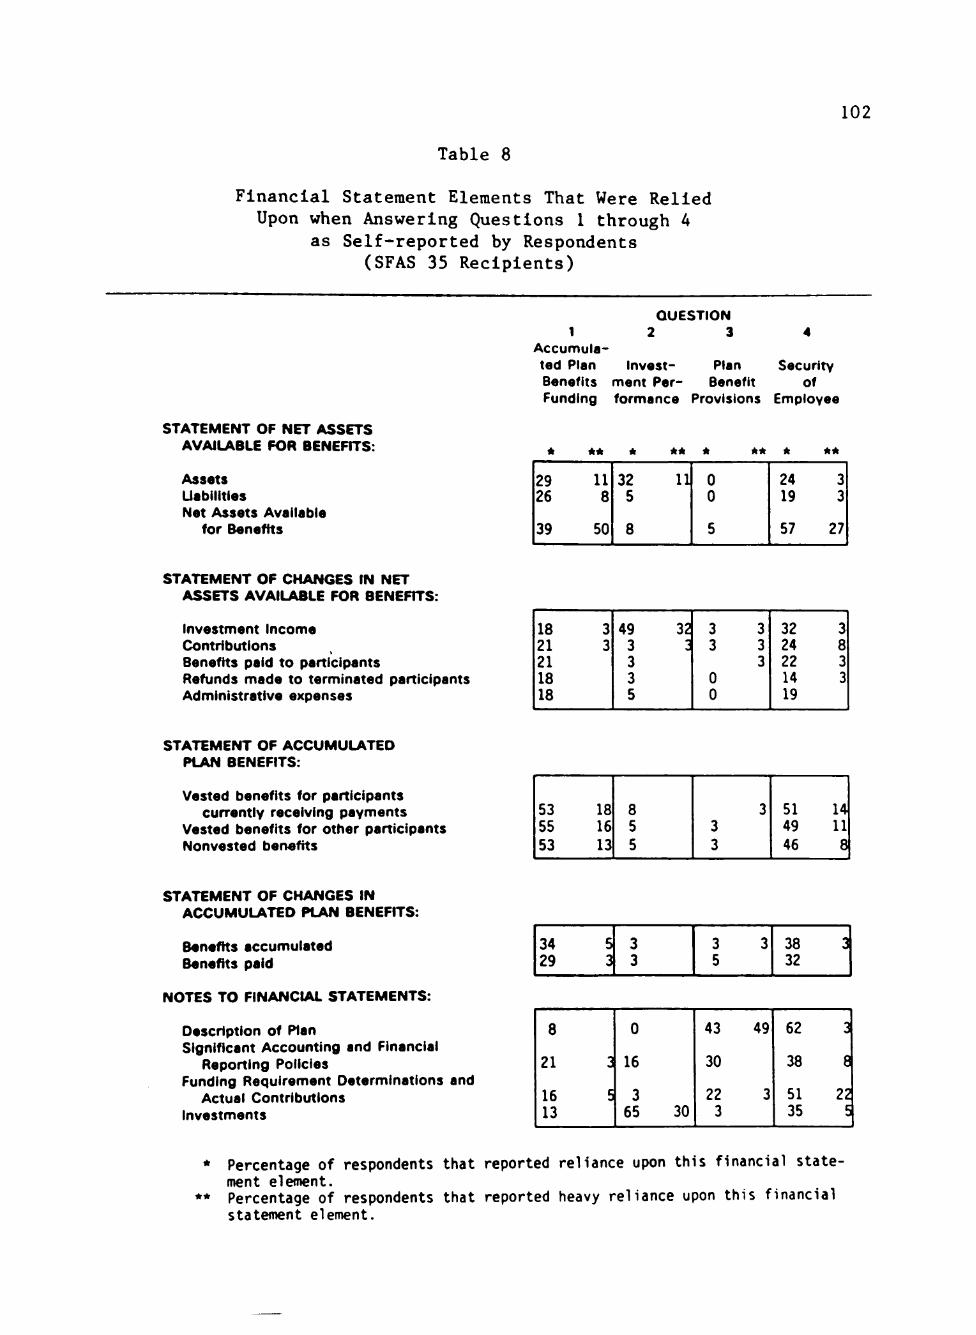
Table 8
Financial Statement Elements That Were Relied Upon when Answering Questions 1 through 4
as Self-reported by Respondents (SFAS 35 Recipients)
102
STATEMENT OF NET ASSETS AVAILABLE FOR BENEFITS:
Assets Uabilitles Net Assets Available
for Benefits
QUESTION 1 2 3 4
Accumulated Plan Invest- Plan Security Benefits ment Per- Benefit of Funding formance Provisions Employee
*
29 26
39
**
11 8
50
*
32 5
8
**
11
* **
0 0
5
*
24 19
57
**
3 3
27
STATEMENT OF CHANGES IN NET ASSETS AVAILABLE FOR BENEFITS:
Investment Income Contributions Benefits paid to participants Refunds made to terminated participants Administrative expenses
18 21 21 18 18
3 3 49 3 3 3 5
32 3 3
0 0
3 3 3
32 24 22 14 19
3 8 3 3
STATEMENT OF ACCUMULATED PLAN BENEFITS:
Vested benefits for participants currently receiving payments
Vested benefits for other participants Nonvested benefits
53 55 53
18 16 13
8 5 5
3 3 3
51 49 46
14 11 8
STATEMENT OF CHANGES IN ACCUMULATED PLAN BENEFITS:
Benefits accumulated Benefits paid
NOTES TO FINANCIAL STATEMENTS:
Description of Plan Significant Accounting and Financial
Reporting Policies Funding Requirement Determinations and
Actual Contributions Investments
34 5 29 3
CO
C
O
3 3 5
38 3 32
8
21 3
16 5 13
0
16
3 65 30
43
30
22 3
49
3
62
38
51 35
3
8
22 5
* Percentage of respondents that reported reliance upon this financial statement element.
* * Percentage of respondents that reported heavy reliance upon this financial statement element.
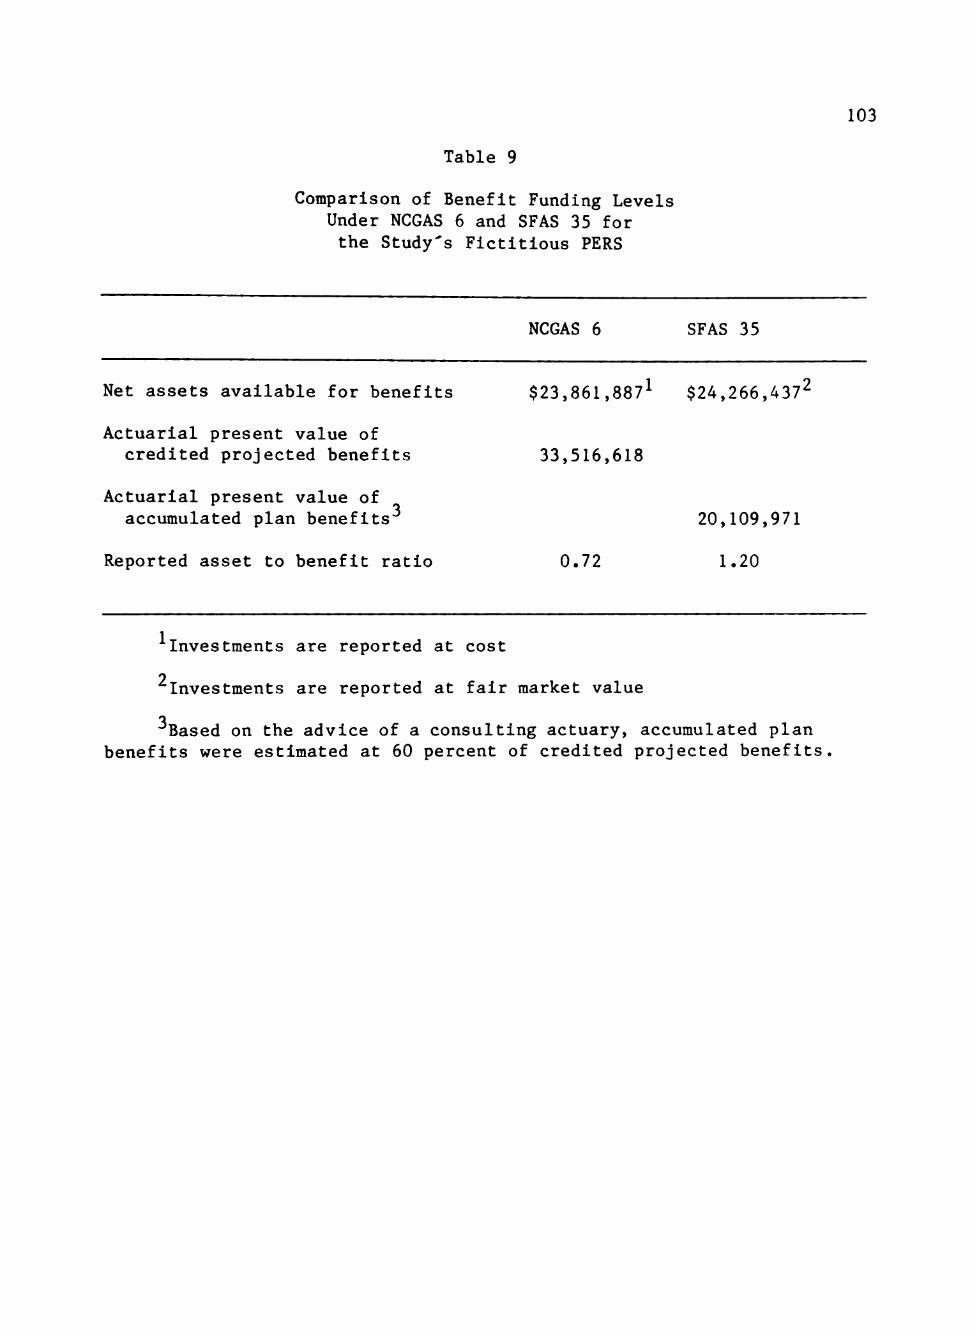
Table 9
Comparison of Benefit Funding Levels Under NCGAS 6 and SFAS 35 for the Study's Fictitious PERS
103
NCGAS 6 SFAS 35
Net assets available for benefits
Actuarial present value of credited projected benefits
$23,861,887^ $24,266,437^
33,516,618
Actuarial present value of accumulated plan benefits" 20,109,971
Reported asset to benefit ratio 0.72 1.20
1 Investments are reported at cost
Investments are reported at fair market value
o
Based on the advice of a consulting actuary, accumulated plan benefits were estimated at 60 percent of credited projected benefits.
104
explanation for the perceived higher employee security as evidenced by
the response to question 4.
A comparison of the responses to questions 1 and 4 is also inter
esting since the two NCGAS 6 groups rated benefits security higher than
the funding level, probably in recognition of the fact that municipal
pension default has been rare and that pension benefits receive
preferred creditor status [Inman, 1982]. In contrast, the SFAS 35 group
rated benefits security lower than their assessment of plan funding.
This assessment seems to incorporate their lower rating of the PERS'
investment performance (refer to Table 4). Indeed, the responses to
these two questions are significantly (alpha = .01) positively
correlated. Thus, benefits security is perceived as a function of more
than just a plan's funding level. This conclusion is supported by the
variety of financial statement elements that respondents claimed to have
considered when making this judgment (refer to Tables 6, 7, and 8).
Evidence of Fixation
Actuarial assumptions may affect the actuarial present value of
credited projected benefits (APVCPB) reported by a PERS. By making
different assumptions, different APVCPBs may be reported for the same
plan. In turn, the reported APVCPB affects the PERS' asset-to-benefit
ratio; thus, different asset-to-benefit ratios may be reported for the
same plan. Accounting standards now permit both the rate of return on
plan assets and annual employee salary Increases to be estimated by each
plan's actuary—and these estimates vary widely among PERS. If a PERS
financial statement user is fixated on the reported asset-to-benefit
105
ratio, his assessment of the level of plan funding will be determined by
the reported ratio rather than be affected by the factors underlying the
ratio.
An exercise was included in the questionnaire to determine which
cues were relied upon by PERS financial statement users when making
funding level determinations. An analysis-of-variance (ANOVA) approach
was used to discover and describe cue utilization. If judgment stimuli
(cues) are regarded as categorical treatment factors rather than as
continuous random variables, and if the judgments made to the cues are
considered as dependent variables, then the ANOVA technique can be
applied to the study of judgment (Hoffman, Slovic, and Rorer, 1968).
The application is fairly simple and direct: multidimensional judgment
stimuli are prepared by constructing all possible combinations of the
cue levels in a completely crossed factorial design. The ANOVA model
was used because it provides a convenient way to calculate tests of
significance and because of its potential for describing both the linear
and nonlinear aspects of the judgment process.
The following cues were varied in the exercise: (1) market value of
available assets (MVA), (2) assumed salary increase (SAL), and (3)
assumed rate of return (RET). The exercise also listed the APVCPB for
each case. This factor was not considered a cue since it was a function
of the SAL and RET cues. Two levels of each cue were utilized, which
resulted in a 2^ complete factorial arrangement of case patterns.
Respondents were told (1) that each case listed selected items that
appeared in the financial statements of eight PERS, (2) that—except for
the differences noted in the cases—each PERS reported the same

106 •a
information , and (3) that actuarial assumptions may affect the reported
APVCPB. They were then instructed to compare the benefits funding level
reported in the eight cases with that of the fictitious PERS. The
judgments were made on a 7-point scale ranging from 1 (lower funding
level) to 7 (higher funding level). Respondents were instructed to
select the midpoint of the scale when the funding level of the case was
judged to be the same as that of the fictitious PERS. One of the cases
was a duplicate of the fictitious PERS to enable the elimination of
random responses or those invalidated by failure of the respondent to
follow instructions. Of the 115 questionnaires returned, 95 were
usable; the unusable questionnaires were attributable to (1) four
respondents that did not detect the duplicate case, (2) one respondent
that had a random decision model—but did correctly identify the
duplicate case (the modeling procedure will be explained later), and
(3) 15 respondents that did not complete the exercise.
Table 10 lists the main effects and the Interactions for the model.
The first main effect listed in the table—that for the response
variance attributable to respondents—was statistically significant.
This indicates that the respondents differed in their mean judgments
across the eight cue patterns. The significant main effects for MVA,
SAL, and RET indicate that, when data were averaged over respondents.
^The task of interest (evaluating PERS' funding levels) was characterized by the availability of a considerable amount of data. Modeling all of the potential cues in a stable model would have required a prohibitively large number of cases. Accordingly, a limited number of cues were presented and manipulated. Task realism was attained by presenting the cases in the context of extensive background data (the fictitious PERS' report) which was held constant across all cases.
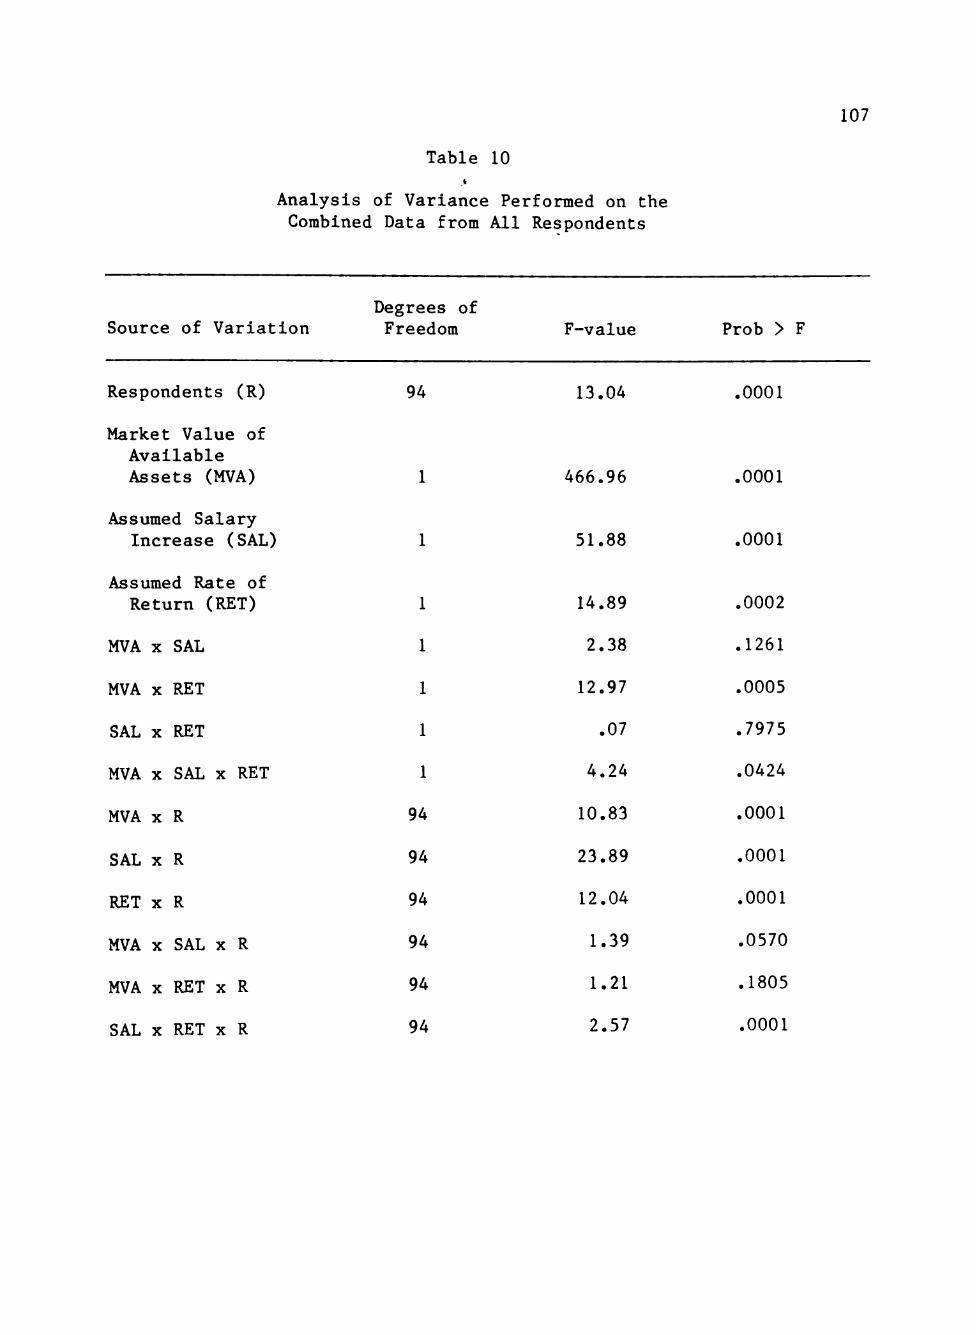
Table 10 I
Analysis of Variance Performed on the Combined Data from All Respondents
107
Source of Variation Degrees of Freedom F-value Prob > F
Respondents (R)
Market Value of Available Assets (MVA)
Assumed Salary Increase (SAL)
Assumed Rate of Return (RET)
MVA X SAL
MVA X RET
SAL X RET
MVA X SAL X RET
MVA X R
SAL X R
RET X R
MVA X SAL X R
MVA X RET X R
SAL X RET X R
94 13.04 .0001
94
94
94
94
94
94
466.96
51.88
.0001
.0001
14.89
2.38
12.97
.07
4.24
10.83
23.89
12.04
1.39
1.21
2.57
.0002
.1261
.0005
.7975
.0424
.0001
.0001
.0001
.0570
.1805
.0001
108
the mean judgments varied systematically with the levels of these cues.
The significant Interactions between respondents and the individual cues
(e.g., MVA X R) indicates that the respondents differed among themselves
in the extent to which they relied on the cues. This difference is
attributable both to direction and degree. For example, some respon
dents believed that—all other things being equal—the cases that
reported lower asset levels were better funded than those reporting the
higher level of assets. The Interactions between (1) MVA and RET, and
(2) MVA, SAL, and RET indicate that these cue sets were employed
configurally by the group as a whole. The three-way interactions that
include respondents as one of the factors tell whether there were
individual differences in the conflgural use of a pair of cues.
Discussion of Results
Using heuristics presented by Wlnklevoss [1977], four reported
APVCPBs (one for each combination of SAL and RET) were calculated for
the fictitious PERS. The same credited projected benefit results in
various present values when different assumed rates of return and salary
increase are employed in the calculations.
Each PERS has a projected benefit obligation that is a function of
the plan's (1) benefit provisions, (2) unique participant demographic
characteristics, and (3) assumed rate of salary increase. In turn, the
APVCPB is a function of (1) the plan's projected benefit obligation and
assumed rate of return, and (2) participants' credited service. Because
of these relationships, the effect on the APVCPB of, for example, a one
percent change in the rate of return assumption is not constant for all
109
PERS. However, such effects can be estimated by modeling hypothetical
pension plan populations and benefit packages. Estimates of the effect
on the APVCPB of changes in the assumed rates of return and salary
Increase that were developed by Wlnklevoss were used to calculate the
four equivalent APVCPBs presented in the questionnaire's cases, which
were then paired with two levels of available plan assets to make up the
data in the eight cases.
Since the APVCPBs were all equivalent, the only real difference in
case funding levels was attributable to the two levels of available
assets. Recall that one of the cases was a duplicate of the fictitious
PERS. Accordingly, respondents who recognized the APVCPBs as equivalent
(i.e., were not fixated on the reported values) assessed the funding
level of the duplicate case—and the other three cases with the same
level of assets—to be the same as that of the fictitious PERS. In
turn, they judged the funding level of the remaining cases to be equiva
lent but lower than the fictitious PERS (these cases had the lower
reported asset level). If all participants had responded in this
fashion, the only significant main effect for the combined analysis
would be attributable to changes in MVA. Further, none of the two-way
main effect interactions or their "with respondent" interactions should
be significant. Only the interaction MVA x R could legitimately assume
significance if the respondents differed in their judgments regarding
what scale value to assign to the "lower asset" cases.
As Table 10 indicates, however, a significant number of respondents
did not make judgments in accordance with those judgments hypothesized
110
for non-fixated respondents. Thus, this hypothesis was rejected:
HQ3: Respondents are not functionally fixated on the reported
asset-to-benefit ratio and will properly recognize the effects on
this ratio of changes in the rate of return on plan assets and
salary increase assumptions.
Some care is required in interpreting the significance levels
reported for the SAL and RET variables. A significant effect that is
attributable to one of these variables does not indicate that the
respondent considered the effect on plan funding of the variable;
rather, it indicates that the respondent was fixated on the asset-to-
benefit ratio and did not recognize that the variation in this ratio was
attributable to the variable. If the respondent had understood the role
of interest and salary assumptions in present value calculations, he or
she should have recognized that the reported APVCPBs were the same
credited projected benefit with different assumptions applied.
To determine if the results of the combined analysis were "biased"
by those respondents that had limited actuarial knowledge, the respon
dents were grouped according to their performance on the actuarial
knowledge exercise (see Table 3) and the analysis was repeated for each
group. As indicated by Table 11, respondents that did well on the
actuarial exercise (i.e., TOTAL = 3) basically relied on the same cues
as did the other respondents. Although some between group cue utiliza
tion differences were noted, they did not support the notion that more
knowledgeable persons were less fixated.
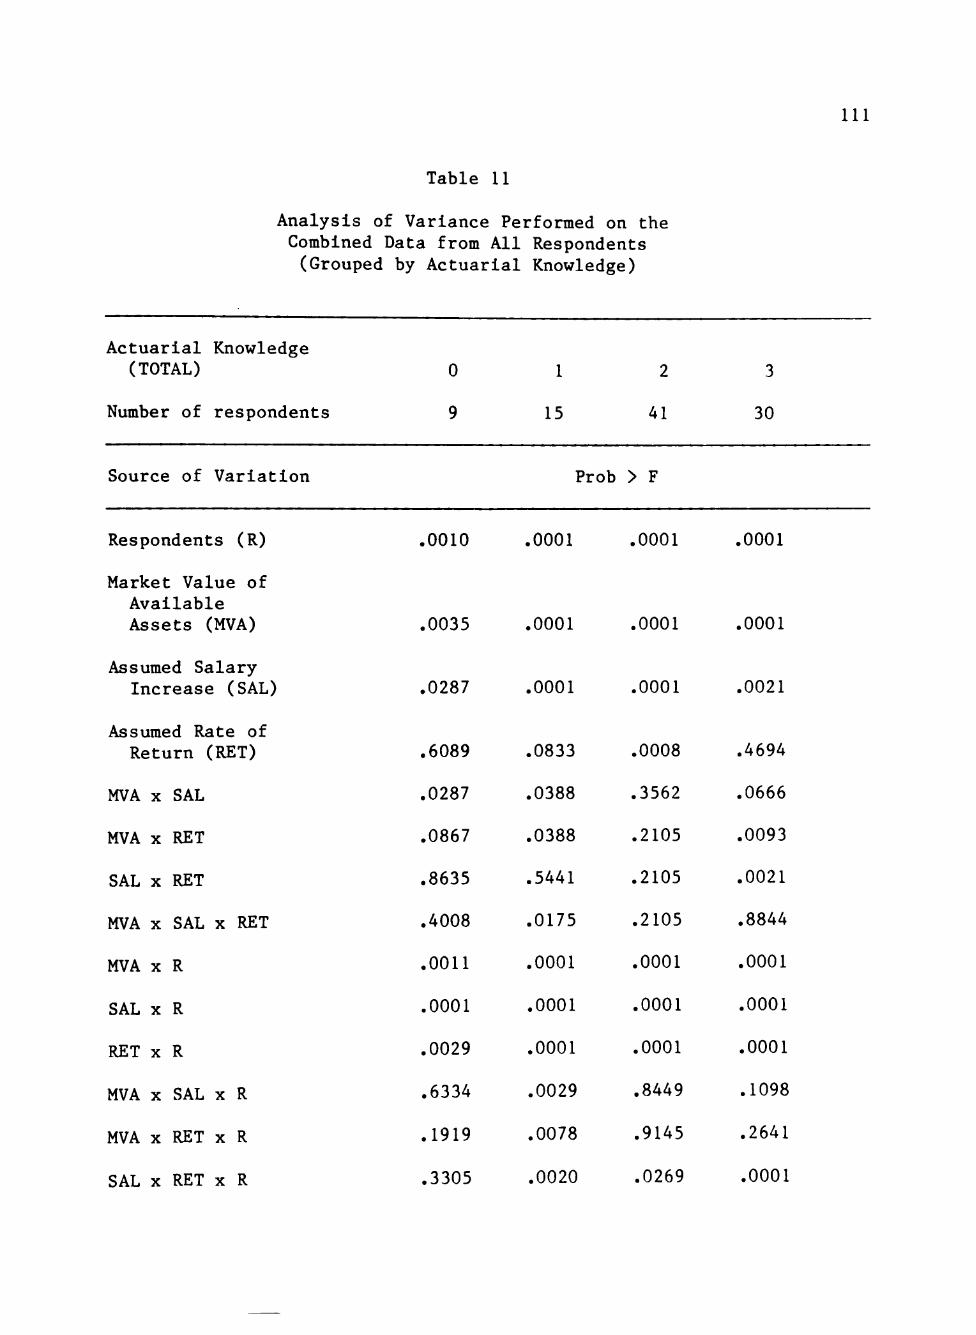
Table 11
Analysis of Variance Performed on the Combined Data from All Respondents (Grouped by Actuarial Knowledge)
111
Actuarial Knowledge (TOTAL)
Number of respondents
0
9
1 2
15 41
Prob > F
3
30
Source of Variation
Respondents (R) ,0010 .0001 .0001 .0001
Market Value of Available Assets (MVA) .0035 .0001 .0001 .0001
Assumed Salary Increase (SAL) .0287 .0001 .0001 .0021
Assumed Rate of Return (RET)
MVA X SAL
MVA X RET
SAL X RET
MVA X SAL X RET
MVA X R
SAL X R
RET X R
MVA X SAL X R
MVA X RET X R
SAL X RET X R
.6089
.0287
.0867
.8635
.4008
.0011
.0001
.0029
.6334
.1919
.3305
.0833
.0388
.0388
.5441
.0175
.0001
.0001
.0001
.0029
.0078
.0020
.0008
.3562
.2105
.2105
.2105
.0001
.0001
.0001
.8449
.9145
.0269
.4694
.0666
.0093
.0021
.8844
.0001
.0001
.0001
.1098
.2641
.0001
112
Cue Utilization Index
Within the framework of the ANOVA model, it is possible to
2 calculate an index (CP ) of the importance of Individual or patterned
use of a cue relative to the importance of other cues (Hayes, 1963).
The index Co provides an estimate of the proportion of the total
variation in a person's judgments that can be predicted from a knowledge
of the particular levels of a given cue or a pattern of cues. Its
interpretation is analogous to the Interpretation of the squared Pearson
correlation coefficient as a proportion of the variance explained.
2 Accordingly, the Co index makes possible the interpretation of the
effects of ANOVA variables in terms of degree, rather than in terms of
level of significance.
The following ANOVA model was calculated for each respondent using
the SAS ANOVA procedure:
Funding level comparison = MVA SAL RET MVA*SAL MVA*RET SAL*RET .
A 6o index was then computed for each respondent's utilization of each
cue by using the formula:
2 = (SS - df (MSE)) / (SST + MSE) , where
SS = ANOVA sum of squares for the cue,
df = degrees of freedom,
MSE = mean square error, and
SST = total sum of squares.
. 2 Table 12 presents the distribution of the individual Oj indices.
Although their judgment models differed considerably, the judges were
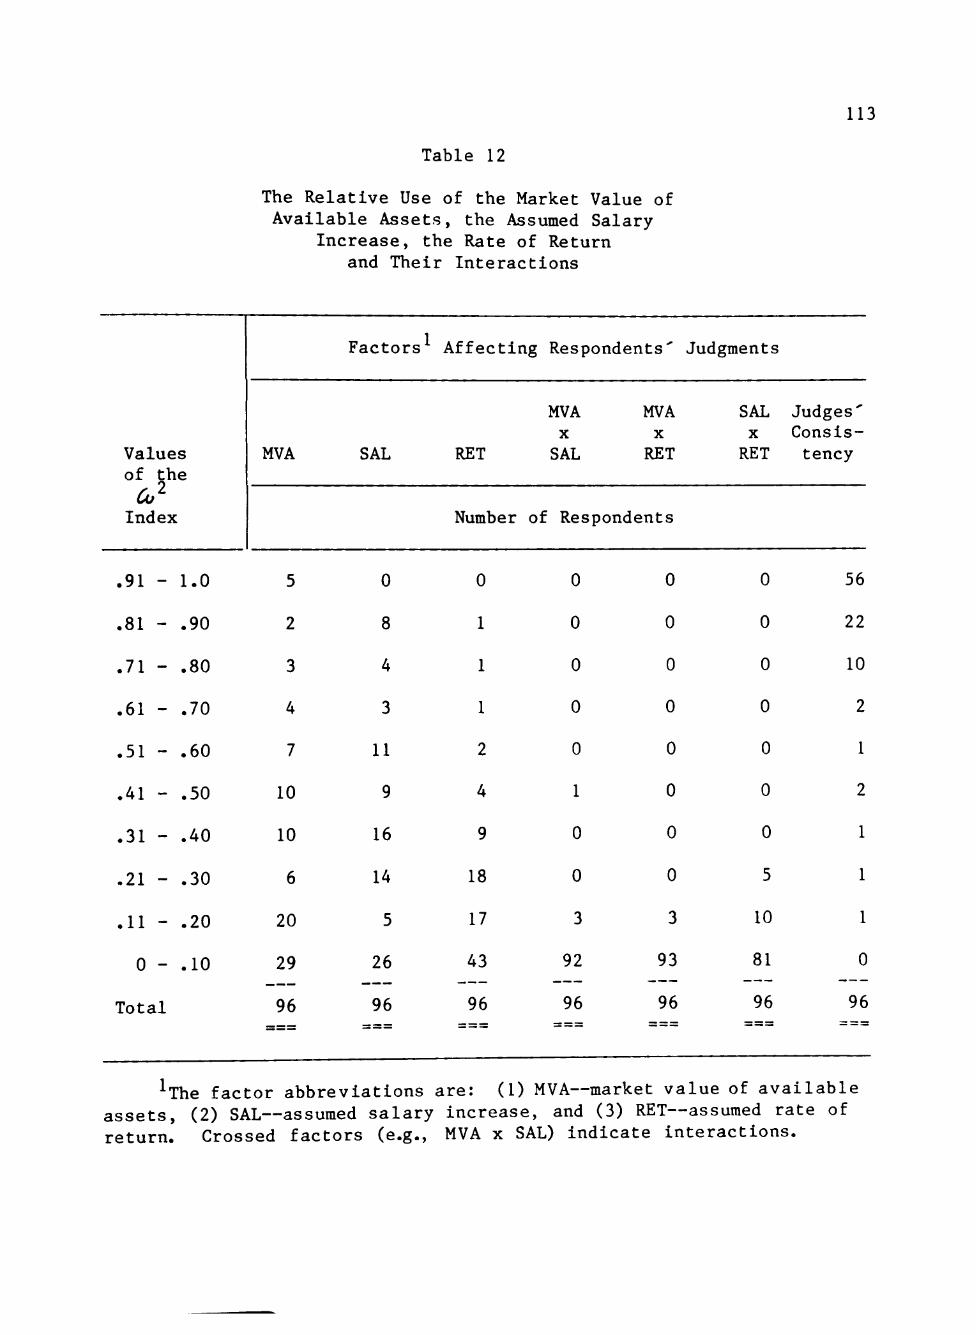
113
Table 12
The Relative Use of the Market Value of Available Assets, the Assumed Salary
Increase, the Rate of Return and Their Interactions
Values of the aP-Index
.91 -
.81 -
.71 -
.61 -
.51 -
.41 -
.31 -
.21 -
.11 -
0 -
Total
1.0
.90
.80
.70
.60
.50
.40
.30
.20
.10
MVA
5
2
3
4
7
10
10
6
20
29 ———
96 =^^
Factors
SAL
0
8
4
3
11
9
16
14
5
26
96 - " • ^ • ^
Affec
RET
ting
Number o1
0
1
1
1
2
4
9
18
17
43
96 ===
Respondents'
MVA X
SAL
I Res
0
0
0
0
0
1
0
0
3
92
96
pond
MVA X
RET
ents
0
0
0
0
0
0
0
0
3
93
96
Judgments
SAL X
RET
0
0
0
0
0
0
0
5
10
81
96
Judg< as' Consistency
56
22
10
2
1
2
1
1
1
0
96
The factor abbreviations are: (1) MVA—market value of available assets, (2) SAL—assumed salary Increase, and (3) RET—assumed rate of return. Crossed factors (e.g., MVA x SAL) indicate interactions.
114
quite consistent in applying their models. Over half of the respondents
were so consistent in their judgments that their models explained over
90 percent of the variance in their responses; only eight respondents'
models explained less than 70 percent of their response variance. Note
that persons making consistent judgments do not necessarily make
accurate judgments—of the 56 persons with an Cu^ in excess of .9, only
five were correct in their cue utilizations. The high degree of consis
tency noted does indicate, however, that the respondents took the task
seriously and carefully considered their responses.
Only five respondents correctly relied very heavily on MVA, while
29 respondents placed almost no reliance on this variable. On the other
hand, SAL—which should have had no effect on "correct" judgments—was
relied on to some extent by a sizable majority of the respondents.
Judgment Consensus
In a Proposed Statement of Governmental Accounting Standards,
"Disclosure of Defined Benefit Pension Information for Public Employee
Retirement Systems and State and Local Governmental Employers," [1985]
the GASB states:
After considering the needs of [PERS financial statement] users and related reporting objectives, the GASB has concluded that the primary objectives of pension disclosures are to provide persons familiar with financial matters with information needed to assess (a) the funding status of a PERS on a going-concern basis, (b) progress made in accumulating assets to pay benefits when due, and (c) whether employers are making actuarially determined contributions to plans.
The GASB believes that single-year financial statements alone (including notes) cannot provide sufficient information to accomplish these objectives. Historical trend information is also required. This Statement therefore also calls for disclosure of 10-year historical trend information [par. 6 and par. 7].
115
These paragraphs imply that PERS financial statement users will be able
to make "better" (i.e., more accurate) assessments of a PERS' condition
if they are furnished with trend data. The GASB, however, presents no
evidence to support this assertion.
A known criterion value must exist for judgment accuracy to be
directly assessed. In the case of a judgment that "a PERS is adequately
funded," judgment accuracy implies that the PERS is. Indeed, able to
make its benefits payments on a timely basis. However, the long-term
nature of pensions requires that years elapse before funding level
adequacy can be accurately assessed. This absence of a short-term means
to measure judgment accuracy, however, does not lessen the need to make
funding level assessments.
Research concerned with judgment consensus, or agreement among
decision makers, indicates that consensus serves as a good surrogate for
judgment accuracy [A. Ashton, 1985]. Accordingly, financial information
that promotes judgment accuracy also should promote judgment consensus
among knowledgeable decision makers. To test the GASB's belief that
10-year trend data is useful (i.e., improves judgment consensus), the
following hypothesis was tested:
H 4: There is no difference in judgment consensus regarding the
status of the fictitious PERS between users who receive financial
statements that contain 10-year historical trend data and those
that receive financial statements with the trend data omitted.
To test this hypothesis, the responses of the respondent groups that
116
received the two NCGAS 6 financial statement versions were compared.^
The following tables (hereafter, items) were included in the "statisti
cal data" section of the PERS financial report that was furnished to the
members of one respondent group:
1. Comparative Summary of Net Assets Available for Benefits and
Total Actuarial Present Value of Credited Projected Benefits,
2. Comparative Summary of Unfunded Actuarial Present Value of
Credited Projected Benefits and Annual Active Member Payroll,
3. Comparative Summary of Actuarial Values and Percentage Covered
by Net Assets Available for Benefits,
4. Investment Performance Measurements, and
5. Comparative Summary of Revenues by Source and Expenses by Type.
The comparisons of interest concerned the responses to questions 1,
2, and 4. Question 2 (regarding investment performance) was included
with the two "funding level" questions since the statistical data
included investment performance indices (Item 4). The respondent group
that received the 10-year trend data had to exhibit significantly less
response variance than the other group to reject the null hypothesis.
Hypothesis Test Results
Parametric statistical tests of variance are not very robust; that
is, they are quite sensitive to violations of the assumption of normally
^Although Table 3 indicates that the SFAS 35 version resulted in the lowest response variance to questions 1 and 4, it is believed that this is due to the anchoring points used on the scale. For example, many of the respondents who received the SFAS 35 version reacted to the reported asset-to-benefit ratio and considered the plan to be "fully or over funded." The resulting high concentration of "endpolnt" responses reduced the variance considerably.
117
distributed data. As Conover [1980] notes, "the true distribution may
be symmetric and resemble somewhat the normal distribution . . . and yet
the true level of significance may be two or three times as large as it
is supposed to be." To test the normality of the responses, a
Kologomorov D test statistic was computed for the responses to each of
the questions. In all cases, the hypothesis of a normal distribution
was rejected (alpha = .01). Accordingly, a nonparametric test of
dispersion was used.
A test statistic was computed for each of the comparisons using the
squared ranks test for variances procedure—as described by Conover.
Using a "one-tailed" decision rule, the test statistic Indicated a
significant difference in variance (alpha = .05) only in the question 1
responses. Although the response variances for questions 2 and 4 were
in the hypothesized direction (i.e., the "10-year trend data" group
exhibited less variance), the differences were not statistically
significant.
Discussion of Results
The significant variance reduction noted for the funding level
question was expected—if the 10-year trend information was at all
useful—since the preponderance of the statistical data dealt with
benefits funding (i.e.. Items 1, 2, 3, and to some extent 5). Further,
Table 7 indicates that a considerable percentage of the respondents
claimed that one or more of these items served as bases for their
judgments. Accordingly, the results of this study support the GASB's
contention that 10-year trend data are useful. As one respondent (who
118
received the "statistical data omitted" version) commented, "[the]
balance sheet or notes do not answer the question, "is the unfunded
liability growing, staying about the same, or declining annually'?"
Note, however, that cost-benefit Issues are not addressed here
(although if no consensus improvement results from additional
disclosure—which is made at some cost—it seems reasonable to state
that the disclosure is not cost-beneficial). Several respondents (who
were associated with multiple-employer PERS) objected to the inclusion
of 10-year trend data based on (1) its preparation cost, and (2) the
potential for user confusion—since it is affected by changes in plan
provisions and actuarial assumptions. The latter objection was predi
cated on the 'Tiistorical fact" of frequent changes in provisions and/or
assumptions and the "onerous burden" of providing sufficient disclosure
for users to interpret the effects of these changes on the reported
trend.
The "insignificant results" for questions 2 and 4 suggest several
observations:
1. Although Table 7 indicates that 82% of the respondents relied
upon the investment performance indices when answering question 2, these
Indices may provide limited information content. Recall that the GASB
posited that 10-year trend data are required to make PERS judgments. As
presented pursuant to NCGAS 6, the investment indices cover only the
current year. Perhaps the PERS' return-on-investment for the past 10
years as compared to several market indices and the PERS' actuarially
assumed rate of return would be more useful.
119
2. Tables 7 and 8 indicate that the respondents utilized quite a
variety of financial statement elements when assessing the participants'
benefit security. Thus, it appears that the funding level component of
the benefit security judgment was not large enough to significantly
affect the response variance to this question.
3. The lack of a significant difference in response variance may
be attributable, in some part, to the research design or the sample
size. For example, the 7-polnt response scale may have obscured
differences that would have been apparent if some continuous measure of
the dependent variable had been taken.
Effects on Judgments of Respondent Demographics
Although respondents' demographic characteristics and actuarial
knowledge were uncontrolled by the research design, it was hypothesized
that these factors would affect their decision models. For Instance, a
person that had years of PERS management experience might analyze PERS
financial statements differently than a finance officer who is not
involved in management of the government's pension plan(s). Tests were
conducted to determine which, if any, of these effects were significant.
Chi-square test statistics were used to determine if there were any
significant relationships between the responses to the questions about
the fictitious PERS and the respondents' demographic characteristics or
actuarial knowledge. Table 13 presents these statistics and their
significance level (refer to Table 2 for a description of the variables;
^This observation is supported by the differences in mean responses to questions 1 and 4 as noted previously.
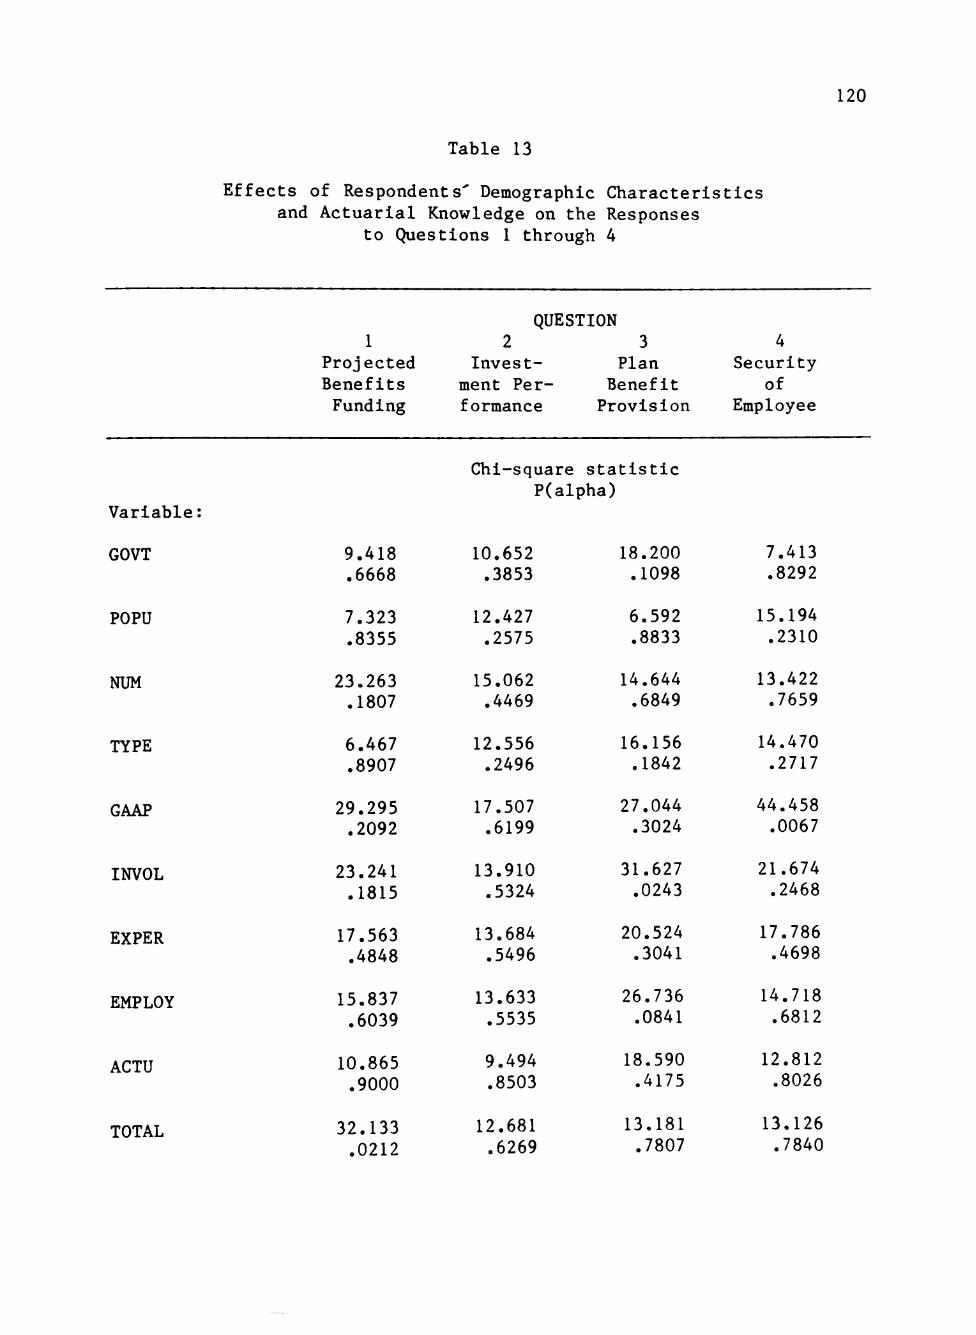
120
Table 13
Effects of Respondents' Demographic Characteristics and Actuarial Knowledge on the Responses
to Questions 1 through 4
1 Projected Benefits Funding
QUESTION 2 3 4
Invest- Plan Security ment Per- Benefit of formance Provision Employee
Chi-square statistic P(alpha)
Variable:
GOVT
POPU
NUM
TYPE
GAAP
INVOL
EXPER
EMPLOY
ACTU
TOTAL
9.418 .6668
7.323 .8355
23.263 .1807
6.467 .8907
29.295 .2092
23.241 .1815
17.563 .4848
15.837 .6039
10.865 .9000
32.133 .0212
10.652 .3853
12.427 .2575
15.062 .4469
12.556 .2496
17.507 .6199
13.910 .5324
13.684 .5496
13.633 .5535
9.494 .8503
12.681 .6269
18.200 .1098
6.592 .8833
14.644 .6849
16.156 .1842
27.044 .3024
31.627 .0243
20.524 .3041
26.736 .0841
18.590 .4175
13.181 .7807
7.413 .8292
15.194 .2310
13.422 .7659
14.470 .2717
44.458 .0067
21.674 .2468
17.786 .4698
14.718 .6812
12.812 .8026
13.126 .7840
121
TOTAL represents the number of correct responses to the actuarial
knowledge exercise—see Table 3).
Perceptions about the fictitious PERS' funding level were related
to the respondent's actuarial knowledge. The Spearman correlation
coefficient (.1907) provides a measure of the strength of this
relationship. Although statistically significant, the respondent's
actuarial knowledge accounted for only four percent of the response
variance. Thus, a person's actuarial knowledge should not be viewed as
having a major effect on his judgment model.
Judgments about the plan participants' benefits security were
related to the authoritative pronouncement that the respondent's employer
followed when accounting for pensions. There are two plausible explana
tions for this finding: (1) respondents that based their evaluations on
financial statements that employed a familiar format may have made
different assessments than those respondents who were not accustomed to
the format and content of the fictitious PERS financial statements, and
(2) as Indicated by Table 2, a large number of respondents did not
know what authoritative pronouncement their employer used for PERS
accounting and financial reporting. This variable (GAAP) may act as a
surrogate for the respondent's general PERS knowledge and involvement—
with knowledgeable and involved respondents knowing what pronouncement
their employer follows.
^The squared correlation coefficient provides an indication of the portion of the total response variance that is attributable to the variable.
122
The respondent's degree of involvement with PERS management was
associated with his response to the question regarding the "typicalness"
of the fictitious PERS—although the Spearman correlation coefficient
(.2377) indicated that only 5.6 percent of the response variance was
related to this variable. No demographic characteristics were signifi
cantly related to the respondent's evaluation of the fictitious PERS
management's Investment performance.
In summary, a small portion of the response variance can be
attributed to but a few demographic characteristics. This finding
supports the contention that the sample subjects comprised a relatively
homogeneous group with respect to their PERS judgments; i.e., PERS
administrators, as a group, did not make significantly different
judgments than the city or county finance officers; as a group,
respondents employed by governments that administered single-employer
PERS made similar judgments to the group whose employers contributed
only to multiple-employer PERS, etc.
Limitations
The nature of field experiments somewhat limits what can be
concluded for accounting policy makers. The lack of realism of the
experimental setting reduces the external validity of the results. To
minimize such effects, respondents were furnished with financial state
ments that were prepared in accordance with present generally accepted
accounting principles. Further, they were presented with extensive
common "background" material when asked to make case comparisons.
123
Several questionnaires were returned unanswered, accompanied by a
letter which indicated that the recipient's employer participated in
only multiple-employer PERS and thus the study was not applicable to
them. Such sentiments may have affected the response rate of the
sample's "multiple-employer PERS" members, potentially introducing some
bias in the responses. In retrospect, this misconception could have
been eliminated by specifically stating in the Introductory materials
that members of multiple-employers PERS were to respond.
As with any questionnaire research, little experimental control can
be exerted over who actually completed the questionnaires. For example,
several questionnaires mailed to finance officers were returned by the
administrator of the government's PERS, who indicated that the question
naire had been sent to him for completion. In such cases, the
demographic information reflected the person who actually completed the
questionnaire. Although instrument completion by persons other than to
whom the questionnaires were addressed can result in a significant
amount of random error being Introduced into the results, the apparent
care with which the instruments were completed indicates that no serious
effect on the results can be attributable to completion of the
questionnaires by "uninformed" persons. Further, those unable to
recognize the duplicate case were eliminated from the results, and thus
there was some control over the knowledge of the respondents.
The sample was selected from the membership roles of the Governmen
tal Finance Officers Association. Since persons who are interested
enough in professional activities to join such an organization may not
be truly representative of governmental finance officers in general,
124
some bias may have been Introduced. These people would be more active
and knowledgeable than other government employees. In spite of this
source of bias, the fixation prevailed.
Summary
This chapter detailed the research results, which may be summarized
as follows:
1. A significant percentage of respondents understood the effects
of the assumed rates of salary increase and return on plan assets on
reported pension obligations but were incorrect in their understanding
of actuarial cost methods.
2. Mean responses were not affected by the presence of 10-year
trend data; however, the Inclusion of 10-year data did result in
improved judgment consensus.
3. Respondents appeared to be fixated on the reported funding
status of the PERS and did not properly consider the underlying factors
that affect the reported funding status.
4. Fixation on the reported funding status of the fictitious PERS
was not limited to those respondents that had limited actuarial
knowledge, but was found in all respondent groups.
5. Demographic characteristics have only a limited effect on
respondent's decision models. Judgments about the plan participants'
benefits security were related to the authoritative pronouncement that
the respondent's employer followed when accounting for pensions. In
addition, the respondent's degree of involvement with PERS management
was associated with his response to the question regarding the

125
"typicalness" of the flcitious PERS—although the association was rather
weak. No demographic characteristics were significantly related to the
respondent's evaluation of the fictitious PERS management's Investment
performance.
CHAPTER 6
CONCLUSIONS
This chapter briefly restates the objectives of the study, presents
a summary of the research results, and discusses the implications for
PERS financial reporting practices that are suggested by the findings.
Also, suggestions are made for further research.
The Study: An Overview
Research Objectives
This study was conducted to gain insight into the decision making
process(es) of PERS financial statement users and preparers. This
objective was based on research [summarized by Ashton, 1982] which has
shown that an understanding of judgment formation assists standards
setters, thereby resulting in more "useful" accounting reports.
Research Methodology
A simulated decision making situation was employed in the study in
which respondents made judgments about the funding level, the investment
performance, and the level and security of benefits of a fictitious
PERS. They then completed two exercises that (1) measured their
knowledge of the effects of actuarial methods and assumptions on
reported data, and (2) tested their ability to properly consider these
effects when comparing the funding of the fictitious PERS to that of
other pension plans. This methodology enabled determination of the
effects on the respondent's judgments of variations in the information
126
127
signal. Individual and aggregate decision models were constructed—
based on the funding level comparison exercise—to see if the
respondents appropriately assimilated reported actuarial data. These
research questions were addressed:
1. Does the benefit-liability measure used for PERS financial
reporting and/or the amount of supplemental disclosure affect users'
perceptions of the PERS financial condition?
2. Do users of PERS financial statements understand the effects
that actuarial assumptions have on the reported benefit-liability
measure?
Research Findings
The sample was randomly divided into three groups. Each group was
then provided financial statements for the same PERS—prepared in
accordance with either NCGAS 6, NCGAS 6 with the required statistical
data omitted, or SFAS 35—and asked to (1) make judgments about the
PERS, and (2) complete an exercise designed to test their level of
actuarial knowledge. Since the financial statements received by each
group were different, between-group comparisons indicated whether mean
judgments or group consensus were affected by the contents of the
financial statements.
The statistical tests and procedures applied to the responses
resulted in these findings:
1. Respondents appeared to be functionally fixated on the reported
funding status of the PERS and did not properly consider the underlying
128
factors that affect the reported funding status.^
2. Fixation on the reported funding status of the fictitious PERS
was not limited to those respondents that had limited actuarial
knowledge, but was found in all respondent groups.
3. A significant percentage of respondents understood the effects
of the assumed rates of (1) salary increase and (2) return on plan
assets on reported pension obligations, but were incorrect in their
understanding of actuarial cost methods.
4. Mean responses were not affected by the presence of 10-year
trend data; however, the Inclusion of 10-year data did result in
improved judgment consensus,
5. Demographic characteristics had only a limited effect on
respondent's decision models.
The Research Results in Perspective
Llvnat [1984] found that unfunded vested benefits served as an
o
information signal to users of corporate financial statements.
The amount reported as unfunded vested benefits depends upon the
actuarial assumptions that are made and is a principal component of an
entity's pension benefits obligation. Daley [1984] discovered that (1)
pension expense is the most "consistent measure" of the equity market's
aggregate pension cost measure, and (2) differences in actuarially
^A decision maker is "functionally fixated" when he is unable to adjust his decision process to a change in the accounting process which supplies him with decision data [Ijirl, Jaedicke, and Knight, 1966].
^"A signal is said to possess information content when it changes the market transactors' beliefs about the distribution of future returns" [Llvnat, 1978, p. 78].
129
selected discount rates are not used by the equity markets in evaluating
data on pension costs. Taken together, these studies showed evidence of
fixation on the part of financial report users. The "fixation"
phenomena was studied by Abdel-khalik and Keller [1979] who reported
that:
decision makers employed in this study have shown that they understand the effect on reported earnings, taxes and cash flows of changing the Inventory method to LIFO. Yet, they judged the expected return from investing in the stock of the firms that switched to LIFO lower than (or the same as) that (1) from investing in stocks of identical firms that had not changed the method of valuing inventories and (2) from the same firm before changing to LIFO. [p. 50]
In a similar fashion, respondents in this study appeared to attribute a
particular Information content, or meaning, to the reported funding
level of a fictitious PERS and seemed unable to adapt their understand
ing to changes in the assumptions that underlie this level. Thus, this
study corroborates the findings of these prior studies.
Changes in PERS Financial Reporting Practices Suggested by the Results
Fixation Implications
Over the past decade, accountants and policy makers have become
Increasingly concerned about the usefulness of accounting information
[NCGA Concepts Statement 1, 1982; SFAC 4, 1980]. Accounting numbers
must serve user information needs if they are to be useful. In the
context of pension accounting, the GASB [1985a] stated that these needs
related to the assessment of "(a) the funding status of a PERS on a
going-concern basis, (b) progress made in accumulating assets to pay
benefits when due, and (c) whether employers are making actuarially
130
determined contributions to plans" [par. 6]. Accounting policy makers
should know as accurately as possible the model(s) used by PERS
financial statement users if accounting standards are to meet these
needs. As Abdel-khalik and Keller [1979] note, "accounting numbers
developed using an incorrect assumption about users decision models may
not provide the desired information or may lead to Incorrect decisions
if they are relied upon" [p, 49],
PERS financial reports serve to communicate with a variety of
interested parties. For these reports to be effective, the PERS
phenomena must be coded in accordance with a generally accepted system
so that the receiver of the communication (i,e., the PERS financial
report user) is able to decode the communication to receive the correct
message. Unfortunately, due to report user fixation, the message may
not be correctly received even if it is correctly coded.
Fixation, as found in this study, has been posited as a source of
communication failure [Abdel-khalik and Keller, 1979]. Its presence
indicates that the communication channels between PERS financial state
ment preparers and users are in need of improvement. Communication
improvements occur when PERS accounting reports are coded better (i.e.,
clearer) or when their users develop a better understanding of the
economic phenomena encompassed in a given signal.
An important implication for the setting of accounting standards
can be drawn from this discussion. If financial statement users seem
able to make appropriate use of reported information (i.e., there is a
high degree of correlation between their judgments and the economic
phenomena judged), then the financial statements adequately communicate.
131
Note, however, that the converse is also true—financial reports
inadequately communicate when their users are unable to make appropriate
use of reported information.
As noted previously, this study's respondents were fixated on the
reported benefits funding level; thus, they did not adequately decode
the signal provided by the underlying actuarial assumptions. A major
implication of this finding for standards setters is that PERS financial
reports prepared in accordance with current generally accepted
accounting principles do not communicate well.
Some respondents understood the effects of interest and salary
rate assumptions on the reported benefits obligation, implying that
disclosure of these assumptions is all that is required. Such a conclu
sion is supported by the PERS financial report users' information needs
survey conducted by Van Daniker and Aldrldge [1985]. However, if the
purpose of financial reporting is to provide information that users can
use when making decisions, the fixation finding implies that more than
just simple disclosure of such assumptions is needed. The research
design does not permit a definitive statement regarding the form that
"useful" actuarial information should take; however, the potential of
the policies suggested below to Improve communication between PERS
financial report preparers and users might be tested through further
research.
Policy 1
Standardize the actuarial cost method and all of the actuarial
assumptions that are used for financial reporting. Differences between
132
reports would thus be attributable to "real" differences in (1) plan
funding, and/or (2) benefit provisions.
"Actuarial standardization" would result in PERS reports that are
both cross-sectionally and longitudinally comparable. Further,
standardization would reduce the level of actuarial knowledge that users
of PERS financial reports must possess to make valid PERS comparisons.
A comment by the administrator of a multiple-employer PERS in response
to a recently Issued discussion memorandum on pension reporting [GASB,
1985a] summarized this concern:
My staff and I recently reviewed a questionnaire submitted to us by Stephen D. Willits. It was revealing to us to realize that we could not agree on the relative strengths of the "funding level" of the cases presented in Part C of the questionnaire. _I£ the relative strength of the funding level of plans . . . is a critical purpose of the reporting requirements, then the major assumptions (i.e., inflation, investment, and salary) must be standardized.
However, the cost of financial reporting would increase if
standardized actuarial methods and assumptions were required since the
assumptions currently used for financial reporting are those developed
by the plan's actuary for funding determinations. Multiple-employer
"agency" PERS are particularly susceptible to these cost increases since
an extra actuarial valuation would be required for each member
government. Further, all PERS do not earn the same return on plan
assets, have identical turnover rates, etc. Thus, utilization of a
standard rate of return—say seven percent—for PERS reporting may be
misleading when a plan earns only four percent on its portfolio.
Policy 2
Present sensitivity data that shows the effects on reported data
of, for instance, 1 and 2 percent changes in each of the actuarial
133
assumptions. These data would warn the financial report user of the
potential impact of the actuarial assumptions and methods on the
reported data.
Sensitivity data should facilitate (1) between-PERS comparisons
when different actuarial assumptions are used, and (2) within-PERS
comparisons when the assumptions are changed. This additional
information may reduce the effects of fixation.
Unfortunately, it is difficult to extrapolate sensitivity figures,
and this may reduce their usefulness. For instance, a two percent
change in the Interest rate does not have twice the effect of a one
percent change on a plan's reported benefits obligation. Too,
additional cost is incurred when this information is reported.
Policy 3
Report 10-year historical trend data for both (1) the assumed rates
of return on plan assets and salary increase, and (2) those actually
experienced.
Although it is desirable that PERS financial report users know the
effects on reported data of actuarial assumptions and methods, it may be
equally important that they know whether the assumptions used for plan
funding—and reporting—are reasonable. Data that compare the assump
tions with historical data may facilitate this assessment.
In addition to the usual cost of information concerns, implementa
tion of this policy may be hampered by the availability of data.
Further, rates of return and salary Increase are but two of many assump
tions that must be made by the plan's actuary. Reporting assumed versus
actual data for all of these assumptions may not be feasible.
134
Policy 4
Report a "comparison index" based on "standard assumptions" in
addition to the usual information. For example, the index might be the
PERS' asset-to-benefits obligation ratio computed under uniform actuar
ial assumptions.
The fixation finding resulted from the failure of PERS financial
report users to determine the effects of actuarial assumptions on
reported data. This failure particularly affects users' judgments
when financial reports prepared under different assumptions are
compared. The suggested index might mitigate these effects by providing
one metric, or measure, for each PERS that is based on the same
assumptions and methods.
Again, the objections to such an index concern (1) its cost and (2)
its usefulness, since all PERS do not have comparable benefit provisions
or actuarial experience.
Policy 5
Warn PERS financial report users that comparisons between PERS—or
longitudinal comparisons for the same PERS when changes in assumptions,
etc., have occurred—may be very difficult due to the complexity of the
actuarial computations.
This policy would add little to the cost of financial reporting;
however, it may also do little to mitigate the effects of fixation.
Policy 6
In lieu of reporting actuarial data, include a statement by the
plan's actuary to the effect that the plan is being funded using
135
standard actuarial methods and that the plan's assumptions are
reasonable and in keeping with its past experience.
An audit provides an objective assessment of the "fairness" of an
entity's financial statements and is widely used to reduce the costs—
and impracticalities—of having all financial statement users indepen
dently verify reported data. Thus, the auditor serves as an agent for
the users of financial reports. Users of PERS financial reports are
interested primarily in the financial condition of the PERS and are
concerned with actuarial information only to the extent that it affects
what the PERS reports. The suggested statement by the plan's actuary
would shift the burden of determining whether the plan's assumptions are
reasonable—and thus should lead, over time, to adequate plan funding—
from the user of the report to a professional actuary.
Permitting an "actuary's opinion" in lieu of full disclosure of the
actuarial assumptions and methods used may hinder PERS evaluations that
are undertaken by sophisticated financial report users. Accordingly, it
may be desirable to make the "actuarial opinion" a required supplement
to—Instead of a substitute for—existing requirements.
Note that cost-benefit issues are not addressed here, but must be
considered during the standards setting process.
Actuarial Knowledge Implications
The lack of knowledge exhibited by the users of PERS financial
reports concerning the effect of the actuarial cost method on the
reported benefits obligation implies that a standardized actuarial cost
method should be adopted for financial reporting purposes. Thus, the
proposal [GASB, 1985a] that would require the use of the actuarial
136
present value of credited projected benefits when measuring the accrued
pension benefit obligation is supported.
Usefulness of Trend Data
The presence of trend data resulted in improved consensus regarding
the plan's funding level. Since consensus has been found to be a good
surrogate for judgment accuracy [A. Ashton, 1985], the inclusion of
trend data should result in "better" decisions being made. This finding
supports the contention of the GASB that "single-year financial state
ments alone cannot provide sufficient information to accomplish these
[reporting] objectives" [1985a, par. 7]. Accordingly, unless cost
prohibited, trend data should be Included in PERS financial reports.
Implications of "Knowledgeable User" Fixation
The finding of fixation in all user groups raises questions about
the supposition—made by the GASB [1985a] and Beaver [1973]—that
financial reporting should presume a knowledgeable user group. This
supposition infers that knowledgeable users are able to make appropriate
decisions when furnished with financial data. However, this study
indicates that even knowledgeable users were not able to make
reasonable, or rational, judgments about a PERS' funding level when
presented with data that by implication are deemed to be adequate, i.e.,
GAAP based financial statements that meet the objectives of the concep
tual framework. Thus, being "familiar with financial matters" is a
necessary, but not sufficient condition for accuracy in judgments about
PERS funding.
137
Demographic Effects
The little Impact of demographics suggests that decision model
differences are not systematically related to the respondent's
experience, involvement with pension management, etc. However, the
considerable differences noted in the respondents' decision models
indicates that wide variation exists in the way pension data is
evaluated—even among relatively homogeneous users. Accordingly, it may
be difficult—if not Impossible—to Identify a limited set of PERS data
that will meet the needs of all PERS financial report users. This
finding supports the tendency of standards setters over the past decade
to require additional pension disclosures.
Implications for Additional Research
The inclusion of 10-year trend data did not have a statistically
significant effect on mean responses to the questions regarding the
condition of the fictitious PERS; however, this result may be a function
of the research design and sample size and bears further Investigation.
A major objective of financial information is to provide users with data
that can be used to forecast future events. Financial statements that
report a steady improvement in PERS funding should thus convey a differ
ent information signal than those that report a deteriorating funding
level—even if both report the same funding level at the balance sheet
date. Accordingly, trend data should be useful when comparing
different PERS.
This study determined that PERS financial report users have
difficulty in forming judgments when presented with PERS financial

138
statements prepared in accordance with current generally accepted
accounting principles. Additional research may identify an information
set(s) or reporting approach that will facilitate decision making by the
users of PERS information.
BIBLIOGRAPHY
Abdel-khalik, A. Rashad, and K. El-Sheshai, "Information Choice and Utilization in an Experiment on Default Prediction," Journal of Accounting Research, (Autumn, 1980), pp. 325-42.
Abdel-khalik, A. Rashad, and Thomas F. Keller, Earnings or Cash Flows: An Experiment on Functional Fixation and the Valuation of the Firm (American Accounting Association, 1979).
American Institute of Certified Public Accountants, "Industry Audit Guide," Audits of State and Local Governmental Units, (AICPA, 1974).
Ashton, Alice H., "Does Consensus Imply Accuracy in Accounting Studies of Decision Making?" The Accounting Review, (April, 1985), pp. 173-185.
Ashton, Robert H., "An Experimental Study of Internal Control
Judgments," Journal of Accounting Research (Spring, 1974), pp. 143-57. (a)
Ashton, Robert H., "Cue Utilization and Expert Judgments: A Comparison of Independent Auditors with Other Judges," Journal of Applied Psychology (August, 1974), pp. 437-44. (b)
Ashton, Robert H., "Cognitive Changes Induced by Accounting Changes: Experimental Evidence on the Functional Fixation Hypothesis," Studies on Human Information Processing in Accounting, Supplement to Journal of Accounting Research, (1976), pp. 1-17.
Ashton, Robert H., Human Information Processing in Accounting, (American Accounting Association, 1982).
Ashton, Robert H. and P. R. Brown, "Descriptive Modeling of Auditors-Internal Control Judgments: Replication and Extension," Journal of Accounting Research (Spring, 1980), pp. 269-77.
Ashton, Robert H. and Sandra S. Kramer, "Students as Surrogates in Behavioral Accounting Research: Some Evidence," Journal of Accounting Research (Spring, 1980), pp, 1-15,
Barefleld, Russell M,, "The Effect of Aggregation on Decision Making Success: A Laboratory Study," Journal of Accounting Research (Autumn, 1972), pp. 229-42,
Beaver, William H,, "What Should Be the FASB's Objectives?" The Journal of Accountancy (August, 1973), pp. 49-56.
139
140
Boatsman, James R, and Jack C, Robertson, "Policy-Capturing on Selected Materiality Judgments," The Accounting Review (April, 1974), pp. 342-52.
Brunswik, E., "Thing Constancy as Measured by Correlation Coefficients," Psychological Review, (January, 1940), pp. 69-78.
Buxbaum, William E. and John J. Quindlen, "Accounting for Pensions— DuPont's Views," Georgia Journal of Accounting, (Spring, 1984), pp. 33-49.
Buzby, Stephen L., "Company Size, Listed Versus Unlisted Stocks, and the Extent of Financial Disclosure," Journal of Accounting Research (Spring, 1975), pp. 16-37.
Casey, Cornelius J., "The Usefulness of Accounting Ratios for Subjects' Predictions of Corporate Failure: Replications and Extensions," Journal of Accounting Research (Autumn, 1980), pp. 603-13.
Chang, Davis L. and Jacob G. Birnberg, "Functional Fixity in Accounting Research: Perspective and New Data," Journal of Accounting Research (Autumn, 1977), pp. 300-12.
Conover, W. J., Practical Nonparametric Statistics (New York: John Wiley & Sons), 1980.
Copeland, Ronald M. and Earl R. Wilson, "Municipal Pension Funding and Bond Borrowing Costs: A Fiscal Policy Analysis," unpublished manuscript. Northeastern University and University of Missouri-Columbia, 1985.
Daley, Lane A., "The Valuation of Reported Pension Measures for Firms Sponsoring Defined Benefit Plans," The Accounting Review, (April, 1984), pp. 177-98.
Danos, Paul P, and Eugene A, Imhoff, Jr., "Auditor Review of Financial Forecasts: An Analysis of Factors Affecting Reasonableness Judgments," The Accounting Review (January, 1982), pp. 39-54.
Deitrlck, James W. and Walter T. Harrison, "EMH, CMR and the Accounting Profession," Journal of Accountancy (February, 1984), pp. 82-94.
Dyckman, Thomas R., David H. Downes, and Robert R. Magee, Efficient
Capital Markets and Accounting: A Critical Analysis (Prentice-Hall, 1975).
Eggleton, Ian R.C., "Patterns, Prototypes, and Predictions: An Exploratory Study," Studies on Human Information Processing in Accounting, Supplement to Journal of Accounting Research (1976), pp. 68-131.
141
Einhorn, H. J., "The Use of Nonlinear, Noncompensatory Models in Decision Making," Psychological Bulletin (February, 1970), pp. 221-230.
Einhorn, H. J., "Expert Judgment: Some Necessary Conditions and an Example," Journal of Applied Psychology, (October, 1974), pp. 562-71.
Engstrom, John H., "Pension Reporting by Municipalities," Journal of Accounting, Auditing, & Finance, (Spring, 1984), pp. 197-211.
Financial Accounting Standards Board, An Analysis of Issues Related to Conceptual Framework for Financial Accounting and Reporting: Elements of Financial Statements and Their Measurements (FASB, 1976).
Financial Accounting Standards Board, "Objectives of Financial Reporting by Business Enterprises," Statement of Financial Accounting Concepts No. 1, (FASB, November 1978).
Financial Accounting Standards Board, "Accounting and Reporting by Defined Benefit Pension Plans," Statement No. 35, (FASB, 1980).
Financial Accounting Standards Board, "Disclosure of Pension Information," Statement No. 36, (FASB, 1980).
Financial Accounting Standards Board, "Objectives of Financial Reporting by Nonbusiness Organizations," Statement of Financial Accounting Concepts No. 4, (FASB, December 1980).
Financial Accounting Standards Board, "Deferral of the Effective Date of Certain Accounting Requirements for Pension Plans of State and Local Governmental Units," Statement No. 59, (FASB, April, 1982).
Financial Accounting Standards Board, "Deferral of the Effective Date of Certain Accounting Requirements for Pension Plans of State and Local Governmental Units," Statement No. 75, (FASB, November, 1983).
Financial Accounting Standards Board, "Employers Accounting for Pensions," Statement No. 87, (FASB, December, 1985).
Firth, M., "Consensus Views and Judgment Models in Materiality Decisions," Accounting, Organizations and Society, (1979), pp. 283-95.
Gaumnitz, Bruce R., Thomas R. Nunamaker, John J. Surdick, and Michael F. Thomas, "Auditor Consensus in Internal Control Evaluation and Audit Program Planning," Journal of Accounting Research (Autumn, 1982), pp. 745-55.
142
General Accounting Office, An Actuarial and Economic Analysis of State and Local Government Pension Plans, (February 26, 1980).
Gonedes, Nicholas J. and Nicholas Dopuch, "Capital Market Equilibrium, Information Production and Selecting Accounting Techniques," Studies in Financial Objectives: 1974, Supplement to Journal of Accounting Research, pp. 48-129.
Gonedes, Nicholas J., "Corporate Signaling, External Accounting, and Capital Market Equilibrium: Evidence on Dividends, Income and Extraordinary Items," Journal of Accounting Research, (Spring, 1978), pp. 26-79.
Governmental Accounting Standards Board, "Authoritative Status of NCGA Pronouncements and AICPA Industry Audit Guide," Statement No. 1, (GASB, 1984).
Governmental Accounting Standards Board, "Disclosure of Defined Benefit Pension Information for Public Employee Retirement Systems and State and Local Governmental Employers," Exposure Draft, (GASB, 1985). (a)
Governmental Accounting Standards Board, "Statement of Governmental Accounting and Reporting Objectives," Working Draft, (GASB, 1985). (b)
Hamilton, R. E. and W. F. Wright, "The Evaluation of Internal Controls over Payroll," Research Paper No. 397, Graduate School of Business, Stanford University, December 1977.
Hammond, K. R. and D. A. Summers, "Cognitive Control," Psychological Review (January, 1972), pp. 58-67.
Harrison, W. Thomas, "Different Market Reactions to Discretionary and Non-Discretionary Accounting Changes," Journal of Accounting Research (Spring, 1977), pp. 84-107.
Hayes, William L., Statistics for Psychologists, (New York: Holt, Rinehart and Winston), 1963.
Hoffman, Paul J., Paul Slovic and Leonard G. Rorer, "An Analysis-of Variance Model for the Assessment of Conflgural Cue Utilization in Clinical Judgment." Psychological Bulletin (May, 1968), pp. 338-49.
Hofstedt, Thomas R. and G. D. Hughes, "An Experimental Study of the
Judgment Element in Disclosure Decisions," The Accounting Review (April, 1977), pp. 378-394.
Hursch, C. J., K. R. Hammond, and J. L. Hursch, "Some Methodological Considerations in Multiple Cue Probability Studies," Psychological Review (January, 1964), pp. 42-60.
143
Ijirl, Y., R. K. Jaedicke, and K. E. Knight, "The Effects of Accounting Alternatives on Management Decisions," in Research in Accounting Measurement (New York: American Accounting Association, 1966), pp. 186-99.
Inman, R.P., "Public Employee Pensions and the Local Labor Budget," Journal of Public Economics, (1982), pp. 49-71.
Joyce, Edward J., "Expert Judgment in Audit Program Planning," Studies on Human Information Processing in Accounting, Supplement To Journal of Accounting Research (1976), pp. 29-60.
Kaplan, Robert S., "The Information Content of Financial Accounting Numbers: A Survey of Empirical Evidence," in The Impact of Accounting Research on Practice and Disclosure (Abdel-khalik and Keller, eds.).
Kessler, Lawrence I. and Robert H. Ashton, "Feedback and Prediction Achievement in Financial Analysis," Journal of Accounting Research (Spring, 1981), pp. 146-62.
Ketz, Edward J. and Arthur R. Wyatt, "The FASB in a World With Partially Efficient Markets," Journal of Accounting, Auditing & Finance (Fall, 1983), pp. 29-43.
Libby, Robert, "Accounting Ratios and the Prediction of Failure: Some Behavioral Evidence," Journal of Accounting Research (Spring, 1975), pp. 150-61. (a)
Libby, Robert, "The Use of Simulated Decision Makers in Information Evaluation," The Accounting Review (July, 1975), pp. 475-89. (b)
Libby, Robert, "Man Versus Model of Man: Some Conflicting Evidence," Organizational Behavior and Human Performance (June, 1976), pp. 1-12,
Libby, Robert, "Bankers' and Auditors' Perceptions of the Message Communicated by the Audit Report," Journal of Accounting Research (Spring, 1979), pp. 99-112. (a)
Libby, Robert, "The Impact of Uncertainty Reporting on the Loan Decision, " Selections From the Research Opportunities in Auditing Program, Supplement to Journal of Accounting Research (1979), pp. 35-57. (b)
Libby, Robert, Accounting and Human Information Processing: Theory and Applications, (Englewood Cliffs, NJ: Prentice-Hall), 1981.
Llvnat, Joshua, "Disclosure of Pension Liabilities: The Information Content of Unfunded Vested Benefits and Unfunded Past Service Cost," Journal of Business, Finance & Accounting, (Spring, 1984), pp. 73-88.
144
Mansfield, Edwin, Statistics for Business and Economics, (New York: W. W. Norton & Company), 1980.
Mautz, R. K., "Financial Reporting: Should Government Emulate Business?", Journal of Accountancy (August, 1981), pp. 53-60.
McGhee, W., M. D. Shields, and J. G. Birnberg, "The Effects of Personality on a Subject's Information Processing," The Accounting Review (July, 1978), pp. 681-97.
Moriarity, Shane R., "Communicating Financial Information Through Multidimensional Graphics," Journal of Accounting Research (Spring 1979), pp. 205-24.
Moriarity, Shane R. and F. H. Barron, "Modeling the Materiality Judgments of Audit Partners," Journal of Accounting Research (Autumn, 1976), pp. 320-41.
Moriarity, Shane R. and F. H. Barron, "Judgment Based Definition of Materiality," Selections From the Research Opportunities in Auditing Program, Supplement to Journal of Accounting Research (1979), pp. 114-35.
National Committee on Governmental Accounting, Municipal Accounting and Auditing, (NCGA, 1951).
National Committee on Governmental Accounting, Governmental Accounting, Auditing, and Financial Reporting, (NCGA, 1968).
National Council on Governmental Accounting, "Government Accounting and Financial Reporting Principles," Statement 1, (NCGA, 1979).
National Council on Governmental Accounting, "Accounting and Financial Reporting for Public Employee Retirement Systems and Pension Trust Funds," Interpretation 4, (NCGA, 1981).
National Council on Governmental Accounting, "Objectives of Accounting and Financial Reporting for Governmental Units," Concepts Statement ]_, (NCGA, 1982).
National Council on Governmental Accounting, "Pension Accounting and Financial Reporting: Public Employee Retirement Systems and State and Local Government Employers," Statement 6, (NCGA, 1983).
National Council on Governmental Accounting, "Certain Pension Matters," Interpretation 8, (NCGA, 1983).
Newton, J. R., "Judgment and Feedback in a Quasi-Clinical Situation," Journal of Personality and Social Psychology, (April, 1965), pp. 336-42.
145
Nichols, William D. and Michael H. Morris, "The Rate of Return Assumption: Insights from the New FASB Statement No. 36 Disclosures," Financial Analysts Journal, (September/October, 1982), pp. 10-11, 15.
Oppenheim, A. N., Questionnaire Design and Attitude Measurement (New York: Basic Books, Inc.), 1966.
Reckers, Phillip M. and Martin E. Taylor, "Consistency in Auditors' Evaluations of Internal Control," Journal of Accounting, Auditing, and Finance (Fall, 1979), pp. 42-55.
Robblns, Walter A., Nicholas G. Apostolou and Robert H. Strawser, "Municipal Annual Reports and the Information Needs of Investors," Journal of Accounting, Auditing, and Finance (Summer, 1985), pp. 279-92.
Savich, Richard S., "The Use of Accounting Information in Decision Making," The Accounting Review (July, 1977), pp. 642-52.
Scheffe, H., The Analysis of Variance, (New York: John Wiley & Sons), 1959.
Schlpper, Katherine and Roman L. Weil, "Alternative Accounting Treatments for Pensions," The Accounting Review, (October, 1982), pp. 806-824.
Schultz, Joseph J. and S. G. Gustavson, "Actuaries' Perceptions of Variables Affecting the Independent Auditors' Legal Liability," The Accounting Review (July, 1978), pp. 626-41.
Schwartz, Richard and John M. Lorentz, "FASB Project on Employers' Accounting for Pensions," Georgia Journal of Accounting, (Spring, 1984), pp. 1-20.
Slovik, P., "Analyzing the Expert Judge: A Descriptive Study of a
Stockbroker's Decision Processes," Journal of Applied Psychology, (August, 1969), pp, 255-63,
Slovik, P., D. Flelssner, and W. S. Bauman, "Analyzing the Use of Information In Investment Decision Making: A Methodological Proposal," Journal of Business (April, 1972), pp. 283-301.
Tierney, Cornelius E. and Philip T. Calder, Governmental Accounting; Procedures and Practices, 1985 , (New York: Elsevier), 1985.
United States Department of Commerce, Finances of Employee-Retirement Systems of S££t£ and_ Local Governments in 1982-83, (August, 1984).
University of Kentucky, "Financial Reporting for Pension Plans of
Governmental Entities," University of_ Kentucky Research Study,
(March 18, 1983).

146
Van Daniker, Relmond P. and C. Richard Aldridge, "Financial Reporting for Pension Plans of Governmental Entities," The Government Accountants Journal (Winter 1984-85), pp. 13-22.
Walker, Devra P., "Sensitivity of Actuarial Assumptions in Pension Plans," Georgia Journal of Accounting, (Spring, 1984), pp. 181-95.
Weber, Richard P., "Auditor Decision Making on Overall System Reliability: Accuracy, Consensus, and the Usefulness of a Simulated Decision Aid," Journal of Accounting Research (Autumn, 1978), pp. 368-88.
Webster, John D., "Pension Reporting: A Federal Government Experience," Georgia Journal of Accounting, (Spring, 1984), pp. 61-81.
Wiggins, N. and P.J. Hoffman, "Three Models of Clinical Judgment," Journal of Abnormal Psychology (February, 1968), pp. 70-77.
Wlnklevoss, Howard E., Pension Mathematics with Numerical Illustrations, (Homewood, IL: Irwin), 1977.
Wlnklevoss, Howard E. and Dan M. McGlll, Public Pension Plans: Standards of Design, Funding, and Reporting, (Homewood, IL: Irwin), 1979.
Wright, William F., "Financial Information Processing Models: An Empirical Study," The Accounting Review (July, 1977), pp. 676-89. (a)
Wright, William F., "Self-Insight Into the Cognitive Processing of Financial Information," Accounting, Organizations and Society (1977), pp. 323-31. (b)
Wright, William F., "Properties of Judgment Models in a Financial
Setting," Organizational Behavior and Human Performance (February, 1979), pp. 73-85.
Zimmer, I., "A Lens Study of the Prediction of Corporate Failure by Bank Loan Officers," Journal of Accounting Research (Autumn, 1980), pp. 629-36.
Zimmer, I., "A Comparison of the Prediction Accuracy of Loan Officers and Their Linear-Additive Models," Organizational Behavior and Human Performance (February, 1981), pp. 69-74.

APPENDIX A
COMPARISON OF SFAS 35 AND NCGAS 6
147
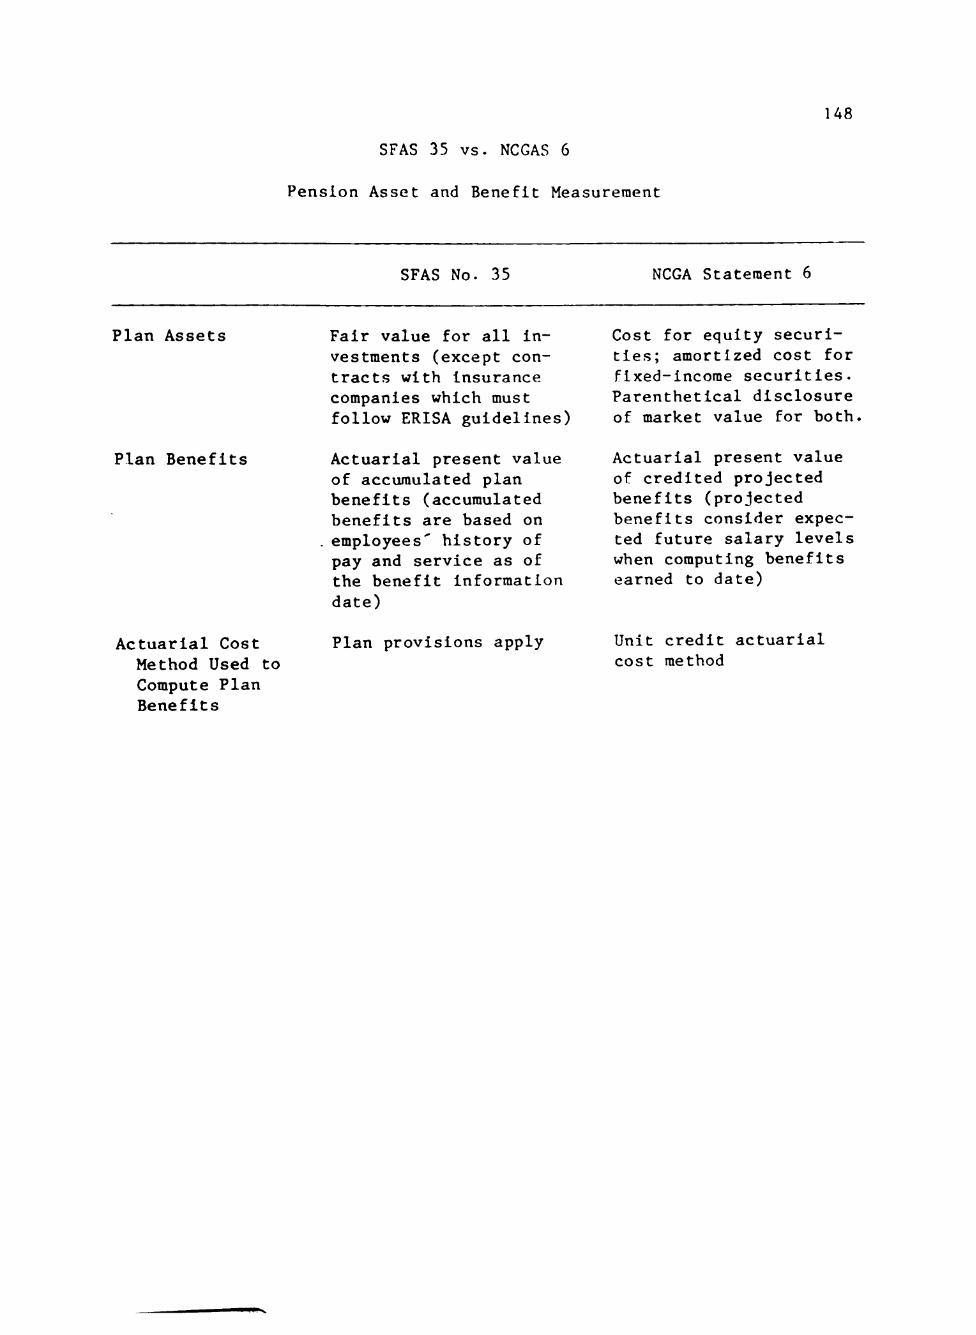
148
SFAS 35 vs. NCGAS 6
Pension Asset and Benefit Measurement
SFAS No. 35 NCGA S ta t emen t 6
P l a n A s s e t s
Plan Benefits
Actuarial Cost Method Used to Compute Plan Benefits
Fair value for all investments (except contracts with Insurance companies which must follow ERISA guidelines)
Actuarial present value of accumulated plan benefits (accumulated benefits are based on employees' history of pay and service as of the benefit information date)
Plan provisions apply
Cost for equity securities; amortized cost for fixed-income securities. Parenthetical disclosure of market value for both.
Actuarial present value of credited projected benefits (projected benefits consider expected future salary levels when computing benefits earned to date)
Unit credit actuarial cost method
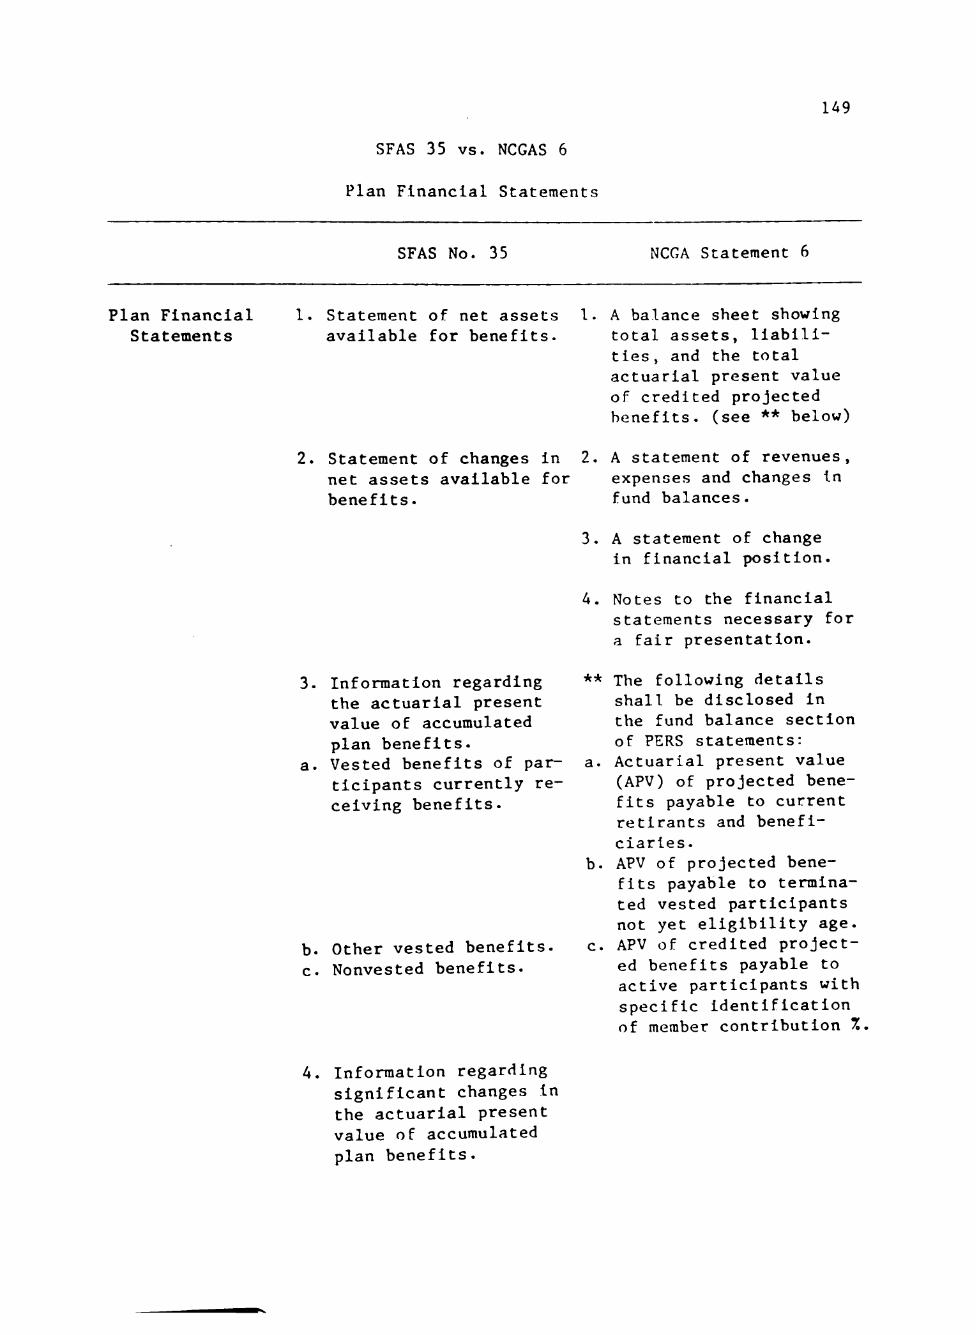
SFAS 35 vs. NCGAS 6
Plan Financial Statements
U9
SFAS No. 35 NCGA Statement 6
Plan Financial Statements
Statement of net assets available for benefits.
A balance sheet showing total assets, liabilities, and the total actuarial present value of credited projected benefits, (see ** below)
2. Statement of changes in 2. A statement of revenues, net assets available for expenses and changes In benefits. fund balances.
3. A statement of change in financial position.
4. Notes to the financial statements necessary for a fair presentation.
** The following details shall be disclosed in the fund balance section of PERS statements:
a. Actuarial present value (APV) of projected benefits payable to current retlrants and beneficiaries.
b. APV of projected benefits payable to terminated vested participants not yet eligibility age.
c. APV of credited projected benefits payable to active participants with specific Identification of member contribution %
Information regarding the actuarial present value of accumulated plan benefits. Vested benefits of par ticipants currently re ceiving benefits.
b. Other vested benefits. c. Nonvested benefits.
4. Information regarding significant changes in the actuarial present value of accumulated plan benefits.
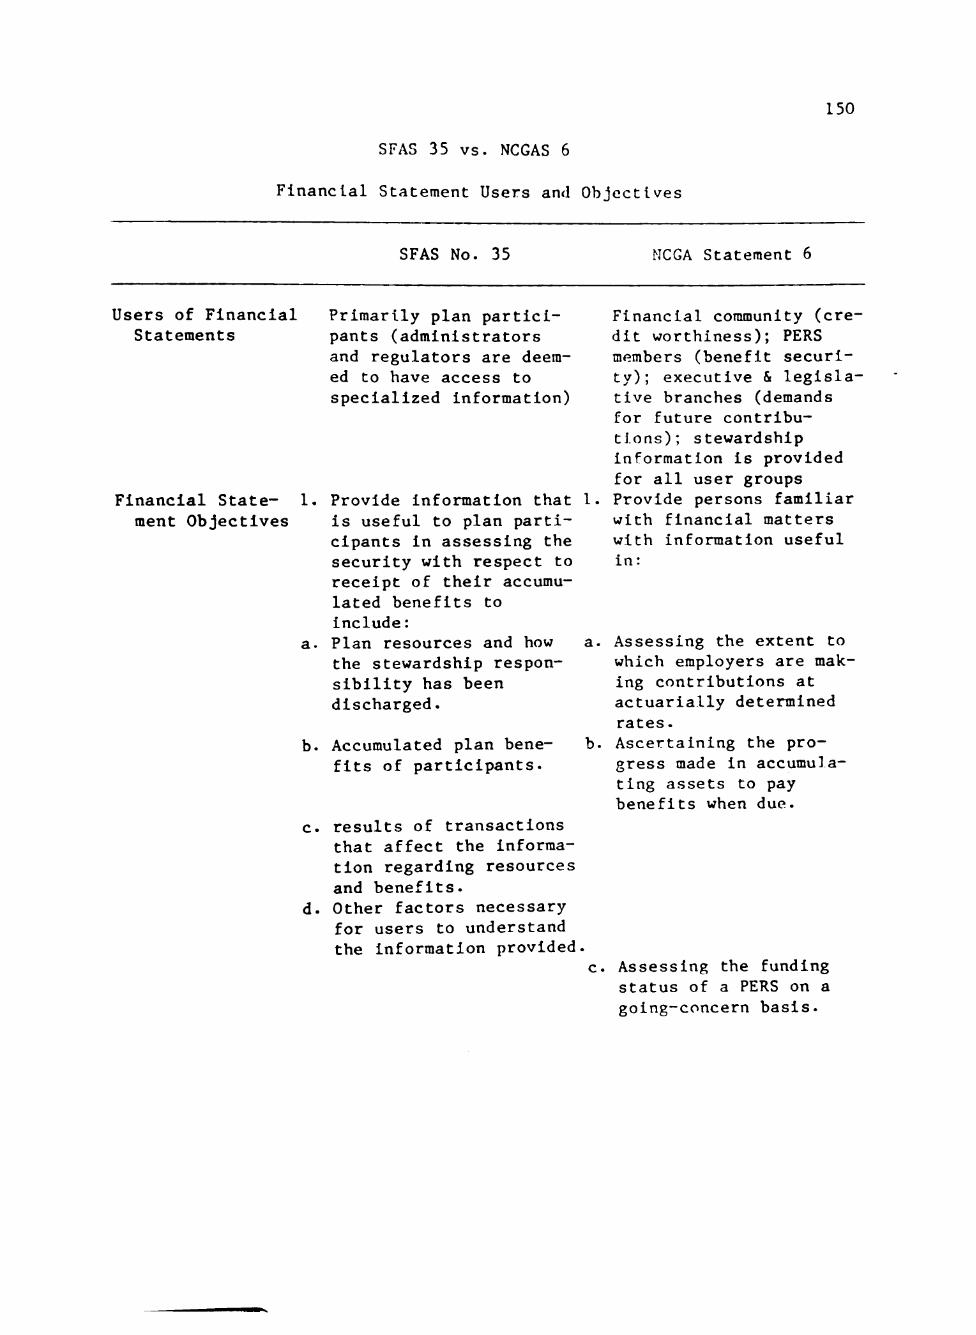
150
SFAS 35 vs. NCGAS 6
Financial Statement Users and Objectives
SFAS No. 35 NCGA Statement 6
Users of Financial Statements
Financial State- 1. ment Objectives
Primarily plan participants (administrators and regulators are deemed to have access to specialized information)
Provide Information that is useful to plan participants in assessing the security with respect to receipt of their accumulated benefits to include: Plan resources and how the stewardship responsibility has been discharged.
b. Accumulated plan benefits of participants.
c. results of transactions that affect the information regarding resources and benefits.
d. Other factors necessary for users to understand the information provided
Financial community (credit worthiness); PERS members (benefit security); executive & legislative branches (demands for future contributions); stewardship Information is provided for all user groups Provide persons familiar with financial matters with information useful in:
Assessing the extent to which employers are making contributions at actuarially determined rates. Ascertaining the progress made in accumulating assets to pay benefits when due.
Assessing the funding status of a PERS on a going-concern basis.

151
SFAS 35 vs. NCGAS 6
Additional Financial Statement Disclosures
SFAS No. 35 NCGA Statement 6
Additional Financial Statement Disclosures
Disclosure of the plan's accounting policies must include descriptions of:
1. Method used to fair 1 value investments.
2. Method and significant assumptions used to determine the actuarial present value of accumulated plan benefits.
3. Plan agreement including vesting and benefit provisions.
4. Significant plan ammendments.
The following information shall be disclosed in the notes: Summary of significant accounting and financial reporting policies to Include the method of valuing Investments. Description of actuarial cost method and assumptions.
3. Description of plan,
Comparison of actuarial values with similar values as of last benefit determination date with explanation of the amount of change due to changes in actuarial assumptions or benefits
5. Priority order of participants claims to the assets of the plan upon termination.
6. Funding policy and any changes made.
Funding requirement determinations and actual contributions
7. Investments that exceed 6. or equal 5% of available net assets.
8. Significant related 7 party transactions.
9. Significant events occuring after the last benefit information date.
Investments in any one organization that exceed or equal 5% of available net assets. Investments in securiti-tles Issued by the employer or loans to the employer.

152
SFAS 35 vs. NCGAS 6
Additional Financial Statement Disclosures, Continued
SFAS No. 35 NCGA Statement 6
8. Describe the use of the APV of credited projected benefits determined under the unit credit actuarial cost method.
9. Required statistical data:
a. 10 year comparative summary of net assets available for benefits and total APV of credited projected benefits.
b. 10 year comparative summary of amounts of unfunded APV of credited projected benefits and annual active member payroll.
c. 10 year comparative suimnary of amounts of total APV of credited projected benefits, segregated among (1) member contributions (2) current retlrants and beneficiaries (3) terminated vested participants (4) active member portion financed by the employer.
d. 10 year comparative summary of revenues by source.
e. Other statistical data as are considered appropriate, such as 10 year summary of investment results by portfolio segment.

APPENDIX B
DESCRIPTION OF BRUNSWIK'S LENS MODEL
153
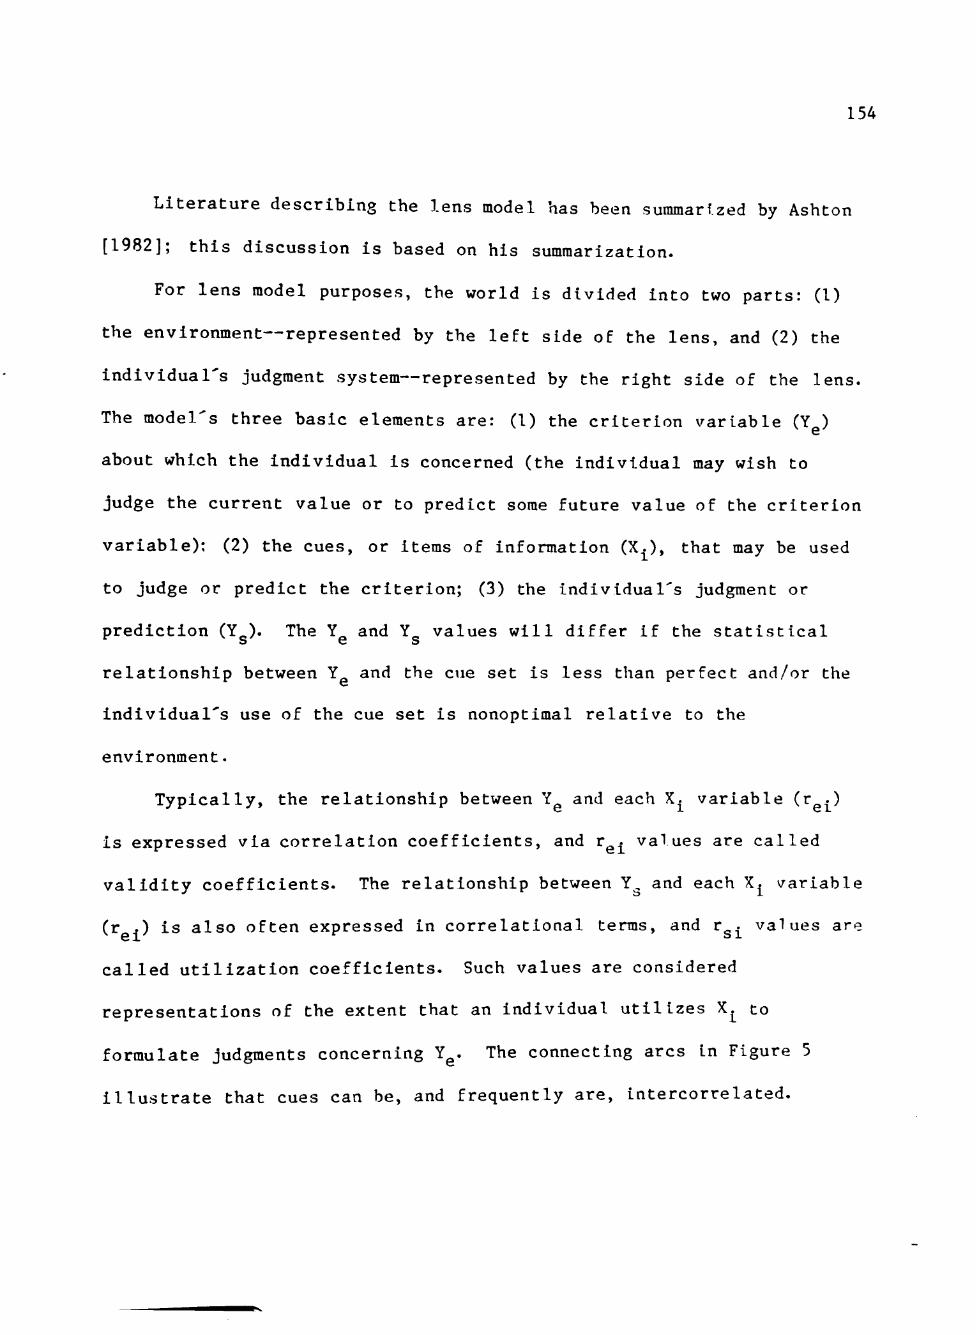
154
Literature describing the lens model has been summarized by Ashton
[1982]; this discussion is based on his summarization.
For lens model purposes, the world is divided into two parts: (1)
the environment—represented by the left side of the lens, and (2) the
individual's judgment system—represented by the right side of the lens.
The model's three basic elements are: (1) the criterion variable (Y )
about which the individual is concerned (the individual may wish to
judge the current value or to predict some future value of the criterion
variable); (2) the cues, or items of information (X.), that may be used
to judge or predict the criterion; (3) the individual's judgment or
prediction (Y ). The Y^ and Y_ values will differ if the statistical
relationship between Y and the cue set is less than perfect and/or the
Individual's use of the cue set is nonoptimal relative to the
environment.
Typically, the relationship between Y and each X. variable (r ^)
Is expressed via correlation coefficients, and r^^ values are called
validity coefficients. The relationship between Y, and each X^ variable
(r .) is also often expressed in correlational terms, and r ^ values are
called utilization coefficients. Such values are considered
representations of the extent that an individual utilizes X^ to
formulate judgments concerning Y^. The connecting arcs in Figure 5
illustrate that cues can be, and frequently are, intercorrelated.

155
The relationships existing on each side of the lens may be
represented by linear multiple regression equations:
^e " ^el^l " e2^2 + • • • + ^en^n* ^^^ (Equation l-U
^s ^ ^sl^l "*• ^s2^2 + • • • + ^sn^n' ^^^^ (Equation 1.2)
Yg is the optimal prediction of the environment and Y is the optimal
prediction of the individual's judgment.
The quality of an Individual's judgment/prediction can be evaluated
through use of values for Y^, Yg, Y^, and Y^. Six judgment indices can
be computed by correlating every pair of these four values, as
illustrated by Figure 6.
Rg (the multiple correlation coefficient) Indicates the predictive
ability of the X. variables (available cues) with respect to Y ,.
R measures the individual's consistency, or the extent to which the
individual consistently utilizes his judgment policy as represented by
Equation 1.2. The individual's accuracy in judging/predicting criterion
values is indicated by r_. However, r_ does not consider the fact that
Y is not perfectly predictable from any set of X ^ values (i.e.,
R < 1.0). Thus, two additional indices assume Importance. First, r^
represents the relationship between the individual's judgment and the
optimal multiple regression equation (Equation 1.1) prediction of the
criterion. Second, G measures the degree of correlation between the
regression equation of the individual (Equation 1.2) and the optimal
regression equation of the environment (Equation 1.1). Hammond and
Sunmiers [1972] refer to G as a measure of the knowledge the Individual
has acquired in the judgment task. The final index, r^ indicates the
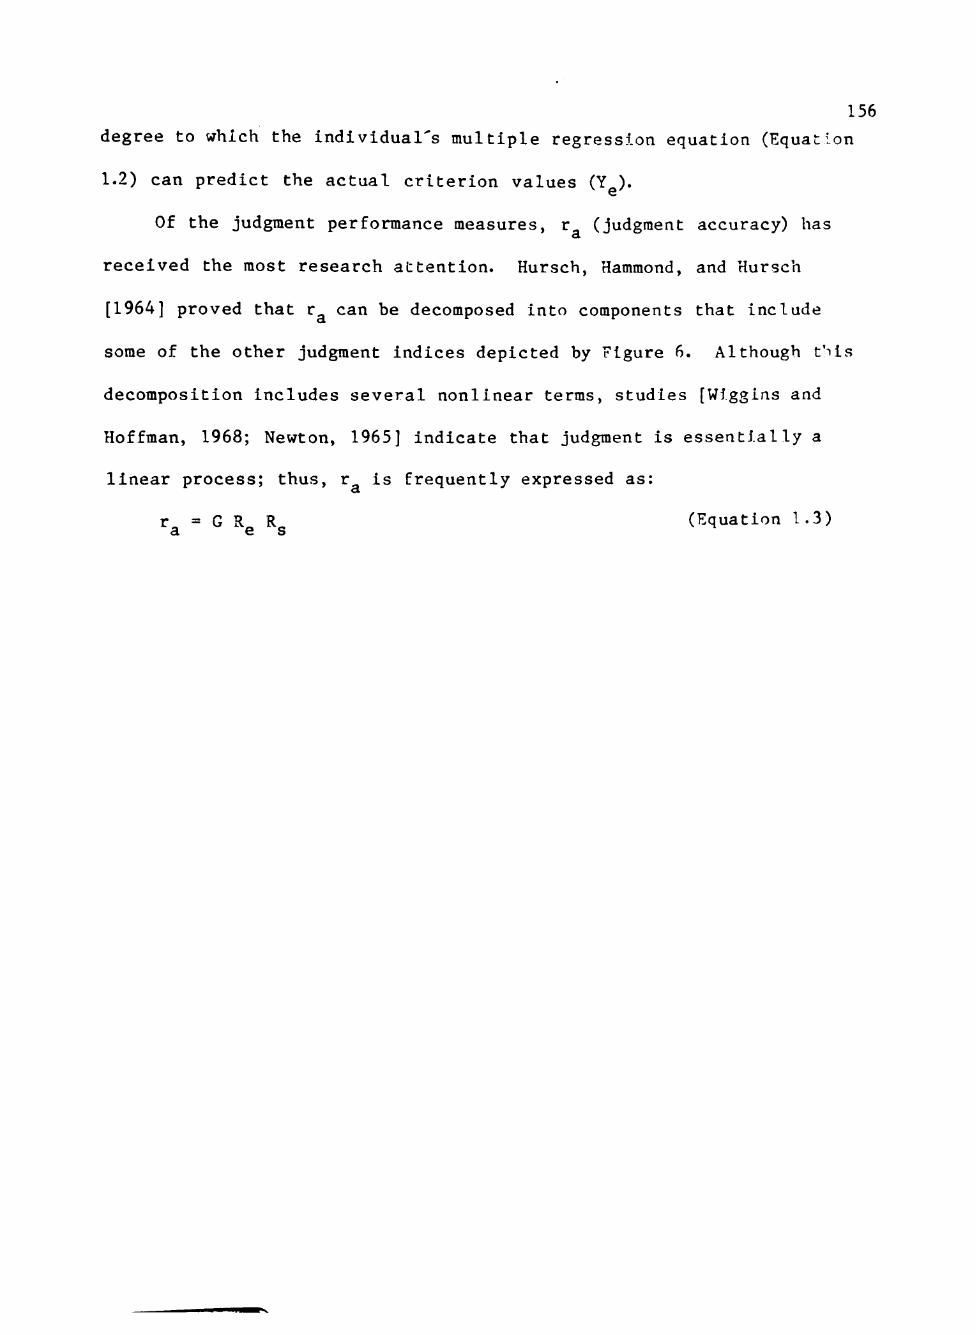
156
degree to which the individual's multiple regression equation (Equation
1.2) can predict the actual criterion values (Y ). e'
Of the judgment performance measures, r. (judgment accuracy) has
received the most research attention. Hursch, Hammond, and Hursch
[1964] proved that r can be decomposed into components that include
some of the other judgment indices depicted by Figure 6. Although tMs
decomposition includes several nonlinear terms, studies [Wiggins and
Hoffman, 1968; Newton, 1965] indicate that judgment is essentially a
linear process; thus, r is frequently expressed as:
r = G R R (Equation 1.3) a e s

APPENDIX C
RESPONDENT PACKET—NCGAS 6 VERSION
157
158
Texas Tech University College of Business Administrat ion
Box 4320/Lubbock, Texas 79409-4320/(806) 742-3166
October 16, 1985
Mr. John Doe Finance Director Example City P.O. Box 27210 Example, TX 79410
Dear Mr. Doe:
Pension costs are a burden for many governments. Yet, there is no consensus as to what cons t i tu tes "proper" PERS accounting and f i nanc ia l repor t ing. The Governmental Accounting Standards Board (GASB) i s studying the issue, however, and plans to provide a u t h o r i t a t i v e guidance on the topic by the end o f t h i s year. We need your help in t h i s matter.
The purpose of t h i s study is to see i f the pension informat ion now commonly disseminated through PERS f i nanc ia l repor ts i s adequate to support decision making by persons in terested in PERS. The input you can provide by p a r t i c i p a t i n g i n t h i s study should help the GASB to determine the Informat ion tha t PERS f i nanc ia l statement users f i nd most h e l p f u l ; thus, the GASB requests your pa r t i c i pa t i on in th i s study (see attached l e t t e r ) .
Please take 30-35 minutes to study the enclosed PERS f i nanc ia l statements, complete the attached quest ionnaire, and return i t in the stamped envelope as soon as poss ib le . You may be assured of complete c o n f i d e n t i a l i t y as only summarized informat ion w i l l be prepared from the responses.
You may be chal lenged by parts of the quest ionnaire. I f you have d i f f i c u l t y , please do your best to answer as many of the questions as you can and re tu rn the questionnaire—even i f i t is incomplete. Indeed, your he lp i s essent ia l to i d e n t i f y the aspects of current pension repor t ing that cause problems fo r f i nanc ia l statement users as we l l as those that are w ide ly understood.
I f you have any questions regarding t h i s p ro jec t , please contact me at (806) 742-1525. Summarized r e s u l t s of the study w i l l be sent to a l l p a r t i c i p a n t s . Thank you for your assistance.
S incere ly ,
Stephen D. W i l l i t s
•An Iquil Ofiporlunily/Allirmilive Action Insumiinn'
159
GOVERNMEtfTAL ACCOUNUNG STANDARDS BOARD High Ridge Park, PO Box 3821. Stamkxd. Connecticut 0690W)8211203-968-7325
Martin Ives VIceChaHmarvOHeclor o) Reseatcn
July 31, 1985
Dear Sir;
Accounting and financial reporting for public employee retirement systems and employer reporting of pension expenditures and obligations are major topics on the Governmental Accounting Standards Board agenda. Both topics present problems that must be addressed during the standard setting process, and the GASB wishes to consider any information that might aid in their resolution. Accordingly, we support and endorse independent research efforts to supplement studies undertaken by the GASB staff.
The study being conducted by Stephen D. Willits of Texas Tech University addresses questions that concern the GASB. Valid results are possible, however, only if a sufficient number of persons carefully complete the research instrument. Accordingly, we urge your participation in this study.
Sincerely,
Martin Ives
MI:566i
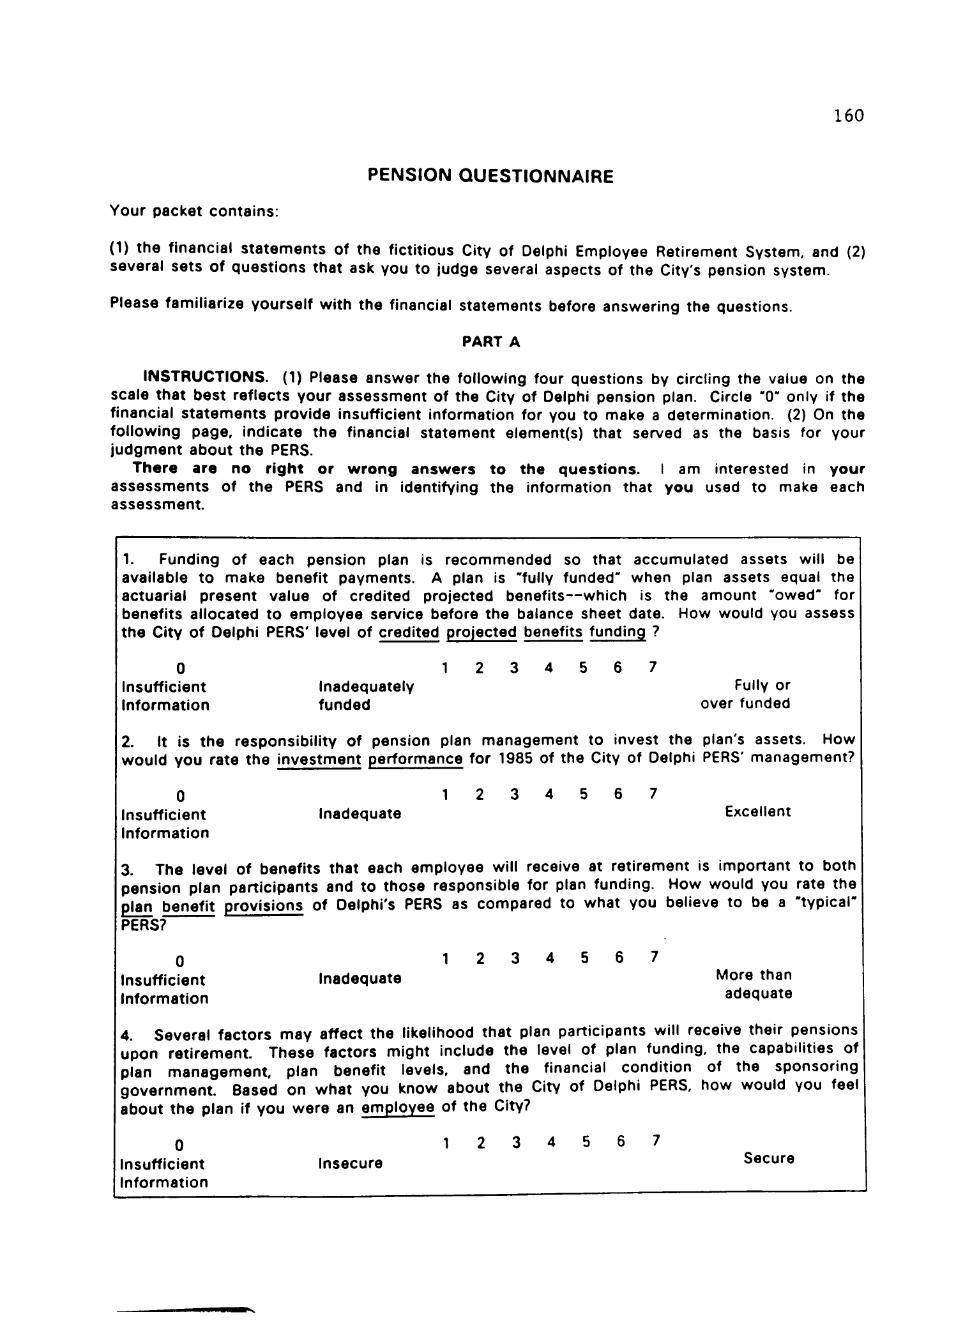
160
PENSION QUESTIONNAIRE
Your packet contains:
(1) the financial statements of the fictitious City of Delphi Employee Retirement System, and (2) several sets of questions that ask you to judge several aspects of the City's pension system.
Please familiarize yourself with the financial statements before answering the questions.
PART A
INSTRUCTIONS. (1) Please answer the following four questions by circling the value on the scale that best reflects your assessment of the City of Delphi pension plan. Circle "0" only if the financial statements provide insufficient information for you to make a determination. (2) On the following page, indicate the financial statement element(s) that served as the basis for your judgment about the PERS.
There are no right or wrong answers to the questions. I am interested in your assessments of the PERS and in identifying the information that you used to make each assessment.
1. Funding of each pension plan is recommended so that accumulated assets will be available to make benefit payments. A plan is "fully funded" when plan assets equal the actuarial present value of credited projected benefits—which is the amount "owed" for benefits allocated to employee service before the balance sheet date. How would you assess the City of Delphi PERS' level of credited projected benefits funding ?
0 1 2 3 4 5 6 7 Insufficient Inadequately Fully or Information funded over funded
2. It is the responsibility of pension plan management to invest the plan's assets. How would you rate the investment performance for 1985 of the City of Delphi PERS' management?
0 1 2 3 4 5 6 7 Insufficient Inadequate Excellent Information
3. The level of benefits that each employee will receive at retirement is important to both pension plan participants and to those responsible for plan funding. How would you rate the plan benefit provisions of Delphi's PERS as compared to what you believe to be a "typical" PERS?
0 1 2 3 4 5 6 7 Insufficient Inadequate More than Information adequate
4. Several factors may affect the likelihood that plan participants will receive their pensions upon retirement. These factors might include the level of plan funding, the capabilities of plan management, plan benefit levels, and the financial condition of the sponsoring government. Based on what you know about the City of Delphi PERS, how would you feel about the plan if you were an employee of the City?
0 1 2 3 4 5 6 7 Insufficient Insecure Secure Information

161
INSTRUCTIONS. Please indicate the PERS financial statement element(s) that you relied upon when you answered questions 1-4. Do so by placing check marks in the appropriate columns Use an * to indicate those items that were very important in your evaluation.
QUESTION 1 2 3 4
Projected Invest- Plan Security Benefits ment Per- Benefit of Funding formance Provisions Employee
FINANCIAL STATEMENT ELEMENTS
BALANCE SHEET:
Assets Liabilities Projected Benefits Unfunded Projected Benefits
STATEMENT OF REVENUES, EXPENSES AND CHANGES IN FUND BALANCE:
Contributions Investment Income Operating Expenses Fund Balance Changes
STATEMENT OF CHANGES IN FINANCIAL POSITION:
Resources Provided Resources Used
NOTES TO FINANCIAL STATEMENTS:
Description of Plan Significant Accounting and Financial
Reporting Policies Actuarial Cost Method and Assumptions Funding Requirement Determinations and
Actual Contributions Explanation of Actuarial Values and Changes Investments
STATISTICAL DATA:
Summary of Net Assets Available for Benefits
Summary of Unfunded Actuarial Present Value of Projected Benefits
Summary of Actuarial Values Covered by Net Assets
Investment Performance Measurements Summary of Revenues and Expenses
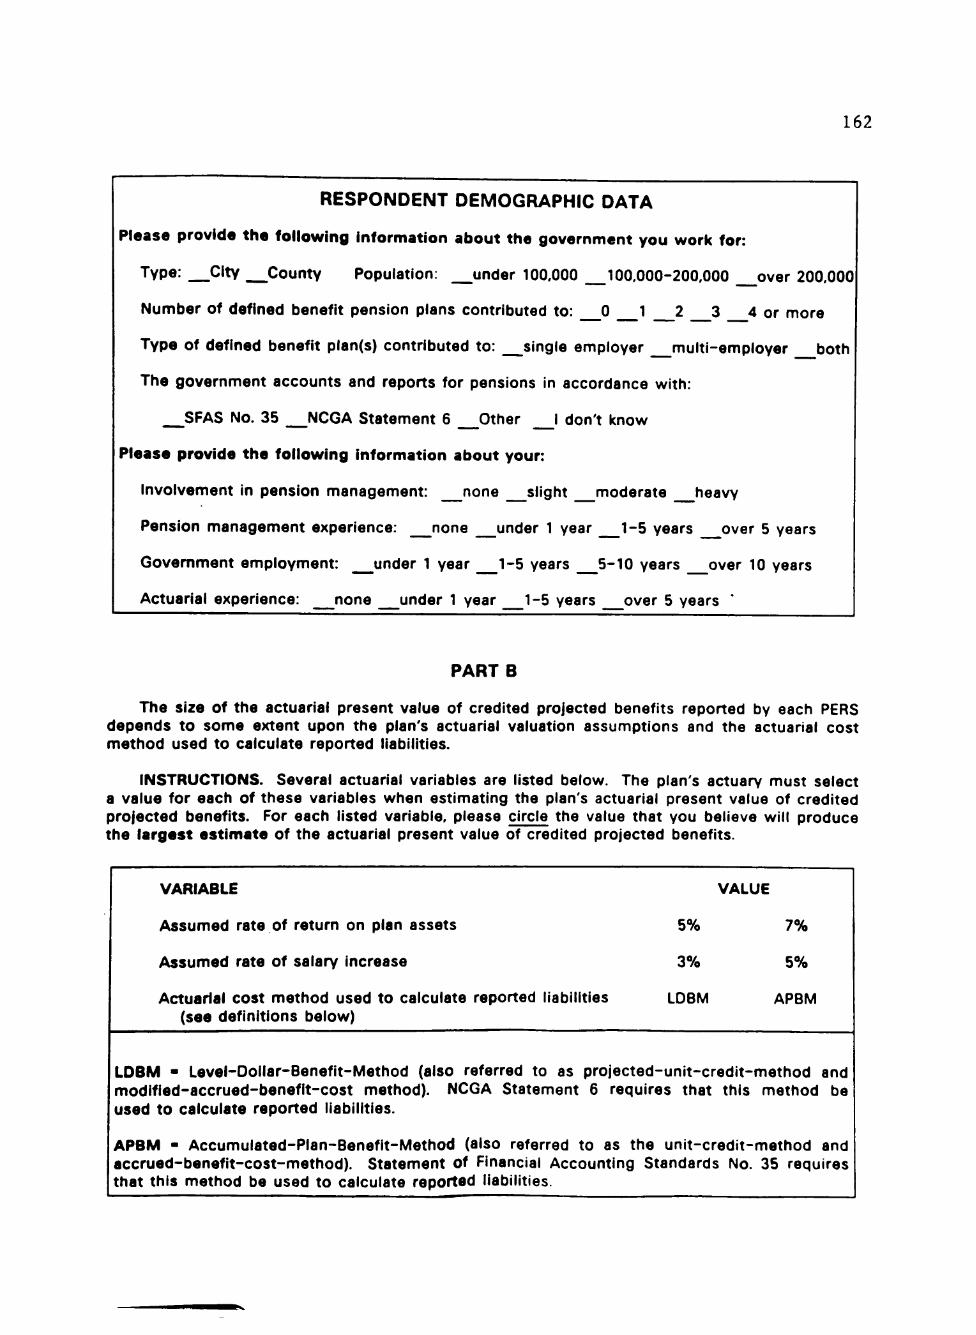
162
RESPONDENT DEMOGRAPHIC DATA
Please provide the following information about the government you work for:
Type: City County Population: under 100,000 100,000-200,000 over 200,000
Number of defined benefit pension plans contributed to: 0 1 2 3 4 or more
Type of defined benefit plan(s) contributed to: single employer multi-employer both
The government accounts and reports for pensions in accordance with:
SFAS No. 35 NCGA Statement 6 Other I don't know
Please provide the following information about your:
Involvement in pension management: none slight moderate heavy
Pension management experience: none under 1 year 1-5 years over 5 years
Government employment: under 1 year 1-5 years 5-10 years over 10 years
Actuarial experience: none under 1 year 1-5 years over 5 years "
PART B
The size of the actuarial present value of credited projected benefits reported by each PERS depends to some extent upon the plan's actuarial valuation assumptions and the actuarial cost method used to calculate reported liabilities.
INSTRUCTIONS. Several actuarial variables are listed below. The plan's actuary must select a value for each of these variables when estimating the plan's actuarial present value of credited projected benefits. For each listed variable, please circle the value that you believe will produce the largest estimate of the actuarial present value of credited projected benefits.
VARIABLE VALUE
Assumed rate of return on plan assets 5% 7%
Assumed rate of salary increase 3% 5%
Actuarial cost method used to calculate reported liabilities LDBM APBM (see definitions below)
LDBM - Level-Oollar-Benefit-Method (also referred to as projected-unit-credit-method and modifled-accrued-benefit-cost method). NCGA Statement 6 requires that this method be used to calculate reported liabilities.
APBM - Accumulated-Plan-Benefit-Method (also referred to as the unit-credit-method and accrued-benefit-cost-method). Statement of Financial Accounting Standards No. 35 requires that this method be used to calculate reported liabilities.
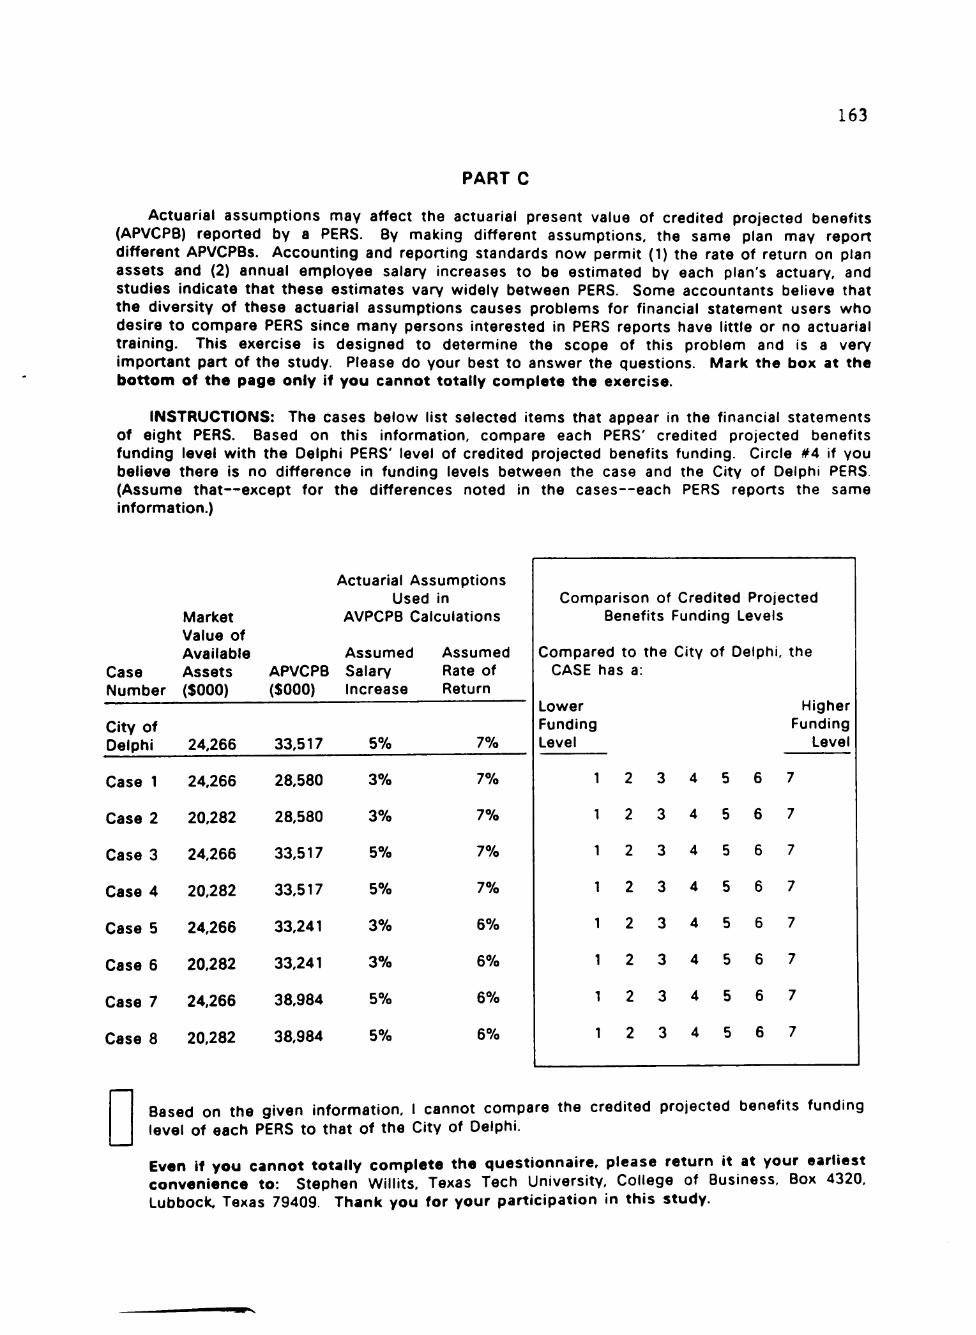
163
PART C
Actuarial assumptions may affect the actuarial present value of credited projected benefits (APVCPB) reported by a PERS. By making different assumptions, the same plan may report different APVCPBs. Accounting and reporting standards now permit (1) the rate of return on plan assets and (2) annual employee salary increases to be estimated by each plan's actuary, and studies indicate that these estimates vary widely between PERS. Some accountants believe that the diversity of these actuarial assumptions causes problems for financial statement users who desire to compare PERS since many persons interested in PERS reports have little or no actuarial training. This exercise is designed to determine the scope of this problem and is a very important part of the study. Please do your best to answer the questions. Mark the box at the bottom of the page only if you cannot totally complete the exercise.
INSTRUCTIONS: The cases below list selected items that appear in the financial statements of eight PERS. Based on this information, compare each PERS' credited projected benefits funding level with the Delphi PERS' level of credited projected benefits funding. Circle #4 If you believe there is no difference in funding levels between the case and the City of Delphi PERS (Assume that—except for the differences noted in the cases—each PERS reports the same information.)
Case Number
Market Value of Available Assets ($000)
Actuarial Assumptions Used in
AVPCPB Calculations
Assumed Assumed APVCPB Salary Rate of ($000) Increase Return
City of Delphi
Case 1
Case 2
Case 3
Case 4
Case 5
Case 6
Case 7
Case 8
24,266
24,266
20,282
24,266
20.282
24,266
20,282
24,266
20.282
33,517
28,580
28,580
33,517
33,517
33,241
33,241
38,984
38,984
5%
3%
3%
5%
5%
3%
3%
5%
5%
7%
7%
7%
7%
7%
6%
6%
6%
6%
Comparison of Credited Projected Benefits Funding Levels
Compared to the CASE has a:
Lower Funding Level
1 2
1 2
1 2
1 2
1 2
1 2
1 2
1 2
3
3
3
3
3
3
3
3
City of Delphi
4
4
4
4
4
4
4
4
5
5
5
5
5
5
5
5
6
6
6
6
6
6
6
6
, the
Higher Funding
Level
7
7
7
7
7
7
7
7
Based on the given information, I cannot compare the credited projected benefits funding level of each PERS to that of the City of Delphi.
Even if you cannot totally complete the questionnaire, please return it at your earliest convenience to: Stephen Willits, Texas Tech University, College of Business, Box 4320, Lubbock, Texas 79409. Thank you for your participation in this study.
164
CITY OF DELPHI
EMPLOYEE RETIREMENT SYSTEM
ANNUAL REPORT
JUNE 30. 1985

165
SMITH & JONES, CERTIFIED PUBLIC ACCOUNTANTS
To the Members of the City of Delphi Employee Retirement System
We have examined the accompanying financial statements of the City of Delphi Employee Retirement System for the year ended June 30, 1985. Our examination was made in accordance with generally accepted auditing standards and Included such tests of the accounting records and such other auditing procedures as we considered necessary in the circumstances.
In our opinion, based upon our examination, the financial statements referred to above present fairly the financial position and the changes in financial position of the City of Delphi Employee Retirement System as of June 30. 1985 and the results of its operations for the year then ended in conformity with generally accepted accounting principles applied on a basis consistent with that of the preceding year.
>K.j^^Xl Certified Public Ace
September 5, 1985 City of Delphi, USA
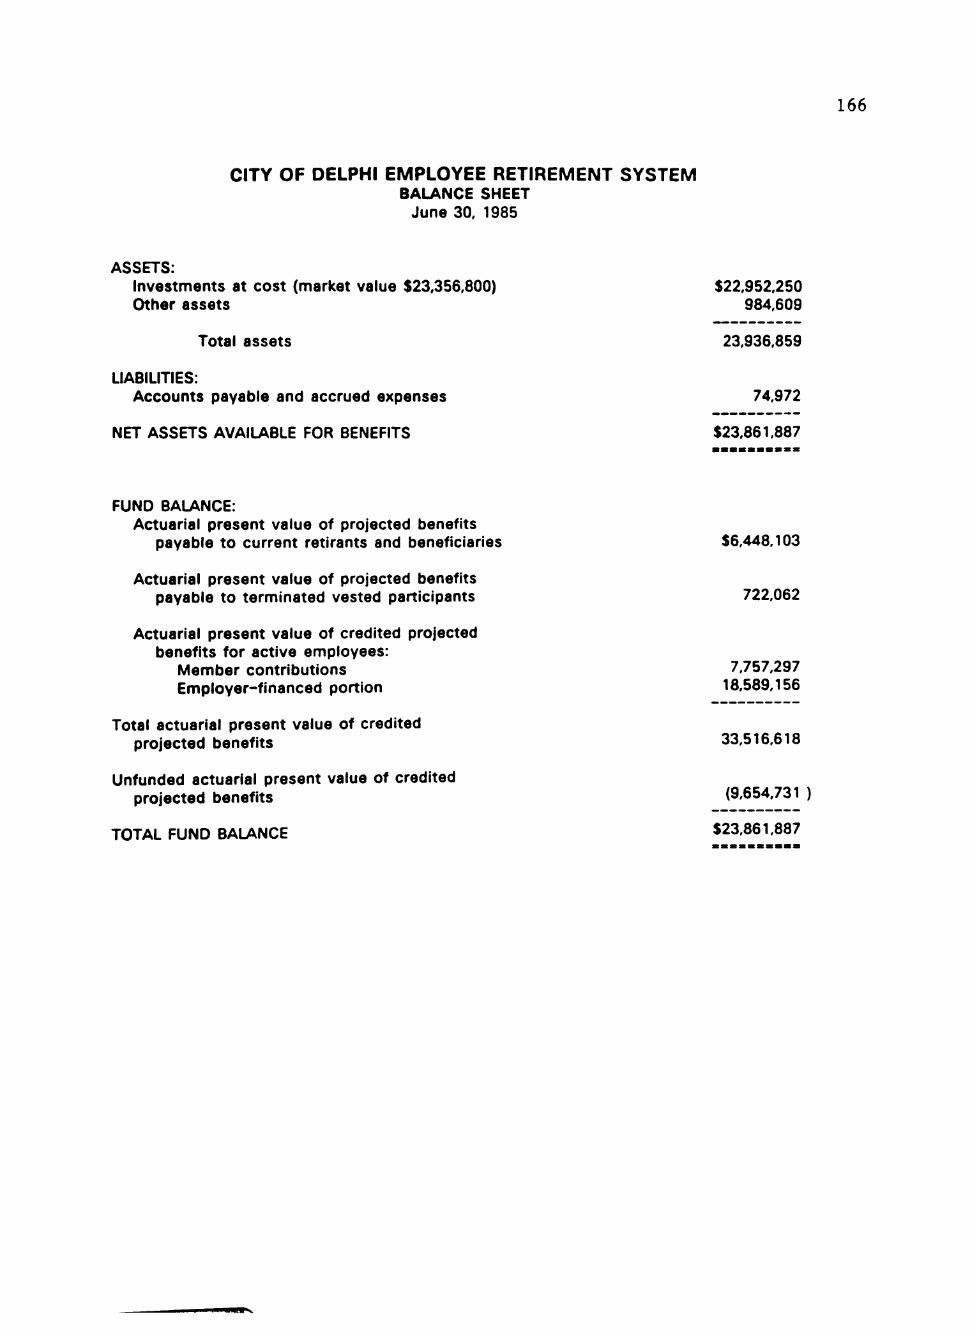
166
CITY OF DELPHI EMPLOYEE RETIREMENT SYSTEM BALANCE SHEET
June 30, 1985
ASSETS: Investments at cost (market value $23,356,800) $22,952,250 Other assets 984,609
Total assets 23,936,859
LIABILITIES: Accounts payable and accrued expenses 74.972
NET ASSETS AVAILABLE FOR BENEFITS $23,861,887
FUND BALANCE: Actuarial present value of projected benefits
payable to current retlrants and beneficiaries $6,448,103
Actuarial present value of projected benefits payable to terminated vested participants 722.062
Actuarial present value of credited projected benefits for active employees:
Member contributions 7,757.297 Employer-financed portion 18.589.156
Total actuarial present value of credited projected benefits 33.516.618
Unfunded actuarial present value of credited projected benefits (9.654,731 )
TOTAL FUND BALANCE $23,861,887
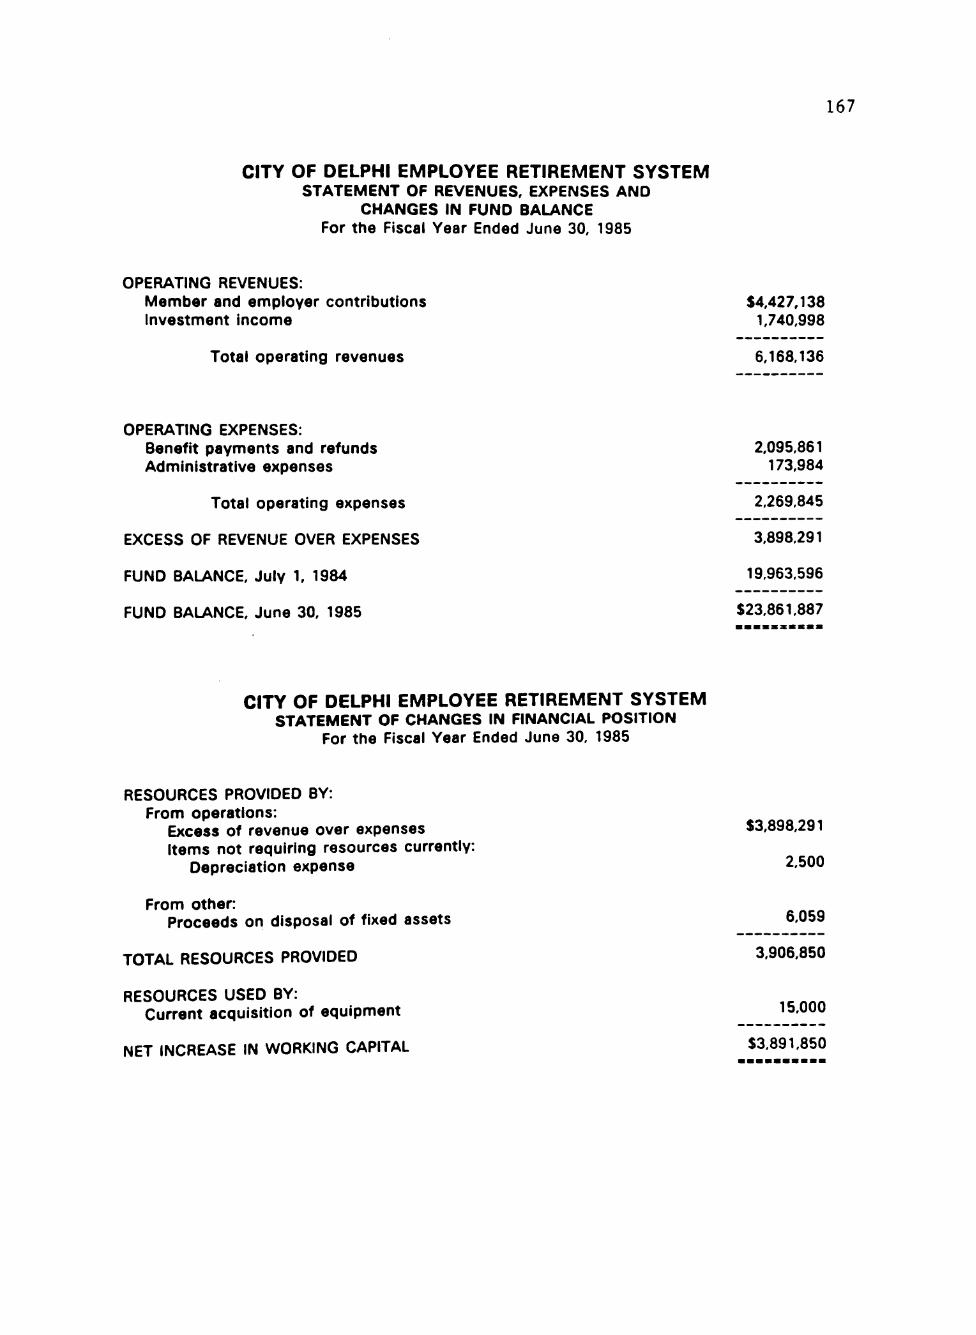
167
CITY OF DELPHI EMPLOYEE RETIREMENT SYSTEM STATEMENT OF REVENUES, EXPENSES AND
CHANGES IN FUND BALANCE For the Fiscal Year Ended June 30, 1985
OPERATING REVENUES: Member and employer contributions $4,427,138 Investment income 1,740.998
Total operating revenues 6.168,136
OPERATING EXPENSES: Benefit payments and refunds 2.095.861 Administrative expenses 173,984
Total operating expenses 2.269,845
EXCESS OF REVENUE OVER EXPENSES 3,898,291
FUND BALANCE. July 1. 1984 19,963,596
FUND BALANCE. June 30, 1985 $23,861,887
CITY OF DELPHI EMPLOYEE RETIREMENT SYSTEM STATEMENT OF CHANGES IN FINANCIAL POSITION
For the Fiscal Year Ended June 30, 1985
RESOURCES PROVIDED BY: From operations:
Excess of revenue over expenses $3,898,291 Items not requiring resources currently:
Depreciation expense 2.500
From other:
Proceeds on disposal of fixed assets 6.059
TOTAL RESOURCES PROVIDED 3,906.850
RESOURCES USED BY: Current acquisition of equipment 15,000
NET INCREASE IN WORKING CAPITAL $3,891,850
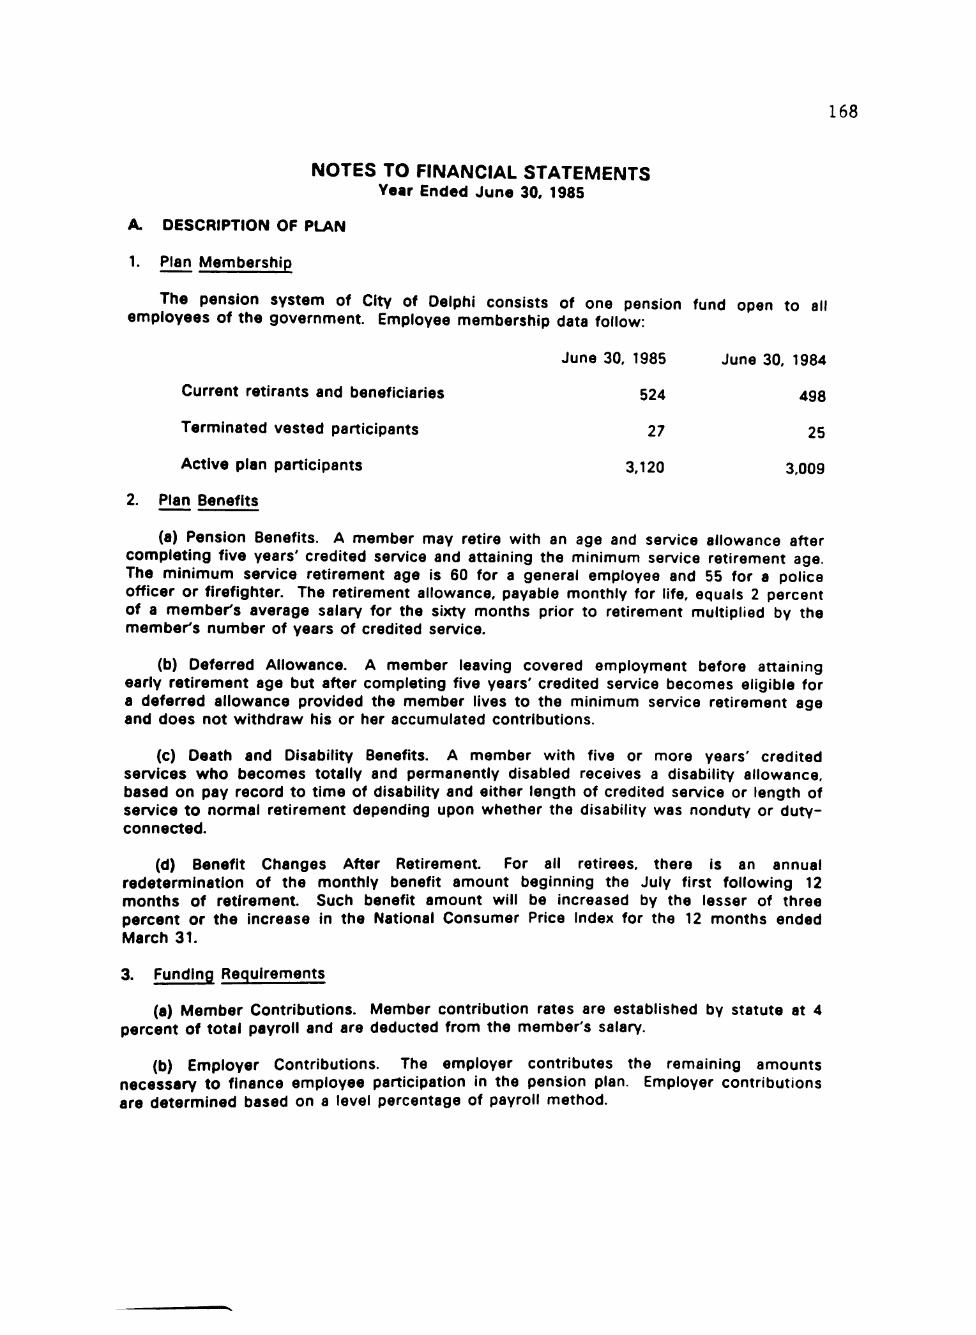
168
NOTES TO FINANCIAL STATEMENTS Year Ended June 30, 1985
A DESCRIPTION OF PLAN
1. Plan Membership
The pension system of City of Delphi consists of one pension fund open to al employees of the government. Employee membership data follow:
30, 1985
524
27
3,120
June 30, 1984
498
25
3.009
Current retlrants and beneficiaries
Terminated vested participants
Active plan participants
2. Plan Benefits
(a) Pension Benefits. A member may retire with an age and service allowance after completing five years' credited service and attaining the minimum service retirement age. The minimum service retirement age is 60 for a general employee and 55 for a police officer or firefighter. The retirement allowance, payable monthly for life, equals 2 percent of a member's average salary for the sixty months prior to retirement multiplied by the member's number of years of credited service.
(b) Deferred Allowance. A member leaving covered employment before attaining early retirement age but after completing five years' credited service becomes eligible for a deferred allowance provided the member lives to the minimum service retirement age and does not withdraw his or her accumulated contributions.
(c) Death and Disability Benefits. A member with five or more years' credited services who becomes totally and permanently disabled receives a disability allowance, based on pay record to time of disability and either length of credited service or length of service to normal retirement depending upon whether the disability was nonduty or duty-connected.
(d) Benefit Changes After Retirement. For all retirees, there is an annual redetermination of the monthly benefit amount beginning the July first following 12 months of retirement Such benefit amount will be increased by the lesser of three percent or the increase in the National Consumer Price Index for the 12 months ended March 31,
3. Funding Requirements
(a) Member Contributions. Member contribution rates are established by statute at 4 percent of total payroll and are deducted from the member's salary.
(b) Employer Contributions. The employer contributes the remaining amounts necessary to finance employee participation in the pension plan. Employer contributions are determined based on a level percentage of payroll method.
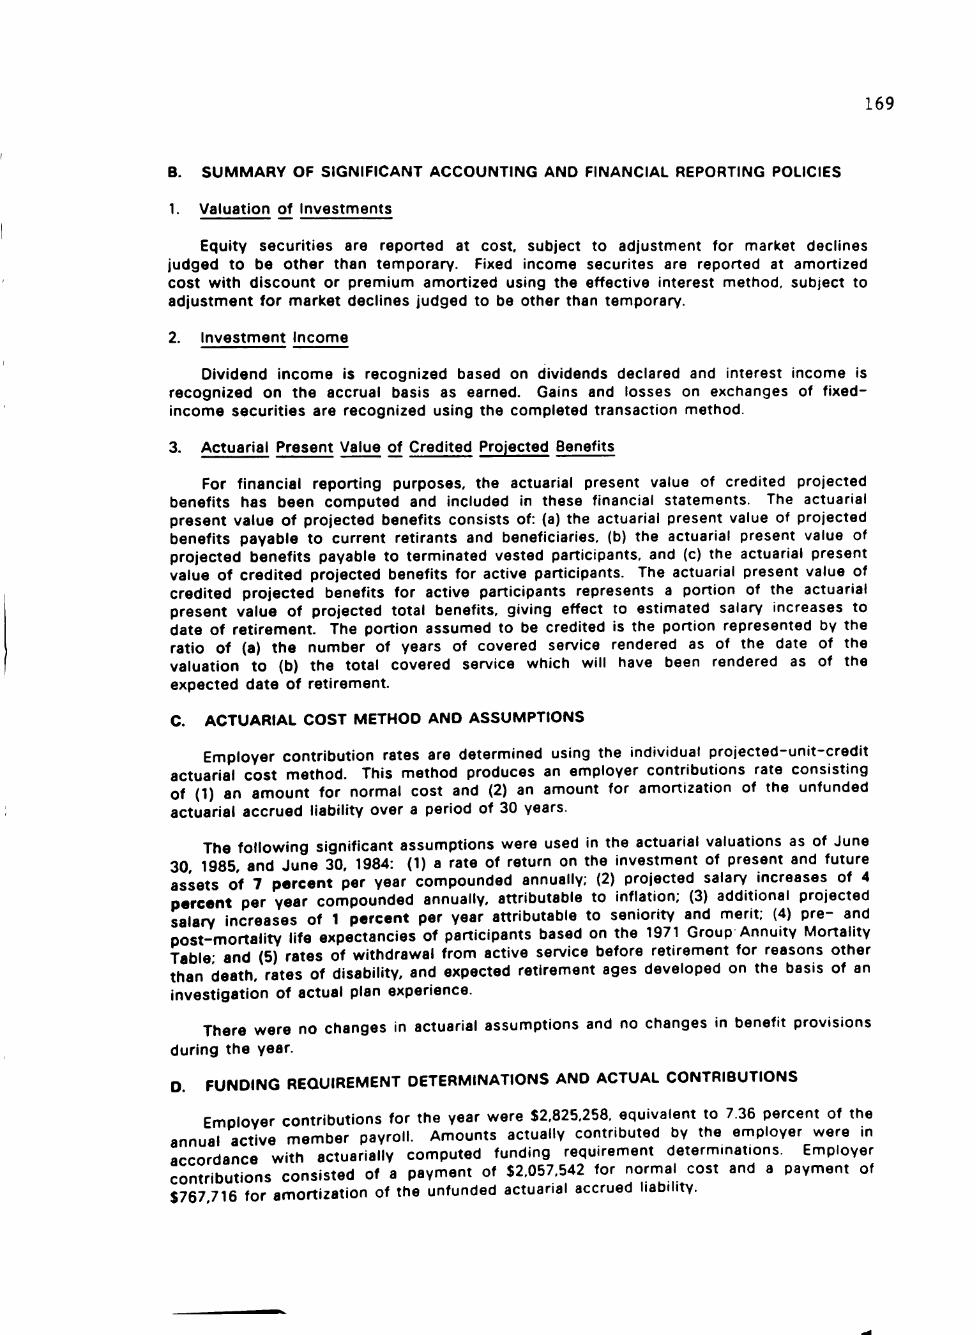
169
B. SUMMARY OF SIGNIFICANT ACCOUNTING AND FINANCIAL REPORTING POLICIES
1. Valuation of Investments
Equity securities are reported at cost, subject to adjustment for market declines judged to be other than temporary. Fixed income securites are reported at amortized cost with discount or premium amortized using the effective interest method, subject to adjustment for market declines judged to be other than temporary.
2. Investment Income
Dividend income is recognized based on dividends declared and interest income is recognized on the accrual basis as earned. Gains and losses on exchanges of fixed-income securities are recognized using the completed transaction method.
3. Actuarial Present Value of Credited Projected Benefits
For financial reporting purposes, the actuarial present value of credited projected benefits has been computed and included in these financial statements. The actuarial present value of projected benefits consists of: (a) the actuarial present value of projected benefits payable to current retlrants and beneficiaries, (b) the actuarial present value of projected benefits payable to terminated vested participants, and (c) the actuarial present value of credited projected benefits for active participants. The actuarial present value of credited projected benefits for active participants represents a portion of the actuarial present value of projected total benefits, giving effect to estimated salary increases to date of retirement. The portion assumed to be credited is the portion represented by the ratio of (a) the number of years of covered service rendered as of the date of the valuation to (b) the total covered service which will have been rendered as of the expected date of retirement
C. ACTUARIAL COST METHOD AND ASSUMPTIONS
Employer contribution rates are determined using the individual projected-unit-credit actuarial cost method. This method produces an employer contributions rate consisting of (1) an amount for normal cost and (2) an amount for amortization of the unfunded actuarial accrued liability over a period of 30 years.
The following significant assumptions were used in the actuarial valuations as of June 30, 1985, and June 30, 1984: (1) a rate of return on the investment of present and future assets of 7 percent per year compounded annually; (2) projected salary increases of 4 percent per year compounded annually, attributable to inflation; (3) additional projected salary increases of 1 percent per year attributable to seniority and merit (4) pre- and post-mortality life expectancies of participants based on the 1971 Group Annuity Mortality Table and (5) rates of withdrawal from active service before retirement for reasons other than death, rates of disability, and expected retirement ages developed on the basis of an investigation of actual plan experience.
There were no changes in actuarial assumptions and no changes in benefit provisions
during the year.
D. FUNDING REQUIREMENT DETERMINATIONS AND ACTUAL CONTRIBUTIONS
Employer contributions for the year were $2,825,258, equivalent to 7.36 percent of the annual active member payroll. Amounts actually contributed by the employer were in accordance with actuarially computed funding requirement determinations. Employer contributions consisted of a payment of $2,057,542 for normal cost and a payment of $767 716 for amortization of the unfunded actuarial accrued liability.
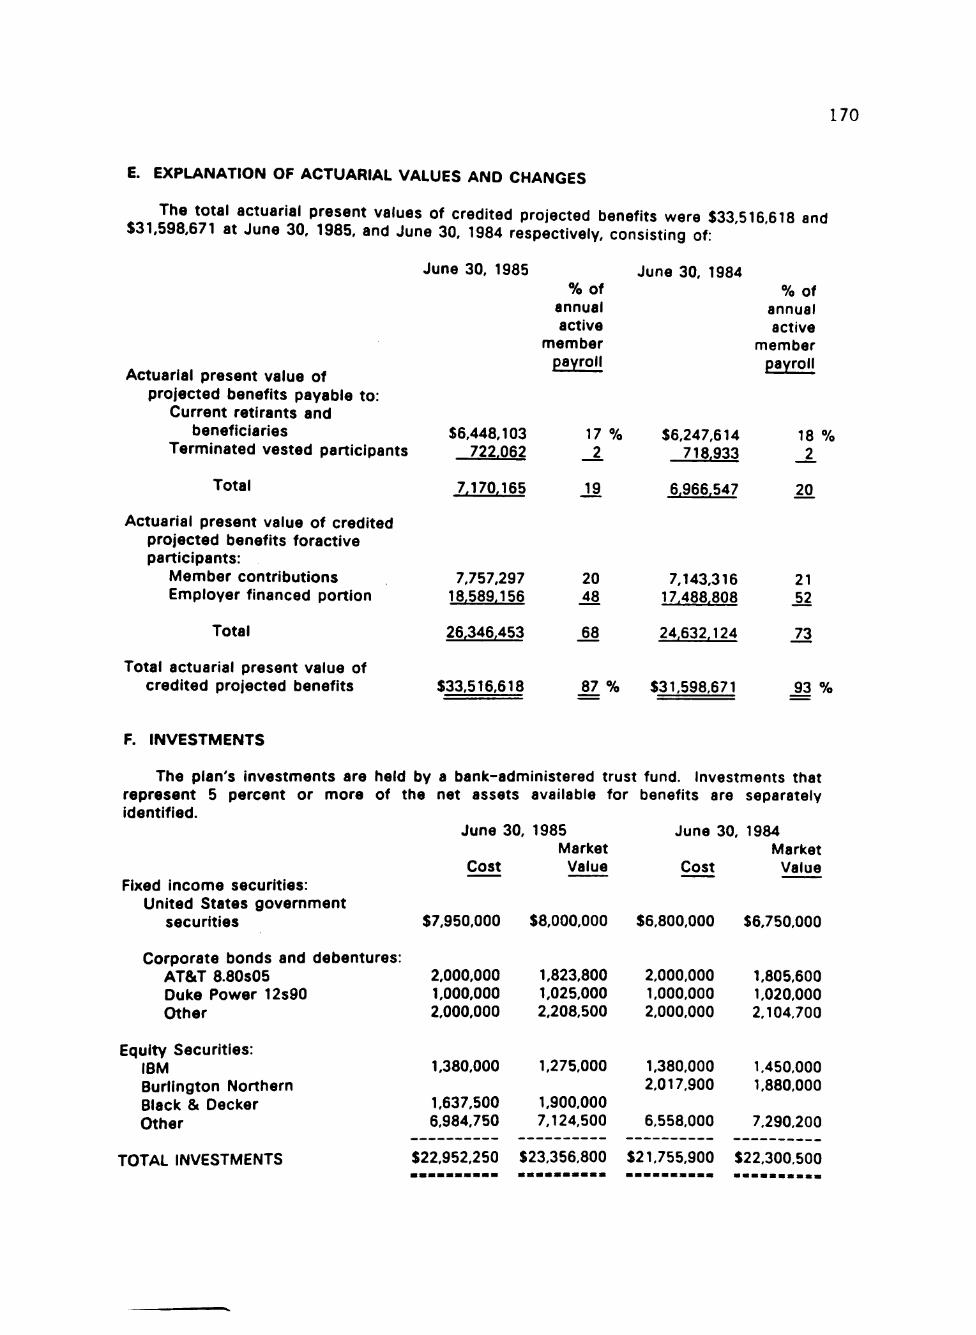
170
E. EXPLANATION OF ACTUARIAL VALUES AND CHANGES
The total actuarial present values of credited projected benefits were $33,516 618 and $31,598,671 at June 30, 1985, and June 30, 1984 respectively, consisting of:
Actuarial present value of projected benefits payable to:
Current retlrants and beneficiaries
Terminated vested participants
Total
Actuarial present value of credited projected benefits foractive participants:
Member contributions Employer financed portion
Total
Total actuarial present value of credited projected benefits
June 30, 1985 % of
annual active
member payroll
$6,448,103 722.062
7.757.297 18,589.156
26.346.453
$33.516,618
17 % 2
7.170,165 J ^
20 M
68
June 30, 1984 % of
annual active
member payroll
$6,247,614 718,933
7.143,316 17,488.808
24,632,124
87 % $31,598,671
18 % 2
6,966.547 20.
21 31
73
93 %
F. INVESTMENTS
The plan's investments are held by a bank-administered trust fund. Investments that represent 5 percent or more of the net assets available for benefits are separately identified.
June 30, 1985 June 30, 1984 Market Market
Cost Value Cost Value Fixed income securities:
United States government securities $7,950,000 $8,000,000 $6,800,000 $6,750,000
Corporate bonds and debentures: AT&T 8.80S05 Duke Power 12s90 Other
Equity Securities: IBM Burlington Northern Black 8( Decker Other
TOTAL INVESTMENTS
2,000,000 1.000,000 2,000,000
1,380,000
1,637,500 6.984,750
1.823,800 1,025,000 2,208,500
1,275,000
1.900,000 7.124,500
2,000,000 1,000,000 2,000,000
1.380,000 2,017,900
1.805,600 1.020.000 2.104,700
1,450,000 1.880,000
6,558.000 7,290,200
$22,952,250 $23,356,800 $21,755,900 $22,300,500
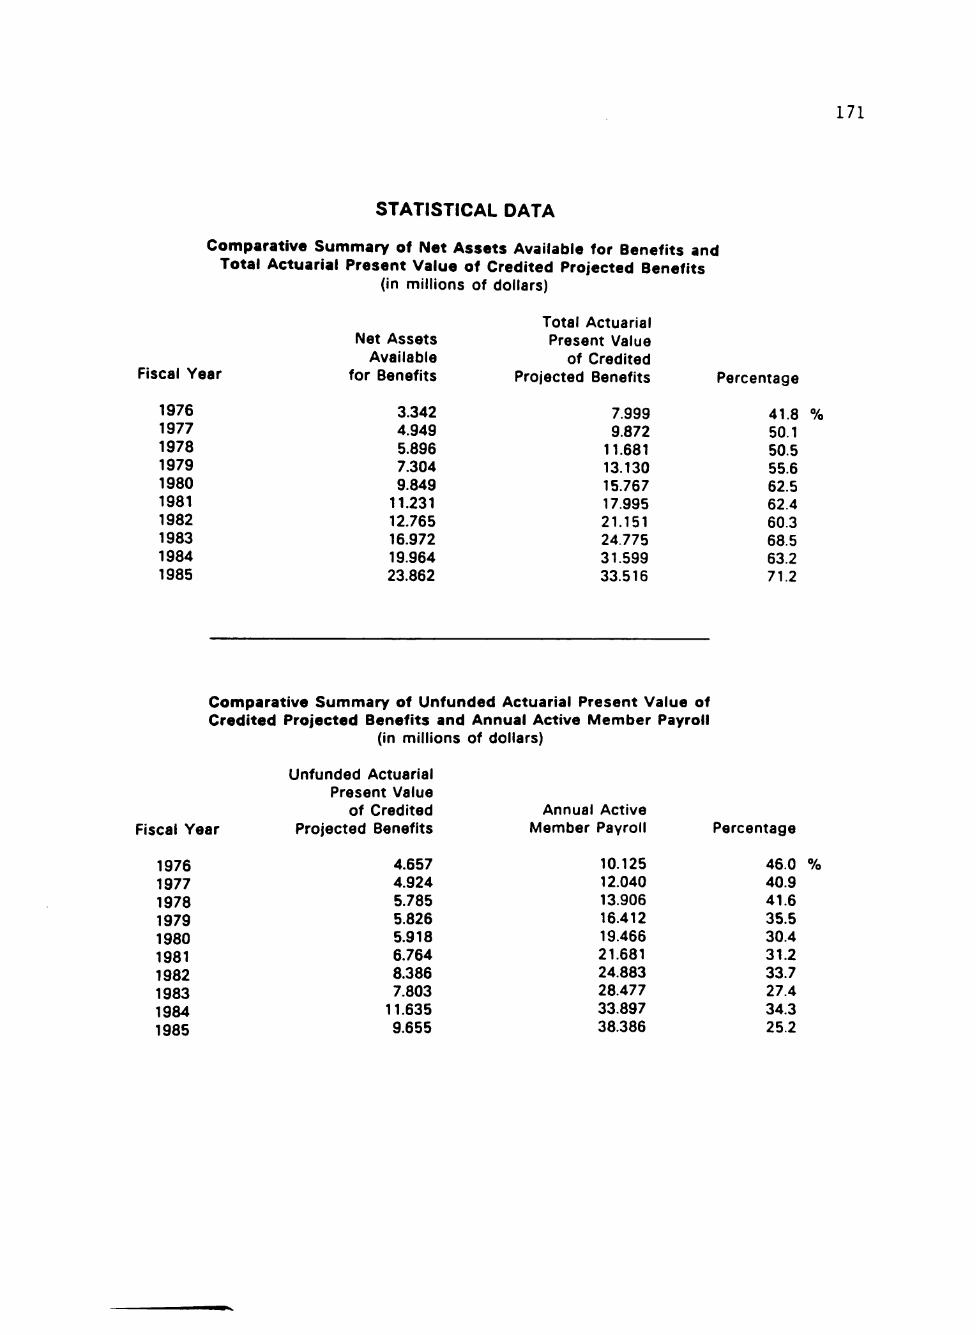
STATISTICAL DATA
Comparative Summary of Net Assets Available for Benefits and Total Actuarial Present Value of Credited Projected Benefits
(in millions of dollars)
171
Fiscal Year
1976 1977 1978 1979 1980 1981 1982 1983 1984 1985
Net Assets Available
for Benefits
3.342 4.949 5.896 7.304 9.849
11.231 12.765 16.972 19.964 23.862
Total Actuarial Present Value
of Credited Projected Benefits
7.999 9.872
11.681 13.130 15.767 17.995 21.151 24.775 31.599 33.516
Percentage
41.8 % 50.1 50.5 55.6 62.5 62.4 60.3 68.5 63.2 71.2
Comparative Summary of Unfunded Actuarial Present Value of Credited Projected Benefits and Annual Active Member Payroll
(in millions of dollars)
Fiscal Year
1976 1977 1978 1979 1980 1981 1982 1983 1984 1985
Unfunded Actuarial Present Value
of Credited Projected Benefits
4.657 4.924 5.785 5.826 5.918 6.764 8.386 7.803
11.635 9.655
Annual Active Member Payroll
10.125 12.040 13.906 16.412 19.466 21.681 24.883 28.477 33.897 38.386
Percentage
46.0 % 40.9 41.6 35.5 30.4 31.2 33.7 27.4 34.3 25.2
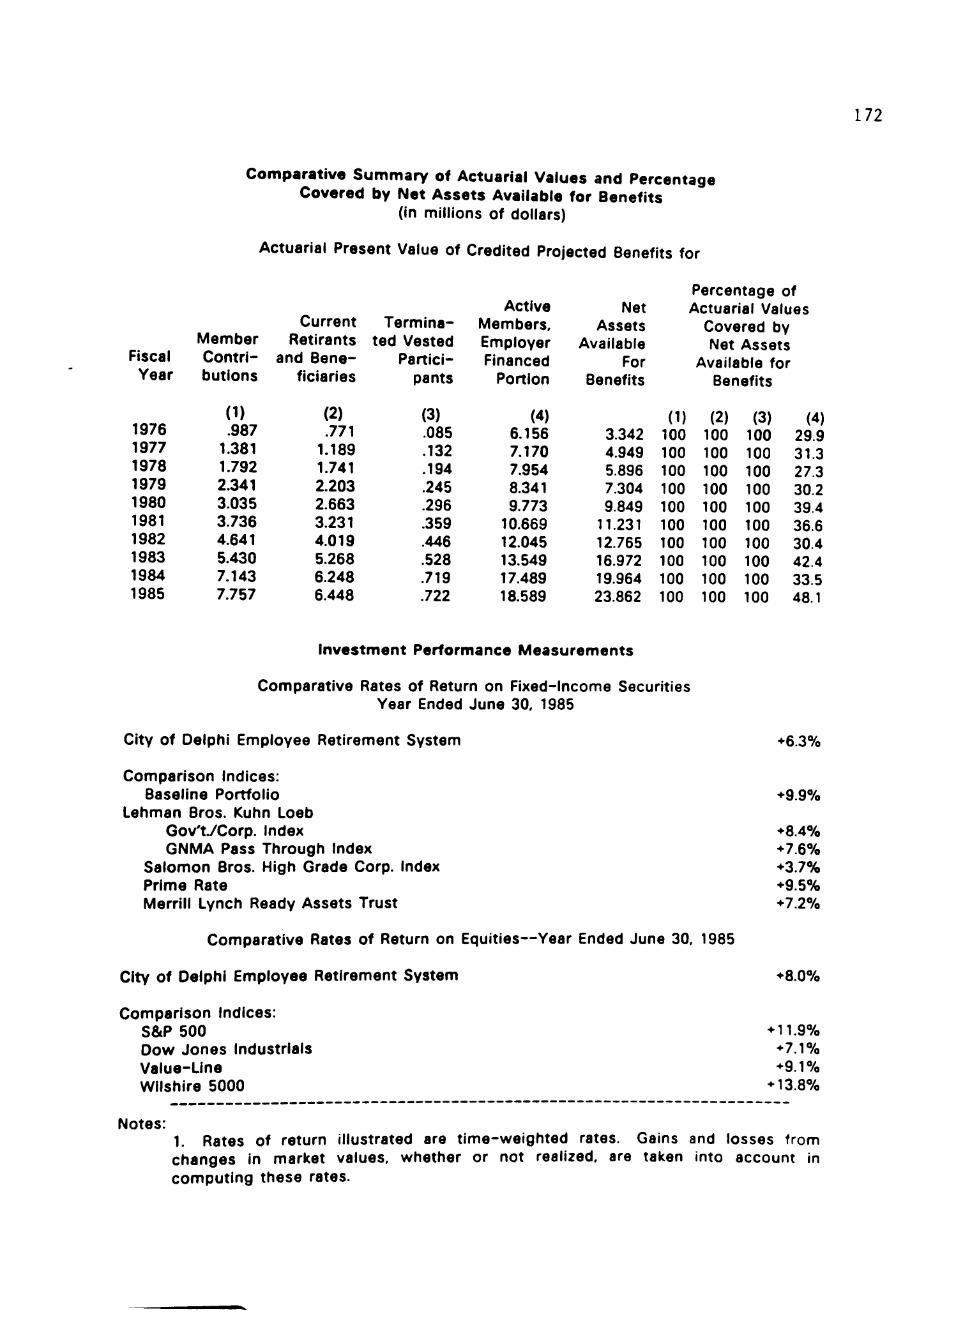
172
Comparative Summary of Actuarial Values and Percentage Covered by Net Assets Available for Benefits
(in millions of dollars)
Actuarial Present Value of Credited Projected Benefits for
Fiscal Year
1976 1977 1978 1979 1980 1981 1982 1983 1984 1985
Member Contributions
(1) .987
1.381 1.792 2.341 3.035 3.736 4.641 5.430 7.143 7.757
Current Retirants
and Beneficiaries
(2) .771
1.189 1.741 2.203 2.663 3.231 4.019 5.268 6.248 6.448
Terminated Vested
Participants
(3) .085 .132 .194 .245 .296 .359 .446 .528 .719 .722
Active Members. Employer Financed
Portion
(4) 6.156 7.170 7.954 8.341 9.773
10.669 12.045 13.549 17.489 18.589
Net Assets
Available For
Benefits
3.342 4.949 5.896 7.304 9.849
11.231 12.765 16.972 19.964 23.862
1
(1) 100 100 100 100 100 100 100 100 100 100
Percentage of Actuarial Values
Covered bv Net Assets
Available foi Benefits
(2) 100 100 100 100 100 100 100 100 100 100
(3) 100 100 100 100 100 100 100 100 100 100
r
p
(4) 29.9 31.3 27.3 30.2 39.4 36.6 30.4 42.4 33.5 48.1
Investment Performance Measurements
Comparative Rates of Return on Fixed-Income Securities Year Ended June 30. 1985
City of Delphi Employee Retirement System
Comparison Indices: Baseline Portfolio
Lehman Bros. Kuhn Loeb Gov't/Corp. Index GNMA Pass Through Index
Salomon Bros. High Grade Corp. Index Prime Rate Merrill Lynch Ready Assets Trust
Comparative Rates of Return on Equities—Year Ended June 30, 1985
City of Delphi Employee Retirement System
Comparison Indices: S&P 500 Dow Jones Industrials Value-Line Wllshire 5000
••6.3%
•9.9%
•8.4% •7.6% •3.7% •9.5% •7.270
•8.0%
• 11.9% • 7 . 1 % • 9 . 1 %
•13.8%
Notes: 1. Rates of return illustrated are time-weighted rates. Gains and losses from changes in market values, whether or not realized, are taken into account in computing these rates.

173
Comparative Summary of Revenues by Source and Expenses by Type
Revenues by Source
Fiscal Year
1976 1977 1978 1979 1980 1981 1982 1983 1984 1985
Member Contributions
491,350 505.680 591,005 728,693 924,635 975,645
1,025.180 1.315.637 1,444.012 1,601.880
Employer Contributions
745.200 886,144
1.023.482 1,207,923 1.432.698 1.595,722 1.831.389 2.095,907 2.494,819 2,825,258
Investment Income
512,001 947.585 158,811 498.798
1.689,058 615.892 595,131
3,226,665 1.754,211 1,740,998
Total
1,748,551 2,339,409 1,773,298 2,435,414 4,046,391 3,187.259 3,451,700 6,638,209 5,693,042 6,168,136
Expenses by Type
Fiscal Year
1976 1977 1978 1979 1980 1981 1982 1983 1984 1985
Benefits
210,495 370,100 403,014 585,312 671,779 853,047 875,491 912.753
1,215,300 1,135,402
Refunds
201,642 286,495 318,379 332,290 683,346 780,758 853,620
1,284,398 1,229,913
960,459
Administrative Expenses
51.200 75,500
105.411 109.715 145.567 171.504 188.289 233.864 256.679 173.984
Total
463.337 732.095 826.804
1,027,317 1,500,692 1,805,309 1,917,400 2,431.015 2,701,892 2,269,845

APPENDIX D
RESPONDENT PACKET—SFAS 35 VERSION
174
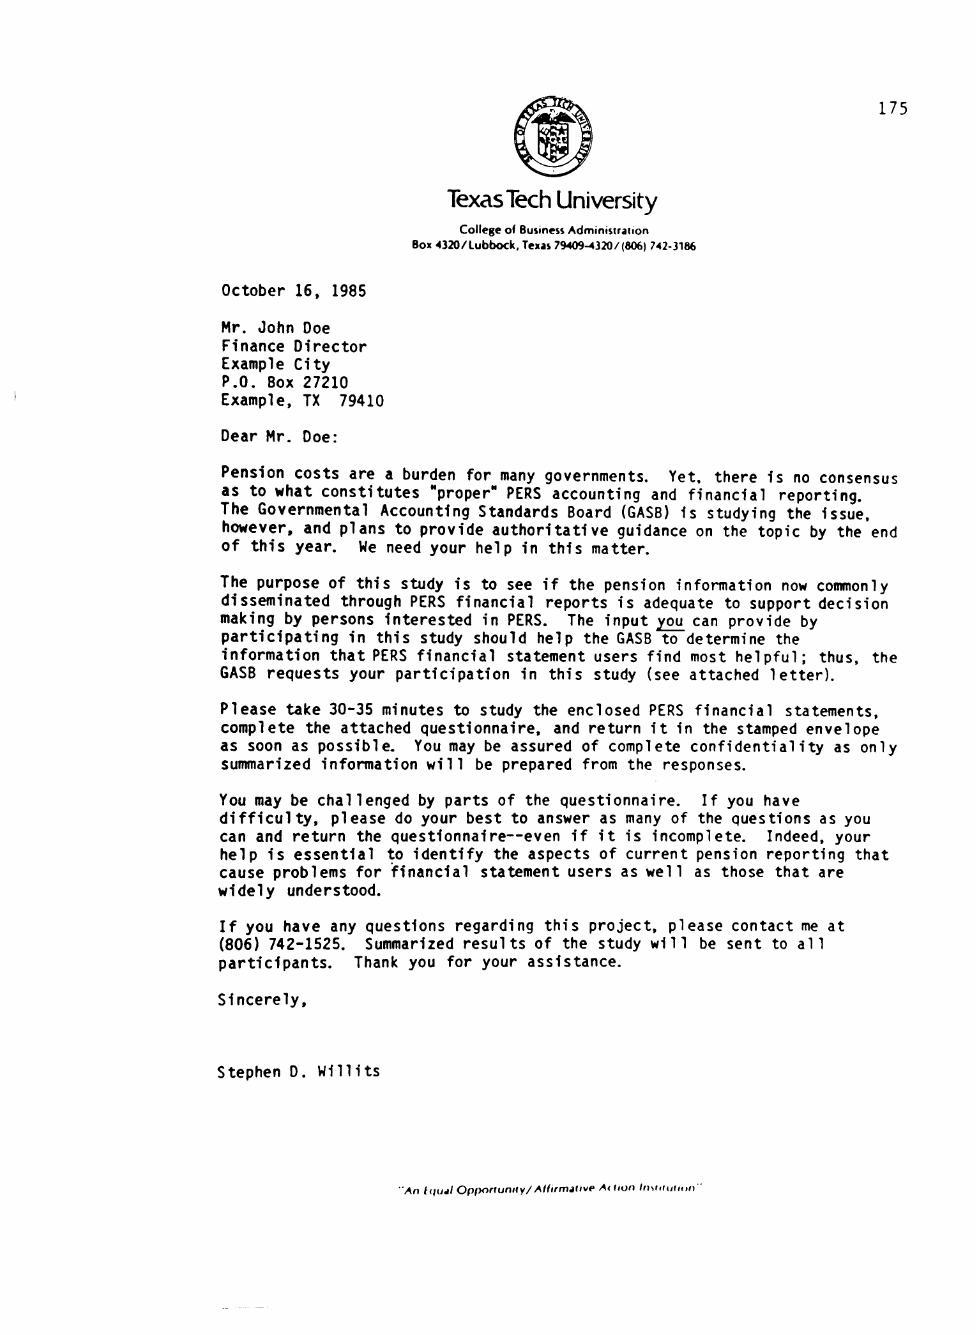
175
Texas Tech University College o( Business Administration
Box 4320/Lubbock, Texas 79409-4320/(806) 742-3186
October 16, 1985
Mr. John Doe Finance Director Example City P.O. Box 27210 Example, TX 79410
Dear Mr. Doe:
Pension costs are a burden for many governments. Yet, there is no consensus as to what cons t i tu tes "proper" PERS accounting and f i nanc ia l repor t ing. The Governmental Accounting Standards Board (GASB) i s studying the issue, however, and plans to provide a u t h o r i t a t i v e guidance on the topic by the end o f t h i s year. We need your help in th i s matter.
The purpose of t h i s study i s to see i f the pension information now commonly disseminated through PERS f i nanc ia l reports i s adequate to support decision making by persons in terested in PERS. The input ^ou^ can provide by p a r t i c i p a t i n g in th i s study should help the GASB to determine the in format ion tha t PERS f i nanc ia l statement users f i nd most h e l p f u l ; thus, the GASB requests your pa r t i c i pa t i on in th i s study (see attached l e t t e r ) .
Please take 30-35 minutes to study the enclosed PERS f i nanc ia l statements, complete the attached quest ionnaire, and return i t in the stamped envelope as soon as possib le. You may be assured of complete c o n f i d e n t i a l i t y as only summarized informat ion w i l l be prepared from the responses.
You may be chal lenged by parts of the quest ionnaire. I f you have d i f f i c u l t y , please do your best to answer as many of the questions as you can and re turn the questionnaire—even i f i t i s incomplete. Indeed, your help i s essent ia l to i d e n t i f y the aspects of current pension repor t ing that cause problems fo r f i nanc ia l statement users as w e l l as those that are w ide ly understood.
I f you have any questions regarding t h i s p ro jec t , please contact me at (806) 742-1525. Summarized resu l t s of the study w i l l be sent to a l l pa r t i c i pan t s . Thank you for your assistance.
S incere ly ,
Stephen D. W i l l i t s
"An tquii Opfyortunity/Ailirmative At lion ln\iiiuii,,n '
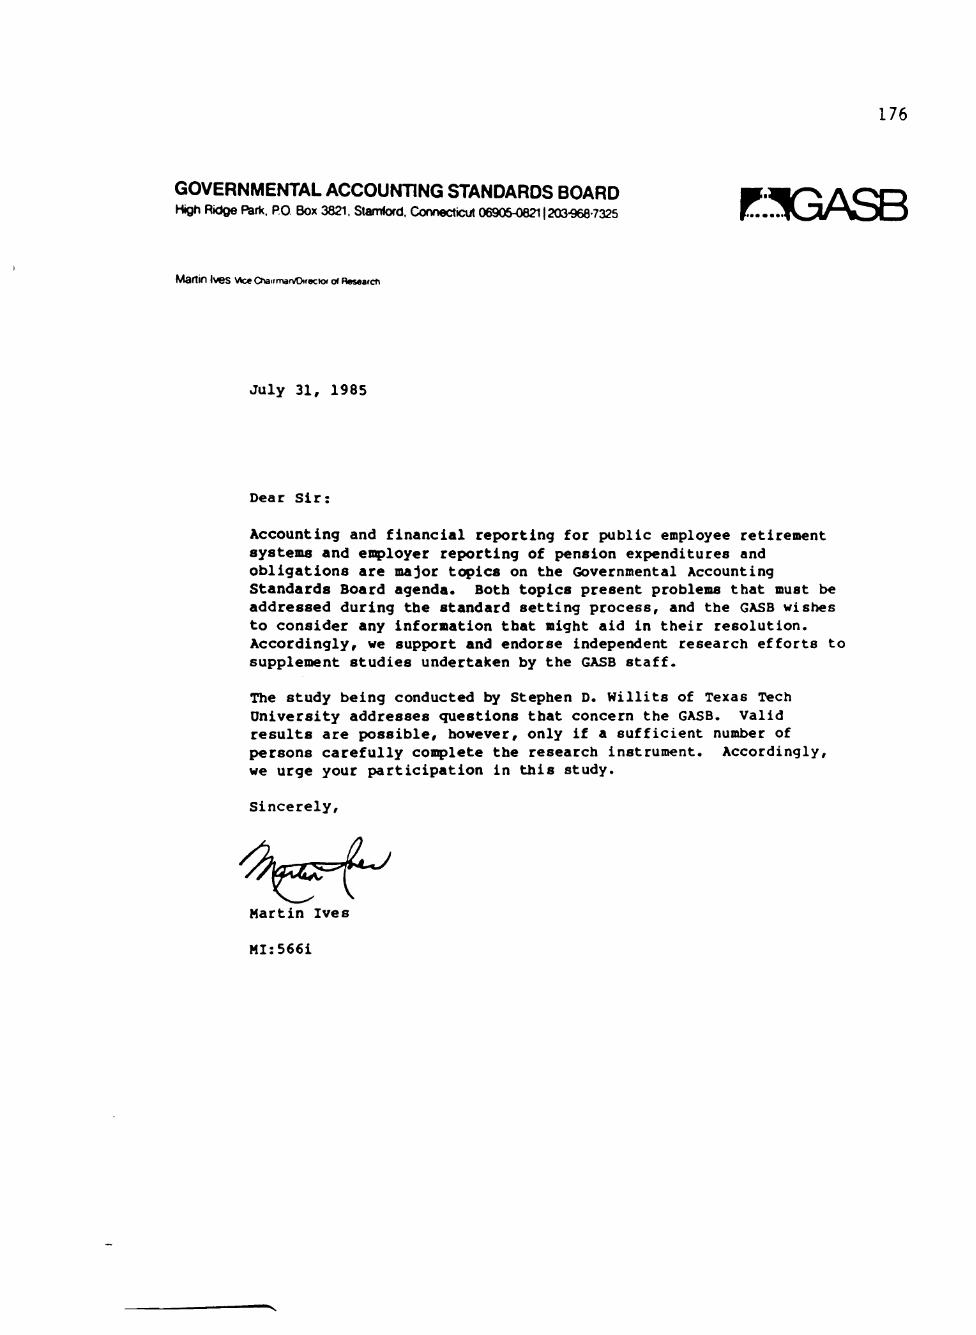
176
GOVERNMEhOAL ACCOUrmNG STANDARDS BOARD High Ridge Park. PO Box 3821, Stamtofd. Connecticut 06905-08211203-968-7325
Martin Ives VtceCnanmaiVDirecHX ot Reseaicti
July 31, 1985
Dear Sir:
Accounting and financial reporting for public employee retirement systems and en^loyer reporting of pension expenditures and obligations are major topics on the Governmental Accounting Standards Board agenda. Both topics present problems that must be addressed during the standard setting process, and the GASB wishes to consider any information tbat might aid in their resolution. Accordingly, we support and endorse independent research efforts to supplement studies undertaken by the GASB staff.
The study being conducted by Stephen D. Willits of Texas Tech University addresses questions tbat concern the GASB. Valid results are possible, however, only if a sufficient number of persons carefully complete the research instrument. Accordingly, we urge your participation in this study.
Sincerely,
Martin Ives
MI:566i

177
PENSION QUESTIONNAIRE
Your packet contains:
(1) the financial statements of the fictitious City of Delphi Employee Retirement System, and (2) several sets of questions that ask you to judge several aspects of the City's pension system.
Please familiarize yourself with the financial statements before answering the questions.
PART A
INSTRUCTIONS. (1) Please answer the following four questions by circling the value on the scale that best reflects your assessment of the City of Delphi pension plan. Circle '0" only if the financial statements provide insufficient information for you to make a determination. (2) On the following page, indicate the financial statement element(s) that served as the basis for your judgment about the PERS.
There are no right or wrong answers to the questions. I am interested in your assessments of the PERS and in identifying the information that you used to make each assessment.
1. Funding of each pension plan is recommended so that accumulated assets will be available to make benefit payments. A plan is "fully funded" when plan assets equal the actuarial present value of accumulated plan benefits—which is the amount "owed" for benefits allocated to employee service before the balance sheet date. How would you assess the City of Delphi PERS' level of accumulated plan benefits funding ?
0 1 2 3 4 5 6 7 Insufficient Inadequately Fully or Information funded over funded
2, It is the responsibility of pension plan management to invest the plan's assets. How would you rate the investment performance for 1985 of the City of Delphi PERS' management?
0 1 2 3 4 5 6 7 Insufficient Inadequate Excellent Information
3, The level of benefits that each employee will receive at retirement is important to both pension plan participants and to those responsible for plan funding. How would you rate the plan benefit provisions of Delphi's PERS as compared to what you believe to be a "typical" PERS?
0 1 2 3 4 5 6 7 Insufficient Inadequate More than Information adequate
4. Several factors may affect the likelihood that plan participants will receive their pensions upon retirement. These factors might Include the level of plan funding, the capabilities of plan management, plan benefit levels, and the financial condition of the sponsoring government. Based on what you know about the City of Delphi PERS. how would you feel about the plan if you were an employee of the City?
0 1 2 3 4 5 6 7 Insufficient Insecure Secure Information
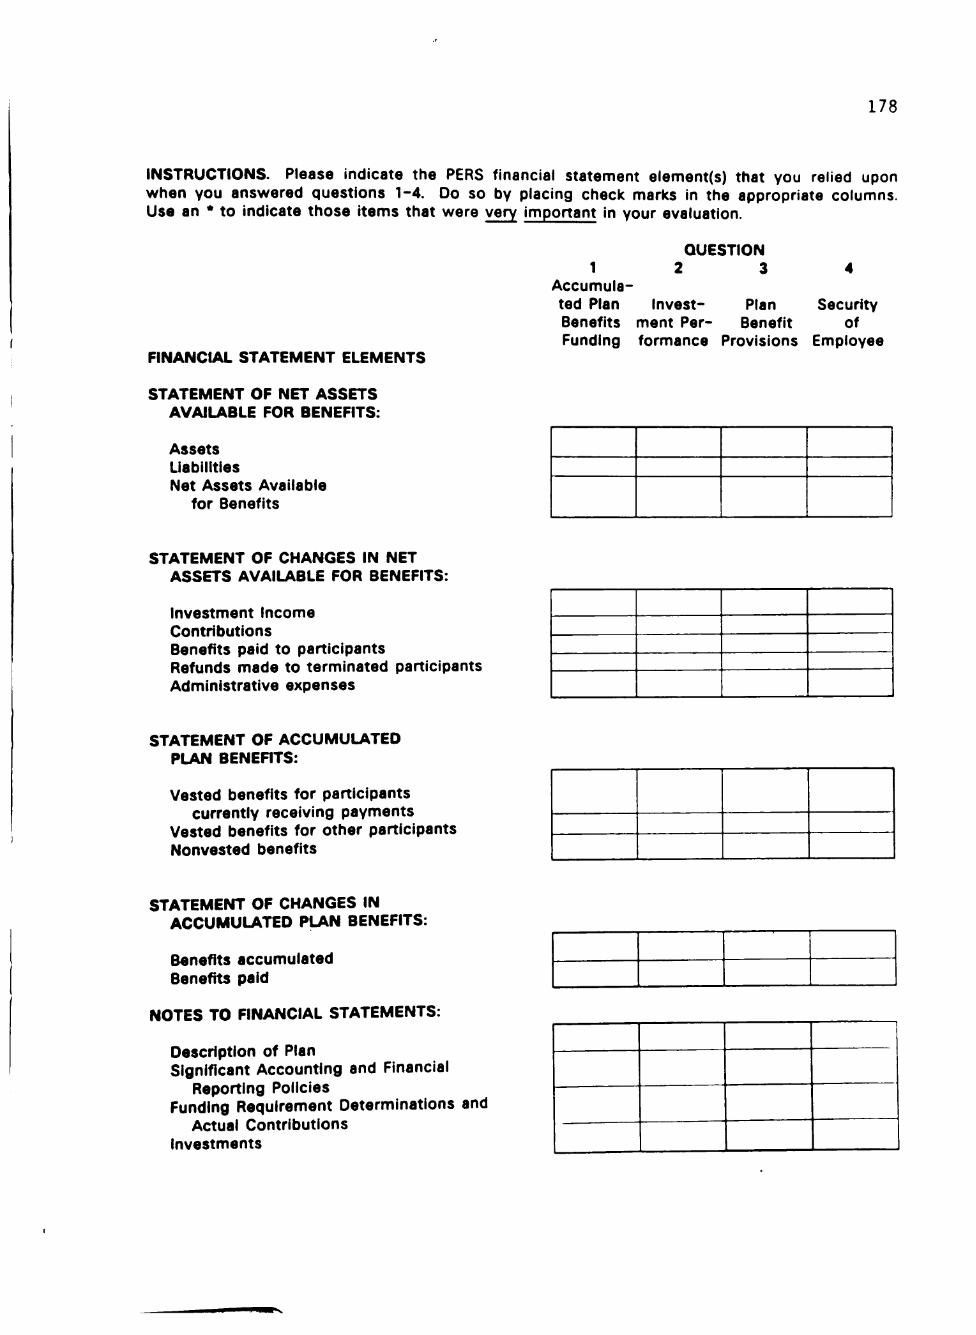
178
INSTRUCTIONS. Please indicate the PERS financial statement element(s) that you relied upon when you answered questions 1-4. Do so by placing check marks in the appropriate columns. Use an * to indicate those items that were very important in your evaluation.
QUESTION 1 2 3 4
Accumulated Plan Invest- Plan Security Benefits ment Per- Benefit of Funding formance Provisions Employee
FINANCIAL STATEMENT ELEMENTS
STATEMENT OF NET ASSETS AVAILABLE FOR BENEFITS:
Assets Liabilities Net Assets Available
for Benefits
STATEMENT OF CHANGES IN NET ASSETS AVAILABLE FOR BENEFITS:
Investment Income Contributions Benefits paid to participants Refunds made to terminated participants Administrative expenses
STATEMENT OF ACCUMULATED PLAN BENEFITS:
Vested benefits for participants currently receiving payments
Vested benefits for other participants Nonvested benefits
STATEMENT OF CHANGES IN ACCUMULATED PLAN BENEFITS:
Benefits accumulated Benefits paid
NOTES TO FINANCIAL STATEMENTS:
Description of Plan Significant Accounting and Financial
Reporting Policies Funding Requirement Determinations and
Actual Contributions Investments
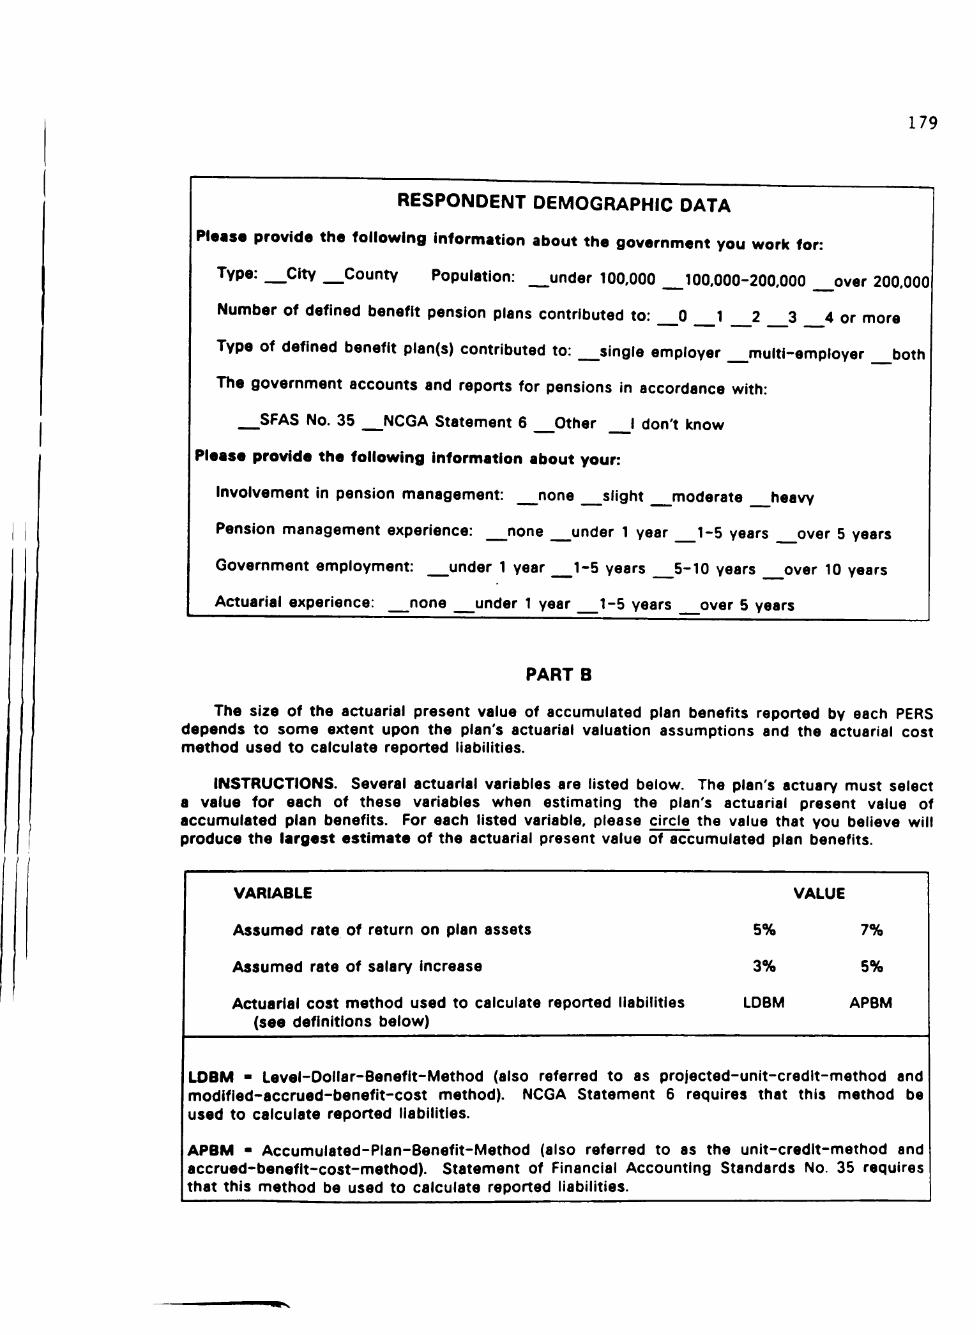
179
RESPONDENT DEMOGRAPHIC DATA
Please provide the following information about the government you work for:
Type: —City County Population: under 100,000 100.000-200.000 over 200.000
Number of defined benefit pension plans contributed to: 0 1 2 3 4 or more
Type of defined benefit plan(s) contributed to: single employer multi-employer _ b o t h
The government accounts and reports for pensions in accordance with:
SFAS No. 35 NCGA Statement 6 Other I don't know
Please provide the following information about your:
involvement in pension management: none slight moderate heavy
Pension management experience: none under 1 year 1-5 years over 5 years
Government employment: under 1 year 1-5 years 5-10 years over 10 years
Actuarial experience: none under 1 year 1-5 years over 5 years
/ /
PART B
The size of the actuarial present value of accumulated plan benefits reported by each PERS depends to some extent upon the plan's actuarial valuation assumptions and the actuarial cost method used to calculate reported liabilities.
INSTRUCTIONS. Several actuarial variables are listed below. The plan's actuary must select a value for each of these variables when estimating the plan's actuarial present value of accumulated plan benefits. For each listed variable, please circle the value that you believe will produce the largest estimate of the actuarial present value of accumulated plan benefits.
VARIABLE
Assumed rate of return on plan assets
Assumed rate of salary Increase
Actuarial cost method used to calculate reported liabilities (see definitions below)
VALUE
5%
3%
LDBM
7%
5%
APBM
LDBM - Level-Oollar-Benefit-Method (also referred to as projected-unit-credlt-method and modifled-accrued-benefit-cost method). NCGA Statement 6 requires that this method be used to calculate reported liabilities.
APBM - Accumulated-Plan-Benefit-Method (also referred to as the unlt-credlt-method and accrued-benefit-cost-method). Statement of Financial Accounting Standards No. 35 requires that this method be used to calculate reported liabilities.
•p^
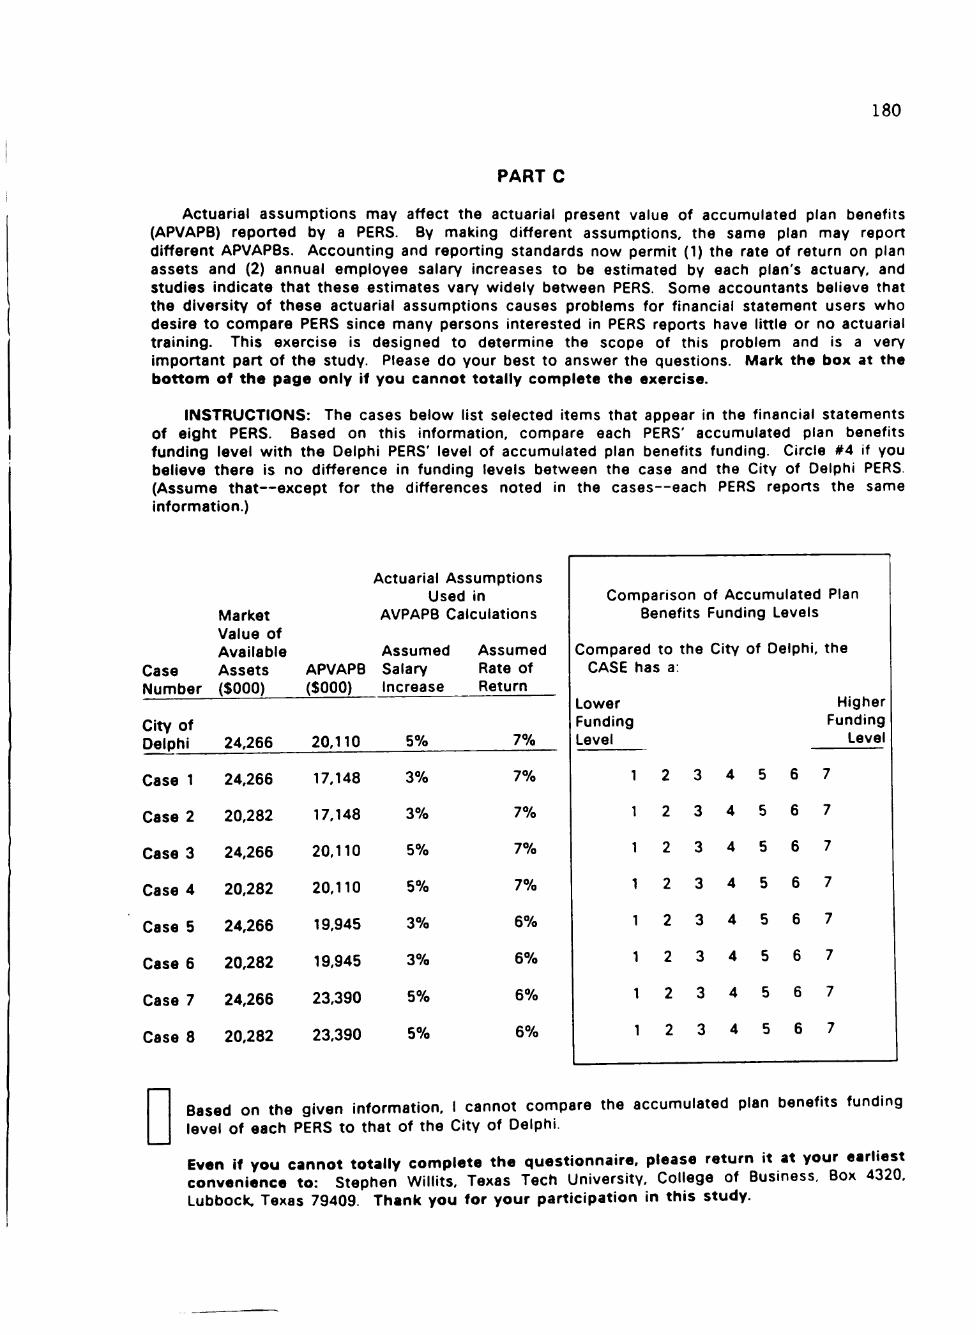
180
PART C
Actuarial assumptions may affect the actuarial present value of accumulated plan benefits (APVAPB) reported by a PERS. By making different assumptions, the same plan may report different APVAPBs. Accounting and reporting standards now permit (1) the rate of return on plan assets and (2) annual employee salary increases to be estimated by each plan's actuary, and studies indicate that these estimates vary widely between PERS. Some accountants believe that the diversity of these actuarial assumptions causes problems for financial statement users who desire to compare PERS since many persons interested in PERS reports have little or no actuarial training. This exercise is designed to determine the scope of this problem and is a very important part of the study. Please do your best to answer the questions. Mark the box at the bottom of the page only if you cannot to ta l ly complete the exercise.
INSTRUCTIONS: The cases below list selected items that appear in the financial statements of eight PERS. Based on this information, compare each PERS' accumulated plan benefits funding level wi th the Delphi PERS' level of accumulated plan benefits funding. Circle #4 if you believe there is no difference in funding levels between the case and the City of Delphi PERS. (Assume that—except for the differences noted in the cases—each PERS reports the same information.)
Case Number
Market Value of Available Assets ($000)
Actuarial Assumptions Used in
AVPAPB Calculations
Assumed Assumed APVAPB Salary Rate of ($000) Increase Return
City of Delphi 24,266 20.110 5%
Case 1
Case 2
Case 3
Case 4
Case 5
Case 6
Case 7
Case 8
24,266
20.282
24,266
20,282
24,266
20,282
24,266
20,282
17,148
17.148
20.110
20.110
19.945
19,945
23,390
23.390
3%
3%
5%
5%
3%
3%
5%
5%
7%
7%
77o
7%
7%
6%
6%
6%
6%
Comparison of Accumulated Plan Benefits Funding Levels
Compared to the City of Delphi, the CASE has a:
Lower Funding Level
Higher Funding
Level
Based on the given information. I cannot compare the accumulated plan benefits funding
level of each PERS to that of the City of Delphi
Even If you cannot to ta l ly complete the quest ionnai re , please re turn it at your earl iest convenience to: Stephen Will its. Texas Tech University. College of Business. Box 4320. Lubbock. Texas 79409. Thank you for your par t ic ipat ion in th is study.
181
CITY OF DELPHI
EMPLOYEE RETIREMENT SYSTEM
ANNUAL REPORT
JUNE 30, 1985

182
SMITH & JONES, CERTIFIED PUBLIC ACCOUNTANTS
To the Members of the City of Delphi Employee Retirement System
We have examined the accompanying financial statements of the City of Delphi Employee Retirement System for the year ended June 30, 1985. Our examination was made in accordance with generally accepted auditing standards and Included such tests of the accounting records and such other auditing procedures as we considered necessary in the circumstances.
in our opinion, based upon our examination, the financial statements referred to above present fairly the financial position and the changes in financial position of the City of Delphi Employee Retirement System as of June 30. 1985 and the results of its operations for the year then ended in conformity with generally accepted accounting principles applied on a basis consistent with that of the preceding year.
'=Y'(M^ASU. Certified Public Accriyritants
September 5. 1985 City of Delphi, USA
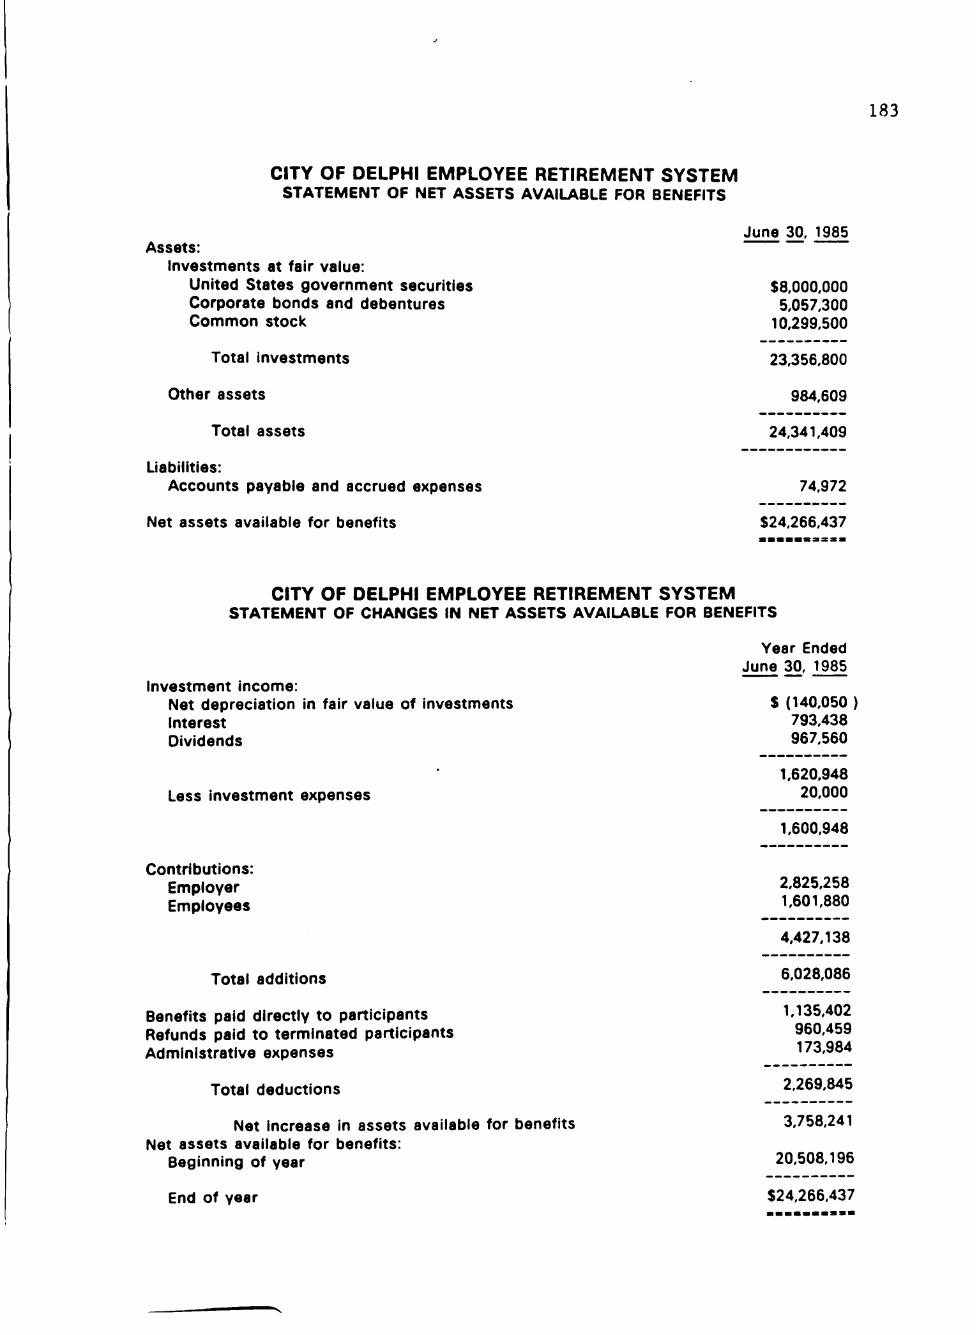
183
CITY OF DELPHI EMPLOYEE RETIREMENT SYSTEM STATEMENT OF NET ASSETS AVAILABLE FOR BENEFITS
Assets: Investments at fair value:
United States government securities Corporate bonds and debentures Common stock
Total investments
Other assets
Total assets
Liabilities: Accounts payable and accrued expenses
Net assets available for benefits
June 30, 1985
$8,000,000 5,057.300
10,299,500
23,356.800
984.609
24,341,409
74,972
$24,266,437
CITY OF DELPHI EMPLOYEE RETIREMENT SYSTEM STATEMENT OF CHANGES IN NET ASSETS AVAILABLE FOR BENEFITS
Investment income: Net depreciation in fair value of investments Interest Dividends
Less investment expenses
Year Ended June 30. 1985
$ (140.050 ) 793,438 967,560
1,620.948 20.000
1.600.948
Contributions: Employer Employees
Total additions
Benefits paid directly to participants Refunds paid to terminated participants Administrative expenses
Total deductions
Net increase in assets available for benefits Net assets available for benefits:
Beginning of year
End of year
2.825.258 1.601.880
4,427,138
6.028,086
1.135.402 960.459 173.984
2,269.845
3.758,241
20,508,196
$24,266,437
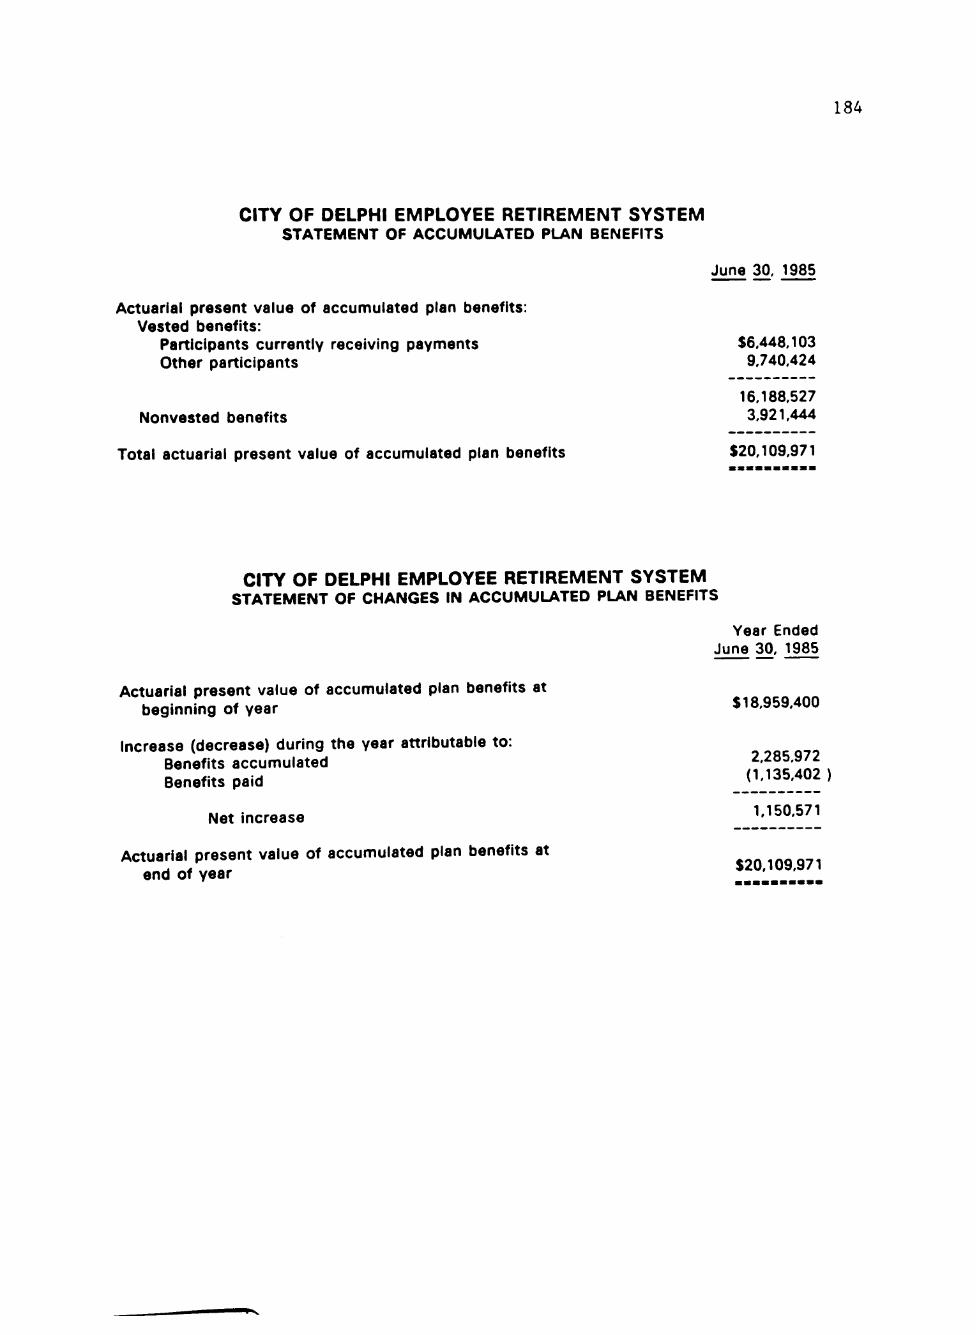
18A
CITY OF DELPHI EMPLOYEE RETIREMENT SYSTEM STATEMENT OF ACCUMULATED PLAN BENEFITS
June 30, 1985
Actuarial present value of accumulated plan benefits: Vested benefits:
Participants currently receiving payments $6,448,103 Other participants 9.740,424
16,188,527 Nonvested benefits 3,921,444
Total actuarial present value of accumulated plan benefits $20,109,971
CITY OF DELPHI EMPLOYEE RETIREMENT SYSTEM STATEMENT OF CHANGES IN ACCUMULATED PLAN BENEFITS
Year Ended June 30. 1985
Actuarial present value of accumulated plan benefits at beginning of year $18,959,400
Increase (decrease) during the year attributable to: Benefits accumulated ,?'??!'?«: . Benefits paid .J^l?.^:^?? ^
1 150 571 Net Increase i,iou.o/^
Actuarial present value of accumulated plan benefits at end of year $20,109,971
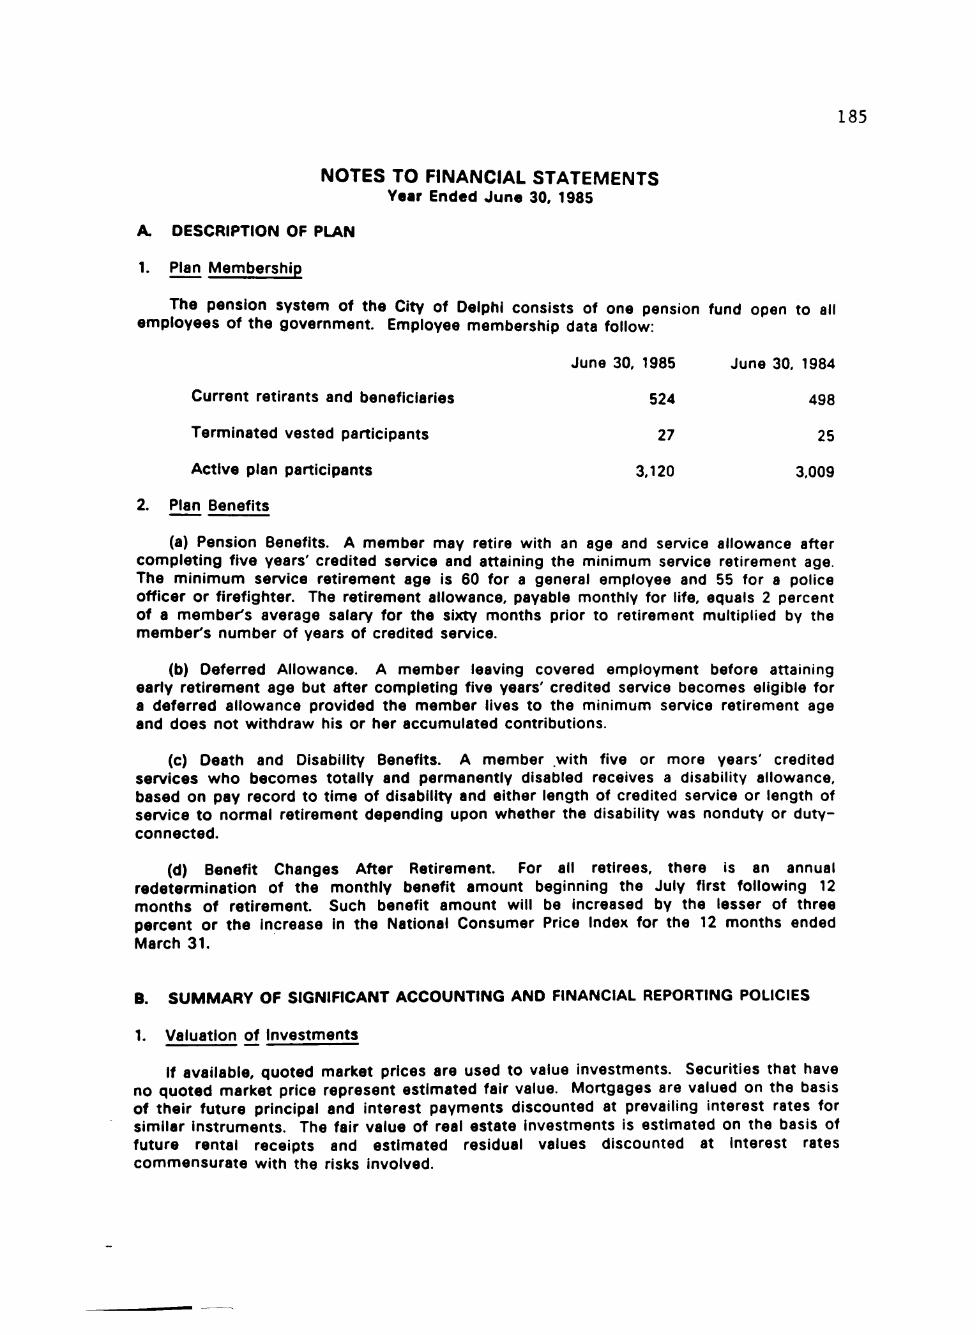
185
NOTES TO FINANCIAL STATEMENTS Year Ended June 30, 1985
A DESCRIPTION OF PLAN
1. Plan Membership
The pension system of the City of Delphi consists of one pension fund open to all employees of the government Employee membership data follow:
June 30. 1985 June 30, 1984
Current retirants and beneficiaries 524 498
Terminated vested participants 27 25
Active plan participants 3.120 3,009
2. Plan Benefits
(a) Pension Benefits. A member may retire with an age and service allowance after completing five years' credited service and attaining the minimum service retirement age. The minimum service retirement age is 60 for a general employee and 55 for a police officer or firefighter. The retirement allowance, payable monthly for life, equals 2 percent of a member's average salary for the sixty months prior to retirement multiplied by the member's number of years of credited service.
(b) Deferred Allowance. A member leaving covered employment before attaining early retirement age but after completing five years' credited service becomes eligible for a deferred allowance provided the member lives to the minimum service retirement age and does not withdraw his or her accumulated contributions.
(c) Death and Disability Benefits. A member with five or more years' credited services who becomes totally and permanently disabled receives a disability allowance, based on pay record to time of disability and either length of credited service or length of service to normal retirement depending upon whether the disability was nonduty or duty-connected.
(d) Benefit Changes After Retirement. For all retirees, there is an annual redetermination of the monthly benefit amount beginning the July first following 12 months of retirement Such benefit amount will be Increased by the lesser of three percent or the Increase In the National Consumer Price Index for the 12 months ended March 31,
B. SUMMARY OF SIGNIFICANT ACCOUNTING AND FINANCIAL REPORTING POLICIES
1. Valuation of Investments
If available, quoted market prices are used to value investments. Securities that have no quoted market price represent estimated fair value. Mortgages are valued on the basis of their future principal and interest payments discounted at prevailing interest rates for similar Instruments. The fair value of real estate investments is estimated on the basis of future rental receipts and estimated residual values discounted at interest rates commensurate with the risks Involved.
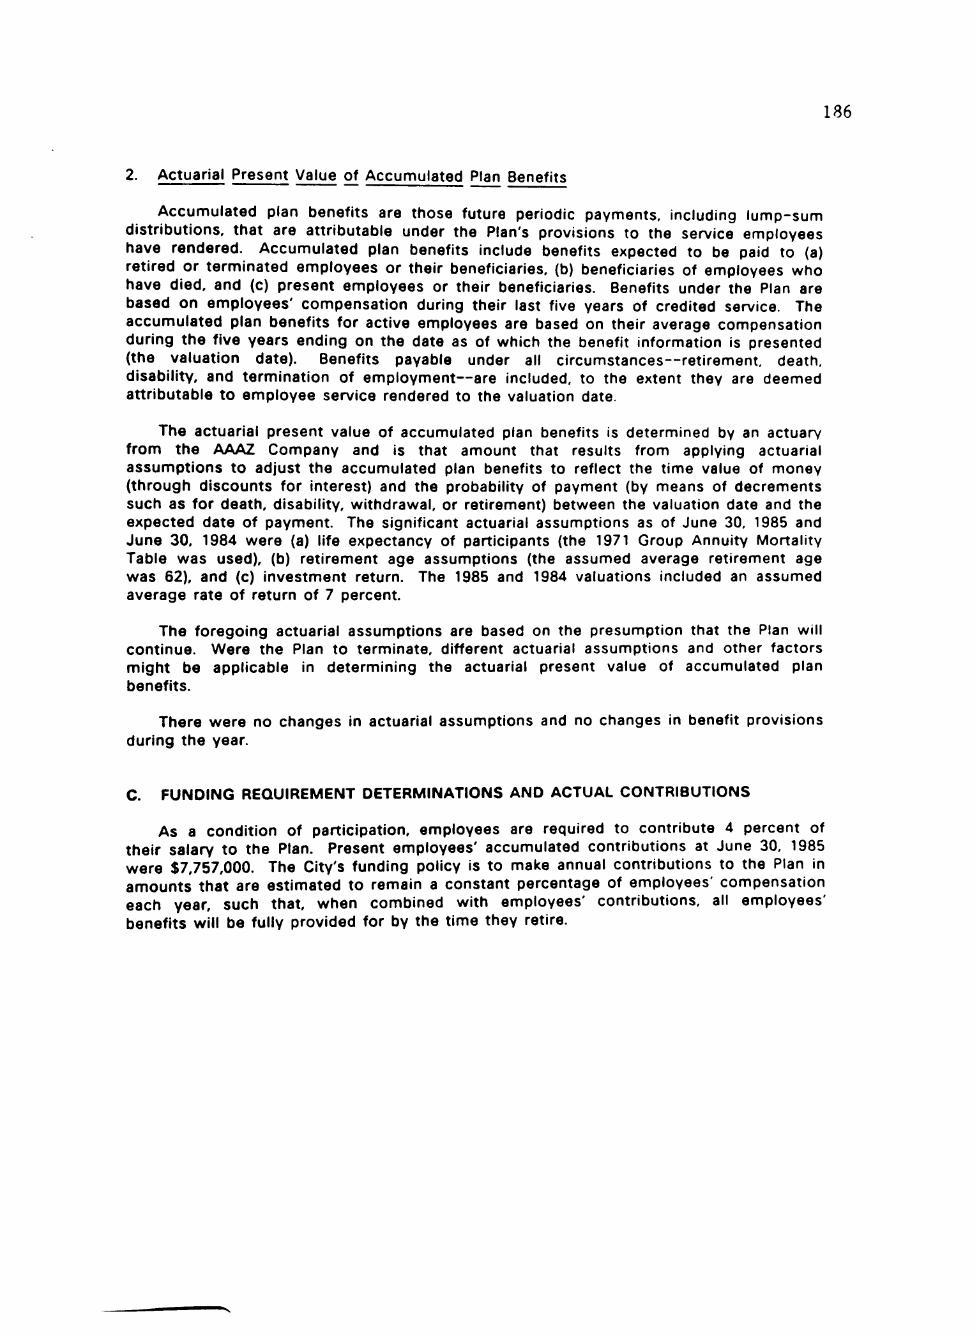
186
2. Actuarial Present Value of Accumulated Plan Benefits
Accumulated plan benefits are those future periodic payments, including lump-sum distributions, that are attributable under the Plan's provisions to the service employees have rendered. Accumulated plan benefits include benefits expected to be paid to (a) retired or terminated employees or their beneficiaries, (b) beneficiaries of employees who have died, and (c) present employees or their beneficiaries. Benefits under the Plan are based on employees' compensation during their last five years of credited service. The accumulated plan benefits for active employees are based on their average compensation during the five years ending on the date as of which the benefit information is presented (the valuation date). Benefits payable under all circumstances—retirement, death, disability, and termination of employment—are included, to the extent they are deemed attributable to employee service rendered to the valuation date.
The actuarial present value of accumulated plan benefits is determined by an actuary from the AAAZ Company and is that amount that results from applying actuarial assumptions to adjust the accumulated plan benefits to reflect the time value of money (through discounts for interest) and the probability of payment (by means of decrements such as for death, disability, withdrawal, or retirement) between the valuation date and the expected date of payment. The significant actuarial assumptions as of June 30, 1985 and June 30. 1984 were (a) life expectancy of participants (the 1971 Group Annuity Mortality Table was used), (b) retirement age assumptions (the assumed average retirement age was 62), and (c) investment return. The 1985 and 1984 valuations included an assumed average rate of return of 7 percent
The foregoing actuarial assumptions are based on the presumption that the Plan will continue. Were the Plan to terminate, different actuarial assumptions and other factors might be applicable in determining the actuarial present value of accumulated plan benefits.
There were no changes in actuarial assumptions and no changes in benefit provisions during the year.
C. FUNDING REQUIREMENT DETERMINATIONS AND ACTUAL CONTRIBUTIONS
As a condition of participation, employees are required to contribute 4 percent of their salary to the Plan. Present employees' accumulated contributions at June 30, 1985 were $7,757,000. The City's funding policy is to make annual contributions to the Plan in amounts that are estimated to remain a constant percentage of employees' compensation each year, such that when combined with employees' contributions, all employees' benefits will be fully provided for by the time they retire.
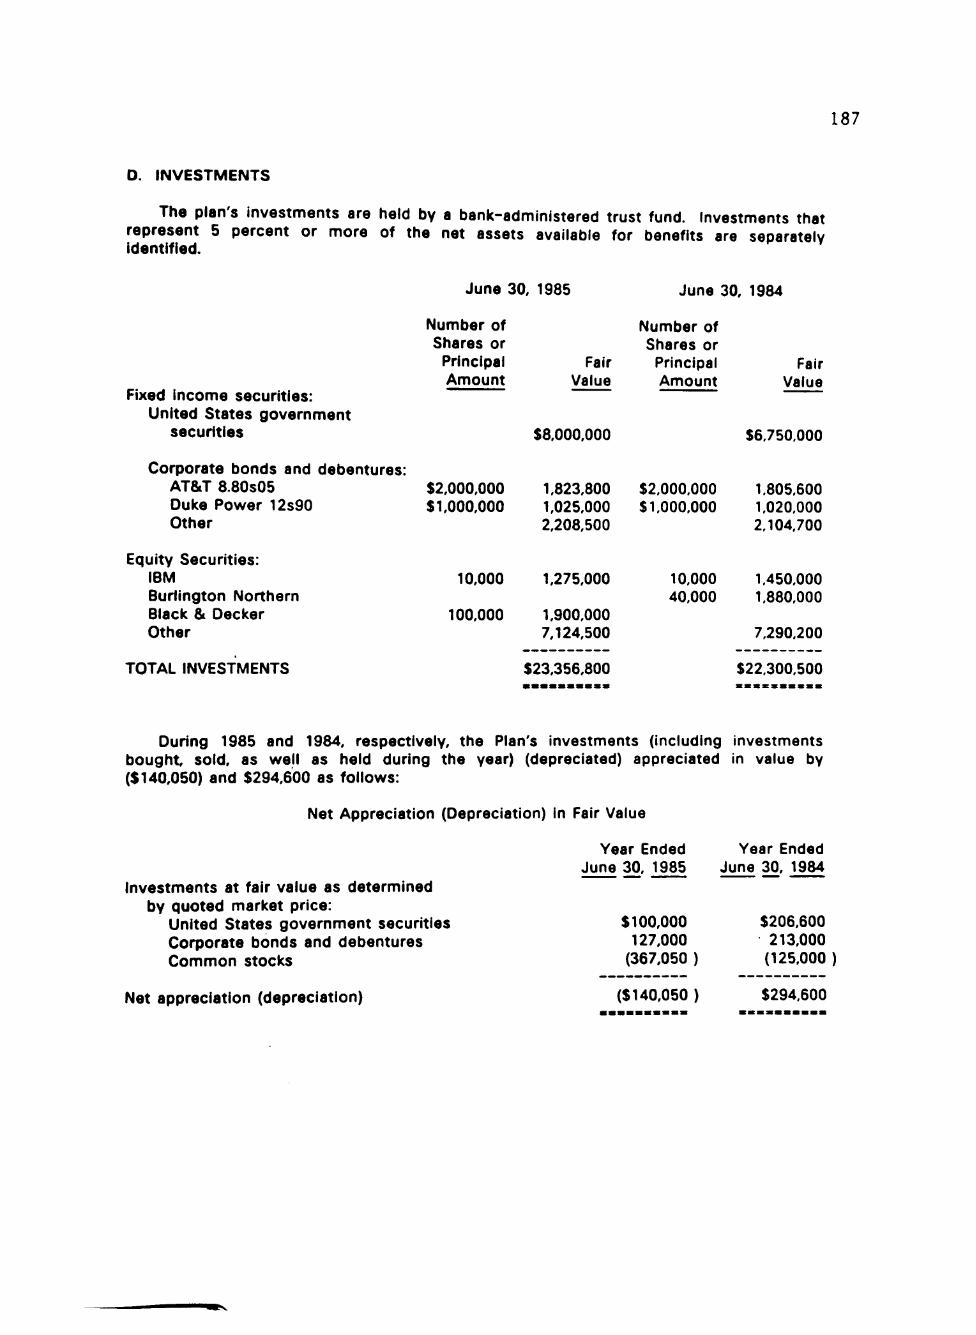
187
D. INVESTMENTS
The plan's investments are held by a bank-administered trust fund. Investments that represent 5 percent or more of the net assets available for benefits are separatelv identified.
Fixed income securities: United States government
securities
Corporate bonds and debentures: AT&T 8.80s05 Duke Power 12s90 Other
Equity Securities: IBM Burlington Northern Black 8t Decker Other
TOTAL INVESTMENTS
June 30, 1985
Number of Shares or
Principal Amount
$2,000,000 $1,000,000
10.000
100,000
Fair Value
$8,000,000
1,823,800 1.025.000 2.208.500
1.275.000
1.900.000 7.124.500
$23,356,800
June 30, 1984
Number of Shares or
Principal Amount
$2,000,000 $1,000,000
10,000 40,000
Fair Value
$6,750,000
1,805,600 1,020,000 2,104,700
1,450.000 1,880,000
7,290,200
$22,300,500
During 1985 and 1984, respectively, the Plan's investments (including investments bought, sold, as well as held during the year) (depreciated) appreciated in value by ($140,050) and $294,600 as follows:
Net Appreciation (Depreciation) In Fair Value
Investments at fair value as determined by quoted market price:
United States government securities Corporate bonds and debentures Common stocks
Net appreciation (depreciation)
Year Ended June 30. 1985
$100,000 127.000
(367,050 )
($140,050 )
Year Ended June 30. 1984
$206,600 213,000 (125,000 )
$294,600
•^v