may 2010 alameda county deferred compensation plan inst-20081201-a023892rs.pp.080 edition...
TRANSCRIPT
May 2010
Alameda County Deferred
Compensation Plan
INST-20081201-A023892 RS.PP.080Edition 6/2007 Updated 12/2008
Enrollment: Alameda County Deferred Compensation Plan
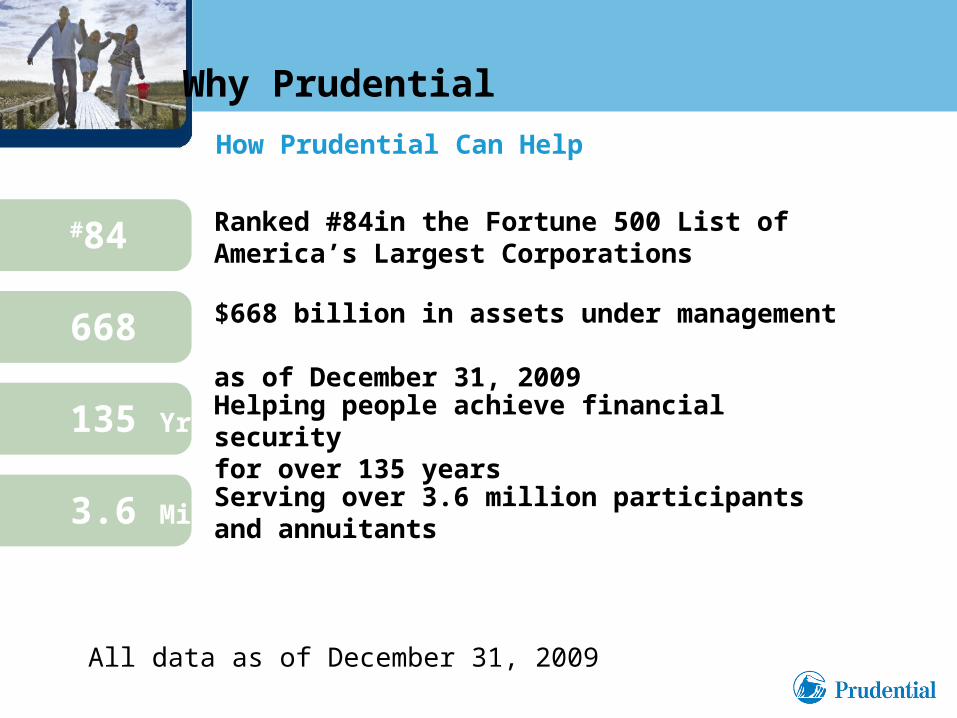
How Prudential Can Help
Ranked #84in the Fortune 500 List of America’s Largest Corporations
#84
$668 billion in assets under management as of December 31, 2009668
Helping people achieve financial security for over 135 years135 Yrs.
Serving over 3.6 million participantsand annuitants3.6 Mil.
Why Prudential
All data as of December 31, 2009
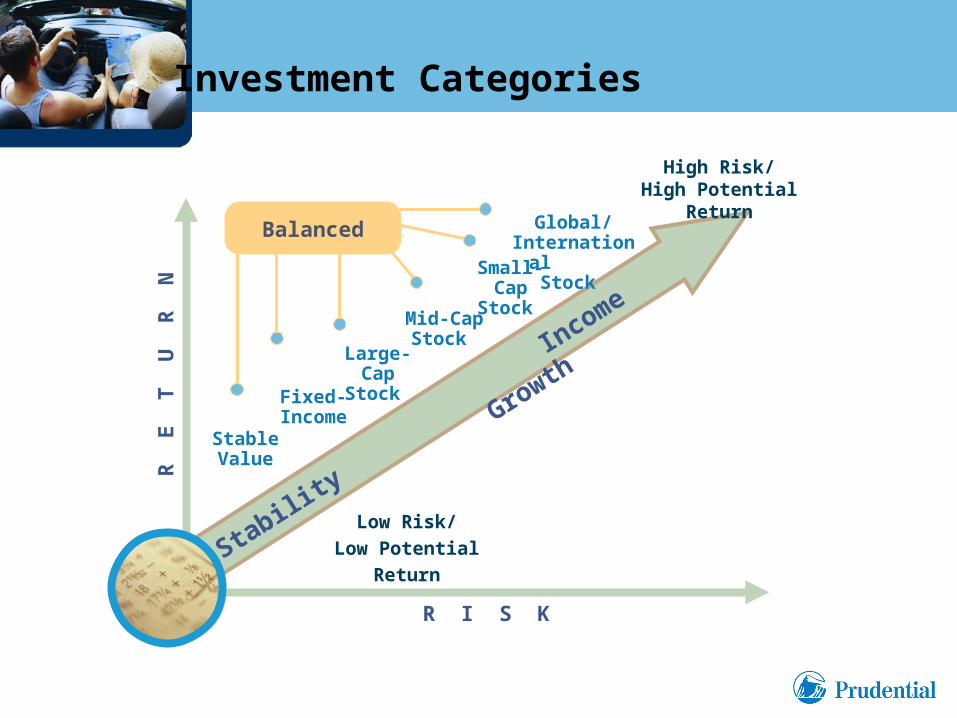
Stability
Income
Growth
High Risk/High Potential Return
Low Risk/
Low Potential Return
Stable Value
Fixed- Income
Large-Cap
Stock
Mid-CapStock
Small-Cap
Stock
Global/ International
Stock
Balanced
R E
T U
R N
R I S K
Investment Categories
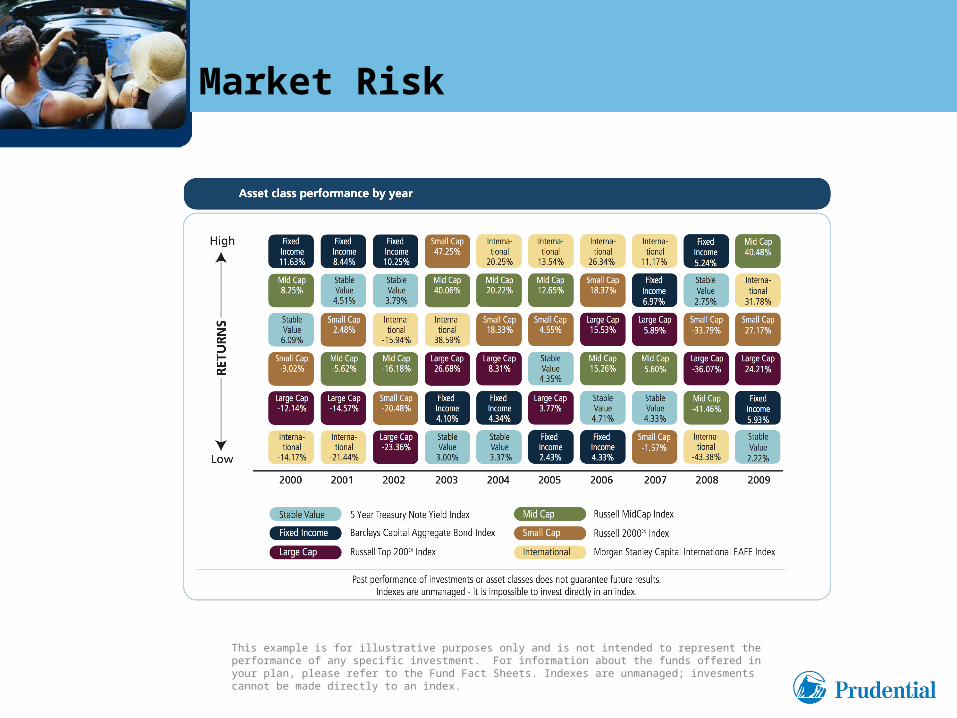
This example is for illustrative purposes only and is not intended to represent the performance of any specific investment. For information about the funds offered in your plan, please refer to the Fund Fact Sheets. Indexes are unmanaged; invesments cannot be made directly to an index.
Market risk Market risk Market Risk
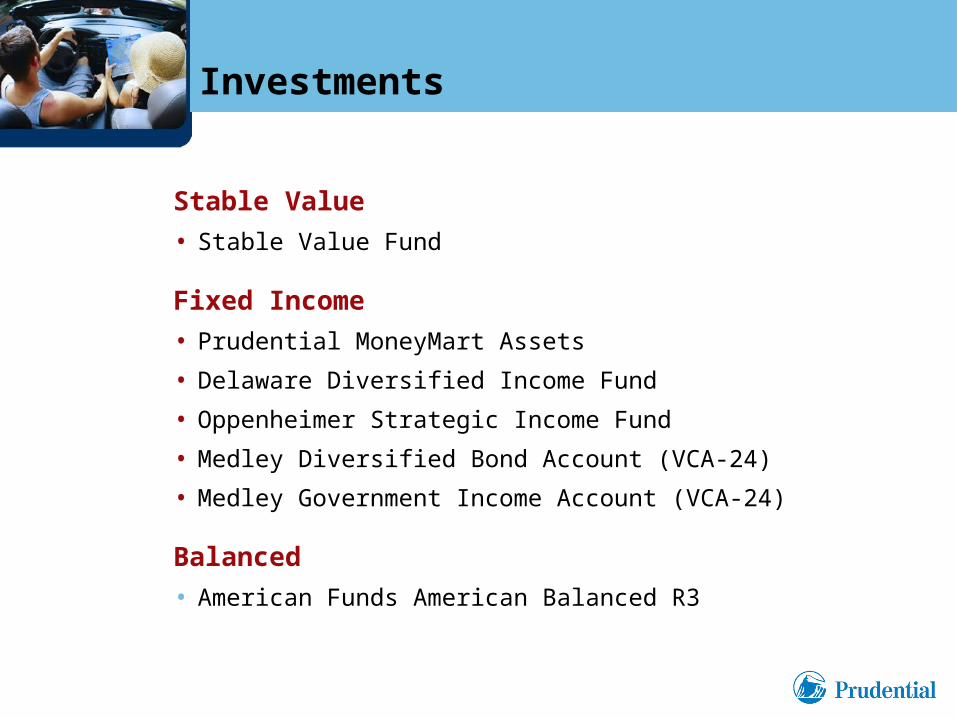
Stable Value
• Stable Value Fund
Fixed Income
• Prudential MoneyMart Assets
• Delaware Diversified Income Fund
• Oppenheimer Strategic Income Fund
• Medley Diversified Bond Account (VCA-24)
• Medley Government Income Account (VCA-24)
Balanced
• American Funds American Balanced R3
Investments

Large-Cap
• Allianz NFJ Dividend Value A
• American Funds Fundamental Invs R3
• Davis NY Venture Fund A
• Prudential Stock Index Fund I
• American Funds Growth Fund of America R3
• Franklin Flex Cap Growth Fund
• Prudential Jennison Growth Fund Z
• Medley Capital Growth Account (VCA-10)
• Medley Equity Account (VC-24)
Investments
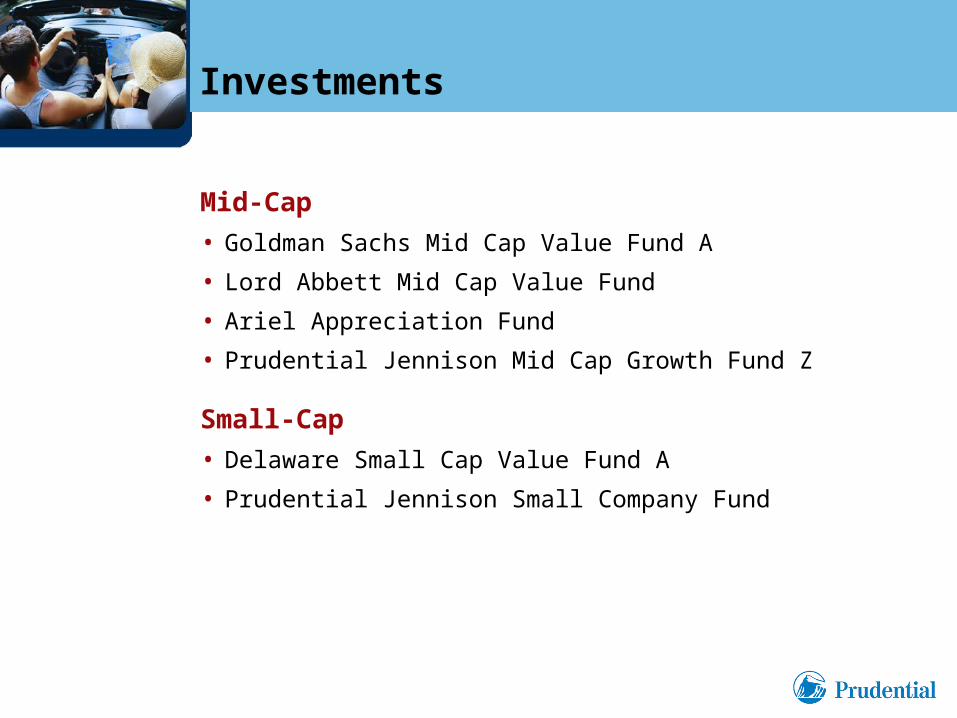
Mid-Cap
• Goldman Sachs Mid Cap Value Fund A
• Lord Abbett Mid Cap Value Fund
• Ariel Appreciation Fund
• Prudential Jennison Mid Cap Growth Fund Z
Small-Cap
• Delaware Small Cap Value Fund A
• Prudential Jennison Small Company Fund
Investments

Global / International
• Templeton World Fund
• AllianceBernstein Global Thematic Growth A
• American Funds EuroPacific Growth Fund R3
• Mutual European Fund
• Templeton Developing Markets Trust
Other
• BlackRock Health Sciences Portfolio
Investments

Fund Fact Sheet User’s Guide

Optional asset allocation program adopted by your employer
Helps target the investment options best suited to your retirement goal
Uses investment options offered by your retirement program
12 diversified portfolios, based on various risk tolerances and time horizons
Application of asset allocation and diversification concepts does not ensure safety of principal andinterest. It is possible to lose money by investing in securities.
What is GoalMaker?
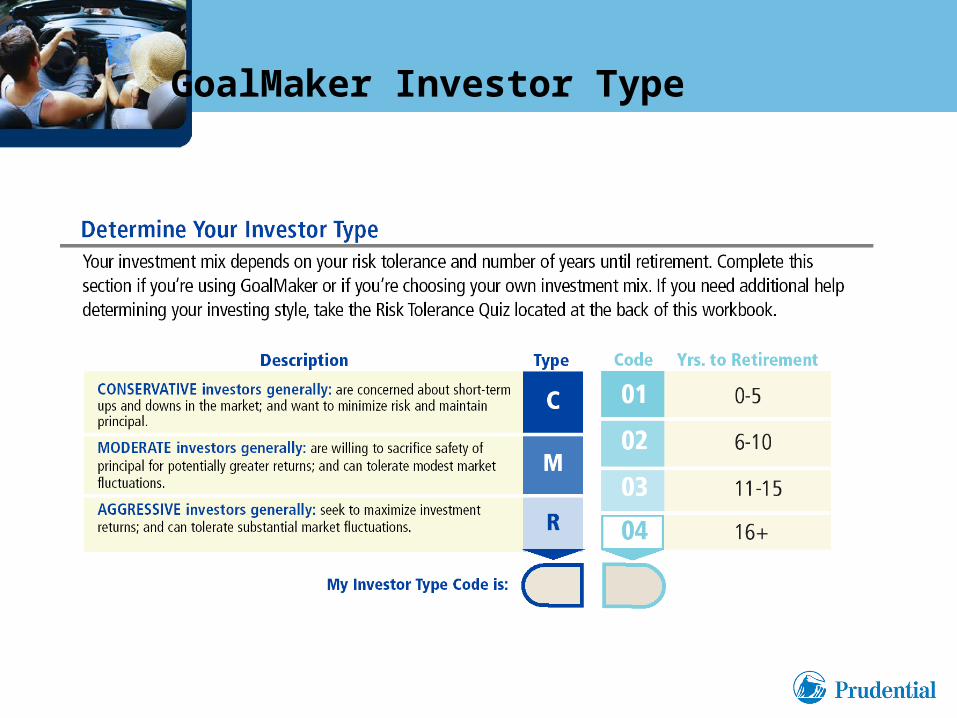
GoalMaker Investor Type
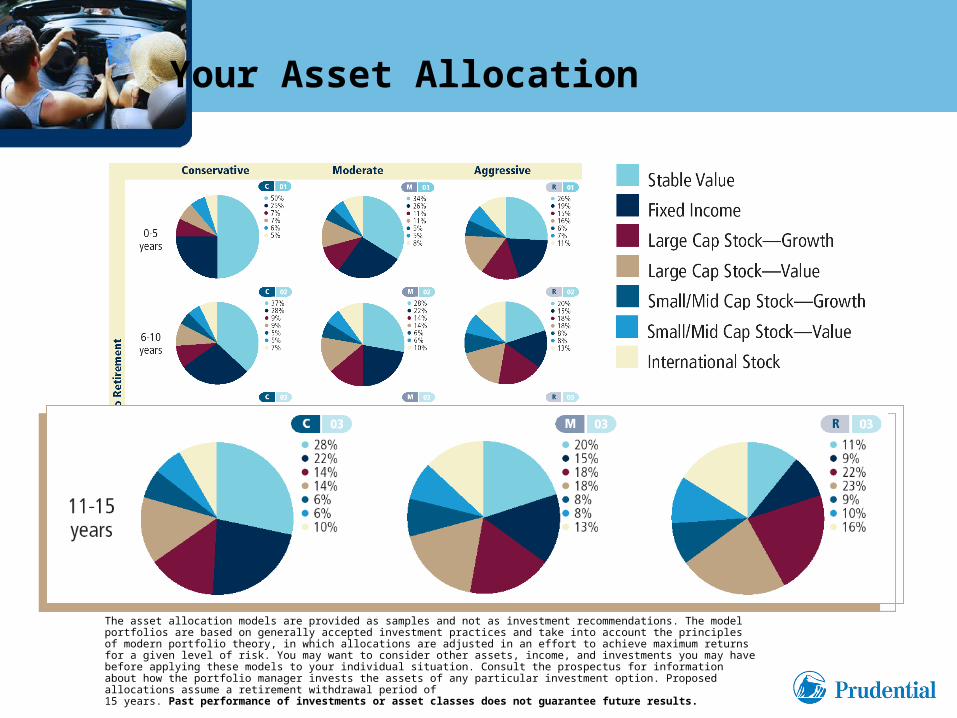
The asset allocation models are provided as samples and not as investment recommendations. The model portfolios are based on generally accepted investment practices and take into account the principles of modern portfolio theory, in which allocations are adjusted in an effort to achieve maximum returns for a given level of risk. You may want to consider other assets, income, and investments you may have before applying these models to your individual situation. Consult the prospectus for information about how the portfolio manager invests the assets of any particular investment option. Proposed allocations assume a retirement withdrawal period of 15 years. Past performance of investments or asset classes does not guarantee future results.
Your Asset Allocation
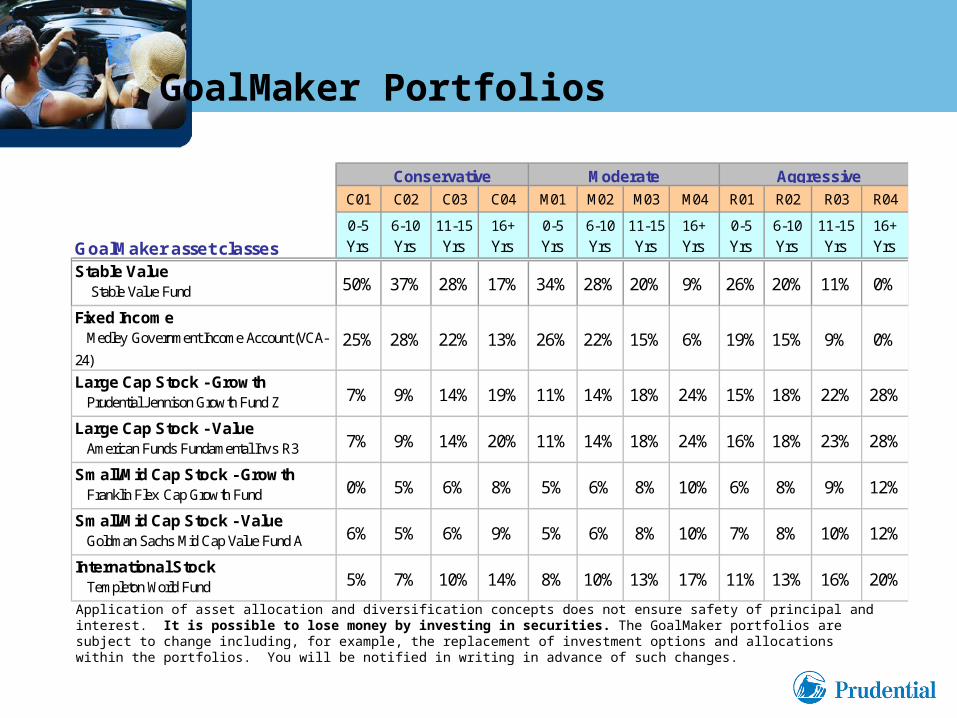
Application of asset allocation and diversification concepts does not ensure safety of principal and interest. It is possible to lose money by investing in securities. The GoalMaker portfolios are subject to change including, for example, the replacement of investment options and allocations within the portfolios. You will be notified in writing in advance of such changes.
GoalMaker Portfolios
C01 C02 C03 C04 M01 M02 M03 M04 R01 R02 R03 R04
GoalMaker asset classes0-5
Yrs6-10
Yrs11-15
Yrs16+
Yrs0-5
Yrs6-10
Yrs11-15
Yrs16+
Yrs0-5
Yrs6-10
Yrs11-15
Yrs16+
Yrs
Stable Value Stable Value Fund 50% 37% 28% 17% 34% 28% 20% 9% 26% 20% 11% 0%
Fixed Income Medley Gov ernment Income Account (VCA-
24)25% 28% 22% 13% 26% 22% 15% 6% 19% 15% 9% 0%
Large Cap Stock - Growth Prudential Jennison Grow th Fund Z 7% 9% 14% 19% 11% 14% 18% 24% 15% 18% 22% 28%
Large Cap Stock - Value American Funds Fundamental Inv s R3 7% 9% 14% 20% 11% 14% 18% 24% 16% 18% 23% 28%
Small/Mid Cap Stock - Growth Franklin Flex Cap Grow th Fund 0% 5% 6% 8% 5% 6% 8% 10% 6% 8% 9% 12%
Small/Mid Cap Stock - Value Goldman Sachs Mid Cap Value Fund A 6% 5% 6% 9% 5% 6% 8% 10% 7% 8% 10% 12%
International Stock Templeton World Fund 5% 7% 10% 14% 8% 10% 13% 17% 11% 13% 16% 20%
Moderate Conservative Aggressive
Application of asset allocation and diversification concepts does not ensure safety of principal and interest. It is possible to lose money by investing in securities.
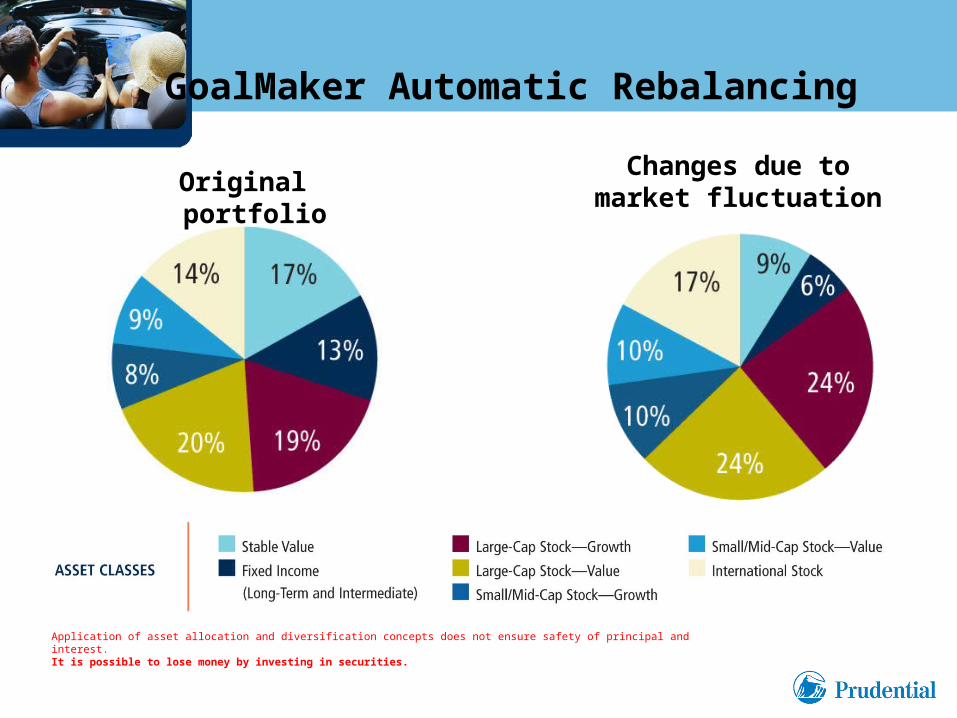
GoalMaker Automatic Rebalancing
Original portfolioChanges due to
market fluctuation
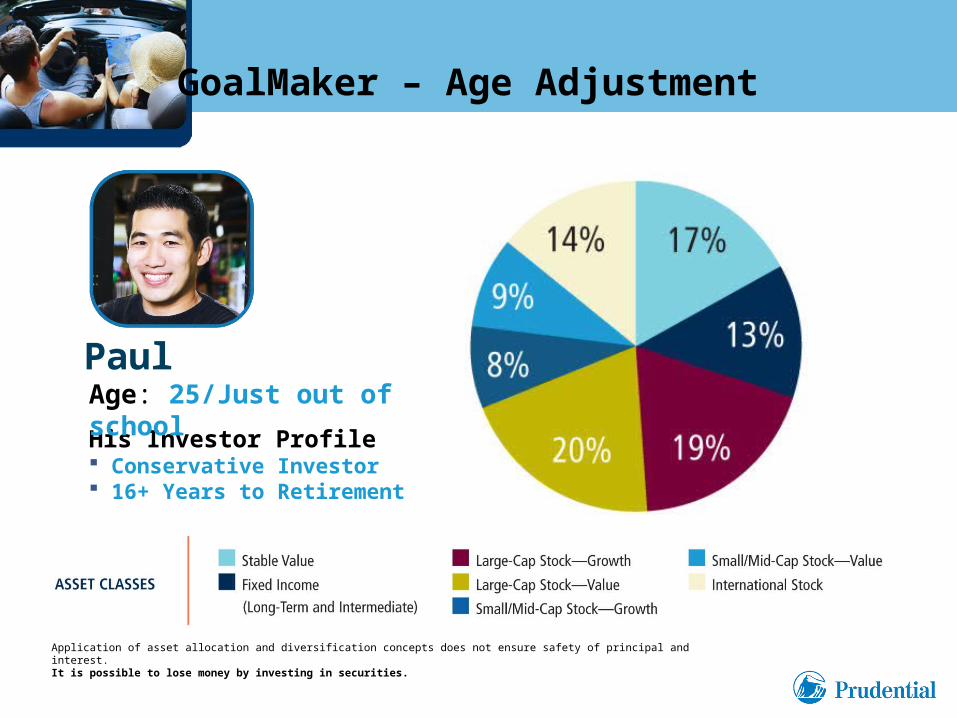
His Investor Profile Conservative Investor 16+ Years to Retirement
PaulAge: 25/Just out of school
Application of asset allocation and diversification concepts does not ensure safety of principal and interest. It is possible to lose money by investing in securities.
GoalMaker – Age Adjustment
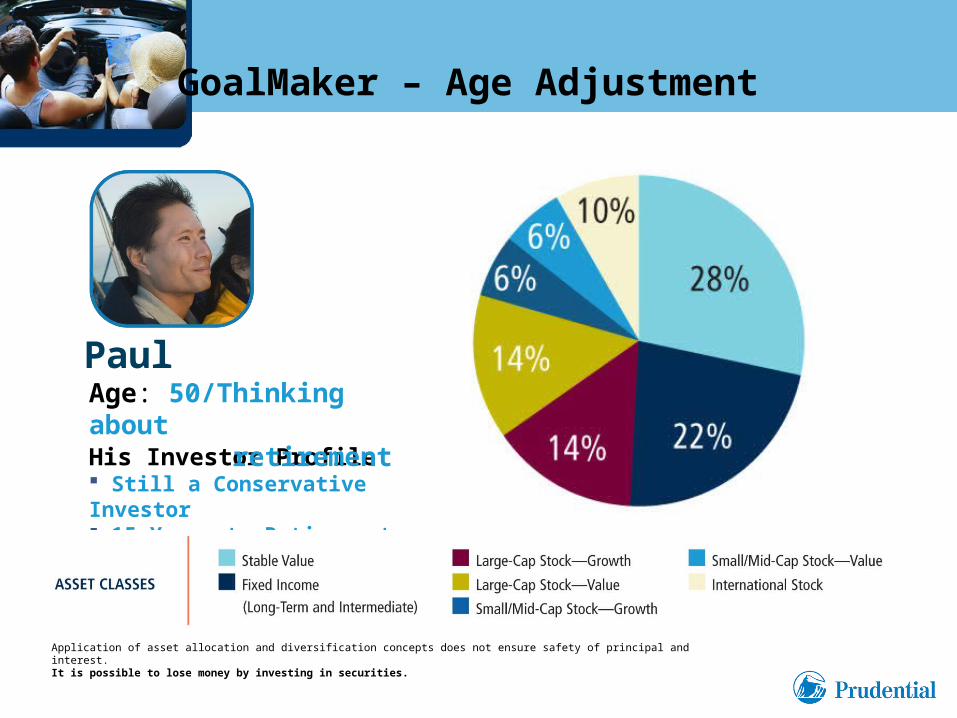
His Investor Profile Still a Conservative Investor 15 Years to Retirement
PaulAge: 50/Thinking about retirement
Application of asset allocation and diversification concepts does not ensure safety of principal and interest. It is possible to lose money by investing in securities.
GoalMaker – Age Adjustment
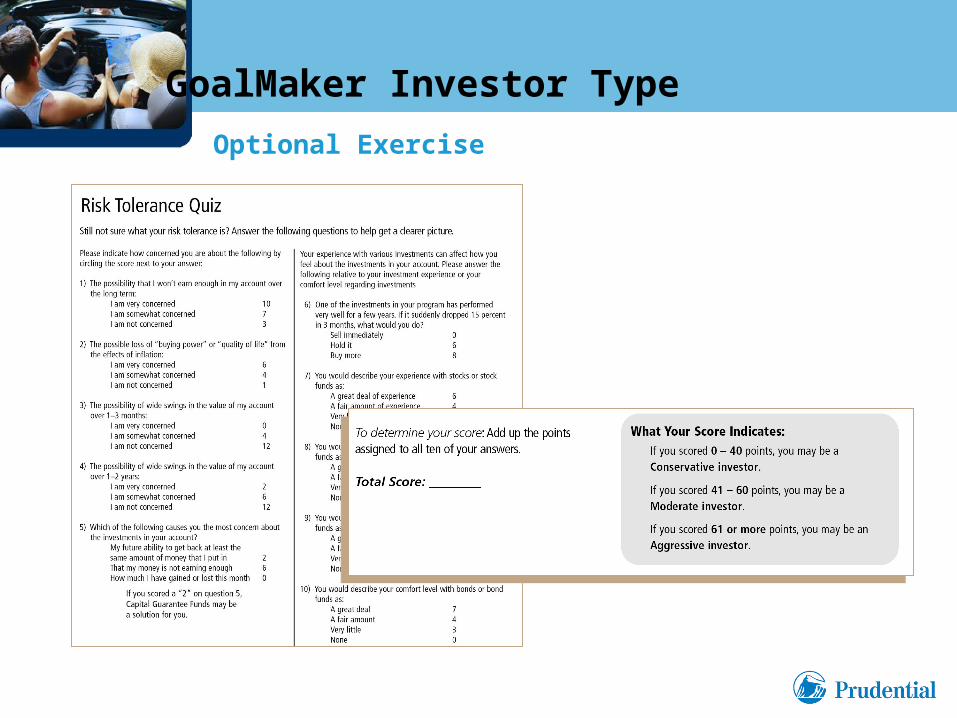
Optional Exercise
GoalMaker Investor Type
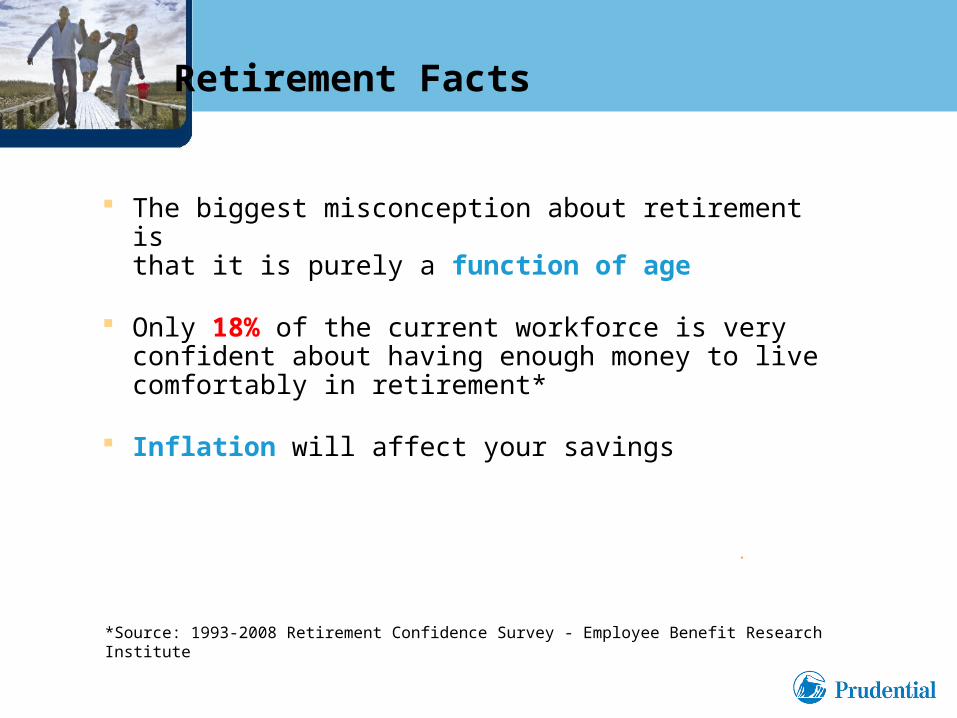
The biggest misconception about retirement is that it is purely a function of age
Only 18% of the current workforce is very confident about having enough money to live comfortably in retirement*
Inflation will affect your savings
*Source: 1993-2008 Retirement Confidence Survey - Employee Benefit Research Institute
.
Retirement Facts
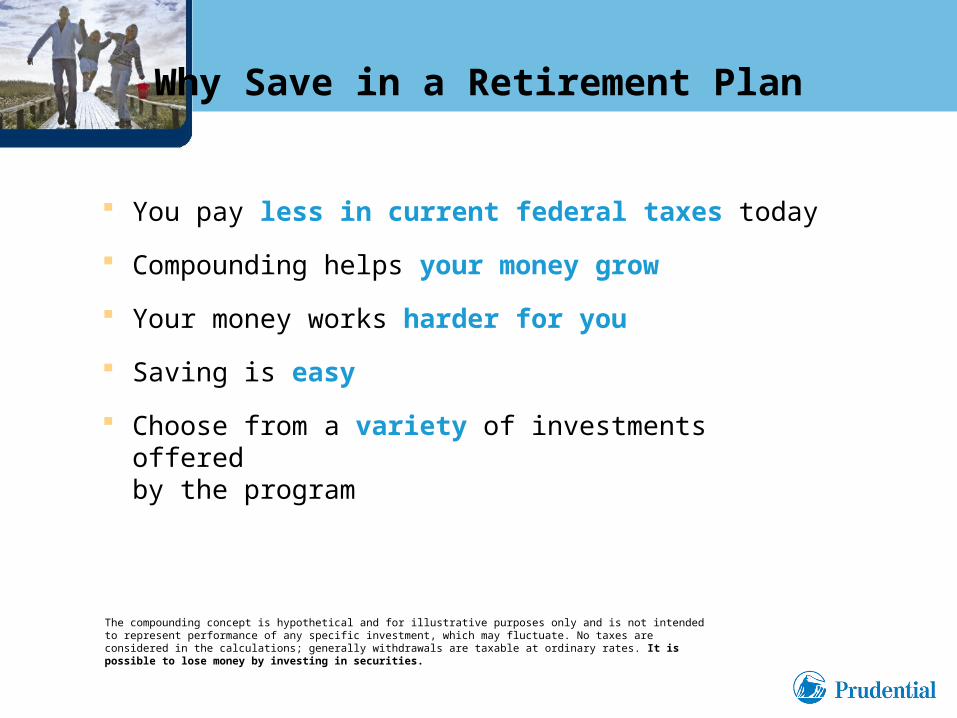
You pay less in current federal taxes today
Compounding helps your money grow
Your money works harder for you
Saving is easy
Choose from a variety of investments offered by the program
The compounding concept is hypothetical and for illustrative purposes only and is not intended to represent performance of any specific investment, which may fluctuate. No taxes are considered in the calculations; generally withdrawals are taxable at ordinary rates. It is possible to lose money by investing in securities.
Why Save in a Retirement Plan
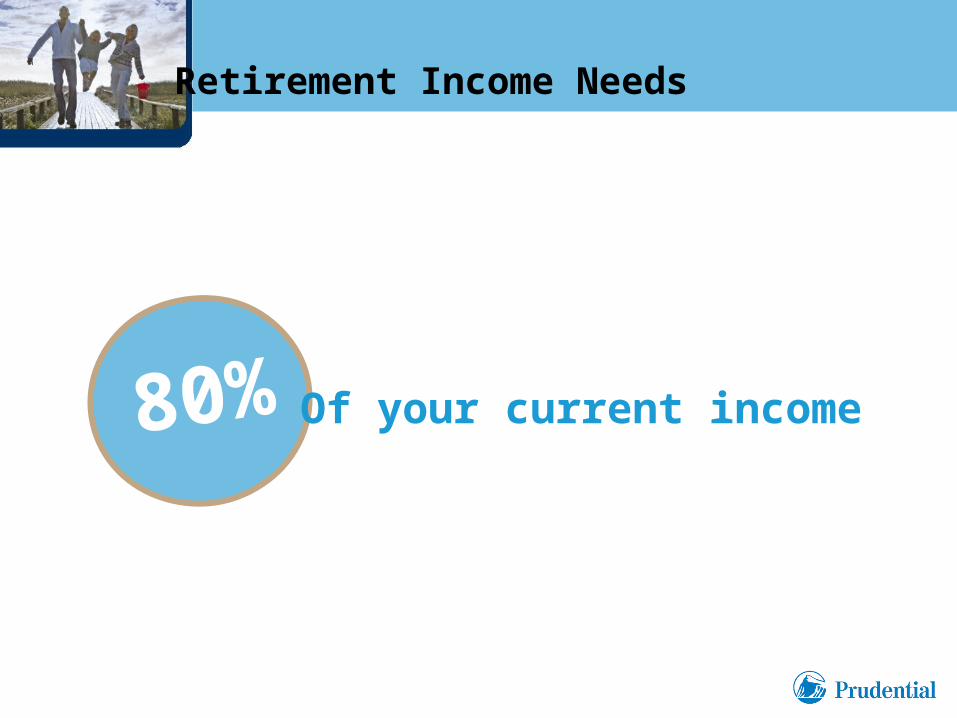
80% Of your current income
Retirement Income Needs
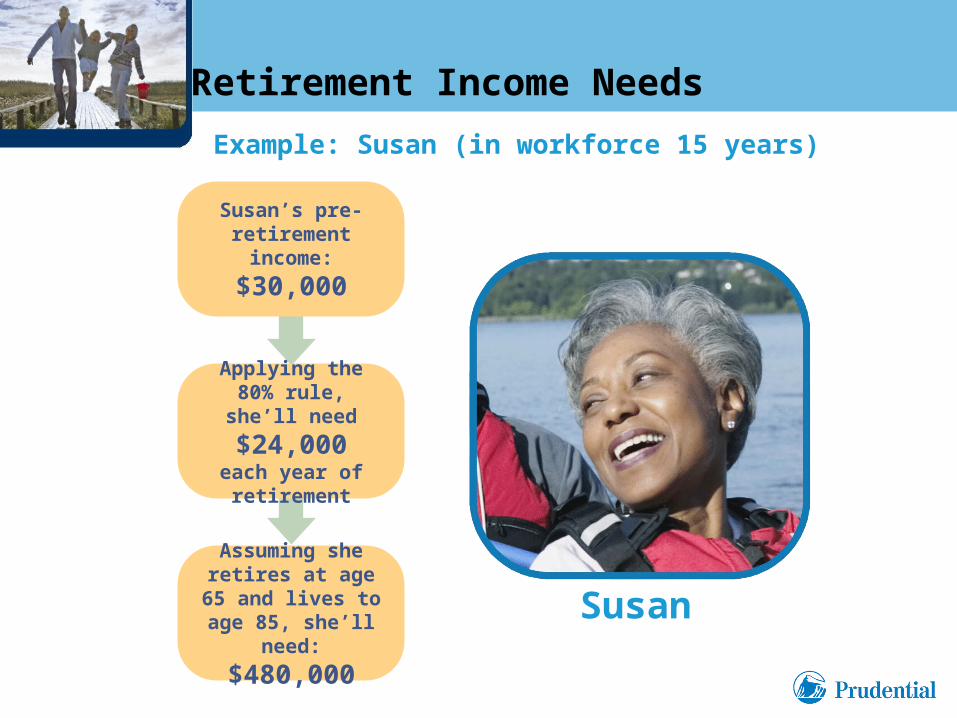
Susan
Susan’s pre-retirementincome:
$30,000
Applying the 80% rule, she’ll need
$24,000each year of retirement
Assuming she retires at age 65
and lives toage 85, she’ll
need:
$480,000
Example: Susan (in workforce 15 years)
Retirement Income Needs
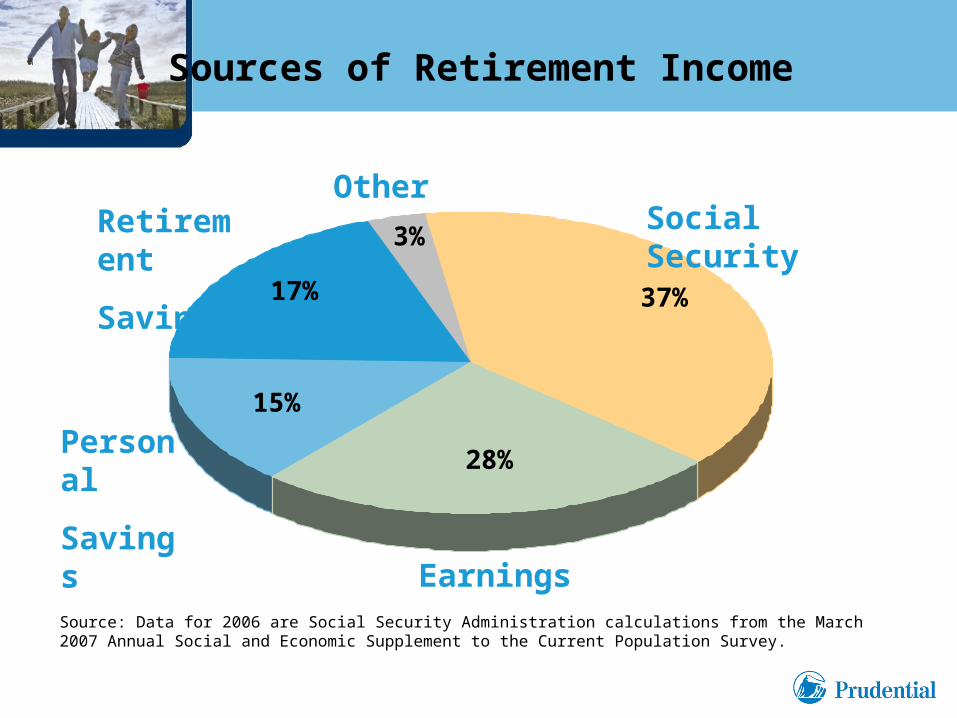
Source: Data for 2006 are Social Security Administration calculations from the March 2007 Annual Social and Economic Supplement to the Current Population Survey.
37%
28%
15%
17%
3%
OtherSocial SecurityRetirement
Savings
Personal
Savings
Earnings
Sources of Retirement Income
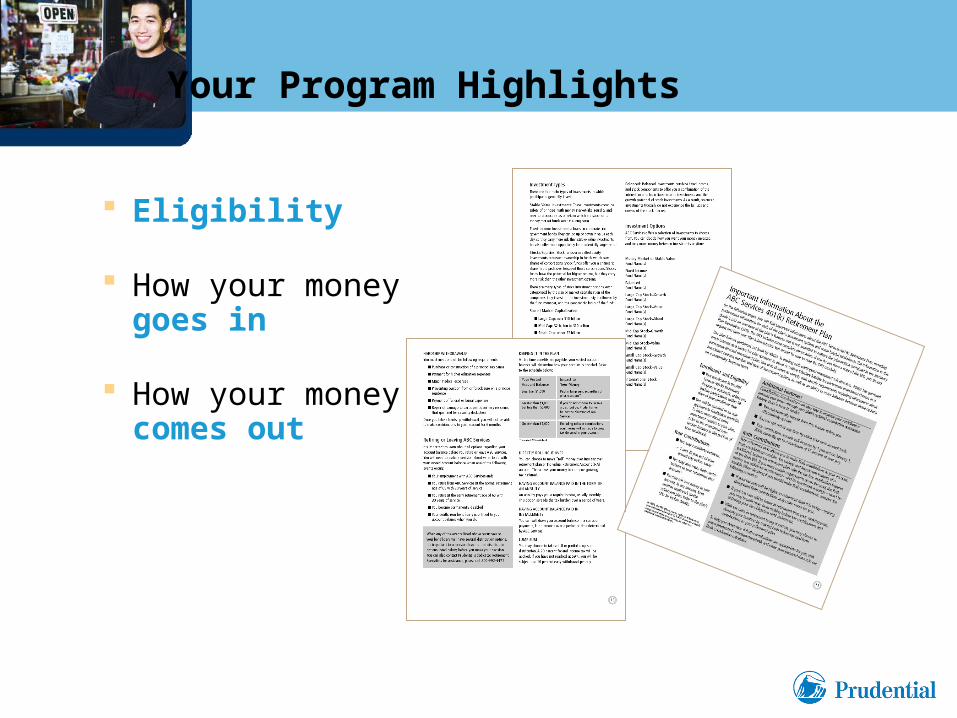
Eligibility
How your money goes in
How your money comes out
Your Program Highlights
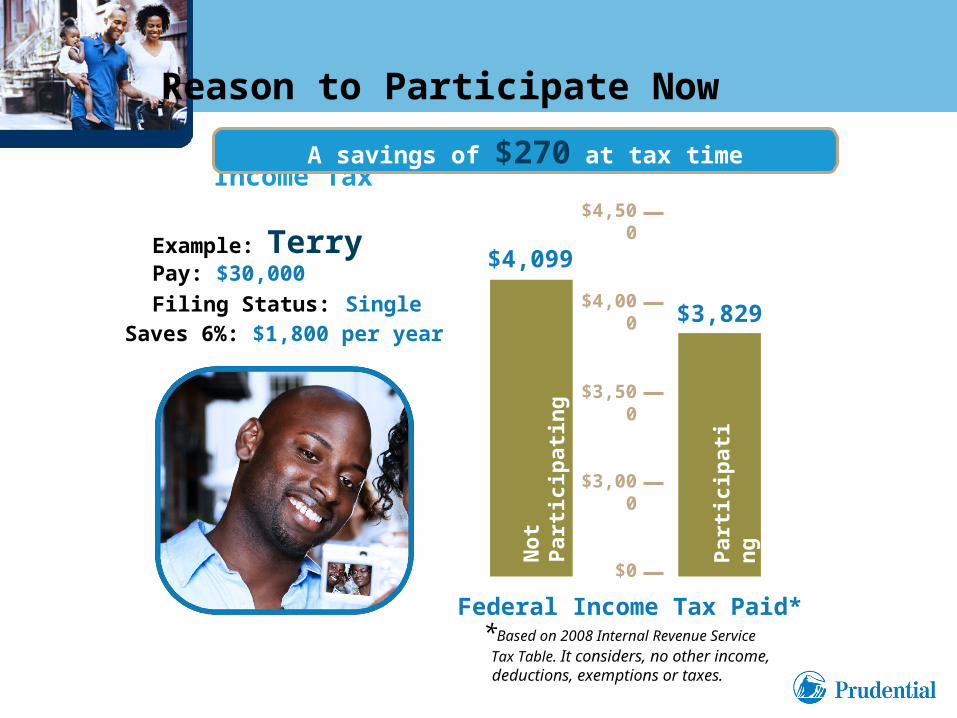
The Potential to Pay Less in Federal Income TaxA savings of $270 at tax time
*Based on 2008 Internal Revenue Service Tax Table. It considers, no other income, deductions, exemptions or taxes.
$0
$3,000
$3,500
$4,000
$4,500
Federal Income Tax Paid*
$4,099
$3,829
Example: TerryPay: $30,000
Filing Status: SingleSaves 6%: $1,800 per year
No
t P
arti
cip
atin
g
Par
tici
pat
ing
Reason to Participate Now
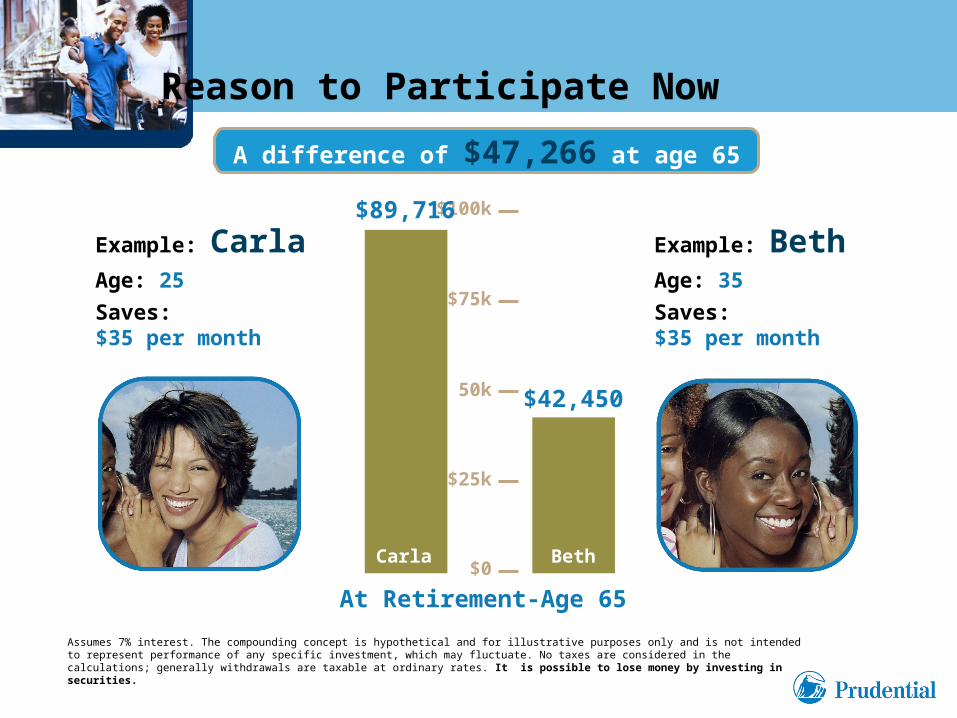
Compounding InterestA difference of $47,266 at age 65
Assumes 7% interest. The compounding concept is hypothetical and for illustrative purposes only and is not intended to represent performance of any specific investment, which may fluctuate. No taxes are considered in the calculations; generally withdrawals are taxable at ordinary rates. It is possible to lose money by investing in securities.
Example: CarlaAge: 25
Saves: $35 per month
$0
$25k
50k
$75k
$100k
At Retirement-Age 65
$89,716
Carla
$42,450
Beth
Example: BethAge: 35
Saves: $35 per month
Reason to Participate Now
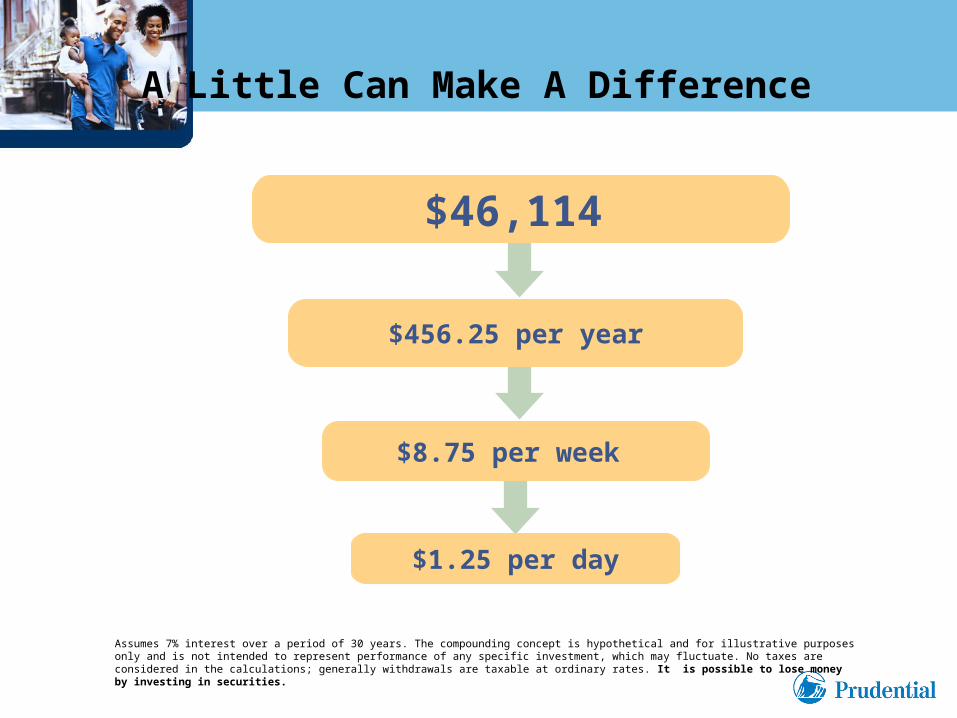
Assumes 7% interest over a period of 30 years. The compounding concept is hypothetical and for illustrative purposes only and is not intended to represent performance of any specific investment, which may fluctuate. No taxes are considered in the calculations; generally withdrawals are taxable at ordinary rates. It is possible to lose money by investing in securities.
$1.25 per day
$8.75 per week
$456.25 per year
$46,114
A Little Can Make A Difference
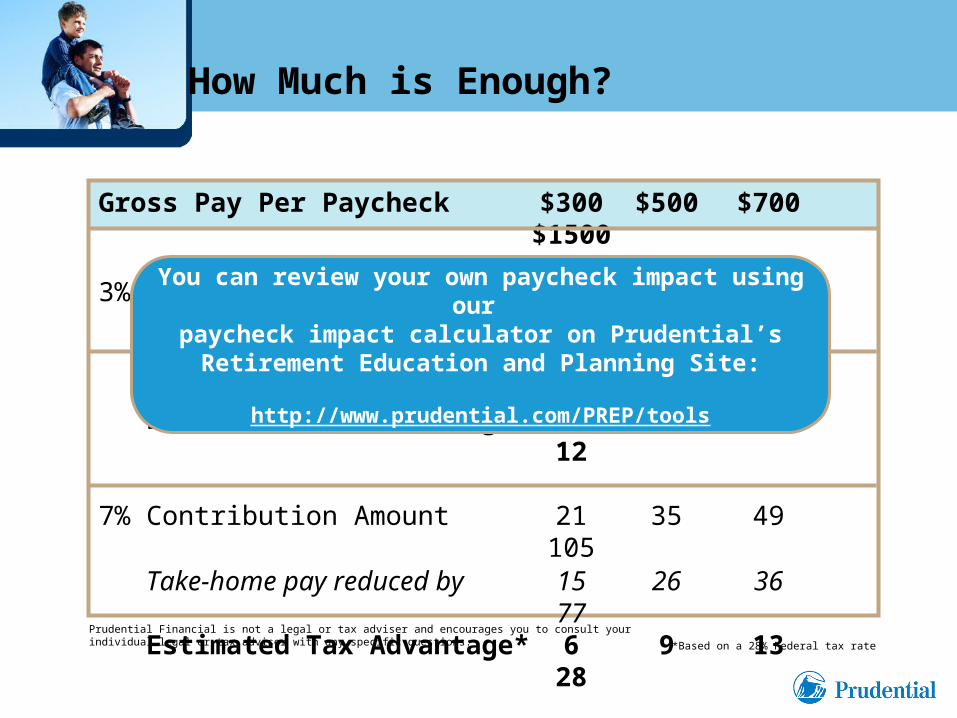
Gross Pay Per Paycheck $300 $500 $700$1500
3% Contribution Amount 9 15 2145
Take-home pay reduced by 7 11 1533
Estimated Tax Advantage* 2 4 612
7% Contribution Amount 21 35 49105
Take-home pay reduced by 15 26 3677
Estimated Tax Advantage* 6 9 1328
9% Contribution Amount 27 45 63135
Take-home pay reduced by 20 33 4699
Estimated Tax Advantage* 7 12 1736
*Based on a 28% Federal tax rate
Prudential Financial is not a legal or tax adviser and encourages you to consult your individual legal or tax adviser with any specific questions.
You can review your own paycheck impact using our paycheck impact calculator on Prudential’s Retirement
Education and Planning Site:
http://www.prudential.com/PREP/tools
How Much is Enough?
Enroll by completing the enrollment forms in the back of the Prudential Retirement Workbook
Learn more about planning for retirement at www.prudential.com/prep
Reevaluate your plan at least once per year
Next Steps
Rollover Contributions
Beneficiary Designation

Your Account Tools
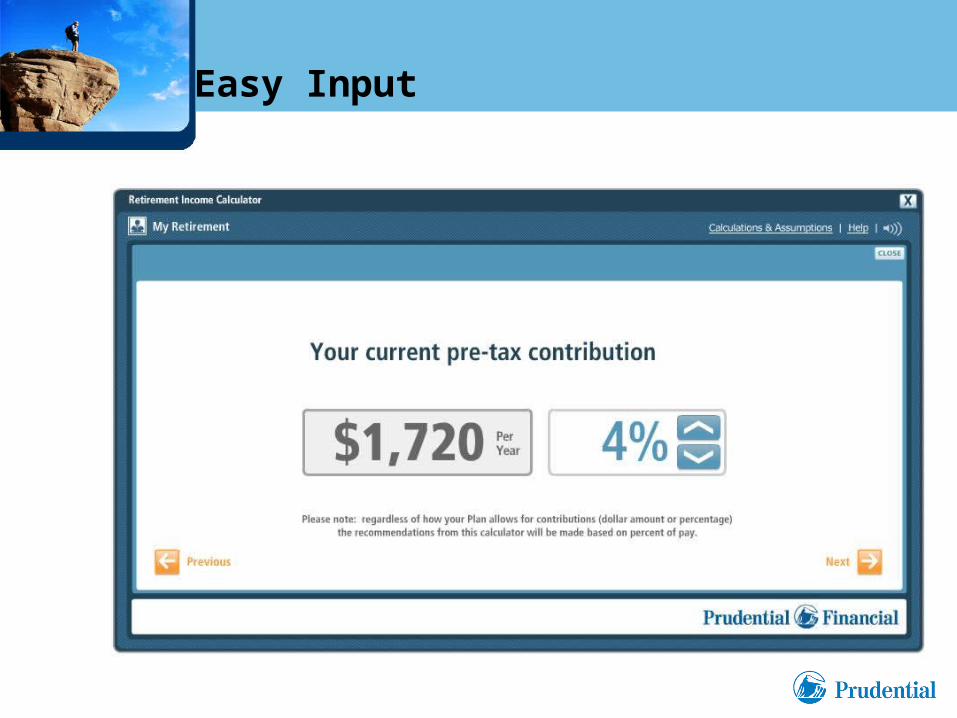
Easy Input

Straight Forward Results
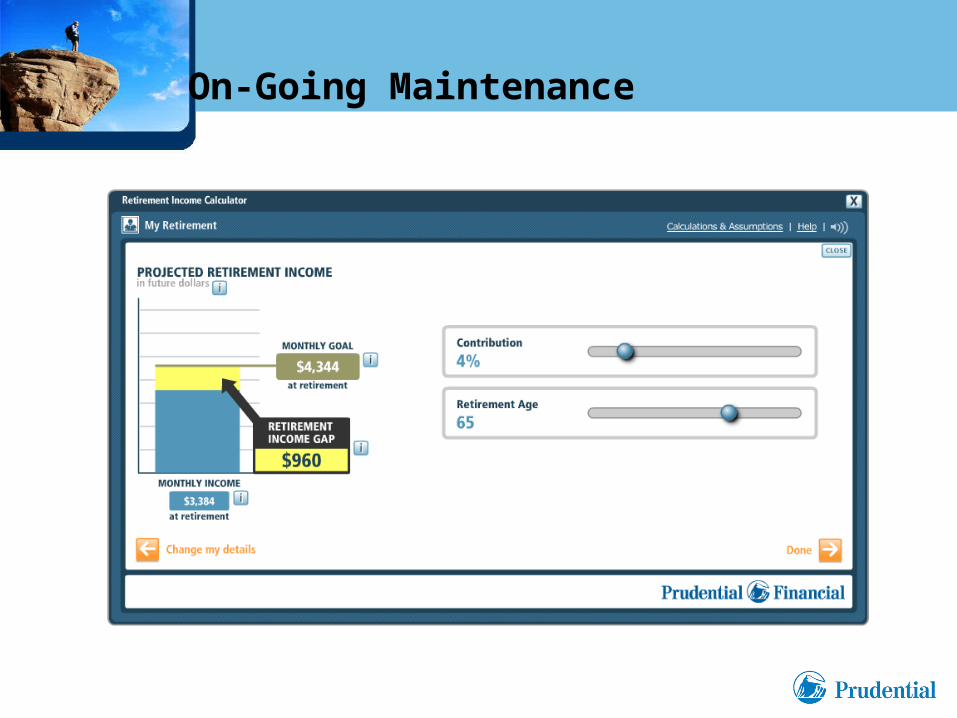
On-Going Maintenance