may 2015 asset/liability study - kentucky presentations... · rvk · 1 introduction the purpose of...
TRANSCRIPT

Asset/Liability StudyCERS Hazardous Pension Plan
May 2015

RVK · 1
Introduction The purpose of this memorandum is to summarize the key inferences we draw from the Asset/Liability (“A/L”) study of the CERS Hazardous Pension Plan (“CERS-HPP” or the “Plan”). While this memorandum refers directly to points raised within the study, we emphasize that a full understanding of the A/L study and its implications requires a close review of the study in its entirety. Background and Key Conclusions As of the fiscal year beginning June 30, 2014, the date of the most recent actuarial valuation and the start date of the projections in this study, the Plan was 63% funded (on a market value basis) meaning that assets were available to cover 63% of Plan liabilities as currently estimated by the Plan’s actuary. This equates to a shortfall of approximately $1.2 billion. This is a significant concern for the future of the Plan’s financial health, however, this study shows that the Plan remains solvent and while the Plan’s funding ratio will fluctuate during this period, the study suggests the potential for reducing the funding gap over the next 20 years. As highlighted below, this study suggests that continued diversification in the investment of Plan assets is desirable. The study, however, suggests caution in assuming that increased pursuit of higher expected returns, through even more aggressive (and hence even more volatile) asset allocations, is always beneficial. High expected return and high expected risk approaches bring with them increased risk of large declines in the value of the Plan and increased volatility in required contributions. The Purpose of an Asset Liability Study The central purpose of an A/L study is to examine the probable future consequences, over extended periods of time, of applying alternative asset allocation strategies to the Plan’s investment assets in order to fund the liabilities created by the benefit provisions of the Plan. A/L studies are unique in their ability to combine in a single analysis the three critical factors that drive the financial health of the Plan—benefit policy (liabilities), contribution policy, and investment strategy (asset allocation). Certainly this type of forward looking study—nor any others we are aware of—cannot indicate with any reliability what will happen in any given year over this extended period of time and its insights are dependent on the assumptions used. However, we have high conviction that the study’s results paint a highly reliable view of the core long-term trends in the Plan’s financial health. Best practice, in our judgment, is to take the
Memorandum To Kentucky Employees Retirement System
From RVK, Inc. Subject CERS-HPP Asset/Liability Study – Executive Summary
Date May 5, 2015

RVK · 2
general direction suggested as most appropriate by this study with its unique consideration of liabilities, contribution policy and trending liquidity needs and refine it in an asset allocation study where implementing the Plan’s structure can reflect the pragmatic considerations of investing in the capital markets present at any given point in time. Deterministic versus Stochastic In this study, we examined a series of related questions associated with this central purpose, projecting future outcomes under two distinctly different methodologies:
1. a deterministic basis (all underlying assumptions, liabilities, contributions and most critically investment returns, are achieved precisely and without variance in each and every year); and
2. a stochastic basis (outcomes for investment returns vary each year according to
estimated volatility with contribution requirements following suit while actual contribution policy and liabilities remains in their current form).
Key Results Below you will find a series of important findings, forecasts, and conclusions drawn from the body of the study. While the remarks are presented here to allow a quick assessment of some of the key findings, they represent only a sampling of the fundamental elements of the study. We emphasize that a solid understanding of each element requires that they be reviewed as they are presented in the study itself within their surrounding context (please note the frequent page references to the full study). This is especially important to understanding the findings which represent probable, but not certain, outcomes as analyzed in the stochastic section of the study. At the Outset:
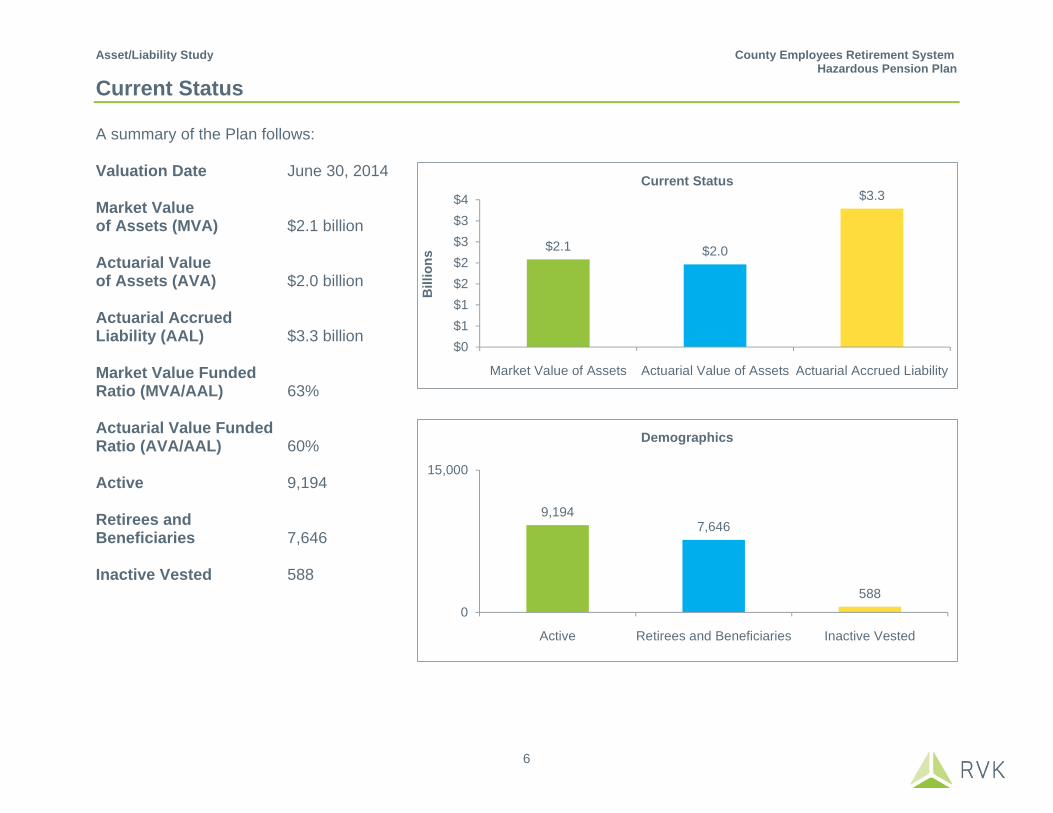
As of June 30, 2014 (the date of the actuarial valuation used to model liabilities), the Plan’s market value funded ratio (available assets to fund benefit obligations) was 63% (page 6).
The number of active members currently exceeds the number of inactive members by
approximately 20%. Over time, the inactive population is projected to grow and begin to quickly outnumber the active member population (page 8). The maturing demographics of the Plan is an important factor when considering the findings on Plan risk/return options and the projected status of Plan liquidity below.
Deterministic Analysis: A deterministic analysis assumes full certainty about the future, in particular, certainty of investment returns. Its virtues are that it is simple and that the findings reflect what will happen if the future turns out to be precisely as forecasted—no better, but also no worse.

RVK · 3
Benefit payments to Plan participants are expected to increase by about 98% over the
next 20 years (page 9). Annual increases are projected to range between 1.5% and 4.5%.
Total annual dollar contributions (employer and employee) based on actuarially required
rates are expected to almost double over the next 20 years; from $137 million in 2014 to $261 million in 2034 (page 10). Please note however, that precise actuarially required rates as they unfold are the purview of the Plan’s actuary and are affected by factors other than investment returns and resulting asset values of the Plan.
Beginning in 2016, contributions expressed as a weighted average percentage of salary are projected to remain constant (page 11).
Aggregate benefit payments are expected to increase by about 98% over the next 20
years but actually remain roughly constant as a percentage of Plan assets over this same time period (pages 9 and 12). Not only do benefit payments as a percentage of Plan assets not increase, they are also healthy and sustainable on an absolute basis during this period. This is an important and positive indication, because increased payout ratios, if they rise sufficiently high, can potentially impose liquidity constraints on the management of the portfolio (inhibiting the ability of the Plan to invest with a long-term horizon) therefore limiting the opportunity to invest in less liquid asset classes regardless of the return or risk reducing diversification benefits they offer. The payout ratio is projected to fluctuate between 10% and 11%% during the projection period. These levels do not, in our opinion, materially inhibit investment opportunities for the Plan (page 12).
As assets grow each and every year without exception at the assumed rate of return
(7.50%), the funding ratio on a market value basis is expected to gradually increase to approximately 77% by 2034 from the current value of 63% (page 17).
Assuming the current contribution policy remains unchanged, the Plan would need to
experience annual returns in excess of 11% over the next 10 years or 9% over the next 20 years without exception in each and every year in order to reach full funding (page 18). Achieving such lofty returns on such a sustained basis is extremely unlikely in our judgment and underscores our conclusion that investment returns alone cannot move the Plan to full funding.
Experiencing a return of 100 basis points below the Plan’s current assumed rate of
return of 7.50% (i.e., 6.50%) each year for the 20 year projection period would result in a moderate decline in the projected funding ratio to 66% in year 20 versus 77% at the current assumed rate of return (page 19). Additionally, under this scenario cumulative employer contributions would be $400 million higher over the 20 year period. Given the widely shared concerns about the prospects for a low return environment in the capital markets over the foreseeable future, this is a conclusion that should be thoroughly

RVK · 4
understood and appreciated. In the event that capital markets do not support returns commensurate with the assumed rate of return, reliance on contributions to complete the payout of the Plan’s liabilities effectively increases, especially in later years.
Stochastic Analysis: Unlike a deterministic analysis, a stochastic analysis does not assume an unvarying stream of expected investment returns year after year. Instead, it reflects the realistic view that pension plan investment returns are—like the investment markets themselves—volatile and always uncertain. This means that there are a range of possible outcomes for CERS-HPP; some are more likely, others less likely, but still possible. The deterministic approach is useful for gauging the general direction of change and associated consequences, but adding the element of uncertainty—more specifically year to year variability in the performance of the capital markets and the value of the Plan’s assets over time—can offer additional insights, albeit along with considerable complexity. Uncertainty in future investment returns is taken into account via a stochastic analysis of six different investment approaches (in the table below and on page 25) ranging from highly conservative (low risk, asset protective) to highly aggressive (high return seeking with substantial associated risk), including the Current Target allocation CERS-HPP. The reason for testing such a broad range of approaches is that at the heart of the CERS-HPP situation is a simple question that is difficult to answer: whether the Plan is better off following a strategy that:
(A) Falls in the general category of higher prospective return with greater risk (i.e. potential for more widely varying outcomes – good or bad), or
(B) Falls in the general category of lower prospective return with concomitantly lower risk (i.e. a tighter band of likely outcomes).

RVK · 5
Essential to answering this question is to ask precisely how CERS-HPP and the Plan’s broader constituencies define what “better off” means. The metrics we use for each to determine whether the Plan is “better off” under one approach versus another are as follows:
(1) The effect on funding ratio (and thus on contribution rates which decline with higher funding ratios).
(2) The effect on Plan liquidity (i.e. the Plan’s ability to pay annual benefits without major disruption of its strategic asset allocation, the driver of its investment strategy).
(3) The effect on the trend line and stability of annual contributions.
(4) The risk of large, sudden, and highly disruptive short-term declines in the Plan’s
assets over the course of time and the associated effects on contributions and potentially investment decisions.
The results of this analysis are displayed on pages 26 through 46 of the accompanying A/L study. For purposes of this summary, the consequences of choosing A versus B, as described above, is summarized most clearly in the tables on pages 32 and 46 of the study (copied below followed by explanatory comments).
Current Target 15% 54% 20% -38% 55%Conservative Portfolio 0% 95% 40% -22% 58%Potential Portfolio 1 10% 59% 20% -32% 55%Potential Portfolio 2 19% 51% 19% -41% 55%Potential Portfolio 3 25% 48% 20% -46% 55%Aggressive Portfolio 31% 44% 21% -51% 56%
Maximum 1 YearEmployer Contribution
Probability of < 63% (Current) Funding in 2034
Probability of FullFunding in 203420 Years Maximum 1 Year
Investment LossProbability of < 40%
(Current) Funding in 2034

RVK · 6
The median expected funding ratio at the end of the 20 year study period is lower than the current funding level all but Potential Portfolio 3 and the Aggressive Portfolio (pages 31, 32, and 46). The Current Target and Potential Portfolio 1 result in expected funding ratios that are substantially similar to the current level. This is supportive of the continued utilization of diversified investment approach.
With the exception of the Conservative Portfolio all portfolios analyzed show a moderate
(from 10% to 31%) probability of full funding in 20 years (page 32). The Conservative Portfolio shows a no probability of full funding in 20 years.
None of the portfolios show significant probability of extreme payout ratios over the next 20 years (pages 33-38 and 46). However, the peak value for all portfolios is above 30%, a level that does inhibit asset allocation decisions as they relate to illiquid asset classes.
As you incrementally increase the expected risk and return of the fund (from Potential
Portfolio 1 to Potential Portfolio 3), the outcomes do appear to gradually improve at the cost of slightly reduced worst-case outcomes.
The cumulative cost of providing the Plan’s benefits is met through a combination of contributions and the investment returns on those contributions. The Conservative Portfolio requires the largest increase in cumulative contributions (i.e., the direct funding of benefits) (pages 40, 45, and 46). Even under the very unlikely best-case scenario the Plan would have a funded ratio of about 43%, far lower than any of the other portfolios (page 46). The only redeeming virtue of such an ultra-conservative approach is that the potential for large declines in the value of the fund is significantly mitigated albeit at much higher ongoing costs (contributions) and chronic poor Plan financial health.
The Aggressive Portfolio does appear to have the highest probability of producing full
funding by 2034 at 31% (page 32). However, it also has a maximum theoretical one-year portfolio decline of 51%—a loss of almost one half of the Plan’s assets, significant we believe by any standard. This likelihood of notably larger one year declines within the study period gives pause to the desirability of a far more aggressive approach simply from a quantitative viewpoint. It also suggests it may be a strategy that is extremely difficult for decision makers to sustain over a long period of time. Declines in the total fund market value of this magnitude are a disruptive event from all aspects of Plan management. Yet, the benefit of such an aggressive approach that makes it superficially attractive can only be realized with any probability if the aggressive and highly volatile
50th 5th 95th Peak TroughCurrent Target 63% 32% 138% 60% 28% 142% $3,278 $4,624 $1,055 13% 34% 5%Conservative Portfolio 46% 31% 67% 43% 27% 63% $4,046 $4,578 $3,268 19% 34% 9%Potential Portfolio 1 60% 33% 114% 58% 29% 118% $3,386 $4,523 $1,433 14% 32% 7%Potential Portfolio 2 64% 31% 156% 62% 27% 161% $3,210 $4,676 $904 13% 35% 5%Potential Portfolio 3 66% 30% 202% 66% 26% 199% $3,090 $4,781 $742 12% 38% 4%Aggressive Portfolio 70% 29% 261% 69% 25% 271% $2,935 $4,870 $599 11% 42% 3%
Year 20 Median
2014-203420 YearsActuarial Funded Ratio in Year 20 Market Funded Ratio in Year 20 Payout Ratios
50th 5th 95th 50th 5th 95th
Cumulative Employer Contributions in Year 20 (Millions)
RVK · 7
approach is maintained for several decades through good times, bad times, and unnerving times. Furthermore, this type of strategy could prove difficult to maintain in future years should demographic (early retirement incentives for example) or financial events create higher liquidity demands on the Plan. For all these reasons, it is not an approach that should be seriously considered without full recognition of the significant risks.
While RVK supports the conclusions of the study using our current capital market
assumptions, we also model for extreme market scenarios to stress test the results of the study. The summary of this analysis can be found in Appendices 1 and 2 (beginning on pages 47 and 50 respectively). The first test models the case of extreme market volatility by doubling the assumed standard deviations of all asset classes. The second test models converging market returns by assuming all assets are perfectly correlated (i.e. correlations equal +1.00). The results of these additional analyses show that the relative portfolio outcomes do not change, but that the range of potential results widens, indicating higher risk for all asset mixes given the increased systemic volatility and the reduced dampening effects of total fund diversification we assume under these stress scenarios.
Final Comments This A/L study shows that CERS-HPP is currently underfunded but significant improvements in financial health are possible. The Plan can best meet its objectives through the continued use of a well-diversified investment portfolio. However, positive outcomes are extremely dependent on the contribution policy. The study is not supportive of a long-term, ultra-conservative approach. The increasing potential for large one-year declines suggests that there is likely a limit to the net benefits of adding increased risk in pursuit of additional return. Progress should be monitored periodically through studies such as these, particularly if the Plan encounters a sustained period of lower returns in the capital markets (and thus for the Plan’s assets) as well as material changes in contribution policy or benefit levels. Additionally, this study assumes no further changes are made to the benefit policy at any point during the 20 year projection period. Such changes would fall outside the reach of an Asset/Liability study. However, we do note that even small changes to the benefit policy can have a meaningful long-term impact on the likely future outcomes of the Plan.

Asset/Liability Study County Employees Retirement System Hazardous Pension Plan
1
Table of Contents
ACKNOWLEDGEMENTS ........................................................................... PAGE 2 INTRODUCTION ....................................................................................... PAGE 3 CURRENT STATUS ................................................................................. PAGE 6 DETERMINISTIC ANALYSIS ...................................................................... PAGE 7 DETERMINISTIC SCENARIO ANALYSIS ................................................... PAGE 18 STOCHASTIC ANALYSIS ........................................................................ PAGE 20 APPENDIX 1: SENSITIVITY ANALYSIS: VOLATILITY ................................. PAGE 47 APPENDIX 2: SENSITIVITY ANALYSIS: CORRELATIONS........................... PAGE 50 APPENDIX 3: ASSUMPTIONS AND METHODS .......................................... PAGE 53
Asset/Liability Study County Employees Retirement System Hazardous Pension Plan
2
Acknowledgements PREPARED BY:
TONY JOHNSON, SENIOR CONSULTANT, RVK, INC.
JAMES VOYTKO, SENIOR CONSULTANT, RVK, INC.
RYAN SULLIVAN, CONSULTANT, RVK, INC.
MATTHIAS BAUER, CONSULTANT, RVK, INC. WITH THE COOPERATION OF:
DAVID DOUGHERTY, LLC (RVK CONSULTING ACTUARY)
CAVANAUGH MACDONALD CONSULTING, LLC (SYSTEM ACTUARY)

Asset/Liability Study County Employees Retirement System Hazardous Pension Plan
3
Introduction RVK, Inc. (RVK) has prepared this report for the County Employees Retirement System Hazardous Pension Plan (CERS) to:
o Present projected valuation results with respect to the funded status of the Plan. o Present projected benefit payments of the Plan. o Investigate asset mixes to determine those which best serve to protect and increase funding levels, while
providing adequate liquidity for benefit payments. The valuation projections are shown using both a deterministic and stochastic process. The deterministic process provides an open group analysis of projected valuation results based on a fixed set of future assumptions (see summary in the Assumptions and Methods section of this report). The stochastic process provides an open group analysis of projected valuation results under many capital market environments based on expected asset returns and inflation, and their expected volatility. Using a Monte Carlo simulation technique, both assets and liabilities are assumed to vary stochastically, linked together by changes in inflation. Expected values, variances of the returns and inflation, and correlations are used to generate 2,000 trials to produce a distribution of potential outcomes. A stochastic analysis can answer questions about the best/worst case outcomes along with the probability of such outcomes.

Asset/Liability Study County Employees Retirement System Hazardous Pension Plan
4
Investment Policy
Contribution Policy
Asset Liability Analysis
Benefit Policy
Introduction (continued) What is an Asset/Liability Study? Investment programs and the strategy they seek to implement (Investment Policy) do not exist in a vacuum. They seek
to satisfy one or more investment objectives and operate within a plan framework that includes the investment objectives (Benefit Policy) and plan funding (Contribution Policy).
The purpose of an Asset/Liability Study is to examine how well alternative investment strategies (i.e., differing asset
allocations) address the objectives served by the Plan—the Plan’s “liabilities” in the context of the Plan’s funding streams—the Plan’s Contribution Policy. It is the only standard analysis that fully links all three aspects of the Plan’s key financial drivers.
In doing so, it creates an important “guidepost” for the actual asset allocation for the Plan; the asset allocation chosen
by the Plan’s fiduciaries will likely reflect the nature of the liabilities but also numerous other factors including risk preferences, liquidity, implementation constraints, etc.
For the CERS Asset/Liability Study, we assume the objectives are:
1. Fund all participants’ benefits over time. 2. Assure sufficient liquidity to pay benefits at all times. 3. Foster a stable contribution stream consistent with objectives 1 and 2. 4. Achieve adequate returns without accepting unnecessary or imprudent levels of risk.
An Asset/Liability Study is NOT . . . An actuarial study of the CERS liabilities—that is the purview of the Plan’s actuary. A prescription for Plan benefits—that is the purview of the elected representatives. An assessment of the affordability of contribution levels—that is the purview of the elected officials and their
constituents. The sole determinant of the final asset allocation adopted for the Plan—there are a number of factors, including
insights from an Asset/Liability Study, which will bear on the optimal asset allocation.
Asset/Liability Study County Employees Retirement System Hazardous Pension Plan
5
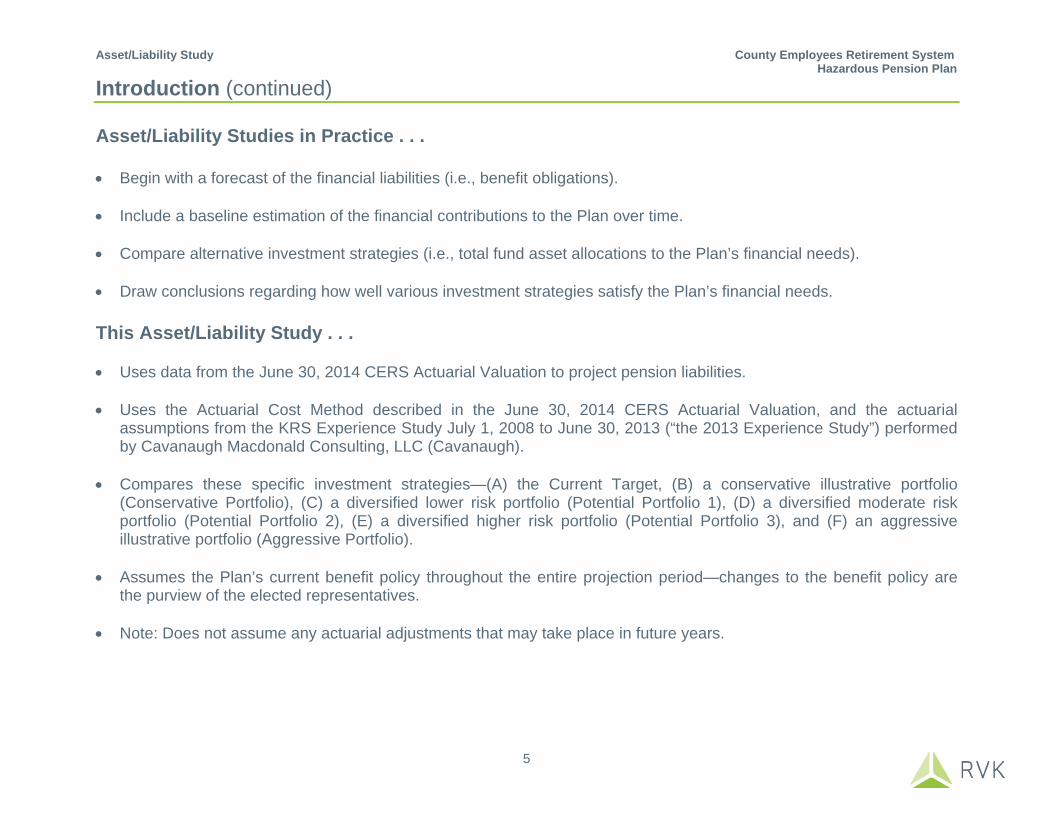
Introduction (continued) Asset/Liability Studies in Practice . . . Begin with a forecast of the financial liabilities (i.e., benefit obligations). Include a baseline estimation of the financial contributions to the Plan over time. Compare alternative investment strategies (i.e., total fund asset allocations to the Plan’s financial needs). Draw conclusions regarding how well various investment strategies satisfy the Plan’s financial needs. This Asset/Liability Study . . . Uses data from the June 30, 2014 CERS Actuarial Valuation to project pension liabilities. Uses the Actuarial Cost Method described in the June 30, 2014 CERS Actuarial Valuation, and the actuarial
assumptions from the KRS Experience Study July 1, 2008 to June 30, 2013 (“the 2013 Experience Study”) performed by Cavanaugh Macdonald Consulting, LLC (Cavanaugh).
Compares these specific investment strategies—(A) the Current Target, (B) a conservative illustrative portfolio
(Conservative Portfolio), (C) a diversified lower risk portfolio (Potential Portfolio 1), (D) a diversified moderate risk portfolio (Potential Portfolio 2), (E) a diversified higher risk portfolio (Potential Portfolio 3), and (F) an aggressive illustrative portfolio (Aggressive Portfolio).
Assumes the Plan’s current benefit policy throughout the entire projection period—changes to the benefit policy are
the purview of the elected representatives. Note: Does not assume any actuarial adjustments that may take place in future years.
Asset/Liability Study County Employees Retirement System Hazardous Pension Plan
6
$2.1 $2.0
$3.3
$0$1$1$2$2$3$3$4
Market Value of Assets Actuarial Value of Assets Actuarial Accrued Liability
Bill
ions
Current Status
9,1947,646
5880
15,000
Active Retirees and Beneficiaries Inactive Vested
Demographics
Current Status A summary of the Plan follows: Valuation Date June 30, 2014 Market Value of Assets (MVA) $2.1 billion Actuarial Value of Assets (AVA) $2.0 billion Actuarial Accrued Liability (AAL) $3.3 billion Market Value Funded Ratio (MVA/AAL) 63% Actuarial Value Funded Ratio (AVA/AAL) 60% Active 9,194 Retirees and Beneficiaries 7,646 Inactive Vested 588
Asset/Liability Study County Employees Retirement System Hazardous Pension Plan
7
Deterministic Analysis This section provides an analysis of the Plan’s assets, liabilities, funded status, and benefit payments based on a fixed set of future assumptions. Each analysis that follows in this deterministic section rests on the critical assumptions below and must be read and interpreted with them in mind—particularly assumptions #2, #3 and #4. The deterministic assumptions are as follows:
1. Current Plan provisions (see Summary of Main Benefit and Contribution Provisions beginning on page 38 of the CERS June 30, 2014 actuarial valuation report prepared by Cavanaugh).
2. The participant data used by Cavanaugh in its June 30, 2014 actuarial valuation.
3. Actuarially assumed rate of return on Plan assets for all projection years: 7.50%.
4. For the fiscal years ending 2015 and 2016, assumes total employer contributions equal to the full actuarially
required contributions as set forth in the actuarial valuations as of June 30, 2013, and June 30, 2014 (20.73% and 20.26% of payroll, respectively). Thereafter, assumes employer contributions for each fiscal year are determined as of the prior year’s valuation date in accordance with the actuarial funding policy and the assumptions from the 2013 Experience Study.
5. Assumes demographic experience projected in accordance with the actuarial assumptions proposed in the 2013
Experience Study.
6. Open group analysis: level active population. New active participants entering the Plan are assumed to have similar characteristics to recently hired participants.

Asset/Liability Study County Employees Retirement System Hazardous Pension Plan
8
Deterministic Analysis (continued) Demographics Following are the projected number of active and inactive participants at the beginning of each Plan year from 2014 through 2034 (2014 is actual). These projections are based on an open group analysis. Using the actuary’s assumptions for death, termination, retirement, and disability, current participants are assumed to leave the Plan in the future. The number of total inactive participants (Retirees and Beneficiaries and Vested Inactive) increases by approximately 210% during the 20-year projection period shown.
0
5,000
10,000
15,000
20,000
25,000
30,000
35,000
40,000
2014 2015 2016 2017 2018 2019 2020 2021 2022 2023 2024 2025 2026 2027 2028 2029 2030 2031 2032 2033 2034At Plan Year Beginning
Projected Demographics
Active Retirees and Beneficiaries Inactive Vested
Total Population 2014 2015 2016 2017 2018 2019 2020 2021 2022 2023 2024 2025 2026 2027 2028 2029 2030 2031 2032 2033 2034Annual Percent Change N/A 8.5% 6.5% 5.7% 5.2% 4.6% 4.2% 4.0% 3.8% 3.5% 3.3% 3.0% 2.8% 2.6% 2.4% 2.3% 2.0% 1.8% 1.6% 1.4% 1.3%
Asset/Liability Study County Employees Retirement System Hazardous Pension Plan
9
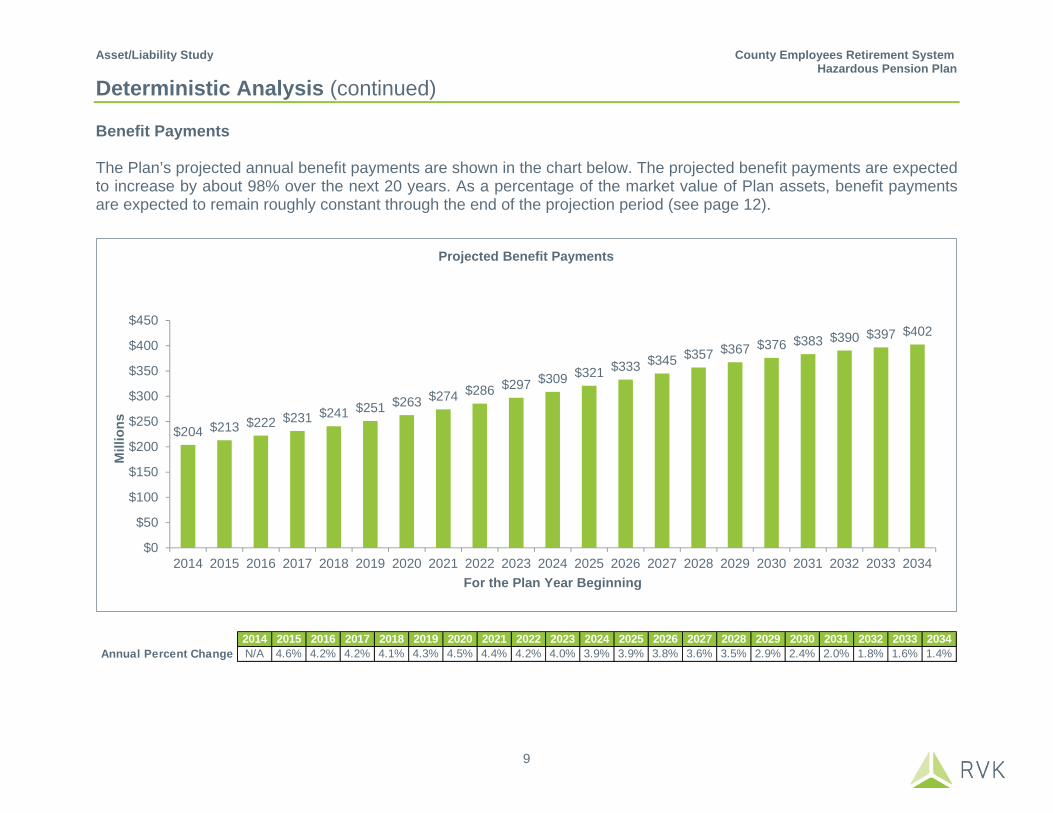
Deterministic Analysis (continued) Benefit Payments The Plan’s projected annual benefit payments are shown in the chart below. The projected benefit payments are expected to increase by about 98% over the next 20 years. As a percentage of the market value of Plan assets, benefit payments are expected to remain roughly constant through the end of the projection period (see page 12).
$204 $213 $222 $231 $241 $251 $263 $274 $286 $297 $309 $321 $333 $345 $357 $367 $376 $383 $390 $397 $402
$0
$50
$100
$150
$200
$250
$300
$350
$400
$450
2014 2015 2016 2017 2018 2019 2020 2021 2022 2023 2024 2025 2026 2027 2028 2029 2030 2031 2032 2033 2034
Mill
ions
For the Plan Year Beginning
Projected Benefit Payments
2014 2015 2016 2017 2018 2019 2020 2021 2022 2023 2024 2025 2026 2027 2028 2029 2030 2031 2032 2033 2034Annual Percent Change N/A 4.6% 4.2% 4.2% 4.1% 4.3% 4.5% 4.4% 4.2% 4.0% 3.9% 3.9% 3.8% 3.6% 3.5% 2.9% 2.4% 2.0% 1.8% 1.6% 1.4%

Asset/Liability Study County Employees Retirement System Hazardous Pension Plan
10
Deterministic Analysis (continued) Contributions The Plan’s projected contributions, expressed as total dollar contributions, are shown in the chart below. The results assume the contribution policy remains unchanged, and that the Plan’s assets return precisely the actuarially assumed rate each year without exception for all projection years.
$137 $137 $136 $140 $143 $146 $152 $158 $164 $170 $177 $184 $191 $199 $207 $215 $223 $232 $242 $251 $261
$0
$50
$100
$150
$200
$250
$300
2014 2015 2016 2017 2018 2019 2020 2021 2022 2023 2024 2025 2026 2027 2028 2029 2030 2031 2032 2033 2034
Mill
ions
For the Plan Year Beginning
Projected Contributions
Employer Contribution Employee Contribution
2014 2015 2016 2017 2018 2019 2020 2021 2022 2023 2024 2025 2026 2027 2028 2029 2030 2031 2032 2033 2034Annual Percent Change N/A -0.1% -0.9% 3.2% 2.0% 2.4% 3.7% 3.8% 3.9% 3.9% 3.9% 4.0% 3.9% 4.0% 4.0% 4.0% 4.0% 4.0% 4.0% 4.0% 4.0%
Asset/Liability Study County Employees Retirement System Hazardous Pension Plan
11
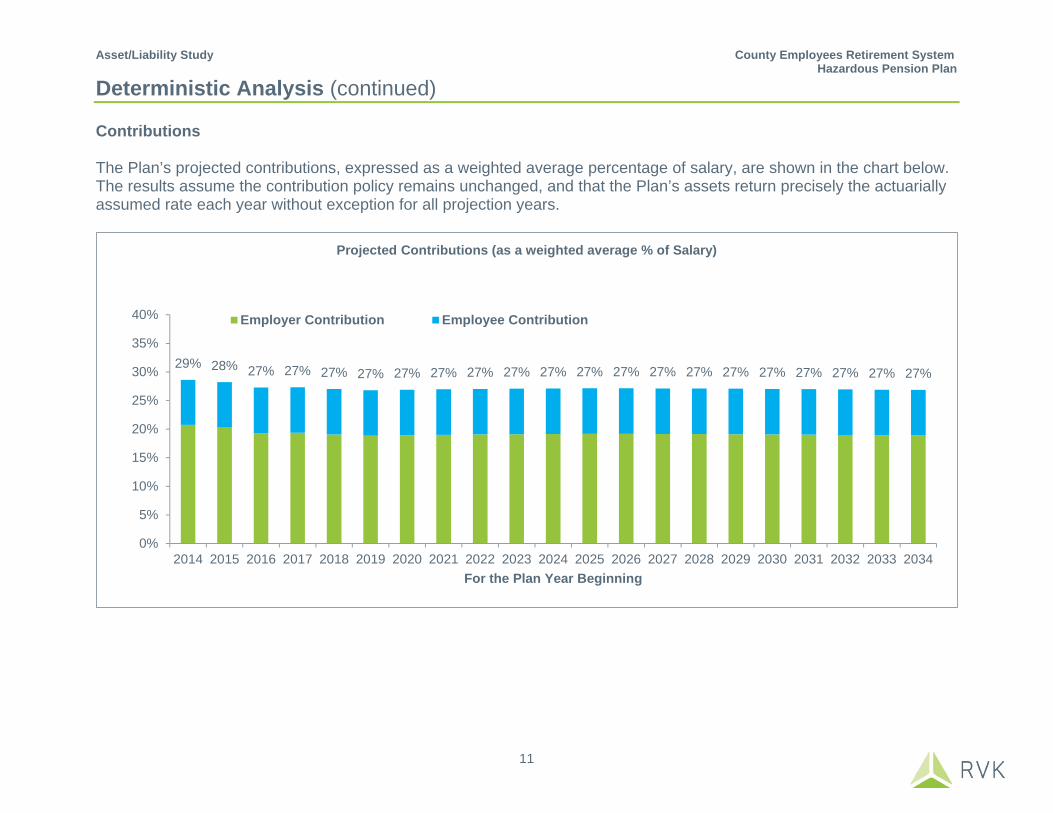
Deterministic Analysis (continued) Contributions The Plan’s projected contributions, expressed as a weighted average percentage of salary, are shown in the chart below. The results assume the contribution policy remains unchanged, and that the Plan’s assets return precisely the actuarially assumed rate each year without exception for all projection years.
29% 28% 27% 27% 27% 27% 27% 27% 27% 27% 27% 27% 27% 27% 27% 27% 27% 27% 27% 27% 27%
0%
5%
10%
15%
20%
25%
30%
35%
40%
2014 2015 2016 2017 2018 2019 2020 2021 2022 2023 2024 2025 2026 2027 2028 2029 2030 2031 2032 2033 2034For the Plan Year Beginning
Projected Contributions (as a weighted average % of Salary)
Employer Contribution Employee Contribution
Asset/Liability Study County Employees Retirement System Hazardous Pension Plan
12
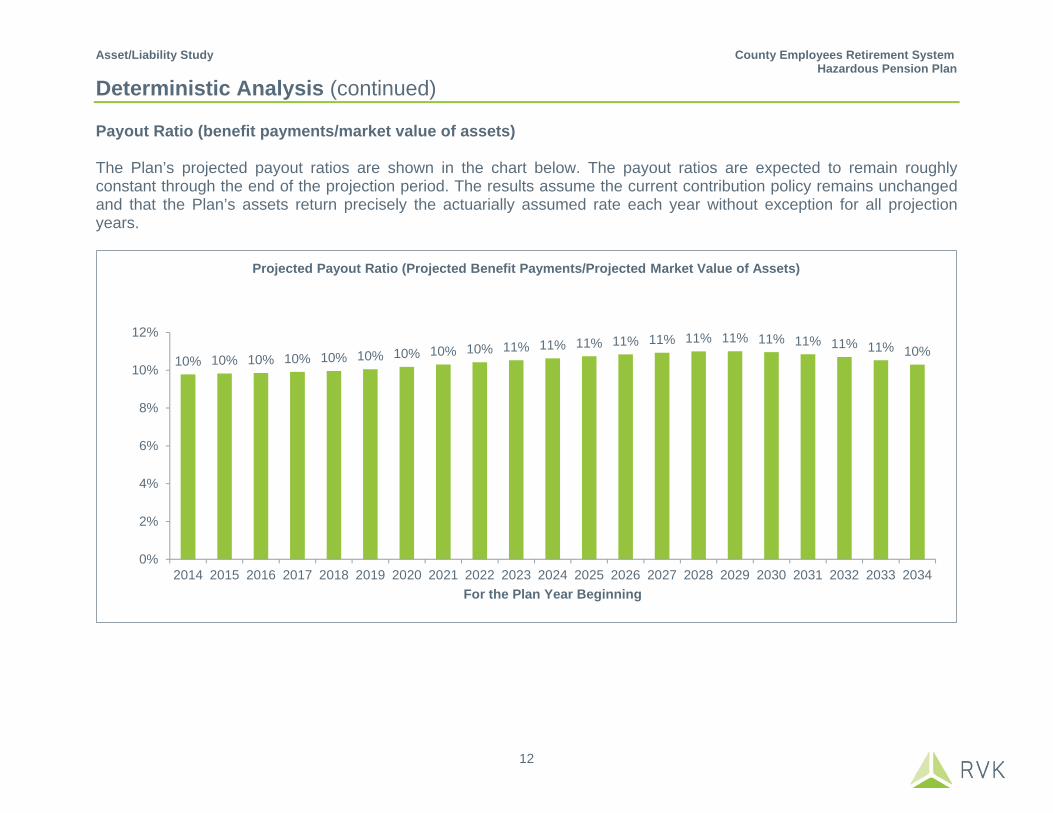
Deterministic Analysis (continued) Payout Ratio (benefit payments/market value of assets) The Plan’s projected payout ratios are shown in the chart below. The payout ratios are expected to remain roughly constant through the end of the projection period. The results assume the current contribution policy remains unchanged and that the Plan’s assets return precisely the actuarially assumed rate each year without exception for all projection years.
10% 10% 10% 10% 10% 10% 10% 10% 10% 11% 11% 11% 11% 11% 11% 11% 11% 11% 11% 11% 10%
0%
2%
4%
6%
8%
10%
12%
2014 2015 2016 2017 2018 2019 2020 2021 2022 2023 2024 2025 2026 2027 2028 2029 2030 2031 2032 2033 2034For the Plan Year Beginning
Projected Payout Ratio (Projected Benefit Payments/Projected Market Value of Assets)

Asset/Liability Study County Employees Retirement System Hazardous Pension Plan
13
Deterministic Analysis (continued) Benefit Payments/Contributions The Plan’s projected benefit payments divided by projected contributions are shown in the chart below. The results assume the contribution policy remains unchanged, and that the Plan’s assets return precisely the actuarially assumed rate each year without exception for all projection years.
148%
155%
163% 165%168%
172% 173% 174% 174% 175% 175% 175% 174% 174% 173%171%
168%165%
161%158%
154%
135%
140%
145%
150%
155%
160%
165%
170%
175%
180%
2014 2015 2016 2017 2018 2019 2020 2021 2022 2023 2024 2025 2026 2027 2028 2029 2030 2031 2032 2033 2034For the Plan Year Beginning
Projected Benefit Payments/Projected Contributions
Asset/Liability Study County Employees Retirement System Hazardous Pension Plan
14
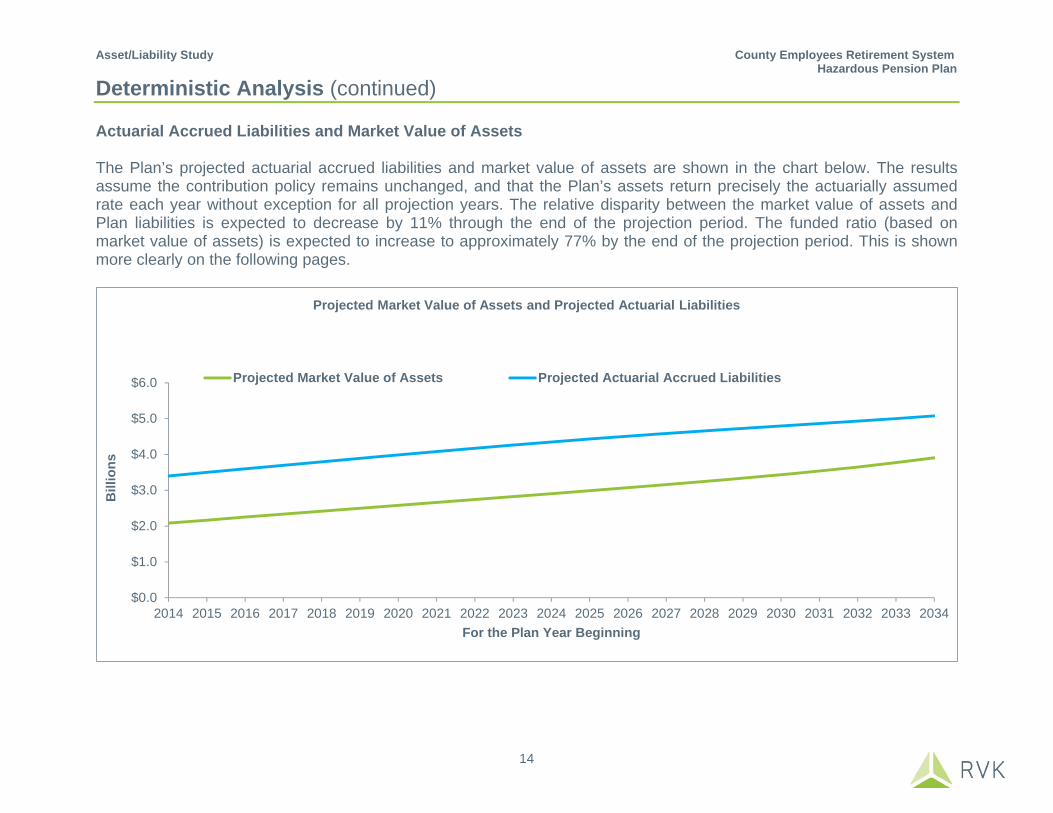
Deterministic Analysis (continued) Actuarial Accrued Liabilities and Market Value of Assets The Plan’s projected actuarial accrued liabilities and market value of assets are shown in the chart below. The results assume the contribution policy remains unchanged, and that the Plan’s assets return precisely the actuarially assumed rate each year without exception for all projection years. The relative disparity between the market value of assets and Plan liabilities is expected to decrease by 11% through the end of the projection period. The funded ratio (based on market value of assets) is expected to increase to approximately 77% by the end of the projection period. This is shown more clearly on the following pages.
$0.0
$1.0
$2.0
$3.0
$4.0
$5.0
$6.0
2014 2015 2016 2017 2018 2019 2020 2021 2022 2023 2024 2025 2026 2027 2028 2029 2030 2031 2032 2033 2034
Bill
ions
For the Plan Year Beginning
Projected Market Value of Assets and Projected Actuarial Liabilities
Projected Market Value of Assets Projected Actuarial Accrued Liabilities

Asset/Liability Study County Employees Retirement System Hazardous Pension Plan
15
Deterministic Analysis (continued) Deficit (market value of assets – actuarial accrued liabilities) The Plan’s projected deficit of assets is shown in the chart below. The results assume the contribution policy remains unchanged, and that the Plan’s assets return precisely the actuarially assumed rate each year without exception for all projection years. The disparity between the market value of assets and Plan liabilities is expected to decrease by the end of the projection period by 11%.
$0.0
$0.2
$0.4
$0.6
$0.8
$1.0
$1.2
$1.4
$1.6
2014 2015 2016 2017 2018 2019 2020 2021 2022 2023 2024 2025 2026 2027 2028 2029 2030 2031 2032 2033 2034
Blli
ons
For the Plan Year Beginning
Projected Deficit

Asset/Liability Study County Employees Retirement System Hazardous Pension Plan
16
Deterministic Analysis (continued) Actuarial Funded Ratio (actuarial value of assets/actuarial accrued liability) The Plan’s projected actuarial funded ratio is shown in the chart below. The Plan is expected to end the projection period at approximately 77% funded. The results assume the contribution policy remains unchanged, and that the Plan’s assets return precisely the actuarially assumed rate each year without exception for all projection years.
60% 60% 61% 62% 64% 64% 65% 65% 66% 66% 67% 67% 68% 69% 70% 71% 72% 73% 74% 75% 77%
0%
10%
20%
30%
40%
50%
60%
70%
80%
90%
2014 2015 2016 2017 2018 2019 2020 2021 2022 2023 2024 2025 2026 2027 2028 2029 2030 2031 2032 2033 2034For the Plan Year Beginning
Projected Actuarial Funded Ratio

Asset/Liability Study County Employees Retirement System Hazardous Pension Plan
17
Deterministic Analysis (continued) Market Funded Ratio (market value of assets/actuarial accrued liability) The Plan’s projected market funded ratio is shown in the chart below. The Plan is expected to end the projection period at approximately 77% funded. The results assume the contribution policy remains unchanged, and that the Plan’s assets return precisely the actuarially assumed rate each year without exception for all projection years.
63% 62% 63% 63% 64% 64% 65% 65% 66% 66% 67% 67% 68% 69% 70% 71% 72% 73% 74% 75% 77%
0%
10%
20%
30%
40%
50%
60%
70%
80%
90%
2014 2015 2016 2017 2018 2019 2020 2021 2022 2023 2024 2025 2026 2027 2028 2029 2030 2031 2032 2033 2034For the Plan Year Beginning
Projected Market Funded Ratio
Asset/Liability Study County Employees Retirement System Hazardous Pension Plan
18
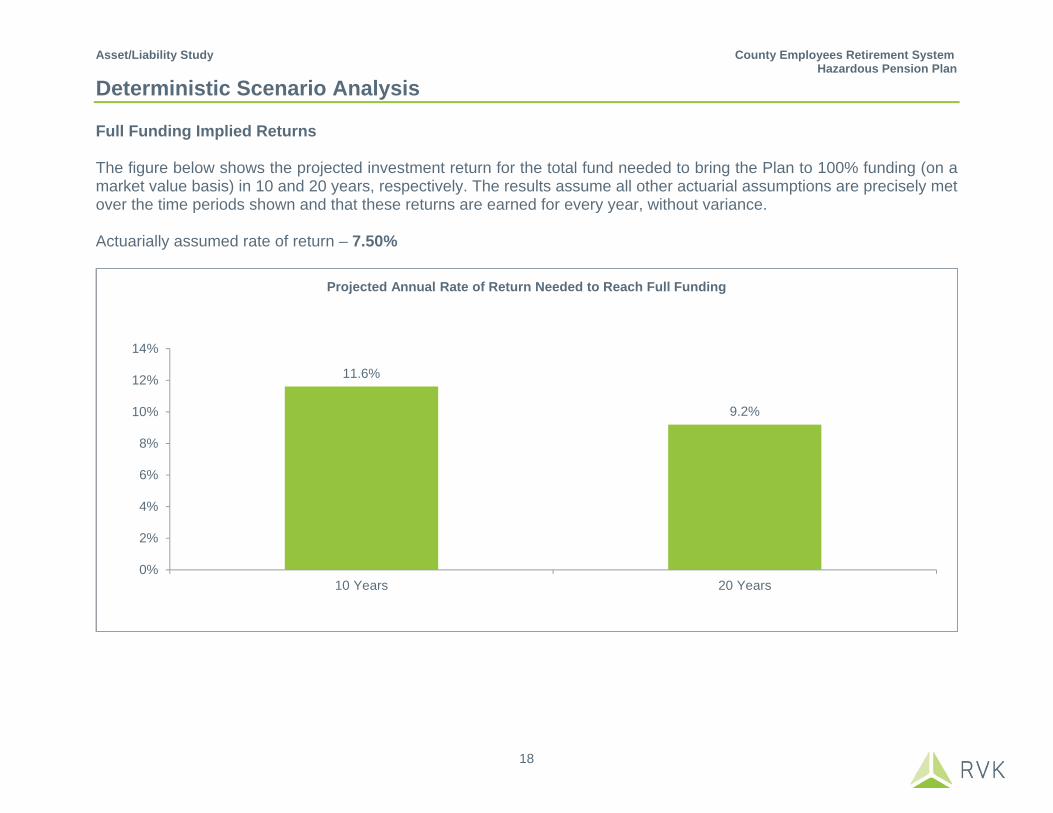
Deterministic Scenario Analysis Full Funding Implied Returns The figure below shows the projected investment return for the total fund needed to bring the Plan to 100% funding (on a market value basis) in 10 and 20 years, respectively. The results assume all other actuarial assumptions are precisely met over the time periods shown and that these returns are earned for every year, without variance. Actuarially assumed rate of return – 7.50%
11.6%
9.2%
0%
2%
4%
6%
8%
10%
12%
14%
10 Years 20 Years
Projected Annual Rate of Return Needed to Reach Full Funding
Asset/Liability Study County Employees Retirement System Hazardous Pension Plan
19
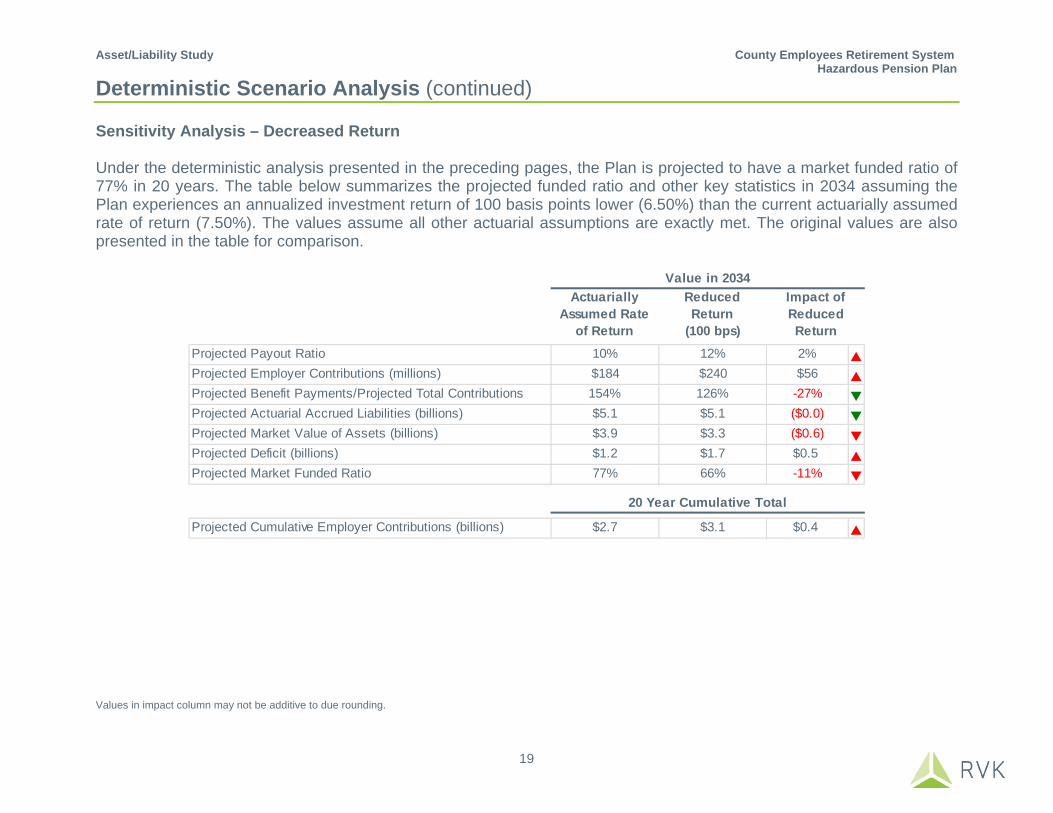
Deterministic Scenario Analysis (continued) Sensitivity Analysis – Decreased Return Under the deterministic analysis presented in the preceding pages, the Plan is projected to have a market funded ratio of 77% in 20 years. The table below summarizes the projected funded ratio and other key statistics in 2034 assuming the Plan experiences an annualized investment return of 100 basis points lower (6.50%) than the current actuarially assumed rate of return (7.50%). The values assume all other actuarial assumptions are exactly met. The original values are also presented in the table for comparison.
Values in impact column may not be additive to due rounding.
Actuarially Assumed Rate
of Return
ReducedReturn
(100 bps)Projected Payout Ratio 10% 12% 2% Projected Employer Contributions (millions) $184 $240 $56 Projected Benefit Payments/Projected Total Contributions 154% 126% -27% Projected Actuarial Accrued Liabilities (billions) $5.1 $5.1 ($0.0) Projected Market Value of Assets (billions) $3.9 $3.3 ($0.6) Projected Deficit (billions) $1.2 $1.7 $0.5 Projected Market Funded Ratio 77% 66% -11%
Projected Cumulative Employer Contributions (billions) $2.7 $3.1 $0.4
20 Year Cumulative Total
Value in 2034Impact of Reduced Return
Asset/Liability Study County Employees Retirement System Hazardous Pension Plan
20
Stochastic Analysis In the previous section of this report, we assumed the Plan operated going forward with certain knowledge of the future investment returns earned by the Plan’s assets. This section introduces the element of uncertainty in those future investment returns. This part of the analysis examines Plan assets and liabilities under many capital market environments based on expected future asset returns and inflation, and their expected volatility. Using a Monte Carlo simulation technique, both assets and liabilities are assumed to vary stochastically, linked together by changes in inflation. Using the current expected values and variances of the returns and inflation, along with their correlations, 2,000 trials are generated to produce a distribution of results. A stochastic analysis can answer questions about the best/worst case outcomes along with the probability of such outcomes. This is contrasted with the deterministic analysis that provides an expected value if all current Plan assumptions are exactly met.
Asset/Liability Study County Employees Retirement System Hazardous Pension Plan
21
Asset ClassArithmetic
Return Assumption
Standard Deviation
Assumption
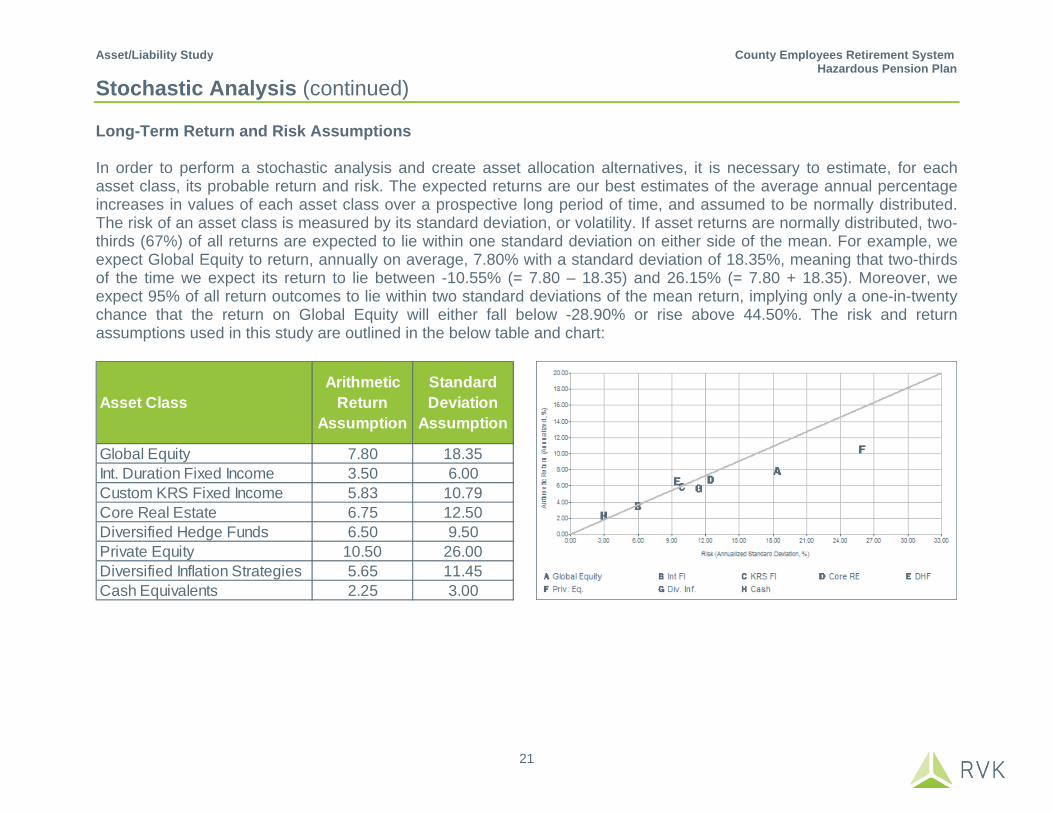
Global Equity 7.80 18.35Int. Duration Fixed Income 3.50 6.00Custom KRS Fixed Income 5.83 10.79Core Real Estate 6.75 12.50Diversified Hedge Funds 6.50 9.50Private Equity 10.50 26.00Diversified Inflation Strategies 5.65 11.45Cash Equivalents 2.25 3.00
Stochastic Analysis (continued) Long-Term Return and Risk Assumptions In order to perform a stochastic analysis and create asset allocation alternatives, it is necessary to estimate, for each asset class, its probable return and risk. The expected returns are our best estimates of the average annual percentage increases in values of each asset class over a prospective long period of time, and assumed to be normally distributed. The risk of an asset class is measured by its standard deviation, or volatility. If asset returns are normally distributed, two-thirds (67%) of all returns are expected to lie within one standard deviation on either side of the mean. For example, we expect Global Equity to return, annually on average, 7.80% with a standard deviation of 18.35%, meaning that two-thirds of the time we expect its return to lie between -10.55% (= 7.80 – 18.35) and 26.15% (= 7.80 + 18.35). Moreover, we expect 95% of all return outcomes to lie within two standard deviations of the mean return, implying only a one-in-twenty chance that the return on Global Equity will either fall below -28.90% or rise above 44.50%. The risk and return assumptions used in this study are outlined in the below table and chart:

Asset/Liability Study County Employees Retirement System Hazardous Pension Plan
22
Stochastic Analysis (continued) Correlation Between Asset Classes Creating a diversified portfolio of asset classes enables the investor to achieve a high rate of return while minimizing volatility of the portfolio. As defined on the previous page, volatility is “risk” or standard deviation. By minimizing the volatility of a portfolio, we produce asset returns that vary less from year to year. Diversification exists because the returns of different asset classes do not always move in the same direction, at the same time, or with the same magnitude. Correlation values are between 1.00 and –1.00. If returns of two asset classes rise or fall at the same time and in the same magnitude, they have a correlation value of 1.00. Conversely, two asset classes that simultaneously move in opposite directions, and in the same magnitude, have a correlation value of –1.00. A correlation of zero indicates no relationship between returns. The assumed correlations are largely based on historical index data, with some qualitative analysis applied. For instance, where appropriate, we have weighted current history more heavily. The correlation matrix used in this study is shown below:
The fact that the correlations shown in the table are nearly all positive does not imply that these asset classes do not diversify one another. Their correlations are significantly less than 1.00, meaning we expect a measurable number of instances when the underperformance of one or more of the asset classes will be offset by the outperformance of others. This point is demonstrated on the following pages, which illustrate that diversification into less correlated asset classes can decrease the expected overall volatility of a portfolio.

Asset/Liability Study County Employees Retirement System Hazardous Pension Plan
23
Stochastic Analysis (continued) Efficient Portfolios Each frontier portfolio (optimal allocation) is created using target rates of return both above and below the projected rate of return for the current allocation. This range illustrates the trade-off between return and risk; additional return can only be achieved by undertaking additional risk. The table below shows the possible optimal allocations given the selected asset classes and their constraints listed under “Min” and “Max.” The table shows the Current Target allocation and highlights three potential targets (Potential Portfolios 1, 2, and 3) for consideration throughout this study. Two illustrative portfolios (Conservative and Aggressive Portfolios) are also shown for demonstrative purposes.

Asset/Liability Study County Employees Retirement System Hazardous Pension Plan
24
Stochastic Analysis (continued) Efficient Frontier The risk of each alternative allocation is plotted against the horizontal axis, while the return is measured on the vertical axis. The line connecting the points represents all the optimal portfolios subject to the given constraints and is known as the “efficient frontier.” The upward slope of the efficient frontier indicates the direct relationship between return and risk.
Efficient Frontier
Asset/Liability Study County Employees Retirement System Hazardous Pension Plan
25
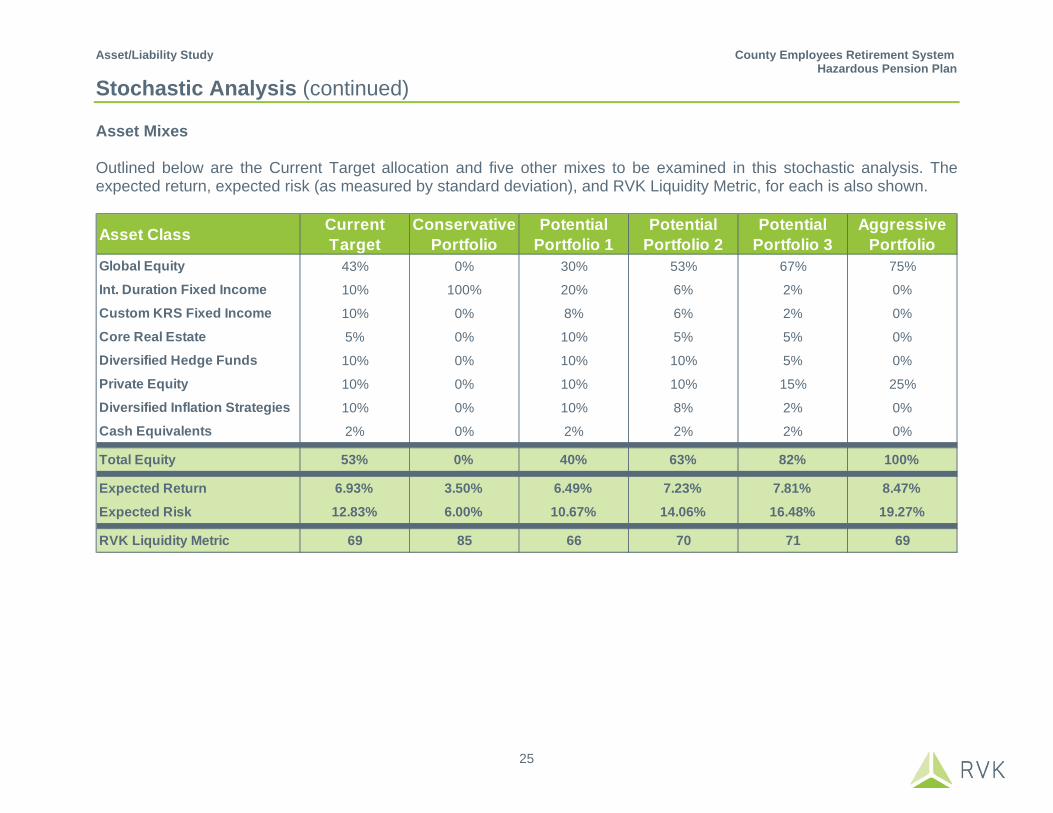
Stochastic Analysis (continued) Asset Mixes Outlined below are the Current Target allocation and five other mixes to be examined in this stochastic analysis. The expected return, expected risk (as measured by standard deviation), and RVK Liquidity Metric, for each is also shown.
Asset Class Current Target
Conservative Portfolio
Potential Portfolio 1
Potential Portfolio 2
Potential Portfolio 3
Aggressive Portfolio
Global Equity 43% 0% 30% 53% 67% 75%
Int. Duration Fixed Income 10% 100% 20% 6% 2% 0%
Custom KRS Fixed Income 10% 0% 8% 6% 2% 0%
Core Real Estate 5% 0% 10% 5% 5% 0%
Diversified Hedge Funds 10% 0% 10% 10% 5% 0%
Private Equity 10% 0% 10% 10% 15% 25%
Diversified Inflation Strategies 10% 0% 10% 8% 2% 0%
Cash Equivalents 2% 0% 2% 2% 2% 0%
Total Equity 53% 0% 40% 63% 82% 100%
Expected Return 6.93% 3.50% 6.49% 7.23% 7.81% 8.47%
Expected Risk 12.83% 6.00% 10.67% 14.06% 16.48% 19.27%
RVK Liquidity Metric 69 85 66 70 71 69

Asset/Liability Study County Employees Retirement System Hazardous Pension Plan
26
95th Percentile
75th Percentile
Median
25th Percentile
5th Percentile
0%
20%
40%
60%
80%
100%
120%
CurrentTarget
ConservativePortfolio
PotentialPortfolio 1
PotentialPortfolio 2
PotentialPortfolio 3
AggressivePortfolio
Projected Actuarial Funded Ratio September 30, 2019
Unfunded Liability (Mil)
Funded Ratio
Unfunded Liability
Funded Ratio
Unfunded Liability (Mil)
Funded Ratio
Unfunded Liability (Mil)
Funded Ratio
Unfunded Liability (Mil)
Funded Ratio
Unfunded Liability (Mil)
Funded Ratio
5th Percentile $2,186 43% $2,026 47% $2,103 45% $2,237 42% $2,320 40% $2,412 37%25th Percentile $1,826 53% $1,843 52% $1,809 54% $1,839 53% $1,874 52% $1,912 51%Median $1,528 61% $1,720 56% $1,551 60% $1,508 61% $1,490 62% $1,452 63%75th Percentile $1,177 70% $1,579 59% $1,265 68% $1,118 71% $1,016 74% $894 77%95th Percentile $558 86% $1,378 65% $784 80% $424 89% $160 96% ($183) 105%
Current Target Potential Portfolio 1 Potential Portfolio 2Conservative Portfolio Aggressive PortfolioPotential Portfolio 3
Stochastic Analysis (continued) Projected Actuarial Funded Ratio (actuarial value of assets/actuarial accrued liability); 5 Years The graph below shows the distribution of possible actuarial funded ratios five years from now, assuming the six different asset mixes highlighted on the prior pages. The results assume the current contribution policy remains unchanged for all projection years.
Asset/Liability Study County Employees Retirement System Hazardous Pension Plan
27
95th Percentile
75th Percentile
Median
25th Percentile
5th Percentile
0%
20%
40%
60%
80%
100%
120%
140%
CurrentTarget
ConservativePortfolio
PotentialPortfolio 1
PotentialPortfolio 2
PotentialPortfolio 3
AggressivePortfolio
Projected Market Funded Ratio September 30, 2019
Unfunded Liability (Mil)
Funded Ratio
Unfunded Liability
Funded Ratio
Unfunded Liability (Mil)
Funded Ratio
Unfunded Liability (Mil)
Funded Ratio
Unfunded Liability (Mil)
Funded Ratio
Unfunded Liability (Mil)
Funded Ratio
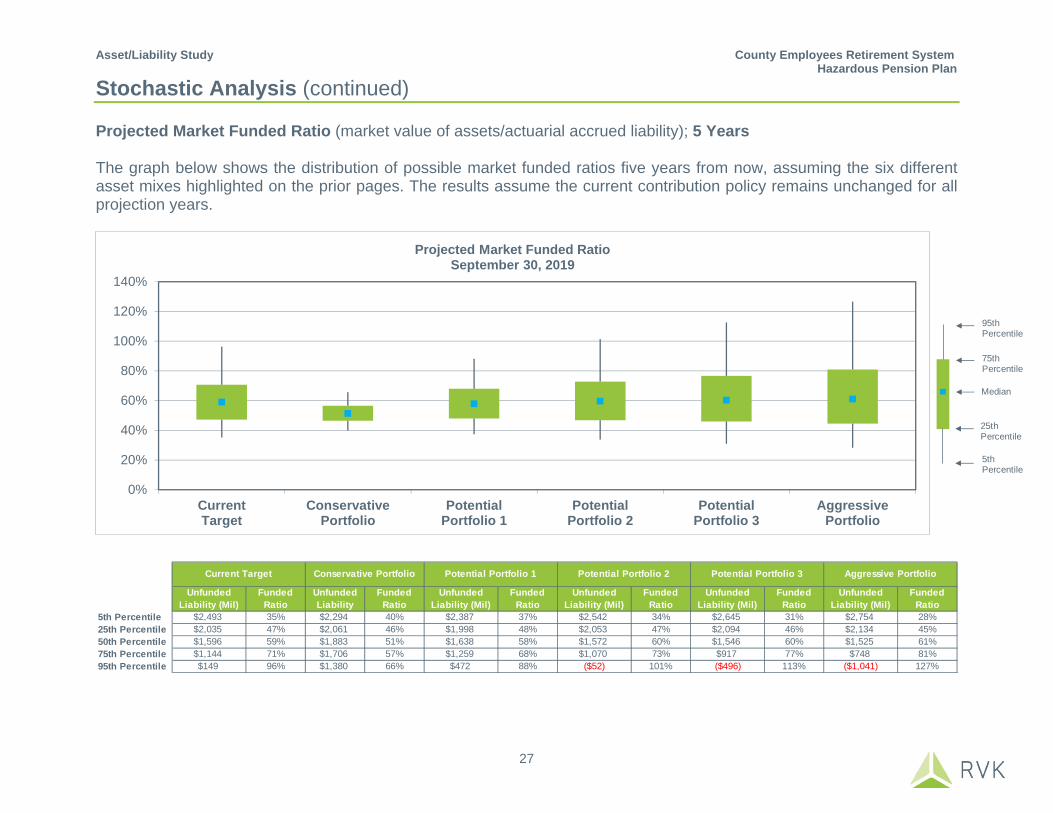
5th Percentile $2,493 35% $2,294 40% $2,387 37% $2,542 34% $2,645 31% $2,754 28%25th Percentile $2,035 47% $2,061 46% $1,998 48% $2,053 47% $2,094 46% $2,134 45%50th Percentile $1,596 59% $1,883 51% $1,638 58% $1,572 60% $1,546 60% $1,525 61%75th Percentile $1,144 71% $1,706 57% $1,259 68% $1,070 73% $917 77% $748 81%95th Percentile $149 96% $1,380 66% $472 88% ($52) 101% ($496) 113% ($1,041) 127%
Current Target Potential Portfolio 1 Potential Portfolio 2Conservative Portfolio Aggressive PortfolioPotential Portfolio 3
Stochastic Analysis (continued) Projected Market Funded Ratio (market value of assets/actuarial accrued liability); 5 Years The graph below shows the distribution of possible market funded ratios five years from now, assuming the six different asset mixes highlighted on the prior pages. The results assume the current contribution policy remains unchanged for all projection years.

Asset/Liability Study County Employees Retirement System Hazardous Pension Plan
28
95th Percentile
75th Percentile
Median
25th Percentile
5th Percentile
0%
25%
50%
75%
100%
125%
150%
175%
CurrentTarget
ConservativePortfolio
PotentialPortfolio 1
PotentialPortfolio 2
PotentialPortfolio 3
AggressivePortfolio
Projected Actuarial Funded Ratio September 30, 2024
Unfunded Liability (Mil)
Funded Ratio
Unfunded Liability
Funded Ratio
Unfunded Liability (Mil)
Funded Ratio
Unfunded Liability (Mil)
Funded Ratio
Unfunded Liability (Mil)
Funded Ratio
Unfunded Liability (Mil)
Funded Ratio
5th Percentile $2,929 31% $2,784 33% $2,834 33% $2,979 29% $3,084 27% $3,178 25%25th Percentile $2,341 45% $2,515 41% $2,328 46% $2,343 45% $2,380 44% $2,426 43%Median $1,814 58% $2,291 47% $1,891 57% $1,775 59% $1,693 61% $1,605 63%75th Percentile $1,133 74% $2,055 54% $1,313 70% $1,017 77% $792 82% $468 89%95th Percentile ($356) 108% $1,585 65% $192 96% ($687) 116% ($1,390) 131% ($2,328) 154%
Conservative PortfolioCurrent Target Aggressive PortfolioPotential Portfolio 3Potential Portfolio 1 Potential Portfolio 2
Stochastic Analysis (continued) Projected Actuarial Funded Ratio (actuarial value of assets/actuarial accrued liability); 10 Years The graph below shows the distribution of possible actuarial funded ratios ten years from now, assuming the six different asset mixes highlighted on the prior pages. The results assume the current contribution policy remains unchanged for all projection years.

Asset/Liability Study County Employees Retirement System Hazardous Pension Plan
29
95th Percentile
75th Percentile
Median
25th Percentile
5th Percentile
0%
20%
40%
60%
80%
100%
120%
140%
160%
180%
CurrentTarget
ConservativePortfolio
PotentialPortfolio 1
PotentialPortfolio 2
PotentialPortfolio 3
AggressivePortfolio
Projected Market Funded Ratio September 30, 2024
Unfunded Liability (Mil)
Funded Ratio
Unfunded Liability
Funded Ratio
Unfunded Liability (Mil)
Funded Ratio
Unfunded Liability (Mil)
Funded Ratio
Unfunded Liability (Mil)
Funded Ratio
Unfunded Liability (Mil)
Funded Ratio
5th Percentile $3,081 26% $2,950 29% $2,994 28% $3,151 25% $3,252 23% $3,345 21%25th Percentile $2,493 42% $2,692 37% $2,470 42% $2,509 42% $2,557 41% $2,578 40%50th Percentile $1,906 56% $2,460 43% $1,972 55% $1,867 57% $1,782 59% $1,686 61%75th Percentile $1,119 75% $2,186 51% $1,351 70% $977 78% $693 84% $345 92%95th Percentile ($537) 112% $1,674 64% ($20) 100% ($945) 121% ($1,871) 141% ($2,979) 167%
Conservative PortfolioCurrent Target Aggressive PortfolioPotential Portfolio 3Potential Portfolio 1 Potential Portfolio 2
Stochastic Analysis (continued) Projected Market Funded Ratio (market value of assets/actuarial accrued liability); 10 Years The graph below shows the distribution of possible market funded ratios ten years from now, assuming the six different asset mixes highlighted on the prior pages. The results assume the current contribution policy remains unchanged for all projection years.

Asset/Liability Study County Employees Retirement System Hazardous Pension Plan
30
95th Percentile
75th Percentile
Median
25th Percentile
5th Percentile
0%
50%
100%
150%
200%
250%
300%
CurrentTarget
ConservativePortfolio
PotentialPortfolio 1
PotentialPortfolio 2
PotentialPortfolio 3
AggressivePortfolio
Projected Actuarial Funded Ratio September 30, 2034
Unfunded Liability (Mil)
Funded Ratio
Unfunded Liability
Funded Ratio
Unfunded Liability (Mil)
Funded Ratio
Unfunded Liability (Mil)
Funded Ratio
Unfunded Liability (Mil)
Funded Ratio
Unfunded Liability (Mil)
Funded Ratio
5th Percentile $3,161 32% $3,145 31% $3,083 33% $3,192 31% $3,262 30% $3,337 29%25th Percentile $2,560 47% $2,894 40% $2,562 47% $2,556 47% $2,560 47% $2,569 47%Median $1,866 63% $2,683 46% $1,990 60% $1,794 64% $1,680 66% $1,533 70%75th Percentile $831 84% $2,417 53% $1,202 76% $631 88% $45 99% ($705) 114%95th Percentile ($2,110) 138% $1,871 67% ($790) 114% ($2,968) 156% ($5,218) 202% ($8,850) 261%
Aggressive PortfolioPotential Portfolio 3Current Target Potential Portfolio 1 Potential Portfolio 2Conservative Portfolio
Stochastic Analysis (continued) Projected Actuarial Funded Ratio (actuarial value of assets/actuarial accrued liability); 20 Years The graph below shows the distribution of possible actuarial funded ratios twenty years from now, assuming the six different asset mixes highlighted on the prior pages. The results assume the current contribution policy remains unchanged for all projection years.

Asset/Liability Study County Employees Retirement System Hazardous Pension Plan
31
95th Percentile
75th Percentile
Median
25th Percentile
5th Percentile
0%
50%
100%
150%
200%
250%
300%
CurrentTarget
ConservativePortfolio
PotentialPortfolio 1
PotentialPortfolio 2
PotentialPortfolio 3
AggressivePortfolio
Projected Market Funded Ratio September 30, 2034
Unfunded Liability (Mil)
Funded Ratio
Unfunded Liability
Funded Ratio
Unfunded Liability (Mil)
Funded Ratio
Unfunded Liability (Mil)
Funded Ratio
Unfunded Liability (Mil)
Funded Ratio
Unfunded Liability (Mil)
Funded Ratio
5th Percentile $3,333 28% $3,327 27% $3,242 29% $3,371 27% $3,469 26% $3,557 25%25th Percentile $2,715 44% $3,072 36% $2,703 44% $2,708 44% $2,701 44% $2,705 44%50th Percentile $1,951 60% $2,859 43% $2,096 58% $1,868 62% $1,731 66% $1,519 69%75th Percentile $900 82% $2,578 50% $1,264 76% $627 88% $15 100% ($848) 116%95th Percentile ($2,273) 142% $2,036 63% ($977) 118% ($3,216) 161% ($5,413) 199% ($8,931) 271%
Aggressive PortfolioPotential Portfolio 3Current Target Potential Portfolio 1 Potential Portfolio 2Conservative Portfolio
Stochastic Analysis (continued) Projected Market Funded Ratio (market value of assets/actuarial accrued liability); 20 Years The graph below shows the distribution of possible market funded ratios twenty years from now, assuming the six different asset mixes highlighted on the prior pages. The results assume the current contribution policy remains unchanged for all projection years.
Asset/Liability Study County Employees Retirement System Hazardous Pension Plan
32
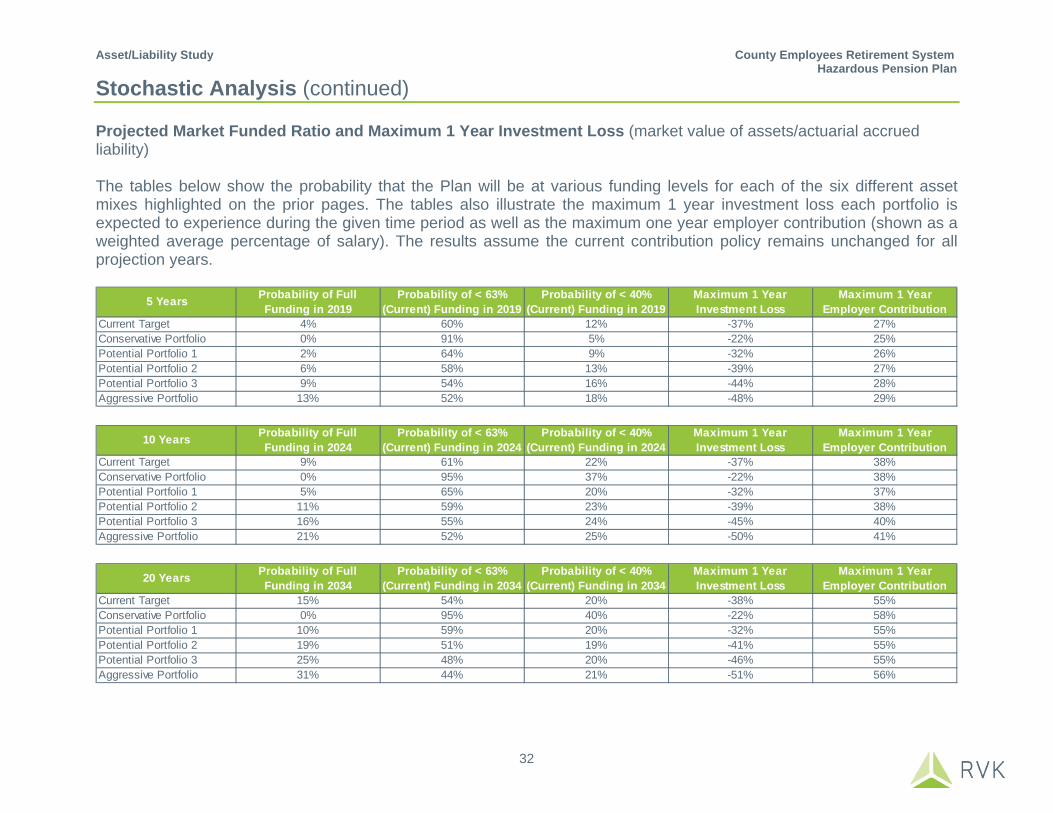
Stochastic Analysis (continued) Projected Market Funded Ratio and Maximum 1 Year Investment Loss (market value of assets/actuarial accrued liability) The tables below show the probability that the Plan will be at various funding levels for each of the six different asset mixes highlighted on the prior pages. The tables also illustrate the maximum 1 year investment loss each portfolio is expected to experience during the given time period as well as the maximum one year employer contribution (shown as a weighted average percentage of salary). The results assume the current contribution policy remains unchanged for all projection years.
Current Target 4% 60% 12% -37% 27%Conservative Portfolio 0% 91% 5% -22% 25%Potential Portfolio 1 2% 64% 9% -32% 26%Potential Portfolio 2 6% 58% 13% -39% 27%Potential Portfolio 3 9% 54% 16% -44% 28%Aggressive Portfolio 13% 52% 18% -48% 29%
Maximum 1 YearEmployer Contribution5 Years Probability of Full
Funding in 2019Probability of < 63%
(Current) Funding in 2019Maximum 1 Year Investment Loss
Probability of < 40% (Current) Funding in 2019
Current Target 9% 61% 22% -37% 38%Conservative Portfolio 0% 95% 37% -22% 38%Potential Portfolio 1 5% 65% 20% -32% 37%Potential Portfolio 2 11% 59% 23% -39% 38%Potential Portfolio 3 16% 55% 24% -45% 40%Aggressive Portfolio 21% 52% 25% -50% 41%
Maximum 1 YearEmployer Contribution
Maximum 1 Year Investment Loss10 Years Probability of Full
Funding in 2024Probability of < 63%
(Current) Funding in 2024Probability of < 40%
(Current) Funding in 2024
Current Target 15% 54% 20% -38% 55%Conservative Portfolio 0% 95% 40% -22% 58%Potential Portfolio 1 10% 59% 20% -32% 55%Potential Portfolio 2 19% 51% 19% -41% 55%Potential Portfolio 3 25% 48% 20% -46% 55%Aggressive Portfolio 31% 44% 21% -51% 56%
Maximum 1 YearEmployer Contribution
Probability of < 63% (Current) Funding in 2034
Probability of FullFunding in 203420 Years Maximum 1 Year
Investment LossProbability of < 40%
(Current) Funding in 2034
Asset/Liability Study County Employees Retirement System Hazardous Pension Plan
33
5th Percentile
25th Percentile
Median
75th Percentile
95th Percentile
0%
5%
10%
15%
20%
25%
30%
35%
40%
45%
2013 2014 2015 2016 2017 2018 2019 2020 2021 2022 2023 2024 2025 2026 2027 2028 2029 2030 2031 2032 2033For the Plan Year Beginning
Projected Payout Ratio Current Target
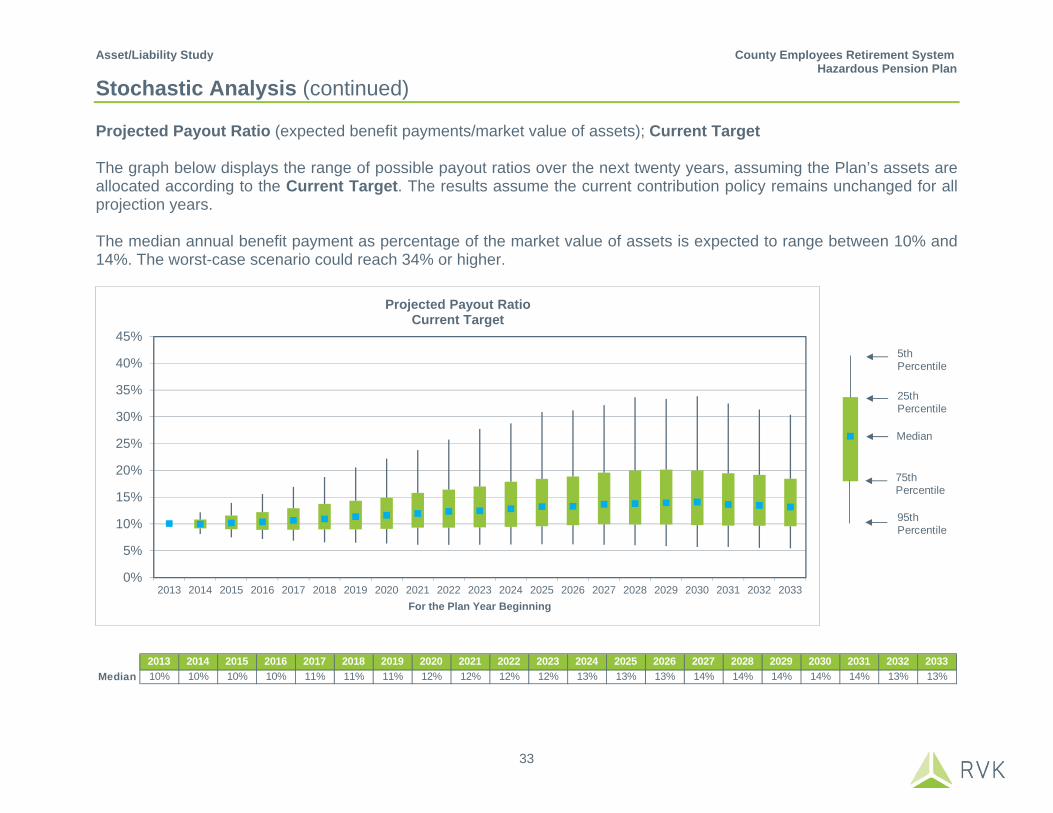
2013 2014 2015 2016 2017 2018 2019 2020 2021 2022 2023 2024 2025 2026 2027 2028 2029 2030 2031 2032 2033Median 10% 10% 10% 10% 11% 11% 11% 12% 12% 12% 12% 13% 13% 13% 14% 14% 14% 14% 14% 13% 13%
Stochastic Analysis (continued) Projected Payout Ratio (expected benefit payments/market value of assets); Current Target The graph below displays the range of possible payout ratios over the next twenty years, assuming the Plan’s assets are allocated according to the Current Target. The results assume the current contribution policy remains unchanged for all projection years. The median annual benefit payment as percentage of the market value of assets is expected to range between 10% and 14%. The worst-case scenario could reach 34% or higher.
Asset/Liability Study County Employees Retirement System Hazardous Pension Plan
34
5th Percentile
25th Percentile
Median
75th Percentile
95th Percentile
0%
5%
10%
15%
20%
25%
30%
35%
40%
45%
2013 2014 2015 2016 2017 2018 2019 2020 2021 2022 2023 2024 2025 2026 2027 2028 2029 2030 2031 2032 2033For the Plan Year Beginning
Projected Payout Ratio Conservative Portfolio
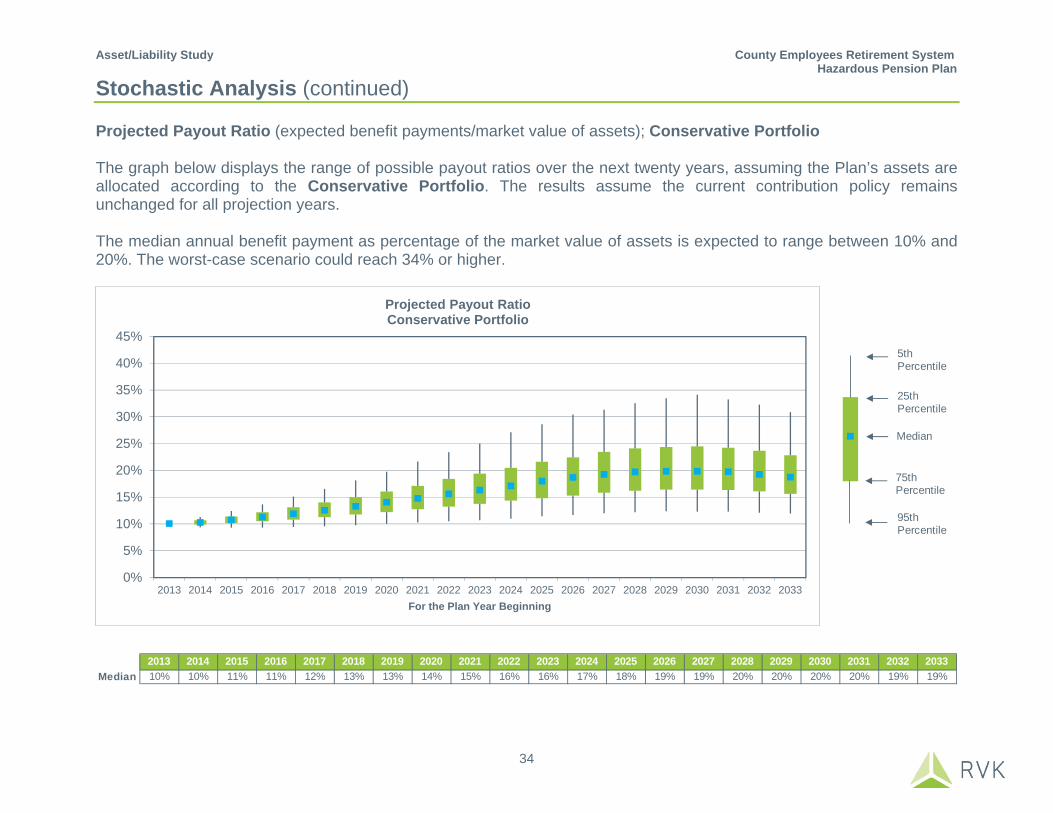
2013 2014 2015 2016 2017 2018 2019 2020 2021 2022 2023 2024 2025 2026 2027 2028 2029 2030 2031 2032 2033Median 10% 10% 11% 11% 12% 13% 13% 14% 15% 16% 16% 17% 18% 19% 19% 20% 20% 20% 20% 19% 19%
Stochastic Analysis (continued) Projected Payout Ratio (expected benefit payments/market value of assets); Conservative Portfolio The graph below displays the range of possible payout ratios over the next twenty years, assuming the Plan’s assets are allocated according to the Conservative Portfolio. The results assume the current contribution policy remains unchanged for all projection years. The median annual benefit payment as percentage of the market value of assets is expected to range between 10% and 20%. The worst-case scenario could reach 34% or higher.
Asset/Liability Study County Employees Retirement System Hazardous Pension Plan
35
5th Percentile
25th Percentile
Median
75th Percentile
95th Percentile
0%
5%
10%
15%
20%
25%
30%
35%
40%
45%
2013 2014 2015 2016 2017 2018 2019 2020 2021 2022 2023 2024 2025 2026 2027 2028 2029 2030 2031 2032 2033For the Plan Year Beginning
Projected Payout Ratio Potential Portfolio 1
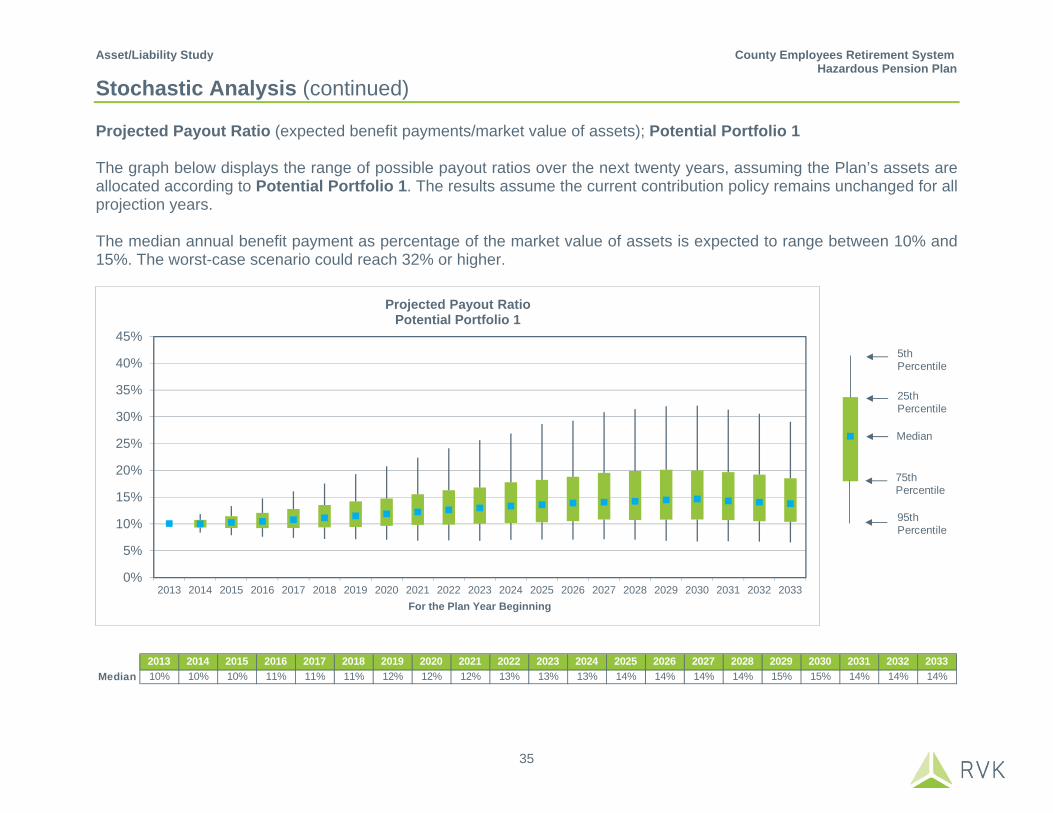
2013 2014 2015 2016 2017 2018 2019 2020 2021 2022 2023 2024 2025 2026 2027 2028 2029 2030 2031 2032 2033Median 10% 10% 10% 11% 11% 11% 12% 12% 12% 13% 13% 13% 14% 14% 14% 14% 15% 15% 14% 14% 14%
Stochastic Analysis (continued) Projected Payout Ratio (expected benefit payments/market value of assets); Potential Portfolio 1 The graph below displays the range of possible payout ratios over the next twenty years, assuming the Plan’s assets are allocated according to Potential Portfolio 1. The results assume the current contribution policy remains unchanged for all projection years. The median annual benefit payment as percentage of the market value of assets is expected to range between 10% and 15%. The worst-case scenario could reach 32% or higher.

Asset/Liability Study County Employees Retirement System Hazardous Pension Plan
36
5th Percentile
25th Percentile
Median
75th Percentile
95th Percentile
0%
5%
10%
15%
20%
25%
30%
35%
40%
45%
2013 2014 2015 2016 2017 2018 2019 2020 2021 2022 2023 2024 2025 2026 2027 2028 2029 2030 2031 2032 2033For the Plan Year Beginning
Projected Payout Ratio Potential Portfolio 2
2013 2014 2015 2016 2017 2018 2019 2020 2021 2022 2023 2024 2025 2026 2027 2028 2029 2030 2031 2032 2033Median 10% 10% 10% 10% 11% 11% 11% 12% 12% 12% 12% 13% 13% 13% 13% 14% 14% 14% 13% 13% 13%
Stochastic Analysis (continued) Projected Payout Ratio (expected benefit payments/market value of assets); Potential Portfolio 2 The graph below displays the range of possible payout ratios over the next twenty years, assuming the Plan’s assets are allocated according to Potential Portfolio 2. The results assume the current contribution policy remains unchanged for all projection years. The median annual benefit payment as percentage of the market value of assets is expected to range between 10% and 14%. The worst-case scenario could reach 35% or higher.

Asset/Liability Study County Employees Retirement System Hazardous Pension Plan
37
5th Percentile
25th Percentile
Median
75th Percentile
95th Percentile
0%
5%
10%
15%
20%
25%
30%
35%
40%
45%
2013 2014 2015 2016 2017 2018 2019 2020 2021 2022 2023 2024 2025 2026 2027 2028 2029 2030 2031 2032 2033For the Plan Year Beginning
Projected Payout Ratio Potential Portfolio 3
2013 2014 2015 2016 2017 2018 2019 2020 2021 2022 2023 2024 2025 2026 2027 2028 2029 2030 2031 2032 2033Median 10% 10% 10% 10% 10% 11% 11% 11% 11% 12% 12% 12% 12% 13% 13% 13% 13% 13% 13% 13% 12%
Stochastic Analysis (continued) Projected Payout Ratio (expected benefit payments/market value of assets); Potential Portfolio 3 The graph below displays the range of possible payout ratios over the next twenty years, assuming the Plan’s assets are allocated according to Potential Portfolio 3. The results assume the current contribution policy remains unchanged for all projection years. The median annual benefit payment as percentage of the market value of assets is expected to range between 10% and 13%. The worst-case scenario could reach 38% or higher.

Asset/Liability Study County Employees Retirement System Hazardous Pension Plan
38
5th Percentile
25th Percentile
Median
75th Percentile
95th Percentile
0%
5%
10%
15%
20%
25%
30%
35%
40%
45%
2013 2014 2015 2016 2017 2018 2019 2020 2021 2022 2023 2024 2025 2026 2027 2028 2029 2030 2031 2032 2033For the Plan Year Beginning
Projected Payout Ratio Aggressive Portfolio
2013 2014 2015 2016 2017 2018 2019 2020 2021 2022 2023 2024 2025 2026 2027 2028 2029 2030 2031 2032 2033Median 10% 10% 10% 10% 10% 10% 11% 11% 11% 11% 12% 12% 12% 12% 12% 12% 13% 13% 12% 12% 11%
Stochastic Analysis (continued) Projected Payout Ratio (expected benefit payments/market value of assets); Aggressive Portfolio The graph below displays the range of possible payout ratios over the next twenty years, assuming the Plan’s assets are allocated according to the Aggressive Portfolio. The results assume the current contribution policy remains unchanged for all projection years. The median annual benefit payment as percentage of the market value of assets is expected to range between 10% and 13%. The worst-case scenario could reach 42% or higher.

Asset/Liability Study County Employees Retirement System Hazardous Pension Plan
39
5th Percentile
25th Percentile
Median
75th Percentile
95th Percentile
$0
$1
$2
$3
$4
$5
2013 2014 2015 2016 2017 2018 2019 2020 2021 2022 2023 2024 2025 2026 2027 2028 2029 2030 2031 2032 2033
Bill
ions
For the Plan Year Beginning
Projected Cumulative Employer Contributions to Date Current Target
2013 2014 2015 2016 2017 2018 2019 2020 2021 2022 2023 2024 2025 2026 2027 2028 2029 2030 2031 2032 20335th Percentile $99 $198 $302 $414 $535 $670 $822 $994 $1,177 $1,376 $1,589 $1,818 $2,064 $2,329 $2,603 $2,897 $3,199 $3,508 $3,846 $4,219 $4,62425th Percentile $99 $198 $297 $402 $514 $635 $766 $910 $1,063 $1,231 $1,412 $1,603 $1,800 $2,011 $2,231 $2,478 $2,732 $3,009 $3,299 $3,604 $3,936Median $99 $198 $294 $395 $498 $606 $721 $843 $974 $1,109 $1,255 $1,406 $1,570 $1,744 $1,928 $2,127 $2,334 $2,550 $2,777 $3,019 $3,27875th Percentile $99 $198 $291 $386 $481 $575 $670 $767 $867 $970 $1,076 $1,189 $1,297 $1,408 $1,536 $1,671 $1,785 $1,889 $2,035 $2,212 $2,38195th Percentile $99 $198 $287 $375 $455 $524 $588 $637 $678 $710 $746 $779 $820 $853 $883 $909 $939 $966 $995 $1,020 $1,055
Stochastic Analysis (continued) Cumulative Employer Contributions to Date; Current Target The graph and table below show the range of projected cumulative employer contributions over the next twenty years, assuming the Plan’s assets are allocated according to the Current Target (highlighted on the prior pages). The results assume the current contribution policy remains unchanged for all projection years.

Asset/Liability Study County Employees Retirement System Hazardous Pension Plan
40
5th Percentile
25th Percentile
Median
75th Percentile
95th Percentile
$0
$1
$2
$3
$4
$5
2013 2014 2015 2016 2017 2018 2019 2020 2021 2022 2023 2024 2025 2026 2027 2028 2029 2030 2031 2032 2033
Bill
ions
For the Plan Year Beginning
Projected Cumulative Employer Contributions to Date Conservative Portfolio
2013 2014 2015 2016 2017 2018 2019 2020 2021 2022 2023 2024 2025 2026 2027 2028 2029 2030 2031 2032 20335th Percentile $99 $198 $302 $413 $530 $658 $803 $962 $1,137 $1,329 $1,531 $1,751 $1,989 $2,246 $2,518 $2,808 $3,118 $3,450 $3,802 $4,176 $4,57825th Percentile $99 $198 $298 $403 $515 $636 $771 $916 $1,076 $1,250 $1,439 $1,643 $1,863 $2,098 $2,349 $2,618 $2,908 $3,219 $3,555 $3,910 $4,285Median $99 $198 $295 $398 $506 $621 $748 $887 $1,037 $1,199 $1,374 $1,563 $1,768 $1,990 $2,227 $2,484 $2,756 $3,047 $3,361 $3,692 $4,04675th Percentile $99 $198 $292 $392 $496 $607 $726 $855 $994 $1,146 $1,311 $1,486 $1,672 $1,873 $2,091 $2,324 $2,576 $2,852 $3,138 $3,440 $3,77795th Percentile $99 $198 $289 $384 $482 $584 $694 $809 $934 $1,067 $1,207 $1,356 $1,514 $1,680 $1,860 $2,051 $2,259 $2,493 $2,732 $2,986 $3,268
Stochastic Analysis (continued) Cumulative Employer Contributions to Date; Conservative Portfolio The graph and table below show the range of projected cumulative employer contributions over the next twenty years, assuming the Plan’s assets are allocated according to the Conservative Portfolio (highlighted on the prior pages). The results assume the current contribution policy remains unchanged for all projection years.
Asset/Liability Study County Employees Retirement System Hazardous Pension Plan
41
5th Percentile
25th Percentile
Median
75th Percentile
95th Percentile
$0
$1
$2
$3
$4
$5
2013 2014 2015 2016 2017 2018 2019 2020 2021 2022 2023 2024 2025 2026 2027 2028 2029 2030 2031 2032 2033
Bill
ions
For the Plan Year Beginning
Projected Cumulative Employer Contributions to Date Potential Portfolio 1
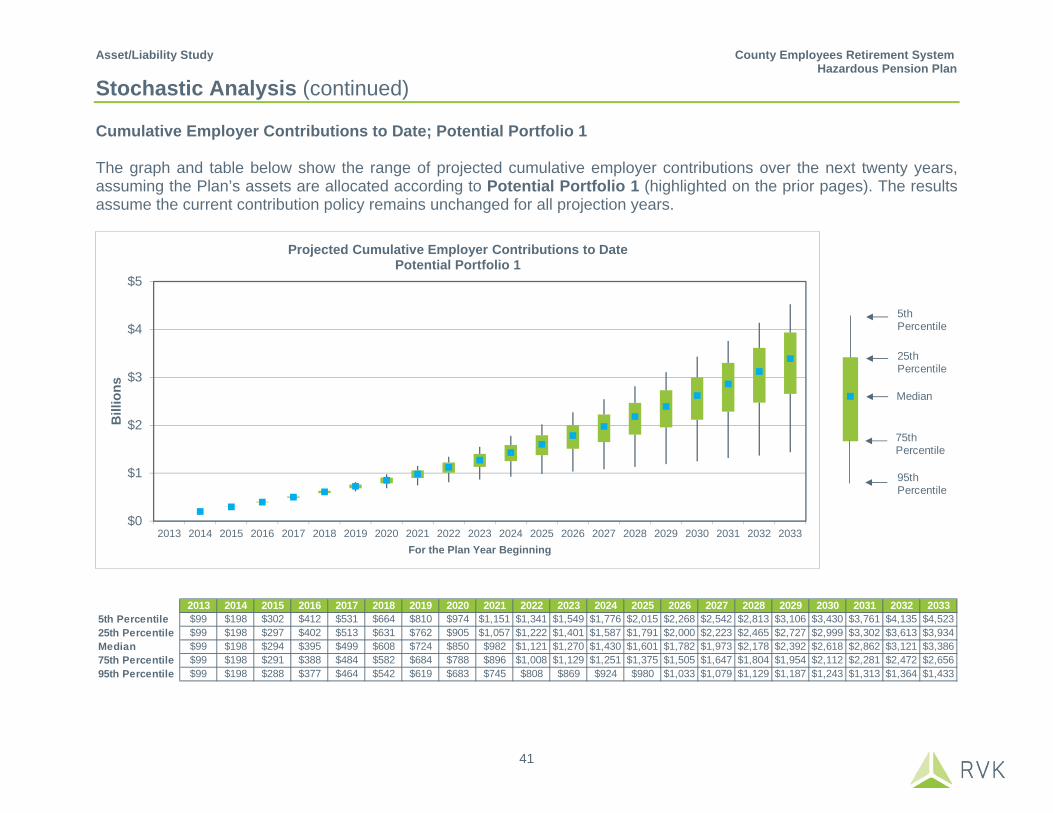
2013 2014 2015 2016 2017 2018 2019 2020 2021 2022 2023 2024 2025 2026 2027 2028 2029 2030 2031 2032 20335th Percentile $99 $198 $302 $412 $531 $664 $810 $974 $1,151 $1,341 $1,549 $1,776 $2,015 $2,268 $2,542 $2,813 $3,106 $3,430 $3,761 $4,135 $4,52325th Percentile $99 $198 $297 $402 $513 $631 $762 $905 $1,057 $1,222 $1,401 $1,587 $1,791 $2,000 $2,223 $2,465 $2,727 $2,999 $3,302 $3,613 $3,934Median $99 $198 $294 $395 $499 $608 $724 $850 $982 $1,121 $1,270 $1,430 $1,601 $1,782 $1,973 $2,178 $2,392 $2,618 $2,862 $3,121 $3,38675th Percentile $99 $198 $291 $388 $484 $582 $684 $788 $896 $1,008 $1,129 $1,251 $1,375 $1,505 $1,647 $1,804 $1,954 $2,112 $2,281 $2,472 $2,65695th Percentile $99 $198 $288 $377 $464 $542 $619 $683 $745 $808 $869 $924 $980 $1,033 $1,079 $1,129 $1,187 $1,243 $1,313 $1,364 $1,433
Stochastic Analysis (continued) Cumulative Employer Contributions to Date; Potential Portfolio 1 The graph and table below show the range of projected cumulative employer contributions over the next twenty years, assuming the Plan’s assets are allocated according to Potential Portfolio 1 (highlighted on the prior pages). The results assume the current contribution policy remains unchanged for all projection years.

Asset/Liability Study County Employees Retirement System Hazardous Pension Plan
42
5th Percentile
25th Percentile
Median
75th Percentile
95th Percentile
$0
$1
$2
$3
$4
$5
2013 2014 2015 2016 2017 2018 2019 2020 2021 2022 2023 2024 2025 2026 2027 2028 2029 2030 2031 2032 2033
Bill
ions
For the Plan Year Beginning
Projected Cumulative Employer Contributions to Date Potential Portfolio 2
2013 2014 2015 2016 2017 2018 2019 2020 2021 2022 2023 2024 2025 2026 2027 2028 2029 2030 2031 2032 20335th Percentile $99 $198 $302 $415 $538 $674 $829 $1,003 $1,190 $1,395 $1,609 $1,843 $2,095 $2,365 $2,643 $2,941 $3,238 $3,553 $3,894 $4,271 $4,67625th Percentile $99 $198 $297 $403 $516 $636 $769 $914 $1,066 $1,235 $1,415 $1,611 $1,806 $2,013 $2,240 $2,488 $2,744 $3,014 $3,299 $3,613 $3,940Median $99 $198 $294 $394 $497 $605 $719 $840 $968 $1,101 $1,244 $1,391 $1,553 $1,724 $1,901 $2,092 $2,289 $2,494 $2,725 $2,957 $3,21075th Percentile $99 $198 $291 $385 $478 $570 $662 $755 $849 $944 $1,043 $1,148 $1,253 $1,353 $1,454 $1,579 $1,678 $1,782 $1,901 $2,044 $2,19495th Percentile $99 $198 $286 $373 $449 $513 $568 $608 $636 $657 $683 $703 $735 $767 $785 $806 $846 $863 $874 $882 $904
Stochastic Analysis (continued) Cumulative Employer Contributions to Date; Potential Portfolio 2 The graph and table below show the range of projected cumulative employer contributions over the next twenty years, assuming the Plan’s assets are allocated according to Potential Portfolio 2 (highlighted on the prior pages). The results assume the current contribution policy remains unchanged for all projection years.
Asset/Liability Study County Employees Retirement System Hazardous Pension Plan
43
5th Percentile
25th Percentile
Median
75th Percentile
95th Percentile
$0
$1
$2
$3
$4
$5
2013 2014 2015 2016 2017 2018 2019 2020 2021 2022 2023 2024 2025 2026 2027 2028 2029 2030 2031 2032 2033
Bill
ions
For the Plan Year Beginning
Projected Cumulative Employer Contributions to Date Potential Portfolio 3
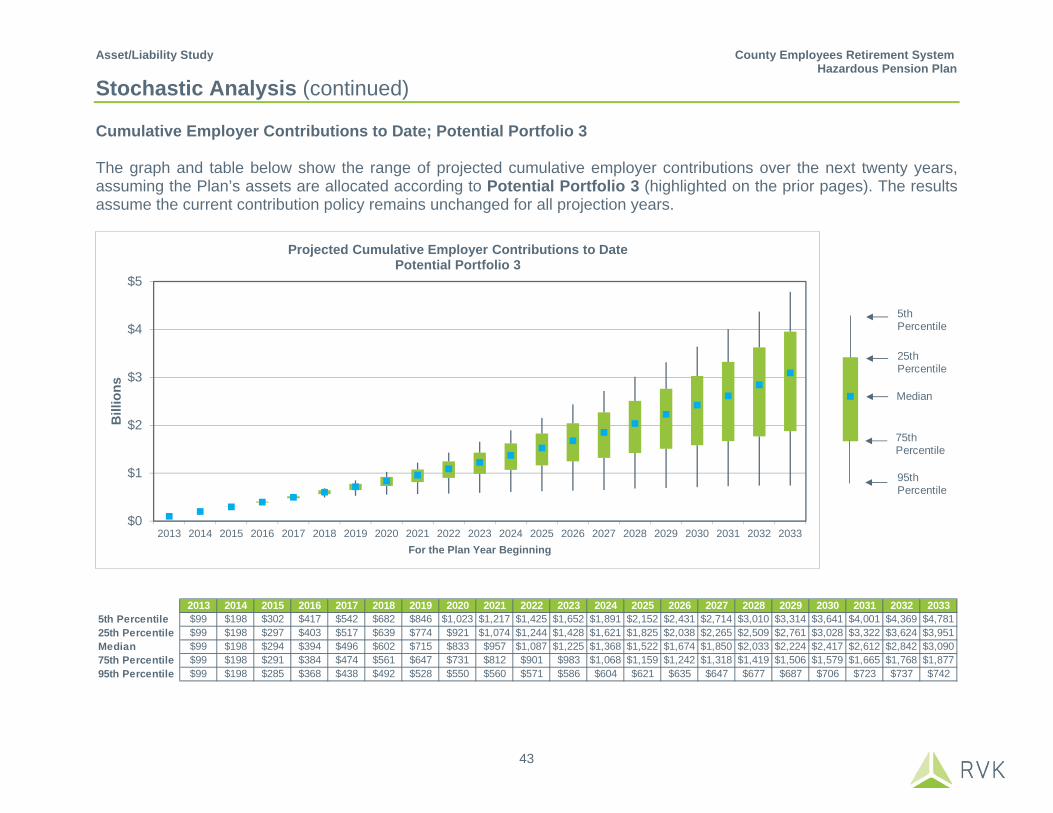
2013 2014 2015 2016 2017 2018 2019 2020 2021 2022 2023 2024 2025 2026 2027 2028 2029 2030 2031 2032 20335th Percentile $99 $198 $302 $417 $542 $682 $846 $1,023 $1,217 $1,425 $1,652 $1,891 $2,152 $2,431 $2,714 $3,010 $3,314 $3,641 $4,001 $4,369 $4,78125th Percentile $99 $198 $297 $403 $517 $639 $774 $921 $1,074 $1,244 $1,428 $1,621 $1,825 $2,038 $2,265 $2,509 $2,761 $3,028 $3,322 $3,624 $3,951Median $99 $198 $294 $394 $496 $602 $715 $833 $957 $1,087 $1,225 $1,368 $1,522 $1,674 $1,850 $2,033 $2,224 $2,417 $2,612 $2,842 $3,09075th Percentile $99 $198 $291 $384 $474 $561 $647 $731 $812 $901 $983 $1,068 $1,159 $1,242 $1,318 $1,419 $1,506 $1,579 $1,665 $1,768 $1,87795th Percentile $99 $198 $285 $368 $438 $492 $528 $550 $560 $571 $586 $604 $621 $635 $647 $677 $687 $706 $723 $737 $742
Stochastic Analysis (continued) Cumulative Employer Contributions to Date; Potential Portfolio 3 The graph and table below show the range of projected cumulative employer contributions over the next twenty years, assuming the Plan’s assets are allocated according to Potential Portfolio 3 (highlighted on the prior pages). The results assume the current contribution policy remains unchanged for all projection years.
Asset/Liability Study County Employees Retirement System Hazardous Pension Plan
44
5th Percentile
25th Percentile
Median
75th Percentile
95th Percentile
$0
$1
$2
$3
$4
$5
2013 2014 2015 2016 2017 2018 2019 2020 2021 2022 2023 2024 2025 2026 2027 2028 2029 2030 2031 2032 2033
Bill
ions
For the Plan Year Beginning
Projected Cumulative Employer Contributions to Date Aggressive Portfolio
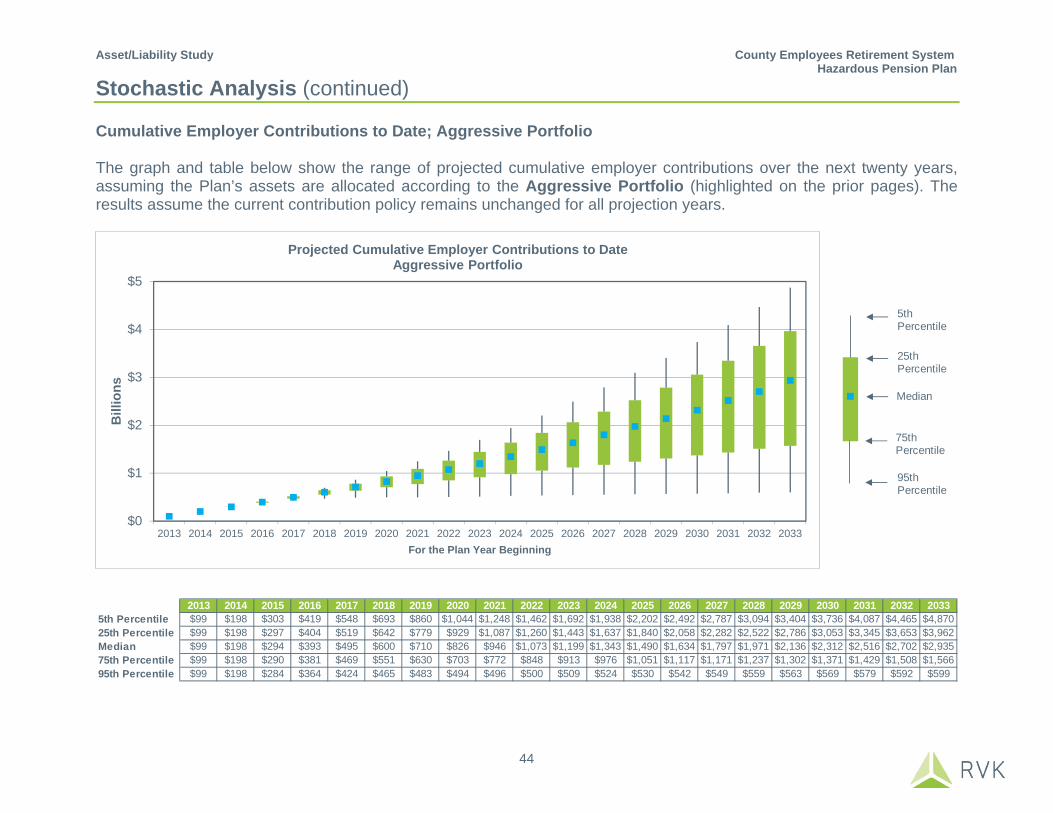
2013 2014 2015 2016 2017 2018 2019 2020 2021 2022 2023 2024 2025 2026 2027 2028 2029 2030 2031 2032 20335th Percentile $99 $198 $303 $419 $548 $693 $860 $1,044 $1,248 $1,462 $1,692 $1,938 $2,202 $2,492 $2,787 $3,094 $3,404 $3,736 $4,087 $4,465 $4,87025th Percentile $99 $198 $297 $404 $519 $642 $779 $929 $1,087 $1,260 $1,443 $1,637 $1,840 $2,058 $2,282 $2,522 $2,786 $3,053 $3,345 $3,653 $3,962Median $99 $198 $294 $393 $495 $600 $710 $826 $946 $1,073 $1,199 $1,343 $1,490 $1,634 $1,797 $1,971 $2,136 $2,312 $2,516 $2,702 $2,93575th Percentile $99 $198 $290 $381 $469 $551 $630 $703 $772 $848 $913 $976 $1,051 $1,117 $1,171 $1,237 $1,302 $1,371 $1,429 $1,508 $1,56695th Percentile $99 $198 $284 $364 $424 $465 $483 $494 $496 $500 $509 $524 $530 $542 $549 $559 $563 $569 $579 $592 $599
Stochastic Analysis (continued) Cumulative Employer Contributions to Date; Aggressive Portfolio The graph and table below show the range of projected cumulative employer contributions over the next twenty years, assuming the Plan’s assets are allocated according to the Aggressive Portfolio (highlighted on the prior pages). The results assume the current contribution policy remains unchanged for all projection years.

Asset/Liability Study County Employees Retirement System Hazardous Pension Plan
45
Stochastic Analysis (continued) Employer Contributions (as a weighted average percentage of salary) The tables below show the range of required employer contributions (as a weighted average percentage of salary) assuming the six different asset mixes highlighted on the prior pages. The results assume the current contribution policy remains unchanged for all projection years.
5th 25th 50th 75th 95thCurrent Target 27% 23% 20% 17% 12%Conservative Portfolio 25% 23% 21% 20% 17%Potential Portfolio 1 26% 23% 20% 17% 13%Potential Portfolio 2 27% 23% 20% 16% 11%Potential Portfolio 3 28% 23% 19% 15% 9%Aggressive Portfolio 29% 23% 19% 15% 7%
5 Years Required Employer Contribution for Plan Year Beginning 2019
5th 25th 50th 75th 95thCurrent Target 38% 29% 22% 15% 2%Conservative Portfolio 38% 31% 27% 23% 17%Potential Portfolio 1 37% 29% 23% 17% 6%Potential Portfolio 2 38% 29% 22% 14% 0%Potential Portfolio 3 40% 30% 21% 12% 0%Aggressive Portfolio 41% 30% 20% 9% 0%
10 Years Required Employer Contribution for Plan Year Beginning 2024
5th 25th 50th 75th 95thCurrent Target 55% 39% 26% 13% 0%Conservative Portfolio 58% 45% 37% 29% 20%Potential Portfolio 1 55% 39% 28% 17% 0%Potential Portfolio 2 55% 38% 25% 10% 0%Potential Portfolio 3 55% 38% 24% 5% 0%Aggressive Portfolio 56% 38% 22% 0% 0%
Required Employer Contribution for Plan Year Beginning 203420 Years
Asset/Liability Study County Employees Retirement System Hazardous Pension Plan
46
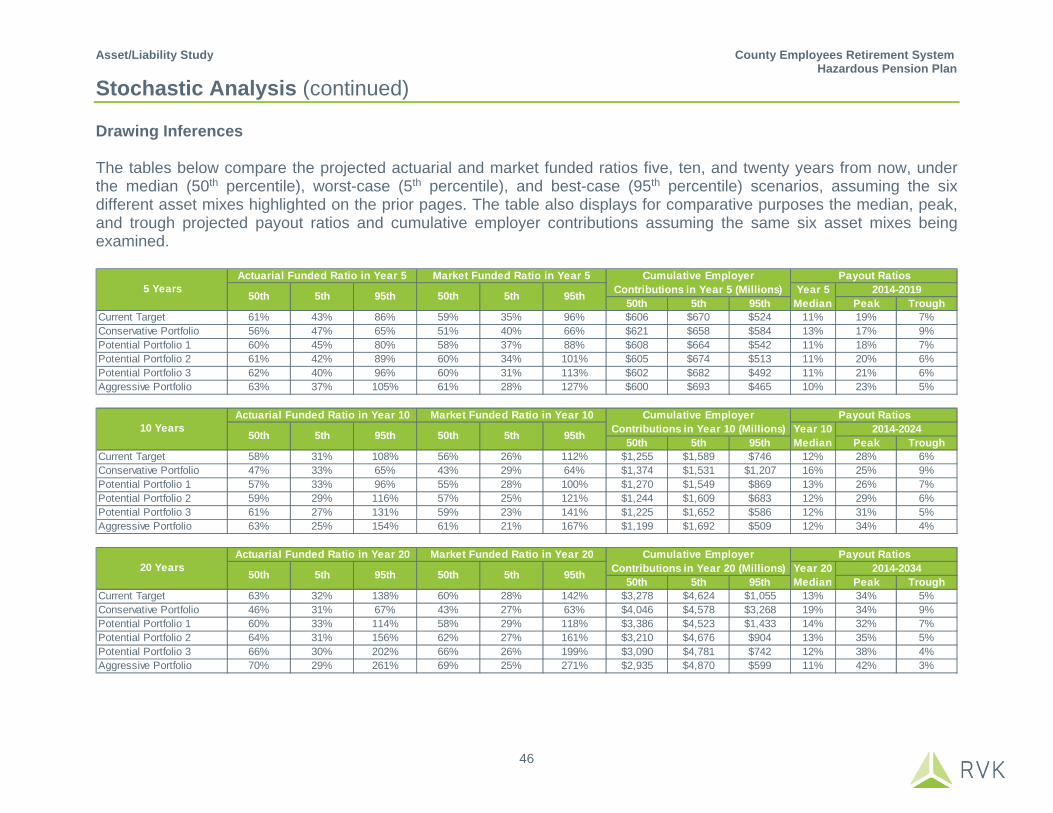
Stochastic Analysis (continued) Drawing Inferences The tables below compare the projected actuarial and market funded ratios five, ten, and twenty years from now, under the median (50th percentile), worst-case (5th percentile), and best-case (95th percentile) scenarios, assuming the six different asset mixes highlighted on the prior pages. The table also displays for comparative purposes the median, peak, and trough projected payout ratios and cumulative employer contributions assuming the same six asset mixes being examined.
50th 5th 95th Peak TroughCurrent Target 61% 43% 86% 59% 35% 96% $606 $670 $524 11% 19% 7%Conservative Portfolio 56% 47% 65% 51% 40% 66% $621 $658 $584 13% 17% 9%Potential Portfolio 1 60% 45% 80% 58% 37% 88% $608 $664 $542 11% 18% 7%Potential Portfolio 2 61% 42% 89% 60% 34% 101% $605 $674 $513 11% 20% 6%Potential Portfolio 3 62% 40% 96% 60% 31% 113% $602 $682 $492 11% 21% 6%Aggressive Portfolio 63% 37% 105% 61% 28% 127% $600 $693 $465 10% 23% 5%
50th 5th 95th Peak TroughCurrent Target 58% 31% 108% 56% 26% 112% $1,255 $1,589 $746 12% 28% 6%Conservative Portfolio 47% 33% 65% 43% 29% 64% $1,374 $1,531 $1,207 16% 25% 9%Potential Portfolio 1 57% 33% 96% 55% 28% 100% $1,270 $1,549 $869 13% 26% 7%Potential Portfolio 2 59% 29% 116% 57% 25% 121% $1,244 $1,609 $683 12% 29% 6%Potential Portfolio 3 61% 27% 131% 59% 23% 141% $1,225 $1,652 $586 12% 31% 5%Aggressive Portfolio 63% 25% 154% 61% 21% 167% $1,199 $1,692 $509 12% 34% 4%
50th 5th 95th Peak TroughCurrent Target 63% 32% 138% 60% 28% 142% $3,278 $4,624 $1,055 13% 34% 5%Conservative Portfolio 46% 31% 67% 43% 27% 63% $4,046 $4,578 $3,268 19% 34% 9%Potential Portfolio 1 60% 33% 114% 58% 29% 118% $3,386 $4,523 $1,433 14% 32% 7%Potential Portfolio 2 64% 31% 156% 62% 27% 161% $3,210 $4,676 $904 13% 35% 5%Potential Portfolio 3 66% 30% 202% 66% 26% 199% $3,090 $4,781 $742 12% 38% 4%Aggressive Portfolio 70% 29% 261% 69% 25% 271% $2,935 $4,870 $599 11% 42% 3%
10 YearsActuarial Funded Ratio in Year 10 Market Funded Ratio in Year 10 Cumulative Employer
Contributions in Year 10 (Millions)Payout Ratios
50th 5th 95th 50th 5th 95th Year 10 Median
5 YearsActuarial Funded Ratio in Year 5 Market Funded Ratio in Year 5 Cumulative Employer
Contributions in Year 5 (Millions)Payout Ratios
50th 5th 95th 50th 5th 95th Year 5 Median
2014-2019
20 YearsActuarial Funded Ratio in Year 20 Market Funded Ratio in Year 20 Payout Ratios
50th 5th 95th 50th 5th 95th
Cumulative Employer Contributions in Year 20 (Millions) Year 20
Median2014-2034
2014-2024
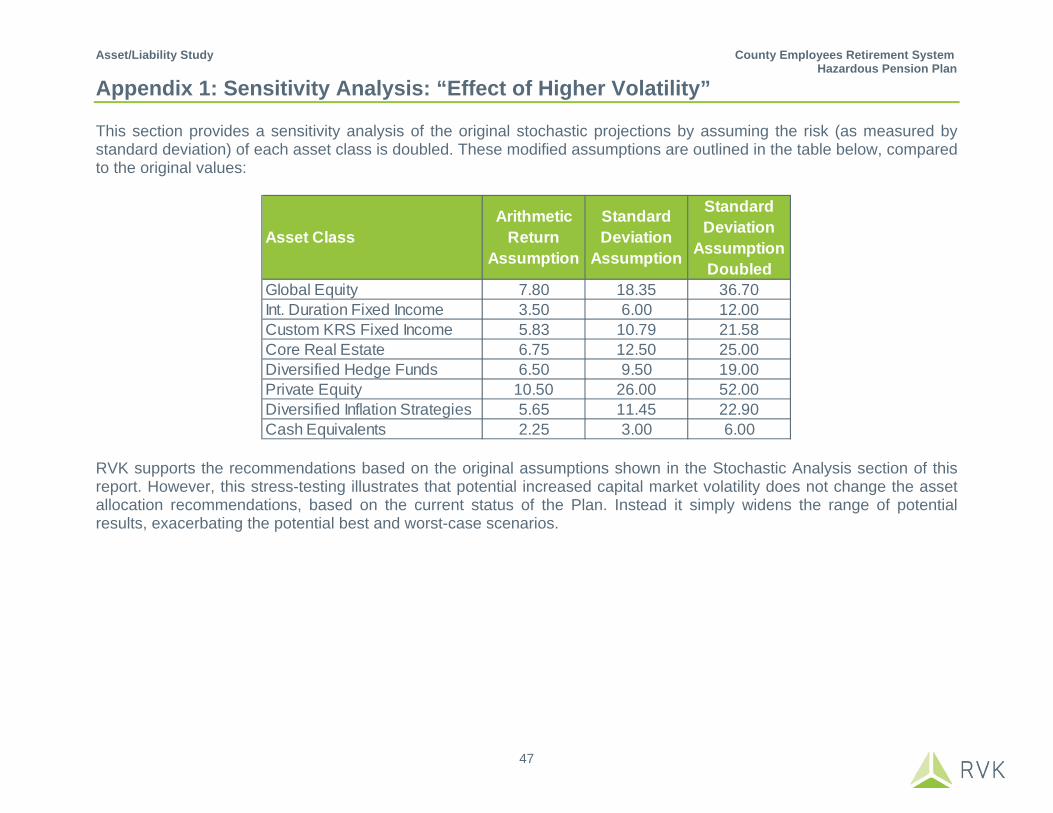
Asset/Liability Study County Employees Retirement System Hazardous Pension Plan
47
Appendix 1: Sensitivity Analysis: “Effect of Higher Volatility” This section provides a sensitivity analysis of the original stochastic projections by assuming the risk (as measured by standard deviation) of each asset class is doubled. These modified assumptions are outlined in the table below, compared to the original values:
RVK supports the recommendations based on the original assumptions shown in the Stochastic Analysis section of this report. However, this stress-testing illustrates that potential increased capital market volatility does not change the asset allocation recommendations, based on the current status of the Plan. Instead it simply widens the range of potential results, exacerbating the potential best and worst-case scenarios.
Asset ClassArithmetic
Return Assumption
Standard Deviation
Assumption
Standard Deviation
Assumption Doubled
Global Equity 7.80 18.35 36.70Int. Duration Fixed Income 3.50 6.00 12.00Custom KRS Fixed Income 5.83 10.79 21.58Core Real Estate 6.75 12.50 25.00Diversified Hedge Funds 6.50 9.50 19.00Private Equity 10.50 26.00 52.00Diversified Inflation Strategies 5.65 11.45 22.90Cash Equivalents 2.25 3.00 6.00

Asset/Liability Study County Employees Retirement System Hazardous Pension Plan
48
Appendix 1: Sensitivity Analysis: “Effect of Higher Volatility” (continued) Projected Market Funded Ratio and Maximum 1 Year Investment Loss (market value of assets/actuarial accrued liability) The tables below show the probability that the Plan will be at various funding levels for each of the six different asset mixes highlighted on the prior pages. The tables also illustrate the maximum 1 year investment loss each portfolio is expected to experience during the given time period as well as the maximum one year employer contribution (shown as a weighted average percentage of salary). The results assume the current contribution policy remains unchanged for all projection years.
Current Target 17% 54% 27% -62% 35%Conservative Portfolio 1% 77% 20% -41% 30%Potential Portfolio 1 14% 57% 25% -56% 33%Potential Portfolio 2 20% 53% 28% -65% 36%Potential Portfolio 3 24% 52% 30% -70% 37%Aggressive Portfolio 27% 51% 31% -74% 39%
5 Years Probability of FullFunding in 2019
Probability of < 63% (Current) Funding in 2019
Maximum 1 Year Investment Loss
Probability of < 40% (Current) Funding in 2019
Maximum 1 YearEmployer Contribution
Current Target 24% 55% 34% -62% 52%Conservative Portfolio 3% 79% 43% -41% 50%Potential Portfolio 1 20% 59% 33% -56% 52%Potential Portfolio 2 27% 54% 34% -65% 52%Potential Portfolio 3 31% 52% 35% -71% 53%Aggressive Portfolio 34% 50% 35% -76% 55%
Maximum 1 Year Investment Loss10 Years Probability of Full
Funding in 2024Probability of < 63%
(Current) Funding in 2024Probability of < 40%
(Current) Funding in 2024Maximum 1 Year
Employer Contribution
Current Target 33% 49% 31% -63% 85%Conservative Portfolio 4% 78% 44% -41% 86%Potential Portfolio 1 27% 52% 31% -56% 86%Potential Portfolio 2 36% 48% 31% -67% 85%Potential Portfolio 3 40% 45% 30% -72% 84%Aggressive Portfolio 44% 43% 30% -77% 84%
Probability of < 40% (Current) Funding in 2034
Maximum 1 YearEmployer Contribution
Probability of < 63% (Current) Funding in 2034
Probability of FullFunding in 203420 Years Maximum 1 Year
Investment Loss

Asset/Liability Study County Employees Retirement System Hazardous Pension Plan
49
Appendix 1: Sensitivity Analysis: “Effect of Higher Volatility” (continued) Drawing Inferences The tables below compare the projected actuarial and market funded ratios five, ten, and twenty years from now, under the median (50th percentile), worst-case (5th percentile), and best-case (95th percentile) scenarios, assuming the six different asset mixes highlighted on the prior pages. The table also displays for comparative purposes the median, peak, and trough projected payout ratios and cumulative employer contributions assuming the same six asset mixes being examined.
50th 5th 95th Peak TroughCurrent Target 61% 29% 121% 60% 21% 154% $604 $739 $424 11% 32% 4%Conservative Portfolio 56% 40% 76% 51% 31% 83% $622 $698 $549 13% 22% 7%Potential Portfolio 1 60% 33% 106% 58% 24% 132% $607 $720 $464 11% 28% 5%Potential Portfolio 2 62% 26% 130% 60% 19% 168% $603 $751 $401 11% 35% 4%Potential Portfolio 3 63% 23% 148% 61% 16% 204% $601 $774 $363 10% 42% 3%Aggressive Portfolio 64% 19% 176% 62% 13% 247% $599 $799 $332 10% 51% 3%
50th 5th 95th Peak TroughCurrent Target 59% 16% 202% 57% 12% 222% $1,242 $1,836 $447 12% 62% 3%Conservative Portfolio 48% 23% 88% 43% 19% 91% $1,372 $1,674 $1,000 16% 40% 7%Potential Portfolio 1 57% 18% 163% 55% 14% 181% $1,257 $1,761 $518 13% 52% 4%Potential Portfolio 2 61% 14% 228% 59% 11% 252% $1,229 $1,874 $419 12% 68% 3%Potential Portfolio 3 63% 12% 287% 61% 9% 334% $1,208 $1,943 $379 12% 81% 2%Aggressive Portfolio 64% 10% 382% 63% 7% 446% $1,182 $2,001 $348 11% 99% 2%
50th 5th 95th Peak TroughCurrent Target 66% 19% 397% 65% 15% 415% $3,201 $5,237 $498 12% 79% 2%Conservative Portfolio 47% 20% 95% 43% 17% 94% $4,021 $5,007 $1,999 18% 61% 7%Potential Portfolio 1 62% 20% 282% 60% 16% 289% $3,310 $5,092 $633 13% 71% 3%Potential Portfolio 2 68% 18% 474% 67% 14% 497% $3,127 $5,345 $458 12% 87% 1%Potential Portfolio 3 70% 18% 692% 73% 14% 723% $3,001 $5,477 $406 11% 98% 1%Aggressive Portfolio 77% 16% 1048% 81% 12% 1111% $2,842 $5,590 $365 10% 100% 1%
Year 20 Median
2014-2034
2014-2024
20 YearsActuarial Funded Ratio in Year 20 Market Funded Ratio in Year 20 Payout Ratios
50th 5th 95th 50th 5th 95th
Cumulative Employer Contributions in Year 20 (Millions)
5 YearsActuarial Funded Ratio in Year 5 Market Funded Ratio in Year 5 Cumulative Employer
Contributions in Year 5 (Millions)Payout Ratios
50th 5th 95th 50th 5th 95th Year 5 Median
2014-2019
10 YearsActuarial Funded Ratio in Year 10 Market Funded Ratio in Year 10 Cumulative Employer
Contributions in Year 10 (Millions)Payout Ratios
50th 5th 95th 50th 5th 95th Year 10 Median
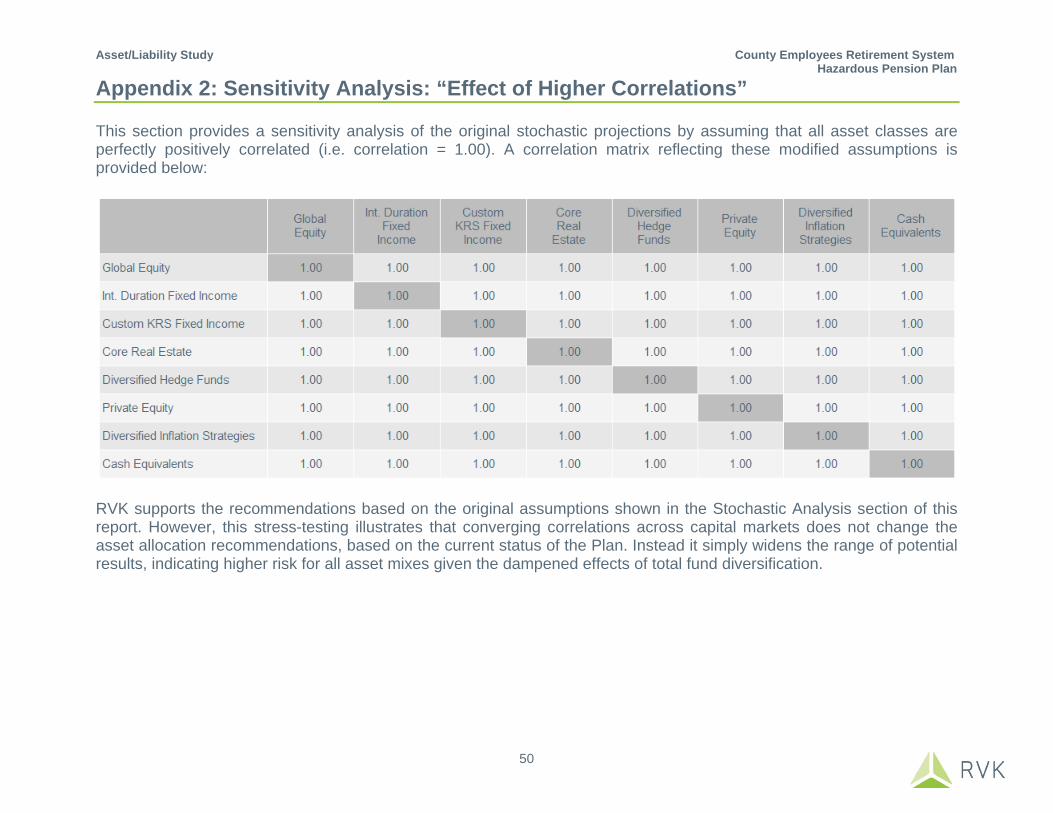
Asset/Liability Study County Employees Retirement System Hazardous Pension Plan
50
Appendix 2: Sensitivity Analysis: “Effect of Higher Correlations” This section provides a sensitivity analysis of the original stochastic projections by assuming that all asset classes are perfectly positively correlated (i.e. correlation = 1.00). A correlation matrix reflecting these modified assumptions is provided below:
RVK supports the recommendations based on the original assumptions shown in the Stochastic Analysis section of this report. However, this stress-testing illustrates that converging correlations across capital markets does not change the asset allocation recommendations, based on the current status of the Plan. Instead it simply widens the range of potential results, indicating higher risk for all asset mixes given the dampened effects of total fund diversification.

Asset/Liability Study County Employees Retirement System Hazardous Pension Plan
51
Appendix 2: Sensitivity Analysis: “Effect of Higher Correlations” (continued) Projected Market Funded Ratio and Maximum 1 Year Investment Loss (market value of assets/actuarial accrued liability) The tables below show the probability that the Plan will be at various funding levels for each of the six different asset mixes highlighted on the prior pages. The tables also illustrate the maximum 1 year investment loss each portfolio is expected to experience during the given time period as well as the maximum one year employer contribution (shown as a weighted average percentage of salary). The results assume the current contribution policy remains unchanged for all projection years.
Current Target 11% 57% 18% -41% 30%Conservative Portfolio 0% 81% 13% -23% 27%Potential Portfolio 1 9% 59% 17% -38% 29%Potential Portfolio 2 12% 56% 19% -43% 30%Potential Portfolio 3 16% 54% 20% -47% 31%Aggressive Portfolio 19% 53% 22% -51% 32%
5 Years Probability of FullFunding in 2019
Probability of < 63% (Current) Funding in 2019
Maximum 1 Year Investment Loss
Probability of < 40% (Current) Funding in 2019
Maximum 1 YearEmployer Contribution
Current Target 18% 57% 29% -41% 45%Conservative Portfolio 1% 85% 40% -23% 42%Potential Portfolio 1 15% 59% 29% -38% 44%Potential Portfolio 2 20% 56% 29% -43% 45%Potential Portfolio 3 23% 53% 29% -47% 46%Aggressive Portfolio 27% 52% 29% -51% 47%
Maximum 1 Year Investment Loss10 Years Probability of Full
Funding in 2024Probability of < 63%
(Current) Funding in 2024Probability of < 40%
(Current) Funding in 2024Maximum 1 Year
Employer Contribution
Current Target 24% 53% 28% -48% 65%Conservative Portfolio 1% 86% 45% -29% 64%Potential Portfolio 1 20% 56% 29% -46% 65%Potential Portfolio 2 27% 51% 28% -50% 66%Potential Portfolio 3 32% 49% 28% -54% 66%Aggressive Portfolio 35% 46% 27% -58% 67%
Probability of < 40% (Current) Funding in 2034
Maximum 1 YearEmployer Contribution
Probability of < 63% (Current) Funding in 2034
Probability of FullFunding in 203420 Years Maximum 1 Year
Investment Loss
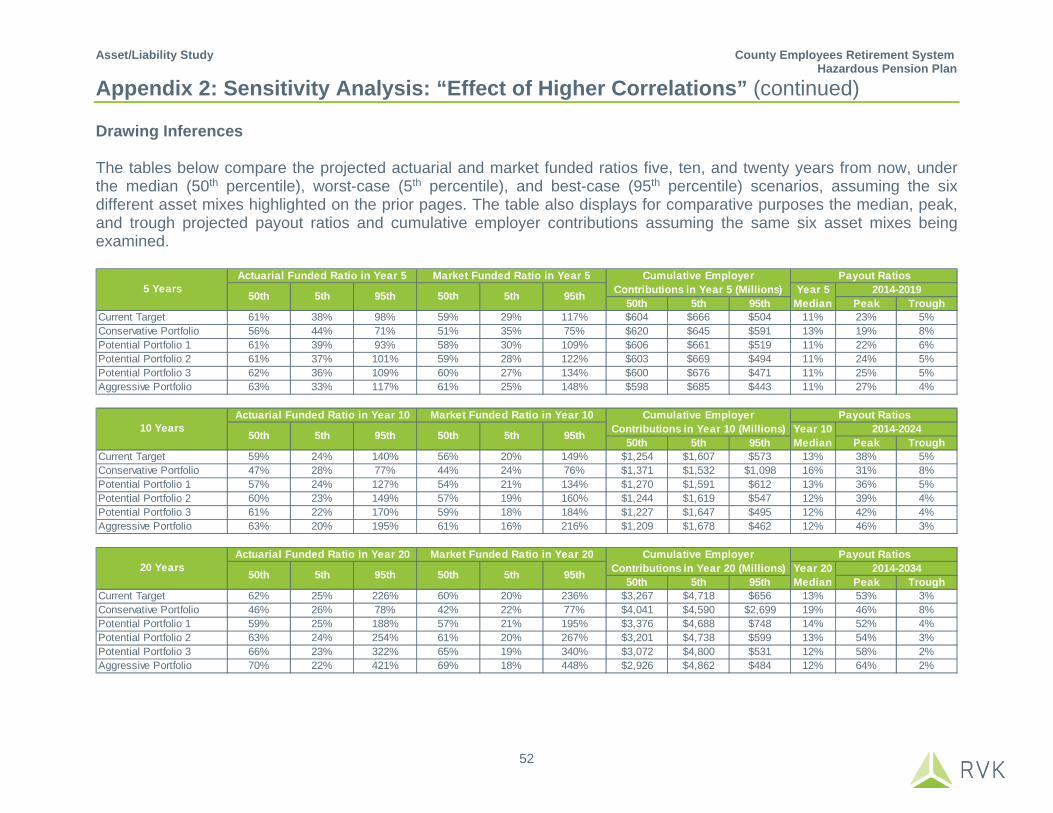
Asset/Liability Study County Employees Retirement System Hazardous Pension Plan
52
Appendix 2: Sensitivity Analysis: “Effect of Higher Correlations” (continued) Drawing Inferences The tables below compare the projected actuarial and market funded ratios five, ten, and twenty years from now, under the median (50th percentile), worst-case (5th percentile), and best-case (95th percentile) scenarios, assuming the six different asset mixes highlighted on the prior pages. The table also displays for comparative purposes the median, peak, and trough projected payout ratios and cumulative employer contributions assuming the same six asset mixes being examined.
50th 5th 95th Peak TroughCurrent Target 61% 38% 98% 59% 29% 117% $604 $666 $504 11% 23% 5%Conservative Portfolio 56% 44% 71% 51% 35% 75% $620 $645 $591 13% 19% 8%Potential Portfolio 1 61% 39% 93% 58% 30% 109% $606 $661 $519 11% 22% 6%Potential Portfolio 2 61% 37% 101% 59% 28% 122% $603 $669 $494 11% 24% 5%Potential Portfolio 3 62% 36% 109% 60% 27% 134% $600 $676 $471 11% 25% 5%Aggressive Portfolio 63% 33% 117% 61% 25% 148% $598 $685 $443 11% 27% 4%
50th 5th 95th Peak TroughCurrent Target 59% 24% 140% 56% 20% 149% $1,254 $1,607 $573 13% 38% 5%Conservative Portfolio 47% 28% 77% 44% 24% 76% $1,371 $1,532 $1,098 16% 31% 8%Potential Portfolio 1 57% 24% 127% 54% 21% 134% $1,270 $1,591 $612 13% 36% 5%Potential Portfolio 2 60% 23% 149% 57% 19% 160% $1,244 $1,619 $547 12% 39% 4%Potential Portfolio 3 61% 22% 170% 59% 18% 184% $1,227 $1,647 $495 12% 42% 4%Aggressive Portfolio 63% 20% 195% 61% 16% 216% $1,209 $1,678 $462 12% 46% 3%
50th 5th 95th Peak TroughCurrent Target 62% 25% 226% 60% 20% 236% $3,267 $4,718 $656 13% 53% 3%Conservative Portfolio 46% 26% 78% 42% 22% 77% $4,041 $4,590 $2,699 19% 46% 8%Potential Portfolio 1 59% 25% 188% 57% 21% 195% $3,376 $4,688 $748 14% 52% 4%Potential Portfolio 2 63% 24% 254% 61% 20% 267% $3,201 $4,738 $599 13% 54% 3%Potential Portfolio 3 66% 23% 322% 65% 19% 340% $3,072 $4,800 $531 12% 58% 2%Aggressive Portfolio 70% 22% 421% 69% 18% 448% $2,926 $4,862 $484 12% 64% 2%
Year 20 Median
2014-2034
2014-2024
20 YearsActuarial Funded Ratio in Year 20 Market Funded Ratio in Year 20 Payout Ratios
50th 5th 95th 50th 5th 95th
Cumulative Employer Contributions in Year 20 (Millions)
5 YearsActuarial Funded Ratio in Year 5 Market Funded Ratio in Year 5 Cumulative Employer
Contributions in Year 5 (Millions)Payout Ratios
50th 5th 95th 50th 5th 95th Year 5 Median
2014-2019
10 YearsActuarial Funded Ratio in Year 10 Market Funded Ratio in Year 10 Cumulative Employer
Contributions in Year 10 (Millions)Payout Ratios
50th 5th 95th 50th 5th 95th Year 10 Median

Asset/Liability Study County Employees Retirement System Hazardous Pension Plan
53
Appendix 3: Assumptions and Methods Actuarial Valuation Assumptions and Methods: At the beginning of each projection year, an actuarial valuation is performed to determine employer contributions. The assumptions proposed in the 2013 Experience Study were used with actuarial valuations beginning in 2015 and beyond. These methods and assumptions are summarized below: Actuarial Cost Method Entry-Age Normal (level % of pay). Funding policies and methods are described in the
June 30, 2014 actuarial valuation report prepared by Cavanaugh. Liability Discount Rate 7.50% per year, compounded annually. Future Pay Increases Future pay increases as recommended in the 2013 Experience Study. Pay increases
include a 4.00% base wage inflation rate. Retirement Rates of retirement as recommended in the 2013 Experience Study. Mortality Rates of mortality as recommended in the 2013 Experience Study. Disability Rates of disability as recommended in the 2013 Experience Study. Withdrawal Rates of withdrawal as recommended in the 2013 Experience Study. Asset Valuation Method 5-Year smoothing of actual versus expected returns. The asset valuation method is
described on page 36 of the June 30, 2014 actuarial valuation report prepared by Cavanaugh.
Contribution Policy For fiscal years 2017 and beyond, employer contributions are assumed to equal the full
actuarially required contribution consisting of: (1) gross normal cost, less (2) expected employee contributions, plus (3) administrative expenses (0.36% of 2014-15 payroll, growing at inflation each year), plus (4) an amortization of the unfunded actuarial liability over 29 years beginning in 2014, calculated as a level percentage of payroll assuming 4.00% payroll growth. The amortization period was not assumed to reset at any point in the future, and was not allowed to fall below 10 years.

Asset/Liability Study County Employees Retirement System Hazardous Pension Plan
54
Appendix 3: Assumptions and Methods (continued) Projection Assumptions (used in the deterministic and stochastic asset/liability projections): These projections begin with the Plan's participant population as of June 30, 2014, as provided by Cavanaugh. The Plan's population is projected forward and assumed to change as a result of employment separation, death, disability, and retirement, as predicted by the assumptions recommended in the 2013 Experience Study (and described on the prior pages). New members are assumed to enter the Plan such that the active population remains level throughout the projection. Employee compensation is projected into the future in accordance with the assumptions described on the prior pages. Investment returns are projected into the future in accordance with the assumptions described below. Employer Contributions For the fiscal years ending 2015 and 2016, assumes total employer contributions equal
to the full actuarially required contributions as set forth in the actuarial valuations as of June 30, 2013, and June 30, 2014 (20.73% and 20.26% of payroll, respectively). Thereafter, assumes employer contributions for each fiscal year are determined as of the prior year’s valuation date in accordance with the actuarial funding policy and the assumptions from the 2013 Experience Study.
Member Contributions Member contributions are determined based on current contribution rates, and projected
pay. New Entrants New employees are assumed to join the Plan such that the active population remains
level throughout the projection. New employees entering the Plan are assumed to have characteristics similar to recently hired participants.
Rate of Return on Assets Deterministic Analysis: 7.50%, compounded annually.
Stochastic Analysis: Returns on the portfolio are based on the expected returns of each asset class and the correlations between each class which are detailed in the Stochastic Analysis section of this report.
Cash Balance Interest Credit Deterministic Analysis: 7.00%, compounded annually. Stochastic Analysis: Interest credits are based on the expected returns of a benchmark
portfolio designed to mirror the overall portfolio return.

Asset/Liability Study County Employees Retirement System Hazardous Pension Plan
55
Appendix 3: Assumptions and Methods (continued) Inflation 2.50% per year with a standard deviation of 3.00%. Other All other projection assumptions are the same as those recommended in the 2013
Experience Study. Our work was based partly on original work prepared by Cavanaugh using the ProVal valuation software. This included their coding of benefit provisions and the methodology to generate liabilities under the entry age normal actuarial cost method. Cavanaugh provided us with an actuarial valuation as of June 30, 2014, using assumptions from the 2013 Experience Study. We reviewed this work for reasonableness, but we did not perform a complete audit of this work. We started with Cavanaugh’s base year valuation work. Certain changes to the coding of benefit provisions were required in order to facilitate a 20-year projection of liabilities and costs. For example, we added employee contribution definitions in order to offset gross normal cost calculations by expected employee contributions. In some cases, scaling of liabilities was used to approximate liabilities not valued directly in the work provided by Cavanaugh. The participant data provided by Cavanaugh was the same as that used in the actuarial valuation as of June 30, 2014, for CERS Hazardous Plan funding purposes. This data was used without grouping or adjustment. We modeled contribution rates based on annual valuations with a one-year lag period.