may 2016 greater boston real estate market trends report
TRANSCRIPT
May 2016 Quick Facts
23456789
1011121314
Monthly Indicators
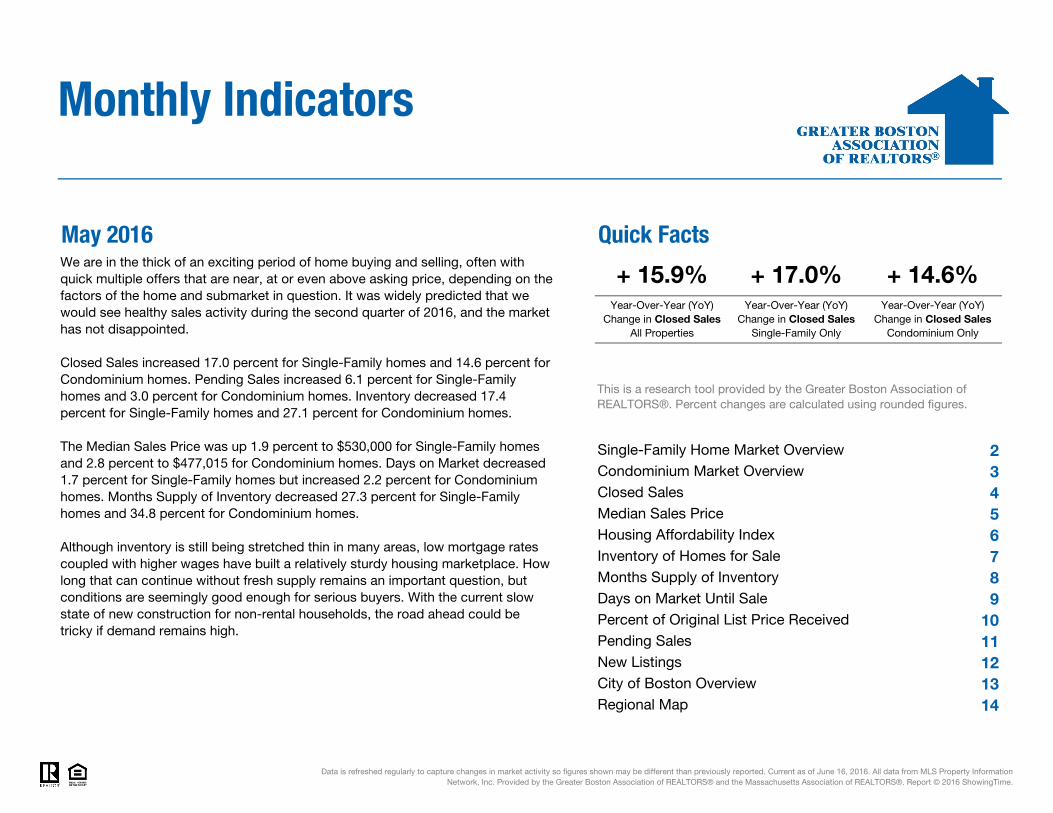
We are in the thick of an exciting period of home buying and selling, often with quick multiple offers that are near, at or even above asking price, depending on the factors of the home and submarket in question. It was widely predicted that we would see healthy sales activity during the second quarter of 2016, and the market has not disappointed.
Closed Sales increased 17.0 percent for Single-Family homes and 14.6 percent for Condominium homes. Pending Sales increased 6.1 percent for Single-Family homes and 3.0 percent for Condominium homes. Inventory decreased 17.4 percent for Single-Family homes and 27.1 percent for Condominium homes.
The Median Sales Price was up 1.9 percent to $530,000 for Single-Family homes and 2.8 percent to $477,015 for Condominium homes. Days on Market decreased 1.7 percent for Single-Family homes but increased 2.2 percent for Condominium homes. Months Supply of Inventory decreased 27.3 percent for Single-Family homes and 34.8 percent for Condominium homes.
Although inventory is still being stretched thin in many areas, low mortgage rates coupled with higher wages have built a relatively sturdy housing marketplace. How long that can continue without fresh supply remains an important question, but conditions are seemingly good enough for serious buyers. With the current slow state of new construction for non-rental households, the road ahead could be tricky if demand remains high.
Data is refreshed regularly to capture changes in market activity so figures shown may be different than previously reported. Current as of June 16, 2016. All data from MLS Property Information Network, Inc. Provided by the Greater Boston Association of REALTORS® and the Massachusetts Association of REALTORS®. Report © 2016 ShowingTime.
Single-Family Home Market Overview
+ 15.9% + 17.0% + 14.6%
This is a research tool provided by the Greater Boston Association of REALTORS®. Percent changes are calculated using rounded figures.
Condominium Market Overview
Year-Over-Year (YoY) Change in Closed Sales
All Properties
Year-Over-Year (YoY) Change in Closed Sales
Single-Family Only
Year-Over-Year (YoY) Change in Closed Sales
Condominium Only
Closed Sales
Pending SalesNew ListingsCity of Boston OverviewRegional Map
Median Sales PriceHousing Affordability IndexInventory of Homes for SaleMonths Supply of InventoryDays on Market Until SalePercent of Original List Price Received

Single-Family Home Market Overview
Historical Sparkbars 5-2015 5-2016 PercentChange YTD 2015 YTD 2016 Percent
Change
Key market metrics for the current month and year-to-date figures for Single-Family Homes Only.
Closed Sales 1,060 1,240 + 17.0%
Key Metrics
4,377 + 16.7%
Median Sales Price $520,000 $530,000 + 1.9% $497,700 $515,000 + 3.5%
3,752
- 2.3%
Inventory of Homes for Sale 3,533 2,918 - 17.4% -- -- --
Housing Affordability Index 84 82 - 2.4% 87 85
--
Days on Market Until Sale 59 58 - 1.7% 79 72 - 8.9%
Months Supply of Inventory 3.3 2.4 - 27.3% -- --
Current as of June 16, 2016. All data from MLS Property Information Network, Inc. Provided by the Greater Boston Association of REALTORS® and the Massachusetts Association of REALTORS®. Report © 2016 ShowingTime. | 2
+ 0.6%
Pending Sales 1,760 1,868 + 6.1% 5,751 6,523 + 13.4%
Pct. of Orig. List Price Received 99.1% 99.4% + 0.3% 97.1% 97.7%
New Listings + 5.5%2,532 2,083 - 17.7% 7,975 8,416
May 2014 Nov 2014 May 2015 Nov 2015 May 2016
May 2014 Nov 2014 May 2015 Nov 2015 May 2016
May 2014 Nov 2014 May 2015 Nov 2015 May 2016
May 2014 Nov 2014 May 2015 Nov 2015 May 2016
May 2014 Nov 2014 May 2015 Nov 2015 May 2016
May 2014 Nov 2014 May 2015 Nov 2015 May 2016
May 2014 Nov 2014 May 2015 Nov 2015 May 2016
May 2014 Nov 2014 May 2015 Nov 2015 May 2016
May 2014 Nov 2014 May 2015 Nov 2015 May 2016

Condominium Market Overview
Historical Sparkbars 5-2015 5-2016 PercentChange YTD 2015 YTD 2016 Percent
Change
Current as of June 16, 2016. All data from MLS Property Information Network, Inc. Provided by the Greater Boston Association of REALTORS® and the Massachusetts Association of REALTORS®. Report © 2016 ShowingTime. | 3
+ 13.0%Pending Sales 1,298 1,337 + 3.0% 4,684 5,294
New Listings 1,662 1,429 - 14.0% 5,991 6,185
100.0% + 0.4%
53+ 2.2% 58
+ 3.2%
Pct. of Orig. List Price Received 100.9% 101.4% + 0.5% 99.6%
- 8.6%
- 27.1% -- --
Months Supply of Inventory 2.3 1.5 - 34.8% --
--
-- --
+ 2.8% $445,010 $470,000 + 5.6%
91 - 3.2% 98 93 - 5.1%
+ 14.6%
Key Metrics
3,748 + 18.5%3,164
Key market metrics for the current month and year-to-date figures for Condominium Properties Only.
Closed Sales 958 1,098
Median Sales Price $463,950 $477,015
Inventory of Homes for Sale 1,937 1,413
Days on Market Until Sale 45 46
Housing Affordability Index 94
May 2014 Nov 2014 May 2015 Nov 2015 May 2016
May 2014 Nov 2014 May 2015 Nov 2015 May 2016
May 2014 Nov 2014 May 2015 Nov 2015 May 2016
May 2014 Nov 2014 May 2015 Nov 2015 May 2016
May 2014 Nov 2014 May 2015 Nov 2015 May 2016
May 2014 Nov 2014 May 2015 Nov 2015 May 2016
May 2014 Nov 2014 May 2015 Nov 2015 May 2016
May 2014 Nov 2014 May 2015 Nov 2015 May 2016
May 2014 Nov 2014 May 2015 Nov 2015 May 2016
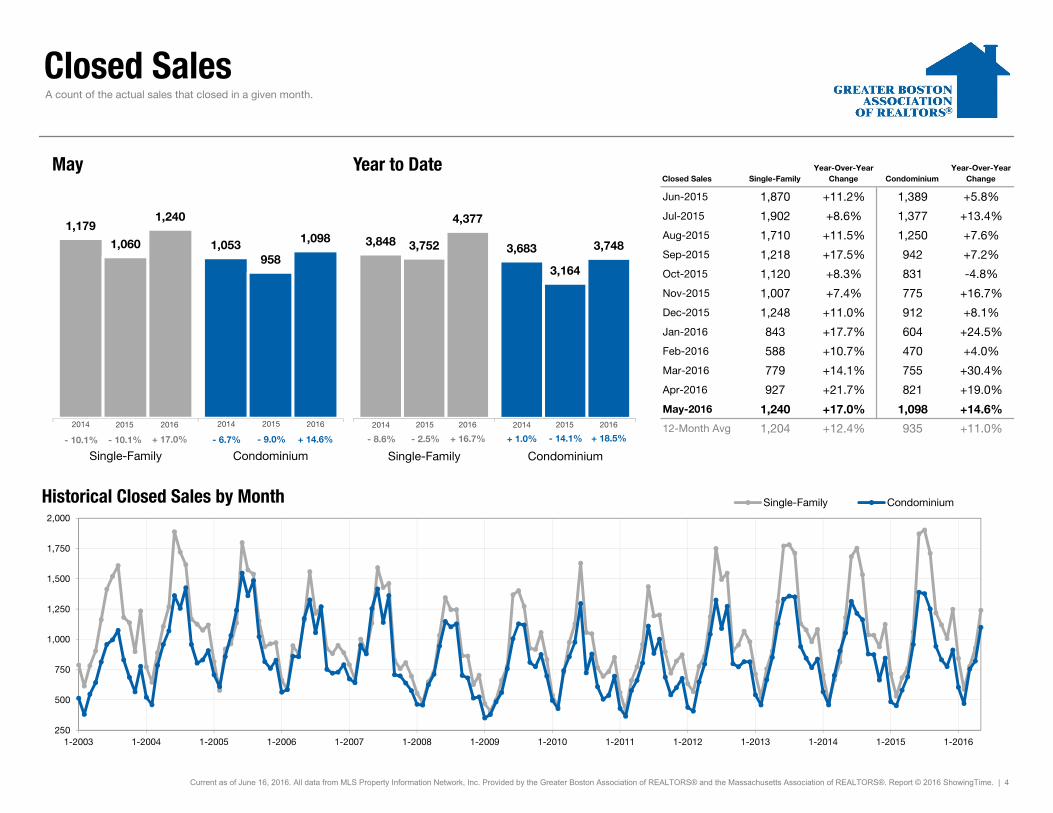
Closed Sales
Closed Sales Single-FamilyYear-Over-Year
Change CondominiumYear-Over-Year
Change
Jun-2015 1,870 +11.2% 1,389 +5.8%
Jul-2015 1,902 +8.6% 1,377 +13.4%
Aug-2015 1,710 +11.5% 1,250 +7.6%
Sep-2015 1,218 +17.5% 942 +7.2%
Oct-2015 1,120 +8.3% 831 -4.8%
Nov-2015 1,007 +7.4% 775 +16.7%
Dec-2015 1,248 +11.0% 912 +8.1%
Jan-2016 843 +17.7% 604 +24.5%
Feb-2016 588 +10.7% 470 +4.0%
Mar-2016 779 +14.1% 755 +30.4%
Apr-2016 927 +21.7% 821 +19.0%
May-2016 1,240 +17.0% 1,098 +14.6%
12-Month Avg 1,204 +12.4% 935 +11.0%
Historical Closed Sales by Month
Current as of June 16, 2016. All data from MLS Property Information Network, Inc. Provided by the Greater Boston Association of REALTORS® and the Massachusetts Association of REALTORS®. Report © 2016 ShowingTime. | 4
A count of the actual sales that closed in a given month.
1,179
1,0531,060958
1,240
1,098
Single-Family Condominium
May
250
500
750
1,000
1,250
1,500
1,750
2,000
1-2003 1-2004 1-2005 1-2006 1-2007 1-2008 1-2009 1-2010 1-2011 1-2012 1-2013 1-2014 1-2015 1-2016
Single-Family Condominium
3,848 3,6833,752
3,164
4,377
3,748
Single-Family Condominium
Year to Date
2014 2015 2016
+ 14.6%- 9.0%+ 17.0%- 10.1% - 14.1%+ 16.7%- 2.5% + 18.5%
2014 2015 2016 2014 2015 2016 2014 2015 2016
- 10.1% - 8.6% + 1.0%- 6.7%

Median Sales Price
Median Sales Price Single-FamilyYear-Over-Year
Change CondominiumYear-Over-Year
Change
Jun-2015 $560,000 +4.7% $460,000 +7.0%
Jul-2015 $550,000 +5.8% $460,000 +9.8%
Aug-2015 $528,900 +2.7% $455,500 +9.0%
Sep-2015 $491,700 +7.1% $425,450 +3.4%
Oct-2015 $475,000 +0.5% $455,000 +15.2%
Nov-2015 $517,000 +6.4% $450,455 +7.3%
Dec-2015 $500,001 +5.3% $443,750 +5.2%
Jan-2016 $490,000 +1.0% $443,250 -1.3%
Feb-2016 $518,750 +10.4% $449,500 +7.2%
Mar-2016 $472,500 +0.7% $477,500 +4.9%
Apr-2016 $530,000 +3.5% $480,000 +10.1%
May-2016 $530,000 +1.9% $477,015 +2.8%
12-Month Avg* $513,654 +4.0% $456,452 +8.2%
Historical Median Sales Price by Month
Point at which half of the sales sold for more and half sold for less, not accounting for seller concessions, in a given month.
* Median Sales Price for all properties from June 2015 through May 2016. This is not the average of the individual figures above.
Current as of June 16, 2016. All data from MLS Property Information Network, Inc. Provided by the Greater Boston Association of REALTORS® and the Massachusetts Association of REALTORS®. Report © 2016 ShowingTime. | 5
$492,000
$418,000
$520,000
$463,950
$530,000
$477,015
Single-Family Condominium
May
$200,000
$300,000
$400,000
$500,000
$600,000
1-2003 1-2004 1-2005 1-2006 1-2007 1-2008 1-2009 1-2010 1-2011 1-2012 1-2013 1-2014 1-2015 1-2016
Single-Family Condominium
$474,000
$410,000
$497,700
$445,010
$515,000
$470,000
Single-Family Condominium
Year to Date
2014 2015 2016
+ 2.8%+ 11.0%+ 1.9%+ 5.7% + 8.5%+ 3.5%+ 5.0% + 5.6%
2014 2015 2016 2014 2015 2016 2014 2015 2016
+ 7.0% + 10.0% + 8.2%+ 5.8%

Housing Affordability Index
Affordability Index Single-FamilyYear-Over-Year
Change CondominiumYear-Over-Year
Change
Jun-2015 76 +1.3% 93 -1.1%
Jul-2015 76 -1.3% 91 -5.2%
Aug-2015 80 +2.6% 93 -4.1%
Sep-2015 87 0.0% 101 +4.1%
Oct-2015 90 +4.7% 94 -8.7%
Nov-2015 82 -2.4% 94 -3.1%
Dec-2015 85 -2.3% 96 -1.0%
Jan-2016 86 -3.4% 95 -2.1%
Feb-2016 84 -8.7% 97 -6.7%
Mar-2016 92 0.0% 91 -3.2%
Apr-2016 82 -3.5% 91 -8.1%
May-2016 82 -2.4% 91 -3.2%
12-Month Avg 84 -0.8% 94 -3.5%
Historical Housing Affordability Index by Month
This index measures housing affordability for the region. For example, an index of 120 means the median household income is 120% of what is necessary to qualify for the median-priced home under prevailing interest rates. A higher number means greater affordability.
Current as of June 16, 2016. All data from MLS Property Information Network, Inc. Provided by the Greater Boston Association of REALTORS® and the Massachusetts Association of REALTORS®. Report © 2016 ShowingTime. | 6
82
96
8494
8291
Single-Family Condominium
May
40
60
80
100
120
140
1-2003 1-2004 1-2005 1-2006 1-2007 1-2008 1-2009 1-2010 1-2011 1-2012 1-2013 1-2014 1-2015 1-2016
Single-Family Condominium
85
98
87
98
8593
Single-Family Condominium
Year to Date
2014 2015 2016
- 3.2%- 2.1%- 2.4%+ 2.4% 0.0%- 2.3%+ 2.4% - 5.1%
2014 2015 2016 2014 2015 2016 2014 2015 2016
- 7.9% - 10.5% - 9.3%- 7.7%
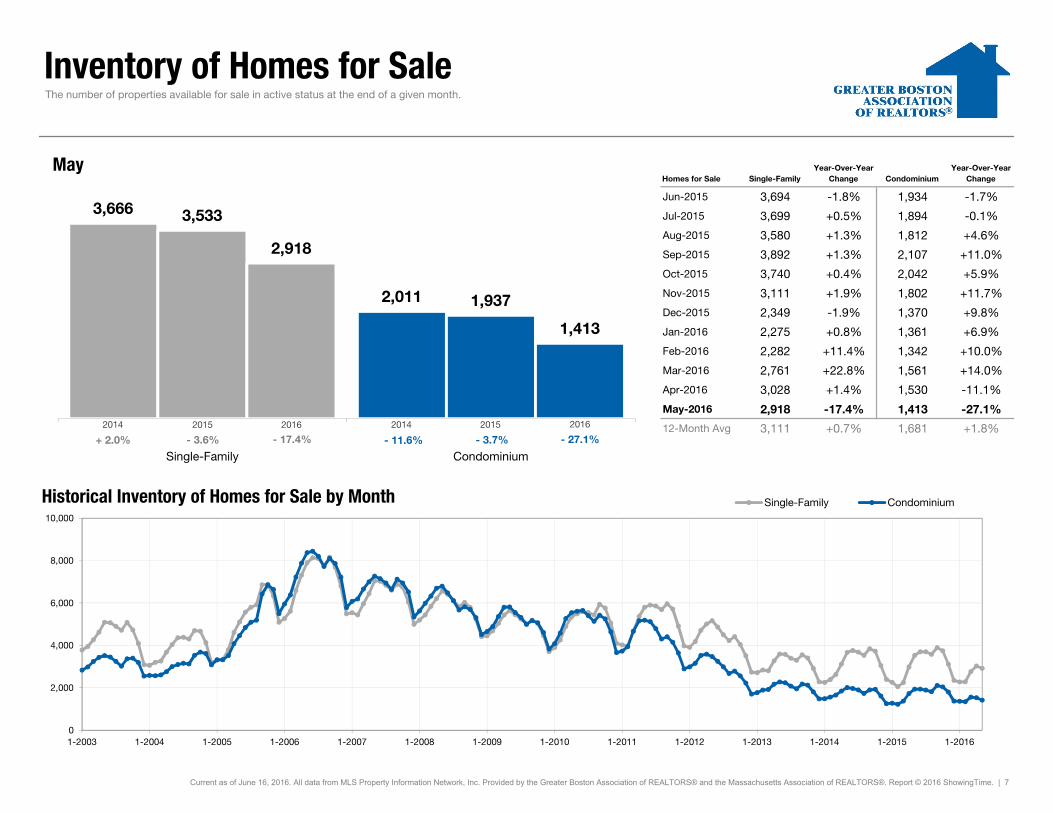
Inventory of Homes for Sale
Homes for Sale Single-FamilyYear-Over-Year
Change CondominiumYear-Over-Year
Change
Jun-2015 3,694 -1.8% 1,934 -1.7%
Jul-2015 3,699 +0.5% 1,894 -0.1%
Aug-2015 3,580 +1.3% 1,812 +4.6%
Sep-2015 3,892 +1.3% 2,107 +11.0%
Oct-2015 3,740 +0.4% 2,042 +5.9%
Nov-2015 3,111 +1.9% 1,802 +11.7%
Dec-2015 2,349 -1.9% 1,370 +9.8%
Jan-2016 2,275 +0.8% 1,361 +6.9%
Feb-2016 2,282 +11.4% 1,342 +10.0%
Mar-2016 2,761 +22.8% 1,561 +14.0%
Apr-2016 3,028 +1.4% 1,530 -11.1%
May-2016 2,918 -17.4% 1,413 -27.1%
12-Month Avg 3,111 +0.7% 1,681 +1.8%
Historical Inventory of Homes for Sale by Month
The number of properties available for sale in active status at the end of a given month.
Current as of June 16, 2016. All data from MLS Property Information Network, Inc. Provided by the Greater Boston Association of REALTORS® and the Massachusetts Association of REALTORS®. Report © 2016 ShowingTime. | 7
3,666
2,011
3,533
1,937
2,918
1,413
Single-Family Condominium
May
0
2,000
4,000
6,000
8,000
10,000
1-2003 1-2004 1-2005 1-2006 1-2007 1-2008 1-2009 1-2010 1-2011 1-2012 1-2013 1-2014 1-2015 1-2016
Single-Family Condominium
2014 2015 2016
- 27.1%- 3.7%- 17.4%- 3.6%2014 2015 2016
+ 2.0% - 11.6%

Months Supply of Inventory
Months Supply Single-FamilyYear-Over-Year
Change CondominiumYear-Over-Year
Change
Jun-2015 3.4 0.0% 2.3 +9.5%
Jul-2015 3.4 +3.0% 2.2 +4.8%
Aug-2015 3.2 0.0% 2.1 +10.5%
Sep-2015 3.4 -2.9% 2.4 +14.3%
Oct-2015 3.3 -5.7% 2.3 +4.5%
Nov-2015 2.7 -3.6% 2.0 +11.1%
Dec-2015 2.0 -9.1% 1.5 +7.1%
Jan-2016 2.0 -4.8% 1.5 +7.1%
Feb-2016 2.0 +5.3% 1.5 +7.1%
Mar-2016 2.3 +9.5% 1.7 +6.3%
Apr-2016 2.5 -10.7% 1.7 -15.0%
May-2016 2.4 -27.3% 1.5 -34.8%
12-Month Avg* 2.7 -4.2% 1.9 +1.8%
Historical Months Supply of Inventory by Month
The inventory of homes for sale at the end of a given month, divided by the average monthly closed sales from the last 12 months.
* Months Supply for all properties from June 2015 through May 2016. This is not the average of the individual figures above.
Current as of June 16, 2016. All data from MLS Property Information Network, Inc. Provided by the Greater Boston Association of REALTORS® and the Massachusetts Association of REALTORS®. Report © 2016 ShowingTime. | 8
3.3
2.2
3.3
2.32.4
1.5
Single-Family Condominium
May
0.0
2.0
4.0
6.0
8.0
10.0
1-2004 1-2005 1-2006 1-2007 1-2008 1-2009 1-2010 1-2011 1-2012 1-2013 1-2014 1-2015 1-2016
Single-Family Condominium
2014 2015 2016
- 34.8%+ 4.5%- 27.3%0.0%2014 2015 2016
0.0% - 15.4%

Days on Market Until Sale
Days on Market Single-FamilyYear-Over-Year
Change CondominiumYear-Over-Year
Change
Jun-2015 52 +4.0% 39 -13.3%
Jul-2015 49 -2.0% 40 -18.4%
Aug-2015 54 +5.9% 45 -10.0%
Sep-2015 57 -6.6% 50 -2.0%
Oct-2015 64 +4.9% 50 0.0%
Nov-2015 61 -7.6% 56 +5.7%
Dec-2015 70 +1.4% 52 -5.5%
Jan-2016 74 -11.9% 58 -1.7%
Feb-2016 91 -3.2% 64 -13.5%
Mar-2016 80 -13.0% 60 -9.1%
Apr-2016 70 -10.3% 46 -22.0%
May-2016 58 -1.7% 46 +2.2%
12-Month Avg* 65 -2.8% 50 -8.0%
Historical Days on Market Until Sale by Month
Average number of days between when a property is listed and when an offer is accepted in a given month.
* Days on Market for all properties from June 2015 through May 2016. This is not the average of the individual figures above.
Current as of June 16, 2016. All data from MLS Property Information Network, Inc. Provided by the Greater Boston Association of REALTORS® and the Massachusetts Association of REALTORS®. Report © 2016 ShowingTime. | 9
5450
59
45
58
46
Single-Family Condominium
May
20
40
60
80
100
120
140
1-2003 1-2004 1-2005 1-2006 1-2007 1-2008 1-2009 1-2010 1-2011 1-2012 1-2013 1-2014 1-2015 1-2016
Single-Family Condominium
68
59
79
58
72
53
Single-Family Condominium
Year to Date
2014 2015 2016
+ 2.2%- 10.0%- 1.7%+ 9.3% - 1.7%- 8.9%+ 16.2% - 8.6%
2014 2015 2016 2014 2015 2016 2014 2015 2016
- 16.9% - 19.0% - 11.9%- 2.0%
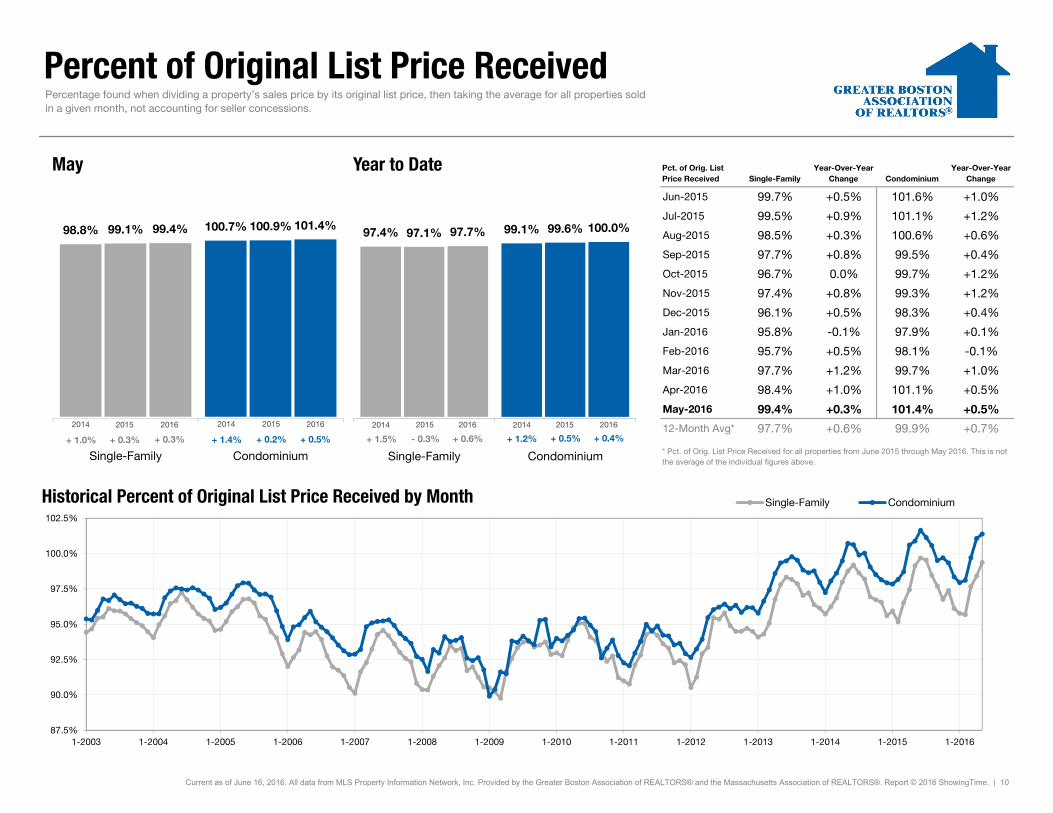
Percent of Original List Price Received
Pct. of Orig. List Price Received Single-Family
Year-Over-YearChange Condominium
Year-Over-YearChange
Jun-2015 99.7% +0.5% 101.6% +1.0%
Jul-2015 99.5% +0.9% 101.1% +1.2%
Aug-2015 98.5% +0.3% 100.6% +0.6%
Sep-2015 97.7% +0.8% 99.5% +0.4%
Oct-2015 96.7% 0.0% 99.7% +1.2%
Nov-2015 97.4% +0.8% 99.3% +1.2%
Dec-2015 96.1% +0.5% 98.3% +0.4%
Jan-2016 95.8% -0.1% 97.9% +0.1%
Feb-2016 95.7% +0.5% 98.1% -0.1%
Mar-2016 97.7% +1.2% 99.7% +1.0%
Apr-2016 98.4% +1.0% 101.1% +0.5%
May-2016 99.4% +0.3% 101.4% +0.5%
12-Month Avg* 97.7% +0.6% 99.9% +0.7%
Historical Percent of Original List Price Received by Month
Percentage found when dividing a property’s sales price by its original list price, then taking the average for all properties soldin a given month, not accounting for seller concessions.
* Pct. of Orig. List Price Received for all properties from June 2015 through May 2016. This is not the average of the individual figures above.
Current as of June 16, 2016. All data from MLS Property Information Network, Inc. Provided by the Greater Boston Association of REALTORS® and the Massachusetts Association of REALTORS®. Report © 2016 ShowingTime. | 10
98.8% 100.7%99.1% 100.9%99.4% 101.4%
Single-Family Condominium
May
87.5%
90.0%
92.5%
95.0%
97.5%
100.0%
102.5%
1-2003 1-2004 1-2005 1-2006 1-2007 1-2008 1-2009 1-2010 1-2011 1-2012 1-2013 1-2014 1-2015 1-2016
Single-Family Condominium
97.4% 99.1%97.1% 99.6%97.7% 100.0%
Single-Family Condominium
Year to Date
2014 2015 2016
+ 0.5%+ 0.2%+ 0.3%+ 0.3% + 0.5%+ 0.6%- 0.3% + 0.4%
2014 2015 2016 2014 2015 2016 2014 2015 2016
+ 1.0% + 1.5% + 1.2%+ 1.4%

Pending Sales
Pending Sales Single-FamilyYear-Over-Year
Change CondominiumYear-Over-Year
Change
Jun-2015 1,788 +15.4% 1,386 +18.0%
Jul-2015 1,287 +8.8% 964 +2.1%
Aug-2015 1,123 +15.4% 815 +11.8%
Sep-2015 1,215 +17.5% 861 +0.2%
Oct-2015 1,259 +8.2% 955 +14.2%
Nov-2015 952 +6.3% 723 +10.4%
Dec-2015 662 +12.4% 519 +12.1%
Jan-2016 686 -2.8% 652 +19.0%
Feb-2016 894 +41.5% 833 +46.9%
Mar-2016 1,450 +31.1% 1,141 +14.4%
Apr-2016 1,625 +5.0% 1,331 +4.5%
May-2016 1,868 +6.1% 1,337 +3.0%
12-Month Avg 1,234 +12.7% 960 +11.3%
Historical Pending Sales by Month
A count of the properties in UAG status between the first and last day in a given month, regardless of current status (based on Off Market Date).
Current as of June 16, 2016. All data from MLS Property Information Network, Inc. Provided by the Greater Boston Association of REALTORS® and the Massachusetts Association of REALTORS®. Report © 2016 ShowingTime. | 11
1,603
1,166
1,760
1,298
1,868
1,337
Single-Family Condominium
May
250
500
750
1,000
1,250
1,500
1,750
2,000
1-2003 1-2004 1-2005 1-2006 1-2007 1-2008 1-2009 1-2010 1-2011 1-2012 1-2013 1-2014 1-2015 1-2016
Single-Family Condominium
5,653
4,897
5,751
4,684
6,523
5,294
Single-Family Condominium
Year to Date
2014 2015 2016
+ 3.0%+ 11.3%+ 6.1%+ 9.8% - 4.3%+ 13.4%+ 1.7% + 13.0%
2014 2015 2016 2014 2015 2016 2014 2015 2016
- 7.6% - 11.0% - 8.4%- 12.8%

New Listings
New Listings Single-FamilyYear-Over-Year
Change CondominiumYear-Over-Year
Change
Jun-2015 2,270 +13.1% 1,567 +16.2%
Jul-2015 1,630 +13.0% 1,117 +3.6%
Aug-2015 1,331 +11.8% 936 +18.3%
Sep-2015 1,954 +8.3% 1,439 +12.7%
Oct-2015 1,525 +3.1% 1,154 +3.6%
Nov-2015 873 +17.5% 764 +26.7%
Dec-2015 555 +10.8% 462 +15.8%
Jan-2016 902 +7.4% 806 +13.7%
Feb-2016 1,126 +76.8% 938 +50.3%
Mar-2016 2,176 +45.6% 1,540 +21.8%
Apr-2016 2,129 -13.9% 1,472 -15.0%
May-2016 2,083 -17.7% 1,429 -14.0%
12-Month Avg 1,546 +8.2% 1,135 +8.1%
Historical New Listings by Month
A count of the properties that have been newly listed on the market in a given month.
Current as of June 16, 2016. All data from MLS Property Information Network, Inc. Provided by the Greater Boston Association of REALTORS® and the Massachusetts Association of REALTORS®. Report © 2016 ShowingTime. | 12
2,412
1,512
2,532
1,662
2,083
1,429
Single-Family Condominium
May
0
1,000
2,000
3,000
4,000
1-2003 1-2004 1-2005 1-2006 1-2007 1-2008 1-2009 1-2010 1-2011 1-2012 1-2013 1-2014 1-2015 1-2016
Single-Family Condominium
8,207
6,166
7,975
5,991
8,416
6,185
Single-Family Condominium
Year to Date
2014 2015 2016
- 14.0%+ 9.9%- 17.7%+ 5.0% - 2.8%+ 5.5%- 2.8% + 3.2%
2014 2015 2016 2014 2015 2016 2014 2015 2016
+ 3.5% - 3.2% - 9.0%- 7.7%

City of Boston - Market Overview
Historical Sparkbars 5-2015 5-2016 PercentChange YTD 2015 YTD 2016 Percent
Change
Current as of June 16, 2016. All data from MLS Property Information Network, Inc. Provided by the Greater Boston Association of REALTORS® and the Massachusetts Association of REALTORS®. Report © 2016 ShowingTime. | 13
+ 7.8%
3,096 + 1.2%
2,562
New Listings 837 779 - 6.9% 3,059
Pending Sales 667 706 + 5.8% 2,377
- 5.5%
Pct. of Orig. List Price Received 101.1% 100.6% - 0.5% 98.9% 99.3% + 0.4%
Days on Market Until Sale 40 44 + 10.0% 55 52
-- --
Inventory of Homes for Sale 989 798 - 19.3% --
Months Supply of Inventory 2.4 1.7 - 29.2% --
89 - 6.3%
----
Housing Affordability Index 87 83 - 4.6% 95
1,784 + 13.4%
Median Sales Price $550,000 $577,500 + 5.0% $502,000 $540,000 + 7.6%
1,573
Key market metrics for the current month and year-to-date figures for the City of Boston.
Closed Sales 474 507 + 7.0%
Key Metrics
May 2014 Nov 2014 May 2015 Nov 2015 May 2016
May 2014 Nov 2014 May 2015 Nov 2015 May 2016
May 2014 Nov 2014 May 2015 Nov 2015 May 2016
May 2014 Nov 2014 May 2015 Nov 2015 May 2016
May 2014 Nov 2014 May 2015 Nov 2015 May 2016
May 2014 Nov 2014 May 2015 Nov 2015 May 2016
May 2014 Nov 2014 May 2015 Nov 2015 May 2016
May 2014 Nov 2014 May 2015 Nov 2015 May 2016
May 2014 Nov 2014 May 2015 Nov 2015 May 2016

Regional Map
Central Middlesex Region Metro West RegionActon AshlandBedford DoverBoxboro FraminghamConcord HollistonHudson HopkintonLexington MedfieldLincoln MedwayMaynard MillisStow NatickSudbury NeedhamWayland SherbornWeston Wellesley
Eastern Middlesex Region Southern Norfolk RegionBurlington AvonMalden BellinghamMedford CantonMelrose FoxboroNorth Reading FranklinReading MansfieldStoneham NorfolkWakefield NorwoodWilmington RandolphWinchester SharonWoburn Stoughton
WalpoleMetro Boston Region WestwoodArlington WrenthamBelmontBostonBrooklineCambridgeChelseaDedhamEverettMiltonNewtonRevereSomervilleWalthamWatertownWinthrop
Current as of June 16, 2016. All data from MLS Property Information Network, Inc. Provided by the Greater Boston Association of REALTORS® and the Massachusetts Association of REALTORS®. Report © 2016 ShowingTime. | 14
A map of the the 64 areas and 5 regions that make up "Greater Boston."
Greater Boston Association of REALTORS® Regional Map
Communities by Region