may 29, 2001 - farallon consulting study and... · calibration procedures for pressure and...
TRANSCRIPT


G:\Projects\457 Capital Indust\457004 Plants 2 and 4 RIFS\Reports\Tidal Study&Slug Test\Tidal Study and Aquifer results ltr.docx
FIGURES
TIDAL STUDY AND
AQUIFER CHARACTERIZATION RESULTS
Capital Industries
5801 Third Avenue South
Seattle, Washington
Farallon PN: 457-004


G:\Projects\457 Capital Indust\457004 Plants 2 and 4 RIFS\Reports\Tidal Study&Slug Test\Tidal Study and Aquifer results ltr.docx
TABLES
TIDAL STUDY AND
AQUIFER CHARACTERIZATION RESULTS
Capital Industries
5801 Third Avenue South
Seattle, Washington
Farallon PN: 457-004


G:\Projects\457 Capital Indust\457004 Plants 2 and 4 RIFS\Reports\Tidal Study&Slug Test\Tidal Study and Aquifer results ltr.docx
ATTACHMENT A
MANUFACTURER SPECIFICATIONS FOR
DATA LOGGING INSTRUMENTS
TIDAL STUDY AND
AQUIFER CHARACTERIZATION RESULTS
Capital Industries
5801 Third Avenue South
Seattle, Washington
Farallon PN: 457-004

Innovations inWater Monitoring
Level TROLL® 700 InstrumentDesigned for aquifer characterization•Vented (gauged) and non-vented (absolute) instruments•Linear, fast linear, linear average, event, step linear, and true •logarithmic logging modesTitanium construction for all applications (0.72” OD)•
Level TROLL® 500 InstrumentDesigned for groundwater and surface-water monitoring •Vented or non-vented instrument•Linear, fast linear, and event logging modes•Titanium body ideal for harsh environments (0.72” OD)•
Level TROLL® 300 InstrumentDesigned for fresh water and industrial monitoring•Non-vented instrument•Linear, fast linear, and event logging modes•Stainless steel construction (0.82” OD)•
Powerful, Accurate, Reliable PerformanceLow-power consumption• – Extend deployments and get the only industry guarantee for battery life — minimum of 5 years or 2 million readings. External power or battery packs can be used.Telemetry and SCADA integration• – Access data when you need it. No adapters or confusing proprietary protocols required — fully compliant Modbus/RS485, SDI-12, and 4-20 mA.Superior accuracy• – Get guaranteed accuracy under all operating conditions — instruments undergo extensive calibration procedures for pressure and temperature. Each instrument includes a serialized calibration report.Intuitive interface• – Simplify data collection and management with Win-Situ® 5 and Win-Situ® Mobile software. Software features setup wizards, fast data download rates, multiple water level reference options, and more.
Level TROLL® Instruments
Applications
Water Level Instruments for Every Application & Budget
Aquifer characterization•Coastal deployments — tide/harbor levels, storm •surge systems, and wetlands researchConstruction and mine dewatering•River, lake, and reservoir monitoring•Stormwater management•

Call to purchase or rent — www.in-situ.com221 East Lincoln Avenue, Fort Collins, CO 805241-800-446-7488 (toll-free in US & Canada)1-970-498-1500 (international & domestic)Copyright © 2010 In-Situ Inc. All rights reserved. Sept. 2010
Level TROLL® 300, 500 & 700 Instruments
General Level TROLL 300 Level TROLL 500 Level TROLL 700 BaroTROLL
Temperature ranges Operational: -4-176° F (-20-80° C)Storage: -40-176° F (-40-80° C)Calibrated: 23-122° F (-5-50° C)
Operational: -4-176° F (-20-80° C)Storage: -40-176° F (-40-80° C)Calibrated: 23-122° F (-5-50° C)
Operational: -4-176° F (-20-80° C)Storage: -40-176° F (-40-80° C)Calibrated: 23-122° F (-5-50° C)
Operational: -4-176° F (-20-80° C)Storage: -40-176° F (-40-80° C)Calibrated: 23-122° F (-5-50° C)
Diameter 0.82 in (2.08 cm) 0.72 in (1.83 cm) 0.72 in (1.83 cm) 0.72 in (1.83 cm)
Length 9.0 in (22.9 cm) 8.5 in (21.6 cm) 8.5 in (21.6 cm) 8.5 in (21.6 cm)
Weight 0.54 lb (245 g) 0.43 lb (197 g) 0.43 lb (197 g) 0.43 lb (197 g)
Materials Stainless steel body; Delrin® nose cone Titanium body; Delrin nose cone Titanium body; Delrin nose cone Titanium body; Delrin nose cone
Output options Modbus/RS485, SDI-12, 4-20 mA Modbus/RS485, SDI-12, 4-20 mA Modbus/RS485, SDI-12, 4-20 mA Modbus/RS485, SDI-12, 4-20 mA
Battery type & life 3.6V lithium; 5 years or 2M readings1 3.6V lithium; 5 years or 2M readings1 3.6V lithium; 5 years or 2M readings1 3.6V lithium; 5 years or 2M readings1
External power 8-36 VDC 8-36 VDC 8-36 VDC 8-36 VDC
Measurement current 4 mA 4 mA 4 mA 4 mA
Sleep current 180 µA 180 µA 180 µA 180 µA
MemoryData records2
Data logs
1.0 MB65,0002
2.0 MB130,00050
4.0 MB260,00050
1.0 MB65,0002
Fastest logging rate & Modbus rate
2 per second 2 per second 4 per second 1 per minute
Fastest SDI-12 & 4-20 mA output rate
1 per second 1 per second 1 per second 1 per second
Log types Linear, Fast Linear, and Event Linear, Fast Linear, and Event Linear, Fast Linear, Linear Average, Event, Step Linear, True Logarithmic
Linear
Real-time clock Accurate to 1 second/24-hr period Accurate to 1 second/24-hr period Accurate to 1 second/24-hr period Accurate to 1 second/24-hr period
Sensor Type/Material Piezoresistive; stainless steel Piezoresistive; titanium Piezoresistive; titanium Piezoresistive; titanium
Range Non-vented30 psia: 35.8 ft (10.9 m)100 psia: 197.3 ft (60.1 m)300 psia: 658.7 ft (200.7 m)
Non-vented30 psia: 35.8 ft (10.9 m)100 psia: 197.3 ft (60.1 m)300 psia: 658.7 ft (200.7 m)500 psia: 1120 ft (341.3 m)
Vented5 psig: 11.5 ft (3.5 m)15 psig: 35 ft (11 m)30 psig: 69 ft (21 m)100 psig: 231 ft (70 m)300 psig: 692 ft (211 m)500 psig: 1153 ft (351 m)
Non-vented30 psia: 35.8 ft (10.9 m)100 psia: 197.3 ft (60.1 m)300 psia: 658.7 ft (200.7 m)500 psia: 1120 ft (341.3 m)1000 psia: 2306.4 ft (703 m)Vented5 psig: 11.5 ft (3.5 m)15 psig: 35 ft (11 m)30 psig: 69 ft (21 m)100 psig: 231 ft (70 m)300 psig: 692 ft (211 m)500 psig: 1153 ft (351 m)
0 to 16.5 psi; 0 to 1.14 bar
Burst pressure Maximum 2x range; burst 3x range Maximum 2x range; burst 3x range Maximum 2x range; burst 3x range Vaccum/over-pressure above 16.5 psi damages sensor
Accuracy @ 15° C ±0.1% full scale (FS) ±0.05% FS ±0.05% FS ±0.1% FS
Accuracy (FS) ±0.2% FS3 ±0.1% FS3 ±0.1% FS3 ±0.2% FS3
Resolution ±0.01% FS or better ±0.005% FS or better ±0.005% FS or better ±0.005% FS or better
Units of measure Pressure: psi, kPa, bar, mbar, mmHg, inHg, cmH2O, inH2OLevel: in, ft, mm, cm, m
Pressure: psi, kPa, bar, mbar, mmHg, inHg, cmH2O, inH2OLevel: in, ft, mm, cm, m
Pressure: psi, kPa, bar, mbar, mmHg, inHg, cmH2O, inH2OLevel: in, ft, mm, cm, m
Pressure: psi, kPa, bar, mbar, mmHg, inHg, cmH2O, inH2O
Temperature Sensor Silicon Silicon Silicon Silicon
Range Calibrated: 23-122° F (-5-50° C) Calibrated: 23-122° F (-5-50° C) Calibrated: 23-122° F (-5-50° C) Calibrated: 23-122° F (-5-50° C)
Accuracy & resolution ±0.1° C; 0.01° C or better ±0.1° C; 0.01° C or better ±0.1° C; 0.01° C or better ±0.1° C; 0.01° C or better
Units of measure Fahrenheit, Celsius Fahrenheit, Celsius Fahrenheit, Celsius Fahrenheit, Celsius
Warranty Level TROLL and BaroTROLL instruments come with a 1-year warranty. Up to 5-year extended warranties are available.
1 Battery life guaranteed when used within the factory-calibrated temperature range.2 1 record = date/time plus 2 parameters logged (no wrapping) from device within the factory-calibrated temperature range.3 Across factory-calibrated temperature range.
Specifications are subject to change without notice. Delrin is a registered trademark of E.I. du Pont de Nemours and Company.
BaroTROLL® InstrumentThe titanium BaroTROLL instrument measures and logs barometric pressure and temperature. Use the BaroTROLL in conjunction with Level TROLL instruments.
Win-Situ Baro Merge™ software simplifies post-correction of water level data. Barometric readings are automatically subtracted from data collected by a Level TROLL to compensate for changes in water level due to barometric fluctuations.
24/7 SupportIn-Situ technical experts assist with instrument setup, application support, and troubleshooting. Fast, friendly, and always free, technical answers are a phone call away.

G:\Projects\457 Capital Indust\457004 Plants 2 and 4 RIFS\Reports\Tidal Study&Slug Test\Tidal Study and Aquifer results ltr.docx
ATTACHMENT B
GRAPHS SHOWING GROUNDWATER ELEVATION
FLUCTUATIONS AND TIDAL FILTERING PROCESS
TIDAL STUDY AND
AQUIFER CHARACTERIZATION RESULTS
Capital Industries
5801 Third Avenue South
Seattle, Washington
Farallon PN: 457-004

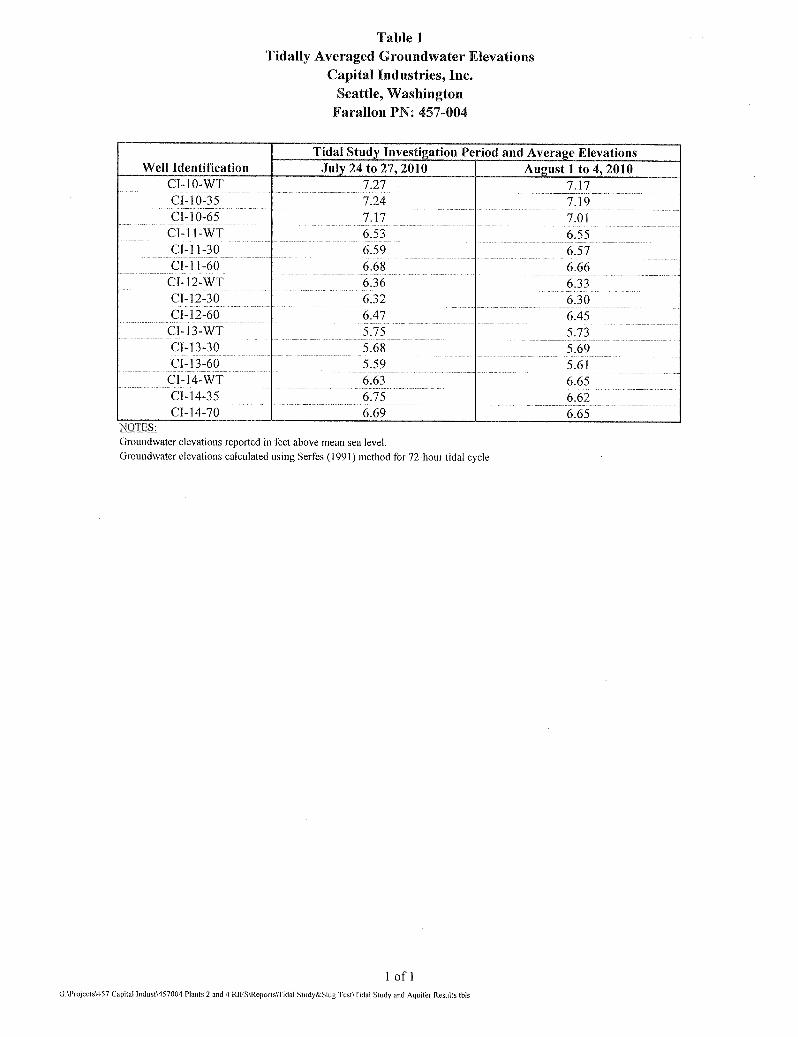
7.277.27
7.28
7.28
7.29
7.29
dwater Elevation
(ft msl)
Hydrograph Showing 72‐hour Tidal Filtering Process & Mean ElevationWell CI‐10‐WT(July 24 ‐ 27, 2010)
GW Elevation
Moving Average 1
Moving Average 2
7.27
7.25
7.26
7.26
7.27
7.27
7.28
7.28
7.29
7.29
7/24/10 0:00 7/24/10 12:00 7/25/10 0:00 7/25/10 12:00 7/26/10 0:00 7/26/10 12:00 7/27/10 0:00 7/27/10 12:00
Groun
dwater Elevation
(ft msl)
Date
Hydrograph Showing 72‐hour Tidal Filtering Process & Mean ElevationWell CI‐10‐WT(July 24 ‐ 27, 2010)
GW Elevation
Moving Average 1
Moving Average 2
Mean Elevation

7.177.18
7.19
7.20
7.21
7.22
7.23
dwater Elevation
(ft msl)
Hydrograph Showing 72‐hour Tidal Filtering Process & Mean ElevationWell CI‐10‐WT(August 1‐4, 2010)
GW Elev
Moving Average 1
Moving Average 27.17
7.14
7.15
7.16
7.17
7.18
7.19
7.20
7.21
7.22
7.23
8/1/10 0:00 8/1/10 12:00 8/2/10 0:00 8/2/10 12:00 8/3/10 0:00 8/3/10 12:00 8/4/10 0:00 8/4/10 12:00
Groun
dwater Elevation
(ft msl)
Date
Hydrograph Showing 72‐hour Tidal Filtering Process & Mean ElevationWell CI‐10‐WT(August 1‐4, 2010)
GW Elev
Moving Average 1
Moving Average 2
Mean Elevation

7.24
7.24
7.25
7.25
7.26
7.26
7.27
7.27
dwater Elevation
(ft msl)
Hydrograph Showing 72‐hour Tidal Filtering Process & Mean ElevationWell CI‐10‐35
(July 24 ‐ 27, 2010)
GW Elevation
Moving Average 1
Moving Average 2
7.24
7.22
7.23
7.23
7.24
7.24
7.25
7.25
7.26
7.26
7.27
7.27
7/24/10 0:00 7/24/10 12:00 7/25/10 0:00 7/25/10 12:00 7/26/10 0:00 7/26/10 12:00 7/27/10 0:00 7/27/10 12:00
Groun
dwater Elevation
(ft msl)
Date
Hydrograph Showing 72‐hour Tidal Filtering Process & Mean ElevationWell CI‐10‐35
(July 24 ‐ 27, 2010)
GW Elevation
Moving Average 1
Moving Average 2
Mean Elevation

7.19
7.19
7.19
7.20
7.20
7.21
7.21
dwater Elevation
(ft msl)
Hydrograph Showing 72‐hour Tidal Filtering Process & Mean ElevationWell CI‐10‐35
(August 1‐4, 2010)
GW Elev
Moving Average 1
Moving Average 2
7.19
7.17
7.17
7.18
7.18
7.19
7.19
7.20
7.20
7.21
7.21
8/1/10 0:00 8/1/10 12:00 8/2/10 0:00 8/2/10 12:00 8/3/10 0:00 8/3/10 12:00 8/4/10 0:00 8/4/10 12:00
Groun
dwater Elevation
(ft msl)
Date
Hydrograph Showing 72‐hour Tidal Filtering Process & Mean ElevationWell CI‐10‐35
(August 1‐4, 2010)
GW Elev
Moving Average 1
Moving Average 2
Mean Elevation

7.17
7.16
7.18
7.20
7.22
7.24
7.26
7.28
dwater Elevation
(ft msl)
Hydrograph Showing 72‐hour Tidal Filtering Process & Mean ElevationWell CI‐10‐65
(July 24 ‐ 27, 2010)
GW Elevation
Moving Average 1
Moving Average 2
7.17
7.08
7.10
7.12
7.14
7.16
7.18
7.20
7.22
7.24
7.26
7.28
7/24/10 0:00 7/24/10 12:00 7/25/10 0:00 7/25/10 12:00 7/26/10 0:00 7/26/10 12:00 7/27/10 0:00 7/27/10 12:00
Groun
dwater Elevation
(ft msl)
Date
Hydrograph Showing 72‐hour Tidal Filtering Process & Mean ElevationWell CI‐10‐65
(July 24 ‐ 27, 2010)
GW Elevation
Moving Average 1
Moving Average 2
Mean Elevation

7.01
7.05
7.10
7.15
7.20
dwater Elevation
(ft msl)
Hydrograph Showing 72‐hour Tidal Filtering Process & Mean ElevationWell CI‐10‐65
(August 1‐4, 2010)
GW Elev
Moving Average 1
Moving Average 27.01
6.90
6.95
7.00
7.05
7.10
7.15
7.20
8/1/10 0:00 8/1/10 12:00 8/2/10 0:00 8/2/10 12:00 8/3/10 0:00 8/3/10 12:00 8/4/10 0:00 8/4/10 12:00
Groun
dwater Elevation
(ft msl)
Date
Hydrograph Showing 72‐hour Tidal Filtering Process & Mean ElevationWell CI‐10‐65
(August 1‐4, 2010)
GW Elev
Moving Average 1
Moving Average 2
Mean Elevation

6.53
6.4
6.5
6.6
6.7
6.8
6.9
dwater Elevation
(ft msl)
Hydrograph Showing 72‐hour Tidal Filtering Process & Mean ElevationWell CI‐11‐WT(July 24 ‐ 27, 2010)
GW Elevation
Moving Average 1
Moving Average 2
6.53
6.0
6.1
6.2
6.3
6.4
6.5
6.6
6.7
6.8
6.9
7/24/10 0:00 7/24/10 12:00 7/25/10 0:00 7/25/10 12:00 7/26/10 0:00 7/26/10 12:00 7/27/10 0:00 7/27/10 12:00
Groun
dwater Elevation
(ft msl)
Date
Hydrograph Showing 72‐hour Tidal Filtering Process & Mean ElevationWell CI‐11‐WT(July 24 ‐ 27, 2010)
GW Elevation
Moving Average 1
Moving Average 2
Mean Elevation

6.55
6.5
6.6
6.7
6.8
6.9
dwater Elevation
(ft msl)
Hydrograph Showing 72‐hour Tidal Filtering Process & Mean ElevationWell CI‐11‐WT(August 1‐4, 2010)
GW Elev
Moving Average 1
Moving Average 2
6.55
6.2
6.3
6.4
6.5
6.6
6.7
6.8
6.9
8/1/10 0:00 8/1/10 12:00 8/2/10 0:00 8/2/10 12:00 8/3/10 0:00 8/3/10 12:00 8/4/10 0:00 8/4/10 12:00
Groun
dwater Elevation
(ft msl)
Date
Hydrograph Showing 72‐hour Tidal Filtering Process & Mean ElevationWell CI‐11‐WT(August 1‐4, 2010)
GW Elev
Moving Average 1
Moving Average 2
Mean Elevation

6.59
6.4
6.6
6.8
7.0
7.2
dwater Elevation
(ft msl)
Hydrograph Showing 72‐hour Tidal Filtering Process & Mean ElevationWell CI‐11‐30
(July 24 ‐ 27, 2010)
GW Elevation
Moving Average 1
Moving Average 2
6.59
5.8
6.0
6.2
6.4
6.6
6.8
7.0
7.2
7/24/10 0:00 7/24/10 12:00 7/25/10 0:00 7/25/10 12:00 7/26/10 0:00 7/26/10 12:00 7/27/10 0:00 7/27/10 12:00
Groun
dwater Elevation
(ft msl)
Date
Hydrograph Showing 72‐hour Tidal Filtering Process & Mean ElevationWell CI‐11‐30
(July 24 ‐ 27, 2010)
GW Elevation
Moving Average 1
Moving Average 2
Mean Elevation

6.57
6.5
6.6
6.7
6.8
6.9
7.0
7.1
dwater Elevation
(ft msl)
Hydrograph Showing 72‐hour Tidal Filtering Process & Mean ElevationWell CI‐11‐30
(August 1‐4, 2010)
GW Elev
Moving Average 1
Moving Average 2
6.57
6.0
6.1
6.2
6.3
6.4
6.5
6.6
6.7
6.8
6.9
7.0
7.1
8/1/10 0:00 8/1/10 12:00 8/2/10 0:00 8/2/10 12:00 8/3/10 0:00 8/3/10 12:00 8/4/10 0:00 8/4/10 12:00
Groun
dwater Elevation
(ft msl)
Date
Hydrograph Showing 72‐hour Tidal Filtering Process & Mean ElevationWell CI‐11‐30
(August 1‐4, 2010)
GW Elev
Moving Average 1
Moving Average 2
Mean Elevation

6.68
6.4
6.6
6.8
7.0
7.2
dwater Elevation
(ft msl)
Hydrograph Showing 72‐hour Tidal Filtering Process & Mean ElevationWell CI‐11‐60
(July 24 ‐ 27, 2010)
GW Elevation
Moving Average 1
Moving Average 2
6.68
5.8
6.0
6.2
6.4
6.6
6.8
7.0
7.2
7/24/10 0:00 7/24/10 12:00 7/25/10 0:00 7/25/10 12:00 7/26/10 0:00 7/26/10 12:00 7/27/10 0:00 7/27/10 12:00
Groun
dwater Elevation
(ft msl)
Date
Hydrograph Showing 72‐hour Tidal Filtering Process & Mean ElevationWell CI‐11‐60
(July 24 ‐ 27, 2010)
GW Elevation
Moving Average 1
Moving Average 2
Mean Elevation

6.66
6.6
6.7
6.8
6.9
7.0
7.1
7.2
dwater Elevation
(ft msl)
Hydrograph Showing 72‐hour Tidal Filtering Process & Mean ElevationWell CI‐11‐60
(August 1‐4, 2010)
GW Elev
Moving Average 1
Moving Average 2
6.66
6.1
6.2
6.3
6.4
6.5
6.6
6.7
6.8
6.9
7.0
7.1
7.2
8/1/10 0:00 8/1/10 12:00 8/2/10 0:00 8/2/10 12:00 8/3/10 0:00 8/3/10 12:00 8/4/10 0:00 8/4/10 12:00
Groun
dwater Elevation
(ft msl)
Date
Hydrograph Showing 72‐hour Tidal Filtering Process & Mean ElevationWell CI‐11‐60
(August 1‐4, 2010)
GW Elev
Moving Average 1
Moving Average 2
Mean Elevation

6.36
6.3
6.4
6.5
6.6
dwater Elevation
(ft msl)
Hydrograph Showing 72‐hour Tidal Filtering Process & Mean ElevationWell CI‐12‐WT(July 24 ‐ 27, 2010)
GW Elevation
Moving Average 1
Moving Average 2
6.36
6.0
6.1
6.2
6.3
6.4
6.5
6.6
7/24/10 0:00 7/24/10 12:00 7/25/10 0:00 7/25/10 12:00 7/26/10 0:00 7/26/10 12:00 7/27/10 0:00 7/27/10 12:00
Groun
dwater Elevation
(ft msl)
Date
Hydrograph Showing 72‐hour Tidal Filtering Process & Mean ElevationWell CI‐12‐WT(July 24 ‐ 27, 2010)
GW Elevation
Moving Average 1
Moving Average 2
Mean Elevation

6.33
6.3
6.4
6.5
6.6
dwater Elevation
(ft msl)
Hydrograph Showing 72‐hour Tidal Filtering Process & Mean ElevationWell CI‐12‐WT(August 1‐4, 2010)
GW Elev
Moving Average 1
Moving Average 2
6.33
6.0
6.1
6.2
6.3
6.4
6.5
6.6
8/1/10 0:00 8/1/10 12:00 8/2/10 0:00 8/2/10 12:00 8/3/10 0:00 8/3/10 12:00 8/4/10 0:00 8/4/10 12:00
Groun
dwater Elevation
(ft msl)
Date
Hydrograph Showing 72‐hour Tidal Filtering Process & Mean ElevationWell CI‐12‐WT(August 1‐4, 2010)
GW Elev
Moving Average 1
Moving Average 2
Mean Elevation

6.32
6.2
6.3
6.4
6.5
6.6
dwater Elevation
(ft msl)
Hydrograph Showing 72‐hour Tidal Filtering Process & Mean ElevationWell CI‐12‐30
(July 24 ‐ 27, 2010)
GW Elevation
Moving Average 1
Moving Average 2
6.32
5.9
6.0
6.1
6.2
6.3
6.4
6.5
6.6
7/24/10 0:00 7/24/10 12:00 7/25/10 0:00 7/25/10 12:00 7/26/10 0:00 7/26/10 12:00 7/27/10 0:00 7/27/10 12:00
Groun
dwater Elevation
(ft msl)
Date
Hydrograph Showing 72‐hour Tidal Filtering Process & Mean ElevationWell CI‐12‐30
(July 24 ‐ 27, 2010)
GW Elevation
Moving Average 1
Moving Average 2
Mean Elevation

6.306.3
6.4
6.5
6.6
6.7
dwater Elevation
(ft msl)
Hydrograph Showing 72‐hour Tidal Filtering Process & Mean ElevationWell CI‐12‐30
(August 1‐4, 2010)
GW Elev
Moving Average 1
Moving Average 2
6.30
6.0
6.1
6.2
6.3
6.4
6.5
6.6
6.7
8/1/10 0:00 8/1/10 12:00 8/2/10 0:00 8/2/10 12:00 8/3/10 0:00 8/3/10 12:00 8/4/10 0:00 8/4/10 12:00
Groun
dwater Elevation
(ft msl)
Date
Hydrograph Showing 72‐hour Tidal Filtering Process & Mean ElevationWell CI‐12‐30
(August 1‐4, 2010)
GW Elev
Moving Average 1
Moving Average 2
Mean Elevation

6.47
6.4
6.5
6.6
6.7
6.8
dwater Elevation
(ft msl)
Hydrograph Showing 72‐hour Tidal Filtering Process & Mean ElevationWell CI‐12‐60
(July 24 ‐ 27, 2010)
GW Elevation
Moving Average 1
Moving Average 2
6.47
6.1
6.2
6.3
6.4
6.5
6.6
6.7
6.8
7/24/10 0:00 7/24/10 12:00 7/25/10 0:00 7/25/10 12:00 7/26/10 0:00 7/26/10 12:00 7/27/10 0:00 7/27/10 12:00
Groun
dwater Elevation
(ft msl)
Date
Hydrograph Showing 72‐hour Tidal Filtering Process & Mean ElevationWell CI‐12‐60
(July 24 ‐ 27, 2010)
GW Elevation
Moving Average 1
Moving Average 2
Mean Elevation

6.45
6.4
6.5
6.6
6.7
dwater Elevation
(ft msl)
Hydrograph Showing 72‐hour Tidal Filtering Process & Mean ElevationWell CI‐12‐60
(August 1‐4, 2010)
GW Elev
Moving Average 1
Moving Average 2
6.45
6.1
6.2
6.3
6.4
6.5
6.6
6.7
8/1/10 0:00 8/1/10 12:00 8/2/10 0:00 8/2/10 12:00 8/3/10 0:00 8/3/10 12:00 8/4/10 0:00 8/4/10 12:00
Groun
dwater Elevation
(ft msl)
Date
Hydrograph Showing 72‐hour Tidal Filtering Process & Mean ElevationWell CI‐12‐60
(August 1‐4, 2010)
GW Elev
Moving Average 1
Moving Average 2
Mean Elevation
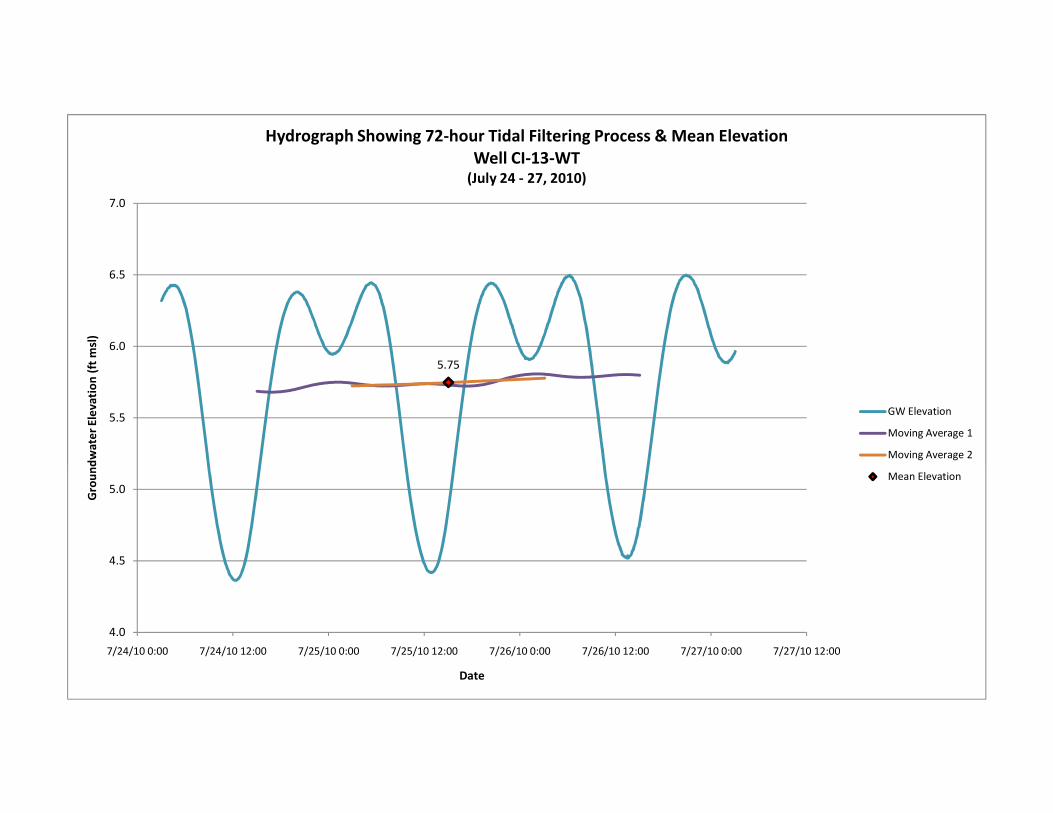
5.75
5.5
6.0
6.5
7.0
dwater Elevation
(ft msl)
Hydrograph Showing 72‐hour Tidal Filtering Process & Mean ElevationWell CI‐13‐WT(July 24 ‐ 27, 2010)
GW Elevation
Moving Average 1
Moving Average 2
5.75
4.0
4.5
5.0
5.5
6.0
6.5
7.0
7/24/10 0:00 7/24/10 12:00 7/25/10 0:00 7/25/10 12:00 7/26/10 0:00 7/26/10 12:00 7/27/10 0:00 7/27/10 12:00
Groun
dwater Elevation
(ft msl)
Date
Hydrograph Showing 72‐hour Tidal Filtering Process & Mean ElevationWell CI‐13‐WT(July 24 ‐ 27, 2010)
GW Elevation
Moving Average 1
Moving Average 2
Mean Elevation

5.73
5.5
6.0
6.5
7.0
dwater Elevation
(ft msl)
Hydrograph Showing 72‐hour Tidal Filtering Process & Mean ElevationWell CI‐13‐WT(August 1‐4, 2010)
GW Elevation
Moving Average 1
Moving Average 2
5.73
4.0
4.5
5.0
5.5
6.0
6.5
7.0
8/1/10 0:00 8/1/10 12:00 8/2/10 0:00 8/2/10 12:00 8/3/10 0:00 8/3/10 12:00 8/4/10 0:00 8/4/10 12:00
Groun
dwater Elevation
(ft msl)
Date
Hydrograph Showing 72‐hour Tidal Filtering Process & Mean ElevationWell CI‐13‐WT(August 1‐4, 2010)
GW Elevation
Moving Average 1
Moving Average 2
Mean Elevation

5.68
5.5
6.0
6.5
7.0
dwater Elevation
(ft msl)
Hydrograph Showing 72‐hour Tidal Filtering Process & Mean ElevationWell CI‐13‐30
(July 24 ‐ 27, 2010)
GW Elevation
Moving Average 1
Moving Average 2
5.68
4.0
4.5
5.0
5.5
6.0
6.5
7.0
7/24/10 0:00 7/24/10 12:00 7/25/10 0:00 7/25/10 12:00 7/26/10 0:00 7/26/10 12:00 7/27/10 0:00 7/27/10 12:00
Groun
dwater Elevation
(ft msl)
Date
Hydrograph Showing 72‐hour Tidal Filtering Process & Mean ElevationWell CI‐13‐30
(July 24 ‐ 27, 2010)
GW Elevation
Moving Average 1
Moving Average 2
Mean Elevation

5.69
5.5
6.0
6.5
7.0
dwater Elevation
(ft msl)
Hydrograph Showing 72‐hour Tidal Filtering Process & Mean ElevationWell CI‐13‐30
(August 1‐4, 2010)
GW Elev
Moving Average 1
Moving Average 2
5.69
4.0
4.5
5.0
5.5
6.0
6.5
7.0
8/1/10 0:00 8/1/10 12:00 8/2/10 0:00 8/2/10 12:00 8/3/10 0:00 8/3/10 12:00 8/4/10 0:00 8/4/10 12:00
Groun
dwater Elevation
(ft msl)
Date
Hydrograph Showing 72‐hour Tidal Filtering Process & Mean ElevationWell CI‐13‐30
(August 1‐4, 2010)
GW Elev
Moving Average 1
Moving Average 2
Mean Elevation

5.59
5.0
5.5
6.0
6.5
7.0
dwater Elevation
(ft msl)
Hydrograph Showing 72‐hour Tidal Filtering Process & Mean ElevationWell CI‐13‐60
(July 24 ‐ 27, 2010)
GW Elevation
Moving Average 1
Moving Average 2
5.59
3.0
3.5
4.0
4.5
5.0
5.5
6.0
6.5
7.0
7/24/10 0:00 7/24/10 12:00 7/25/10 0:00 7/25/10 12:00 7/26/10 0:00 7/26/10 12:00 7/27/10 0:00 7/27/10 12:00
Groun
dwater Elevation
(ft msl)
Date
Hydrograph Showing 72‐hour Tidal Filtering Process & Mean ElevationWell CI‐13‐60
(July 24 ‐ 27, 2010)
GW Elevation
Moving Average 1
Moving Average 2
Mean Elevation

5.61
5.5
6.0
6.5
7.0
7.5
dwater Elevation
(ft msl)
Hydrograph Showing 72‐hour Tidal Filtering Process & Mean ElevationWell CI‐13‐60
(August 1‐4, 2010)
GW Elev
Moving Average 1
Moving Average 2
5.61
3.5
4.0
4.5
5.0
5.5
6.0
6.5
7.0
7.5
8/1/10 0:00 8/1/10 12:00 8/2/10 0:00 8/2/10 12:00 8/3/10 0:00 8/3/10 12:00 8/4/10 0:00 8/4/10 12:00
Groun
dwater Elevation
(ft msl)
Date
Hydrograph Showing 72‐hour Tidal Filtering Process & Mean ElevationWell CI‐13‐60
(August 1‐4, 2010)
GW Elev
Moving Average 1
Moving Average 2
Mean Elevation

6.63
6.6
6.7
6.8
6.9
7.0
dwater Elevation
(ft msl)
Hydrograph Showing 72‐hour Tidal Filtering Process & Mean ElevationWell CI‐14‐WT(July 24 ‐ 27, 2010)
GW Elevation
Moving Average 1
Moving Average 2
6.63
6.3
6.4
6.5
6.6
6.7
6.8
6.9
7.0
7/24/10 0:00 7/24/10 12:00 7/25/10 0:00 7/25/10 12:00 7/26/10 0:00 7/26/10 12:00 7/27/10 0:00 7/27/10 12:00
Groun
dwater Elevation
(ft msl)
Date
Hydrograph Showing 72‐hour Tidal Filtering Process & Mean ElevationWell CI‐14‐WT(July 24 ‐ 27, 2010)
GW Elevation
Moving Average 1
Moving Average 2
Mean Elevation

6.656.7
6.7
6.8
6.8
dwater Elevation
(ft msl)
Hydrograph Showing 72‐hour Tidal Filtering Process & Mean ElevationWell CI‐14‐WT(August 1‐4, 2010)
GW Elev
Moving Average 1
Moving Average 2
6.65
6.5
6.6
6.6
6.7
6.7
6.8
6.8
8/1/10 0:00 8/1/10 12:00 8/2/10 0:00 8/2/10 12:00 8/3/10 0:00 8/3/10 12:00 8/4/10 0:00 8/4/10 12:00
Groun
dwater Elevation
(ft msl)
Date
Hydrograph Showing 72‐hour Tidal Filtering Process & Mean ElevationWell CI‐14‐WT(August 1‐4, 2010)
GW Elev
Moving Average 1
Moving Average 2
Mean Elevation

6.75
6.7
6.8
6.8
6.9
6.9
dwater Elevation
(ft msl)
Hydrograph Showing 72‐hour Tidal Filtering Process & Mean ElevationWell CI‐14‐35
(July 24 ‐ 27, 2010)
GW Elevation
Moving Average 1
Moving Average 2
6.75
6.6
6.6
6.7
6.7
6.8
6.8
6.9
6.9
7/24/10 0:00 7/24/10 12:00 7/25/10 0:00 7/25/10 12:00 7/26/10 0:00 7/26/10 12:00 7/27/10 0:00 7/27/10 12:00
Groun
dwater Elevation
(ft msl)
Date
Hydrograph Showing 72‐hour Tidal Filtering Process & Mean ElevationWell CI‐14‐35
(July 24 ‐ 27, 2010)
GW Elevation
Moving Average 1
Moving Average 2
Mean Elevation

6.626.7
6.7
6.8
6.8
6.9
dwater Elevation
(ft msl)
Hydrograph Showing 72‐hour Tidal Filtering Process & Mean ElevationWell CI‐14‐35
(August 1‐4, 2010)
GW Elev
Moving Average 1
Moving Average 2
6.62
6.5
6.5
6.6
6.6
6.7
6.7
6.8
6.8
6.9
8/1/10 0:00 8/1/10 12:00 8/2/10 0:00 8/2/10 12:00 8/3/10 0:00 8/3/10 12:00 8/4/10 0:00 8/4/10 12:00
Groun
dwater Elevation
(ft msl)
Date
Hydrograph Showing 72‐hour Tidal Filtering Process & Mean ElevationWell CI‐14‐35
(August 1‐4, 2010)
GW Elev
Moving Average 1
Moving Average 2
Mean Elevation

6.69
6.6
6.7
6.8
6.9
7.0
dwater Elevation
(ft msl)
Hydrograph Showing 72‐hour Tidal Filtering Process & Mean ElevationWell CI‐14‐70
(July 24 ‐ 27, 2010)
GW Elevation
Moving Average 1
Moving Average 2
6.69
6.2
6.3
6.4
6.5
6.6
6.7
6.8
6.9
7.0
7/24/10 0:00 7/24/10 12:00 7/25/10 0:00 7/25/10 12:00 7/26/10 0:00 7/26/10 12:00 7/27/10 0:00 7/27/10 12:00
Groun
dwater Elevation
(ft msl)
Date
Hydrograph Showing 72‐hour Tidal Filtering Process & Mean ElevationWell CI‐14‐70
(July 24 ‐ 27, 2010)
GW Elevation
Moving Average 1
Moving Average 2
Mean Elevation

6.65
6.6
6.7
6.8
6.9
7.0
dwater Elevation
(ft msl)
Hydrograph Showing 72‐hour Tidal Filtering Process & Mean ElevationWell CI‐14‐70
(August 1‐4, 2010)
GW Elev
Moving Average 1
Moving Average 2
6.65
6.3
6.4
6.5
6.6
6.7
6.8
6.9
7.0
8/1/10 0:00 8/1/10 12:00 8/2/10 0:00 8/2/10 12:00 8/3/10 0:00 8/3/10 12:00 8/4/10 0:00 8/4/10 12:00
Groun
dwater Elevation
(ft msl)
Date
Hydrograph Showing 72‐hour Tidal Filtering Process & Mean ElevationWell CI‐14‐70
(August 1‐4, 2010)
GW Elev
Moving Average 1
Moving Average 2
Mean Elevation
G:\Projects\457 Capital Indust\457004 Plants 2 and 4 RIFS\Reports\Tidal Study&Slug Test\Tidal Study and Aquifer results ltr.docx
ATTACHMENT C
ROSE DIAGRAMS SHOWING GROUNDWATER FLOW
DIRECTION AND RELATIVE FREQUENCY OF FLOW
TIDAL STUDY AND
AQUIFER CHARACTERIZATION RESULTS
Capital Industries
5801 Third Avenue South
Seattle, Washington
Farallon PN: 457-004

0
90
180
270
North
South
West East
Rose Diagram Showing Frequency of Groundwater Flow Direction in Water Table Zone July 24 -27, 2010 Wells CI-11-WT, CI-13-WT & CI-14-WT Capital Tidal Investigation

0
90
180
270
North
South
West East
Rose Diagram Showing Frequency of Groundwater Flow Direction in Water Table Zone August 1-4, 2010 Wells CI-11-WT, CI-13-WT & CI-14-WT Capital Tidal Investigation

Rose Diagram Showing Frequency of Groundwater Flow Direction in Shallow Zone July 24 -27, 2010 Wells CI-11-30, CI-13-30 & CI-14-35 Capital Tidal Investigation
90
180
270
North
South
West East

0
90
180
270
Rose Diagram Showing Frequency of Groundwater Flow Direction in Shallow Zone August 1-4, 2010 Wells CI-11-30, CI-13-30 & CI-14-35 Capital Tidal Investigation
North
South
West East

North
South
West East
0
90
180
270
Rose Diagram Showing Frequency of Groundwater Flow Direction in Intermediate Zone July 24 -27, 2010 Wells CI-11-60, CI-13-60 & CI-14-70 Capital Tidal Investigation

0
90
180
270
North
South
West East
Rose Diagram Showing Frequency of Groundwater Flow Direction in Intermediate Zone August 1-4, 2010 Wells CI-11-60, CI-13-60 & CI-14-70 Capital Tidal Investigation

G:\Projects\457 Capital Indust\457004 Plants 2 and 4 RIFS\Reports\Tidal Study&Slug Test\Tidal Study and Aquifer results ltr.docx
ATTACHMENT D
SLUG TEST ANALYSIS PLOTS
TIDAL STUDY AND
AQUIFER CHARACTERIZATION RESULTS
Capital Industries
5801 Third Avenue South
Seattle, Washington
Farallon PN: 457-004

0. 2. 4. 6. 8. 10.0.001
0.01
0.1
1.
Time (sec)
Nor
mal
ized
Hea
d (ft
/ft)
SLUG TEST RESULTS FOR MW-8 (RISING HEAD)
Data Set: N:\Farallon\Capital Industries\Slug Testing Aug 2010\Aqtesolv Files\MW-8.aqtDate: 01/21/11 Time: 15:28:05
PROJECT INFORMATION
Company: Farallon ConsultingClient: CapitalTest Well: MW-8Test Date: 8-6-10
AQUIFER DATA
Saturated Thickness: 62.07 ft Anisotropy Ratio (Kz/Kr): 1.
WELL DATA (MW-8)
Initial Displacement: 3.15 ft Static Water Column Height: 12.07 ftTotal Well Penetration Depth: 20. ft Screen Length: 10. ftCasing Radius: 0.083 ft Well Radius: 0.083 ft
Gravel Pack Porosity: 0.3
SOLUTION
Aquifer Model: Unconfined Solution Method: Bouwer-Rice
K = 99.79 ft/day y0 = 1.7 ft

0. 4. 8. 12. 16. 20.-1.
-0.6
-0.2
0.2
0.6
1.
Time (sec)
Nor
mal
ized
Hea
d (ft
/ft)
SLUG TEST RESULTS FOR CI-8-40 (FALLING HEAD)
Data Set: N:\Farallon\Capital Industries\Slug Testing Aug 2010\Aqtesolv Files\CI-8-40.aqtDate: 01/21/11 Time: 15:28:27
PROJECT INFORMATION
Company: Farallon ConsultingClient: CapitalTest Well: CI-8-40Test Date: 8-6-10
AQUIFER DATA
Saturated Thickness: 62.32 ft Anisotropy Ratio (Kz/Kr): 1.
WELL DATA (CI-8-40)
Initial Displacement: 1.77 ft Static Water Column Height: 32.32 ftTotal Well Penetration Depth: 40. ft Screen Length: 10. ftCasing Radius: 0.083 ft Well Radius: 0.083 ft
SOLUTION
Aquifer Model: Unconfined Solution Method: Springer-Gelhar
K = 213. ft/day Le = 8.556 ft

0. 16. 32. 48. 64. 80.0.01
0.1
1.
Time (sec)
Nor
mal
ized
Hea
d (ft
/ft)
SLUG TEST RESULTS FOR CI-8-60 (RISING HEAD)
Data Set: N:\Farallon\Capital Industries\Slug Testing Aug 2010\Aqtesolv Files\CI-8-60.aqtDate: 01/21/11 Time: 15:28:42
PROJECT INFORMATION
Company: Farallon ConsultingClient: CapitalTest Well: CI-8-40Test Date: 8-6-10
AQUIFER DATA
Saturated Thickness: 62.23 ft Anisotropy Ratio (Kz/Kr): 1.
WELL DATA (CI-8-60)
Initial Displacement: 2.05 ft Static Water Column Height: 52.23 ftTotal Well Penetration Depth: 60. ft Screen Length: 10. ftCasing Radius: 0.083 ft Well Radius: 0.083 ft
SOLUTION
Aquifer Model: Unconfined Solution Method: Bouwer-Rice
K = 10.06 ft/day y0 = 1.573 ft

0. 1.8 3.6 5.4 7.2 9.-1.
-0.6
-0.2
0.2
0.6
1.
Time (sec)
Nor
mal
ized
Hea
d (ft
/ft)
SLUG TEST RESULTS FOR CI-9-WT (RISING HEAD)
Data Set: N:\...\CI-9-WT RisingHead-Short.aqtDate: 01/21/11 Time: 15:29:20
PROJECT INFORMATION
Company: Farallon ConsultingClient: CapitalTest Date: 8-6-10
AQUIFER DATA
Saturated Thickness: 62.11 ft Anisotropy Ratio (Kz/Kr): 1.
WELL DATA (CI-9-WT)
Initial Displacement: 1.53 ft Static Water Column Height: 12.11 ftTotal Well Penetration Depth: 20. ft Screen Length: 10. ftCasing Radius: 0.083 ft Well Radius: 0.083 ft
Gravel Pack Porosity: 0.3
SOLUTION
Aquifer Model: Unconfined Solution Method: Springer-Gelhar
K = 135.1 ft/day Le = 8.4 ft

0. 1.8 3.6 5.4 7.2 9.-1.
-0.6
-0.2
0.2
0.6
1.
Time (sec)
Nor
mal
ized
Hea
d (ft
/ft)
SLUG TEST RESULTS FOR CI-9-WT (FALLING HEAD)
Data Set: N:\Farallon\Capital Industries\Slug Testing Aug 2010\Aqtesolv Files\CI-9-WT FallingHead.aqtDate: 01/21/11 Time: 15:29:40
PROJECT INFORMATION
Company: Farallon ConsultingClient: CapitalTest Date: 8-6-10
AQUIFER DATA
Saturated Thickness: 62.11 ft Anisotropy Ratio (Kz/Kr): 1.
WELL DATA (CI-9-WT )
Initial Displacement: 3.12 ft Static Water Column Height: 12.11 ftTotal Well Penetration Depth: 20. ft Screen Length: 10. ftCasing Radius: 0.083 ft Well Radius: 0.083 ft
Gravel Pack Porosity: 0.3
SOLUTION
Aquifer Model: Unconfined Solution Method: Springer-Gelhar
K = 356.5 ft/day Le = 2.173 ft

0. 4. 8. 12. 16. 20.0.001
0.01
0.1
1.
Time (sec)
Nor
mal
ized
Hea
d (ft
/ft)
SLUG TEST RESULTS FOR CI-9-40 (RISING HEAD)
Data Set: N:\Farallon\Capital Industries\Slug Testing Aug 2010\Aqtesolv Files\CI-9-40 RisingHead.aqtDate: 01/21/11 Time: 15:30:09
PROJECT INFORMATION
Company: Farallon ConsultingClient: CapitalTest Date: 8-6-10
AQUIFER DATA
Saturated Thickness: 62.14 ft Anisotropy Ratio (Kz/Kr): 1.
WELL DATA (CI-9-40 )
Initial Displacement: 1.76 ft Static Water Column Height: 32.14 ftTotal Well Penetration Depth: 40. ft Screen Length: 10. ftCasing Radius: 0.083 ft Well Radius: 0.083 ft
SOLUTION
Aquifer Model: Unconfined Solution Method: Bouwer-Rice
K = 25.52 ft/day y0 = 1.302 ft

0. 16. 32. 48. 64. 80.0.001
0.01
0.1
1.
Time (sec)
Nor
mal
ized
Hea
d (ft
/ft)
SLUG TEST RESULTS FOR CI-9-70 (RISING HEAD)
Data Set: N:\Farallon\Capital Industries\Slug Testing Aug 2010\Aqtesolv Files\CI-9-70 RisingHead.aqtDate: 01/21/11 Time: 15:30:32
PROJECT INFORMATION
Company: Farallon ConsultingClient: CapitalTest Date: 8-6-10
AQUIFER DATA
Saturated Thickness: 62.1 ft Anisotropy Ratio (Kz/Kr): 1.
WELL DATA (CI-9-70)
Initial Displacement: 4.36 ft Static Water Column Height: 62.1 ftTotal Well Penetration Depth: 70. ft Screen Length: 10. ftCasing Radius: 0.083 ft Well Radius: 0.083 ft
SOLUTION
Aquifer Model: Unconfined Solution Method: Bouwer-Rice
K = 10.19 ft/day y0 = 1.47 ft

0. 1.2 2.4 3.6 4.8 6.1.0E-4
0.001
0.01
0.1
1.
Time (sec)
Nor
mal
ized
Hea
d (ft
/ft)
SLUG TEST RESULTS FOR CI-10-WT (RISING HEAD)
Data Set: N:\...\CI-10-WT RisingHead.aqtDate: 01/21/11 Time: 15:30:54
PROJECT INFORMATION
Company: Farallon ConsultingClient: CapitalTest Date: 8-6-10
AQUIFER DATA
Saturated Thickness: 61.5 ft Anisotropy Ratio (Kz/Kr): 1.
WELL DATA (CI-10-WT)
Initial Displacement: 4.34 ft Static Water Column Height: 11.5 ftTotal Well Penetration Depth: 20. ft Screen Length: 10. ftCasing Radius: 0.083 ft Well Radius: 0.083 ft
Gravel Pack Porosity: 0.3
SOLUTION
Aquifer Model: Unconfined Solution Method: Bouwer-Rice
K = 96.5 ft/day y0 = 0.9909 ft

0. 10. 20. 30. 40. 50.-1.
-0.6
-0.2
0.2
0.6
1.
Time (sec)
Nor
mal
ized
Hea
d (ft
/ft)
SLUG TEST RESULTS FOR CI-10-WT (FALLING HEAD)
Data Set: N:\...\CI-10-WT FallingHead.aqtDate: 01/21/11 Time: 15:34:56
PROJECT INFORMATION
Company: Farallon ConsultingClient: CapitalTest Date: 8-6-10
AQUIFER DATA
Saturated Thickness: 61.5 ft Anisotropy Ratio (Kz/Kr): 1.
WELL DATA (CI-10-WT)
Initial Displacement: 4.32 ft Static Water Column Height: 11.5 ftTotal Well Penetration Depth: 20. ft Screen Length: 10. ftCasing Radius: 0.083 ft Well Radius: 0.083 ft
Gravel Pack Porosity: 0.3
SOLUTION
Aquifer Model: Unconfined Solution Method: Springer-Gelhar
K = 92.8 ft/day Le = 8.282 ft

0. 4. 8. 12. 16. 20.0.001
0.01
0.1
1.
Time (sec)
Nor
mal
ized
Hea
d (ft
/ft)
SLUG TEST RESULTS FOR CI-10-35 (RISING HEAD)
Data Set: N:\Farallon\Capital Industries\Slug Testing Aug 2010\Aqtesolv Files\CI-10-35 RisingHead.aqtDate: 01/21/11 Time: 15:35:21
PROJECT INFORMATION
Company: Farallon ConsultingClient: CapitalTest Date: 8-6-10
AQUIFER DATA
Saturated Thickness: 61.46 ft Anisotropy Ratio (Kz/Kr): 1.
WELL DATA (CI-10-35 )
Initial Displacement: 2.78 ft Static Water Column Height: 26.46 ftTotal Well Penetration Depth: 35. ft Screen Length: 10. ftCasing Radius: 0.083 ft Well Radius: 0.083 ft
SOLUTION
Aquifer Model: Unconfined Solution Method: Bouwer-Rice
K = 39.11 ft/day y0 = 0.5545 ft
0. 2. 4. 6. 8. 10.0.001
0.01
0.1
1.
Time (sec)
Nor
mal
ized
Hea
d (ft
/ft)
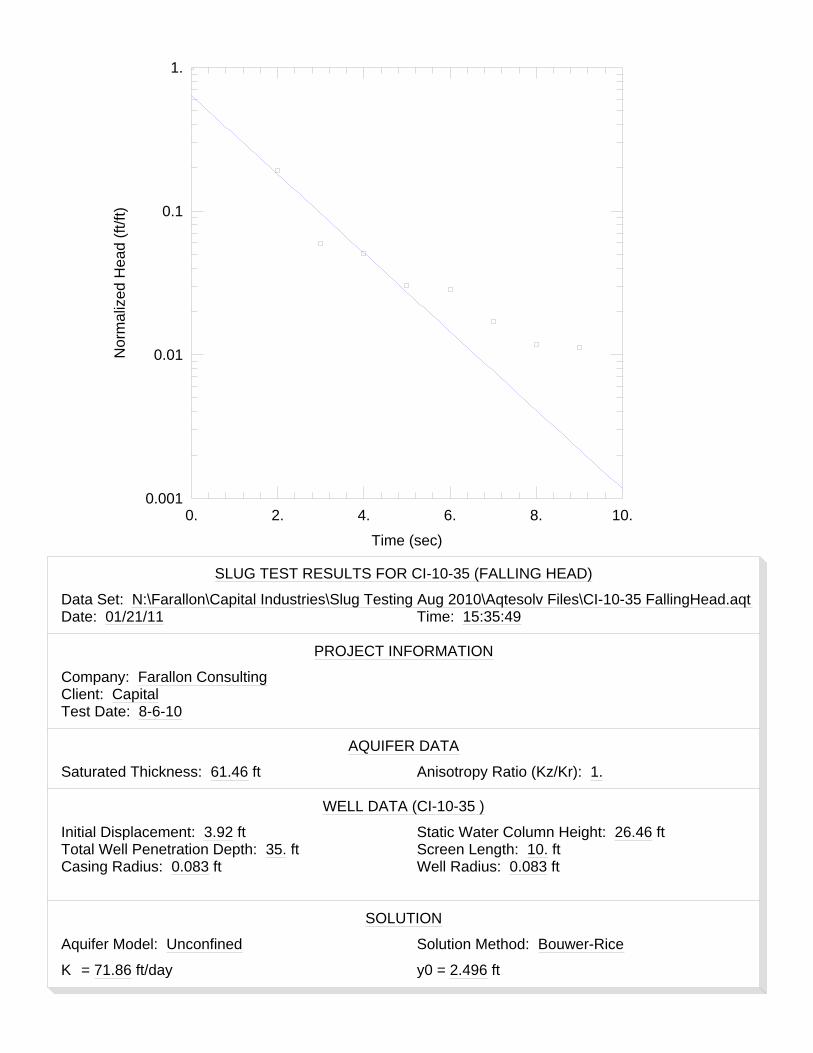
SLUG TEST RESULTS FOR CI-10-35 (FALLING HEAD)
Data Set: N:\Farallon\Capital Industries\Slug Testing Aug 2010\Aqtesolv Files\CI-10-35 FallingHead.aqtDate: 01/21/11 Time: 15:35:49
PROJECT INFORMATION
Company: Farallon ConsultingClient: CapitalTest Date: 8-6-10
AQUIFER DATA
Saturated Thickness: 61.46 ft Anisotropy Ratio (Kz/Kr): 1.
WELL DATA (CI-10-35 )
Initial Displacement: 3.92 ft Static Water Column Height: 26.46 ftTotal Well Penetration Depth: 35. ft Screen Length: 10. ftCasing Radius: 0.083 ft Well Radius: 0.083 ft
SOLUTION
Aquifer Model: Unconfined Solution Method: Bouwer-Rice
K = 71.86 ft/day y0 = 2.496 ft

0. 10. 20. 30. 40. 50.0.001
0.01
0.1
1.
Time (sec)
Nor
mal
ized
Hea
d (ft
/ft)
SLUG TEST RESULTS FOR CI-10-65 (RISING HEAD)
Data Set: N:\Farallon\Capital Industries\Slug Testing Aug 2010\Aqtesolv Files\CI-10-65 RisingHead.aqtDate: 01/21/11 Time: 15:36:10
PROJECT INFORMATION
Company: Farallon ConsultingClient: CapitalTest Date: 8-6-10
AQUIFER DATA
Saturated Thickness: 61.4 ft Anisotropy Ratio (Kz/Kr): 1.
WELL DATA (CI-10-65 )
Initial Displacement: 9.82 ft Static Water Column Height: 56.4 ftTotal Well Penetration Depth: 65. ft Screen Length: 15. ftCasing Radius: 0.083 ft Well Radius: 0.083 ft
SOLUTION
Aquifer Model: Unconfined Solution Method: Bouwer-Rice
K = 10.58 ft/day y0 = 1.18 ft

0. 12. 24. 36. 48. 60.0.01
0.1
1.
Time (sec)
Nor
mal
ized
Hea
d (ft
/ft)
SLUG TEST RESULTS FOR CI-10-65 (FALLING HEAD)
Data Set: N:\Farallon\Capital Industries\Slug Testing Aug 2010\Aqtesolv Files\CI-10-65 FallingHead.aqtDate: 01/21/11 Time: 15:36:30
PROJECT INFORMATION
Company: Farallon ConsultingClient: CapitalTest Date: 8-6-10
AQUIFER DATA
Saturated Thickness: 61.4 ft Anisotropy Ratio (Kz/Kr): 1.
WELL DATA (CI-10-65 )
Initial Displacement: 2.3 ft Static Water Column Height: 56.4 ftTotal Well Penetration Depth: 65. ft Screen Length: 15. ftCasing Radius: 0.083 ft Well Radius: 0.083 ft
SOLUTION
Aquifer Model: Unconfined Solution Method: Bouwer-Rice
K = 9.423 ft/day y0 = 1.097 ft

0. 4. 8. 12. 16. 20.0.001
0.01
0.1
1.
Time (sec)
Nor
mal
ized
Hea
d (ft
/ft)
SLUG TEST RESULTS FOR CI-14-WT (RISING HEAD)
Data Set: N:\...\CI-14-WT RisingHead.aqtDate: 01/21/11 Time: 15:36:52
PROJECT INFORMATION
Company: Farallon ConsultingClient: CapitalTest Date: 8-6-10
AQUIFER DATA
Saturated Thickness: 61.54 ft Anisotropy Ratio (Kz/Kr): 1.
WELL DATA (CI-14-WT)
Initial Displacement: 3.54 ft Static Water Column Height: 11.54 ftTotal Well Penetration Depth: 20. ft Screen Length: 10. ftCasing Radius: 0.083 ft Well Radius: 0.083 ft
Gravel Pack Porosity: 0.3
SOLUTION
Aquifer Model: Unconfined Solution Method: Bouwer-Rice
K = 40.87 ft/day y0 = 0.5165 ft

0. 4. 8. 12. 16. 20.0.001
0.01
0.1
1.
Time (sec)
Nor
mal
ized
Hea
d (ft
/ft)
SLUG TEST RESULTS FOR CI-14-WT (FALLING HEAD)
Data Set: N:\...\CI-14-WT FallingHead.aqtDate: 01/21/11 Time: 15:37:11
PROJECT INFORMATION
Company: Farallon ConsultingClient: CapitalTest Date: 8-6-10
AQUIFER DATA
Saturated Thickness: 61.54 ft Anisotropy Ratio (Kz/Kr): 1.
WELL DATA (CI-14-WT)
Initial Displacement: 3.97 ft Static Water Column Height: 11.54 ftTotal Well Penetration Depth: 20. ft Screen Length: 10. ftCasing Radius: 0.083 ft Well Radius: 0.083 ft
Gravel Pack Porosity: 0.3
SOLUTION
Aquifer Model: Unconfined Solution Method: Bouwer-Rice
K = 53.37 ft/day y0 = 1.112 ft

0. 2. 4. 6. 8. 10.1.0E-4
0.001
0.01
0.1
1.
Time (sec)
Nor
mal
ized
Hea
d (ft
/ft)
SLUG TEST RESULTS FOR CI-14-35 (RISING HEAD)
Data Set: N:\Farallon\Capital Industries\Slug Testing Aug 2010\Aqtesolv Files\CI-14-35 RisingHead.aqtDate: 01/21/11 Time: 15:37:29
PROJECT INFORMATION
Company: Farallon ConsultingClient: CapitalTest Date: 8-6-10
AQUIFER DATA
Saturated Thickness: 61.44 ft Anisotropy Ratio (Kz/Kr): 1.
WELL DATA (CI-14-35)
Initial Displacement: 3.7 ft Static Water Column Height: 26.44 ftTotal Well Penetration Depth: 35. ft Screen Length: 10. ftCasing Radius: 0.083 ft Well Radius: 0.083 ft
SOLUTION
Aquifer Model: Unconfined Solution Method: Bouwer-Rice
K = 114.4 ft/day y0 = 1.707 ft

0. 4. 8. 12. 16. 20.0.001
0.01
0.1
1.
Time (sec)
Nor
mal
ized
Hea
d (ft
/ft)
SLUG TEST RESULTS FOR CI-14-35 (FALLING HEAD)
Data Set: N:\Farallon\Capital Industries\Slug Testing Aug 2010\Aqtesolv Files\CI-14-35 FallingHead.aqtDate: 01/21/11 Time: 15:37:52
PROJECT INFORMATION
Company: Farallon ConsultingClient: CapitalTest Date: 8-6-10
AQUIFER DATA
Saturated Thickness: 61.44 ft Anisotropy Ratio (Kz/Kr): 1.
WELL DATA (CI-14-35)
Initial Displacement: 2.29 ft Static Water Column Height: 26.44 ftTotal Well Penetration Depth: 35. ft Screen Length: 10. ftCasing Radius: 0.083 ft Well Radius: 0.083 ft
SOLUTION
Aquifer Model: Unconfined Solution Method: Hvorslev
K = 78.4 ft/day y0 = 1.696 ft

0. 24. 48. 72. 96. 120.0.01
0.1
1.
Time (sec)
Nor
mal
ized
Hea
d (ft
/ft)
SLUG TEST RESULTS FOR CI-14-70 (RISING HEAD)
Data Set: N:\Farallon\Capital Industries\Slug Testing Aug 2010\Aqtesolv Files\CI-14-70 RisingHead.aqtDate: 01/21/11 Time: 15:38:26
PROJECT INFORMATION
Company: Farallon ConsultingClient: CapitalTest Date: 8-6-10
AQUIFER DATA
Saturated Thickness: 61.3 ft Anisotropy Ratio (Kz/Kr): 1.
WELL DATA (CI-14-70)
Initial Displacement: 6.55 ft Static Water Column Height: 61.3 ftTotal Well Penetration Depth: 70. ft Screen Length: 10. ftCasing Radius: 0.083 ft Well Radius: 0.083 ft
SOLUTION
Aquifer Model: Unconfined Solution Method: Bouwer-Rice
K = 3.305 ft/day y0 = 1.769 ft

0. 40. 80. 120. 160. 200.0.01
0.1
1.
Time (sec)
Nor
mal
ized
Hea
d (ft
/ft)
SLUG TEST RESULTS FOR CI-14-70 (FALLING HEAD)
Data Set: N:\Farallon\Capital Industries\Slug Testing Aug 2010\Aqtesolv Files\CI-14-70 FallingHead.aqtDate: 01/21/11 Time: 15:38:52
PROJECT INFORMATION
Company: Farallon ConsultingClient: CapitalTest Date: 8-6-10
AQUIFER DATA
Saturated Thickness: 61.3 ft Anisotropy Ratio (Kz/Kr): 1.
WELL DATA (CI-14-70)
Initial Displacement: 3.01 ft Static Water Column Height: 61.3 ftTotal Well Penetration Depth: 70. ft Screen Length: 10. ftCasing Radius: 0.083 ft Well Radius: 0.083 ft
SOLUTION
Aquifer Model: Unconfined Solution Method: Bouwer-Rice
K = 2.898 ft/day y0 = 1.588 ft

G:\Projects\457 Capital Indust\457004 Plants 2 and 4 RIFS\Reports\Tidal Study&Slug Test\Tidal Study and Aquifer results ltr.docx
ATTACHMENT E
REFERENCES
TIDAL STUDY AND
AQUIFER CHARACTERIZATION RESULTS
Capital Industries
5801 Third Avenue South
Seattle, Washington
Farallon PN: 457-004
