maybank indonesia · operating income after provision 2,028 1,745 16.2% 636 727 -12.6% non...
TRANSCRIPT
Maybank Indonesia
Financial Results
9M 2017 ended 30 September 2017
www.maybank.co.id
Humanising Financial Services
Table of Contents
Summary of 9M 2017 Results 3
Financial Performance 5
Maybank Indonesia in Brief 19
Awards and Events Highlights 25
Summary of 9M 2017 Results
Page 4
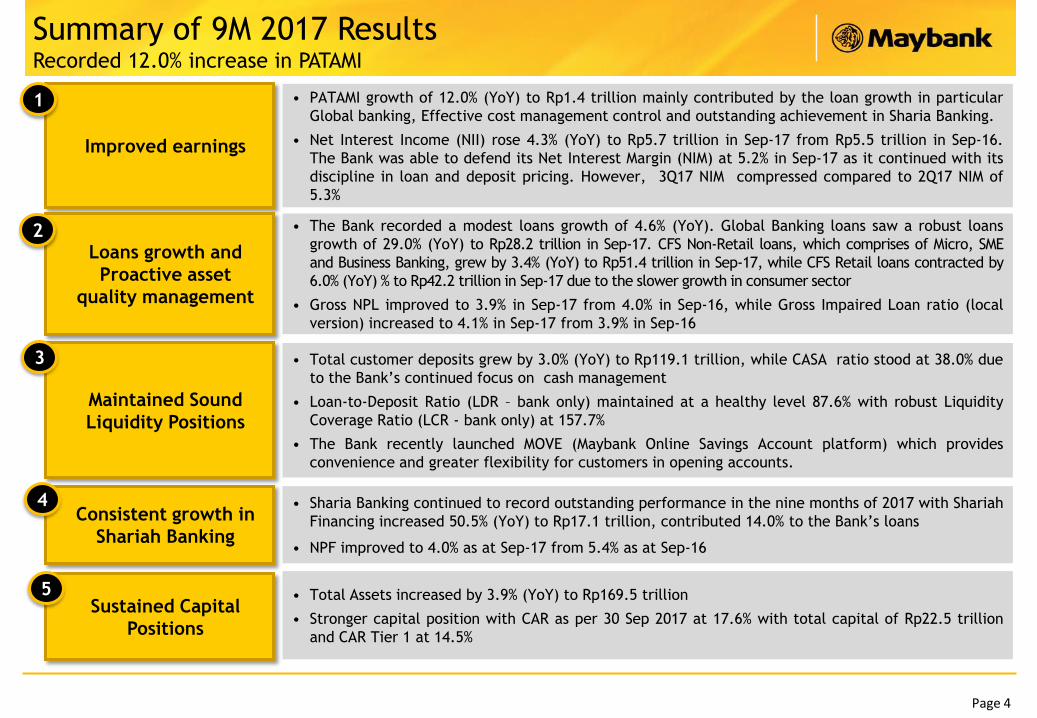
Summary of 9M 2017 ResultsRecorded 12.0% increase in PATAMI
Improved earnings
• PATAMI growth of 12.0% (YoY) to Rp1.4 trillion mainly contributed by the loan growth in particular
Global banking, Effective cost management control and outstanding achievement in Sharia Banking.
• Net Interest Income (NII) rose 4.3% (YoY) to Rp5.7 trillion in Sep-17 from Rp5.5 trillion in Sep-16.
The Bank was able to defend its Net Interest Margin (NIM) at 5.2% in Sep-17 as it continued with its
discipline in loan and deposit pricing. However, 3Q17 NIM compressed compared to 2Q17 NIM of
5.3%
• The Bank recorded a modest loans growth of 4.6% (YoY). Global Banking loans saw a robust loans
growth of 29.0% (YoY) to Rp28.2 trillion in Sep-17. CFS Non-Retail loans, which comprises of Micro, SME
and Business Banking, grew by 3.4% (YoY) to Rp51.4 trillion in Sep-17, while CFS Retail loans contracted by
6.0% (YoY) % to Rp42.2 trillion in Sep-17 due to the slower growth in consumer sector
• Gross NPL improved to 3.9% in Sep-17 from 4.0% in Sep-16, while Gross Impaired Loan ratio (local
version) increased to 4.1% in Sep-17 from 3.9% in Sep-16
• Total customer deposits grew by 3.0% (YoY) to Rp119.1 trillion, while CASA ratio stood at 38.0% due
to the Bank‟s continued focus on cash management
• Loan-to-Deposit Ratio (LDR – bank only) maintained at a healthy level 87.6% with robust Liquidity
Coverage Ratio (LCR - bank only) at 157.7%
• The Bank recently launched MOVE (Maybank Online Savings Account platform) which provides
convenience and greater flexibility for customers in opening accounts.
1
Loans growth and
Proactive asset
quality management
Maintained Sound
Liquidity Positions
2
3
• Sharia Banking continued to record outstanding performance in the nine months of 2017 with Shariah
Financing increased 50.5% (YoY) to Rp17.1 trillion, contributed 14.0% to the Bank‟s loans
• NPF improved to 4.0% as at Sep-17 from 5.4% as at Sep-16
Consistent growth in
Shariah Banking
4
• Total Assets increased by 3.9% (YoY) to Rp169.5 trillion
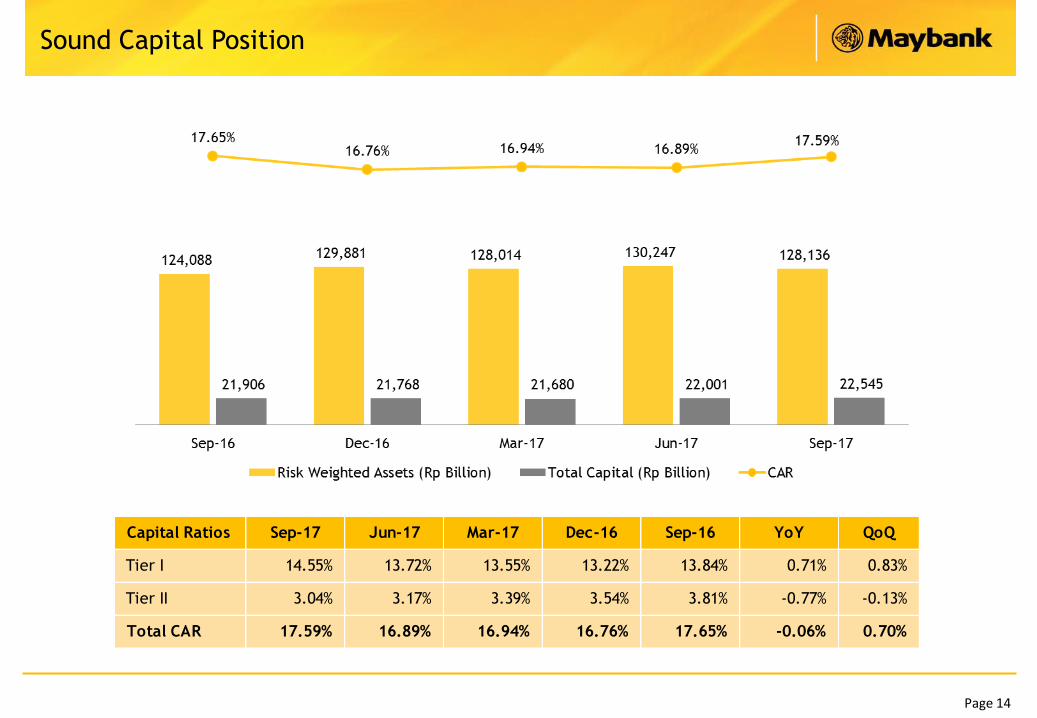
• Stronger capital position with CAR as per 30 Sep 2017 at 17.6% with total capital of Rp22.5 trillion
and CAR Tier 1 at 14.5%
Sustained Capital
Positions
5
Financial Performance
Page 6
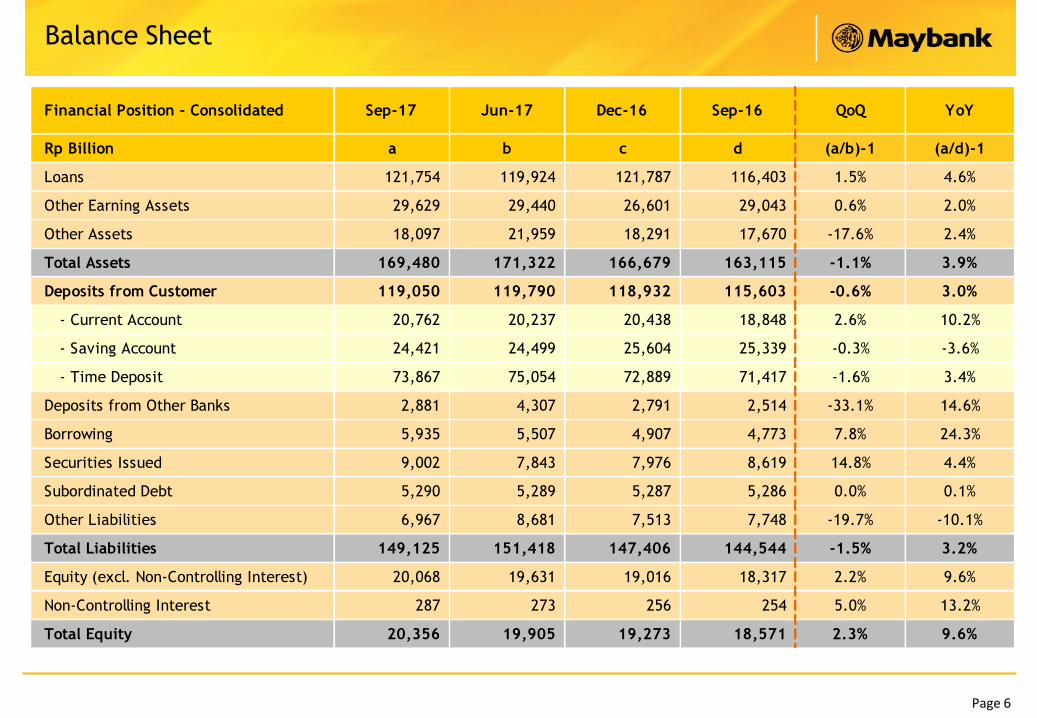
Balance Sheet
Financial Position - Consolidated Sep-17 Jun-17 Dec-16 Sep-16 QoQ YoY
Rp Billion a b c d (a/b)-1 (a/d)-1
Loans 121,754 119,924 121,787 116,403 1.5% 4.6%
Other Earning Assets 29,629 29,440 26,601 29,043 0.6% 2.0%
Other Assets 18,097 21,959 18,291 17,670 -17.6% 2.4%
Total Assets 169,480 171,322 166,679 163,115 -1.1% 3.9%
Deposits from Customer 119,050 119,790 118,932 115,603 -0.6% 3.0%
- Current Account 20,762 20,237 20,438 18,848 2.6% 10.2%
- Saving Account 24,421 24,499 25,604 25,339 -0.3% -3.6%
- Time Deposit 73,867 75,054 72,889 71,417 -1.6% 3.4%
Deposits from Other Banks 2,881 4,307 2,791 2,514 -33.1% 14.6%
Borrowing 5,935 5,507 4,907 4,773 7.8% 24.3%
Securities Issued 9,002 7,843 7,976 8,619 14.8% 4.4%
Subordinated Debt 5,290 5,289 5,287 5,286 0.0% 0.1%
Other Liabilities 6,967 8,681 7,513 7,748 -19.7% -10.1%
Total Liabilities 149,125 151,418 147,406 144,544 -1.5% 3.2%
Equity (excl. Non-Controlling Interest) 20,068 19,631 19,016 18,317 2.2% 9.6%
Non-Controlling Interest 287 273 256 254 5.0% 13.2%
Total Equity 20,356 19,905 19,273 18,571 2.3% 9.6%
Page 7
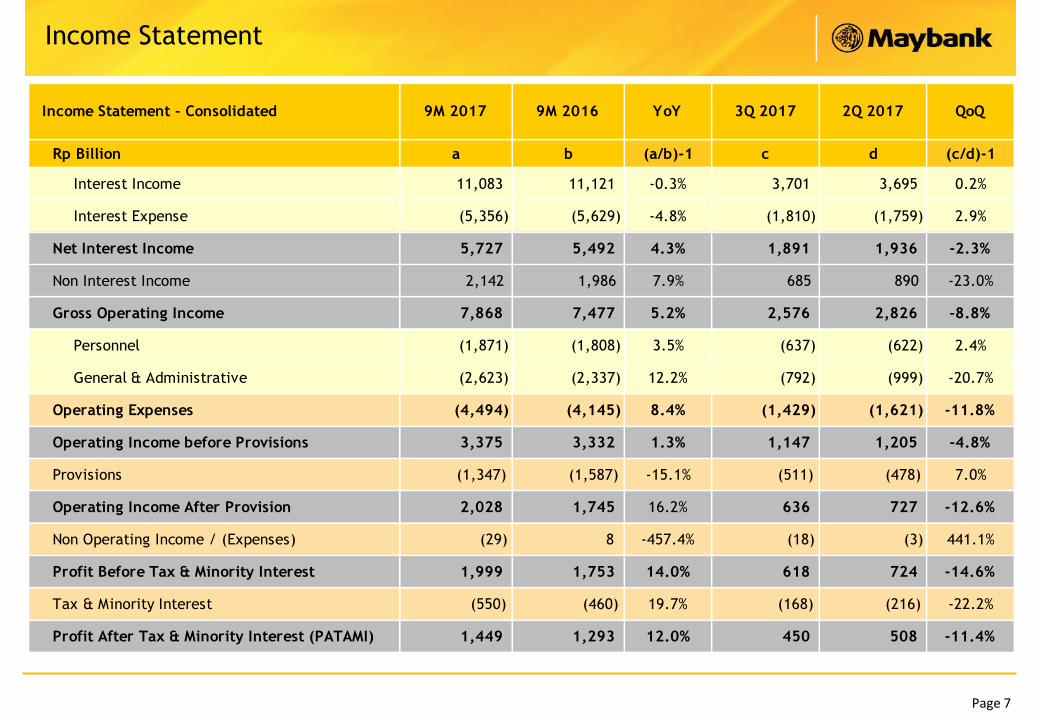
Income Statement
Income Statement - Consolidated 9M 2017 9M 2016 YoY 3Q 2017 2Q 2017 QoQ
Rp Billion a b (a/b)-1 c d (c/d)-1
Interest Income 11,083 11,121 -0.3% 3,701 3,695 0.2%
Interest Expense (5,356) (5,629) -4.8% (1,810) (1,759) 2.9%
Net Interest Income 5,727 5,492 4.3% 1,891 1,936 -2.3%
Non Interest Income 2,142 1,986 7.9% 685 890 -23.0%
Gross Operating Income 7,868 7,477 5.2% 2,576 2,826 -8.8%
Personnel (1,871) (1,808) 3.5% (637) (622) 2.4%
General & Administrative (2,623) (2,337) 12.2% (792) (999) -20.7%
Operating Expenses (4,494) (4,145) 8.4% (1,429) (1,621) -11.8%
Operating Income before Provisions 3,375 3,332 1.3% 1,147 1,205 -4.8%
Provisions (1,347) (1,587) -15.1% (511) (478) 7.0%
Operating Income After Provision 2,028 1,745 16.2% 636 727 -12.6%
Non Operating Income / (Expenses) (29) 8 -457.4% (18) (3) 441.1%
Profit Before Tax & Minority Interest 1,999 1,753 14.0% 618 724 -14.6%
Tax & Minority Interest (550) (460) 19.7% (168) (216) -22.2%
Profit After Tax & Minority Interest (PATAMI) 1,449 1,293 12.0% 450 508 -11.4%
Page 8
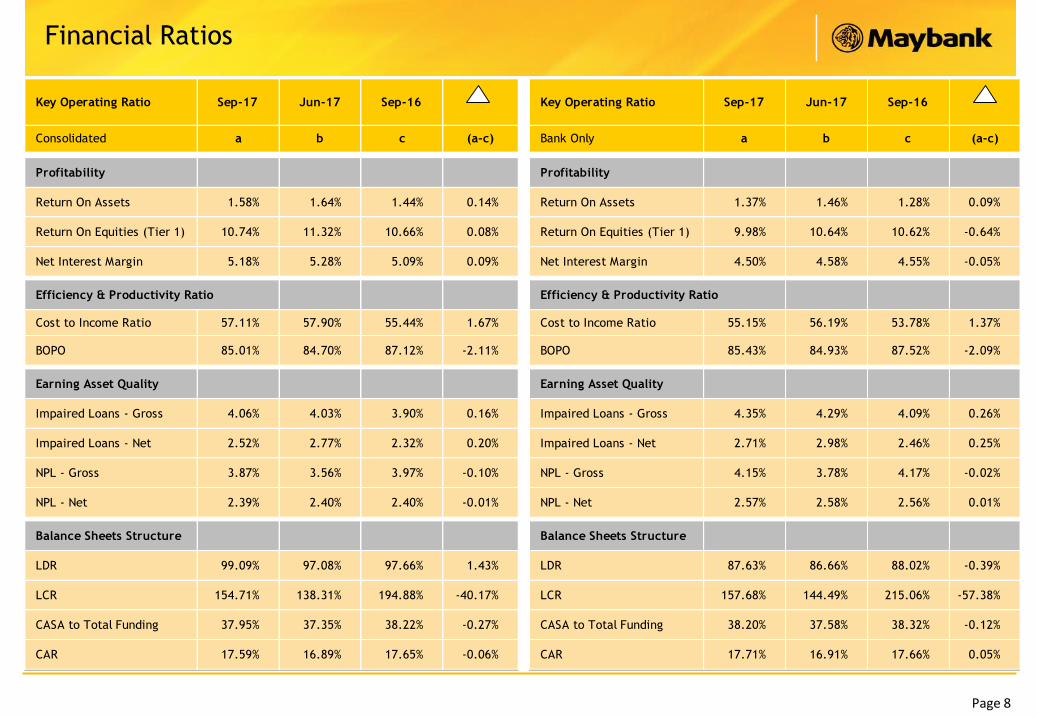
Financial Ratios
Key Operating Ratio Sep-17 Jun-17 Sep-16 Key Operating Ratio Sep-17 Jun-17 Sep-16
Consolidated a b c (a-c) Bank Only a b c (a-c)
Profitability Profitability
Return On Assets 1.58% 1.64% 1.44% 0.14% Return On Assets 1.37% 1.46% 1.28% 0.09%
Return On Equities (Tier 1) 10.74% 11.32% 10.66% 0.08% Return On Equities (Tier 1) 9.98% 10.64% 10.62% -0.64%
Net Interest Margin 5.18% 5.28% 5.09% 0.09% Net Interest Margin 4.50% 4.58% 4.55% -0.05%0.00% 0.00% 0.00% 0.00% 0.00% 0.00%
Efficiency & Productivity Ratio Efficiency & Productivity Ratio
Cost to Income Ratio 57.11% 57.90% 55.44% 1.67% Cost to Income Ratio 55.15% 56.19% 53.78% 1.37%
BOPO 85.01% 84.70% 87.12% -2.11% BOPO 85.43% 84.93% 87.52% -2.09%0.00% 0.00% 0.00% 0.00% 0.00% 0.00%
Earning Asset Quality Earning Asset Quality
Impaired Loans - Gross 4.06% 4.03% 3.90% 0.16% Impaired Loans - Gross 4.35% 4.29% 4.09% 0.26%
Impaired Loans - Net 2.52% 2.77% 2.32% 0.20% Impaired Loans - Net 2.71% 2.98% 2.46% 0.25%
NPL - Gross 3.87% 3.56% 3.97% -0.10% NPL - Gross 4.15% 3.78% 4.17% -0.02%
NPL - Net 2.39% 2.40% 2.40% -0.01% NPL - Net 2.57% 2.58% 2.56% 0.01%
Balance Sheets Structure Balance Sheets Structure
LDR 99.09% 97.08% 97.66% 1.43% LDR 87.63% 86.66% 88.02% -0.39%
LCR 154.71% 138.31% 194.88% -40.17% LCR 157.68% 144.49% 215.06% -57.38%
CASA to Total Funding 37.95% 37.35% 38.22% -0.27% CASA to Total Funding 38.20% 37.58% 38.32% -0.12%
CAR 17.59% 16.89% 17.65% -0.06% CAR 17.71% 16.91% 17.66% 0.05%
Page 9
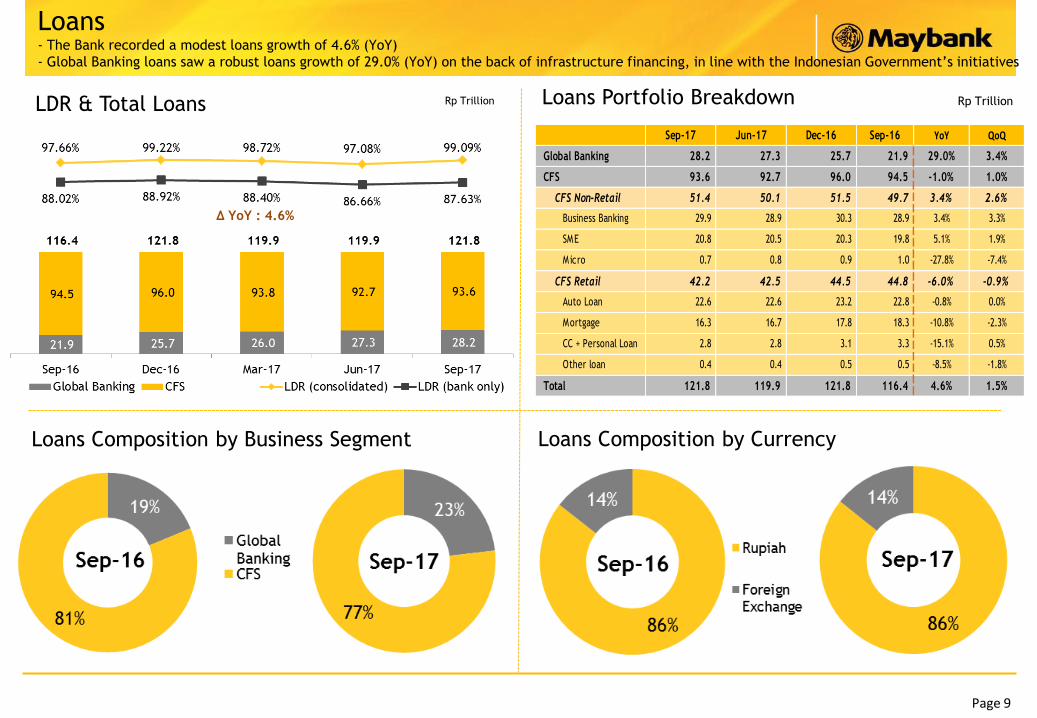
Δ YoY : 4.6%
LDR & Total Loans
Loans Composition by Business Segment
Loans Portfolio Breakdown
Loans Composition by Currency
Rp TrillionRp Trillion
Sep-17 Jun-17 Dec-16 Sep-16 YoY QoQ
Global Banking 28.2 27.3 25.7 21.9 29.0% 3.4%
CFS 93.6 92.7 96.0 94.5 -1.0% 1.0%
CFS Non-Retail 51.4 50.1 51.5 49.7 3.4% 2.6%
Business Banking 29.9 28.9 30.3 28.9 3.4% 3.3%
SME 20.8 20.5 20.3 19.8 5.1% 1.9%
Micro 0.7 0.8 0.9 1.0 -27.8% -7.4%
CFS Retail 42.2 42.5 44.5 44.8 -6.0% -0.9%
Auto Loan 22.6 22.6 23.2 22.8 -0.8% 0.0%
Mortgage 16.3 16.7 17.8 18.3 -10.8% -2.3%
CC + Personal Loan 2.8 2.8 3.1 3.3 -15.1% 0.5%
Other loan 0.4 0.4 0.5 0.5 -8.5% -1.8%
Total 121.8 119.9 121.8 116.4 4.6% 1.5%
Loans- The Bank recorded a modest loans growth of 4.6% (YoY)
- Global Banking loans saw a robust loans growth of 29.0% (YoY) on the back of infrastructure financing, in line with the Indonesian Government‟s initiatives
Page 10
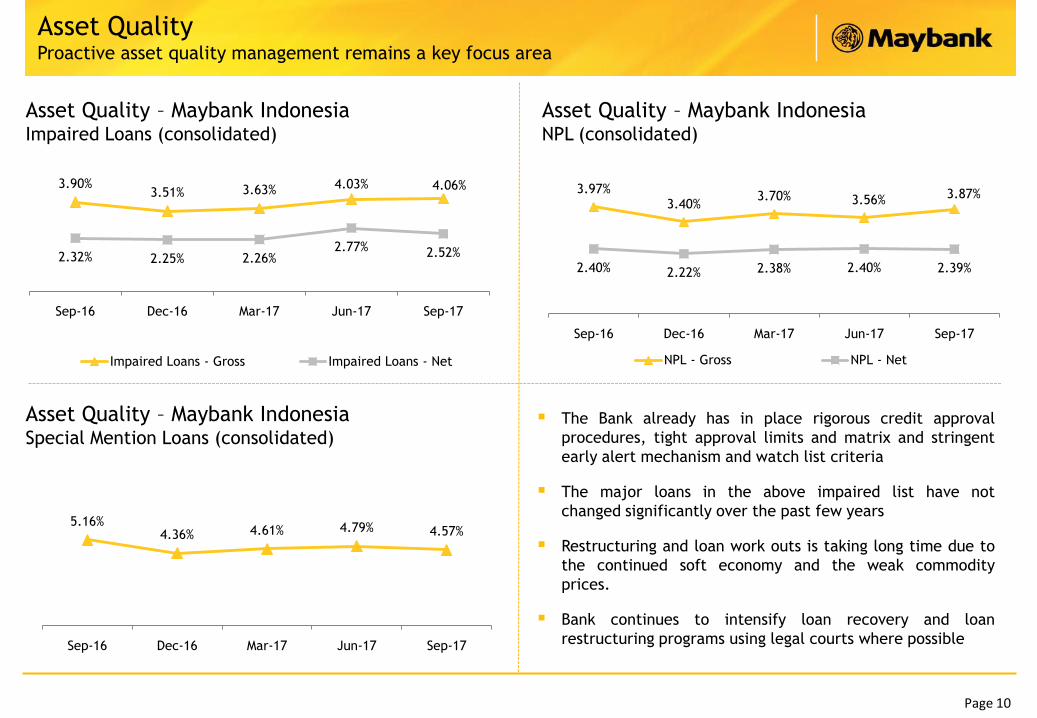
Asset QualityProactive asset quality management remains a key focus area
Asset Quality – Maybank Indonesia Impaired Loans (consolidated)
The Bank already has in place rigorous credit approval
procedures, tight approval limits and matrix and stringent
early alert mechanism and watch list criteria
The major loans in the above impaired list have not
changed significantly over the past few years
Restructuring and loan work outs is taking long time due to
the continued soft economy and the weak commodity
prices.
Bank continues to intensify loan recovery and loan
restructuring programs using legal courts where possible
Asset Quality – Maybank Indonesia NPL (consolidated)
Asset Quality – Maybank Indonesia Special Mention Loans (consolidated)
3.90%3.51% 3.63% 4.03% 4.06%
2.32% 2.25% 2.26%2.77% 2.52%
Sep-16 Dec-16 Mar-17 Jun-17 Sep-17
Impaired Loans - Gross Impaired Loans - Net
3.97%3.40%
3.70% 3.56% 3.87%
2.40% 2.22% 2.38% 2.40% 2.39%
Sep-16 Dec-16 Mar-17 Jun-17 Sep-17
NPL - Gross NPL - Net
5.16%4.36% 4.61% 4.79% 4.57%
Sep-16 Dec-16 Mar-17 Jun-17 Sep-17
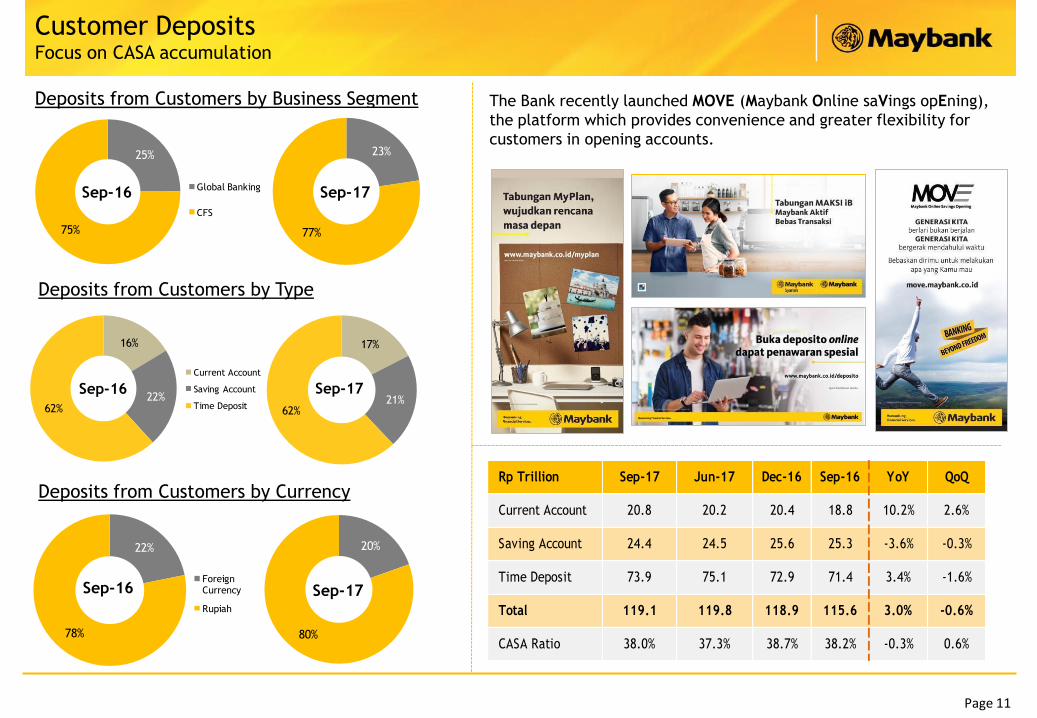
Page 11
16%
22%62%
Sep-16
Current Account
Saving Account
Time Deposit
17%
21%62%
Sep-17
Deposits from Customers by Business Segment
Deposits from Customers by Type
Customer DepositsFocus on CASA accumulation
25%
75%
Sep-16 Global Banking
CFS
23%
77%
Sep-17
Rp Trillion Sep-17 Jun-17 Dec-16 Sep-16 YoY QoQ
Current Account 20.8 20.2 20.4 18.8 10.2% 2.6%
Saving Account 24.4 24.5 25.6 25.3 -3.6% -0.3%
Time Deposit 73.9 75.1 72.9 71.4 3.4% -1.6%
Total 119.1 119.8 118.9 115.6 3.0% -0.6%
CASA Ratio 38.0% 37.3% 38.7% 38.2% -0.3% 0.6%
Deposits from Customers by Currency
22%
78%
Sep-16Foreign Currency
Rupiah
20%
80%
Sep-17
The Bank recently launched MOVE (Maybank Online saVings opEning),
the platform which provides convenience and greater flexibility for
customers in opening accounts.
Page 12
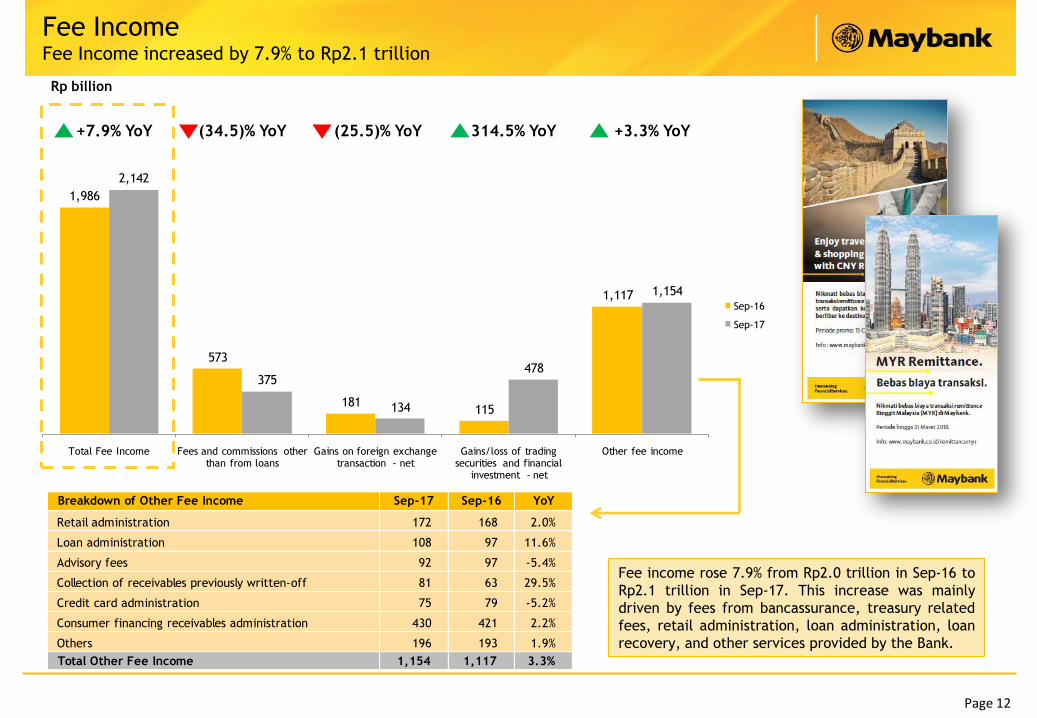
(in Rp billion)
Breakdown of Other Fee Income Sep-17 Sep-16 YoY
Retail administration 172 168 2.0%
Loan administration 108 97 11.6%
Advisory fees 92 97 -5.4%
Collection of receivables previously written-off 81 63 29.5%
Credit card administration 75 79 -5.2%
Consumer financing receivables administration 430 421 2.2%
Others 196 193 1.9%
Total Other Fee Income 1,154 1,117 3.3%
1,986
573
181115
1,117
2,142
375
134
478
1,154
Total Fee Income Fees and commissions other than from loans
Gains on foreign exchange transaction - net
Gains/loss of trading securities and financial
investment - net
Other fee income
Sep-16
Sep-17
+7.9% YoY (34.5)% YoY (25.5)% YoY 314.5% YoY +3.3% YoY
Rp billion
Fee IncomeFee Income increased by 7.9% to Rp2.1 trillion
Fee income rose 7.9% from Rp2.0 trillion in Sep-16 to
Rp2.1 trillion in Sep-17. This increase was mainly
driven by fees from bancassurance, treasury related
fees, retail administration, loan administration, loan
recovery, and other services provided by the Bank.
Page 13
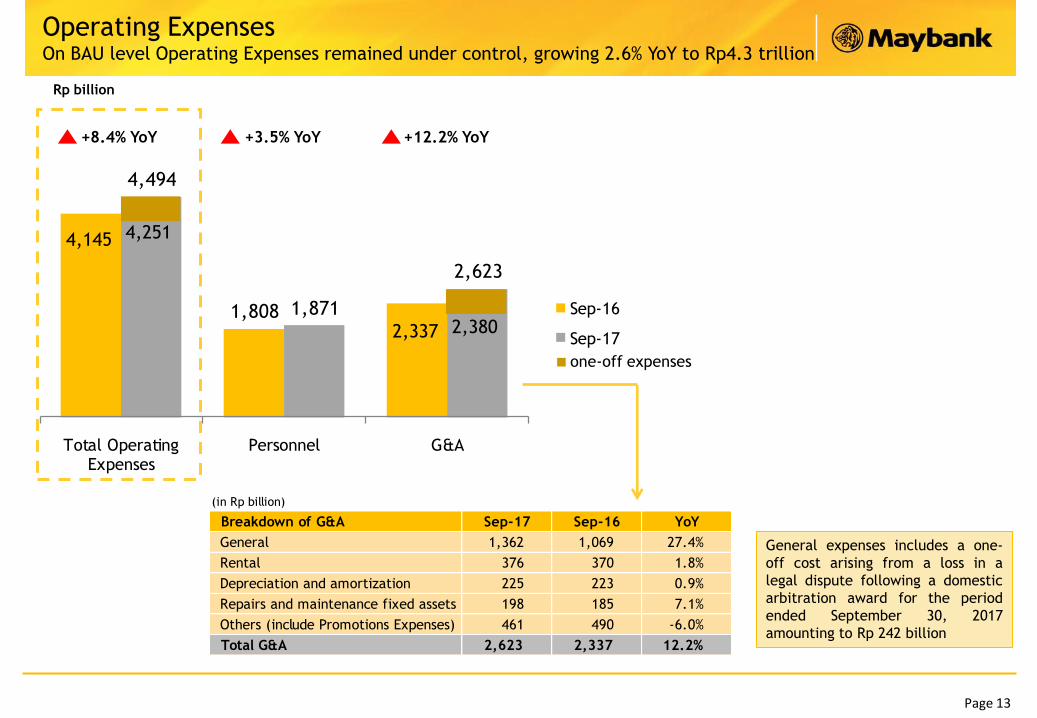
4,145
1,808
2,337
4,494
1,871
2,623
Total Operating Expenses
Personnel G&A
Sep-16
Sep-17
(in Rp billion)
Breakdown of G&A Sep-17 Sep-16 YoY
General 1,362 1,069 27.4%
Rental 376 370 1.8%
Depreciation and amortization 225 223 0.9%
Repairs and maintenance fixed assets 198 185 7.1%
Others (include Promotions Expenses) 461 490 -6.0%
Total G&A 2,623 2,337 12.2%
Operating ExpensesOn BAU level Operating Expenses remained under control, growing 2.6% YoY to Rp4.3 trillion
+8.4% YoY +3.5% YoY +12.2% YoY
Rp billion
4,251
one-off expenses
2,380
4,145
2,337
General expenses includes a one-
off cost arising from a loss in a
legal dispute following a domestic
arbitration award for the period
ended September 30, 2017
amounting to Rp 242 billion
Page 14
Sound Capital Position
Capital Ratios Sep-17 Jun-17 Mar-17 Dec-16 Sep-16 YoY QoQ
Tier I 14.55% 13.72% 13.55% 13.22% 13.84% 0.71% 0.83%
Tier II 3.04% 3.17% 3.39% 3.54% 3.81% -0.77% -0.13%
Total CAR 17.59% 16.89% 16.94% 16.76% 17.65% -0.06% 0.70%
Page 15
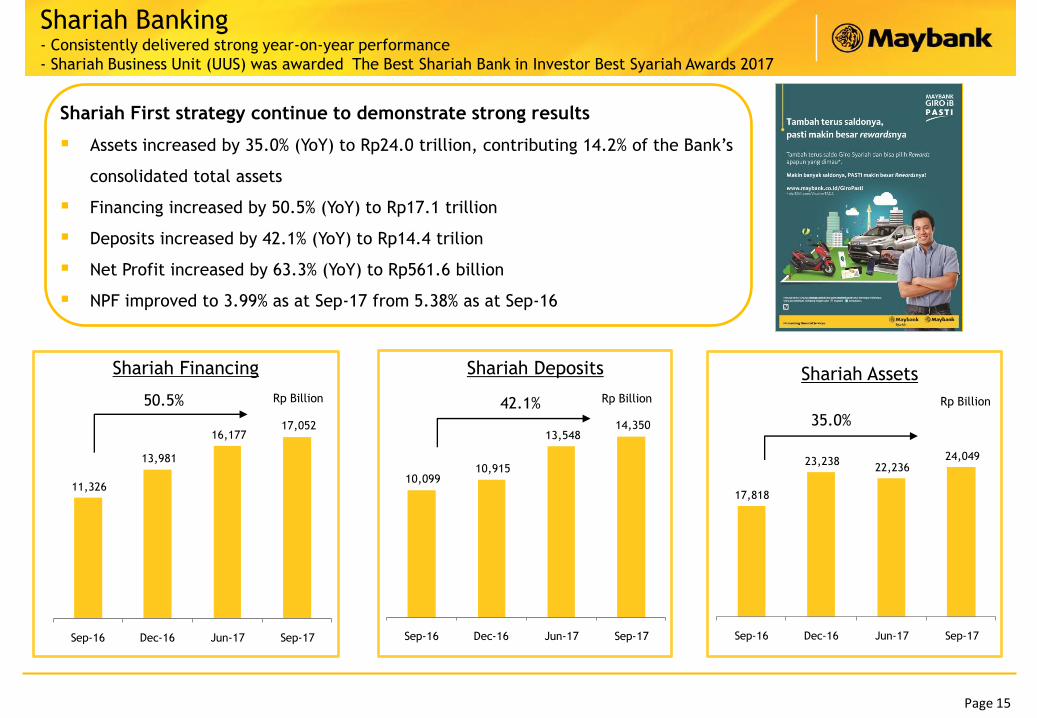
17,818
23,238 22,236
24,049
Sep-16 Dec-16 Jun-17 Sep-17
10,099 10,915
13,548 14,350
Sep-16 Dec-16 Jun-17 Sep-17
11,326
13,981
16,177 17,052
Sep-16 Dec-16 Jun-17 Sep-17
Shariah Banking- Consistently delivered strong year-on-year performance
- Shariah Business Unit (UUS) was awarded The Best Shariah Bank in Investor Best Syariah Awards 2017
Shariah Assets
Rp Billion
35.0%
Shariah First strategy continue to demonstrate strong results
Assets increased by 35.0% (YoY) to Rp24.0 trillion, contributing 14.2% of the Bank‟s
consolidated total assets
Financing increased by 50.5% (YoY) to Rp17.1 trillion
Deposits increased by 42.1% (YoY) to Rp14.4 trilion
Net Profit increased by 63.3% (YoY) to Rp561.6 billion
NPF improved to 3.99% as at Sep-17 from 5.38% as at Sep-16
Rp Billion
Shariah Deposits
42.1%
Shariah Financing
50.5% Rp Billion
Page 16
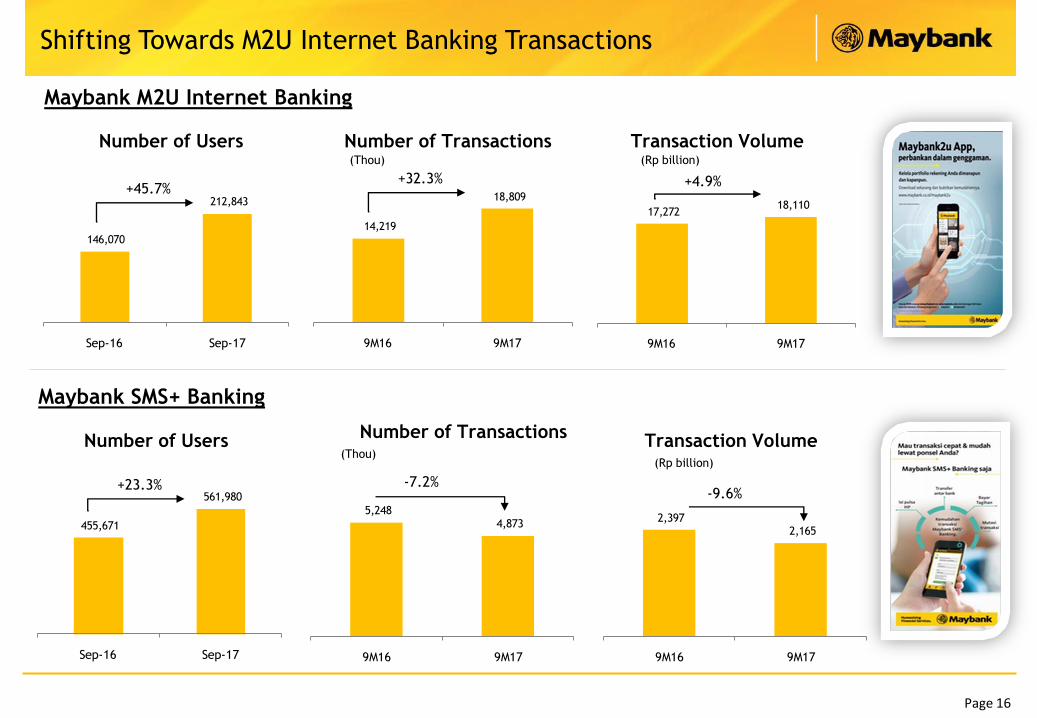
17,272 18,110
9M16 9M17
14,219
18,809
9M16 9M17
146,070
212,843
Sep-16 Sep-17
2,397 2,165
9M16 9M17
5,248 4,873
9M16 9M17
455,671
561,980
Sep-16 Sep-17
Shifting Towards M2U Internet Banking Transactions
Number of Users
Maybank M2U Internet Banking
Number of Users
Transaction VolumeNumber of Transactions
(Thou)(Rp billion)
Number of Transactions(Thou)
Transaction Volume(Rp billion)
Maybank SMS+ Banking
+23.3% -7.2% -9.6%
+45.7% +32.3% +4.9%
Page 17
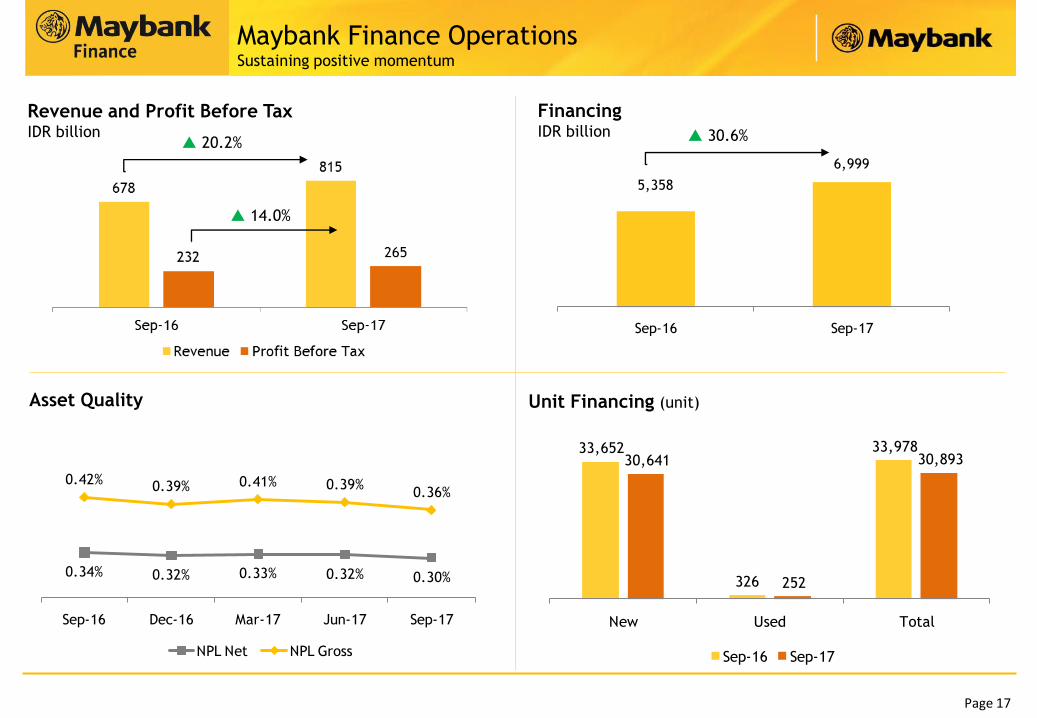
0.34% 0.32% 0.33% 0.32% 0.30%
0.42% 0.39% 0.41% 0.39%0.36%
Sep-16 Dec-16 Mar-17 Jun-17 Sep-17
NPL Net NPL Gross
5,358
6,999
Sep-16 Sep-17
Consumer Financing
33,652
326
33,978 30,641
252
30,893
New Used Total
Sep-16 Sep-17
Maybank Finance OperationsSustaining positive momentum
Asset Quality
Revenue and Profit Before Tax IDR billion
FinancingIDR billion
Unit Financing (unit)
20.2%
14.0%
30.6%
Page 18
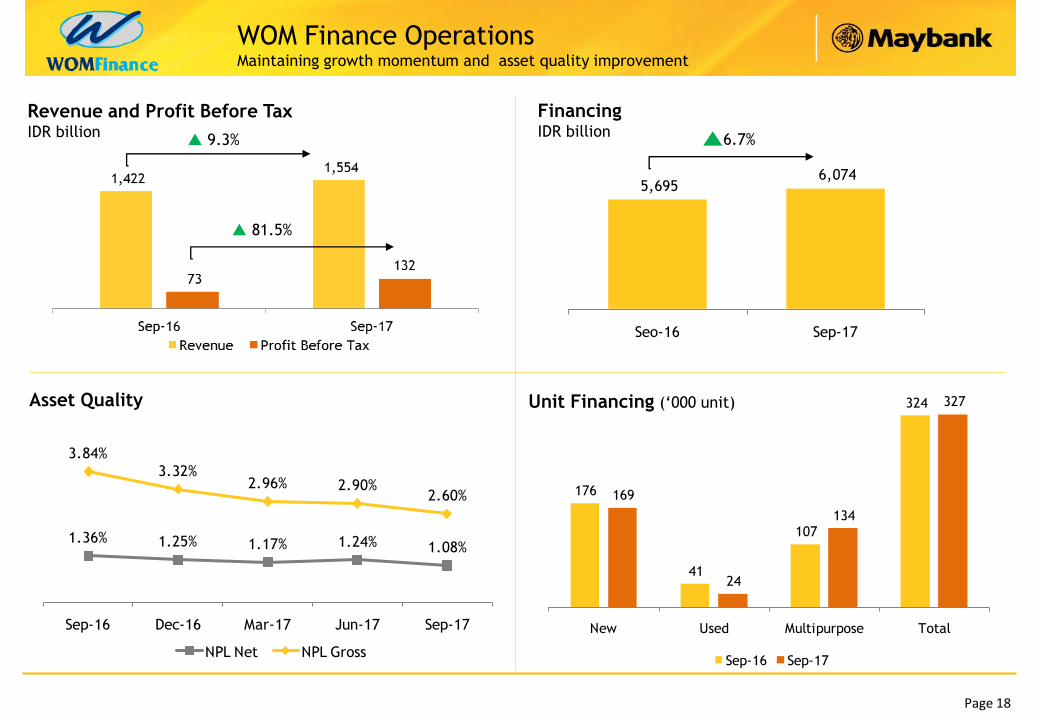
5,695 6,074
Seo-16 Sep-17
1.36% 1.25% 1.17% 1.24% 1.08%
3.84%
3.32%2.96% 2.90%
2.60%
Sep-16 Dec-16 Mar-17 Jun-17 Sep-17
NPL Net NPL Gross
176
41
107
324
169
24
134
327
New Used Multipurpose Total
Sep-16 Sep-17
WOM Finance OperationsMaintaining growth momentum and asset quality improvement
Asset Quality
Revenue and Profit Before Tax IDR billion
FinancingIDR billion
Unit Financing („000 unit)
6.7% 9.3%
81.5%
Maybank Indonesia in Brief
Page 20
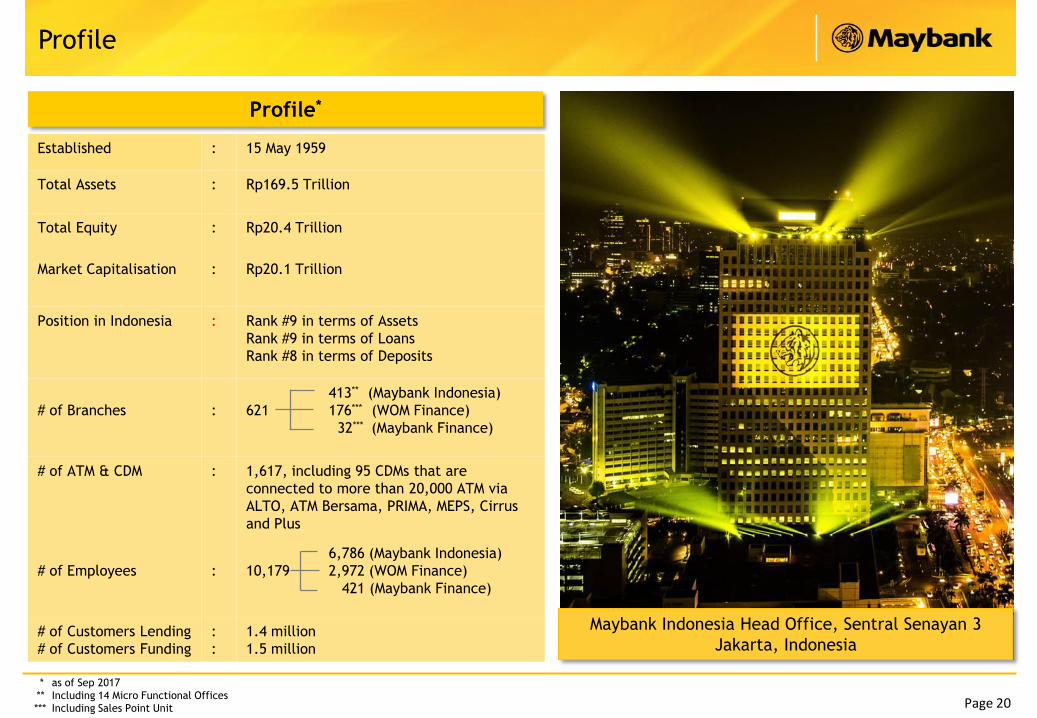
Profile
Profile*
Maybank Indonesia Head Office, Sentral Senayan 3
Jakarta, Indonesia
Established : 15 May 1959
Total Assets : Rp169.5 Trillion
Total Equity : Rp20.4 Trillion
Market Capitalisation : Rp20.1 Trillion
Position in Indonesia : Rank #9 in terms of Assets
Rank #9 in terms of Loans
Rank #8 in terms of Deposits
# of Branches : 621
413** (Maybank Indonesia)
176*** (WOM Finance)
32*** (Maybank Finance)
# of ATM & CDM : 1,617, including 95 CDMs that are
connected to more than 20,000 ATM via
ALTO, ATM Bersama, PRIMA, MEPS, Cirrus
and Plus
# of Employees : 10,179
6,786 (Maybank Indonesia)
2,972 (WOM Finance)
421 (Maybank Finance)
# of Customers Lending
# of Customers Funding
:
:
1.4 million
1.5 million
* as of Sep 2017
** Including 14 Micro Functional Offices
*** Including Sales Point Unit
Page 21
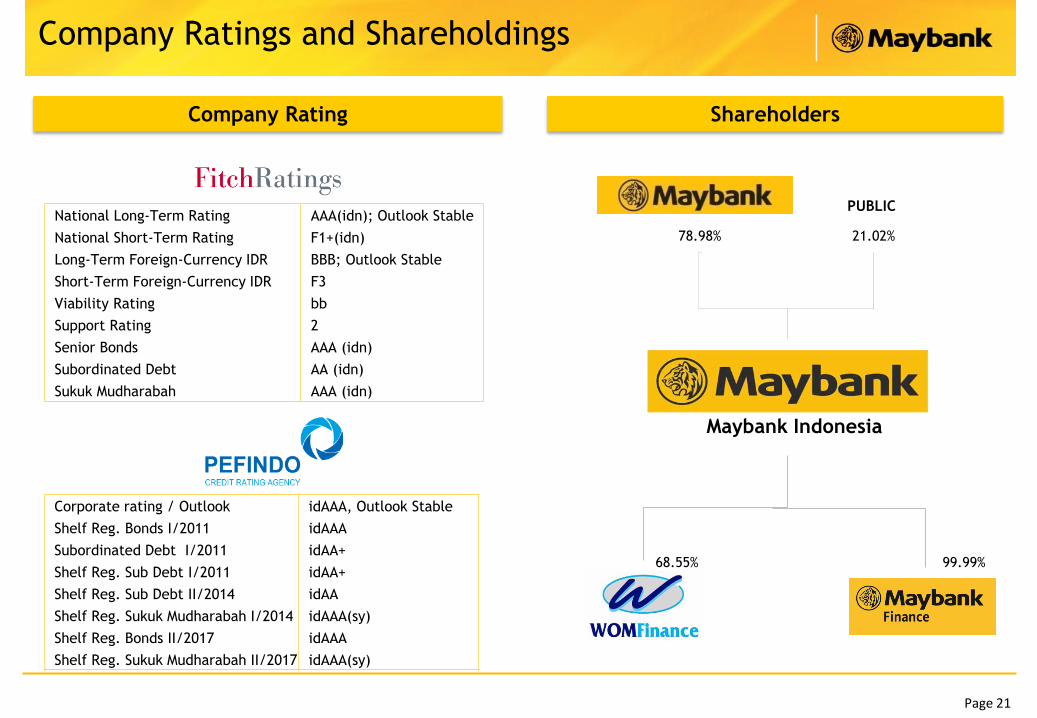
Company Rating Shareholders
Company Ratings and Shareholdings
68.55%
78.98%
99.99%
PUBLIC
21.02%
Maybank Indonesia
National Long-Term Rating AAA(idn); Outlook Stable
National Short-Term Rating F1+(idn)
Long-Term Foreign-Currency IDR BBB; Outlook Stable
Short-Term Foreign-Currency IDR F3
Viability Rating bb
Support Rating 2
Senior Bonds AAA (idn)
Subordinated Debt AA (idn)
Sukuk Mudharabah AAA (idn)
Corporate rating / Outlook idAAA, Outlook Stable
Shelf Reg. Bonds I/2011 idAAA
Subordinated Debt I/2011 idAA+
Shelf Reg. Sub Debt I/2011 idAA+
Shelf Reg. Sub Debt II/2014 idAA
Shelf Reg. Sukuk Mudharabah I/2014 idAAA(sy)
Shelf Reg. Bonds II/2017 idAAA
Shelf Reg. Sukuk Mudharabah II/2017 idAAA(sy)
Page 22
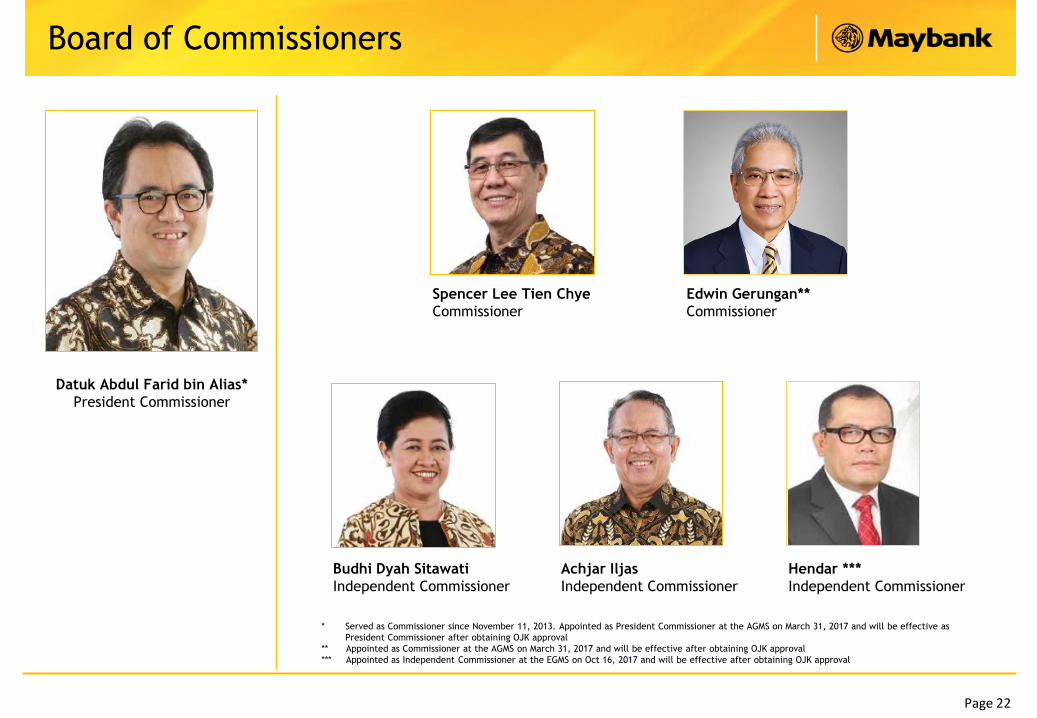
Board of Commissioners
Achjar Iljas
Independent Commissioner
Budhi Dyah Sitawati
Independent Commissioner
Hendar ***
Independent Commissioner
Spencer Lee Tien Chye
Commissioner
Datuk Abdul Farid bin Alias*
President Commissioner
Edwin Gerungan**
Commissioner
* Served as Commissioner since November 11, 2013. Appointed as President Commissioner at the AGMS on March 31, 2017 and will be effective as
President Commissioner after obtaining OJK approval
** Appointed as Commissioner at the AGMS on March 31, 2017 and will be effective after obtaining OJK approval
*** Appointed as Independent Commissioner at the EGMS on Oct 16, 2017 and will be effective after obtaining OJK approval

Page 23
Dhien Tjahajani
Director
Taswin Zakaria
President Director
Board of Directors
Irvandi Ferizal
Director
Jenny Wiriyanto
Director
Eri Budiono
Director
Thilagavathy Nadason
Director
Effendi
Director
Page 24
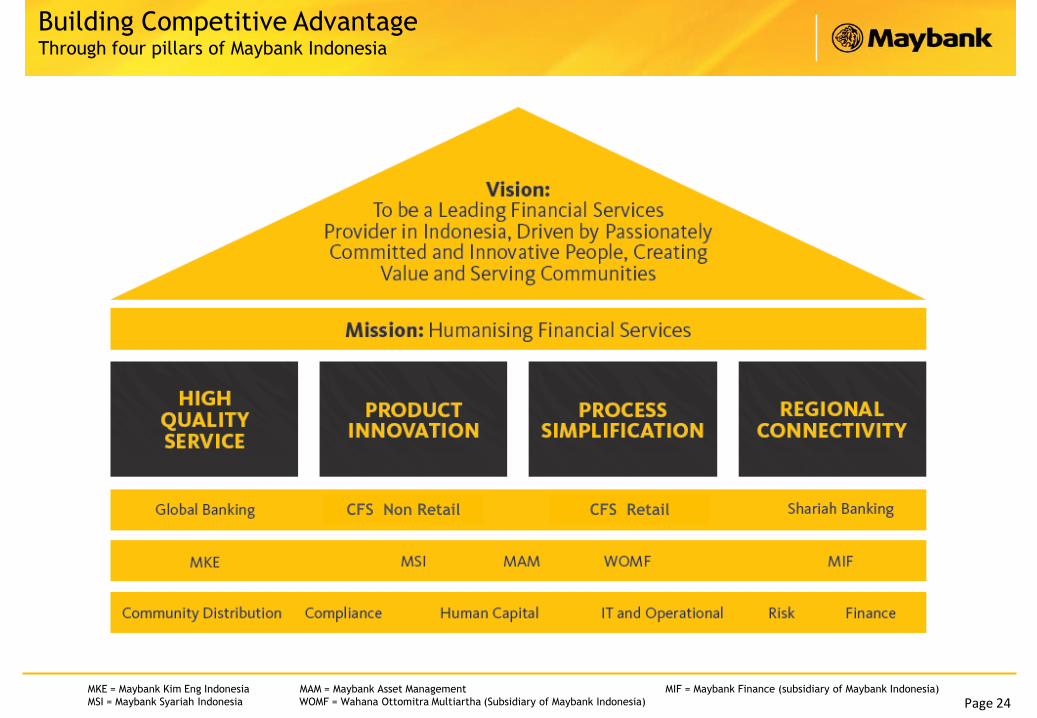
Building Competitive AdvantageThrough four pillars of Maybank Indonesia
MKE = Maybank Kim Eng Indonesia MAM = Maybank Asset Management MIF = Maybank Finance (subsidiary of Maybank Indonesia)
MSI = Maybank Syariah Indonesia WOMF = Wahana Ottomitra Multiartha (Subsidiary of Maybank Indonesia)
CFS Non Retail CFS Retail

Awards and Events Highlights
Page 26
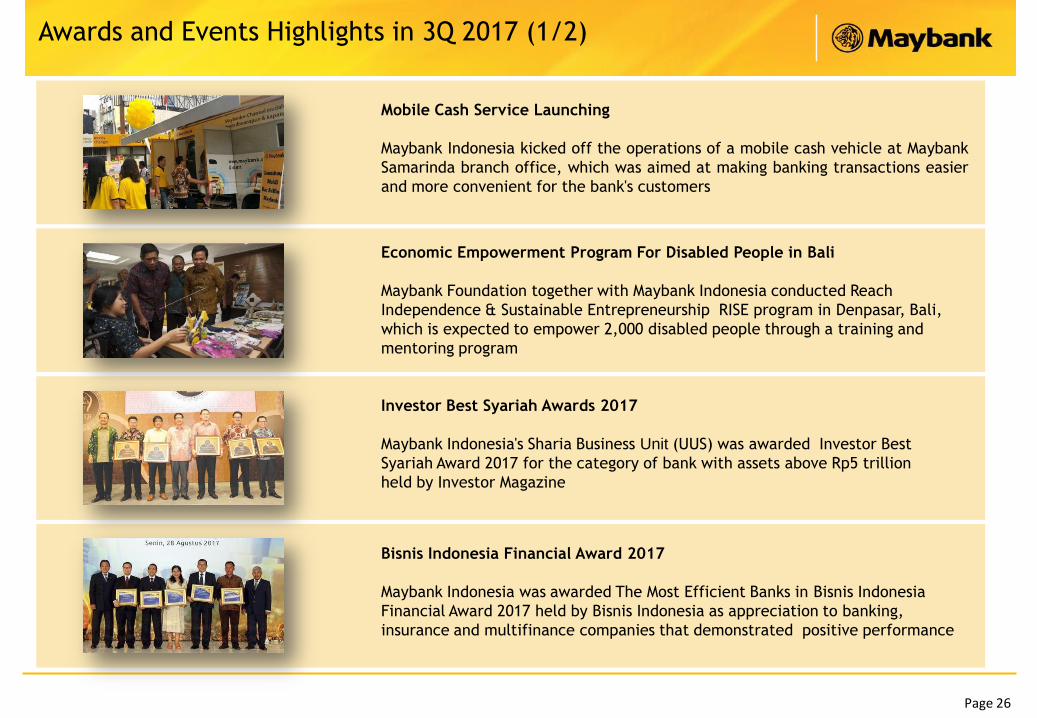
Awards and Events Highlights in 3Q 2017 (1/2)
Investor Best Syariah Awards 2017
Maybank Indonesia's Sharia Business Unit (UUS) was awarded Investor Best
Syariah Award 2017 for the category of bank with assets above Rp5 trillion
held by Investor Magazine
Bisnis Indonesia Financial Award 2017
Maybank Indonesia was awarded The Most Efficient Banks in Bisnis Indonesia
Financial Award 2017 held by Bisnis Indonesia as appreciation to banking,
insurance and multifinance companies that demonstrated positive performance
Mobile Cash Service Launching
Maybank Indonesia kicked off the operations of a mobile cash vehicle at Maybank
Samarinda branch office, which was aimed at making banking transactions easier
and more convenient for the bank's customers
Economic Empowerment Program For Disabled People in Bali
Maybank Foundation together with Maybank Indonesia conducted Reach
Independence & Sustainable Entrepreneurship RISE program in Denpasar, Bali,
which is expected to empower 2,000 disabled people through a training and
mentoring program
Page 27
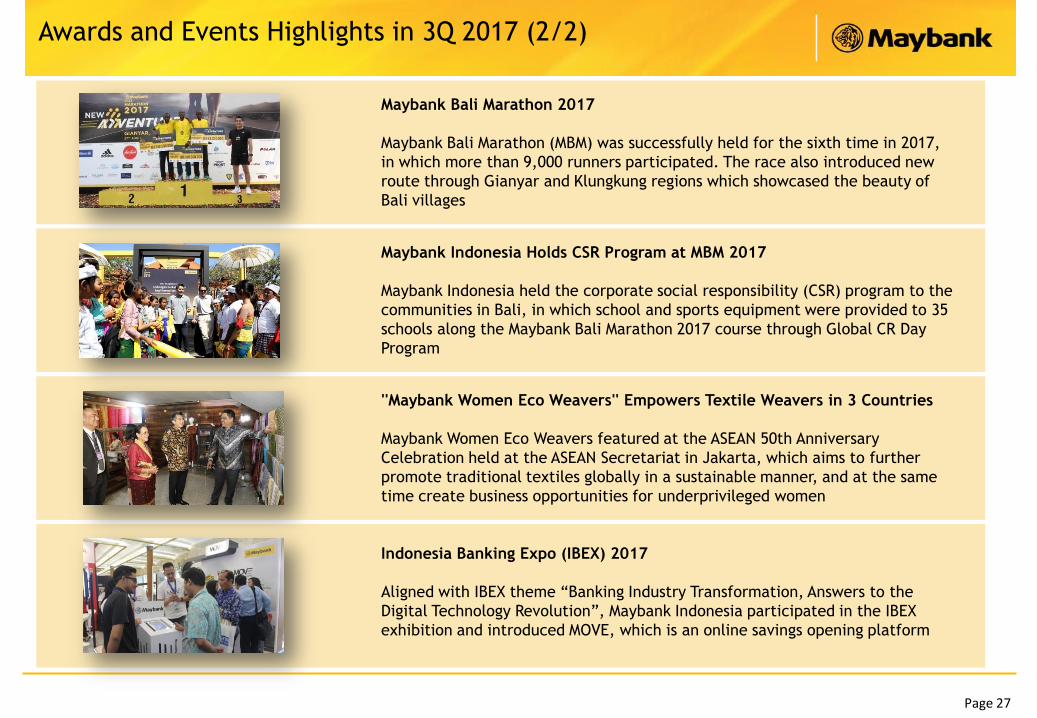
Awards and Events Highlights in 3Q 2017 (2/2)
Maybank Indonesia Holds CSR Program at MBM 2017
Maybank Indonesia held the corporate social responsibility (CSR) program to the
communities in Bali, in which school and sports equipment were provided to 35
schools along the Maybank Bali Marathon 2017 course through Global CR Day
Program
''Maybank Women Eco Weavers'' Empowers Textile Weavers in 3 Countries
Maybank Women Eco Weavers featured at the ASEAN 50th Anniversary
Celebration held at the ASEAN Secretariat in Jakarta, which aims to further
promote traditional textiles globally in a sustainable manner, and at the same
time create business opportunities for underprivileged women
Maybank Bali Marathon 2017
Maybank Bali Marathon (MBM) was successfully held for the sixth time in 2017,
in which more than 9,000 runners participated. The race also introduced new
route through Gianyar and Klungkung regions which showcased the beauty of
Bali villages
Indonesia Banking Expo (IBEX) 2017
Aligned with IBEX theme “Banking Industry Transformation, Answers to the
Digital Technology Revolution”, Maybank Indonesia participated in the IBEX
exhibition and introduced MOVE, which is an online savings opening platform

Page 28
MY BANK IS
MAYBANK!
Disclaimer : Please note that some of the statements in this document may constitute “forward-looking statements” that do not directly or
exclusively relate to historical facts. Some of the statements in this document (including but not limited to the forward-looking
statements) are derived from or are based upon information from public or external sources and/or reflect Maybank Indonesia’s own
internal projections, current intentions, plans, expectations, assumptions and beliefs about future events and are subject to risks and
uncertainties that may cause actual events and Maybank Indonesia’s future results to be materially different than expected or indicated by
such statements. To the extent that such statements in this document (including but not limited to the forward-looking statements) are
derived from or are based on public or external sources of information, Maybank Indonesia’s has not undertaken any independent
verification of such information. No assurance can be given that the results anticipated by Maybank Indonesia, or indicated by any such
statements in this document (including but not limited to the forward-looking statements), will be achieved. You are urged to view the
statements contained in this document (including but not limited to the forward-looking statements) with caution.
PT BANK MAYBANK INDONESIA TBK
Investor Relations
Sentral Senayan III
Jl. Asia Afrika No. 8, Gelora Bung Karno
Jakarta 10270, Indonesia
Tel : (62-21) 2922 8888
Fax : (62-21) 2922 8799
Email : [email protected]
www.maybank.co.id