maynilad 2018 annual report · the iso recertification and surveillance audit with expansion of...
TRANSCRIPT

MAYNILAD 2018 ANNUAL REPORT 1
M AY N I L A D 2 0 1 8 A N N UA L R E P O RT

2 Sustaining Growth

MAYNILAD 2018 ANNUAL REPORT 3

Contents
About the CoverOur journey from infancy to a prime mover of the water industry is made more fulfilling by the lives, communities and industries now thriving because of our work. From where we stand, with continued commitment and hard work, we see a future of sustained shared growth.
Business Overview
How we Performed
Messages
Operational Highlights
Sustainability
Financial Review and Analysis
In the Pipeline
Corporate Social Responsibility
Awards Received in 2018
Board of Directors
Top Management Team
Financial Statements
8
10
14
24
38
44
50
54
66
68
74
78


6 Sustaining Growth

MAYNILAD 2018 ANNUAL REPORT 7

8 Sustaining Growth
Business Overview
Parañaque Water Reclamation FacilityMaynilad’s 22nd wastewater treatment facility, it has the capacity to treat about 76 million liters of sewage per day, serving over 500,000 people in Parañaque City.
Maynilad provides water and wastewater services to the West Zone of the Greater Manila Area, by virtue of a concession agreement with the Metropolitan Waterworks and Sewerage System (MWSS). The West Zone covers 17 cities and municipalities, including certain portions of Manila and Quezon City; a portion of Makati City, west of the South Super Highway; the cities of Caloocan, Pasay, Parañaque, Las Piñas, Muntinlupa, Valenzuela, Navotas and Malabon in Metro Manila; the cities of Cavite, Bacoor and Imus, and the towns of Kawit, Noveleta and Rosario, all in the Province of Cavite.

MAYNILAD 2018 ANNUAL REPORT 9
Since its re-privatization in 2007, and eventual award to then Metro Pacific-DMCI (now Metro Pacific-DMCI-Marubeni) consortium, Maynilad has risen to become the Philippines’ largest private water concessionaire in terms of customer base.
What we doMaynilad provides piped-in water supply to its customers through its network of facilities and conveyances. Its ISO-accredited Central Laboratory monitors compliance to the Department of Health’s Philippine National Standards for Drinking Water, ensuring that its water supply is safe and fit for drinking, bathing, cooking and other household activities.
In addition to providing water services, Maynilad also connects some parts of the concession area to its sewerage network. The unconnected portions are regularly provided with septic tank cleaning (desludging) services.
To contribute to improving technical knowledge in the industry, Maynilad offers technical consulting services on Water Supply Facilities Management, Water Loss Management, Geographic Information System Management, and Wastewater Management Services.
Our VisionWe are the leading water solutions company in the Philippines with a strong presence across Asia.
Our MissionWe provide safe, affordable and sustainable water solutions that enable those we serve to lead healthier, more comfortable lives.
Our ValuesHonesty and IntegrityWe deal with our stakeholders with honesty and integrity. We will always do what is right and fair for the sake of our customers, shareholders and the environment.
Customer ServiceWe consider our customers as our growth partners. Only by providing them with affordable, high-quality water solutions can we continue generating value for our company and shareholders.
EntrepreneurshipWe encourage creative thinking and deliberate execution. We expect our people to manage our company’s resources with a strong sense of initiative, ownership and accountability in order to balance the needs of our customers with those of our other stakeholders.
Commitment to ExcellenceWe view excellence as a means and not an end. To maintain our operational efficiency and industry leadership, we push our people to excel by being diligent and innovative in their work.
TeamworkWe value our people and consider their success as our own. This is why we provide them with the support, responsibilities and opportunities that will allow them to develop individually and with the company.
Love for CountryWe actively partner with the public sector so that we can provide even more Filipinos with water solutions that will spur national development and secure the environment.

How we Performed
BilledVolume (MCM)
Water pressureover 16 psi (%)
AverageNRW (%)
Consolidatednet income
BilledServices
Consolidatedrevenue
24-houravailability (%)
Consolidatedcore net income
Year at a Glance
10 Sustaining Growth
2017
2017
2017
2017
2017
2017
2017
2017
2018
2018
2018
2018
2018 4.32%
7.78%
4.74%
0.71%
3.59%
7.59%
3.03%
6.02%2018
2018
2018
511.66
1,358,758
32.27
98.27
70.52
20.77
6.85
7.38
527.15
1,407,503
29.76
97.57
67.47
22.02
7.37
7.73

Financial Performance (in Billion Pesos)
Reported Net Income Core EBITDA
No. of Billed Water ServicesBilled Volume (MCM)
24-Hour Water Service (%)
Pipes Laid to Date (km)
Jobs Generated
Revenue Core Net Income
CAPEX (in Million Pesos)
Water Service Coverage (%)
Operating Highlights
Highlights
MAYNILAD 2018 ANNUAL REPORT 11
2014
2014
2014
2014
2014
2014
2014 2014 2014
2016
2016
2016
2016
2016
2016
2016 2016 2016
2015
2015
2015
2015
2015
2015
2015 2015 2015
2017
2017
2017
2017
2017
2017
2017 2017 2017
2018
2018
2018
2018
2018
2018
2018 2018 201821.76
527.15
11,915
1,407,503
97.57
93.9%
7.34 7.71 15.35
20.55
511.66
11,967
1,358,758
98.27
93.4
6.83 7.36 14.05
20.03
498.60
9,539
1,312,223
98.23
94.3
6.78 7.18 14.34
18.92
481.53
8,007
1,265,625
99.81
93.6
9.52 9.65 13.83
18.23
463.24
4,345
New Sewer Service Connections
2014
2016
2015
2017
2018 4,441
3,796
4,019
4,113
4,229
Min. Water Pressure of 16 psi (%)
2014
2016
2015
2017
2018 67.47
70.52
75.79
70.69
67.00
1,190,062
99.89
Sewerage Coverage (%)
2014
2016
2015
2017
2018 20.4
15.5
15.2
14.1
12.1
91.6
NRW Average (%) - DMA Level
2014
2016
2015
2017
2018 29.76
32.27
29.9
31.0
33.9
8.27 8.79 12.82
2014
2014
2016
2016
2015
2015
2017
2017
2018
2018
7,691
34,840
7,675
36,609
7,637
29,183
7,575
25,046
7,458
Min. Water Pressure of 7 psi (%)
2014
2016
2015
2017
2018 90.01
91.10
91.97
94.95
96.00
14,066

12
Events andMilestonesin 2018
Facilities Tour. Maynilad opened its doors to 180 public officials from national government agencies and local government units. The initiative aimed to raise awareness among public officials of Maynilad’s sanitation and wastewater operations.
Disaster Response. Maynilad deployed a mobile water treatment plant to Malilipot, Sto. Domingo, and Tabaco in Albay, following volcanic eruptions which contaminated the water supply in said cities. The mobile treatment plant has the capacity of producing 7,000 gallons of water per day, enough to meet the daily drinking requirements of about 17,000 people.
Anvil Awards. Maynilad bagged five Gold and six Silver awards at the 53rd Anvil Awards, organized annually by the Public Relations Society of the Philippines. Maynilad got Gold for “Lingkod Eskwela” advocacy initiatives, “Ripples” company newsletter, “Maynilad Media Run” event, “Dakilang Manggagawa Awards” employee engagement event, and “Mayni-LAD to the Rescue! Wastewater Video.” Its “Green Badge” and “Daloy Dunong” advocacy programs, “Maynilad Simpleng Ginhawa” and “Maynilad 10th Anniversary” videos, “Wastewater Social Media Campaign,” and “Maynilad 10th Anniversary Campaign” won Silver.
Water Champions. Eighteen water champions were recognized at the 4th World Water Day.PH (WWD.PH) Awards held in Quezon City. The champions were honored for their achievements toward water and environmental sustainability in the Philippines. The annual WWD.PH is organized by Maynilad and the National Water Resources Board (NWRB), in partnership with 22 government and private organizations.
Inspiring Filipina Entrepreneur. Lydia Codiñera, president of the Samahang Tubig Maynilad (STM)-Tondo, was hailed by GoNegosyo as one of this year’s 20 Inspiring Filipina Entrepreneurs at the 10th Filipina Entrepreneur Summit. Codiñera was awarded for pioneering the STM community in Tondo, Manila, which enabled some 1,000 urban poor residents to have water access and livelihood.
Global CSR Awards. Maynilad’s “Daloy Dunong” educational program for public school students won a Platinum Award under the “Excellence in Provision of Literacy and Education” category of the Global CSR Awards 2018. A Gold Award was also conferred to the water-for-the-poor programs, STM and Pag-asa sa Patubig Partnership (P3), under the “Best Community Program” category.
ISO Certifications. The ISO recertification and surveillance audit with expansion of scope of the company-wide Integrated Management System was successfully completed. Maynilad passed the new version standard in quality (ISO 9001:2015) and environmental (ISO 14001:2015) management. The occupational health and safety management (OHSAS 18001:2007) was also part of the recertification.
Central Laboratory. Construction of a new building to house Maynilad’s expanded Central Laboratory began. To be equipped with state-of-the-art instruments, the P70.4-million facility will enable Maynilad’s in-house chemists to monitor more compounds that are now part of the new quality parameters set by the Department of Health’s updated Philippine National Standards for Drinking Water.
Brigada Eskwela. Employee-volunteers participated in refurbishing classrooms and upgrading water and sanitation facilities in 166 public schools throughout the West Zone. Maynilad kicked off its annual “Brigada Eskwela” by installing 26 bidets and replacing broken faucets and toilet flushes at the Malinta Elementary School in Valenzuela City.
Investors in People. Maynilad earned its Investors in People (IiP) standards accreditation, confirming that its people management practices meet international standards. The IiP is a globally recognized institution that sets the standards for people management excellence. It has over 10,000 accredited organizations in 78 countries all over the world.
New Technology. Maynilad starting using an advanced algae monitoring probe to address the algae presence in the raw water of Laguna Lake. The P3.9-million fluorescence technology acquired from Germany now supports the water production process of the Putatan Water Treatment Plant (PWTP) in Muntinlupa City.
Philippine Quill Awards. Maynilad bagged three Excellence and eight Merit Awards at the 16th Philippine Quill Awards organized by the International Association of Business Communicators (IABC). Excellence Awards were given to “Isang Dekada, Dala ay Ginhawa” 10th Anniversary Campaign, “Daloy Dunong” water education program, and Maynilad’s 10th Anniversary Video.
Singapore International Water Week. Maynilad President and CEO Ramoncito S. Fernandez presented the Maynilad experience at the Singapore International Water Week’s “Water Leaders Summit.” Mr. Fernandez joined a panel of industry leaders in discussing major issues in ensuring a sustainable and resilient water future.
Research Partnership. Maynilad, Metro Pacific Water (MPW) and UP Diliman launched a partnership called Daloy Research Program for the advancement of water research. The program grants scholarships to full-time graduate engineering students who wish to pursue research on water source development, water treatment, wastewater management, non-revenue water, smart water technologies, and resource recovery from wastewater.
How wePerformed
Jan
Jul
Feb
Mar
Apr
May
Jun

MAYNILAD 2018 ANNUAL REPORT 13
ISO Certification. Maynilad was recommended for certification in ISO 22301:2012 for Business Continuity Management Systems (BCMS) after passing the Stage 2 certification audit conducted by TUV Rheinland Philippines.
Manila Bay Cleanup. Maynilad organized 500 volunteers from the government and private sectors to take part in the “Save Manila Bay” cleanup drive. The activity is in line with multi-sectoral efforts to clean up, rehabilitate and preserve Manila Bay. More than 100 Maynilad employees participated in the activity.
Junior Water Camp. The Maynilad Water Academy organized the second “Junior Water Camp,” an educational program that promotes the application of science and technology in the water industry. The camp featured lectures, demonstrations, and hands-on activities for junior high school students.
Plant for Life. Maynilad kicked off its “Plant for Life” tree-planting activities for 2018 with a commitment to plant 100,000 tree saplings and mangrove propagules over a land area of approximately 47 hectares. Since its inception, the program has seen over 630,000 trees and mangroves planted at the Ipo, Laguna Lake and Malabon watersheds, as well as the coastal areas of Manila Bay.
International Coastal Cleanup (ICC). Around 135 employee-volunteers from Maynilad participated in the 32nd ICC held simultaneously in different sites along Manila Bay, from Navotas all the way to Bacoor, Cavite. Led by President and CEO Ramoncito S. Fernandez, the Maynilad contingent was stationed along the Las Piñas-Parañaque Critical Habitat and Ecotourism Area in Las Piñas City.
BERDE Certification. The Maynilad Safety Center was granted a BERDE 2-Star Certificate by the TUV Rheinland and Philippine Green Building Council. BERDE, which stands for “Building for Ecologically Responsive Design Excellence”, is the country’s green building rating assessment and certification recognized by the World GBC or Green Building Council. Maynilad is the first among water utility companies in the Philippines to receive this certification.
Marawi Response. Engineers from Maynilad were sent to Lanao del Sur to assist in the full recovery of war-stricken Marawi City. The engineers provided technical expertise for rehabilitating Marawi’s water system. Commissioned by the International Committee of the Red Cross (ICRC), the project involved the conduct of a study on Marawi City’s current pipeline condition, distribution network and water quality.
Global Handwashing Day (GHD). To celebrate GHD, Maynilad visited over 10 schools in Valenzuela, Quezon City, Manila, Las Piñas, Imus in Cavite, and Bustos in Bulacan, reaching some 3,000 schoolchildren to teach them about the value of good health and hygiene. GHD is an international advocacy for promoting proper handwashing with clean water and soap to prevent the spread of diseases.
Partnership with Waze. Maynilad announced its partnership with traffic and navigation app Waze to mitigate the impact of its activities on traffic flow in the metropolis. Through Waze’s “Connected Citizens Program,” Maynilad will upload to the Waze map real-time data on its road-digging activities, including projects that may require road closures.
Pasig River Rehabilitation. Maynilad, MWSS and the Pasig River Rehabilitation Commission (PRRC) joined forces with the local government of Manila to rehabilitate four polluted esteros in Manila over the next three years.
MOU for Protection of Waterways. Maynilad and other government agencies signed a landmark MOU that seeks to protect waterways in Metro Manila from the indiscriminate discharge of untreated wastewater by establishments and villages. The MOU assigns roles to relevant agencies in rehabilitating the Manila Bay in compliance to the Philippine Clean Water Act.
Golden Kubeta Awards. In celebration of World Toilet Day, Maynilad held its second “Golden Kubeta Awards”, a social media contest that recognizes the best public restrooms in the Philippines. Out of over 400 entries, three restrooms were declared winners based on their cleanliness, functionality, overall comfort and amenities. These were: Xentro Mall in Antipolo City (first place), Government Service Insurance System office in Pasay City (second place), and Troi Oi Vietnamese Restaurant in Iloilo City (third place).
Aug
Sep
Oct
Nov
Dec

14 Sustaining Growth
Chairman’s Message
14

MAYNILAD 2018 ANNUAL REPORT 15
TO OUR DEAR STAKEHOLDERS,After years of straddling uncertainty and growth, we have finally moved past what has so far been the most challenging part of our 11-year history. I am happy to note that we went back on track and regained our momentum in 2018. I see this as a result of three distinct factors: Our openness to change, our commitment to long-term goals, and our focus on priorities.
15

16 Sustaining Growth
We also made headway toward our NRW reduction goals through our investments in leak detection, repairs, and pipe replacement. By addressing over 21,000 pipe leaks and replacing 256 kilometers of old pipes in 2018, we managed to reduce NRW at the District Metered Area level to an average of 29.76% from 32.27% the previous year. I am proud to report that 56% of the water network that we inherited in 2007 has now been replaced. This has resulted in daily savings of 291 million liters of potable water, which are now being channeled to serve two million customers.
Building for resilienceWe closed 2018 with a capital expenditure (Capex) investment of P9 billion, bringing our total Capex investments to over P117 billion since 2007 when we took over ownership of Maynilad. This year, we focused on expanding and strengthening our network as a major strategy for building operational resilience. Taking our lessons from the recent years’ challenges, we have acknowledged that building resiliency is key to sustainable business growth and consistent operational efficiency.
One of our biggest undertakings in this area is the ongoing rehabilitation and upgrade of our La Mesa Treatment Plants (LMTP) 1 and 2, for which we have earmarked an investment of
Bottom lineDespite the challenging past few years, our business growth remained steady in 2018. Revenue grew by 6% from P20.77 billion in 2017 to P22.02 billion in 2018. Our net income rose by 7.5% from P6.85 billion in 2017 to P7.37 billion in 2018.
We need to acknowledge the efforts of our Business Areas in expanding our water service coverage to 93.9%, which helped to grow billed volume by 3%. This translates to over 52,000 new accounts connected to our network, bringing our total billed services to over 1.4 million—or 9.5 million people served—despite a 0.6% decrease in water supply.
We also saw major positive results in our wastewater services targets, ushered in by improvements in our wastewater infrastructure. New sewage treatment plants (STP) were inaugurated in Pasay and Parañaque, and this brought our total number of wastewater facilities, including septage treatment plants, to 22 by 2018.
These facilities have a combined capacity to treat 664 million liters of wastewater, as well as 1,090 cubic meters of septage, per day. As a result of these developments, we were able to expand our wastewater coverage from 15.5% in 2017 to 20.4% in 2018, and our sanitation coverage from 10.7% in 2017 to 21.2% in 2018.
Regulatory issuesWe had major positive resolutions to our protracted regulatory challenges in 2018. Following Maynilad’s victory in its claim against the Undertaking Letters issued by the Philippine Republic, the Arbitral Tribunal—in a 2017 decision—ordered the Republic to compensate Maynilad for the delayed implementation of the appropriate tariffs for the Fourth Rate Rebasing Period. The Republic contested this ruling in 2018 by filing an application with the High Court of Singapore to set aside the Second Award. The contest was dismissed by the court.
Also in 2017, the Quezon City Regional Trial Court granted our petition to confirm and enforce the final award that we secured from the Arbitral Tribunal in December 2014. In 2018, this victory was affirmed by the Court of Appeals.
Finally, the successful conclusion of our Fifth Rate Rebasing is another positive development on the regulatory front. It brings in a sense of stability for the next few years, and allows us to commit more resources to sustaining our growth. Today, as we focus on carrying out our approved business plan, our priority has shifted to strengthening our productive working relationship with our regulators.
Growth means creating value for all stakeholders.But more than meeting bottom line targets, it also means embracing our responsibility to contribute to nation building, strengthening our commitment to public service, and tirelessly pursuing opportunities to become better in what we do.
Messages

MAYNILAD 2018 ANNUAL REPORT 17
P7 billion. These decades-old facilities are crucial to our operations, as these serve some nine million customers. We expect the rehabilitation and retrofitting to be completed in year 2020, by which time both plants should be better equipped to address extreme water quality issues, as well as withstand major earthquakes.
We also invested P102 million to equip our Putatan Water Treatment Plant (PWTP) with new technology to address the highly variable quality of raw water from Laguna Lake. Further expansion is underway with the construction of our PWTP 2. The new plant is expected to be fully operational by 2019, and will boost water supply for our customers in the south by an additional 150 million liters per day.
Beyond water“Higit sa tubig,” or “beyond providing water.” This has been a battle cry that has sustained and powered us to embrace the spirit of public service. In 2018, we continued our work of contributing to nation building through community development, environmental sustainability, and promoting safe water and sanitation to the future generation.
Our school-based advocacy called “Daloy Dunong” converted yet another 14,300 elementary students into Water Warriors, poised to become ambassadors of good hygiene, proper waste management, and water resource conservation. We also introduced “Talakay Tubig” as a counterpart, to engage communities in understanding the role of water and wastewater in sustainable development.
This is the year that we grew in strength through the partnerships we built. We teamed up with the Pasig River Rehabilitation Commission and the Manila Bay SUNSET Partnership Program, Inc. to help promote the importance of our wastewater services to the continuous rehabilitation of the Pasig River and Manila Bay. From sharing of technical information through our internal resource persons, this partnership has evolved into concrete
action, including monthly cleanups, awareness drives and seminars.
Along with our drive toward inclusive access to safe water through our Samahang Tubig Maynilad (STM) and Pag-Asa sa Patubig Partnership (P3) programs, we have also instituted projects that empower our beneficiary communities to become environmentally conscious and economically sustainable.
The success story of STM-Tondo president Lydia Codiñera, who was awarded as one of the “20 Inspiring Filipina Entrepreneurs” by GoNegosyo in 2018, exemplifies the positive change that our corporate social responsibility programs yield. One of the recipients of our livelihood program, she led members of her women’s cooperative out of financial instability through Kapwa, a line of hygiene products that they produce and package.
Lydia and the many other recipients of our programs validate the work that we do and inspire us to do more, for other families and communities.
Organizational capabilityWe launched the Next Generation (NextGen) Maynilad program in 2016. A brainchild of Maynilad President and CEO Mon Fernandez, the three-year corporate transformation strategy aimed to advance the three key pillars of operational efficiency, business growth and organizational capability. The success of the strategy depended on our preparedness to address cross-cutting challenges through collaboration. Three years later, the benefits of NextGen are felt and seen in our people, processes, and bottom line.
Among the organizational innovations that we introduced were inter-departmental teams tasked to address major issues, such as NRW reduction and project management. The consultative and collaborative nature of these groups allowed us to bring varying perspectives together and speed up decision making on complex,
multi-dimensional problems.
We set up new departments and divisions for both fresh and foreseen challenges. Among these new groups are the Integrated Asset Management, which has implemented an enterprise-level strategy for maximizing use of our assets and prolonging their productive life cycle; and the Enterprise Risk Management and Internal Audit, which makes sure that risks to our processes are mitigated, if not addressed, and compliance to all standards and processes are monitored. The creation of these new groups speaks volumes about the Maynilad organization’s renewed focus and discipline in meeting service obligations and promoting business efficiencies.
Defining growthThus far, our experiences in reviving and raising Maynilad into one of the leading water and wastewater service companies in the region provide us with a rich definition of what “growth” should be.
Growth means creating value for all stakeholders. But more than meeting bottom line targets, it also means embracing our responsibility to contribute to nation building, strengthening our commitment to public service, and tirelessly pursuing opportunities to become better in what we do.
Once again, let me thank and congratulate everyone for a fruitful 2018.
MANUEL V. PANGILINANChairman

18 Sustaining Growth
TO OUR VALUED STAKEHOLDERS,Allow me to start by thanking everyone for embracing change for the past three years. When I came in as President and CEO of Maynilad, I saw an organization made up of people with a purpose, immersed in their responsibilities and excellent in what they did.
With the “Next Generation Maynilad” (NextGen) program, we harnessed this collective commitment by institutionalizing collaboration, enhancing strategic thinking, and sharpening our focus on sustainability. Three years later, thanks to everyone’s cooperation, we are now seeing the results in terms of operational efficiency, business growth, and organization and people development. These remain to be the three pillars of our transformation.18

MAYNILAD 2018 ANNUAL REPORT 1919

20 Sustaining Growth
InfrastructureWe were busy building in 2018. Our various operating units met ourP9 billion Capex commitment for the year. We also completed more than 100 Capex projects, which contributed to meeting our service level obligations.
In 2018, we commissioned our new STPs in Pasay and Parañaque, which collectively added 123 million liters per day (MLD) to our existing wastewater treatment capacity. This is a huge step forward in our bid to protect community health and the environment through our wastewater management program.
Meanwhile, we partially commissioned the Putatan Water Treatment Plant (PWTP) 2—our second facility to tap raw water from Laguna Lake. It produced an initial 25 MLD, and will yield 150 MLD at full capacity by 2019. We also completed construction of our Aguinaldo Pumping Station and Reservoir in Imus, Cavite, as well as the rehabilitation of our Commonwealth Pumping Station and Binuksuk Reservoir in Quezon City. With these new water facilities, we essentially added more available supply for distribution in the network.
Reinforcing this is our NRW reduction initiative. We have managed to bring Average NRW down to 29.76% in 2018—a huge reduction considering that water losses used to be at a staggering 68% a mere 12 years ago.
To further enhance operational efficiency, we continue to automate more facilities and hook these up to our Central Control Room, where we can remotely monitor and control these facilities for faster response to operational concerns.
We instituted new policies and standards in 2018 to further improve efficiency in project management, pursuant to our NextGen directions. We now have a set of testing and commissioning standards for pumping
stations and reservoirs, even as a cost estimate policy is being developed for implementation in 2019. We also introduced the use of planning analytics as a tool for monitoring Capex projects. Our planners, designers, procurement personnel and implementers are now ready to update project statuses real-time, including the project financial status in terms of commitment and disbursement.
Human resourcesWe ended 2018 by revisiting our NextGen strategy three years from its launch. We went away with a refreshed strategy for the next five years, and sharpened our focus on organizational capability and efficiency. A key component of this undertaking is our competency-based performance management and development system, which seeks to ensure leadership continuity and sustain business competitiveness.
The development of leaders was of particular focus in ensuring the success of NextGen. We provided various learning opportunities covering education, mentoring, coaching and special assignments. These people development initiatives were complemented with fresh talent acquisition. The Maynilad Cadet Engineers Program continues to be at the forefront in building our internal talent pipeline. Investment in people development has gained even stronger traction, with an increase in total training hours of more than 18% versus last year.
As our organization faced new industry competitors, a comprehensive talent retention strategy was aggressively pursued to ensure that we retain our identified successors and key talents. Hence, we have kept our total attrition at low levels, and retained 100% of our identified top talents. This achievement was enabled by an integrated total rewards and recognition, and career management system that we have put in place, as a strategic effort to build a stronger internal talent and organic knowledge base.
While our challenges are evolving in complexity, our opportunities for growth within and outside the concession area are also expanding. A major part of our growth will depend on our ability to develop people to drive our business strategies. As we pursue our growth trajectory, we remain committed to shaping homegrown leaders and technical professionals to prepare them to be the next generation of leaders of our organization.
Customer experienceIn 2018, we continued our efforts to improve customer responsiveness, starting with the creation of a Customer Experience Department that is given the singular task of initiating innovations on customer service delivery. Proactive steps that have been undertaken thus far include the re-engineering of processes, the conduct of competency-based development initiatives for upgrading of service excellence among Business Area (BA) personnel, and the development of performance measures for customer experience.
Realizing the importance of the people who deliver the service to our customers, we embarked on a competency development program involving the complete assessment and conduct of training and other interventions that will allow our employees to provide the kind of service that is consistent with our NextGen aspirations. Assessment of zone personnel was completed in 2018, and trainings will commence in the succeeding year.
Meanwhile, from application to billing, to complaint resolution and prevention, we used technology to improve intuitiveness, offer more touchpoints and convenience for our customers, and automate processes so we can meet the ever-evolving standards ofcustomer experience.
We have fully linked all of our BA offices, and implemented a centralized customer management system that now allows accepting applications
Messages

MAYNILAD 2018 ANNUAL REPORT 21
Maynilad engineers at the Putatan Water Treatment Plant, which taps raw water from Laguna Lake.

22 Sustaining Growth
for a new water service connection in any BA office, regardless of where the customer’s property is located.
Further, we sought to streamline the process of applying for a Maynilad water service connection by partnering with the local government of Quezon City, which is seeking to promote “ease of doing business” among its constituents. Through this partnership, Quezon City residents applying for a new service connection with Maynilad will now get faster application approvals, as the processing of the required excavation permits and restoration works will be trimmed down from the current 10 to 14 processing days to only two processing days. It will also entail fewer visits to the city hall for the applicant, as Maynilad’s BA offices may now accept the application for excavation permits. This will be fully implemented next year, and we hope to enter into similar partnerships with other LGUs within our concession area.
We started implementation of our Automated Customer Communication project in 2018 by setting up a single platform for internal inputs on all emergency activities, as well as planned maintenance activities that may result in water service interruptions. It enables complete visibility of the network in our Central Control Room and provides
real-time data to our contact center partners and BA offices, allowing them to provide timely advisories or promptly address customer inquiries. By 2020, the system should be able to automatically generate and release customer advisories upon uploading of the information.
Further customer convenience was made available in billing and payments. We elevated our billing services to the digital space by developing our billing portal where customers can now enroll to get their electronic billing and payment reminders, as well as information on their consumption history. Automated tracking of abnormal increases and decreases in bills was likewise implemented to allow for proactive and early verification before bills are rendered to customers. We also piloted the “Pay and Go” kiosk payment system in three BA offices, for full rollout by 2019.
The feedback of our customers is important to us and consistently drives the direction for our customer experience enhancement strategy. While we improve our network infrastructure to provide faster turnaround times, we continue to listen to the voice of our customers through external customer surveys and our zone specialists, who constantly keep in touch with our customers on how we can serve them better.
Good housekeepingWe created new roles within the organization for people and teams to focus on identifying and addressing risks, as well as tightening up processes. Consequently, quarterly assessments are now being done on the state of internal controls and associated risks. Consistent advisories of the top 10 risks have helped the entire organization plan and implement their activities around mitigating these risks.
To further embed awareness of risks and controls in the organization, we have put in place several important policies. Our Whistleblower Policy should encourage employees to proactively contribute to enforcing Maynilad’s core values and ethical standards. Our Incident Management Policy lays down the procedure for fact-finding investigations triggered by reports. Finally, our Risk Management Policy is meant to guide our newly formed Risk Core Team in identifying, assessing and mitigating enterprise-level risks.
Beyond 2018, increasing our internal capabilities to evaluate risks and promote corporate governance will continue to be a major focus of our transformation strategy.
In 2018, dialogues and conferences involving the management committees and department heads were held to chart our roadmap for the second phase of NextGen. In the next three years, we shall focus on sustaining our growth, taking the resilience that we have built over the years, and meeting new challenges with a collaborative attitude.
Messages

MAYNILAD 2018 ANNUAL REPORT 23
Water qualityIn 2018, we intensified our efforts to address water quality issues: a major risk factor for the past few years. We built a new structure within the La Mesa Compound to house our expanded Central Laboratory, and invested in state-of-the-art instruments that now allow us to more effectively monitor and test water quality. This P77.88-million facility upgrades our capability to monitor more compounds, in compliance with the new quality parameters set by the Department of Health’s updated Philippine National Standards for Drinking Water (PNSDW).
We also channeled more resources to upgrading our treatment plants’ capacity to address turbidity. In 2018, we began work on our sedimentation basins at La Mesa Treatment Plant (LMTP) 1, as part of our P7-billion rehabilitation project for our two facilities in Quezon City. We are bringing in additional treatment technologies to make sure that we can address the dramatic shifts in raw water quality caused by climate change, especially during the rainy season. By year 2022, our LMTP 1 and 2 should be able to treat up to 2,000 nephelometric turbidity units (NTU) from only 300 NTU.
Even as we completed construction of PWTP 2, we were also able to complete the upgrading of our PWTP 1, which uses large-scale ultrafiltration and reverse osmosis. The P102-million upgrade involved the installation of additional reverse osmosis assemblies to increase treatment capacity by another 20 MLD. The new technology is expected to improve the plant’s ability to address varying raw water conditions in Laguna Lake.
When completed, these upgrades will contribute to business continuity by enabling us to address extreme water quality issues without having to significantly reduce production.
ISOOur efforts to build resilience in times
of disasters and emergencies have been acknowledged last year when we were conferred the ISO certification in Business Continuity Management Systems (BCMS) by third-party auditor TUV Rheinland Philippines. ISO 22301:2012 is given only to organizations or institutions that are able to identify and address disruptive incidents, and continue to function when they arise.
Informed by our own experiences and global best practices, we put together our own business continuity plan primarily to help mitigate risks and exposures. When they do happen, the plan also lays down standards and protocols to ensure that the flow of operations and service delivery is maintained, and their impact on the organization is managed.The ISO certification validates our commitment to ensuring sustained delivery and restoration of water service to customers during emergencies and calamity situations.
Next Generation MayniladWhat’s next for the Next Generation Maynilad?
Corporate transformation is a long and arduous process. When we launched NextGen, our goal was to start the process, evaluate our position after the first three years, redefine success, and set new targets for the next period.In 2018, dialogues and conferences involving the management committees and department heads were held to chart our roadmap for the second phase of NextGen. In the next three years, we shall focus on sustaining our growth, taking the resilience that we have built over the years, and meeting new challenges with a collaborative attitude.
RAMONCITO S. FERNANDEZPresident and Chief Executive Officer
The feedback of our customers is important to us and consistently drives the direction for our customer experience enhancement strategy.

24 Sustaining Growth

MAYNILAD 2018 ANNUAL REPORT 25

26 Sustaining Growth
The Parañaque Wateer Reclamation Facility uses Conventional Activated Sludge technology to remove pollutants from wastewater collected from about 100,000 Maynilad customers in Parañaque City before its discharge to the Malabon Creek, which eventually flows out to Manila Bay.
All operational processes of Maynilad are enabled by technology—from the reduction of water losses, to the enhancement of water treatment capabilities, to the distribution of supply for millions of customers.
OperationalHighlights

MAYNILAD 2018 ANNUAL REPORT 27
Network EnhancementsOur end-to-end approach to reducing non-revenue water (NRW) brought significant results in 2018. Aside from tracking water lost in our network of pipes, we invested in plant metering technology to generate more accurate NRW data. In 2018, we were able to successfully measure the outputs of our La Mesa Treatment Plants (LMTP) 1 and 2, allowing us to calculate Total NRW from the output down to the District Metered Areas (DMA).
We also completed installation of a customized ultrasonic flow meter sensor in our Bagbag Reservoir in Novaliches, Quezon City—an underground reservoir that catches 100% of the output of LMTP 1 and 8% of LMTP 2, which makes it crucial to track how much and where water is lost in the system.
Upgrading of our pipe system continued in 2018, with a total of 256 kilometers of old pipes replaced. We beefed up our leak detection and inspection capabilities by investing in another Sahara® unit, a state-of-the art leak detection technology that allows pipeline inspection for leaks from aboveground without the need for service interruption. Because of this, we were able to cover 5,295.47 kilometers of secondary lines and 521.34 kilometers of primary lines at a success rate of 99%. Using data that the system generated, we identified and repaired 21,382 small leaks and 104 leaks in our primary lines.
Finally, as part of our ongoing massive meter replacement, we pulled out and replaced 104,168 old meters with new ones. Since 2012, we have consistently earmarked resources to replace small meters installed from 2005 and earlier. This has resulted in improved billing accuracy and reduced instances of meter malfunction.
As a result of all these initiatives, our average NRW at the DMA level went down from 32.3% in 2017 to only 29.8% in 2018. This, despite interruptions to NRW activities when we had to prioritize production due to water supply and water quality issues. For 2019, we are pushing to further reduce DMA-NRW to 27% and Total NRW to 37% (from 39.5%) this year.
Replaced Pipes (in KM) No. of Repaired Leaks
2014 2014
2016 2016
2015 2015
2017 2017
2018 2018256 21,382
286 26,792
196 27,936
235 27,650
170 36,967

28 Sustaining Growth
OperationalHighlights

MAYNILAD 2018 ANNUAL REPORT 29
The sedimentation basins at La Mesa Treatment Plant 1 are being fitted with tube settlers and sludge scrapers, thus increasing the plant’s capacity to address high turbidity in the raw water.
30 Sustaining Growth
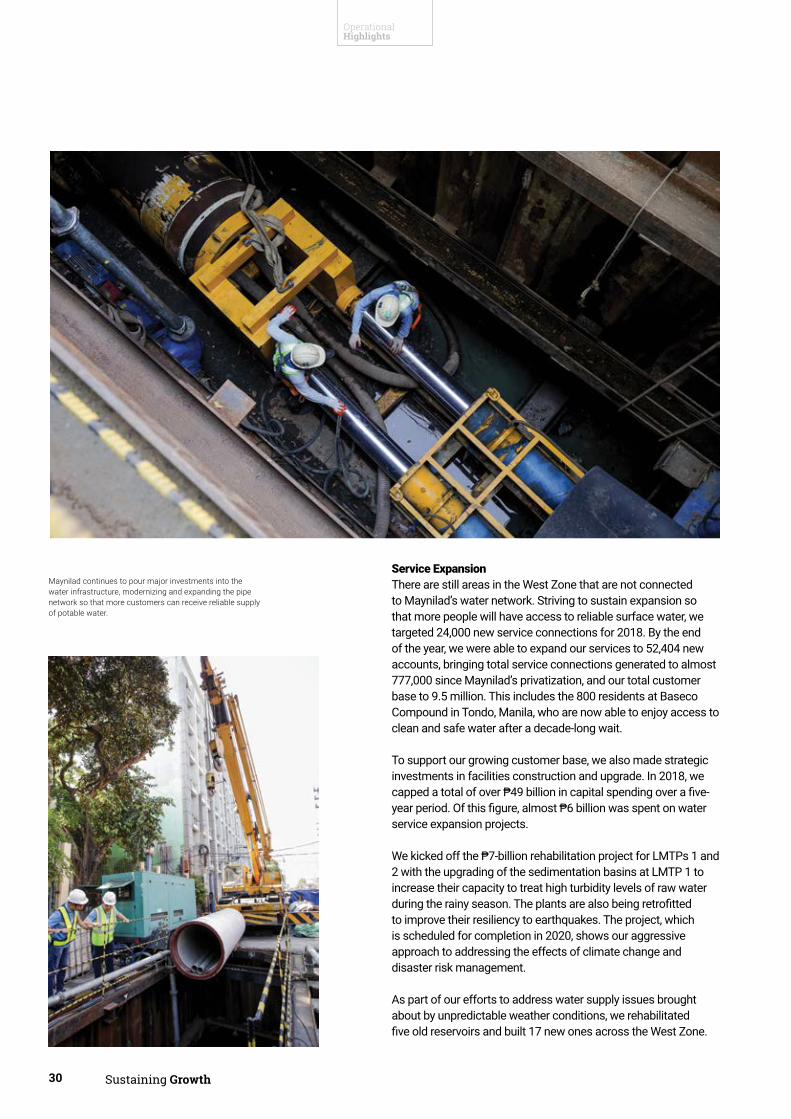
Service ExpansionThere are still areas in the West Zone that are not connected to Maynilad’s water network. Striving to sustain expansion so that more people will have access to reliable surface water, we targeted 24,000 new service connections for 2018. By the end of the year, we were able to expand our services to 52,404 new accounts, bringing total service connections generated to almost 777,000 since Maynilad’s privatization, and our total customer base to 9.5 million. This includes the 800 residents at Baseco Compound in Tondo, Manila, who are now able to enjoy access to clean and safe water after a decade-long wait.
To support our growing customer base, we also made strategic investments in facilities construction and upgrade. In 2018, we capped a total of over P49 billion in capital spending over a five-year period. Of this figure, almost P6 billion was spent on water service expansion projects.
We kicked off the P7-billion rehabilitation project for LMTPs 1 and 2 with the upgrading of the sedimentation basins at LMTP 1 to increase their capacity to treat high turbidity levels of raw water during the rainy season. The plants are also being retrofitted to improve their resiliency to earthquakes. The project, which is scheduled for completion in 2020, shows our aggressive approach to addressing the effects of climate change and disaster risk management.
As part of our efforts to address water supply issues brought about by unpredictable weather conditions, we rehabilitated five old reservoirs and built 17 new ones across the West Zone.
Maynilad continues to pour major investments into the water infrastructure, modernizing and expanding the pipe network so that more customers can receive reliable supply of potable water.
OperationalHighlights

MAYNILAD 2018 ANNUAL REPORT 31
This added 311 million liters to our storage capacity, effectively doubling it from 2007 when we took over Maynilad. From only 10 in 2007, we now have 32 fully operational reservoirs with a combined capacity of 711 million liters. These developments also enabled us to reach previously unserved areas, as well as better manage pressure when supply is compromised.
We currently operate 28 pumping stations, 32 water reservoirs and three world-class water treatment plants. Our expanded Central Laboratory for water testing complement these mission-critical facilities to ensure that with access comes the assurance that our water supply remains clean and safe despite external and extraordinary threats.
We have also made huge strides in the effort to expand our presence beyond the West Zone. With stronger business development teams, we were able to sign up renewals and new businesses that pulled revenues in this space by 329% from last year.
Our Maynilad Water Academy remains to be the center of excellence in the local and regional water utility industry. In 2018, our homegrown experts were commissioned to provide technical expertise to such projects as the Marawi rehabilitation, and various capacity-building activities for local water utilities on wastewater treatment, NRW, and water supply operations.
We will continue to champion business expansion beyond the West Zone, and nurture organic expertise by providing opportunities for knowledge sharing.
With its state-of-the-art instruments and an expanded Central Laboratory, Maynilad upgrades its capability to monitor and test water quality.

32 Sustaining Growth
Wastewater ManagementBefore we took over Maynilad in 2007, sewerage coverage was at a measly 6% with only two operating STPs. Twelve years later, after doubling our customer base and infusing over P25 billion for our wastewater facilities expansion, we have also managed to meet our catch-up targets for the past few years.
The biggest highlight in our wastewater operations for 2018 was the completion, inauguration and successful process-proving of our STPs in Pasay and Parañaque. This development was instrumental in raising our sewerage coverage from 15.5% in 2017 to 20.4% this year.
In addition to the new Pasay and Parañaque Water Reclamation Facilities (WRF), we also spent P70 million to rehabilitate our Dagat-Dagatan Sewage and Septage Treatment Plant to improve its efficiency. It currently treats wastewater collected from around 16,000 customers in Caloocan, Malabon and Navotas, as well as the septage from over 4 million customers in the northern part of the West Zone. The plant rehabilitation is expected to be completed in early 2019.
Because of our heightened focus on wastewater management, we were able to connect an additional 4,441 new sewer service domestic accounts to our network. This further increased the volume of wastewater treated to 64.0 MCM (million cubic meters) from last year’s 59.5 MCM. For unconnected customers, we were able to double our sanitation coverage from 10.7% in 2017 to 21.2% in 2018—still on track to catch up on the target of attaining 81% within the 2017 to 2021 sanitation cycle.
We currently operate 19 STPs, two joint Sewage and Septage Treatment Plants, one Septage Treatment Facility, and 66 Lift/Pump Stations. We are aiming for 100% sewerage coverage by 2037 when our concession period ends. Before then, we will continue to complement wastewater network expansion by offering sanitation services to customers in unsewered areas.
We also recognize the importance of environmental protection to wastewater management. In 2018, we forged an institutional partnership with the Pasig River Rehabilitation Commission for the rehabilitation of four of the most polluted esteros in Manila over the next three years. The collaboration will lessen the pollution load into waterways, in compliance with the Supreme Court’s directive to clean up, rehabilitate and preserve Manila Bay. The project is also expected to benefit over 11,000 households along Estero dela Reina, Estero de Sunog Apog, Estero Magdalena and Estero de Concordia.
The completion of a new STP in Parañaque was one of the highlights of Maynilad’s wastewater management efforts for 2018, as the facility was instrumental in significantly increasing sewerage coverage.
OperationalHighlights

MAYNILAD 2018 ANNUAL REPORT 33
As of 2018, Maynilad operates 19 Sewage Treatment Plants, two Sewage and Septage Treatment Plants, and one Septage Treatment Plant. The company has a com-bined treatment capacity of an estimated 664,000 cubic meters of wastewater per day.
Through the operation of its sewage treatment plants, Maynilad helps to reduce pollution loading into bodies of water.

34 Sustaining Growth
OperationalHighlights

MAYNILAD 2018 ANNUAL REPORT 35
The new Parañaque Water Reclamation facility of Maynilad is the first large-scale Biological Nutrient Removal (BNR)-compliant wastewater treatment facility in the country. BNR is a new effluent standard mandated by the Department of Environment and Natural Resources under its “Water Quality Guidelines and General Effluent Standards of 2016” (DAO 2016-18).

36 Sustaining Growth
Organizational EfficiencyThe Maynilad NextGen corporate transformation strategy that we launched three years ago gave way to major organizational changes, enabling us to address emerging challenges from fresh and varying perspectives. These organizational developments continued in 2018, this time with a focus on financial and resource management, risk mitigation, and streamlining of processes.
Our new Enterprise Risk Management and Internal Audit Division (ERMIA) took to the task of assessing the state of Maynilad’s internal controls and orienting the organization on risk and controls awareness. To complement this, our Project Management Division ensures that Capex programs are implemented in an efficient and timely manner to avoid additional costs due to unnecessary delays.
Synergies were strengthened through multi-division technical working groups set up to address multi-dimensional problems. The result: Solutions that are
practical and well-thought out, taking into consideration the insights and expertise of relevant teams.
As always, technology cuts across our current processes and future plans for improvement. From NRW reduction to services delivery, all the way to disaster management and customer experience, Maynilad has been able to maximize the potential for increasing efficiency through technology. Even internal processes have improved considerably through the use of IT.
The renewed commitment to discipline and continuous learning among employees complemented these organizational movements. In 2018, we witnessed heightened focus on meeting targets across the organization through discipline and a renewed commitment to public service. Opportunities were provided for improving employee competency through technical trainings and leadership development, focusing on business and people management.
The creation of multi-division technical working groups promoted better synergies among employees and gave rise to vital solutions for various operational challenges.
OperationalHighlights

MAYNILAD 2018 ANNUAL REPORT 37
Customer ServiceWe sustained focus on exploring creative ways to provide a richer, more convenient experience to customers in 2018. From application to reconnection, enhancements to customer engagement were made throughout the process.
People can now apply for a new water service connection in any Maynilad Business Area office, regardless of where their property is located. Meanwhile, we are working with the local government of Quezon City to streamline the process of applying for an excavation permit. If we can fully establish this process improvement in Quezon City by 2019, we intend to replicate it in other local governments across the West Zone.
The continuous digitization of our customer processes has also allowed us to further improve turnaround times and customer access to account information. Applicants can now receive updates on their application status by SMS (short message service). We have also activated billing and payment reminders in our Customer Communication Portal. Customers who have enrolled in this service can now receive payment reminders, overdue notices and disconnection notices via SMS and email. Even the waiting time for reactivation of disconnected services
has been reduced from 48 hours after payment to as short as same day for payments received by 12 noon in Bayad Centers.
In 2018, we received the Customer Center of Expertise Award (CCOE) from SAP, our partner in customer experience solutions. The CCOE is given to SAP clients that exhibit best practices in service delivery and business innovation enablement. This validates our commitment to serving our customers the best way we can.
We have also partnered with Paymaya to provide more convenient modes of payment to our customers. Aside from this, we piloted setup of our “Pay and Go” kiosks, initially in three Business Areas. This self-service payment system lets customers pay application fees for new water service connections and reactivations. All Business Areas will have the “Pay and Go” kiosk in 2019.
We continued to listen to customers’ insights in 2018. Customer satisfaction surveys were conducted in our Business Areas, and this was followed through with a focus group discussion on our digital services offered through our Maynilad App and Portal. The responses gathered through these studies will be used to further improve the way we serve our customers.
Maynilad continues to empower its people through training and development programs.

38 Sustaining Growth

MAYNILAD 2018 ANNUAL REPORT 39

40 Sustaining Growth
After taking over Maynilad in 2007, we raised the bar for quality operations in the industry by securing ISO certifications in Quality Management Systems, Environmental Management Systems, and Occupational Health and Safety Management Systems for our Dagat-Dagatan Sewage and Septage Treatment Plant.
It was to be the first wastewater facility of its kind in the Asia-Pacific Region to be conferred the triple certifications.
Sustainability

MAYNILAD 2018 ANNUAL REPORT 41
Twelve years later, the efforts that we have consistently put into building sustainability and operational resiliency have paid off. Maynilad was recommended for certification in Business Continuity Management System (ISO 22301:2012) after passing the Stage 2 certification audit conducted by TUV Rheinland Philippines. This development acknowledges our adherence to a Business Continuity Plan that lays down procedures for managing disruptive incidents and restoring normal operation.
In 2018, the ISO recertification and surveillance audit with expansion of scope of the company-wide Integrated Management System was successfully completed. Maynilad passed the new version standard in quality (ISO 9001:2015) and environmental (ISO 14001:2015) management. The occupational health and safety management (OHSAS 18001:2007) is also part of the recertification. Nine additional sites and offices were added to the scope, bringing the company-wide ISO certification to 96% coverage in terms of manpower. The certifications were also conferred by TUV Rheinland Philippines, Inc.
Our Integrated Asset Management (IAM) team, which we set up in 2016 as part of our NextGen strategy, has started the groundwork for a comprehensive Enterprise Asset Management System with the official launch of our Computerized Maintenance Management System (CMMS). We also laid down crucial evaluation processes to identify critical equipment, review asset condition and performance, and develop asset maintenance programs based on data from these assessments.
By working on sustainability and operational resiliency, Maynilad continues to raise the bar for quality operations in the industry.
The Dagat-Dagatan Sewage and Septage Treatment Plant is the first facility of its kind in the Asia-Pacific Region to receive triple ISO certifications.

42 Sustaining Growth
Beyond 2019, IAM will continue to build and manage knowledge about our assets, their physical condition and performance, service levels, current utilization and ultimate capacity. This information will play a key role in management decision-making processes. It will also further empower us to build sustainability by ensuring that our assets are primed for use in the predictable future.
In 2018, we launched the 11th year of our “Plant for Life” tree-planting activities, a project intended to contribute to reforestation and afforestation efforts, and help prevent soil erosion and flooding in our vital watershed communities. Under our 2018 “Plant for Life” activity, 130,150 tree saplings and mangrove propagules were planted across approximately 47 hectares. These areas include Ipo Dam, Laguna Lake and Malabon watersheds, as well as the coastal areas of Manila Bay. We also registered our tree-planting activities as part of the “Annual Million Trees Challenge” of the MWSS.
Watershed protection also involves uplifting the lives of communities so that they become partners in preserving—rather than exhausting—watershed resources. In 2018, we sustained the livelihood opportunities that we initiated for the Dumagats of Ipo watershed. Our efforts to introduce sculpture making as an alternative livelihood for the Dumagats have successfully turned them away from slash-and-burn farming. From undergoing skills training to getting tools and equipment, they are now generating income from their craft through trade shows and Maynilad’s purchase of their art as our corporate gift.
In the future, we will continue to lead efforts to protect our vital watersheds through an inclusive and innovative approach.
Through the help of volunteers, Maynilad continues to expand implementation of its annual “Plant for Life” Program to cover more critical watersheds.
Sustainability

MAYNILAD 2018 ANNUAL REPORT 43
Maynilad’s mangrove-planting activities in coastal areas of Cavite help protect the shoreline from floods and also improve the quality of water in Manila Bay.
Volunteers from different government agencies, private companies and schools constantly sign up for Maynilad’s tree and mangrove-planting activities.

44 Sustaining Growth

MAYNILAD 2018 ANNUAL REPORT 45
Operating Highlights. For the twelve months ending December 31, 2018, Maynilad grew its billed volume by 3.0% to 527.15 million cubic meters (MCM) compared to 511.66 MCM last year. The improvement in the billed volume was brought about by the increase in billed services through its continued expansion mostly in the southern areas of the concession, namely in Cavite, Muntinlupa, Las Piñas and Parañaque. Total billed services for the period is 1,407,503, a 3.6% growth from last year.
Historically, NRW has been measured and reported at the DMA level. Average NRW at DMA level improved at 29.76% compared to 32.27% last year due to the sustained NRW reduction programs. However, beginning 2018, total NRW losses in the DMAs and primary lines can now be measured with the newly installed production meters in the water treatment plants. Average Total NRW for 2018 is 39.51%.
Consumption per connection slightly declined to 1.04 cubic meters per day (CMD) as the bulk of new water service connections were made in the south, particularly in Cavite, which has low-consuming customers.
Revenues. Combined revenues from water and sewer services grew 7.3% to P21.7 billion from P20.2 billion last year. The increase in revenues was primarily driven by the aforementioned 3.0% billed volume increase, a more favorable customer mix, inflation rate adjustment of 2.8% on Maynilad’s basic charge implemented on January 1, 2018 (versus 1.9% implemented on April 22, 2017), and tariff adjustment of 2.7% starting October 1, 2018.
Other fees and services which primarily consist of installation revenue and reconnection fees, reflected a decline of 72.9% to P99 million due to amortization of installation revenue over the term of the concession in compliance with PFRS 15 Revenue from Contracts with Customers.
Total revenues from operations amounted to P21.8 billion, a 5.9% increase from P20.6 billion last year.
Cash Operating Expenses. Total cash operating expenses declined 4.6% to P6.2 billion versus P6.5 billion last year primarily due to savings in personnel cost. All other expenses grew 7.7%.
Personnel costs, the Company’s single largest cost element, declined 20.8% to P2.2 billion as 2017 contains one-time expenses as a result of (a) Special Opportunity Program (SOP), a redundancy and right-sizing program to optimize headcount, and (b) accrual for reissuance of ESOP shares that have been bought back by the Company from separated employees availing of the SOP. Total number of employees at the end of 2018 stood at 2,204 versus 2,191 at the end of 2017. Productivity ratio improved at 1.57 employees per thousand connections versus 1.61 last year.
Operational Indicators Actual AODec-18
Actual AODec-17
Vs. Last Year
Units %
Water Supply (MCM) 750.84 755.38 (4.54) -0.6%
Water Billed Volume (MCM) 527.15 511.66 15.49 3.0%
% Water Billed to Supply 70.24 67.73 2.51 3.7%
Non-Revenue Water (%) DMA 29.76 32.27 (2.51) -7.8%
Non-Revenue Water (%) Total 39.51 — 39.51 —
Billed Water Services 1,407,503 1,358,758 48,745 3.6%
Average Connections 1,387,125 1,337,929 49,195 3.7%
Average CM per day 1.04 1.05 (0.01) -.6%
In Million Pesos AuditedDec-18
% to Rev AuditedDec-17
% to Rev Vs. Last Year
Peso %
Revenues
Water Services 17,811 81.8% 16,585 80.7% 1,226 7.4%
Sewer Services 3,852 17.7% 3,601 17.5% 251 7.0%
Total Service Revenues 21,663 99.5% 20,186 98.2% 1,476 7.3%
Other Fees & Services 99 0.5% 364 1.8% (265) -72.9%
Total Revenue ft Operations 21,761 100.0% 20,550 100.0% 1,211 5.9%

46 Sustaining Growth
Light and power average tariff rates decreased by 8.13%, offset by 1.07% higher electrical usage as a result of increased operating hours of pumping stations and in-line boosters to maintain service levels, and increased production and water treatment activities in the Putatan Water Treatment Plant. The net result is a decline in total light and power cost by 7.1% to P840 million.
Outside services grew 3.1% to P739 million due primarily to higher cost of security services. Repairs and maintenance (R&M) grew 49.8% to P668 million primarily due to SAP license maintenance and higher leak repairs. These four items are the Company’s largest cost elements, accounting for 72% of total cash expenses, and as a group declined 8.3%.
All other expense items accounting for 28% of the total increased 6.4% to P1.74 billion primarily due to higher chemicals and local taxes.
Non-Cash Operating Expenses. Under IFRIC 12, all property plant and equipment (PP&E) defined as parts of the network are considered intangible assets. These are no longer depreciated but are instead amortized over the life of the concession similar to concession fees. Concession assets (composed of concession fees and network PP&E) are considered intangible assets and are amortized over the life of the concession. Beginning 2013, the Company decided that given the large initial expenditures and the economic benefit of the concession asset being more closely aligned with the growth in billed volume, it would apply the unit-of-production (UOP) method, instead of the straight-line method, of amortizing its concession asset.
Amortization of intangible assets increased 13.9% to P2.7 billion from P2.4 billion last year, in line with the Company’s continuing capital expenditure program. Provisions grew 129.7% to P133 million mainly due to inventory obsolescence of unused materials returned by contractors after project completion. The Company’s average days sales outstanding (DSO) at the end of 2018 declined at 50 days versus 47 days at the end of 2017.
Net Income. With revenue growth coming from growth in billed services, CPI and R tariff adjustments, and an improved customer mix combined with savings in total operating expenses, income from operations grew 9.8% to P12.3 billion from P11.2 billion last year. Reported net income, on the other hand, grew 7.4% to P7.3 billion.
On February 22, 2018, the Company entered into several loan agreements for the refinancing of all its existing loans under the 2013 Term Loan and Corporate Notes, whereby the Company was granted a Term Loan Facility in the aggregate amount of
Financial Reviewand Analysis
In Million Pesos AuditedDec-18
% to Rev AuditedDec-17
% to Rev Vs. Last Year
Peso %
CASH OPERATING EXPENSES
Personnel Cost 2,235 10.3% 2,820 13.7% (585) -20.8%
Light & Power 840 3.9% 904 4.4% (65) -7.1%
Water Treatment Chemicals 311 1.4% 246 1.2% 66 26.7%
Outside Services 739 3.4% 717 3.5% 22 3.1%
Repairs and Maintenance 668 3.1% 446 2.2% 222 49.8%
MWSS MOE 127 0.6% 110 0.5% 17 15.1%
Real Estate/Business Tax 211 1.0% 181 0.9% 30 16.3%
Representation & Entertainment 90 0.4% 115 0.6% (24) -21.3%
Transport/Fuel & Oil 115 0.5% 98 0.5% 17 16.9%
Others 885 4.1% 885 4.3% — 0.0%
Total Cash Expenses 6,221 28.6% 6,552 31.7% (302) -4.6%
In Million Pesos AuditedDec-18
% to Rev AuditedDec-17
% to Rev Vs. Last Year
Peso %
NON CASH OPEX
Amort of Concession Asset 2,719 12.5% 2,387 11.6% 331 13.9%
Depreciation 357 1.6% 352 1.7% 6 1.6%
Provisions 133 0.6% 58 0.3% 75 129.7%
Total Non-Cash Expenses 3,209 14.7% 2,797 13.6% 412 14.7%

MAYNILAD 2018 ANNUAL REPORT 47
P18.5 billion. Under the new terms, the loan shall be drawn in three tenors; 7Y, 10Y and 15Y Fixed Corporate Notes, payable in semi-annual installments within fifteen years to commence at the end of the 6th month after the initial issue date and bears interest rate per annum equal to the applicable benchmark rate plus 0.60%, 0.70% and 0.60% spread per annum for the 7Y, 10Y and 15Y Fixed Corporate Notes, respectively. Refinancing cost amounted to P281 million.
Core net income for the period, which excludes one-time charges such as foreign exchange gains or losses, and refinancing cost, amounted to P7.7 billion, a 4.7% improvement from last year’s core net income of P7.4 billion.
EBITDA. Core Earnings before Interest, Taxes, and Depreciation (EBITDA) grew 9.3% to P15.3 billion versus P14.0 billion last year, an improvement in margin to 70.5% from 68.4% in the previous year.
Balance Sheet. As of December 31, 2018, Maynilad’s total assets grew 15.5% to P107.5 billion compared to P93.0 billion at the end of 2017 primarily due to continuing additions to concession assets. Concession assets continued to form bulk of total assets growing 12.5% net of amortization to P87.5 billion or 81.5% of the total assets of the Company.
Debt-to-equity ratio declined to 55:45 due to additional drawdown from the DBP and WB loans, and new loans from JCB and JICA.
In Million Pesos AuditedDec-18
% to Rev AuditedDec-17
% to Rev Vs. Last Year
Peso %
Revenues 21,761 100.0% 20,550 100.0% 1,211 5.9%
Cash Operating Expenses 6,221 28.6% 6,522 31.7% (302) -4.6%
Net Inc. bef. Non-Cash Opex 15,541 71.4% 14,028 68.3% 1,513 10.8%
Less: Non-Cash Opex 3,209 14.7% 2,797 13.6% 412 14.7%
Income from Operations 12,332 56.7% 11,231 54.7% 1,101 9.8%
Add (Less):
Interest Expense on Loans (1,536) -7.1% (1,135) -5.5% (401) 35.3%
Interest Accretion on CF (572) -2.6% (628) -3.1% 57 -9.0%
Other Income (Expense) 40 0.2% (170) -0.8% 210 -123.2%
Taxes (2,923) -13.4% (2,465) -12.0% (458) 18.6%
(4,991) -22.9% (4,399) -21.4% (592) 13.5%
Net Income 7,341 33.7% 6,832 33.2% 508 7.4%
Net Inc. ex Forex/ExtraOrd (Core) 7,707 35.4% 7,360 35.8% 347 4.7%
EBITDA 15,263 70.1% 13,706 66.7% 1,557 11.4%
EBBITDA ex Forex/ExtraOrd (Core) 15,347 70.5% 14,046 68.4% 1,301 9.3%
In Million Pesos As ofDec-18
% to Total As ofDec-17
% to Total Increase
Peso %
ASSETS
Cash/Short-Term Investments 11,485 10.7% 4,993 5.4% 6,492 130.0%
Accounts Receivable 2,957 2.8% 2,661 2.9% 296 11.1%
Other Current Assets 1,278 1.2% 2,449 2.6% (1,170) -47.8%
SUB-TOTAL: CURRENT ASSETS 15,720 14.6% 10,102 10.9% 5,618 55.6%
Concession Assets 87,527 81.5% 77,801 83.6% 9,726 12.5%
PP&E 1,232 1.1% 1,230 1.3% 3 0.2%
Deferred Tax Assets — 0.0% 463 0.5% (463) -100.0%
Other Non Current 2,973 2.8% 3,453 3.7% (480) -13.9
TOTAL ASSETS 107,452 100.00% 93,049 100.0% 14,404 15.5%
LIABILTIES & EQUITY
Accts Payable/Acc. Expenses 16,129 15.0% 12,954 13.9% 3,175 24.5%
Current Portion of LTD 322 0.3% 1,792 1.9% (1,470) -82.0%
Payable to MWSS (Current) 1,039 1.0% 1,217 1.3% (178) -14.6%
SUB-TOTAL: CURRENT LIABILITIES 17,490 16.3% 15,964 17.2% 1,527 9.6%
Long-Term Debt 33,869 31.5% 25,067 26.9% 8,802 35.1%

48 Sustaining Growth
Financial Reviewand Analysis
Investments. Acquired in August 2012 and owned 100% by Maynilad, PhilHydro owns and operates three plants that supply treated bulk water to the Legazpi City Water District (LCWD) in Albay, Norzagaray Water District and Santa Maria Water District in Bulacan and, starting March 2017, Bocaue Water District in Bulacan; and municipal waterworks of Bambang, Nueva Vizcaya. PhilHydro also owns and operates the treated water supply and distribution system of Rizal, Nueva Ecija. PhilHydro has a total plant capacity of 61 MLD and is currently operating at around 50 MLD as shown in the table below.
As of December 31, 2018, PhilHydro’s billed volumes increased 14.2% to 50.5 MLD versus 44.2 MLD last year primarily due to a 13.0% growth in Bulacan, as new pipe and filtration equipment capacity allowed for expansion in the water districts of Norzagaray and Santa Maria and serve the water district of Bocaue, a new customer. Also contributing to the billed volume growth is a 16.1% increase in Legazpi as new water demands coming from LCWD’s recently completed pipe-laying project are supplied starting May 2018. PhilHydro generated revenues of P262 million and income from operations of P49 million. Contribution to Maynilad after amortization of goodwill from acquisition was P25 million and P106 million contribution to core EBITDA.
On January 28, 2013, Maynilad won the bid to acquire 10% of Subic Water and Sewerage Company Inc. (“Subicwater”) from the city of Olongapo for P211 Million. After the expiry of the right of first refusal of Subicwater’s existing shareholders to acquire the shares, Maynilad signed the deed of sale for the acquisition on March 15, 2013.
Subicwater operates the water supply and sewerage system in the Subic Bay Freeport and the water system in Olongapo City, under a franchise agreement expiring in 2027. Billed connections at the end of 2018 reached 44,910 accounts while average NRW stood at 28.14%. Unaudited gross revenues amounted to P707.41 million while net income was at P197.55 million.
Consolidated Income Statement. With the addition of PhilHydro, Maynilad’s consolidated revenues in 2018 increased by P262 million, consolidated core net income increased by P25 million, and consolidated core EBITDA increased by P106 million, compared to Maynilad’s performance on a stand-alone basis.
In Million Pesos As ofDec-18
% to Total As ofDec-17
% to Total Increase
Peso %
Payable to MWSS (Noncurrent) 6,012 5.6% 6,242 6.7% (231) -3.7%
Deferred Credit 732 0.7% 687 0.7% 45 6.6%
Accrued Retirement 447 0.4% 594 0.6% (147) -24.7%
Other Non Current 746 0.7% 773 0.8% (27) -3.5%
TOTAL LIABILITIES 59,296 55.2% 49,236 53.0% 9,969 20.2%
STOCKHOLDERS’ EQUITY 48,156 44.8% 43,722 47.0% 4,434 10.1%
TOTAL LIABILITIES & EQUITY 107,452 100.0% 93,049 100.0% 14,404 15.5%
Plant/Site Capacity Years Ended December 31
2013 2014 2015 2016 2017 2018
Legazpi, Albay 25.0 17.4 15.0 15.9 15.7 16.4 19.0
Norzagaray, Bulacan 32.0 9.1 11.2 14.7 16.4 25.2 28.5
Bambang, Nueva Vizcaya 2.5 0.9 1.1 1.4 1.6 1.8 2.1
Rizal, Nueva Ecija 1.5 0.5 0.5 0.6 0.7 0.8 0.9
61.0 27.9 27.8 32.6 34.4 44.2 50.5
In Million Pesos As ofDec-18
% to Rev As ofDec-17
% to Rev Increase
Peso %
Revenues 22,024 100.0% 20,774 100.0% 1,249 6.0%
Cash Operating Expenses 6,385 29.0% 6,656 32.0% (271) -4.1
Net Inc. bef. Non-Cash Opex 15,639 71.0% 14,118 68.0% 1,521 10.8%
Less: Non-Cash Opex 3,258 14.8% 2,839 13.7% 419 14.7%
Income from Operations 12,381 56.2% 11,279 54.3% 1,102 9.8%
Add (Less):
Interest Expense on Loans (1,549) -7.0% (1,150) -5.5% (399) 34.7%

MAYNILAD 2018 ANNUAL REPORT 49
Consolidated Balance Sheet. Including PhilHydro’s assets resulted in consolidated assets of P107.9 billion, P468 million higher than Maynilad’s assets on a stand-alone basis.
In Million Pesos As ofDec-18
% to Rev As ofDec-17
% to Rev Increase
Peso %
Interest Accretion on CF (572) -2.6% (628) -3.0% 57 -9.0%
Other Income (Expense) 53 0.2% (179) -0.9% 232 -129.5%
Taxes (2,945) -13.4% (2,469) -11.9% (477) 19.3%
(5,013) -22.8% (4,426) -21.3% (587) 13.3%
Net Income 7,368 33.5% 6,853 33.0% 515 7.5%
Net Inc. ex Forex/ExtraOrd (Core) 7,731 35.1% 7,379 35.5% 352 4.8%
EBITDA 15,374 69.8% 13,787 66.4% 1,587 11.5%
EBBITDA ex Forex/ExtraOrd (Core) 15,454 70.2% 14,136 68.0% 1,318 9.3%
In Million Pesos As ofDec-18
% to Total As ofDec-17
% to Total Increase
Peso %
ASSETS
Cash/Short-Term Investments 11,549 10.7% 5,019 5.4% 6,529 130.1%
Accounts Receivable 2,859 2.6% 2,602 2.8% 257 9.9%
Other Current Assets 1,304 1.2% 2,481 2.7% (1,177) -47.5%
SUB-TOTAL: CURRENT ASSETS 15,712 14.6% 10,102 10.8% 5,609 55.5%
Concession Assets 88,108 81.6% 78,392 83.8% 9,716 12.4%
PP&E 1,401 1.3% 1,409 1.5% (8) -0.6%
Deferred Tax Assets — 0.0% 463 0.5% (463) -100.0%
Other Non Current 2,699 2.5% 3,151 3.4% (451) -14.3%
TOTAL ASSETS 107,920 100.0% 93,516 100.0% 14,404 15.4%
LIABILTIES & EQUITY
Accts Payable/Acc. Expenses 16,205 15.0% 13,050 14.0% 3,155 24.2%
Current Portion of LTD 354 0.3% 1,816 1.9% (1,462) -80.5%
Payable to MWSS (Current) 1,039 1.0% 1,217 1.3% (178) -14.6%
SUB-TOTAL: CURRENT LIABILITIES 17,598 16.3% 16,083 17.2% 1,514 9.4%
Long-Term Debt 34,051 31.6% 25,281 27.0% 8,770 34.7%
Payable to MWSS (Noncurrent) 6,012 5.6% 6,242 6.7% (231) -3.7%
Deferred Credits 732 0.7% 687 0.7% 45 6.6%
Accrued Retirement 448 0.4% 595 0.6% (147) -24.7%
Other Non Current 797 0.7% 808 0.9% (10) -1.3%
TOTAL LIABILITIES 59,638 55.3% 49,696 53.1% 9,942 20.0%
STOKCHOLDERS’ EQUITY 48,282 44.7% 43,820 46.9% 4,461 10.2%
TOTAL LIABILITIES & EQUITY 107,920 100.0% 93,516 100.0% 14,404 15.4%

50 Sustaining Growth

MAYNILAD 2018 ANNUAL REPORT 51

52 Sustaining Growth
In the Pipeline

MAYNILAD 2018 ANNUAL REPORT 53
One of the medium-term solutions to water supply problems in the south is the full operation of our new Putatan Water Treatment Plant 2 (PWTP 2). It began yielding about 25 MLD by end of 2018 but will become fully operational with an output of 150 MLD by 2019. Upgrading and rehabilitation of the 10-year-old PWTP 1 will then follow. This will proceed with the continuous upgrading and rehabilitation of LMTP 1 and 2, which are being equipped with new technology to treat higher turbidity levels. By 2020, the completed upgrading of LMTP 1 and 2 should bring us up to more predictable water supply levels despite the threats of climate change.
While these challenges tested our organization’s resilience, they also provided us with opportunities to “learn by doing,” for which NextGen Maynilad sufficiently prepared us. The three-year strategy sharpened our foresight through risk management, trained us to solve complex issues through collaboration, and improve enterprise-level efficiency through streamlined processes and a tightened network.
We are in the process of calibrating our NextGen Maynilad Program for the next three-year mark. The renewed corporate transformation strategy will build on our successes, tempered by learnings from our shortfalls.
Struggles aside, 2018 also brought with it much promise. On the business development front, we won our first new concession this year, the Boac Waterworks Concession Project in Marinduque. The supply and distribution project is shaping up to become our business model for replicating our success in other parts of the country.
In addition, the positive developments in our rate rebasing exercise clear the air for moving forward and more aggressively toward our business goals and service level targets. Beginning in 2019, we shall vigorously pursue service improvements across the West Zone, especially in the south, through our continued investments in resiliency. We also intend to continue meeting our stretch goals for our wastewater services through the completion of STPs that are currently under construction. And while we work to stabilize service delivery and growth in our core business, we will also strengthen efforts to pursue more businesses outside the concession area.
For 2018, the biggest challenge that shook up the organization is clearly the supply allocation issuecaused by a confluence of factors, including climate change that led to decreased supply and increased turbidity levels, and seasonal algal bloom that affected raw water quality in Laguna Lake.
In thePipeline
Maynilad utilizes various water treatmenttechnologies that effectively convert water from Laguna Lake into potable, drinking water.

54 Sustaining Growth

MAYNILAD 2018 ANNUAL REPORT 55

56 Sustaining Growth
STM-Riverview women repurposing old Maynilad uniforms for the company’s Green Badge program.

MAYNILAD 2018 ANNUAL REPORT 57
Welfare and LivelihoodIn 2018, Maynilad continued to empower communities through livelihood projects that are linked to water access and environmental sustainability. Mothers from Samahang Tubig Maynilad (STM)-Pook Pag-asa and STM-Riverview were given training by experts from the Department of Science and Technology (DOST)-Forest Products Research and Development Institute, as well as trainers from our very own STM-Tondo, on advanced tailoring and other production techniques. Together with beneficiaries from other STM communities, the new set of trainees are now able to produce merchandise such as pillows, drawstring bags and pouches, to be included in Maynilad’s 2018 set of Christmas giveaways.
Green Badge, our uniform upcycling program that provides livelihood opportunities for our STM-Riverview community, marked its third year in 2018. With our continuous supply of upcycling materials such as used tarpaulins and old uniforms, the community was able to manage four production cycles of drawstring bags and other products.
Lydia Codiñera, president of STM-Tondo, was recognized in 2018 as one of GoNegosyo’s 20 Inspiring Filipina Entrepreneurs, under the micro business category. Through her leadership, she was able to steer the pioneering STM community from having water access toward establishing a thriving business of producing and selling home care products. It is a proud moment for Maynilad, a “proof of concept” that water access can be an entry point to uplifting people’s lives through sustainable livelihood.
Lydia Codiñera, president of STM-Tondo, was recognized as one of GoNegosyo’s Inspiring Filipina Entrepreneurs.
CorporateSocial Responsibility

58 Sustaining Growth
Access to Water and SanitationThe Pag-asa sa Patubig Partnership (P3) is one of our water access schemes designed to provide water access to urban poor communities through a social enterprise setup, in collaboration with the non-government organization (NGO) Water and Life Philippines.
In 2018, P3 was successfully implemented in informal settler communities at Bacoor City in Cavite, and Upper Sucat in Muntinlupa, providing almost 500 families with access to safe water. Like other beneficiary communities, the new P3 communities will also be provided with value-added capacity-building programs such as seminars on firefighting and hygiene and sanitation.
In December 2018, we launched a sanitation study in partnership with France-based NGO Eau et Vie and Water and Life Philippines. The study is being conducted in the P3 coastal community of MAGTALHAI and Dinamita in Bacoor City. It aims to come up with ways to address the challenge of collecting septage from informal communities that are currently unserved and will likely remain so without special social and technical intervention. At the end of the study, we hope to develop a combined sanitation and solid waste collection scheme that we can replicate in other STM and P3 communities.
Communities in Talaba II of Bacoor are given access to potable water through Maynilad’s Pag-asa sa Patubig Partnership.

MAYNILAD 2018 ANNUAL REPORT 59
CorporateSocial Responsibility

60 Sustaining Growth
The meter clusters of the Pag-asa sa Patubig communities in Talaba Dos.

MAYNILAD 2018 ANNUAL REPORT 61
CorporateSocial Responsibility

62 Sustaining Growth
Education and TrainingMaynilad continued to lead the way in promoting responsible use of water resources, sanitation and hygiene through its involvement in major conferences and events. In 2018, we staged the World Water Day Awards for the fifth year, in partnership with the National Water Resources Board and the Department of Environment and Natural Resources. The awards recognized 18 individuals and organizations that made exemplary contributions to water and environmental sustainability in the country. As part of our Global Handwashing Day celebration, we went to 11 schools to teach some 2,000 kids about the benefits of regular and proper handwashing.
Our multi-awarded Daloy Dunong school-based campaign welcomed 14,300 elementary and high school students as new Water Warriors. Since its launch in 2012, the water education drive has been to 480 public schools, reaching over 138,000 students with information on good hygiene, proper solid and liquid waste management, and water resource conservation.
In 2018, we complemented Daloy Dunong with Talakay Tubig, a community water forum for heads of households and government officials. Over 1,700 Pantawid Pamilya beneficiaries were assembled by the Department of Social Welfare and Development and the Navotas City local government to learn about water and wastewater. Talakay Tubig was also held in Bambang, Nueva Vizcaya, and Rizal, Nueva Ecija.
Aside from these, more schools and students benefited from other annual school-based projects. Under the Brigada Eskwela program, we adopted 150 schools and sent employee-volunteers to refurbish classrooms and upgrade water and sanitation facilities, while also setting up hydration stations for all volunteers. We installed drink-wash areas in 50 of the most populous and resource-deficient schools in the West Zone as part of our Lingkod Eskwela program. For our Ginhawa Gardening program, 10 public schools now have vertical gardens installed with drip irrigation systems and other gardening facilities. Under our GinhaW.A.S.H. program, 500 bidets, 20 drinking fountains and “health and sanitation tips” signages have been installed in 17 high schools, one hospital and one health center.
A drink-wash station installed at Las Piñas National High School under Maynilad’s Lingkod Eskwela Program.

MAYNILAD 2018 ANNUAL REPORT 63
By installing drink-wash facilities and refurbishing water and sanitation facilities in public schools, Lingkod Eskwela aims to promote good health through proper hygiene among students.
CorporateSocial Responsibility

64 Sustaining Growth
Maynilad constantly provides disaster relief even outside of the West Zone, as part of its commitment to public service.
Some 17,000 Albayanons affected by the Mayon Volcano eruptions were provided with clean and safe drinking water through Maynilad’s relief effort.

MAYNILAD 2018 ANNUAL REPORT 65
Disaster ReliefTrue to our commitment to public service within and beyond the West Zone, Maynilad provided disaster relief to the province of Albay, particularly in the towns that were hard-hit by the Mayon Volcano eruptions in February. In partnership with the MWSS, Maynilad deployed its mobile water treatment plant to Malilipot, Sto. Domingo and Tabaco—three of the nine cities and municipalities whose water sources had been contaminated by sulfuric acid from the eruptions.
Using reverse osmosis and chlorination technology, our mobile water treatment plant produced 7,000 gallons of water per day, enough to meet the daily drinking requirements of some 17,000 Albayanons.
Maynilad remains ever ready to respond to calls for assistance anywhere in the country.
Residents from Malilipot, Sto. Domingo and Tabaco in Albay line up to get potable water from Maynilad’s mobile water treatment plant.
CorporateSocial Responsibility

66 Sustaining Growth

MAYNILAD 2018 ANNUAL REPORT 67
LocalAwards
InternationalAwards
Award Organizer Winning Entries
53rd Anvil Awards Public Relations Society of the Philippines
• Lingkod Eskwela (Gold Anvil) • Ripples: The Official Company Newsletter of Maynilad (Gold Anvil) • Maynilad Media Run (Gold Anvil) • Dakilang Manggagawa Awards (Gold Anvil) • “Mayni-LAD to the Rescue!” Wastewater Video (Gold Anvil) • “Green Badge” Program (Silver Anvil)• Daloy Dunong Program (Silver Anvil)• Maynilad Simpleng Ginhawa Videos (Silver Anvil)• Maynilad 10th Anniversary Video (Silver Anvil)• Maynilad ang kailangan ng poso (negro) mo – Wastewater Digital Campaign (Silver Anvil)• Isang Dekada, Dala ay Ginhawa – Maynilad 10th Anniversary Campaign (Silver Anvil)
16th PhilippineQuill Awards
International Association of Business Communicators
• “Isang Dekada, Dala ay Ginhawa” Maynilad 10th Anniversary Campaign (Excellence Award)• “Daloy Dunong” (Excellence Award)• Maynilad 10th Anniversary Video (Excellence Award)• “Maynilad ang kailangan ng poso (negro) mo” wastewater digital campaign (Merit Award)• “Dakilang Manggagawa Awards” (Merit Award)• “Maynilad Rewards: Grandparents’ Day” (Merit Award)• “Lingkod Eskwela” (Merit Award)• “Green Badge” (Merit Award)• “Ripples, The Official Company Newsletter of Maynilad” (Merit Award)• “Next Generation: Maynilad 2016 Sustainability Report” (Merit Award)• “Mayni-LAD to the Rescue!” Wastewater Video (Merit Award)
Award Organizer Winning Entries
Platinum Awardunder the “Excellence in Provision of Literacy and Education” Category
Global CSR Awards (10th Annual Global CSR Summit and Awards)
• Daloy Dunong
Gold Award under the “Best Community Program” Category
• Samahang Tubig Maynilad (STM) and Pag-asa sa Patubig Partnership (P3)
Maynilad continued to receive recognition for excellent performance in various aspects of its business.

68 Sustaining Growth
Manuel V. PangilinanChairman2007 to present
Mr. Pangilinan assumed chairmanship of Maynilad in January 2007 and remain as such up to the present. He is also the President and CEO of Philippine Long Distance Telephone Company (PLDT) and Smart Communications, and continues to serve as their Chairman concurrently. He also serves as Chairman, Vice Chairman, or Board of Director of Manila Electric Company (MERALCO), Metro Pacific Investments Corp., Mediaquest Inc., Associated Broadcasting Corp. (TV5), Philex Mining Corp., Philex Petroleum Corp., NLEX Corp. (formerly Manila North Tollways Corp.), Landco Pacific Corp., Medical Doctors, Inc. (owner and operator of Makati Medical Center), Colinas Verdes Hospital Managers Corp. (operator of Cardinal Santos Medical Center), East Manila Hospital Managers Corp. (operator of Our Lady of Lourdes Hospital), and Asian Hospital, Inc. In 2012, he was appointed as Vice Chairman of Roxas Holdings Inc., which owns and operates the largest sugar milling operations in the Philippines.
Mr. Pangilinan founded First Pacific in 1981 and serves as its Managing Director and CEO. Within the First Pacific Group, he holds the positions of President and Commissioner of P.T. Indofood Sukses Makmur, the largest food company in Indonesia.
He is currently Chairman of the Board of Trustees of San Beda College. On Feb. 5, 2007, Mr. Pangilinan was named President of the Samahang Basketbol ng Pilipinas. Effective Jan. 2009, MVP assumed chairmanship of the Amateur Boxing Association of the Philippines. In Oct. 2009, he was appointed Chairman of the Philippine Disaster Recovery Foundation, Inc. He is also chairman of the Philippine Business for Social Progress. In June 2012, he was appointed as Co-Chairman of the US-Philippine Business Society.
68

MAYNILAD 2018 ANNUAL REPORT 69
Isidro A. ConsunjiVice Chairman2007 to present
Mr. Consunji has been Vice Chairman of Maynilad since January 2007. He is a Member of the Board of Directors of DMCI Holdings, Inc. (DMCI), Semirara Mining and Power Corp., Atlas Consolidated Mining and Development Corp., D.M. Consunji, Inc., DMCI Project Developers Inc., DMCI Mining Corp., DMCI Power Corp., DMCI Masbate Corp., Sem-Calaca Power Corp., Southwest Luzon Power Generation Corp., Sem-Calaca Res Corp., Semirara Claystone, Inc., Dacon Corp., DFC Holdings, Inc., and Wire Rope Corp. of the Philippines.
Mr. Consunji graduated from the University of the Philippines where he earned a degree in Bachelor of Science in Civil Engineering. He also took up Master of Business Economics from the Center for Research & Communication (now University of Asia and the Pacific) and Master of Business Management from the Asian Institute of Management. He took up an Advanced Management Program at IESE School in Barcelona, Spain.
Among Mr. Consunji’s civic affiliations are Philippine Overseas Construction Board (Chairman); Construction Industry Authority of the Philippines (Board Member); Philippine Constructors Association and Philippines Chamber of Coal Mines (Past President); and Asian Institute of Management Alumni Association, UP Alumni Engineers, and UP Aces Alumni Association (Member).
69
70 Sustaining Growth
Jose Ma. K. LimDirector2007 to present
Mr. Lim has been a Director of Maynilad since January 2007. He is President & CEO of Metro Pacific Investments Corp., and is also currently a Director in the following MPIC subsidiary and/or affiliate companies: Beacon Electric Asset Holdings Inc., Manila Electric Company, Metro Pacific Tollways Corp., NLEX Corp.; Tollways Management Corp., Light Rail Manila Corp., AF Payments Inc., MetroPac Water Investments Corp., Indra Philippines, Global Business Power Corp., Medical Doctors, Inc., Colinas Verdes Hospital Managers Corp., Asian Hospital Inc., East Manila Hospital Managers Corp., and Manila Medical Services Inc. (owner and operator of Manila Doctors Hospital). He is also a Director of the Ateneo Graduate School of Business and a Trustee of the Asian Institute of Management. He is a founding member of the Shareholders Association of the Philippines and an active member in various business organizations.
Jorge A. ConsunjiDirector2007 to present
Mr. Consunji has been a Director of Maynilad since January 2007. Presently, he is the President and CEO of D.M. Consunji, Inc. and Chairman of the Board of Wire Rope Corp. of the Phils. He also serves as a member of the Board of Directors of DMCI Holdings, Inc., Semirara Mining and Power Corp., DMCI Project Developers, Inc., DMCI Mining Corp., DMCI Power Corp., Sem-Calaca Power Corp., Southwest Luzon Power Generation Corp., DACON Corp., and Beta Electric Corp.
70

MAYNILAD 2018 ANNUAL REPORT 71
Board ofDirectors
Ramoncito S. FernandezDirectorJanuary 2016 to present
Mr. Fernandez is the President and CEO of Maynilad. He holds directorships in Metro Pacific Investments Corp. (MPIC), MetroPac Water Investments Corp., Metro Iloilo Bulk Water Supply Corp., Metro Iloilo Holdings Corp., MetroPac Cagayan De Oro, Inc., Cagayan De Oro Bulk Water, Inc., and PLDT’s Tahanan Mutual Building and Loan Association Inc. He is also President of Management Association of the Philippines in 2018, Board Trustee and Treasurer of Shareholders Association of the Philippines, Board Governor of Philippine Basketball Association, Board Trustee of First Pacific Leadership Academy, and Fellow & Member of Institute of Corporate Directors. He is the 2009 PISM GAWAD SINOP Awardee, an award conferred by the Foundation of the Society of Fellows in Supply Management and the Philippine Institute for Supply Management to outstanding achievers in the field of supply management.
Board ofDirectors
71

72 Sustaining Growth
Board ofDirectors
Randolph T. EstrelladoDirector2007 to present
Mr. Estrellado has been a Director of Maynilad since January 2007 and is concurrently the Company’s Chief Operating Officer. He was appointed COO of the company in February 2016, after serving almost 10 years as its Chief Finance Officer since joining the company in January 2007. He previously served as Director and Chief Finance Officer of Metro Pacific Investments Corp. Prior to joining Metro Pacific, Randy was Vice President and Chief Finance Officer for ABS-CBN Broadcasting Corporation from 2000 to 2006. He had also served in various positions of senior responsibility with the Lopez Group and Phinma Group of Companies. Randy obtained his MBA from Harvard Business School in 1991 and his Bachelor in Science Degree in Business Management, Honors Program from the Ateneo de Manila University in 1986.
Atty. Marilyn A. Victorio-AquinoDirectorDecember 21, 2012 to present
Atty. Aquino joined the Maynilad Board on December 21, 2012. She is also a Director of Philex Mining Corporation, Lepanto Consolidated Mining Company, PXP Energy, Silangan Mindanao Mining Co. Inc., Silangan Mindanao Exploration Company Inc., MetroPac Movers, Inc.; MetroPac Logistics Co. Inc., and PremierLogistics, Inc.; and Assistant Director of First Pacific Company Limited (FPC). She joined FPC on July 1, 2012 following her 31-year practice at SyCipLaw. She graduated cum laude (class salutatorian) from the University of the Philippines, College of Law in 1980 and placed second in the Philippine Bar Examination in the same year.
72

MAYNILAD 2018 ANNUAL REPORT 73
Board ofDirectorsBoard ofDirectors
Masato HiraokaDirectorApril 24, 2018 to present
Mr. Hiraoka joined the Maynilad Board of Directors last May 2018. He has been engaged in the development of various international infrastructure projects in Marubeni Corporation for over 25 years, including overseas assignments in Sao Paulo, Brazil (2002-2005) and in Santiago, Chile (2011-2015). Mr. Hiraoka held a director position in Marubeni’s water business subsidiary and affiliate companies, such as Aguas Decima S.A. (Valdivia, Chile), Aguas del Altiplano S.A. (Region I and XV, Chile), Aguas Araucania S.A. (Region IV, Chile), Aguas Magallanes S.A. (Region XII, Chile) and Consorcio Agua Azul S.A. (Lima, Peru). He is also presently the Vice President of Marubeni Philippines Corp.
Seijiro ChibaDirectorApril 24, 2018 to present
Mr. Chiba joined the Maynilad Board of Directors last April 2018, and is General Manager of Environment Infrastructure Department of Marubeni Corporation. He has been engaged in the development of various international infrastructure projects, especially electric power projects and water projects, in Marubeni Corporation for over 25 years, including the overseas assignments in New York, USA (1996-1998) and in Manila, Philippines (2011-2014).
73

74 Sustaining Growth

MAYNILAD 2018 ANNUAL REPORT 75
Ronaldo C.PaduaHead,Water Supply Operations
Ramoncito S. FernandezPresident& CEO
Yolanda C.LucasHead,Program Management
Marcos D.de JesusHead,TechnicalServices
Eric J.MontesHead,Integrated Asset Management

76 Sustaining Growth
Ricardo F.delos ReyesChief Finance Officer
Antonio F.GarciaHead,Wastewater Management
Roel S.EspirituHead, Corporate Quality, Environment, Safety & Health
Lourdes Marivic P. EspirituHead,Legal & Regulatory Affairs
Arturo CelsoD. BarandaHead,Supply Chain Management
Irineo L.DimaanoHead,Central Non-Revenue Water

MAYNILAD 2018 ANNUAL REPORT 77
Martin B.de Guzman Head,HumanResources
FranciscoC. CastilloHead,Information Technology Services
Jose RizalO. BatilesHead,Enterprise Risk Management & Internal Audit
ChristopherJ. LichaucoHead,Customer Experience &Retail Operations
TopManagement Team
Randolph T. EstrelladoChief OperatingOfficer

78 Sustaining Growth

MAYNILAD 2018 ANNUAL REPORT 79

80 Sustaining Growth
IndependentAuditor’s Report
The Stockholders and the Board of DirectorsMaynilad Water Services, Inc.MWSS Compound, Katipunan RoadBalara, Quezon City
OpinionWe have audited the consolidated financial statements of Maynilad Water Services, Inc. and Subsidiaries (the Group), a subsidiary of Maynilad Water Holding Company, Inc., which comprise the consolidated statements of financial position as at December 31, 2018 and 2017, and the consolidated statements of income, consolidated statements of comprehensive income, consolidated statements of changes in equity and consolidated statements of cash flows for each of the three years in the period ended December 31, 2018, and notes to the consolidated financial statements, including a summary of significant accounting policies.
In our opinion, the accompanying consolidated financial statements present fairly, in all material respects, the consolidated financial position of the Group as at December 31, 2018 and 2017, and its consolidated financial performance and its consolidated cash flows for each of the three years in the period ended December 31, 2018 in accordance with Philippine Financial Reporting Standards (PFRSs).
Basis for OpinionWe conducted our audits in accordance with Philippine Standards on Auditing (PSAs). Our responsibilities under those standards are further described in the Auditor’s Responsibilities for the Audit of the Consolidated Financial Statements section of our report. We are independent of the Group in accordance with the Code of Ethics for Professional Accountants in the Philippines (Code of Ethics) together with the ethical requirements that are relevant to our audit of the consolidated financial statements in the Philippines, and we have fulfilled our other ethical responsibilities in accordance with these requirements and the Code of Ethics. We believe that the audit evidence we have obtained is sufficient and appropriate to provide a basis for our opinion.
Responsibilities of Management and Those Charged with Governance for the Financial StatementsManagement is responsible for the preparation and fair presentation of the consolidated financial statements in accordance with PFRSs, and for such internal control as management determines is necessary to enable the preparation of consolidated financial statements that are free from material misstatement, whether due to fraud or error.
In preparing the consolidated financial statements, management is responsible for assessing the Group’s ability to continue as a going concern, disclosing, as applicable, matters related to going concern and using the going concern basis of accounting unless management either intends to liquidate the Group or to cease operations, or has no realistic alternative but to do so.
Those charged with governance are responsible for overseeing the Group’s financial reporting process. Auditors’ Responsibilities for the Audit of the Financial StatementsOur objectives are to obtain reasonable assurance about whether the consolidated financial statements as a whole are free from material misstatement, whether due to fraud or error, and to issue an auditor’s report that includes our opinion. Reasonable assurance is a high level of assurance, but is not a guarantee that an audit conducted in accordance with PSAs will always detect a material misstatement when it exists. Misstatements can arise from fraud or error and are considered material if, individually or in the aggregate, they could reasonably be expected to influence the economic decisions of users taken on the basis of these consolidated financial statements.

FinancialStatements
MAYNILAD 2018 ANNUAL REPORT 81
As part of an audit in accordance with PSAs, we exercise professional judgment and maintain professional skepticism throughout the audit. We also:• Identify and assess the risks of material misstatement of the consolidated financial statements, whether due to fraud
or error, design and perform audit procedures responsive to those risks, and obtain audit evidence that is sufficient and appropriate to provide a basis for our opinion. The risk of not detecting a material misstatement resulting from fraud is higher than for one resulting from error, as fraud may involve collusion, forgery, intentional omissions, misrepresentations, or the override of internal control.
• Obtain an understanding of internal control relevant to the audit in order to design audit procedures that are appropriate in the circumstances, but not for the purpose of expressing an opinion on the effectiveness of the Group’s internal control.
• Evaluate the appropriateness of accounting policies used and the reasonableness of accounting estimates and related disclosures made by management.
• Conclude on the appropriateness of management’s use of the going concern basis of accounting and, based on the audit evidence obtained, whether a material uncertainty exists related to events or conditions that may cast significant doubt on the Group’s ability to continue as a going concern. If we conclude that a material uncertainty exists, we are required to draw attention in our auditor’s report to the related disclosures in the consolidated financial statements or, if such disclosures are inadequate, to modify our opinion. Our conclusions are based on the audit evidence obtained up to the date of our auditor’s report. However, future events or conditions may cause the Group to cease to continue as a going concern.
• Evaluate the overall presentation, structure and content of the consolidated financial statements, including the disclosures, and whether the consolidated financial statements represent the underlying transactions and events in a manner that achieves fair presentation.
• Obtain sufficient appropriate audit evidence regarding the financial information of the entities or business activities within the Group to express an opinion on the consolidated financial statements. We are responsible for the direction, supervision and performance of the audit. We remain solely responsible for our audit opinion.
We communicate with those charged with governance regarding, among other matters, the planned scope and timing of the audit and significant audit findings, including any significant deficiencies in internal control that we identify during our audit.
SYCIP GORRES VELAYO & CO.
Johnny F. AngPartner
CPA Certificate No. 0108257SEC Accreditation No. 1284-AR-1 (Group A), June 9, 2016, valid until June 9, 2019Tax Identification No. 221-717-423BIR Accreditation No. 08-001998-101-2018, November 6, 2018, valid until November 5, 2021PTR No. 7332518, January 3, 2019, Makati City
February 26, 2019

82 Sustaining Growth
Independent Auditor’s Reporton Supplementary Schedule
The Stockholders and the Board of DirectorsMaynilad Water Services, Inc.MWSS Compound, Katipunan RoadBalara, Quezon City
We have audited in accordance with Philippine Standards on Auditing, the consolidated financial statements of Maynilad Water Services, Inc. and Subsidiaries as at December 31, 2018 and 2017, and for each of the three years in the period ended December 31, 2018, and have issued our report thereon dated February 26, 2019. Our audits were made for the purpose of forming an opinion on the basic financial statements taken as a whole. The accompanying schedule of all the effective standards and interpretations as at December 31, 2018 is the responsibility of the Company’s management. This schedule is presented for the purpose of complying with Securities Regulation Code Rule 68, As Amended (2011) and is not part of the basic financial statements. This schedule has been subjected to the auditing procedures applied in the audit of the basic financial statements and, in our opinion, fairly states, in all material respects, the information required to be set forth therein in relation to the basic financial statements taken as a whole.
SYCIP GORRES VELAYO & CO.
Johnny F. AngPartnerCPA Certificate No. 0108257SEC Accreditation No. 1284-AR-1 (Group A), June 9, 2016, valid until June 9, 2019Tax Identification No. 221-717-423BIR Accreditation No. 08-001998-101-2018, November 6, 2018, valid until November 5, 2021PTR No. 7332518, January 3, 2019, Makati City
February 26, 2019

FinancialStatements
MAYNILAD 2018 ANNUAL REPORT 83
Consolidated Statementsof Financial PositionAmounts in Thousands
December 31
2018 2017
ASSETS
Current Assets
Cash and cash equivalents (Notes 4, 24 and 25) P11,533,048 P3,518,494
Short-term investments (Notes 4, 24 and 25) 15,774 1,501,000
Trade and other receivables (Notes 2, 5, 24 and 25) 1,674,114 2,602,129
Contract assets (Note 2, 14, 24 and 25) 1,185,047 –
Other current assets (Notes 6, 11, 24 and 25) 1,303,549 2,480,862
Total Current Assets 15,711,532 10,102,485
Noncurrent Assets
Service concession assets (Notes 7, 10, 11, 15 and 22) 88,108,184 78,391,855
Property and equipment (Note 8) 1,400,970 1,408,758
Goodwill (Notes 2 and 3) 244,925 288,082
Financial asset at fair value through other comprehensive income (Notes 9, 24 and 25) 124,864 –
Available-for-sale financial assets (Notes 9, 24 and 25) – 124,864
Deferred tax assets - net (Notes 16) – 462,530
Other noncurrent assets (Notes 3, 5, 22, 24 25 and 29) 2,329,554 2,737,875
Total Noncurrent Assets 92,208,497 83,413,964
P107,920,029 P93,516,449
LIABILITIES AND EQUITY
Current Liabilities
Trade and other payables (Notes 2, 12, 14, 15, 17, 23, 24 and 25) P16,204,862 P13,050,315
Current portion of interest-bearing loans (Notes 7, 11, 24 and 25) 354,218 1,816,070
Current portion of service concession obligation payable to MWSS (Notes 7, 10, 24 and 25) 1,038,764 1,217,038
Total Current Liabilities 17,597,844 16,083,423
Noncurrent Liabilities
Interest-bearing loans - net of current portion (Notes 7, 11, 24 and 25) 34,051,382 25,281,016
Service concession obligation payable to MWSS - net of current portion (Notes 7, 10, 24 and 25) 6,011,850 6,242,485
Deferred credits (Notes 3, 7, 24 and 25) 732,093 686,833
Customers’ deposits (Notes 24 and 25) 349,479 320,347
Pension liability (Notes 3 and 17) 448,026 594,816
Deferred tax liabilities - net (Notes 16) 140,682 34,988
Other noncurrent liabilities (Notes 14 and 17) 307,058 452,255
Total Noncurrent Liabilities 42,040,570 33,612,740
Total Liabilities 59,638,414 49,696,16
Total Liabilities P59,638,414 P49,696,163
Equity
Capital stock (Notes 1 and 13) 4,546,982 4,546,982
Additional paid-in capital (Note 13) 10,032,877 10,021,200
Treasury shares (Note 13) (20,204) (207,669)
Other comprehensive loss (Notes 9 and 17) (190,216) (303,972)
MAYNILAD WATER SERVICES, INC. AND SUBSIDIARIES (A Subsidiary of Maynilad Water Holding Company, Inc.)

84 Sustaining Growth
December 31
2018 2017
Other equity adjustments (Note 13) (309,220) (89,874)
Retained earnings (Note 13)
Unappropriated 14,221,396 17,353,619
Appropriated 20,000,000 12,500,000
Total Equity 48,281,615 43,820,286
P107,920,029 P93,516,449
See accompanying Notes to Consolidated Financial Statements.
Consolidated Statements of Financial Position

FinancialStatements
MAYNILAD 2018 ANNUAL REPORT 85
Consolidated Statementsof IncomeAmounts in Thousands, Except Earnings per Share Value
MAYNILAD WATER SERVICES, INC. AND SUBSIDIARIES (A Subsidiary of Maynilad Water Holding Company, Inc.)
Years Ended December 31
2018 2017 2016
OPERATING REVENUE
Water services:
West zone P17,810,615 P16,584,931 P16,116,765
Outside west zone 262,353 223,938 194,622
Sewer services -
West zone 3,851,972 3,601,349 3,508,118
Others 98,709 364,023 404,241
22,023,649 20,774,241 20,223,746
COSTS AND EXPENSES
Amortization of service concession assets (Note 7) 2,757,144 2,419,259 2,343,969
Salaries, wages and benefits (Notes 13, 15 and 17) 2,248,648 2,833,346 2,004,436
Utilities 989,539 1,024,322 877,986
Contracted services 884,734 925,258 946,240
Repairs and maintenance 677,596 456,425 515,011
Depreciation and amortization (Note 8) 368,255 362,521 291,491
Materials and supplies 351,779 292,967 283,014
Taxes and licenses 257,539 223,569 214,383
Rental (Notes 22 and 23) 167,476 157,992 143,736
Collection charges 147,361 145,269 136,201
Transportation and travel 130,546 128,035 98,434
Regulatory costs 126,814 110,138 101,200
Business meetings and representations 95,445 119,524 125,835
Advertising and promotion 79,897 59,861 58,699
Insurance 38,901 52,583 51,603
Provision for (reversal of) expected credit losses or doubtful accounts (Note 5) 17,714 57,112 (76,852)
Others 303,476 127,425 257,711
9,642,864 9,495,606 8,373,097
INCOME BEFORE OTHER INCOME (EXPENSES) 12,380,785 11,278,635 11,850,649
OTHER INCOME (EXPENSES)
Revenue from rehabilitation works (Note 7) 11,583,983 11,488,693 8,951,700
Cost of rehabilitation works (11,583,983) (11,488,693) (8,951,700)
Interest expense and other financing charges (Note 18) (2,120,518) (1,778,026) (1,810,575)
Interest income (Note 4) 184,939 94,442 119,919
Foreign exchange losses - net (Note 2) (1,061,205) (558,595) (510,811)
Foreign currency differential adjustments (FCDA) (Note 2) 1,049,747 556,390 510,644
Others - net (Notes 8 and 9) (120,664) (271,117) (161,289)
(2,067,701) (1,956,906) (1,852,112)
INCOME BEFORE INCOME TAX 10,313,084 9,321,729 9,998,537
PROVISION FOR INCOME TAX (Notes 16)
Current 2,393,055 2,107,671 2,117,314
Deferred 552,252 361,085 1,133,051

86 Sustaining Growth
Years Ended December 31
2018 2017 2016
2,945,307 2,468,756 3,250,365
NET INCOME P7,367,777 P6,852,973 P6,748,172
Basic Earnings Per Share (Note 19) P1,652.53 P1,537.06 P1,513.56
Diluted Earnings Per Share (Note 19) P1,620.95 P1,513.06 P1,485.36
Consolidated Statements of Financial Position
See accompanying Notes to Consolidated Financial Statements.

FinancialStatements
MAYNILAD 2018 ANNUAL REPORT 87
Consolidated Statements ofComprehensive IncomeAmounts in Thousands
MAYNILAD WATER SERVICES, INC. AND SUBSIDIARIES (A Subsidiary of Maynilad Water Holding Company, Inc.)
See accompanying Notes to Consolidated Financial Statements.
Years Ended December 31
2018 2017 2016
NET INCOME P7,367,777 P6,852,973 P6,748,172
OTHER COMPREHENSIVE INCOME (LOSS)
Other comprehensive income (loss) not to be reclassified to profit or loss in subse-quent period (Note 17) -
Remeasurement gain (loss) on retirement plans 129,728 (376,996) 10,713
Income tax effect (15,972) 38,306 (3,214)
113,756 (338,690) 7,499
TOTAL COMPREHENSIVE INCOME P7,481,533 P6,514,283 P6,755,671

88 Sustaining Growth
Consolidated Statements of Changes in Equityfor the years ended Deccember 31, 2018, 2017 and 2016Amounts in Thousands
MAYNILAD WATER SERVICES, INC. AND SUBSIDIARIES (A Subsidiary of Maynilad Water Holding Company, Inc.)
Capital Stock
(Notes 1 and 13)
Additional Paid-in Capital
(Note 13)
Treasury Shares
(Note 13)
OtherComprehensive
Income (Loss)(Notes 9 and 17)
Other Equity Adjustments
(Note 13)
Retained Earnings(Note 13)
Total
Unappropriated Appropriated
At December 31, 2017 P4,546,982 P10,021,200 (P207,669) (P303,972) (P89,874) P17,353,619 P12,500,000 P43,820,286
Total comprehensive income for the year
– – – 113,756 – 7,367,777 – 7,481,533
Treasury shares (Note 13) – – (20,204) – – – – (20,204)
Issuance of ESOP shares (Note 13)
– 11,677 207,669 – (219,346) – – –
Reversal of appropriation (Note 13)
– – – – – 12,500,000 (12,500,000) –
Appropriation for capital expenditures (Note 13)
– – – – – (20,000,000) 20,000,000 –
Dividends declared (Note 13) – – – – – (3,000,000) – (3,000,000)
At December 31, 2018 P4,546,982 P10,032,877 (P20,204) (P190,216) (P309,220) P14,221,39 P20,000,000 P48,281,615
Capital Stock
(Notes 1 and 13)
Additional Paid-in Capital
(Note 13)
Treasury Shares
(Note 13)
OtherComprehensive
Income (Loss)(Notes 9 and 17)
Other Equity Adjustments
(Note 13)
Retained Earnings(Note 13)
Total
Unappropriated Appropriated
At December 31, 2015 P4,546,982 P9,979,786 (P104,654) (P27,219) (P163,152) P13,752,474 P7,500,000 P35,538,655
Total comprehensive income for the year
– – – 7,499 – 6,748,172 – 6,755,671
Issuance of ESOP shares (Note 13)
– 41,414 104,654 – (146,068) – – –
Treasury shares (Note 13) – – (32,672) – – – – (32,672)
Dividends declared (Note 13) – – – – – (2,000,000) – (2,000,000)
At December 31, 2016 P4,546,982 P10,021,200 (P32,672) (P34,718) (P309,220) P18,500,646 P7,500,000 P40,261,654
Capital Stock
(Notes 1 and 13)
Additional Paid-in Capital
(Note 13)
Treasury Shares
(Note 13)
OtherComprehensive
Income (Loss)(Notes 9 and 17)
Other Equity Adjustments
(Note 13)
Retained Earnings(Note 13)
Total
Unappropriated Appropriated
At December 31, 2016 P4,546,982 P10,021,200 (P32,672) (34,718) (P309,220) P18,500,646 P7,500,000 P40,261,654
Total comprehensive income for the year
– – – (338,690) – 6,852,973 – 6,514,283
Treasury shares (Note 13) – – (174,997) – – – – (174,997)
Appropriation for capital expenditures (Note 13)
– – – – – (5,000,000) 55,000,000 –
Dividends declared (Note 13) – – – – – (3,000,000) – (3,000,000)
At December 31, 2017 P4,546,982 P10,021,200 (P207,669) (P303,972) (P89,874) P17,353,619 P12,500,000 P43,820,286
See accompanying Notes to Consolidated Financial Statements.

FinancialStatements
MAYNILAD 2018 ANNUAL REPORT 89
Consolidated Statementsof Cash FlowsAmounts in Thousands
MAYNILAD WATER SERVICES, INC. AND SUBSIDIARIES (A Subsidiary of Maynilad Water Holding Company, Inc.)
Years Ended December 31
2018 2017 2016
CASH FLOWS FROM OPERATING ACTIVITIES
Income before income tax P10,313,084 P9,321,729 P9,998,537
Adjustments for:
Amortization of service concession assets (Note 7) 2,757,144 2,419,259 2,343,969
Interest expense and other financing charges (Note 18) 2,120,518 1,778,026 1,810,575
Depreciation and amortization (Note 8) 368,255 362,521 291,491
Interest income (Note 4) (184,939) (94,442) (119,919)
Pension cost (Note 17) 157,029 71,802 104,049
Impairment loss on goodwill 43,157 – –
Provision for (reversal of) expected credit losses or doubtful accounts 17,714 57,112 (76,582)
Dividend income (Note 9) (13,500) (10,000) (10,000)
Gain on sale of property and equipment (Note 8) (10,093) (4,238) (13,252)
Unrealized foreign exchange losses (gains) (4,057) 10,204 (7,628)
Cost of share-based payments (Note 13) – 219,346 –
Impairment loss on AFS financial assets (Note 9) – 7,523 –
Others (22,941) (13,391) –
Operating income before working capital changes 15,541,371 14,125,451 14,321,240
Decrease (increase) in:
Short-term investments 1,485,226 1,540,000 3,047,541
Trade and other receivables 935,704 (141,144) 85,077
Contract assets (1,185,047) – –
Other current assets 1,018,642 115,210 (213,005)
Additions to service concession assets (Notes 7 and 26) (11,655,981) (11,513,654) (9,060,721)
Increase (decrease) in:
Trade and other payables 2,942,380 2,789,383 (750,926)
Customers’ deposits 74,392 95,842 83,261
Other noncurrent liabilities 97,843 197,618 181,369
Cash generated from operations 9,254,530 7,208,706 7,693,836
Contributions to pension fund (Note 17) (160,738) (171,312) (192,000)
Benefits paid out of operating funds (Note 17) (13,353) – –
Interest received 174,356 99,926 130,726
Income taxes paid (2,191,282) (2,103,838) (1,654,232)
Net cash provided by operating activities 7,063,513 5,033,482 5,978,330
CASH FLOWS FROM INVESTING ACTIVITIES
Acquisitions of property and equipment (Note 8) (362,384) (522,854) (714,958)
Increase in other noncurrent assets (111,732) (609,743) (140,974)
Dividends received (Note 9) 13,500 10,000 10,000
Proceeds from sale of property and equipment (Note 8) 12,010 10,152 16,201

90 Sustaining Growth
Years Ended December 31
2018 2017 2016
Net cash used in investing activities (448,606) (1,112,445) (829,731)
CASH FLOWS FROM FINANCING ACTIVITIES
Proceeds from the availment/drawdown of interest-bearing loans (Note 11) 25,582,742 2,077,784 3,173,095
Payments of:
Interest-bearing loans (Notes 11 and 28) (18,487,067) (1,808,101) (1,742,164)
Dividends (Notes 13 and 28) (2,999,548) (3,000,578) (1,999,620)
Service concession obligation payable to MWSS (Notes 10 and 28) (1,007,342) (1,007,387) (1,208,713)
Interest paid (Note 28) (1,668,934) (1,514,018) (1,406,783)
Acquisition of treasury shares (Note 13) (20,204) (174,997) (32,672)
Net cash provided by (used in) financing activities 1,399,647 (5,427,297) (3,216,857)
NET INCREASE (DECREASE) IN CASH AND CASH EQUIVALENTS 8,014,554 (1,506,260) 1,931,742
CASH AND CASH EQUIVALENTS AT BEGINNING OF YEAR 3,518,494 5,024,754 3,093,012
CASH AND CASH EQUIVALENTS AT END OF YEAR (Note 4) P11,533,048 P3,518,494 P5,024,754
Consolidated Statements of Cash Flows
See accompanying Notes to Consolidated Financial Statements.

FinancialStatements
MAYNILAD 2018 ANNUAL REPORT 91
Notes to ConsolidatedFinancial StatementsAmounts in Thousands, Except Number of Shares, Earnings per Share Value and Unless Otherwise Specified
MAYNILAD WATER SERVICES, INC. AND SUBSIDIARIES (A Subsidiary of Maynilad Water Holding Company, Inc.)
Corporate Information and Status of Operations
GeneralMaynilad Water Services, Inc. (Maynilad or Parent Company) was incorporated on January 22, 1997 in the Philippines primarily to bid for the operation of the privatized system of waterworks and wastewater services of the Metropolitan Waterworks and Sewerage System (MWSS) for Metropolitan Manila.
On October 26, 2011, the Securities and Exchange Commission (SEC) approved the amendment of the Articles of Incorporation to amend its primary purpose to include the provision of allied and ancillary services and undertaking such other activities incidental to its secondary purposes.
Effective Interest in MayniladMWHCI and Maynilad Subscription Agreements. Pursuant to the Subscription Agreements executed between Maynilad and Maynilad Water Holding Company, Inc. (MWHCI), a company incorporated in the Philippines and a 51.27% owned subsidiary of Metro Pacific Investments Corporation (MPIC), MWHCI subscribed to 134,022 common shares of Maynilad at par value on December 28, 2012. Such shares, however, were issued only on February 13, 2013 and together with the additional subscription to 402,067 common shares increased MWHCI ownership interest in Maynilad to 92.85% as at December 31, 2013.
MCNK JV Corporation and MWHCI Subscription Agreements. On December 28, 2012, a Subscription Agreement between MCNK JV Corporation (MCNK, a subsidiary of a Japan-listed entity Marubeni Corp.) and MWHCI was executed, wherein MCNK subscribed to 169,617,682 common shares of MWHCI. On February 13, 2013, MCNK and MWHCI entered into another Subscription Agreement for the subscription by MCNK to an additional 508,853,045 common shares resulting to 21.54% interest in MWHCI. On the same date, MPIC purchased 154,992,852 common shares of stock of MWHCI from DMCI Holdings, Inc. (DMCI, a listed Philippine entity) resulting in 51.27% and 27.19% ownership interest as at December 31, 2013 by MPIC and DMCI, respectively.
As at December 31, 2018 and 2017, Maynilad is a 92.85% owned subsidiary of MWHCI. In addition, MPIC directly owns 5.19% of Maynilad thereby having effective ownership interest of 52.80%.
Metro Pacific Holdings, Inc. (MPHI) owns 41.9% of the total issued common shares (or 42.0% of the total outstanding common shares) of MPIC as at December 31, 2018 and 2017. The reduction in the ownership interest in 2016 resulted from GT Capital Holdings, Inc.’s (GTCHI) acquisition of 1.3 billion MPIC common shares from MPHI on May 27, 2016. On the same date, MPIC entered into a Share Subscription Agreement with GTCHI for the subscription by GTCHI of 3.6 billion common shares in MPIC. As sole holder of the voting Class A Preferred Shares, MPHI’s combined voting interest as a result of all of its shareholdings in MPIC is estimated at 55.0% as at December 31, 2018.
MPHI is a Philippine corporation whose stockholders are Enterprise Investment Holdings, Inc. (EIH; 60.0% interest), Intalink B.V. (26.7% interest) and First Pacific International Limited (FPIL; 13.3% interest). First Pacific Company Limited (FPC), a company incorporated in Bermuda and listed in Hong Kong, through its subsidiaries, Intalink B.V. and FPIL, holds 40.0% equity interest in EIH and an investment financing which under Hong Kong Generally Accepted Accounting Principles require FPC to account for the results and assets and liabilities of EIH and its subsidiaries as part of FPC group companies in Hong Kong.
The registered office address of the Parent Company is MWSS Compound, Katipunan Road, Balara, Quezon City.The accompanying consolidated financial statements were approved and authorized for issuance by the Board of Directors (BOD) on February 26, 2019.
1.
92 Sustaining Growth
Concession AgreementOn February 21, 1997, the Parent Company entered into a Concession Agreement with the MWSS, a government-owned and controlled corporation organized and existing pursuant to Republic Act (RA) No. 6234 (the Charter), as clarified and amended, with respect to the MWSS West Service Area. The Concession Agreement sets forth the rights and obligations of the Parent Company throughout the concession period. The MWSS Regulatory Office (RO) acts as the regulatory body of the Concessionaires [the Parent Company and the East Concessionaire - Manila Water Company, Inc. (Manila Water)].
Under the Concession Agreement, MWSS grants the Parent Company (as contractor to perform certain functions and as agent for the exercise of certain rights and powers under the Charter), the sole right to manage, operate, repair, decommission and refurbish all fixed and movable assets required (except certain retained assets of MWSS) to provide water and wastewater services in the West Service Area for an extended period of 40 years commencing on August 1, 1997 (the Commencement Date) to May 6, 2037 (Expiration Date) or the early termination date as the case may be. The 15-year extension of the expiry of the Concession Agreement was approved by the MWSS in 2009 (see Notes 7, 10 and 22).
The Parent Company is also tasked to manage, operate, repair, decommission and refurbish certain specified MWSS facilities in the West Service Area. The legal title to these assets remains with MWSS. The legal title to all property, plant and equipment contributed to the existing MWSS system by the Parent Company during the concession period remains with the Parent Company until the Expiration Date (or on early termination date) at which time, all rights, titles and interest in such assets will automatically vest in MWSS.
Fourth Rate Rebasing Rate Rebasing: 2013-2017
• 2013-2017 Rate Rebasing - Domestic Arbitration. Metropolitan Waterworks and Sewerage (MWSS) released Board of Trustees Resolution No. 2013-100-RO dated September 12, 2013 and Regulatory Office (RO) Resolution No. 13-010-CA dated September 10, 2013 on the rate rebasing adjustment for the rate rebasing period 2013 to 2017 (Fourth Rate Rebasing Period) reducing the Parent Company’s 2012 average all-in basic water charge by 4.82% or P1.46 per cubic meter (cu.m.) or P0.29 per cu.m. over the next five years.
On October 4, 2013, the Parent Company filed its Dispute Notice before the Appeals Panel.
This Dispute Notice is a referral to the Appeals Panel for Major Disputes of the dispute between Maynilad, on the one hand, and MWSS and the RO, on the other. The Dispute relates to the determination by the RO, in accordance with Section 9.4.2 of the Concession Agreement, of the Rebasing Adjustment as embodied in Resolution No. 13-010-CA.
On December 17, 2013, the RO released Resolution No. 13-011-CA regarding the implementation of a status quo for Parent Company’s Standard Rates and Foreign Currency Differential Adjustments (FCDA) for any and all its scheduled adjustments until such time that the Appeals Panel has issued its arbitral award.
On January 5, 2015, the Parent Company officially received the Appeals Panel’s award dated December 29, 2014 upholding Maynilad’s alternative Rebasing Adjustment for the Fourth Rate Rebasing Period of 13.41% or its equivalent of P4.06 per cu.m. (“First Award”). This increase has effectively been reduced to P3.06 per cu.m, following the integration of the P1.00 Currency Exchange Rate Adjustment (CERA) into the basic water charge. To mitigate the impact of the tariff increase on its customers, the Parent Company offered to stagger its implementation over a three-year period.
The First Award, being final and binding on the parties, the Parent Company asked the MWSS to cause its Board of Trustees to approve the 2015 Tariffs Table so that the same can be published and implemented 15 days after its publication.
However, the MWSS and the RO have chosen, over the Parent Company’s repeated objections, to defer the implementation of the First Award despite it being final and binding on the parties. In its letter dated February 9, 2015, the MWSS and RO, who received their copy of the First Award on January 7, 2015, informed the Parent
Notes to Consolidated Financial Statements

FinancialStatements
MAYNILAD 2018 ANNUAL REPORT 93
Company that they have decided to await the final outcome of their arbitration with the other concessionaire, Manila Water, before making any official pronouncements on the applicable resulting water rates for the two concessionaires.
• 2013-2017 Rate Rebasing - International Arbitration.
On February 20, 2015, the Parent Company wrote the Philippine Government, through the Department of Finance (DOF), to call on the Undertaking which the Republic of the Philippines (ROP) issued in favor of the Parent Company on July 31, 1997 and March 17, 2010.
On March 9, 2015, the Parent Company again wrote the ROP, through the DOF, to reiterate its demand against the Undertaking. The letters dated February 20 and March 9, 2015 are collectively referred to as the “Demand Letters”. The Parent Company demanded that it be paid, immediately and without further delay, the P3.4 billion in revenue losses that it had sustained as a direct result of the MWSS’s and the RO’s refusal to implement its correct Rebasing Adjustment from January 1, 2013 (the commencement of the Fourth Rate Rebasing Period) to February 28, 2015.
On March 27, 2015, the Parent Company served a Notice of Arbitration and Statement of Claim upon the ROP, through the DOF. The Parent Company gave notice and demanded that the ROP’s failure or refusal to pay the amounts required under the Demand Letters be, pursuant to the terms of the Undertaking, referred to arbitration before a three-member panel appointed and conduct proceedings in Singapore in accordance with the 1976 United Nations Commission on International Trade Law (UNCITRAL) Arbitration Rules.
On April 21, 2015, the MWSS Board of Trustees in its Resolution No. 2015-004-CA dated March 25, 2015 approved to partially implement the First Award of a tariff adjustment of P0.64 per cu.m. which, net of the P1.00 CERA, actually translates to a tariff adjustment of negative P0.36 per cu.m. as opposed to the First Award of P3.06 per cu.m. tariff adjustment, net of CERA. For being contrary to the First Award as well as the provisions of the Concession Agreement, the Parent Company did not implement this tariff adjustment.
On May 14, 2015, the MWSS Board of Trustees in its Resolution No. 2015-060-RO approved a 7.52% increase in the prevailing average basic charge of P31.25 per cu.m. or an upward adjustment of P2.35 per cu.m. as Consumer Price Index adjustment. With the discontinuance of CERA, the net adjustment in average water charge is 4.32% or P1.35 per cu.m.
In the fourth quarter of 2015, the Arbitral Tribunal was constituted. On February 17, 2016, the Parent Company again wrote the ROP, through the DOF, to reiterate its demand against the Undertaking and to update its claim. Evidentiary hearings were completed in December 2016.
On July 24, 2017, the Arbitral Tribunal unanimously upheld the validity of the Parent Company’s claim against the Undertaking Letter issued by the ROP, through the DOF, to compensate the Parent Company for the delayed implementation of its relevant tariffs for the Fourth Rate Rebasing Period (“Second Award”). The Tribunal ordered the ROP to reimburse the Parent Company the amount of P3.4 billion for losses from March 11, 2015 to August 31, 2016, without prejudice to any rights that the Parent Company may have to seek recourse against MWSS for losses incurred from January 1, 2013 to March 10, 2015. Further, the Tribunal ruled that the Parent Company is entitled to recover from the Republic its losses from September 1, 2016 onwards. In case a disagreement on the amount of such losses arises, the Parent Company may revert to the Tribunal for further determination.
Subsequently, the Parent Company agreed with the corrected computation by the ROP of the Parent Company’s revenue losses from March 11, 2015 to August 31, 2016 in the amount of P3.18 billion (with cost of money as of August 31, 2016).
Starting April 22, 2017, adjusted water rates which included increase in the FCDA, as well as an adjustment to cover the 1.9% Consumer Price Index were implemented.
On February 13, 2018, the Parent Company received an email from the ROP’s Singapore counsel advising that the Republic has filed an application with the High Court of Singapore to set aside the Second Award dated July 24, 2017 (the “Setting Aside Application”).

94 Sustaining Growth
An electronic copy of the Setting-Aside Application was served on the Parent Company’s Singapore counsel on February 15, 2018.
The ROP also filed an interlocutory application for sealing which required, among others, that the proceedings be heard in-camera or otherwise than in open court, that there to be no publication of the identities of the parties to the proceedings or of any matter that would reasonably enable the public to deduce the identities of the parties.
On September 4, 2018, immediately following the conclusion of the hearings before the Singapore High Court, the presiding Justice dismissed the Republic’s Setting Aside Application and awarded $40,000 in favor of the Parent Company by way of costs. The Republic did not appeal the decision to the Singapore Court of Appeal within the prescribed 30-day period and so, the dismissal of the Setting Aside Application became final on October 4, 2018.
As at December 31, 2018, Parent Company has an outstanding claim against the ROP, through the DOF, pursuant to the arbitral and court decisions to compensate the Parent Company for the delayed implementation of its relevant tariffs for the Fourth Rate Rebasing Period (2013 to 2017) in the amount of P3.18 billion, with costs of litigation in the amount of $40,000. The P3.18 billion refers to Parent Company’s aggregate foregone revenues from March 11, 2015 to August 31, 2016, with cost of money as of August 31, 2016.
As at December 31, 2017 and December 31, 2016, Parent Company’s aggregate foregone revenues, with cost of money as of the same dates, are P11.4 billion and P8.2 billion, respectively.
The Parent Company computed a rebasing adjustment for the Fifth Rate Rebasing Period (2018 to 2022) based on an Opening Cash Position as of December 31, 2017, which included the foregone revenues from the Fourth Rate Rebasing Period. Hence, as of December 31, 2018, the aggregate foregone revenues remain at P11.4 billion.
On February 11, 2019, the Parent Company wrote the DOF about the amount of its updated claim for compensation by the ROP, with a request that the DOF order the MWSS and the RO to meet with the Parent Company to agree and discuss a proposed settlement of the updated claim.
As of February 26, 2019, the DOF has yet to respond to the Company’s letter.
• 2013-2017 Rate Rebasing - Domestic Court Actions.
In a decision dated August 30, 2017, the Regional Trial Court, Branch 93 of Quezon City (“RTC”) granted the Petition for Confirmation and Enforcement of the First Award which petitioner, the Parent Company, filed in July 2015 (the “Decision”) following the refusal of MWSS and the RO to implement the First Award. As mentioned above, the First Award upheld the 13.41% Rebasing Adjustment that the Parent Company proposed for the Fourth Rate Rebasing Period.
The MWSS filed a Motion for Reconsideration of the Decision (“MR”). The RTC denied the MR in an Order dated November 23, 2017. Subsequently, MWSS filed a Petition for Review with the Court of Appeals (“CA”) on December 27, 2017 asking for a reversal of the RTC’s Decision. The Parent Company filed its Comment to the Petition for Review and in that Comment, the Parent Company prayed for the dismissal of the Petition for Review and for the immediate enforcement of the Decision and the First Award.
As a consequence of the issuance of the Decision, the Parent Company filed, on October 18, 2017, a Motion for Execution of the First Award (“MotEx”). However, the RTC, on February 6, 2018, denied the MotEx.
In its decision dated May 30, 2018, the CA denied MWSS’s Petition for Review, and affirmed the RTC Decision and Order confirming the Final Award (“CA Decision”).
On June 14, 2018, Maynilad filed with the CA a Motion for Clarification (on the CA Decision) for the CA to confirm that the RTC and CA Decisions are immediately executory, and that MWSS should therefore implement the Final Award without any further delay (“Motion for Clarification”).
Notes to Consolidated Financial Statements

FinancialStatements
MAYNILAD 2018 ANNUAL REPORT 95
In the meantime, on July 11, 2018, Maynilad received MWSS’s Petition for Review on Certiorari with the SC (under Rule 19.37 of the Special Rules of Court on Alternative Dispute Resolution) with Manifestation dated July 4, 2018 (the “Petition for Review”). MWSS prayed that the SC (i) reverse and set aside the CA Decision, and (ii) grant MWSS’s counter-petition and declare MWSS as legally released or excused from implementing or enforcing the Final Award or, in the alternative, declare the Final Award as unenforceable.
On July 30, 2018, the CA issued a Resolution noting, without action, the Motion for Clarification that Maynilad filed “in view of the pending Petition for Review” which the MWSS filed with the SC.
On November 19, 2018, the Second Division of the SC ordered the consolidation of the Petition with (five) consolidated petitions pending before the SC En Banc (the “Consolidated Cases”), which Consolidated Cases seek to, among other things, have the Concession Agreement nullified. On January 11, 2019, the Parent Company filed a Motion to De-consolidate the Petition from the Consolidated Cases.
As at February 26, 2019, the SC has yet to decide on MWSS’s Petition for Review on Certiorari and Maynilad’s Motion to De-consolidate the Petition from the Consolidated Cases.
Fifth Rate Rebasing Rate Rebasing: 2018-2022
On March 31, 2017, the Parent Company submitted a five-year business plan to the RO for the new rate rebasing covering the years from 2018 to 2022 with its proposed rate adjustments. On September 13, 2018, the MWSS issued Resolution No. 2018-136-RO adopting RO Resolution No. 2018-09-CA dated September 7, 2018 granting Maynilad a partial rate adjustment of P5.73/cu.m. for the Fifth Rate Rebasing Period (2018 to 2022), to be implemented on an uneven staggered basis of (i) P0.90/cu.m. effective October 1, 2018; (ii) P1.95/cu.m. effective January 1, 2020, (iii) P1.95/cu.m. effective January 1, 2021, and (iv) P0.93/cu.m. effective January 1, 2022. The approved rate adjustment still does not include the corporate income tax (“CIT”) component to which Maynilad is entitled by virtue of the First Award. In their Resolutions, the MWSS and RO stated that the inclusion of the CIT in Maynilad’s tariff is subject to the SC’s resolution of MWSS’s Petition for Review.
To preserve its right to the CIT which has already been adjudged in its favor in the First Award, and pursuant to Article 12 of the Concession Agreement, Maynilad, on October 12, 2018, filed a Dispute Notice, signaling the start of another arbitration.
As at February 26, 2019, despite the dismissal of the ROP’s Setting Aside Application, the management cannot yet determine, with reasonable certainty, whether the ROP would honor the Second Award and compensate the Parent Company for its foregone revenues. As such, the consolidated financial statements have yet to reflect any adjustments.
Summary of Significant Accounting and Financial Reporting Policies
Basis of PreparationThe consolidated financial statements have been prepared on a historical cost basis. The consolidated financial statements are presented in Philippine peso, which is the Parent Company’s functional and presentation currency, and all amounts are rounded to the nearest thousand (P000), except when otherwise indicated.
Statement of ComplianceThe accompanying consolidated financial statements have been prepared in accordance with Philippine Financial Reporting Standards (PFRS). PFRS include statements named PFRS and Philippine Accounting Standards (PAS), including Philippine Interpretations from International Financial Reporting Interpretations Committee (IFRIC) issued by the Financial Reporting Standards Council (FRSC) and Philippine Interpretations Committee (PIC). Basis of ConsolidationThe accompanying consolidated financial statements comprise the financial statements of the Parent Company and all of its subsidiaries (collectively referred to as the “Company”).
2.

96 Sustaining Growth
Control is achieved when the Company is exposed, or has rights, to variable returns from its involvement with the investee and has the ability to affect those returns through its power over the investee. Specifically, the Company controls an investee, if and only if, the Company has:
• Power over the investee (i.e., existing rights that give it the current ability to direct the relevant activities of the investee);
• Exposure, or rights, to variable returns from its involvement with the investee; and• The ability to use its power over the investee to affect its returns.
Generally, there is a presumption that a majority of voting rights results in control. To support this presumption and when the Company has less than a majority of the voting or similar rights of an investee, the Company considers all relevant facts and circumstances in assessing whether it has power over an investee, including:
• The contractual arrangement(s) with the other vote holders of the investee;• Rights arising from other contractual arrangements; and• The Company’s voting rights and potential voting rights.
The Company re-assesses whether or not it controls an investee if facts and circumstances indicate that there are changes to one or more of the three elements of control. Consolidation of a subsidiary begins when the Company obtains control over the subsidiary and ceases when the Company loses control of the subsidiary. Assets, liabilities, income and expenses of a subsidiary acquired or disposed of during the year are included in the consolidated financial statements from the date the Company gains control until the date the Company ceases to control the subsidiary.
A change in the ownership interest of a subsidiary, without loss of control, is accounted for as an equity transaction. If the Company loses control over a subsidiary, it derecognizes the related assets (including goodwill), liabilities, non-controlling interest and other components of equity, while any resultant gain or loss is recognized in profit or loss. Any investment retained is recognized at fair value.
The financial statements of Maynilad and the following subsidiaries that it controls comprise the consolidated financial statements.
All subsidiaries are wholly-owned and incorporated in the Philippines.
Phil Hydro. On August 3, 2012, the Parent Company through a Share Purchase Agreement with a third party acquired 100% ownership interest in Phil Hydro.
Phil Hydro is engaged in waterworks construction, engineering and engineering consulting services. Phil Hydro is currently undertaking water supply projects outside Metro Manila in line with the thrusts of the government under Presidential Decree No. 198, also known as the Provincial Water Utilities Act of 1973, which mandates the local government units to create and operate local water utilities and provide potable water to the public.Phil Hydro has existing 25-year Bulk Water Supply Agreements (BWSAs) with various provincial municipalities outside the West Service Area and a Memorandum of Agreement with certain provincial municipality for the construction and operation of water treatment facilities for water distribution services.
Amayi. Amayi is incorporated for the purpose of operating, managing, maintaining and rehabilitating waterworks, wastewater and sanitation system and services outside the Concession Area.
The financial statements of the subsidiaries are prepared for the same reporting year as the Parent Company using consistent accounting policies. All significant intercompany balances, transactions, income and expense and profits and losses from intercompany transactions are eliminated in full upon consolidation.
Subsidiaries Nature of Business
Philippine Hydro, Inc. (Phil Hydro) Bulk water supply and water distribution (outside the West Service Area)
Amayi Water Solutions Inc. (Amayi) Water distribution (outside the West Service Area)
Notes to Consolidated Financial StatementsNotes to Consolidated Financial Statements

FinancialStatements
MAYNILAD 2018 ANNUAL REPORT 97
Changes in Accounting Policies and DisclosuresThe accounting policies adopted in the preparation of the consolidated financial statements are consistent with those of the previous financial year, except for the adoption of the following new accounting pronouncements starting January 1, 2018. Adoption of these pronouncements did not have any significant impact on the Company’s financial position or performance unless otherwise indicated.
• Amendments to PFRS 2, Share-based Payment, Classification and Measurement of Share-based Payment Transactions
• Amendments to PFRS 4, Insurance Contracts, Applying PFRS 9, Financial Instruments, with PFRS 4• PFRS 9, Financial Instruments
PFRS 9 reflects all phases of the financial instruments project and replaces PAS 39, Financial Instruments: Recognition and Measurement, and all previous versions of PFRS 9. The standard introduces new requirements for classification and measurement, impairment, and hedge accounting. Retrospective application is required but providing comparative information is not compulsory. For hedge accounting, the requirements are generally applied prospectively, with some limited exceptions.
The Company has adopted PFRS 9 with the date of initial application of January 1, 2018. PFRS 9 replaces PAS 39, Financial Instruments: Recognition and Measurement and all previous versions of PFRS 9. The standard introduces new requirements for classification and measurement, impairment and hedge accounting.
The Company chose not to restate comparative figures as permitted by the transitional provisions of PFRS 9, thereby resulting in the following impact:
• Comparative information for prior periods will not be restated. The classification and measurement requirements previously applied in accordance with PAS 39 and disclosures required in PFRS 7 will be retained for the comparative periods. Accordingly, the information presented for 2017 does not reflect the requirements of PFRS 9.
• The Company will disclose the accounting policies for both the current period and the comparative periods, one applying PFRS 9 beginning January 1, 2018 and one applying PAS 39 as of December 31, 2017.
• The difference between the previous carrying amount and the carrying amount at the beginning of the annual reporting period that includes the date of initial application will be recognized in the opening “Retained earnings” or other component of equity, as appropriate. As comparative information is not restated, the Company is not required to provide a third consolidated statement of financial information at the beginning of the earliest comparative period in accordance with PAS 1, Presentation of Financial Statements.
Classification and measurementUnder PFRS 9, debt instruments are subsequently measured at fair value through profit or loss (FVPL), amortized cost, or fair value through OCI (FVOCI). The classification is based on two criteria:
a. The Company’s business model for managing the assets; and b. Whether the instruments’ contractual cash flows represent ‘solely payment of principal and interest’ on the
principal amount outstanding.
The assessment of the Company’s business model was made as of the date of initial application, January 1, 2018. The assessment of whether contractual cash flows on debt instruments are solely comprised of principal and interest was made based on the facts and circumstances as at the initial recognition of the assets.
The following are the changes in the classification of the Company’s financial assets:
a. Cash and cash equivalents, short-term investments, trade and other receivables, deposits and sinking fund and miscellaneous deposits classified as loans and receivables as at December 31, 2017 are held to collect contractual cash flows and give rise to cash flows representing solely payments of principal and interest. These are classified and measured as financial assets at amortized cost beginning January 1, 2018.

98 Sustaining Growth
b. Unquoted equity investments in non-listed companies classified as AFS financial assets as at December 31, 2017 are classified and measured as financial assets designated at FVOCI beginning January 1, 2018. The Company elected to classify irrevocably its unquoted equity investments under this category at the date of initial application as it intends to hold these investments for the foreseeable future.
The following are the changes in the classification and measurement of the Company’s financial assets as at January 1, 2018:
c. There were no changes to the classification and measurement of financial liabilities. As of December 31, 2018 and 2017, the Company does not hold financial liabilities designated at FVPL.The adoption of new classification and measurement policy have insignificant impact at the Company’s retained earnings as at January 1, 2018.
ImpairmentThe adoption of PFRS 9 has changed the Company’s accounting for impairment losses for financial assets by replacing PAS 39’s incurred loss approach with a forward-looking expected credit loss (ECL) approach. PFRS 9 requires the Company to recognize an allowance for ECL for all debt instruments not held at fair value through profit or loss and contract assets.
The adoption of ECL approach has no significant impact on the allowance for impairment losses and retained earnings as at January 1, 2018.
• PFRS 15, Revenue from Contracts with Customers
The Company has adopted PFRS 15 with a date of initial application of January 1, 2018.PFRS 15 supersedes PAS 11 Construction Contracts, PAS 18 Revenue and related Interpretations and it applies, with limited exceptions, to all revenue arising from contracts with its customers. PFRS 15 establishes a five-step model to account for revenue arising from contracts with customers and requires that revenue be recognized at an amount that reflects the consideration to which an entity expects to be entitled in exchange for transferring goods or services to a customer. The new standard establishes a five-step model to account for revenue arising from contracts with customers. The five-step model is as follows:
1. Identify the contract(s) with a customer;2. Identify the performance obligations in the contract;3. Determine the transaction price;4. Allocate the transaction price to the performance obligations in the contract; and5. Recognize revenue when (or as) the entity satisfies a performance obligation.
PFRS 15 requires entities to exercise judgement, taking into consideration all of the relevant facts and circumstances when applying each step of the model to contracts with their customers. The standard also specifies the accounting for the incremental costs of obtaining a contract and the costs directly related to fulfilling a contract. In addition, the standard requires extensive disclosures.
PFRS 9
PAS 39 Amortized Cost FVOCI
(Amount in Thousands)
Loans and receivables
Cash in banks and cash equivalents P3,479,640 P3,479,640 P–
Short-term investments 1,501,000 1,501,000 –
Trade and other receivables 2,602,129 2,602,129 –
Deposits and sinking fund 1,665,398 1,665,398 –
Miscellaneous deposit 368,151 368,151 –
AFS financial assets
Unquoted equity investments 124,864 – 124,864
Notes to Consolidated Financial Statements

FinancialStatements
MAYNILAD 2018 ANNUAL REPORT 99
The Company adopted PFRS 15 using the modified retrospective method of adoption with the date of initial application of January 1, 2018. Under this method, the standard can be applied either to all contracts at the date of initial application or only to contracts that are not completed (“open contracts”) at this date.The Company invoked the impracticability of retrospective restatement of revenue from connection and installation fees recognized prior to January 1, 2018, in accordance with PAS 8, Accounting Policies, Changes in Accounting Estimates and Errors, since the Company currently does not have sufficient historical records of all connection fees per water service connection, including its related costs for all outstanding contracts as of January 1, 2018. Therefore, the Company elected to apply the standard to all open contracts only starting January 1, 2018. Set out below are the amounts by which each financial statement line item is affected as at and for the year ended December 31, 2018 as a result of the adoption of PFRS 15. The adoption of PFRS 15 did not have a material impact on OCI or the Company’s operating, investing and financing cash flows. The first column shows amounts prepared under PFRS 15 and the second column shows what the amounts would have been had PFRS 15 not been adopted:
Consolidated statement of income forthe year ended December 31, 2018
Amounts prepared under(In Thousands)
Increase/(Decrease)
PFRS 15 PAS 18
OPERATING REVENUE
Water Services:
West zone P17,810,615 P17,810,615 P–
Outside west zone 262,353 262,353 –
Sewer Services -
West Zone 3,851,972 3,851,972 –
Others 98,709 339,828 (241,119)
22,023,649 22,264,768 (241,119)
COST AND EXPENSES
Contracted services 884,734 1,011,156 (126,422)
PROVISION FOR INCOME TAX
Deferred 552,252 572,897 (20,645)
Consolidated statement of financial positionas at December 31, 2018
Amounts prepared under(In Thousands)
Increase/(Decrease)
PFRS 15 PAS 18
ASSETS
Trade and other receivables P1,674,114 P2,859,161 (P1,185,047)
Contract assets 1,185,047 – 1,185,047
Other current assets 1,303,549 1,296,653 6,896
Other noncurrent assets 2,329,554 2,210,028 119,526
LIABILITIES
Trade and other payables 16,204,862 16,191,484 13,378
Other noncurrent liabilities 307,058 71,451 235,607
EQUITY
Retained earnings 34,221,396 34,127,344 (94,052)

100 Sustaining Growth
The reason for the significant changes in the consolidated statement of financial position as at December 31, 2018 and the consolidated statement of income for the year ended December 31, 2018 is described below:
(a) Water and wastewater services
Connection and installation feesBefore the adoption of PFRS 15, the Company recognized connection and installation revenue once the customer has been connected to the Company’s water system. Costs related to the service such as labor and materials are expensed once incurred.
Under PFRS 15, the Company will recognize the connection and installation revenue over time and will be treated not as a separate performance obligation within the context of the contract since it is highly interdependent on the supply of water. The revenues and related costs together with the water services are amortized over the remaining concession period. Upon adoption of PFRS 15, the Company recognized contract liabilities amounting to P13.4 million under “Trade and other payables” account for the current portion and P235.6 million under “Other noncurrent liabilities” account for the noncurrent portion in the 2018 consolidated statement of financial position, for the future services in relation to the connection and installation. The Company also recognized related costs amounting to P6.9 million under “Other current asset” and P119.5 million under “Other noncurrent assets” accounts in the 2018 consolidated statement of financial position.
Unbilled revenueBefore the adoption of PFRS 15, the Company presented the services rendered but not yet billed as unbilled receivable under “Trade and other receivables” account in the consolidated statement of financial position.
Upon adoption of PFRS 15, the Company presented this unbilled receivable as contract assets amounting to P1,185.0 million in the 2018 consolidated statement of financial position because the related services have already been rendered but the Company’s right to collect
• Amendments to PAS 28, Measuring an Associate or Joint Venture at Fair Value (Part of Annual Improvements to PFRSs 2014 - 2016 Cycle)
• Amendments to PAS 40, Investment Property, Transfers of Investment Property • Philippine Interpretation IFRIC-22, Foreign Currency Transactions and Advance Consideration
The interpretation clarifies that, in determining the spot exchange rate to use on initial recognition of the related asset, expense or income (or part of it) on the derecognition of a non-monetary asset or non-monetary liability relating to advance consideration, the date of the transaction is the date on which an entity initially recognizes the nonmonetary asset or non-monetary liability arising from the advance consideration. If there are multiple payments or receipts in advance, then the entity must determine a date of the transactions for each payment or receipt of advance consideration. Entities may apply the amendments on a fully retrospective basis. Alternatively, an entity may apply the interpretation prospectively to all assets, expenses and income in its scope that are initially recognized on or after the beginning of the reporting period in which the entity first applies the interpretation or the beginning of a prior reporting period presented as comparative information in the financial statements of the reporting period in which the entity first applies the interpretation.
Standards, Amendments and Interpretations Issued but Not Yet EffectiveThe Company did not early adopt the following pronouncements issued but not yet effective.Except as otherwise indicated, the Company does not expect the adoption of these pronouncements to have a significant impact on its consolidated financial statements. The Company intends to adopt the following pronouncements when they become effective.
Notes to Consolidated Financial Statements
FinancialStatements
MAYNILAD 2018 ANNUAL REPORT 101
Effective 2019
• Amendments to PFRS 9, Prepayment Features with Negative Compensation• PFRS 16, Leases
PFRS 16 sets out the principles for the recognition, measurement, presentation and disclosure of leases and requires lessees to account for all leases under a single on-balance sheet model similar to the accounting for finance leases under PAS 17, Leases. The standard includes two recognition exemptions for lessees – leases of ’low-value’ assets (e.g., personal computers) and short-term leases (i.e., leases with a lease term of 12 months or less). At the commencement date of a lease, a lessee will recognize a liability to make lease payments (i.e., the lease liability) and an asset representing the right to use the underlying asset during the lease term (i.e., the right-of-use asset). Lessees will be required to separately recognize the interest expense on the lease liability and the depreciation expense on the right-of-use asset.
Lessees will be also required to remeasure the lease liability upon the occurrence of certain events (e.g., a change in the lease term, a change in future lease payments resulting from a change in an index or rate used to determine those payments). The lessee will generally recognize the amount of the remeasurement of the lease liability as an adjustment to the right-of-use asset.
Lessor accounting under PFRS 16 is substantially unchanged from today’s accounting under
PAS 17. Lessors will continue to classify all leases using the same classification principle as in PAS 17 and distinguish between two types of leases: operating and finance leases.
PFRS 16 also requires lessees and lessors to make more extensive disclosures than under PAS 17.
A lessee can choose to apply the standard using either a full retrospective or a modified retrospective approach. The standard’s transition provisions permit certain reliefs. The Company will apply the standard from its mandatory adoption date of January 1, 2019.
The Company intends to apply the simplified transition approach and will not restate comparative amounts for the year prior to first adoption. Right-of-use assets will be measured at the amount of the lease liability on adoption.
The Company will elect to use the exemptions proposed by the standard on lease contracts for which the lease terms ends within 12 months as of the date of initial application, and lease contracts for which the underlying asset is of low value. The Company has leases of certain office equipment (i.e., photocopying machines) that are considered of low value.
The accounting for operating leases where the Company acts as the lessee will significantly change due to the adoption of PFRS 16. As of December 31, 2018, the Company has non-cancellable operating lease commitments of P532.5 million. Of these commitments, the Company expects to recognize right-of-use assets and lease liabilities of P316.4 million as of January 1, 2019.
The remaining lease commitments are classified as short-term leases and low-value leases for which the Company will continue to recognize the associated lease payments in profit or loss on a straight-line basis. Overall, the Company’s equity will be P1.7 million higher upon initial adoption of the new leases standard.
Moving forward, the Company’s cash flows from operating activities will increase and cash flows from financing cash flows will decrease as repayment of the principal portion of the lease liabilities will be classified as cash flows from financing activities.
• Amendments to PAS 19, Employee Benefits, Plan Amendment, Curtailment or Settlement
The amendments to PAS 19 address the accounting when a plan amendment, curtailment or settlement occurs during a reporting period. The amendments specify that when a plan amendment, curtailment or settlement occurs during the annual reporting period, an entity is required to:

102 Sustaining Growth
• Determine current service cost for the remainder of the period after the plan amendment, curtailment or settlement, using the actuarial assumptions used to remeasure the net defined benefit liability (asset) reflecting the benefits offered under the plan and the plan assets after that event; and
• Determine net interest for the remainder of the period after the plan amendment, curtailment or settlement using: the net defined benefit liability (asset) reflecting the benefits offered under the plan and the plan assets after that event; and the discount rate used to remeasure that net defined benefit liability (asset).
The amendments also clarify that an entity first determines any past service cost, or a gain or loss on settlement, without considering the effect of the asset ceiling. This amount is recognized in profit or loss. An entity then determines the effect of the asset ceiling after the plan amendment, curtailment or settlement. Any change in that effect, excluding amounts included in the net interest, is recognized in other comprehensive income.
The amendments apply to plan amendments, curtailments, or settlements occurring on or after the beginning of the first annual reporting period that begins on or after January 1, 2019, with early application permitted. These amendments will apply only to any future plan amendments, curtailments, or settlements of the Company.
The Company is currently assessing the impact of adopting this interpretation.
• Annual Improvements to PFRSs 2015-2017 Cycle
• Amendments to PFRS 3, Business Combinations, and PFRS 11, Joint Arrangements, Previously Held Interest in a Joint Operation
• Amendments to PAS 12, Income Tax Consequences of Payments on Financial Instruments Classified as Equity
• Amendments to PAS 23, Borrowing Costs, Borrowing Costs Eligible for Capitalization
• Amendments to PAS 28, Long-term Interests in Associates and Joint Ventures• Philippine Interpretation IFRIC-23, Uncertainty over Income Tax Treatments
The interpretation addresses the accounting for income taxes when tax treatments involve uncertainty that affects the application of PAS 12 and does not apply to taxes or levies outside the scope of PAS 12, nor does it specifically include requirements relating to interest and penalties associated with uncertain tax treatments.The interpretation specifically addresses the following:
• Whether an entity considers uncertain tax treatments separately;• The assumptions an entity makes about the examination of tax treatments by taxation authorities;• How an entity determines taxable profit (tax loss), tax bases, unused tax losses, unused tax credits and tax
rates; and• How an entity considers changes in facts and circumstances.
An entity must determine whether to consider each uncertain tax treatment separately or together with one or more other uncertain tax treatments. The approach that better predicts the resolution of the uncertainty should be followed.
The Company is currently assessing the impact of adopting this interpretation.
Effective 2020
• Amendments to PFRS 3, Definition of a Business• Amendments to PAS 1, Presentation of Financial Statements, and PAS 8, Accounting Policies, Changes in
Accounting Estimates and Errors, Definition of Material
Notes to Consolidated Financial Statements

FinancialStatements
MAYNILAD 2018 ANNUAL REPORT 103
Effective 2021
• PFRS 17, Insurance Contracts
Deferred effectivity
• Amendments to PFRS 10, Consolidated Financial Statements, and PAS 28, Sale or Contribution of Assets between an Investor and its Associate or Joint Venture
Business Combinations and GoodwillBusiness combinations are accounted for using the acquisition method of accounting. The cost of an acquisition is measured as the aggregate of the consideration transferred, measured at acquisition date fair value and the amount of any non-controlling interest in the acquiree. For each business combination, the acquirer measures the non-controlling interest in the acquiree either at fair value or at the proportionate share of the acquiree’s identifiable net assets. Acquisition costs incurred are expensed as incurred and included in costs and expenses.
When the Company acquires a business, it assesses the financial assets and liabilities assumed for appropriate classification and designation in accordance with the contractual terms, economic circumstances and pertinent conditions as at the acquisition date. This includes the separation of embedded derivatives in host contracts by the acquiree.
Any contingent consideration to be transferred by the acquirer will be recognized at fair value at the acquisition date. Contingent consideration classified as an asset or liability that is a financial instrument and within the scope of PAS 39 is measured at fair value with the changes in fair value recognized in profit or loss.
Goodwill is initially measured at cost (being the excess of the aggregate of the consideration transferred and the amount recognized for non-controlling interests and any previous interest held over the net identifiable assets acquired and liabilities assumed). If the fair value of the net assets acquired is in excess of the aggregate consideration transferred, the Company re-assesses whether it has correctly identified all of the assets acquired and all of the liabilities assumed and reviews the procedures used to measure the amounts to be recognized at the acquisition date. If the reassessment still results in an excess of the fair value of net assets acquired over the aggregate consideration transferred, then the gain is recognized in profit or loss.
After initial recognition, goodwill is measured at cost less any accumulated impairment losses. For the purpose of impairment testing, goodwill acquired in a business combination is, from the acquisition date, allocated to each of the Company’s cash-generating units that are expected to benefit from the combination, irrespective of whether other assets or liabilities of the acquiree are assigned to those units.
Where goodwill has been allocated to a cash-generating unit (CGU) and part of the operation within that unit is disposed of, the goodwill associated with the disposed operation is included in the carrying amount of the operation when determining the gain or loss on disposal. Goodwill disposed in these circumstances is measured based on the relative values of the disposed operation and the portion of the cash-generating unit retained.
Current Versus Non-current ClassificationThe Company presents assets and liabilities in the consolidated statements of financial position based on current/non-current classification.
An asset is current when it is:
• Expected to be realized or intended to be sold or consumed in the normal operating cycle;• Held primarily for the purpose of trading;• Expected to be realized within twelve months after the reporting period; or• Cash or cash equivalent unless restricted from being exchanged or used to settle a liability for at least twelve
months after the reporting period.
All other assets are classified as non-current.

104 Sustaining Growth
A liability is current when:
• It is expected to be settled in the normal operating cycle;• It is held primarily for the purpose of trading;• It is due to be settled within twelve months after the reporting period; or• There is no unconditional right to defer the settlement of the liability for at least twelve months after the
reporting period.
The Company classifies all other liabilities as non-current.
Deferred tax assets and liabilities are classified as non-current assets and liabilities, respectively.
Fair Value MeasurementThe Company measures financial instruments at fair value at each reporting date.Fair value is the price that would be received to sell an asset or paid to transfer a liability in an orderly transaction between market participants at the measurement date. The fair value measurement is based on the presumption that the transaction to sell the asset or transfer the liability takes place either:
• in the principal market for the asset or liability; or• in the absence of a principal market, in the most advantageous market for the asset or liability.
The principal or the most advantageous market must be accessible by the Company.
The fair value of an asset or a liability is measured using the assumptions that market participants would use when pricing the asset or liability, assuming that market participants act in their economic best interest. A fair value measurement of a non-financial asset takes into account a market participant’s ability to generate economic benefits by using the asset or by selling it to another market participant that would use the asset in its highest and best use.
The Company uses valuation techniques that are appropriate in the circumstances and for which sufficient data are available to measure fair value, maximizing the use of relevant observable inputs and minimizing the use of unobservable inputs.
All assets and liabilities for which fair value is measured or disclosed in the consolidated financial statements are categorized within the fair value hierarchy, described as follows, based on the lowest level input that is significant to the fair value measurement as a whole:
• Level 1 – Quoted (unadjusted) market prices in active markets for identical assets or liabilities;• Level 2 – Valuation techniques for which the lowest level input that is significant to the fair value measurement
is directly or indirectly observable; and• Level 3 – Valuation techniques for which the lowest level input that is significant to the fair value measurement
is unobservable.
For assets and liabilities that are recognized in the consolidated financial statements on a recurring basis, the Company determines whether transfers have occurred between levels in the hierarchy by re-assessing categorization (based on the lowest level input that is significant to the fair value measurement as a whole) at the end of each reporting period.
The Company’s management determines the policies and procedures for both recurring and nonrecurring fair value measurements.
For the purpose of fair value disclosures, the Company has determined classes of assets and liabilities on the basis of the nature, characteristics and risks of the asset or liability and the level of the fair value hierarchy as explained above. Fair value measurement disclosures are presented in Note 25.
Notes to Consolidated Financial Statements

FinancialStatements
MAYNILAD 2018 ANNUAL REPORT 105
Cash and Cash EquivalentsCash includes cash on hand and in banks. Cash in banks is stated at face value and earns interest at respective bank deposit rates. Cash equivalents are short-term, highly liquid investments that are readily convertible to known amounts of cash with original maturities of three months or less from the date of acquisition and that are subject to an insignificant risk of change in value.
Short-term InvestmentsShort-term investments are investments with maturities of more than three months to one year.
Financial Instruments – Effective Prior to January 1, 2018
Date of RecognitionFinancial instruments are recognized when the Company becomes a party to the contractual provisions of the instrument. Purchases or sales of financial assets that require delivery of assets within the time frame established by regulation or convention in the marketplace are recognized on the settlement date. Derivatives are recognized on trade date basis. Accounts and notes receivables are recognized when cash is received by the Company or advanced to the borrowers and counterparties.
Initial recognition of financial instrumentsAll financial instruments are initially measured at fair value. Except for financial assets and financial liabilities valued at fair value through profit or loss, the initial measurement of financial instruments includes transaction costs.
The Company has no financial assets at FVPL and held-to-maturity (HTM) investments and financial liabilities at FVPL as at December 31, 2017.
Subsequent Measurement
Loans and receivablesLoans and receivables are non-derivative financial assets with fixed or determinable payments that are not quoted in an active market. After initial measurement, such financial assets are subsequently measured at amortized cost using the effective interest rate (EIR) method, less impairment. Amortized cost is calculated by taking into account any discount or premium on acquisition and fees or costs that are an integral part of the EIR. The EIR amortization is included in finance income in the consolidated statements of income. The losses arising from impairment are recognized in the consolidated statements of income in finance costs for loans and receivables. Loans and receivables are included in current assets if maturity is within twelve months from the reporting date. Otherwise, these are classified as noncurrent assets.
This category includes the Company’s cash and cash equivalents, short-term investments, trade and other receivables, and sinking fund, deposits, and miscellaneous deposits shown as part of “Other current assets” and “Other noncurrent assets” accounts in the consolidated statements of financial position (see Notes 4, 5 and 6).
AFS financial assetsAFS financial assets include equity investments and debt securities. Equity investments classified as AFS are those that are neither classified as held for trading nor designated at FVPL. Debt securities in this category are those that are intended to be held for an indefinite period of time and that may be sold in response to needs for liquidity or in response to changes in market conditions.
After initial measurement, AFS financial assets are subsequently measured at fair value with unrealized gains or losses recognized in OCI and credited to the AFS reserve until the investment is derecognized, at which time, the cumulative gain or loss is recognized in other operating income, or the investment is determined to be impaired, when the cumulative loss is reclassified from the AFS reserve to the consolidated statements of income in finance costs. Interest earned whilst holding AFS financial assets is reported as interest income using the EIR method.
The Company evaluates whether the ability and intention to sell its AFS financial assets in the near term is still appropriate. When, in rare circumstances, the Company is unable to trade these financial assets due to inactive

106 Sustaining Growth
markets, the Company may elect to reclassify these financial assets if management has the ability and intention to hold the assets for the foreseeable future or until maturity. The Company’s AFS financial assets are included in Note 9.
Loans and borrowings and payablesAfter initial recognition, interest-bearing loans and borrowings are subsequently measured at amortized cost using the EIR method. Gains and losses are recognized in profit or loss when the liabilities are derecognized as well as through the EIR amortization process.
Amortized cost is calculated by taking into account any discount or premium on acquisition and fees or costs that are an integral part of the EIR. The EIR amortization is included as finance costs in the consolidated statements of income.
This category includes trade and other payables (excluding statutory liabilities), interest-bearing loans, service concession obligation payable to MWSS and customers’ deposits presented in the consolidated statements of financial position (see Notes 10, 11 and 12).
‘Day 1’ differenceWhere the transaction price in a non-active market is different from the fair value of other observable current market transactions in the same instrument or based on a valuation technique whose variables include only data from observable market, the Company recognizes the difference between the transaction price and fair value (a ‘Day 1’ difference) in the consolidated statements of income unless it qualifies for recognition as some other type of asset.
In cases where use is made of data which is not observable, the difference between the transaction price and model value is only recognized in the consolidated statements of income when the inputs become observable or when the instrument is derecognized. For each transaction, the Company determines the appropriate method of recognizing the ‘Day 1’ difference amount.
Financial Instruments – Effective Starting January 1, 2018
Classification of financial assets Financial assets are classified in their entirety based on the contractual cash flows characteristics of the financial assets and the Company’s business model for managing the financial assets. The Company classifies its financial assets into the following measurement categories:
• financial assets measured at amortized cost;• financial assets measured at fair value through profit or loss;• financial assets measured at fair value through other comprehensive income, where cumulative gains or losses
previously recognized are reclassified to profit or loss; and• financial assets measured at fair value through other comprehensive income, where cumulative gains or losses
previously recognized are not reclassified to profit or loss.
The Company has no financial assets at FVPL and FVOCI where cumulative gains or losses previously recognized are reclassified to profit or loss as at December 31, 2018.
Contractual cash flows characteristicsIf the financial asset is held within a business model whose objective is to hold assets to collect contractual cash flows or within a business model whose objective is achieved by both collecting contractual cash flows and selling financial assets, the Company assesses whether the cash flows from the financial asset represent solely payments of principal and interest (SPPI) on the principal amount outstanding.
In making this assessment, the Company determines whether the contractual cash flows are consistent with a basic lending arrangement, i.e., interest includes consideration only for the time value of money, credit risk and other basic lending risks and costs associated with holding the financial asset for a particular period of time. In addition, interest can include a profit margin that is consistent with a basic lending arrangement. The assessment as to whether the cash flows meet the test is made in the currency in which the financial asset is denominated. Any other contractual terms that introduce exposure to risks or volatility in the contractual cash flows that is unrelated to a basic lending arrangement, such as exposure to changes in equity prices or commodity prices, do not give rise to contractual cash flows that are solely payments of principal and interest on the principal amount outstanding.
Notes to Consolidated Financial Statements

FinancialStatements
MAYNILAD 2018 ANNUAL REPORT 107
Business modelThe Company’s business model is determined at a level that reflects how groups of financial assets are managed together to achieve a particular business objective. The Company’s business model does not depend on management’s intentions for an individual instrument.
The Company’s business model refers to how it manages its financial assets in order to generate cash flows. The Company’s business model determines whether cash flows will result from collecting contractual cash flows, selling financial assets or both. Relevant factors considered by the Company in determining the business model for a group of financial assets include how the performance of the business model and the financial assets held within that business model are evaluated and reported to the Company’s key management personnel, the risks that affect the performance of the business model (and the financial assets held within that business model) and how these risks are managed and how managers of the business are compensated.
Financial assets at amortized costA financial asset is measured at amortized cost if (i) it is held within a business model whose objective is to hold financial assets in order to collect contractual cash flows and (ii) the contractual terms of the financial asset give rise on specified dates to cash flows that are solely payments of principal and interest on the principal amount outstanding. These financial assets are initially recognized at fair value plus directly attributable transaction costs and subsequently measured at amortized cost using the EIR method, less any impairment in value. Amortized cost is calculated by taking into account any discount or premium on acquisition and fees and costs that are an integral part of the EIR. The amortization is included in “Interest income” in the consolidated statement of income and is calculated by applying the EIR to the gross carrying amount of the financial asset, except for (i) purchased or originated credit-impaired financial assets and (ii) financial assets that have subsequently become credit-impaired, where, in both cases, the EIR is applied to the amortized cost of the financial asset. Losses arising from impairment are recognized in “provision for expected credit losses” account in the consolidated statement of income.
This category includes cash and cash equivalents, short-term investments, trade and other receivables, contract assets, deposits and sinking fund and miscellaneous deposits.
Financial assets at fair value through other comprehensive income A financial asset is measured at FVOCI if (i) it is held within a business model whose objective is achieved by both collecting contractual cash flows and selling financial assets and (ii) its contractual terms give rise on specified dates to cash flows that are solely payments of principal and interest on the principal amount outstanding. These financial assets are initially recognized at fair value plus directly attributable transaction costs and subsequently measured at fair value. Gains and losses arising from changes in fair value are included in other comprehensive income within a separate component of equity. Impairment losses or reversals, interest income and foreign exchange gains and losses are recognized in profit and loss until the financial asset is derecognized. Upon derecognition, the cumulative gain or loss previously recognized in other comprehensive income is reclassified from equity to profit or loss. This reflects the gain or loss that would have been recognized in profit or loss upon derecognition if the financial asset had been measured at amortized cost. Impairment is measured based on the ECL model.
The Company may also make an irrevocable election to measure at FVOCI on initial recognition investments in equity instruments that are neither held for trading nor contingent consideration recognized in a business combination in accordance with PFRS 3. Amounts recognized in OCI are not subsequently transferred to profit or loss. However, the Company may transfer the cumulative gain or loss within equity. Dividends on such investments are recognized in profit or loss, unless the dividend clearly represents a recovery of part of the cost of the investment.
Dividends are recognized in profit or loss only when:
• the Company’s right to receive payment of the dividend is established;• it is probable that the economic benefits associated with the dividend will flow to the • Company; and• the amount of the dividend can be measured reliably.

108 Sustaining Growth
The Company’s financial assets at FVOCI is their unquoted equity investments that are included in Note 9 as at December 31, 2018.
Classification of financial liabilities Financial liabilities are measured at amortized cost, except for the following:
• financial liabilities measured at fair value through profit or loss;• financial liabilities that arise when a transfer of a financial asset does not qualify for derecognition or when the
Company retains continuing involvement;• financial guarantee contracts;• commitments to provide a loan at a below-market interest rate; and• contingent consideration recognized by an acquirer in accordance with PFRS 3.A financial liability may be designated at fair value through profit or loss if it eliminates or significantly reduces a measurement or recognition inconsistency (an accounting mismatch) or:
• if a host contract contains one or more embedded derivatives; or• if a group of financial liabilities or financial assets and liabilities is managed and its performance evaluated on a
fair value basis in accordance with a documented risk management or investment strategy.
Where a financial liability is designated at fair value through profit or loss, the movement in fair value attributable to changes in the Company’s own credit quality is calculated by determining the changes in credit spreads above observable market interest rates and is presented separately in other comprehensive income.
The Company has no financial liabilities at FVPL as at December 31, 2018.
Reclassifications of Financial Instruments – Effective Starting January 1, 2018The Company reclassifies its financial assets when, and only when, there is a change in the business model for managing the financial assets. Reclassifications shall be applied prospectively by the Company and any previously recognized gains, losses or interest shall not be restated. The Company does not reclassify its financial liabilities.
The Company does not reclassify its financial assets when:
• A financial asset that was previously a designated and effective hedging instrument in a cash flow hedge or net investment hedge no longer qualifies as such;
• A financial asset becomes a designated and effective hedging instrument in a cash flow hedge or net investment hedge; and
• There is a change in measurement on credit exposures measured at fair value through profit or loss.
Derecognition of Financial Assets and Liabilities – Effective Prior to January 1, 2018
Financial assetsA financial asset (or, where applicable, a part of a financial asset or a part of a group of similar financial assets) is derecognized when, and only when:
• the contractual rights to the cash flows from the financial asset expire, or• the Company transfers the contractual rights to receive the cash flows of the financial asset in a transaction
in which it either (i) transfers substantially all the risks and rewards of ownership of the financial asset, or (ii) it neither transfers nor retains substantially all the risks and rewards of ownership of the financial asset and the Company has not retained control.
When the Company retains the contractual rights to receive the cash flows of a financial asset but assumes a contractual obligation to pay those cash flows to one or more entities, the Company treats the transaction as a transfer of a financial asset if the Company:
• has no obligation to pay amounts to the eventual recipients unless it collects equivalent amounts from the original asset;
Notes to Consolidated Financial Statements

FinancialStatements
MAYNILAD 2018 ANNUAL REPORT 109
• is prohibited by the terms of the transfer contract from selling or pledging the original asset other than as security to the eventual recipients for the obligation to pay them cash flows; and
• has an obligation to remit any cash flows it collects on behalf of the eventual recipients without material delay.
Where the Company has transferred its rights to receive cash flows from an asset or has entered into a ‘pass-through’ arrangement, and has neither transferred nor retained substantially all the risks and rewards of the asset nor has transferred control of the asset, the asset is recognized to the extent of the Company’s continuing involvement in the asset. Continuing involvement that takes the form of a guarantee over the transferred asset is measured at the lower of original carrying amount of the asset and the maximum amount of consideration that the Company could be required to repay.
Modification of contractual cash flowsWhen the contractual cash flows of a financial asset are renegotiated or otherwise modified and the renegotiation or modification does not result in the derecognition of that financial asset, the Company recalculates the gross carrying amount of the financial asset as the present value of the renegotiated or modified contractual cash flows discounted at the original EIR (or credit-adjusted EIR for purchased or originated credit-impaired financial assets) and recognizes a modification gain or loss in the consolidated statement of income.
When the modification of a financial asset results in the derecognition of the existing financial asset and the subsequent recognition of the modified financial asset, the modified asset is considered a ‘new’ financial asset. Accordingly the date of the modification shall be treated as the date of initial recognition of that financial asset when applying the impairment requirements to the modified financial asset.
Financial liabilitiesA financial liability is derecognized when the obligation under the liability has expired, or is discharged or has cancelled. Where an existing financial liability is replaced by another from the same lender on substantially different terms, or the terms of an existing liability are substantially modified, such an exchange or modification is treated as a derecognition of the original liability and the recognition of a new liability, and the difference in the respective carrying amounts is recognized in the consolidated statement of income. Impairment of Financial Assets – Effective Prior January 1, 2018 The Company assesses at each statement of financial position date whether there is objective evidence that a financial asset or group of financial assets is impaired. A financial asset or a group of financial assets is deemed to be impaired if, and only if, there is objective evidence of impairment as a result of one or more events that has occurred after the initial recognition of the asset (an incurred ‘loss event’) and that loss event (or events) has an impact on the estimated future cash flows of the financial asset or the Company of financial assets that can be reliably estimated. Evidence of impairment may include indications that the borrower or a group of borrowers is experiencing significant financial difficulty, default or delinquency in interest or principal payments, the probability that they will enter bankruptcy or other financial reorganization and where observable data indicate that there is measurable decrease in the estimated future cash flows, such as changes in arrears or economic conditions that correlate with defaults.
Financial assets carried at amortized costFor loans and receivables carried at amortized cost, the Company first assesses whether objective evidence of impairment exists individually for financial assets that are individually significant, or collectively for financial assets that are not individually significant. If the Company determines that no objective evidence of impairment exists for individually assessed financial asset, whether significant or not, it includes the asset in a group of financial assets with similar credit risk characteristics and collectively assesses for impairment. Those characteristics are relevant to the estimation of future cash flows for groups of such assets by being indicative of the debtors’ ability to pay all amounts due according to the contractual terms of the assets being evaluated. Assets that are individually assessed for impairment and for which an impairment loss is, or continues to be recognized, are not included in a collective assessment for impairment.
If there is objective evidence that an impairment loss has been incurred, the amount of loss is measured as the difference between the asset’s carrying amount and the present value of the estimated future cash flows (excluding future credit losses that have not been incurred). The carrying amount of the asset is reduced through the use of an

110 Sustaining Growth
allowance account and the amount of loss is charged to the consolidated statement of income under “Provision for doubtful accounts”.
Interest income continues to be recognized based on the original effective interest rate of the asset. Trade receivable, together with the associated allowance accounts, are written off when there is no realistic prospect of future recovery and all collateral has been realized. If, in a subsequent year, the amount of the estimated impairment loss decreases because of an event occurring after the impairment was recognized, the previously recognized impairment loss is reversed. Any subsequent reversal of an impairment loss is recognized in the consolidated statement of income, to the extent that the carrying value of the asset does not exceed its amortized cost at the reversal date.
For the purpose of a collective evaluation of impairment, financial assets are grouped on the basis of such credit risk characteristics such as customer type, payment history, past-due status and term.
Future cash flows in a group of financial assets that are collectively evaluated for impairment are estimated on the basis of historical loss experience for assets with credit risk characteristics similar to those in the group. Historical loss experience is adjusted on the basis of current observable data to reflect the effects of current conditions that did not affect the period on which the historical loss experience is based and to remove the effects of conditions in the historical period that do not exist currently. The methodology and assumptions used for estimating future cash flows are reviewed regularly by the Company to reduce any difference between loss estimates and actual loss experience.
AFS financial assetsFor AFS financial assets, the Company assesses at each reporting date whether there is objective evidence that a financial asset or group of financial assets is impaired.
In the case of equity investments classified as AFS financial assets, this would include a significant or prolonged decline in the fair value of the investments below its cost or where other objective evidence of impairment exists. The determination of what is “significant” or “prolonged” requires judgment. The Company treats “significant” generally as 20% or more and “prolonged” as greater than six (6) months for quoted equity securities. The Company evaluates other factors, including normal volatility in share price for quoted equities and the future cash flows and the discount factors for unquoted equities. Where there is evidence of impairment, the cumulative loss - measured as the difference between the acquisition cost and the current fair value, less any impairment loss on that financial asset previously recognized in the consolidated statement of income - is removed from equity and recognized in the consolidated statement of income in the “Others - net” account. Impairment losses on equity investments are not reversed through the consolidated statement of income. Increases in fair value after impairment are recognized directly in equity through the consolidated statement of comprehensive income.
In the case of debt instruments classified as AFS financial assets, impairment is assessed based on the same criteria as financial assets carried at amortized cost. Future interest income is based on the reduced carrying amount and is accrued using the rate of interest used to discount future cash flows for the purpose of measuring impairment loss and is recorded as part of “Others - net” account in the consolidated statement of income. If, in subsequent year, the fair value of a debt instrument increases and the increase can be objectively related to an event occurring after the impairment loss was recognized in the consolidated statement of income, the impairment loss is reversed through the consolidated statement of income.
Impairment of Financial Assets – Effective Starting January 1, 2018PFRS 9 introduces the single, forward-looking “expected loss” impairment model, replacing the “incurred loss” impairment model under PAS 39.
The Company recognizes ECL for the following financial assets that are not measured at FVPL:
• debt instruments that are measured at amortized cost;• loan commitments; and• financial guarantee contracts.
Notes to Consolidated Financial Statements
FinancialStatements
MAYNILAD 2018 ANNUAL REPORT 111
No ECL is recognized on equity investments.
ECLs are measured in a way that reflects the following:• an unbiased and probability-weighted amount that is determined by evaluating a range of possible outcomes;• the time value of money; and• reasonable and supportable information that is available without undue cost or effort at the reporting date
about past events, current conditions and forecasts of future economic conditions. Financial assets migrate through the following three stages based on the change in credit quality since initial recognition:
Stage 1: 12-month ECLFor credit exposures where there have not been significant increases in credit risk since initial recognition and that are not credit-impaired upon origination, the portion of lifetime ECLs that represent the ECLs that result from default events that are possible within the 12-months after the reporting date are recognized.
Stage 2: Lifetime ECL – not credit-impairedFor credit exposures where there have been significant increases in credit risk since initial recognition on an individual or collective basis but are not credit-impaired, lifetime ECLs representing the ECLs that result from all possible default events over the expected life of the financial asset are recognized.
Stage 3: Lifetime ECL – credit-impairedFinancial assets are credit-impaired when one or more events that have a detrimental impact on the estimated future cash flows of those financial assets have occurred. For these credit exposures, lifetime ECLs are recognized and interest revenue is calculated by applying the credit-adjusted effective interest rate to the amortized cost of the financial asset.
Loss allowances are recognized based on 12-month ECL for debt investment securities that are assessed to have low credit risk at the reporting date. A financial asset is considered to have low credit risk if:
• the financial instrument has a low risk of default;• the borrower has a strong capacity to meet its contractual cash flow obligations in the near term; and• adverse changes in economic and business conditions in the longer term may, but will not necessarily, reduce
the ability of the borrower to fulfil its contractual cash flow obligations.
The Company considers a debt investment security to have low credit risk when its credit risk rating is equivalent to the globally understood definition of “investment grade”, or when the exposure is less than 30 days past due.
Determining the stage for impairmentAt each reporting date, the Company assesses whether there has been a significant increase in credit risk for financial assets since initial recognition by comparing the risk of default occurring over the expected life between the reporting date and the date of initial recognition. The Company considers reasonable and supportable information that is relevant and available without undue cost or effort for this purpose. This includes quantitative and qualitative information and forward-looking analysis.
An exposure will migrate through the ECL stages as asset quality deteriorates. If, in a subsequent period, asset quality improves and also reverses any previously assessed significant increase in credit risk since origination, then the loss allowance measurement reverts from lifetime ECL to 12-months ECL. The simplified approach, where changes in credit risk are not tracked and loss allowances are measured at amounts equal to lifetime ECL, is applied to “Trade and other receivables”. Service Concession AssetsParent Company. The Parent Company accounts for its concession arrangement with MWSS in accordance with IFRIC 12, Service Concession Arrangement, under the Intangible Asset model as it receives the right (license) to charge users of public service. Under the Concession Agreement, the Parent Company is granted the sole and exclusive right and discretion during the concession period to manage, occupy, operate, repair, maintain, decommission and refurbish the identified facilities required to provide water services. The legal title to these assets shall vest in MWSS at the end of the concession period.

112 Sustaining Growth
Phil Hydro. Phil Hydro accounts for its Bulk Water Supply Agreements in accordance with IFRIC 12 under the Intangible Asset model as it receives the right (license) to charge users of public service.
Service concession assets are recognized to the extent that the Company receives a license or right to charge the users of the public service. The service concession assets pertain to the fair value of the service concession obligations at drawdown date and construction costs related to the rehabilitation works performed by the Company. The Parent Company’s service concession assets is amortized using unit of production (UOP) method over the projected total billable water volume during the remaining term of the service concession arrangement. Phil Hydro amortizes its service concession assets using straight-line method over the terms of the Bulk Water Supply Agreements and Memorandum of Agreement.
The Company recognizes and measures revenue from rehabilitation works using the percentage-of-completion method. Under this method, revenue is recognized as the related obligations are fulfilled, measured principally on the basis of the estimated physical completion of the contract work.
Cost of rehabilitation works, which includes all direct materials, labor costs, and those indirect costs related to contract performance, is recognized consistent with the revenue recognition method applied. Expected losses on contracts are recognized immediately when it is probable that the total contract costs will exceed total contract revenue. Changes in contract performance, contract conditions and estimated profitability including those arising from contract penalty provisions and final contract settlements which may result in revisions to estimated costs and gross margins are recognized in the year in which the revisions are determined.
Subsequent costs and expenditures related to the concession agreement are recognized as additions to service concession assets at fair value of obligations at drawdown date and cost of rehabilitation works.
Property and EquipmentProperty and equipment, except land, are stated at cost less accumulated depreciation and any impairment in value (see policy on “Impairment of Nonfinancial Assets”). Land is stated at cost.
The initial cost of property and equipment comprises its purchase price, including import duties, taxes and any directly attributable costs in bringing the asset to its working condition and location for its intended use. Expenditures incurred after the property and equipment have been put into operation, such as repairs and maintenance, are normally charged to income in the period such costs are incurred. In situations where it can be clearly demonstrated that the expenditures have resulted in an increase in the future economic benefits expected to be obtained from the use of an item of property and equipment beyond its originally assessed standard of performance, the expenditures are capitalized as additional costs of property and equipment.
Depreciation is calculated on a straight-line basis over the following estimated useful lives:
The Company computes for depreciation charges based on the significant component of the asset.
The useful lives and depreciation method are reviewed periodically to ensure that the periods and method of depreciation are consistent with the expected pattern of economic benefits from items of property and equipment.
Fully depreciated property and equipment are retained in the accounts until they are no longer in use and no further depreciation is charged to current operations.
An item of property and equipment is derecognized upon disposal or when no future economic benefits are expected to arise from the continued use of the asset. Any gain or loss arising on derecognition of the asset (calculated as the difference between the net disposal proceeds and the carrying amount of the asset) is included in the consolidated statements of income in the year the item is derecognized.
Land improvements 5 to 25 years
Instrumentation, tools and other equipment 5 years
Office furniture, fixtures and equipment 5 years
Transportation equipment 5 years
Notes to Consolidated Financial StatementsNotes to Consolidated Financial Statements

FinancialStatements
MAYNILAD 2018 ANNUAL REPORT 113
Impairment of Nonfinancial Assets An assessment is made at each reporting date to determine whether there is any indication of impairment of any nonfinancial assets (i.e., property and equipment and service concession assets), or whether there is any indication that an impairment loss previously recognized for an asset in prior years may no longer exist or may have decreased. If any such indication exists, the Company estimates the asset’s or CGU’s recoverable amount. An asset’s recoverable amount is calculated as the higher of the asset’s value in use or its fair value less cost to sell. In assessing value in use, the estimated future cash flows are discounted to their present value using a pre-tax discount rate that reflects current market assessments of the time value of money and the risks specific to the asset. In determining fair value less costs to sell, recent market transactions are taken into account, if available. If no such transactions can be identified, an appropriate valuation model is used. These calculations are corroborated by valuation multiples, quoted share prices for publicly traded subsidiaries or other available fair value indicators.
An impairment loss is recognized only if the carrying amount of an asset exceeds its recoverable amount. An impairment loss is charged to operations in the year in which it arises.
A previously recognized impairment loss is reversed only if there has been a change in the assumptions used to determine the recoverable amount of an asset, however, not to an amount higher than the carrying amount that would have been determined (net of any depreciation and amortization) had no impairment loss been recognized for the asset in prior years. Such reversal is recognized in the consolidated statements of income unless the asset is carried at a revalued amount, in which case, the reversal is treated as a revaluation increase.
GoodwillGoodwill is initially measured at cost being the excess of the aggregate of the consideration transferred and the amount recognized for controlling interest over the net identifiable assets acquired and liabilities assumed. If this consideration is lower than the fair value of the net assets of the subsidiary acquired, the difference is recognized in the consolidated statements of income. After initial recognition, goodwill is measured at cost less any accumulated impairment losses.
For the purpose of impairment testing, goodwill acquired in a business combination is, from the acquisition date, allocated to each of the Company’s cash-generating units that are expected to benefit from synergies of the combination irrespective of whether other assets or liabilities of the acquiree are assigned to those units. Each unit or group of units to which the goodwill is so allocated:
• Represents the lowest level within the Company at which the goodwill is monitored for internal management purposes; and
• Not larger than an operating segment determined in accordance with PFRS 8, Operating Segments.
Where goodwill forms part of a cash-generating unit and part of the operation within that unit is disposed of, the goodwill associated with the operation disposed of is included in the carrying amount of the operation when determining the gain or loss on disposal of the operation. Goodwill disposed of in this circumstance is measured based on the relative values of the operation disposed of and the portion of the cash-generating unit retained.
Goodwill is reviewed for impairment, annually or more frequently, if events or changes in circumstances indicate that the carrying value may be impaired.
Impairment is determined by assessing the recoverable amount of the cash-generating unit, to which the goodwill relates. Where the recoverable amount of the cash-generating unit is less than the carrying amount, an impairment loss is recognized. Where goodwill forms part of a cash-generating unit and part of the operation within that unit is disposed, the goodwill associated with the operation disposed of is included in the carrying amount of the operation when determining the gain or loss on disposal of the operation. Goodwill disposed of in this circumstance is measured based on the relative values of the operation disposed and the portion of the cash-generating unit retained. Impairment loss with respect to goodwill is not reversed.
Transfers of assets between commonly-controlled entities are accounted for under historical cost accounting.
If the business combination is achieved in stages, the acquisition date fair value of the acquirer’s previously held equity interest in the acquiree is remeasured to fair value at the acquisition date through profit or loss.

114 Sustaining Growth
When subsidiaries are sold, the difference between the selling price and the net assets plus cumulative translation adjustments and goodwill is recognized in the consolidated statements of income.
Foreign Currency-Denominated Transactions Foreign exchange differentials arising from foreign currency transactions are credited or charged to operations. As approved by the MWSS Board of Trustees under Amendment No. 1 of the Concession Agreement, the following will be recovered through billings to customers:
• Restatement of foreign currency-denominated loans;• Excess of actual concession fee payments over the amounts of concession fee translated using the base
exchange rate assumed in the business plan approved every rate rebasing exercise;• Excess of actual interest payments translated at exchange spot rates on settlement dates over the amounts of
interest translated at drawdown date rates; and• Excess of actual payments of other financing charges relating to foreign currency-denominated loans
translated at exchange spot rates on settlement dates over the amount of other financing charges translated at drawdown date rates.
In view of the automatic reimbursement mechanism, the Parent Company recognizes deferred FCDA (included as part of “Other noncurrent assets” or “Deferred credits” accounts in the consolidated statements of financial position) with a corresponding credit (debit) to FCDA revenues for the unrealized foreign exchange losses (gains) which have not been billed or which will be refunded to the customers. The write-off of the deferred FCDA or reversal of deferred credits pertaining to concession fees will be made upon determination of the new base foreign exchange rate, which is assumed in the business plan approved by the RO during the latest Rate Rebasing exercise, unless indication of impairment of deferred FCDA would be evident at an earlier date.
Deferred FCDA and deferred credits are calculated as the difference between the drawdown or rebased rate and the closing rate. These are presented as part of “Other noncurrent assets” and “Deferred credits” accounts in the consolidated statements of financial position, respectively.
Customers’ DepositsCustomers’ deposits are initially measured at fair value. After initial recognition, these deposits are subsequently measured at amortized cost using the effective interest method. Accretion of customers’ deposits is included under “Interest expense and other financing charges” account in the consolidated statements of income. The discount is recognized as deferred credits and amortized over the remaining concession period using the effective interest method. Amortization of deferred credits is included as part of “Other income” account in the consolidated statements of income.
Assets Held in TrustAssets which are owned by MWSS but are used in the operations of the Parent Company under the Concession Agreement are not reflected in the consolidated statements of financial position but carried as Assets Held in Trust, except for certain assets transferred to the Parent Company as mentioned in Note 23.
Revenue Recognition – Effective Prior to January 1, 2018Revenue is recognized to the extent that it is probable that the economic benefits will flow to the Company and the revenue can be reliably measured. Revenue is measured at the fair value of consideration received or receivable, excluding discounts, rebates and value-added tax (VAT). Water and wastewater are billed every month according to the bill cycles of the customers. As a result of bill cycle cut-off, monthly service revenue earned but not yet billed at the end of the month are estimated and accrued. These estimates are based on historical consumption of the customers.
Revenue from water and wastewater services is recognized upon supply of water to the customers and when the related services are rendered. Billings to customers consist of the following:a. Water charges:
• Basic charges represent the basic tariff charged to consumers for the provision of water services.• FCDA is the tariff mechanism that allows the Parent Company to recover foreign exchange losses or to
compensate foreign exchange gains on a current basis beginning January 1, 2002 until the Expiration Date.• Maintenance service charge represents a fixed monthly charge per connection. The charge varies
depending on the meter size.
Notes to Consolidated Financial Statements

FinancialStatements
MAYNILAD 2018 ANNUAL REPORT 115
b. Environmental charge (included as part of revenue from sewer/sanitation services) represents 20% of the water charges, except for maintenance charge.
c. Sewerage charge represents 20% of the water charges, excluding maintenance service charge, for all consumers connected to the Company’s sewer lines. Effective January 1, 2012, pursuant to RO Resolution No. 11-007-CA, sewerage charge applies only to commercial and industrial customers connected to sewer lines.
Interest income is recognized as the interest accrues, taking into account the effective yield on the asset.
When the Company provides construction or upgrade services, the consideration received or receivable is recognized at its fair value. The Company accounts for revenue and costs relating to operation services based on the percentage of completion (shown as “Revenue from rehabilitation works” and “Cost of rehabilitation works” accounts in the consolidated statements of income).
Revenue from Contracts with Customers – Effective Starting January 1, 2018The Company is in the business of providing water services to its customers within its concession area. Revenue from contracts with customers is recognized when services are transferred to the customer at the amount that amount that reflects the consideration to which the Company expects to be entitled in exchange for those goods or services. The Company has generally concluded that it is the principal in its revenue arrangements because it typically controls the services before transferring them to the customer.
Water and Wastewater ServicesRevenue from water and wastewater services is recognized upon the supply of water to the customers and when the related services are rendered. The performance obligations are satisfied over-time and payment is generally due seven days from invoicing.
• Connection and installation fees
The connection and installation fees are non-refundable upfront fees which do not provide a separate service. The connection and installation fees, along with the water and wastewater services are treated as one performance obligation. The connection and installation fees are to be recognized over the remaining concession period.
• Contract costs
The Company recognizes costs incurred in fulfilling contracts with customers that are directly associated with the contract as an asset if those costs are expected to be recoverable and record them in “Other current assets and “Other noncurrent assets” account in the consolidated statements of financial position.
Costs incurred in fulfilling contracts with customers comprise of costs for connection and installation of the customers to the Company’s water system. These costs are recognized as an asset to the extent they are considered recoverable to the extent of the actual costs incurred. The related asset is amortized over the remaining concession period during the satisfaction of performance obligations of the water and wastewater services.
The Company applied the following judgements that significantly affect the determination of the amount and timing of revenue from contracts with customers:
• Identifying performance obligations
The Company provides water and wastewater services to its customers. Water and wastewater services are composed of water service, wastewater service connection and installation, maintenance and sanitation services. The Company has determined that the services are to be bundled and is considered as one performance obligation since the services are highly interrelated and highly interdependent with one another.
• Determining the transaction price
The Company determined that the transaction price is the total consideration in the contract.

116 Sustaining Growth
• Determining the timing of satisfaction of connection and installation services
The Company concluded that the revenue from water and wastewater services is to be recognized over time because the customer simultaneously receives and consumes the benefits provided by the Company. As another entity would not need to re-perform the services that the Company has provided to date, this demonstrates that the customer simultaneously receives and consumes the benefits of the Company’s performance as it performs. The services are on-going and is completed when the customer is disconnected from the Company’s water system.
Contract AssetA contract asset is the right to consideration in exchange for goods or services transferred to the customer. If the Company performs by transferring goods or services to a customer before the customer pays consideration or before payment is due, a contract asset is recognized for the earned consideration that is conditional.
Trade ReceivablesA receivable represents the Company’s right to an amount of consideration that is unconditional (i.e., only the passage of time is required before payment of the consideration is due). Refer to accounting policies of financial assets.
Contract LiabilitiesA contract liability is the obligation to transfer goods or services to a customer for which the Company has received consideration (or an amount of consideration is due) from the customer. If a customer pays consideration before the Company transfers goods or services to the customer, a contract liability is recognized when the payment is made or the payment is due (whichever is earlier). Contract liabilities are recognized as revenue when the Company performs under the contract.
Cost and Expense Recognition Expenses are decreases in economic benefits during the accounting period in the form of outflows or decrease of assets or incurrence of liabilities that result in decrease in equity, other than those relating to distributions to equity participants. Expenses are recognized in the consolidated statements of income as incurred.
LeasesThe determination of whether an arrangement is, or contains a lease, is based on the substance of the arrangement at inception date, whether the fulfillment of the arrangement is dependent on the use of a specific asset or assets or the arrangement conveys a right to use the asset.
A reassessment is made after the inception of the lease only if one of the following applies:
a. There is a change in contractual terms, other than a renewal of or extension of the arrangement;b. A renewal option is exercised or extension granted, unless the term of the renewal or extension was initially
included in the lease term;c. There is a change in the determination of whether fulfillment is dependent on a specified asset; ord. There is a substantial change to the asset.
Where reassessment is made, lease accounting shall commence or cease from the date when the change in circumstances gave rise to the reassessment scenarios (a), (c) or (d) and at the date of renewal or extension period for scenario (b).
A lease where the lessor retains substantially all the risks and benefits of ownership of the asset is classified as an operating lease.
Operating lease payments are recognized as expense in the consolidated statements of income on a straight-line basis over the lease term (see Note 22).
Notes to Consolidated Financial Statements

FinancialStatements
MAYNILAD 2018 ANNUAL REPORT 117
Borrowing CostsBorrowing costs are generally expensed as incurred. Borrowing costs are capitalized if they are directly attributable to the acquisition or construction of a qualifying asset. To the extent that funds are borrowed specifically for the purpose of obtaining a qualifying asset, the amount of borrowing costs eligible for capitalization on that asset shall be determined as the actual borrowing costs incurred on that borrowing during the period less any investment income on the temporary investment of those borrowings.
To the extent that funds are borrowed generally and used for the purpose of obtaining a qualifying asset, the amount of borrowing costs eligible for capitalization shall be determined by applying a capitalization rate to the expenditures on that asset. The capitalization rate shall be the weighted average of the borrowing costs applicable to the borrowings of the Company that are outstanding during the period, other than borrowings made specifically for the purpose of obtaining a qualifying asset. The amount of borrowing costs capitalized during a period shall not exceed the amount of borrowing costs incurred during that period.
Capitalization of borrowing costs commences when the activities to prepare the asset are in progress and expenditures and borrowing costs are being incurred. Capitalization of borrowing costs ceases when all the activities necessary to prepare the asset for its intended use or sale are substantially complete. If the resulting carrying amount of the asset exceeds its recoverable amount, an impairment loss is recognized.
EquityCapital stock is measured at par value for all shares issued. Incremental costs incurred directly attributable to the issuance of new shares are shown in equity as a deduction from proceeds, net of tax. Proceeds and fair value of consideration received in excess of par value are recognized as additional paid-in capital.
Treasury shares, which represent own equity instruments that are reacquired, are recognized at cost and deducted from equity. No gain or loss is recognized in the consolidated statements of income on the purchase, sale, issuance or the cancellation of the Parent Company’s own equity instruments.
Retained earnings represent the Company’s accumulated earnings, net of dividends declared.
Value-Added Tax (VAT)Revenues, expenses and assets are recognized net of the amount of VAT except:
• When the VAT incurred on a purchase of assets or services is not recoverable from the tax authority, in which case, the sales tax is recognized as part of the cost of acquisition of the asset or as part of the expense item as applicable; and
• Receivables and payables that are stated with the amount of VAT included.
The net amount of current VAT recoverable from and payable to the tax authority is included as part of “Other current assets” and “Trade and other payables” accounts in the consolidated statements of financial position.
Income Taxes• Current Income Tax
Current income tax assets and liabilities for the current and prior periods are measured at the amount expected to be recovered from or paid to the taxation authority. The tax rates and tax laws used to compute the amount are those that are enacted or substantively enacted as at the end of the reporting period.
• Deferred Income Tax
Deferred income tax is provided, using the balance sheet liability method on all temporary differences between the tax bases of assets and liabilities and their carrying amounts for financial reporting purposes at the end of the reporting period.
118 Sustaining Growth
Deferred tax liabilities are recognized for all taxable temporary differences, except:
• When the deferred tax liability arises from the initial recognition of goodwill or of an asset or liability in a transaction that is not a business combination and, at the time of the transaction, affects neither the accounting income nor taxable income or loss; and
• With respect to taxable temporary differences associated with investments in subsidiaries, associates and interests in joint ventures, when the timing of the reversal of the temporary differences can be controlled and it is probable that the temporary differences will not reverse in the foreseeable future.
Deferred tax assets are recognized for all deductible temporary differences, the carry-forward benefits of unused tax credits from excess minimum corporate income tax (MCIT) over the regular corporate income tax (RCIT) and unused tax losses from net operating loss carryover (NOLCO) to the extent that it is probable that taxable income will be available against which the deductible temporary differences and the carry-forward benefits of MCIT and NOLCO can be utilized, except:
• recognition of an asset or liability in a transaction that is not a business combination and, at the time of the transaction, affects neither the accounting income nor taxable income or loss; and
• With respect to deductible temporary differences associated with investments in subsidiaries, associates and interests in joint ventures, deferred tax assets are recognized only to the extent that it is probable that the temporary differences will reverse in the foreseeable future and taxable income will be available against which the temporary differences can be utilized.
The carrying amount of deferred tax assets is reviewed at each reporting date and reduced to the extent that it is no longer probable that sufficient taxable profit will be available to allow all or part of the deferred tax assets to be utilized. Unrecognized deferred tax assets are reassessed at each reporting date and are recognized to the extent that it has become probable that future taxable profit will allow all or part of the deferred tax assets to be recovered.
Deferred tax assets and deferred tax liabilities are measured at the tax rate that is expected to apply to the period when the assets are realized or the liabilities are settled, based on the tax rates (and tax laws) that have been enacted or substantively enacted as at the reporting date.
Deferred tax relating to items recognized in other comprehensive income account is included in the consolidated statements of comprehensive income.
Deferred tax assets and deferred tax liabilities are offset only if a legally enforceable right exists to offset current tax assets against current tax liabilities and the deferred taxes relate to the same taxable entity and the same taxation authority.
ProvisionsProvisions are recognized when the Company has a present obligation (legal or constructive) as a result of a past event, it is probable that an outflow of resources embodying economic benefits will be required to settle the obligations and a reliable estimate can be made of the amount of the obligation. When the Company expects a provision to be reimbursed, such as under an insurance contract, the reimbursement is recognized as a separate asset but only when the reimbursement is virtually certain. The expense relating to any provision is presented in the consolidated statements of income, net of any reimbursement. If the effect of the time value of money is material, provisions are determined by discounting the expected future cash flows at a pre-tax rate that reflects current market assessments of the time value of money and, where appropriate, the risks specific to the liability. Where discounting is used, the increase in the provision due to the passage of time is recognized as an interest expense.
Pension CostThe Parent Company has a funded, noncontributory defined benefit plan. The cost of providing benefits under the defined benefit plans is actuarially determined using the projected unit credit method. This method reflects services rendered by employees to the date of valuation and incorporates assumptions concerning employees’ projected salaries.
The net defined benefit liability or asset is the aggregate of the present value of the defined benefit obligation at the end of the reporting period reduced by the fair value of plan assets (if any), adjusted for any effect of limiting a net
Notes to Consolidated Financial Statements

FinancialStatements
MAYNILAD 2018 ANNUAL REPORT 119
defined benefit asset to the asset ceiling. The asset ceiling is the present value of any economic benefits available in the form of refunds from the plan or reductions in future contributions to the plan.
Defined benefit costs comprise the following: (1) service cost; (2) net interest on the net defined benefit liability or asset; and (3) remeasurements of net defined benefit liability or asset.
Service costs, which include current service costs, past service costs and gains or losses on non-routine settlements, are recognized as part of “Salaries, wages and benefits” account in the consolidated statements of income. Past service costs are recognized when plan amendment or curtailment occurs. These amounts are calculated periodically by independent qualified actuaries.
Net interest on the net defined benefit liability or asset is the change during the period in the net defined benefit liability or asset that arises from the passage of time, which is determined by applying the discount rate based on government bonds to the net defined benefit liability or asset. Net interest on the net defined benefit liability or asset is recognized as expense or income in profit or loss.
Remeasurements comprising actuarial gains and losses, return on plan assets and any change in the effect of the asset ceiling (excluding net interest on defined benefit liability) are recognized immediately in other comprehensive income in the period in which they arise. Remeasurements are not reclassified to profit or loss in subsequent periods.
Plan assets are assets that are held by a long-term employee benefit fund or qualifying insurance policies. Plan assets are not available to the creditors of the Parent Company, nor can they be paid directly to the Parent Company. Fair value of plan assets is based on market price information. When no market price is available, the fair value of plan assets is estimated by discounting expected future cash flows using a discount rate that reflects both the risk associated with the plan assets and the maturity or expected disposal date of those assets (or, if they have no maturity, the expected period until the settlement of the related obligations). If the fair value of the plan assets is higher than the present value of the defined benefit obligation, the measurement of the resulting defined benefit asset is limited to the present value of economic benefits available in the form of refunds from the plan or reductions in future contributions to the plan.
Long-term Employee BenefitsThe Long Term Incentive Plan (LTIP) of the Parent Company grants cash incentives to eligible employees of the Parent Company. Liability under the LTIP is determined using the projected unit credit method. Employee benefit costs include current service costs, interest cost, actuarial gains and losses, and past service costs. Past service costs and actuarial gains and losses are recognized immediately.
The long-term employee benefit liability is determined based on the present value of the defined benefit obligation (using discount rate based on government bonds) vested at the end of the reporting period.
Share-based PaymentsEmployees of the Parent Company receive remuneration in the form of share-based payments, whereby employees render services as consideration for equity instruments (equity-settled transactions) under the Employee Stock Option Plan (ESOP).
The cost of equity-settled transactions is determined as the fair value at the date when the grant is made using an appropriate valuation model. That cost is recognized, together with a corresponding increase in other equity adjustments, over the period in which the performance and/or service conditions are fulfilled, and is shown as part of “Salaries, wages and benefits” account in the consolidated statements of income.
The cumulative expense recognized for equity-settled transactions at each reporting date until the vesting date reflects the extent to which the vesting period has expired and the Parent Company’s best estimate of the number of equity instruments that will ultimately vest.
No expense is recognized for awards that do not ultimately vest, except for equity-settled transactions for which vesting is conditional upon a market or non-vesting condition. These are treated as vesting irrespective of whether

120 Sustaining Growth
or not the market or non-vesting condition is satisfied, provided that all other performance and/or service conditions are satisfied.
When the terms of an equity-settled award are modified, the minimum expense recognized is the expense had the terms not been modified if the original terms of the award are met. An additional expense is recognized for any modification that increases the total fair value of the share-based payment transaction, or is otherwise beneficial to the employee as measured at the date of modification.
ContingenciesContingent liabilities are not recognized in the consolidated financial statements. They are disclosed in the notes to consolidated financial statements unless the possibility of an outflow of resources embodying economic benefits is remote. Contingent assets are not recognized in the consolidated financial statements but are disclosed in the notes to consolidated financial statements when an inflow of economic benefits is probable. Contingent assets are not recognized unless virtually certain.
Events after the Reporting PeriodPost year-end events that provide additional information about the Company’s position at the financial reporting date (adjusting events) are reflected in the consolidated financial statements. Post year-end events that are not adjusting events are disclosed in the notes to the consolidated financial statements when material.
Earnings per Share (EPS)Basic EPS is computed based on the weighted average number of outstanding shares and adjusted to give retroactive effect to any stock split during the year. The dilutive effect of outstanding ESOP shares is reflected as additional share dilution in the computation of diluted EPS.
Significant Accounting Judgments, Estimates and Assumptions
The preparation of the consolidated financial statements in accordance with PFRS requires the Company to make judgments, estimates and assumptions that affect the reported amounts of revenues, expenses, assets and liabilities, and the accompanying disclosures, and the disclosure of contingent liabilities. In preparing the Company’s consolidated financial statements, management has made its best estimates and judgments of certain amounts, giving due consideration to materiality. The estimates and assumptions used in the accompanying consolidated financial statements are based upon management’s evaluation of relevant facts and circumstances as at the date of the consolidated financial statements. The uncertainties inherent in these estimates and assumptions could result in outcomes that could require material adjustments to the carrying amounts of the assets or liabilities affected in future years. The effects of any change in estimates are reflected in the consolidated financial statements as they become reasonably determinable.
Estimates and judgments are continually evaluated and are based on historical experience and other factors, including expectations of future events that are believed to be reasonable under the circumstances.
JudgmentsIn the process of applying the Company’s accounting policies, management has made the following judgments, apart from those involving estimations and assumptions, which have the most significant effect on the amounts recognized in the consolidated financial statements:
Fourth Rate Rebasing. As discussed in Note 1, the Parent Company has an outstanding claim against the ROP, through the DOF, pursuant to the arbitral and court decisions to compensate the Parent Company for the delayed implementation of its relevant tariffs for the rebasing period 2013 to 2017.
Although the Parent Company won in the arbitration against the ROP, certain events (the ‘Pre-requisite Events”) should materialize before the former can collect anything from the latter. Because the Pre-requisite Events have not yet materialized, the Parent Company’s view is that the Second Arbitral Award does not meet the virtually certain criteria as required under PAS 37, Provisions, Contingent Liabilities and Contingent Assets. In view of this, the Parent Company’s position is not to record the Second Arbitral Award in the accounting records until the amount is collected.
3.
Notes to Consolidated Financial Statements

FinancialStatements
MAYNILAD 2018 ANNUAL REPORT 121
Amortization of Service Concession Assets. The Parent Company accounts for its concession arrangement with MWSS in accordance with IFRIC 12 under the Intangible Asset model as it receives the right (license) to charge users of public service. Phil Hydro accounts for its Bulk Water Supply Agreements in accordance with IFRIC 12 under the Intangible Asset model as it receives the right (license) to charge users of public service.
The Parent Company amortizes its service concession assets using UOP method, given that the economic benefit of these assets are more closely aligned with billed volume, which the Parent Company can already estimate reliably. Phil Hydro amortizes its service concession assets using the straight-line method over the terms of each Bulk Water Supply Agreements and Memorandum of Agreement. Service concession assets, net of accumulated amortization of P26.3 billion and P23.5 billion, amounted to P88.1 billion and P78.4 billion as at December 31, 2018 and 2017, respectively (see Note 7).
Disputes with MWSS. Pending resolution of the dispute between the Parent Company and MWSS on certain claims of MWSS, the disputed amount of P5.1 billion as at December 31, 2018 and 2017, is considered as contingent liability. The outstanding provision recognized related to their contingency amounted to P607.2 million as at December 31, 2018 and 2017 (see Notes 7, 10 and 20).
Contingencies. The Company is currently involved in various legal and administrative proceedings. The Company’s estimate of the probable costs for the resolution of these claims has been developed in consultation with outside legal counsel handling defense in these matters and is based upon an analysis of potential results. The Company currently does not believe these proceedings will have a material adverse effect on the Company’s financial position. It is possible, however, that future results of operations could be materially affected by changes in the estimates or in the effectiveness of strategies relating to these proceedings (see Note 20).
Whether Connection and Installation Service is a Distinct Performance Obligation – Effective starting January 1, 2018. The Company provides connection and installation service to its customers as indicated in the water supply contract. The Company determines whether this service is capable of being distinct (i.e., whether the customer can benefit from this activity on a standalone basis) and whether this service is distinct within the context of the water supply contract (i.e., whether this service can be separated from the water and wastewater service provided to the customers). The Company determined that the connection and installation service is highly interdependent and cannot be separated from the water and wastewater service. Accordingly, the connection and installation revenues, and related costs, are deferred and recognized over the remaining concession period (see Note 14).
Estimates and AssumptionsThe key estimates and assumptions concerning the future and other key sources of estimation uncertainties at the end of the reporting period that have a significant risk of causing a material adjustment to the carrying amounts of assets and liabilities recognized in the consolidated financial statements within the next financial year are discussed below. The estimates and assumptions are based on the parameters available when the consolidated financial statements were prepared. Existing circumstances and assumptions about future developments, however, may change due to market changes or circumstances beyond the control of the Company. Such changes are reflected in the assumptions as they occur.
Allowance for Doubtful Accounts – Effective Prior January 1, 2018. The Company estimates the allowance for doubtful accounts related to the trade receivables based on two methods. The amounts calculated using each of these methods are combined to determine the total amount of allowance.
First, the Company evaluates specific accounts that are considered individually significant for any objective evidence that certain customers are unable to meet their financial obligations. In these cases, the Company uses judgment, based on the best available facts and circumstances, including but not limited to, the length of its relationship with the customer and the customer’s current credit status based on third party credit reports and known market factors. The allowance provided is based on the difference between the present value of the receivables that the Company expects to collect, discounted at the receivables’ original effective interest rate and the carrying amount of the receivable. This specific allowance is re-evaluated and adjusted as additional information received affects the amounts estimated.

122 Sustaining Growth
Second, if it is determined that no objective evidence of impairment exists for an individually assessed receivable, the receivable is included in a group of receivables with similar credit risk characteristics and is collectively assessed for impairment. The provision under collective assessment is based on historical collection, write-off, experience and change in customer payment terms. Impairment assessment is performed throughout the year.Provision for doubtful accounts amounted P57.1 million in 2017, while reversal of provision for doubtful accounts amounted to P76.9 million in 2016. Trade and other receivables, net of allowance for doubtful accounts, amounted to P2.6 billion as at December 31, 2017 (see Note 5).
Allowance for ECL – Effective Starting January 1, 2018. The following information explains the inputs, assumptions and techniques used by the Company in estimating ECL:
• General approach for cash in banks and cash equivalents, short-term investments, non-trade receivables and miscellaneous deposits
The ECL is measured on either a 12-month or lifetime basis depending on whether a significant increase in credit risk has occurred since initial recognition or whether an asset is considered to be credit-impaired. The Company considers the probability of its counterparty to default its obligation and the expected loss at default after considering the effects of collateral, any potential value when realized, forward-looking estimates and time value of money.
• Simplified approach for trade and other receivables (excluding non-trade receivables), contract assets and deposits and sinking fund
The Company uses a simplified approach for calculating ECL on trade and other receivables (excluding non-trade receivables) and deposits and sinking fund through the use of provision matrix to calculate ECLs. The provision rates are based on days past due for groupings of various customer segments that have similar loss patterns (i.e., by geography and customer type and rating).
The provision matrix is initially based on the Company’s historical observed default rates. The Company will calibrate the matrix to adjust the historical credit loss experience with forward-looking information. For instance, if forecast economic conditions (i.e., gross domestic product) are expected to deteriorate over the next year which can lead to an increased number of defaults in the Company’s operating segments, the historical default rates are adjusted. At every reporting date, the historical observed default rates are updated and changes in the forward-looking estimates are analyzed.
• Incorporation of forward-looking information
The Company considers a range of relevant forward-looking macro-economic assumptions for the determination of unbiased general industry adjustments and any related specific industry adjustments that support the calculation of ECLs. A broad range of forward-looking information are considered as economic inputs such as the gross domestic product, inflation rate, unemployment rates and other economic indicators.
The macroeconomic factors are aligned with information used by the Company for other purposes such as strategic planning and budgeting.
The Company identifies and documents key drivers of credit risk and credit losses of each portfolio of financial instruments and, using an analysis of historical data, has estimated relationships between macro-economic variables and credit risk and credit losses.
Predicted relationship between the key macro-economic indicators and default and loss rates on various portfolios of financial assets have been developed based on analyzing historical data over the past 3 to 9 years. The methodologies and assumptions including any forecasts of future economic conditions are reviewed regularly.
Notes to Consolidated Financial Statements

FinancialStatements
MAYNILAD 2018 ANNUAL REPORT 123
• Grouping of instruments for losses measured on collective basis
For expected credit loss provisions modelled on a collective basis, a grouping of exposures is performed on the basis of shared risk characteristics, such that risk exposures within a segmentation are homogeneous. The Company segmentized its trade receivables based on their billing class as shown below:
a. Domestic
i. Residential – pertains to receivables arising from water and wastewater service use for domestic purposes only.
ii. Semi-business – pertains to receivables arising from water and wastewater service use for small businesses.
b. Non-domestic
i. Commercial – pertains to receivables arising from water and wastewater service use for commercial purposes.
ii. Industrial – pertains to receivables arising from water and wastewater service use for industrial purposes, including services for manufacturing.
The following credit exposures are assessed individually:
a. All stage 3 assets, which are considered to be specifically impaired, regardless of the class of financial assets; and
b. Cash in banks and cash equivalents, short-term investments, deposits and sinking fund, non-trade receivables and miscellaneous deposits
There have been no significant changes in estimation techniques or significant assumptions made during the reporting period.
The assessment of the correlation between historical observed default rates, forecast economic conditions and ECLs is a significant estimate. The amount of ECLs is sensitive to changes in circumstances and of forecast economic conditions. The Company’s historical credit loss experience and forecast of economic conditions may also not be representative of customer’s actual default in the future.
Provision for expected credit losses amounted to P17.7 million in 2018. Trade and other receivables, net of allowance for expected credit losses, amounted to P1.7 billion as at December 31, 2018 (see Note 5).
Determination of Amortization Period for Deferred Connection and Installation Revenues and Related Costs – Effective Starting January 1, 2018. The Company determines the amortization period for deferred connection and installation revenues and costs based on the expected relationship with its customers. In the absence of other reliable information, the Company determined that the customers are expected to maintain their water and wastewater connection throughout the concession period. Therefore, the Company amortizes its deferred connection and installation revenues and related costs over the remaining concession period (see Note 14).
Revenue Recognition for Certain Customers. The Company identifies and evaluates specific customer accounts that are considered unable to meet their financial obligations. In these cases, the Company uses judgment, based on the best available facts and circumstances, including but not limited to, the length of its relationship with the customer, the customer’s current credit status and other known market factors to recognize revenue as collection is received rather than as billed and supply of water is provided, and services are rendered. The billed revenues from these customers are reversed and recognized only when collections are received. Total billed revenues reversed amounted to P666.9 million and P653.9 million as at December 31, 2018 and 2017, respectively.

124 Sustaining Growth
Fair Value of Financial Assets and Financial Liabilities. PFRS requires that certain financial assets and financial liabilities be carried at fair value, which requires the use of accounting estimates and judgments. The determination of the cost of service concession payable requires management to make estimates and assumptions to determine the extent to which the Company receives a right of license to charge users of the public service. In making those estimates, management is required to determine a suitable discount rate to calculate for the present value of these cash flows. While significant components of fair value measurement are determined using verifiable objective evidence (i.e., foreign exchange rates, interest rates, volatility rates), the timing and amount of changes in fair value would differ with the valuation methodology used. Any change in the fair value of these financial assets and financial liabilities would directly affect income and equity.
The fair values of financial assets and financial liabilities are set out in Note 25.
Estimated Billable Water Volume. The Parent Company estimated the billable water volume, where the amortization of service concession assets is derived from, based on the period over which the Parent Company’s concession agreement with MWSS is in force. The Parent Company reviews annually the billable water volume based on factors that include market conditions such as population growth and consumption, and the status of the Parent Company’s projects and their impact on non-revenue water.
It is possible that future results of operations could be materially affected by changes in the Parent Company’s estimates brought about by changes in the aforementioned factors. A reduction in the projected billable water volume would increase amortization and decrease noncurrent assets.
In 2016, a new study was conducted for the estimation of billable water volume used in the amortization of the Parent Company’s service concession assets. Based on the new study, total billable water volume increased by 9% mainly due to the change in demographic factors.
The financial effect of this change in billable water volume decreased the amortization of service concession assets in 2017 by P216.3 million. In future years, the amortization expense is expected to decrease in the earlier period and increase in the later period of the concession agreement compared to estimated billable water volume in the prior year. Quantitative disclosure on future impact is not provided as it is impracticable to reliably estimate the difference in future amortization as the calculation of the UOP amortization is subject to other variables such as additional capital expenditures and concession fees paid every year, re-estimation of billable water volume and actual billed volume during the year. All of these variables are subject to changes on annual basis.
The change in the billable water volume every year is the change to actual billed volume for the current year whose effect on amortization of service of service concession assets is insignificant.
Service concession assets, net of accumulated amortization of P26.3 billion and P23.5 billion, amounted to P88.1 billion and P78.4 billion as at December 31, 2018 and 2017, respectively (see Note 7). Amortization of service concession assets amounted to P2.8 billion, P2.4 billion and P2.3 billion in 2018, 2017 and 2016, respectively(see Note 7).
Determination of Impairment of AFS Financial Assets. The Company determines that AFS financial assets are impaired when there has been a significant or prolonged decline in the fair value below its cost or where other objective evidence of impairment exists. The Company determines that a decline in fair value of greater than 20% of cost is considered to be a significant decline and a decline for a period of more than 12 months is considered to be a prolonged decline. This determination of what is significant or prolonged requires judgment. In making this judgment, the Company evaluates, among other factors, the normal volatility in share price for quoted equities. AFS financial assets are considered impaired when the Company believes that future cash flows generated from the investment is expected to decline significantly. The Company’s management makes significant estimates and assumptions on the future cash flows expected and the appropriate discount rate to determine if impairment exists. Impairment may also be appropriate when there is evidence of deterioration in the financial health of the investee, industry and sector performance. Impairment losses recognized in profit or loss for an investment in an equity instrument classified as AFS are not reversed through profit or loss. Subsequent increases in the fair value after the impairment are recognized directly in other comprehensive income.
Notes to Consolidated Financial Statements

FinancialStatements
MAYNILAD 2018 ANNUAL REPORT 125
Impairment loss on AFS financial assets amounted to P7.5 million in 2017 and nil in 2016. The carrying amount of AFS financial assets amounted to P124.9 million as at December 31, 2017 (see Note 9).
Estimated Useful Lives of Property and Equipment. The useful life of each item of the Company’s property and equipment is estimated based on the period over which the asset is expected to be available for use. Such estimation is based on a collective assessment of practices of similar businesses, internal technical evaluation and experience with similar assets. The estimated useful life of each asset is reviewed periodically and updated if expectations differ from previous estimates due to physical wear and tear, technical or commercial obsolescence and legal or other limits on the use of the asset. It is possible, however, that future results of operations could be materially affected by changes in the amounts and timing of recorded expenses brought about by changes in the factors mentioned above.
A reduction in the estimated useful life of any item of property and equipment would increase the recorded depreciation expense and decrease property and equipment.
There was no change in estimated useful lives of property and equipment in 2018 and 2017.
Property and equipment, net of accumulated depreciation and amortization of P2.5 billion, P2.2 billion, amounted to P1.4 billion as at December 31, 2018 and 2017, respectively (see Note 8). Depreciation and amortization of property and equipment amounted to P0.4 billion, P0.4 billion and P0.3 billion in 2018, 2017 and 2016, respectively (see Note 8).
Recognition of Deferred Tax Assets. The carrying amount of deferred tax assets is reviewed at each reporting date and reduced to the extent that it is no longer probable that sufficient taxable profit will be available to allow all or part of the deferred tax assets to be utilized. However, there is no assurance that sufficient taxable profit will be generated to allow all or part of the deferred tax assets to be utilized.
Starting 2016, the Parent Company is no longer under income tax holiday (ITH) and uses Optional Standard Deduction (OSD) in computing its taxable income in 2016, 2017 and 2018 (see Notes 16). The Parent Company’s assessment is based on actual gross income in the current year which is more favorable to use OSD method. The Parent Company expects to continue to use OSD method in computing its taxable income each year up to the end of the concession period except for certain years when the Parent Company expects that it would be more favorable to use itemized deduction method. Accordingly, deferred tax assets and liabilities are measured based on OSD or itemized deduction method depending on the forecasted gross and taxable income and which method of deduction is more beneficial to the Parent Company.
Net deferred tax liabilities recognized amounted to P0.1 billion, while net deferred tax assets recognized amounted P0.5 billion as at December 31, 2018 and 2017, respectively (see Note 16).
The Company did not recognize deferred tax assets on deductible temporary differences where doubt exists as to the tax benefits they will bring in the future.
Deferred FCDA and Deferred Credits. Under Amendment No. 1 of the Concession Agreement, the Parent Company is entitled to recover (refund) foreign exchange losses (gains) arising from MWSS loans and any concessionaire loans. For the unrealized foreign exchange losses, the Parent Company recognized deferred FCDA as an asset since this is a resource controlled by the Company as a result of past events and from which future economic benefits are expected to flow to the Parent Company. Unrealized foreign exchange gains, however, are presented as deferred credits and will be refunded to the customers.
Pursuant to MWSS-RO Resolution No. 2018-13-CA, the new base foreign exchange rate was changed from P41.19 to P53.16 effective January 1, 2018 (see Note 7).
Deferred FCDA representing the net effect of unrealized foreign exchange losses on service concession obligation payable to MWSS, and restatement of foreign currency-denominated interest-bearing loans and related interest that are recoverable from the customers amounted to P273.3 million and P776.4 million as at December 31, 2018 and 2017, respectively (see Note 7).

126 Sustaining Growth
As at December 31, 2018 and 2017, the discount, shown as part of “Deferred credits” account in the consolidated statements of financial position, amounted to P732.1 million and P686.8 million, respectively.
Asset Impairment. The Company assesses impairment on assets whenever events or changes in circumstances indicate that the carrying amount of an asset may not be recoverable. The factors that the Company considers important which could trigger an impairment review include the following:
• Significant underperformance relative to expected historical or projected future operating results;• Significant changes in the manner of use of the acquired assets or the strategy for overall business; and• Significant negative industry or economic trends.
The Company recognizes an impairment loss whenever the carrying amount of an asset exceeds its recoverable amount. The recoverable amount is computed using the value in use (VIU) approach. Recoverable amounts are estimated for individual assets or, if it is not possible, for the cash-generating unit to which the asset belongs. Determining the recoverable amount of assets requires the estimation of cash flows expected to be generated from the continued use and ultimate disposition of such assets. While it is believed that the assumptions used in the estimation of fair values reflected in the consolidated financial statements are appropriate and reasonable, significant changes in these assumptions may materially affect the assessment of recoverable amounts and any resulting impairment loss could have a material adverse impact on the results of operations.
Noncurrent nonfinancial assets carried at cost and subjected to impairment test when certain impairment indicators are present are as follows:
The goodwill arising from the acquisition of Phil Hydro represents the fair value of expected incremental economic benefits that the Parent Company expects to obtain. The impairment test of goodwill is based on VIU calculations that used the discounted cash flow model. The VIU was based on the cash flow projections on the most recent financial budgets and forecast of Phil Hydro.
The length of the projections is up to 2035 based on the existing Bulk Water Supply Agreements and Memorandum of Agreement. The discount rate applied was 11.3%, which was based on the market weighted average cost of capital with estimated premium over cost of equity.
The Company performs its annual impairment test close at year-end, after annual financial budget and forecast are finalized. Management also believes that no reasonably possible change in any of the key assumptions would cause the carrying value to materially exceed the recoverable amount. The key assumptions used to determine the recoverable amount are discussed below.
The forecasted period is greater than five (5) years as management can reliably estimate the cash flow for the entire duration of Phil Hydro’s concession period covered by the Bulk Water Supply Agreements and Memorandum of Agreement.
2018 2017
Service concession assets (see Note 7) P88,108,184 P78,391,855
Property and equipment (see Note 8) 1,400,970 1,408,758
Goodwill (see Note 2) 244,925 288,082
Total P89,754,079 P80,088,695
2018 2017
Revenue growth rate* 2.0% 4.0%
Average forecast period 17 years 18 years
Discount rate 11.3% 10.0%
*Average growth represents average of year-over-year growth over the terms of the Bulk Water Supply Agreements and Memorandum of Agreement
Notes to Consolidated Financial Statements

FinancialStatements
MAYNILAD 2018 ANNUAL REPORT 127
Based on the impairment test, management identified an impairment loss on goodwill as at December 31, 2018 amounting to P43.2 million while no impairment loss was identified as at December 31, 2017. No impairment loss was recognized in service concession assets and property and equipment in 2018 and 2017.
Computation of Pension Cost and Other Post-employment Benefits. The cost of defined benefit pension plans and other post-employment benefits as well as the present value of the pension obligation are determined using actuarial valuations. The actuarial valuation involves making various assumptions. These include the determination of the discount rate, turnover rate, mortality rate and salary increase rate. Due to the complexity of the valuation, the underlying assumptions and its long-term nature, defined benefit obligations are highly sensitive to changes in these assumptions. All assumptions are reviewed at each reporting date.
In determining the appropriate discount rate, management considers the interest rates of government bonds that are denominated in the currency in which the benefits will be paid, with extrapolated maturities corresponding to the expected duration of the defined benefit obligation. Turnover rate is based on a 3-year historical information of voluntary separation and resignation by plan members.
The mortality rate is based on publicly available mortality tables for the specific country and is modified accordingly with estimates of mortality improvements. Future salary increases and pension increases are based on expected future inflation rates for the specific country.
Pension cost presented as part of “Salaries, wages and benefits” account in the consolidated statements of income amounted to P156.8 million, P71.7 million and P104.0 million in 2018, 2017 and 2016, respectively. Pension liability amounted to P448.0 million and P594.8 million as at December 31, 2018 and 2017, respectively (see Note 17).
Computation of Share-based Payment Transactions. The Company measures the cost of equity-settled transactions with employees by reference to the fair value of the equity instruments at the date at which they are granted. Estimating fair value for share-based payments requires determining the most appropriate valuation model for a grant of equity instruments, which is dependent on the terms and conditions of the grant. This estimate also requires determining the most appropriate inputs to the valuation model including the expected life of the option, volatility, discount rates and dividend yield and making assumptions about them. The assumptions and models used for estimating fair value for share-based payments are disclosed in Note 13.
Equity-based compensation expense presented as part of “Salaries, wages and benefits” account in consolidated statements of income amounted to nil in 2018 and P219.3 million in 2017 (see Note 13).
Determination of Other Long-term Incentive Benefits. In 2013, the Parent Company has approved an LTIP for its managers and executives which is also based on profit targets for the covered Performance Cycle of 2013 to 2015. Payments were made on March 18, 2016 amounting to P369.0 million.
In 2016, a proposal for new LTIP covering Performance Cycle of 2016 to 2018 for its managers and executives which is also based on profit targets was prepared for approval by the Parent Company’s BOD. The LTIP was approved by the BOD on July 24, 2017.
The cost of LTIP is determined using the projected unit credit method based on prevailing discount rates and profit targets. While management’s assumptions are believed to be reasonable and appropriate, significant differences in actual results or changes in assumptions may materially affect the Company’s other long-term incentive benefits.
Accrued LTIP which was included as part of “Trade and other payables” account in the consolidated statements of financial position amounted to P585.0 million and P378.7 million as at December 31, 2018 and 2017, respectively. The total cost of the LTIP recognized by the Company presented as part of “Salaries, wages and benefits” account in the consolidated statements of income amounted to P206.3 million, P197.6 million and P181.1 million in 2018, 2017 and 2016, respectively (see Note 17).

128 Sustaining Growth
Cash and Cash Equivalents and Short-term Investments
Cash and cash equivalents account consists of:
Cash in banks earn interest at the respective bank deposit rates. Cash equivalents are made for varying periods from one day to three months depending on the immediate cash requirements of the Company and earn interest at the respective short-term deposit rates.
Short-term investments amounting to P15.7 million and P1.5 billion as at December 31, 2018 and 2017, respectively, with original maturities of more than three months to one year are separately shown in the consolidated statements of financial position.
Interest income earned from cash in banks, cash equivalents and short-term investments, net of applicable final tax, amounted to P184.9 million, P94.4 million and P119.9 million in 2018, 2017 and 2016, respectively.
Trade and Other Receivables This account consists of receivables from:
The classes of the Company’s receivables from customers are as follows:
• Residential – pertains to receivables arising from water and wastewater service use for domestic purposes only. • Semi-business – pertains to receivables arising from water and wastewater service use for small businesses.• Commercial – pertains to receivables arising from water and wastewater service use for commercial purposes.• Industrial – pertains to receivables arising from water and wastewater service use for industrial purposes,
including services for manufacturing.• Bulk water supply – pertains to receivables arising from water service to water districts outside the West
Service Area.
Receivables from customers and bulk water supply are non-interest bearing and generally have 60 day term.
Other receivables consist mainly of receivables from collecting agents normally received within 30 days and advances for construction and installation of water reticulation systems for subdivisions in the West Service Area payable on installment basis over a period of 3 to 5 years. Portion of advances for water reticulation systems
4.
2018 2017
Cash on hand and in banks P1,635,351 P1,147,144
Cash equivalents 9,897,697 2,371,350
P11,533,048 P3,518,494
5.
2018 2017
Customers:
Residential P1,479,449 P1,942,394
Commercial 563,772 939,891
Semi-business 204,767 291,042
Industrial 123,209 261,713
Bulk water supply 95,364 83,108
2,466,561 3,518,148
Employees 53,271 48,089
Others (see Note 6) 182,767 46,776
2,702,599 3,613,013
Less allowance for:
ECL 1,028,485 –
Doubtful accounts – 1,010,884
P1,674,114 P2,602,129
Notes to Consolidated Financial Statements

FinancialStatements
MAYNILAD 2018 ANNUAL REPORT 129
6.
expected to be collected beyond one year amounting to P18.2 million and P35.1 million as at December 31, 2018 and 2017, respectively, is presented as part of “Other noncurrent assets” account in the consolidated statements of financial position.
The movements in the Company’s allowance for ECL and doubtful accounts which was determined individually and collectively are as follows:
Other Current Assets
This account consists of:
Sinking fund represents the amount set aside to cover semi-annual principal and interest payments of loan and unutilized proceeds from the US$137.5 million loan drawdowns for the Metro Manila Wastewater Management Project maintained in a designated bank account (see Note 11).
Advances to contractors are normally applied within a year against billings.
Input VAT is an indirect tax on the goods and services which the Company uses in its operations. The Company recovers its input VAT by offsetting it against the output VAT. Management believes that the amount of recorded input VAT is fully realizable in the future.
Deposits mainly consist of bill deposits to Meralco.
Prepayments mainly pertain to insurance, performance bond, and taxes (see Note 22).
Others consist of cost of new water service connections amounting to P6.9 million that was capitalized since these costs are recoverable and is directly associated with the contract with customers (see Note 14).
2018
Receivables from Customers OtherReceivables
Residential Semi-Business Commercial Industrial Total
At January 1 P628,720 P90,934 P241,427 P49,803 P– P1,010,884
Provisions for he year
10,836 1,576 4,366 936 – 17,714
Write-off (113) – – – – (113)
At December 31 P639,443 P92,510 P245,793 P50,739 P– P1,028,485
2017
Receivables from Customers Other Receivables
Residential Semi-Business Commercial Industrial Total
At January 1 P414,481 P110,544 P254,650 P97,527 P76,570 P953,772
Provisions forthe year
214,239 (19,610) (13,223) (47,724) (76,570) 57,112
At December 31 P628,720 P90,934 P241,427 P49,803 P– P1,010,884
2018 2017
Sinking fund (see Note 11) P399,210 P1,507,673
Advances to contractors 23,001 15,077
Input VAT 409,090 449,897
Deposits 170,253 157,725
Prepayments (see Note 22) 209,100 279,492
Others 92,895 70,998
P1,303,549 P2,480,862

130 Sustaining Growth
Service Concession Assets
The movements in this account are as follows:
Service concession assets consist of the present value of total estimated concession fee payments pursuant to the Concession Agreement and the costs of rehabilitation works incurred.
The aggregate Concession Fees pursuant to the Concession Agreement is equal to the sum of the following:
a. 90% of the aggregate peso equivalent due under any MWSS loan which has been disbursed prior to the Commencement Date, including MWSS loans for existing projects and the raw water conveyance component of the Umiray-Angat Transbasin Project (UATP), on the relevant payment date set forth on the pertinent schedule of the Concession Agreement;
b. 90% of the aggregate peso equivalent due under any MWSS loan designated for the UATP which has not been disbursed prior to the Commencement Date on the relevant payment date set forth on the pertinent schedule of the Concession Agreement;
c. 90% of the local component costs and cost overruns related to the UATP in accordance with the pertinent schedule of the Concession Agreement;
d. 100% of the aggregate peso equivalent due under any MWSS loan designated for existing projects, which have not been disbursed prior to the Commencement Date and have been either awarded to third party bidders or been elected by the Parent Company for continuation in accordance with the pertinent sections of the Concession Agreement;
e. 100% of the local component costs and cost overruns related to the existing projects in accordance with relevant schedule of the Concession Agreement; and
f. Maintenance and operating expenditure (MOE) representing one-half of the annual budget for MWSS for that year, provided that such annual budget shall not exceed P200.0 million (as at 1997), subject to annual CPI adjustment (see Note 22).
Service concession assets also include Tranche B Concession Fees, which pertain to additional concession fees charged by MWSS to the Parent Company representing the cost of borrowings by MWSS as at December 2004. In 2005, pursuant to the Debt and Capital Restructuring Agreement (DCRA), the Parent Company had recognized and fully paid Tranche B Concession Fees amounting to US$36.9 million and the related accrued interest thereon (see Note 10).
Pursuant to the recommendation of the Receiver under the DCRA, the disputed amount being claimed by MWSS of additional Tranche B Concession Fees of US$18.1 million is considered as contingent liability of the Parent Company (see Notes 3, 10 and 20).
The Parent Company recognized additional concession fees amounting to P240.6 million and P25.0 million in 2018 and 2017, respectively, mainly pertaining to various rehabilitation projects and UATP-related local component costs (see Note 10).
Specific borrowing costs capitalized as part of service concession assets amounted to P583.8 million and P374.1
7.
2018 2017
Cost:
Balance at beginning of year P101,899,860 P90,386,206
Additions 11,824,601 11,513,654
Effect of change in rebased rate 648,872 –
Balance at end of year 114,373,333 101,899,860
Accumulated amortization:
Balance at beginning of year 23,508,005 21,088,746
Amortization 2,757,144 2,419,259
Balance at end of year 26,265,149 23,508,00
P88,108,184 P78,391,855
Notes to Consolidated Financial Statements

FinancialStatements
MAYNILAD 2018 ANNUAL REPORT 131
million in 2018 and 2017, respectively, while general borrowing cost capitalized as part of service concession assets amounted to P15.0 million and P61.8 million in 2018 and 2017, respectively (see Note 11).
On March 11, 2015, the MWSS Board of Trustees approved and confirmed the recommendation of the MWSS-RO to set aside the status quo of the FCDA and resume its normal operation starting first quarter of 2015. Under MWSS-RO Resolution No. 2014-002-CA, the MWSS-RO approved an FCDA equivalent to 1.12% of the 2015 basic charge of P33.97 per cu.m. or P0.38 per cu.m., effective January 1, 2015. The said FCDA adjustment was determined using the new rebased rate of P41.19 approved by the MWSS-RO, applicable to concession fee payments starting January 1, 2013 (see Note 3).
On September 13, 2018, the MWSS issued Resolution No. 2018-136-RO adopting RO Resolution No. 2018-09-CA dated September 7, 2018 granting the Parent Company a partial rate adjustment of P5.73/cu.m. for the Fifth Rate Rebasing Period (2018 to 2022), to be implemented on an uneven staggered basis of (i) P0.90/cu.m. effective October 1, 2018; (ii) P1.95/cu.m. effective January 1, 2020, (iii) P1.95/cu.m. effective January 1, 2021, and (iv) P0.93/cu.m. effective January 1, 2022. The approved rate adjustment still does not include the corporate income tax (“CIT”) component to which the Parent Company is entitled by virtue of the First Award. In their Resolutions, the MWSS and RO stated that the inclusion of the CIT in Parent Company’s tariff is subject to the SC’s resolution of MWSS’s Petition for Review.
On December 6, 2018, pursuant to MWSS-RO Resolution No. 2018-13-CA, the Parent Company used a new base foreign exchange rate from P41.19 to P53.16 effective January 1, 2018. The said FCDA adjustment was determined using the new rebased rate of P53.16 and P0.475 for United States Dollar and Euro, respectively, applicable to concession fee payments starting January 1, 2018.
The effect of change in rebased rate amounting P648.9 million was accounted for as an adjustment of “Service concession assets” and “Other noncurrent assets” accounts to adjust their carrying values based on the newly determined and approved rebased rate. These foreign exchange differences, while may no longer be recovered through the FCDA mechanism under the Concession Agreement, pertain to actual concession fee payments by Maynilad to MWSS, hence should form part of the service concession assets.
Phil Hydro accounts for each of its BWSAs (except the BWSA with New Era University) and MOA with Municipal Government of Rizal, Nueva Ecija (MGRNE) in accordance with IFRIC 12, Service Concession Arrangements under the Intangible Asset model as it receives the right (license) to charge users of public service.
Property and Equipment8.
2018
Land and Land Improvements
Instrumentation, Tools and Other
Equipment
Office Furniture, Fixtures and
Equipment
Transportation Equipment
Total
Cost
At January 1 P46,455 P1,744,095 P1,284,314 P543,192 P3,618,056
Additions − 138,805 180,436 43,143 362,384
Disposals − (5,593) (1,025) (50,095) (56,713)
At December 31 46,455 1,877,307 1,463,725 536,240 3,923,727
Accumulated Depreciation and Amortization
At January 1 4,688 1,017,610 937,287 249,713 2,209,298
Depreciation and amortization
532 114,642 154,904 98,177 368,255
Disposals − (5,593) (1,022) (48,181) (54,796)
At December 31 5,220 1,126,659 1,091,169 299,709 2,522,757
Net Book Value at December 31
P41,235 P750,648 P372,556 P236,531 P1,400,970

132 Sustaining Growth
2017
Land and Land Improvements
Instrumentation, Tools and Other
Equipment
Office Furniture, Fixtures and
Equipment
Transportation Equipment
Total
Cost
At January 1 P46,455 P1,533,006 P1,077,104 P505,643 P3,162,208
Additions − 240,832 210,994 71,028 522,854
Disposals − (29,743) (3,784) (33,479) (67,006)
At December 31 46,455 1,744,095 1,284,314 543,192 3,618,056
Accumulated Depreciation and Amortization
At January 1 4,328 903,217 813,875 186,449 1,907,869
Depreciation and amortization
360 144,204 127,192 90,765 362,521
Disposals − (29,811) (3,780) (27,501) (61,092)
At December 31 4,688 1,017,610 937,287 249,713 2,209,298
Net Book Value at December 31
P41,767 P726,485 P347,027 P293,479 P1,408,758
Net gain on disposals of property and equipment amounting to P10.1 million, P4.2 million, and P13.3 million, in 2018, 2017 and 2016, respectively, is presented as part of “Others - net” account under “Other income (expenses)” in the consolidated statements of income. The Company sold items of property and equipment for a total consideration of P12.0 million, P10.2 million and P16.2 million in 2018, 2017 and 2016, respectively.
No property and equipment as at December 31, 2018 and 2017 have been pledged as security or collateral.
The Company has fully depreciated property and equipment still used in the operations with cost of P1,786.3 million and P1,596.5 million in 2018 and 2017, respectively.
AFS Financial Assets and Financial Assets at Fair Value through Other Comprehensive Income
The AFS financial assets as of December 31, 2017 consists Company’s investments in unquoted equity shares in a local water distribution Company:
The Company recognized impairment loss amounting P7.5 million and nil in 2017 and 2016, presented as “Others - net” account under “Other income (expenses)” in the consolidated statements of income.
On January 1, 2018, upon adoption of PFRS 9, the Company elected the option to irrevocably designate its AFS financial assets as “Financial asset at FVOCI”.
The Company reclassified its AFS financial assets to financial assets at FVOCI with carrying amount of P124.9 million.
In 2018, the net movement in the fair value of its unquoted equity investments is insignificant.Dividend income on AFS financial assets presented as part of “Others - net” account under “Other income (expenses)” in the consolidated statements of income amounted to P10.0 million in 2017 and 2016. Dividend income on financial assets at FVOCI presented as part of “Others - net” account under “Other income (expenses)” in the consolidated statements of income amounted to P13.5 million in 2018.
9.
Cost P221,093
Less allowance for impairment loss (96,229)
P124,864
Notes to Consolidated Financial Statements

FinancialStatements
MAYNILAD 2018 ANNUAL REPORT 133
10. Service Concession Obligation Payable to MWSS
This account consists of:
Disputes with MWSSThe Parent Company has been contesting certain charges billed by MWSS relating to: (a) the basis of the computation of interest; (b) MWSS cost of borrowings; and (c) additional penalties. Consequently, the Parent Company has not provided for these additional charges. These disputed charges were effectively reflected and recognized by the Parent Company as Tranche B Concession Fees amounting to US$30.1 million by virtue of the DCRA entered into in 2005. The Parent Company also paid US$6.8 million in 2005 as an additional amount of Tranche B Concession Fees determined by the Receiver (see Note 7).
The Parent Company reconciled its liability to MWSS with the confirmation and billings from MWSS. The difference between the amount confirmed by MWSS and the amount recognized by the Parent Company amounted to P5.1 billion as at December 31, 2018 and 2017. The difference mainly pertains to disputed claims of MWSS consisting of additional Tranche B Concession Fees, borrowing cost and interest penalty under the Concession Agreement (prior to the DCRA). The Parent Company’s position on these charges is consistent with the Receiver’s recommendation which was upheld by the Rehabilitation Court (see Notes 3, 7 and 20).
Following the issuance of the Rehabilitation Court’s Order on December 19, 2007 disallowing the MWSS’ disputed claims and the termination of the Parent Company’s rehabilitation proceedings, the Parent Company and MWSS sought to resolve the matter in accordance with the dispute resolution requirements of the transitional and clarificatory agreement (TCA).
Prior to the DCRA, the Parent Company has accrued interest on its payable to MWSS based on the terms of the Concession Agreement, which was disputed by the Parent Company before the Rehabilitation Court. These already amounted to P985.3 million as at December 31, 2011 and have been charged to interest expense in prior years. The Parent Company maintains that the accrued interest on its payable to MWSS has been adequately replaced by the Tranche B Concession Fees discussed above. The Parent Company’s position is consistent with the Receiver’s recommendation which was upheld by the Rehabilitation Court (see Notes 7 and 20). With the prescription of the TCA and in light of the Parent Company’s current negotiation and outstanding offer of US$14.0 million to fully settle the claim of MWSS, the Parent Company reversed the amount of accrued interest in excess of the US$14.0 million settlement offer amounting to P378.1 million and recognized as other income in 2012. The remaining balance of P607.2 million as at December 31, 2018 and 2017, which pertains to the disputed interest penalty under the Concession Agreement prior to DCRA, has remained in the books pending resolution of the remaining disputed claims of MWSS. The schedule of undiscounted estimated future concession fee payments, based on the term of the Concession Agreement, is as follows:
2018 2017
Concession fees payable (see Note 7) P6,443,397 P6,852,306
Accrued interest 607,217 607,217
7,050,614 7,459,523
Less current portion 1,038,764 1,217,038
P6,011,850 P6,242,485
In Original Currency
Year Foreign Currency Loans(Translated to US$)*
Peso Loans/Project Local Support
Total Peso Equivalent*
(In Millions)
2019 $14.4 P598.6 P1,356.1
2020 13.9 598.7 1,328.2
2021 5.5 597.8 889.0
2022 5.4 597.8 880.7
2023-2037 46.1 8,967.6 11,390.8
$85.3 P11,360.5 P15,844.8
*Translated using the December 31, 2018 exchange rate of P52.58:US$1.

134 Sustaining Growth
Interest-bearing Loans
This account consists of:
P21.2 billion Term LoanOn March 22, 2013, the Parent Company entered into several loan agreements for the refinancing of all of its existing loans under the 2008 and 2011 Omnibus Notes Facility and Security Agreements (ONFSA) (collectively referred to as “Corporate Notes”), whereby the Parent Company was granted a Term Loan Facility (“Term Loan”) in the aggregate amount of P21.2 billion. Under the new terms, the loans shall be payable in semi-annual installments within ten years to commence at the end of the 6th month after the initial issue date and bears an interest rate per annum equal to the higher of (i) the applicable benchmark rate plus 0.75% per annum, or (ii) 5.75% per annum. The benchmark rate shall be determined by reference to the PDST-F rate. The Term Loan is secured by a negative pledge. P5.0 billion Corporate NotesOn April 29, 2013, the Parent Company entered into a Loan Agreement (Corporate Notes) with a local bank. The loan shall be payable in semi-annual installments within ten years to commence at the end of the 42nd month, and bears a fixed rate per annum equal to the higher of (i) the applicable benchmark rate plus 0.75% per annum, or (ii) 5.75% per annum. The benchmark rate shall be determined by reference to the PDST-F rate. The P5.0 billion Corporate Notes is secured by a negative pledge.
Debt Issuance Costs. All legal and professional fees incurred in relation to the debt totaling P42.8 million were capitalized in 2013. Debt issuance costs are amortized using the EIR method. Amortization of debt issuance costs attributed to this loan amounting to P24.4million, P4.2 million and P4.0 million in 2018, 2017 and 2016, respectively, is presented as part of “Interest expense and other financing charges” account in the consolidated statements of income (see Note 18).
P18.5 billion Corporate Notes On February 22, 2018, the Parent Company entered into several loan agreements for the refinancing of all of its existing loans under the P21.2 billion Term Loan and P5.0 billion Corporate Notes, whereby the Parent Company was granted a Term Loan Facility (“the Notes Facility”) in the aggregate amount of P18.5 billion. Under the new terms, the loan shall be drawn in three tenors; 7Y, 10Y and 15Y Fixed Corporate Notes, payable in semi-annual installments within fifteen years to commence at the end of the 6th month after the initial issue date and bears interest rate per annum equal to the applicable benchmark rate plus 0.60%, 0.70% and 0.60% per annum for the 7Y, 10Y and 15Y Fixed Corporate Notes, respectively. The Notes Facility is secured by a negative pledge.
All transaction costs incurred in relation to the loan refinancing totaling P257.6 million were charged to expense presented as part of “Interest expense and other financing charges” in the 2018 consolidated statements of income.
11.
2018 2017
P18.5 billion Corporate Notes P18,424,150 P–
US$137.5 million Loan 6,138,223 4,565,054
P4.8 billion Corporate Notes 4,770,000 4,000,000
¥7.9 billion Facility Loan 3,753,290 –
P1.4 billion Facility Loan 1,434,000 –
Peso-denominated Bank Loan 215,156 239,063
P21.2 billion Term Loan – 13,537,311
P5.0 billion Corporate Notes – 4,850,000
34,734,819 27,191,428
Less unamortized debt issuance costs 329,219 94,342
34,405,600 27,097,086
Less current portion 354,218 1,816,070
P34,051,382 P25,281,016
Notes to Consolidated Financial Statements

FinancialStatements
MAYNILAD 2018 ANNUAL REPORT 135
Debt Issuance Costs. All legal and professional fees incurred in relation to the debt totaling P199.7 million were capitalized in 2018. Debt issuance costs are amortized using the EIR method. Amortization of debt issuance costs attributed to this loan amounting to P8.1 million in 2018 is presented as part of “Interest expense and other financing charges” account in the consolidated statements of income (see Note 18).
US$137.5 million Loan The World Bank (WB), through the Metro Manila Wastewater Management Project (MWMP), provided a US$275.0 million loan to the Land Bank of the Philippines (LBP) for relending at an equal share to the two Concessionaires of the MWSS namely, Maynilad and Manila Water.
The MWMP is expected to finance investments in wastewater collection and treatment, and septage management in Metro Manila.
The loan will fund the following projects:
1. Rehabilitation of Ayala Alabang Sewage Treatment Plant (STP) 2. Talayan STP (part of the San Juan River Basin Project) 3. Valenzuela STP and associated wastewater conveyance system 4. Pasay STP and associated wastewater conveyance system 5. Muntinlupa STP and associated wastewater conveyance system 6. South Septage Treatment Plant
The WB and the LBP signed the Loan Agreement on May 31, 2012 while the Subsidiary Loan Agreement between LBP and Maynilad was executed on October 25, 2012.
The loan shall be payable in semi-annual installments within 25 years, inclusive of seven years grace period. The interest shall be paid semi-annually based on the same rate of interest payable by LBP under the WB Loan Agreement, plus fixed spread of 1.25% per annum. The loan is secured by a negative pledge.
Summary of transactions during the year is as follows:
The US$7.6 million (P399.1 million) and US$1.5 million (P74.1 million) balance as at December 31, 2018 and 2017, respectively, represents the outstanding balance of LBP designated account No. 3404-031-936, under the account name MWMP - Category 2 - MWSI, and is presented as part of “Sinking fund” under “Other current assets” account in the consolidated statements of financial position (see Note 6).
The US$116.5 million (P6.5 billion) and US$91.4 million (P4.6 billion) cumulative drawn amount as at December 31, 2018 and 2017, respectively, is presented as part of the noncurrent portion of the interest-bearing loans. On November 29, 2016, Maynilad requested to extend the availability of the undrawn amount until June 30, 2019 and was approved by the World Bank in its letter dated June 15, 2017. As at December 31, 2018, undrawn amount from this facility amounting to US$20.8 million out of Maynilad’s share of US$137.5 million from the facility is available until June 30, 2019.
The proceeds of the World Bank loan have been expended in accordance with the intended purposes as specified in the Loan Agreement.
Debt Issuance Costs. All legal and professional fees incurred in relation to the debt totaling P42.8 million were capitalized in 2013. Debt issuance costs are amortized using the EIR method. Amortization of debt issuance costs attributed to this loan amounting to P2.7 million, P2.7 million and P2.6 million in 2018,
2018 2017
Balance at beginning of year US$1,485 US$4,559
Amount received during the year 25,311 23,897
Net amount 26,796 28,456
Expenditures during the year (19,206) (26,971)
Balance at end of year US$7,590 US$1,485

136 Sustaining Growth
2017 and 2016, respectively, is presented as part of “Interest expense and other financing charges” account in the consolidated statements of income (see Note 18).
Specific borrowing costs capitalized as part of service concession assets amounted to P295.8 million and P183.0 million in 2018 and 2017, respectively (see Note 7).
P4.8 billion Corporate NotesOn February 24, 2014, the Parent Company entered into a Loan Agreement (Corporate Notes) with the Development Bank of the Philippines. The loan proceeds shall be used to finance the first stage of the Parañaque-Las Piñas STP and associated wastewater conveyance system.
The loan shall be payable in semi-annual payments within fifteen years to commence at the end of the fifth year, which bears a fixed rate per annum equal to 6.0%. The first, second, third and fourth drawdowns amounting to P1.0 billion, P2.0 billion, PP1.0 billion and P0.8 billion were made on March 2, 2015, October 4, 2016, August 1, 2017 and March 5, 2018, respectively. The P4.8 Billion Corporate Notes is secured by a negative pledge.
Debt Issuance Costs. All legal and professional fees incurred in relation to the debt totaling P46.1 million were capitalized in 2015. Debt issuance costs are amortized using the EIR method. Amortization of debt issuance costs attributed to this loan amounting to P3.1 million and P2.9 million in 2018 and 2017, respectively, is presented as part of “Interest expense and other financing charges” account in the consolidated statements of income (see Note 18).
Specific borrowing costs capitalized as part of service concession assets amounted to P288.0 million and P191.1 million in 2018 and 2017, respectively (see Note 7).
Under the terms of the loan agreements, the Parent Company may, at its option and without premium and penalty, redeem the Corporate Notes in whole or in part, subject to the conditions stipulated in the agreements. The embedded early redemption and prepayment options are clearly and closely related to the host debt contract, and thus, do not require to be bifurcated and accounted for separately from the host contract.
Covenants. The loan agreements contain, among others, covenants regarding the maintenance of certain financial ratios such as debt-to-equity ratio and debt service coverage ratio, and maintenance of debt service reserve account (see Note 6). As at December 31, 2018 and 2017, the Parent Company has complied with these covenants.
Peso-denominated Loan of Phil HydroOn May 4, 2015, Phil Hydro entered into a Loan Agreement with the Land Bank of the Philippines. The loan shall be payable in quarterly installments within eight years to commence after the end of the 8th quarter and bears an interest rate per annum equal to the higher of (i) the applicable benchmark rate plus 1.0% per annum, or (ii) 5.5% per annum. The benchmark rate shall be determined by reference to the PDST-R2 rate. The peso-denominated loan is secured by a negative pledge.
Debt Issuance Costs. All legal and professional fees incurred in relation to the debt totaling P1.3 million were capitalized in 2015. Debt issuance costs are amortized using the EIR method. Amortization of debt issuance costs attributed to this loan amounting to P0.2 million in 2018 and 2017, is presented as part of “Interest expense and other financing charges” account in the consolidated statements of income (see Note 18).
Covenants. The loan agreement contains, among others, covenants regarding the maintenance of certain financial ratios such as debt-to-equity ratio and debt service coverage ratio. As at December 31, 2018 and 2017, Phil Hydro has complied with these covenants.
¥7.9 billion Facility LoanOn June 7, 2017, the Parent Company entered into a credit agreement (Facility Agreement) with foreign banks, namely The Bank of Tokyo-Mitsubishi UFJ, Ltd., Mizuho Bank Ltd., and Sumitomo Mitsui Banking Corporation (collectively referred to as “the Lenders”). The first and second drawdowns amounting to ¥4.9 billion and ¥3.0 billion were made on August 20, 2018 and November 28, 2018, respectively. The loan shall be payable in semi-annual installments within ten years to commence at the end of the 36th month from the date of the Facility Agreement. The loan is secured by a negative pledge.
Notes to Consolidated Financial Statements

FinancialStatements
MAYNILAD 2018 ANNUAL REPORT 137
Debt Issuance Costs. All legal and professional fees incurred in relation to the debt totaling P70.6 million were capitalized in 2018. Debt issuance costs are amortized using the EIR method. Amortization of debt issuance costs attributed to this loan amounting to P3.6 million in 2018 is presented as part of “Interest expense and other financing charges” account in the consolidated statements of income (see Note 18).
P1.4 billion Facility LoanOn June 7, 2017, the Parent Company entered into a credit agreement with the JICA whereby the Parent Company was granted a peso-denominated Facility Loan, amounting to P1.4 billion. The loan shall be payable in semi-annual installments within seven years to commence on October 15, 2021. Drawdowns amounting to P0.5 billion, P0.5 billion and P0.4 billion were made on May 18, 2018, September 25, 2018 and December 21, 2018, respectively. The loan is secured by a negative pledge.
¥13.1 billion Facility LoanOn June 7, 2017, the Parent Company entered into a credit agreement with the Japan International Cooperation Agency (JICA) whereby the Parent Company was granted a Japanese yen-denominated Facility Loan, amounting to ¥13.1 billion. The loan shall be payable in semi-annual installments within seventeen years to commence on October 10, 2022. Undrawn amount from this facility is available until December 7, 2020. The loan is secured by a negative pledge.
Debt Issuance Costs. All legal and professional fees incurred in relation to the debt totaling P7.3 million were capitalized in 2018. Debt issuance costs are amortized using the EIR method. Amortization of debt issuance costs attributed to this loan amounting to P0.5 million in 2018 is presented as part of “Interest expense and other financing charges” account in the consolidated statements of income (see Note 18).
The movements in the balance of unamortized debt issuance costs related to all interest-bearing loans are as follows:
The repayments of loans based on existing terms are scheduled as follows:
2018 2017
Balance at beginning of year P94,342 P104,330
Additions during the year 277,544 –
Amortization during the year (see Note 18) (42,667) (9,988)
P329,219 P94,342
In Original Currency
Year US Dollar-Denominated*
Japanese Yen-Denominated**
Peso Loans Total Peso Equivalent*
(In Millions)
2019 $3.2 ¥– P183.6 P354.2
2020 6.5 1,053.3 350.5 1,192.3
2021 6.5 1,053.3 706.4 1,548.2
2022 6.5 1,053.3 911.3 1,753.0
2023 onwards 94.0 4,740.1 22,691.5 29,887.1
$116.7 ¥7,900.0 P24,843.3 P34,734.8
*Translated using the December 31, 2018 exchange rate of P52.58:US$1.**Translated using the December 31, 2018 exchange rate of 0.4751:JPY1.

138 Sustaining Growth
Trade and Other Payables
This account consists of:
Accrued expenses mainly consist of provisions, salaries, wages and benefits, contracted services and interest payable to the banks. Details of provisions required by PAS 37, Provisions, Contingent Liabilities and Contingent Assets, are not disclosed as these may prejudice the Company’s positions in relation to the cases pending before the courts or quasi-judicial bodies. Accrued expenses also include accrual for Long-term Incentive Plan (LTIP) amounting to P585.0 million as at December 31, 2018.
Trade and other payables are non-interest bearing and are normally settled within one year.Trade payables include liabilities relating to assets held in trust (see Note 23) used in the Company’s operations amounting to P97.3 million as at December 31, 2018 and 2017.
Accrued construction costs represent unbilled construction costs from contractors and normally settled upon receipt of billings.
Equity
a. The Parent Company’s authorized and issued shares as at December 31, 2018 and 2017 are presented below:
Class A and class B shares comprised sixty percent (60%) and (40%) of the authorized common shares.
b. ESOP
The employees of the Parent Company are allowed equity participation of up to six percent (6%) of the issued and outstanding capital stock of the Parent Company upon the effective date of the increase in authorized capital stock of the Parent Company pursuant to and in accordance with the provisions of Clause 2.6 of the DCRA. For this purpose, a series of 88,500,000 nonvoting convertible redeemable shares (ESOP Shares) was created from common Class A shares as reflected in the Parent Company’s amended Articles of Incorporation. In 2008, the ESOP shares were effectively reduced to 88,500 shares due to change in par value from P1 to P1,000. The ESOP shares have no voting rights, except for those provided under Section 6 of the Corporation Code and have no pre-emptive rights to purchase or subscribe to future or additional issuances or disposition of shares of the Parent Company.
Within thirty (30) days after the earlier of (i) the end of the fifth year from the creation of the ESOP Shares, and
12.
2018 2017
Accrued expenses (see Note 17) P7,195,480 P6,181,374
Accrued construction costs (see Note 15) 5,107,456 3,574,909
Trade and other payables 3,504,386 2,962,341
Due to a related party (see Note 15) 384,162 331,691
Contract liabilities (see Note 14) 13,378 –
P16,204,862 P13,050,315
Number of Shares
2018 2017
Authorized and issued - P1,000 par value
Common shares
Class A 4,222,482 4,222,482
Class B 236,000 236,000
ESOP 88,500 88,500
4,546,982 4,546,982
13.
Notes to Consolidated Financial Statements

FinancialStatements
MAYNILAD 2018 ANNUAL REPORT 139
(ii) the listing date for common shares in a recognized Philippine Stock Exchange, the Parent Company may redeem the ESOP shares at a redemption ratio equal to one common share for every ESOP share held and such common shares so exchanged shall have the same rights and privileges as all other common shares.
Each ESOP Share will be convertible, at the option of the holder thereof, at any time during the period commencing the earlier of (i) the end of the fifth year from the creation of the ESOP Shares; or (ii) the listing date for common shares in a recognized Philippine Stock Exchange into one fully-paid and non-assessable common share. Such common share shall have the same rights and privileges as all other common shares. Conversion of the ESOP Share may be effected by surrendering the certificates representing such shares to be converted to the Parent Company common shares at the Parent Company’s principal office or at such other office or offices as the BOD may designate, and a duly signed and completed notice of conversion in such form as may from time to time be specified by the Parent Company (a “Conversion Notice”), together with such evidence as the Parent Company may reasonably require to prove the title of the person exercising such right. A Conversion Notice once given may not be withdrawn without the consent in writing of the Parent Company.
In 2012, the Board and shareholders of the Parent Company approved the amendment of its Articles of Incorporation to allow for the reissuance of ESOP shares that have been bought back by the Parent Company from separated employees. Upon approval by the SEC of the amendment on January 31, 2013, ESOP shares reacquired by the Parent Company from its resigned employees were subsequently reissued to all qualified employees.
ESOP shares reacquired by the Parent Company from all of its resigned and retired employees amounting to P20.2 million and P175.0 million in 2018 and 2017, respectively, were presented as treasury shares
c. Dividends
On January 25, 2016, during the regular meeting, the Parent Company’s BOD set and approved the declaration of cash dividends of P440.17 per common share amounting to P2.0 billion to all shareholders of record as at February 9, 2016. Payments were made on March 4, 2016.
On February 27, 2017, during the regular meeting, the Parent Company’s BOD set and approved the declaration of cash dividends of P660.54 per common share amounting to P3.0 billion to all shareholders of record as at February 27, 2017. Payments were made on March 17, 2017.
On February 26, 2018, during the regular meeting, the Parent Company’s BOD set and approved the declaration of cash dividends of P659.87 per common share amounting to P3.0 billion to all shareholders of record as at February 28, 2018. Payments were made on March 12, 2018.
On February 26, 2019, during the regular meeting, the Parent Company’s BOD set and approved the declaration of cash dividends of P1,100.49 per common share amounting to P5.0 billion to all shareholders of record as at February 28, 2019. Expected payment date is on March 12, 2019.
d. Appropriation of Retained Earnings
On February 23, 2015, the Parent Company’s BOD approved the appropriation of its retained earnings amounting to P3.5 billion for several water and wastewater projects.
On February 27, 2017, the Parent Company’s BOD approved the appropriation of its retained earnings amounting to P5.0 billion for various water and wastewater projects expected to be implemented in the next three years.
On February 26, 2018 and October 29, 2018, the Parent Company’s BOD approved the appropriation of its retained earnings amounting to P15.0 billion and P5.0 billion for various water and wastewater projects. The appropriation is intended to fund the Parent Company’s capital expenditures for (1) water sources and treatment; (2) operations support programs to sustain, enhance and expand the water facilities and operations in the following areas: (i) service level at 24 hours water availability at a minimum of 16 psi water pressure,

140 Sustaining Growth
(ii) water coverage, (iii) reliability, flexibility and adaptation to climate change, and (iv) right-of-way and lot acquisition for water facilities; (3) pipelaying of secondary and tertiary pipelines; (4) sanitation programs; and (5) customer service and information capex. These projects are expected to be implemented in the next two to three years.
On October 29, 2018, the Parent Company’s BOD approved the reversal of its previously appropriated retained earnings as of December 31, 2017 totaling to P12.5 billion.
e. Equity Adjustments
Redemption of Preferred SharesThe Parent Company issued and redeemed preferred shares in 2008. Foreign exchange fluctuation from date of issuance of the preferred shares to the date of issuance of notice of redemption, amounting to P351.0 million, is recognized as part of “Other equity adjustments” account shown under the equity section of the consolidated statements of financial position.
Maynilad Share-based PaymentOn November 23, 2015, the BOD approved the awarding of 23,777 ESOP shares to all qualified Maynilad employees to be paid through stock purchase bonus (equity-settled transaction). The ESOP covers employees who have met the following eligibility criteria:
a. The employee has completed a full year’s service, from November 2, 2014 to b. November 1, 2015 (the “Period”);c. The employee has obtained at least a satisfactory performance rating for the appraisal period immediately
preceding November 1, 2015;d. The employee has not been suspended at any time during the Period;e. The employee has not exceeded 10 days of absences without official leave during the Period; andf. The employee has not exceeded 20 days of leave without pay during the Period.
Communication to eligible employees was made on December 1, 2015.
The fair value of ESOP shares amounting to P6,143.22 per share was determined based on the Parent Company’s equity value at the date of grant using the discounted cash flows (DCF) method.
The grant of shares under the ESOP does not require an exercise price to be paid by the employees nor are there cash alternatives. All ESOP shares are held in treasury until issuance. On February 9, 2016, the ESOP shares were issued to qualified employees.
On December 4, 2017, the BOD approved the awarding of 24,793 ESOP shares to all qualified Maynilad employees to be paid through stock purchase bonus (equity-settled transaction). The ESOP covers employees who have met the following eligibility criteria:
a. The employee has completed a full year’s service, from December 1, 2016 to b. November 30, 2017 (the “Period”);c. The employee has obtained at least a satisfactory performance rating for the appraisal period immediately
preceding December 1, 2017;d. The employee has not been suspended at any time during the Period;The employee has not exceeded 10
days of absences without official leave during the Period; ande. The employee has not exceeded 20 days of leave without pay during the Period.
Communication to eligible employees was made on December 5, 2017.
The fair value of ESOP shares amounting to P8,847.08 per share was determined based on the Parent Company’s equity value at the date of grant using the discounted cash flows (DCF) method.
The grant of shares under the ESOP does not require an exercise price to be paid by the employees nor are there
Notes to Consolidated Financial Statements

FinancialStatements
MAYNILAD 2018 ANNUAL REPORT 141
cash alternatives. All ESOP shares will be held in treasury until issuance. In February 2018, the ESOP shares were issued to qualified employees.
Equity-based compensation expense recognized by the Parent Company under “Salaries, wages and benefits” account in the consolidated statements of income amounted to nil in 2018 and 2016 and P219.3 million in 2017.Carrying value of the ESOP recognized under “Other equity adjustments” in the equity section of the consolidated statements of financial position amounted to nil and P261.1 million as at December 31, 2018 and 2017, respectively.
Revenue Contracts with Customers
Set out below is the disaggregation of the Company’s revenue from contracts with customers:
Contract balances:
Trade receivables are non-interest bearing and are generally on terms of 60 days.
Contract assets are initially recognized for revenue earned from water and wastewater services as receipt of consideration is conditional on the performance of service. Upon completion of the performance obligation the amounts recognized as contract assets are reclassified to trade receivables. Contract assets as at December 31, 2018 consist of the following:
Contract liabilities are initially recognized from the collection of the connection and installation fees and is recognized over the remaining concession period as the Company provides water and wastewater services to customers. The Company recognized contract liabilities under “Trade and other payables” account amounting to P13.4 million for the current portion and P235.6 million for the noncurrent portion under the “Other noncurrent liabilities” account in the 2018 consolidated statement of financial position.
Cost of new water service connections recognized amounted to P6.9 million under “Other current assets” and P119.5 million under “Other noncurrent asset” account in the 2018 consolidated statement of financial position, since these costs are recoverable and is directly associated with the contract with customers.
14.
2018 2017 2016
Geographical areas:
West zone P21,761,296 P20,550,303 P16,116,765
Outside west zone 262,353 223,938 194,622
P22,023,649 P20,774,241 P16,311,387
2018 2017
Trade receivables (gross of allowance for ECL or doubtful accounts) P2,466,561 P3,518,148
Contract assets 1,185,047 –
Cost of new water service connections 126,422 –
P3,778,030 P3,518,148
Contract liabilities P248,985 P–
Customers:
Residential P558,361
Semi-business 85,598
Commercial 404,747
Industrial 136,341
P1,185,047

142 Sustaining Growth
Related Party Transactions
Parties are considered to be related if one party has the ability to control, directly or indirectly,the other party or exercise influence over the other party in making financial and operating decisions. Parties are considered to be related if they are subject to common control or common significant influence.
15.
Category Year Amount/Volumeof Transactions
OutstandingReceivable
(Payable)
Terms Conditions
Subsidiary of a significant influence investor
DM Consunji, Inc.
Revenue from water and wastewater services
2018 P53.5 million P4.1 million Noninterest-bearing, settlement in cash
and payable on demand
Unsecured, not impaired
2017 40.5 million 2.3 million
Construction costs (see Note 12)
2018 1.2 billion (307.3 million) Noninterest-bearing, settlement in cash
and payable on demand
Unsecured
2017 2.5 billion (205.0 million)
Significant influence investees of FPC
Manila Electric Company
Revenue from water and wastewater services
2018 6.8 million 0.6 million Noninterest-bearing, settlement in cash
and payable on demand
Unsecured, not impaired 2017 5.6 million 1.0 million
Electricity costs 2018 874.2 million (31.2 million) Noninterest-bearing, settlement in cash
and payable on demand
Unsecured
2017 965.2 million (36.8 million)
Meralco Industrial Engineering Services Corporation
Construction costs(see Note 12)
2018 59.3 million (1.2 million) Noninterest-bearing, settlement in cash
and payable on demand
Unsecured
2017 – 16.4 million
Indra Philippines, Inc.
Commercial outsourcing of information technology and system services
2018 271.2 million – Noninterest-bearing, settlement in cash
and payable on demand
Unsecured
2017 238.8 million (38.2 thousand)
PLDT, Inc.
Revenue from water and wastewater services
2018 11.1 million 2.0 thousand Noninterest-bearing, settlement in cash
and payable on demand
Unsecured, not impaired 2017 12.1 million 263.0 thousand
Communication expenses 2018 31.8 million (21.8 million) Noninterest-bearing, settlement in cash
and payable on demand
Unsecured
2017 5.7 million (0.1 million)
Outsourced services 2018 20.6 million (2.1 million) Noninterest-bearing, settlement in cash
and payable on demand
Unsecured
2017 17.6 million (1.5 million)
Entity under common control
Ecosystem Technologies International, Inc.
Revenue from water and wastewater services
2018 10.2 thousand 2.1 thousand Noninterest-bearing, settlement in cash
and payable on demand
Unsecured, not impaired 2017 12.7 thousand 0.9 thousand
Construction costs (see Note 12)
2018 – – Noninterest-bearing, settlement in cash
and payable on demand
Unsecured
2017 2.7 million –
Notes to Consolidated Financial Statements

FinancialStatements
MAYNILAD 2018 ANNUAL REPORT 143
Terms and Conditions of Transactions with Related PartiesOutstanding balances at year-end are unsecured, interest-free, settlement occurs in cash and payable on demand.Total compensation and benefits of key management personnel of the Company consist of:
Income Taxes
Provision for current income tax represents the total of RCIT for both Parent Company and Phil Hydro in 2018,and the combination of RCIT for the Parent Company and MCIT for Phil Hydro in 2017 and 2016.
The components of the Parent Company’s deferred tax liabilities - net and deferred tax assets - net as atDecember 31, 2018 and 2017, respectively shown in the consolidated statements of financial position are as follows:
Category Year Amount/Volumeof Transactions
OutstandingReceivable
(Payable)
Terms Conditions
Others
Revenue from water and wastewater services
2018 13.4 million 230.2 thousand Noninterest-bearing, settlement in cash
and payable on demand
Unsecured, not impaired 2017 11.9 million 174.2 thousand
Communication expenses 2018 33.3 million (6.9 million) Noninterest-bearing, settlement in cash
and payable on demand
Unsecured
2017 36.7 million (2.1 million)
Insurance 2018 8.3 million (10.0 thousand) Noninterest-bearing, settlement in cash
and payable on demand
Unsecured
2017 8.4 million (10.0 thousand)
Sponsorship fees 2018 49.1 thousand (25.0 thousand) Noninterest-bearing, settlement in cash
and payable on demand
Unsecured
2017 49.1 thousand (25.0 thousand)
Transportation equipment 2018 3.6 million – Noninterest-bearing, settlement in cash
and payable on demand
Unsecured
2017 19.5 million –
Repairs and maintenance 2018 – – Noninterest-bearing, settlement in cash
and payable on demand
Unsecured
2017 9.4 thousand –
2018 2017 2016
Compensation P309,273 P308,366 P264,218
Pension costs 11,479 12,701 11,743
Short-term benefits 13,864 10,022 7,424
P334,616 P331,089 P283,385
16.
2018 2017
Deferred tax assets:
Pension liability and unamortized past service cost P80,742 P98,290
Accrued expenses 72,025 113,609
Revenue from contracts with customers - net 23,004 –
Allowance for inventory obsolescence 3,356 2,295
Service concession assets – 217,003
Unamortized debt issuance costs – 32,905
179,127 464,102

144 Sustaining Growth
Deferred tax assets on pension liability included in other comprehensive income amounted to P16.0 million as at December 31, 2018 and deferred tax liabilities on pension liability included in the other comprehensive loss amounted toP38.3 million as at December 31, 2017. The components of the net deferred tax liabilities of Phil Hydro as at December 31, 2018 and 2017 shown in the consolidated statements of financial position are as follows:
Service concession assets consist of concession fees and property, plant and equipment. For income tax purposes, concession fees are amortized using UOP method while property, plant and equipment are depreciated on a straight-line basis over the estimated useful lives or remaining concession period, whichever is shorter.
The reconciliation of provision for income tax computed at the statutory income tax rate to provision for income tax as shown in the consolidated statements of income is summarized as follows:
Employee Benefits
LTIPIn 2017, the Parent Company approved an LTIP for its managers and executives which is based on profit targets for the covered Performance Cycles 2016 to 2018. The total costs of the LTIP amounted to P206.3 million, P197.6 million and P181.1 million in 2018, 2017 and 2016, respectively, presented as part of “Salaries, wages and benefits” account in the consolidated statements of
2018 2017
Deferred tax liabilities:
Service concession assets (264,416) –
Unrealized foreign exchange gain (3,825) (1,572)
(268,241) (1,572)
Deferred tax assets/(liabilities) - net (P89,114) P462,530
2018 2017
Deferred tax assets:
Accrued expenses P2,808 P9,585
Unearned revenue – 6,954
Pension liability and unamortized past service cost 255 172
3,063 16,711
Deferred tax liabilities:
Service concession assets (54,448) (51,461)
Unamortized debt issuance costs (183) (238)
(54,631) (51,699)
Deferred tax liabilities - net (P51,568) (P34,988)
2018 2017 2016
Income tax at statutory tax rate of 30% P3,093,925 P2,796,519 P2,999,561
Add (deduct) the tax effects of:
Deduction under OSD method (1,591,652) (1,406,787) (1,407,531)
Foregone benefit under itemized deduction method 1,428,827 1,222,616 1,216,392
Change in income tax rate for using OSD and others 80,052 (273,718) 311,555
Derecognition of deferred tax assets relating to accrued expenses (10,364) 158,459 214,169
Interest income already subjected to final tax (55,481) (28,333) (35,976)
Change in unrecognized net deferred tax assets − − (47,805)
Provision for income tax P2,945,307 P2,468,756 P3,250,365
17.
Notes to Consolidated Financial Statements

FinancialStatements
MAYNILAD 2018 ANNUAL REPORT 145
comprehensive income. Accrued LTIP amounting to P585.0 million and P378.7 million as at December 31, 2018 and 2017, respectively, were presented as part of “Trade and other payables” and “Other noncurrent liabilities” account in the consolidated statements of financial position.
Pension Plan
MayniladThe Parent Company has a funded, noncontributory and actuarially computed pension plan covering all regular and permanent employees. The benefits are based on years of service and compensation during the last year of employment.
Changes in the funded pension liability in 2018 are as follows:
Changes in funded pension liability in 2017 are as follows:
Present Value of Defined Benefit
Obligation
Fair Value of Plan Assets
Pension Liability
At December 31, 2017 P1,308,945 P714,701 P594,244
Pension cost in the consolidated statements of income:
Current service cost 127,203 – 127,203
Net interest cost 74,584 45,036 29,548
201,787 45,036 156,751
Benefits paid (20,241) (6,888) (13,353)
Actual contributions – 160,738 (160,738)
Remeasurements in other comprehensive income:
Interest income (excluding amount included in net interest cost) – (72,655) 72,655
Actuarial changes due to experience adjustment 23,076 – 23,076
Actuarial changes arising from changes in demographic assumptions 2,181 – 2,181
Actuarial changes arising from changes in financial assumptions (227,640) – (227,640)
(202,383) (72,655) (129,728)
At December 31, 2018 P1,288,108 P840,932 P447,176
Present Value of Defined Benefit
Obligation
Fair Value of Plan Assets
Pension Liability
At December 31, 2016 P1,114,030 P797,118 P316,912
Pension cost in the consolidated statements of income:
Current service cost 90,109 – 90,109
Curtailment gain (30,962) – (30,962)
Net interest cost 58,376 45,875 12,501
117,523 45,875 71,648
Benefits paid (280,764) (280,764) –
Actual contributions – 171,312 (171,312)
Remeasurements in other comprehensive income:
Interest income (excluding amount included in net interest cost) P– (P18,840) P18,840
Actuarial changes due to experience adjustment 46,515 – 46,515
Actuarial changes arising from changes in demographic assumptions (141) – (141)
Actuarial changes arising from changes in financial assumptions 311,782 – 311,782
358,156 (18,840) 376,996
At December 31, 2017 P1,308,945 P714,701 P594,244

146 Sustaining Growth
The components of net pension cost included under “Salaries, wages and benefits” account in the consolidated statements of income for 2018, 2017 and 2016 are as follows:
The fair value of plan assets by each class as at the end of the reporting period are as follows:
The plan asset’s carrying amount approximates its fair value since the plan assets are short-term in nature or marked-to-market. Investments held have quoted prices in active market. The remaining plan assets which are short term in nature, do not have quoted market prices in an active market. The plan assets have diverse investments and do not have any concentration risk.
As at December 31, 2018, the plan assets consist of the following:
• Investments in government securities consist primarily of fixed-rate treasury notes and retail treasury bonds that bear interest ranging from 3.37% to 8.62% per annum and have maturities from 2019 to 2027.
• Investments in equity securities are composed of investment in shares of various listed entities. The carrying amounts of investments in equity securities also approximate their fair values since they are marked-to-market.
• Unit trust funds include mutual funds invested in quoted shares.• Loans and notes receivables include unsecured fixed-rate notes of a related party and unsecured notes of an
unaffiliated company which bear interest ranging from 5.4% to 7.1% per annum.• Cash and cash equivalents include regular savings and time deposits, which bear interest ranging from 6.25%
to 6.9% per annum.• Receivables and others include interest and dividends.
The cost of defined benefit pension plans and other post-employment benefits as well as the present value of the pension obligation are determined using actuarial valuations. The actuarial valuation involves making various assumptions. The principal assumptions used in determining pension cost and present value of defined benefit obligation are shown below:
2018 2017 2016
Current service cost P127,203 P90,109 P88,530
Net interest cost 29,548 12,501 15,519
Curtailment gain – (30,962) –
P156,751 P71,648 P104,049
2018 2017
Investments in:
Government securities P389,267 P342,062
Equity securities 260,462 273,643
Unit trust funds 8,210 1,001
Loans/notes receivable 77,875 62,728
Cash and cash equivalents 100,564 31,542
Receivables and others 4,554 3,725
P840,932 P714,701
2018 2017
Discount rate 7.43% 5.75%
Salary increase rate 7.00% 7.00%
Turnover rate 3.00% 2.76%
Notes to Consolidated Financial Statements

FinancialStatements
MAYNILAD 2018 ANNUAL REPORT 147
Sensitivity analysis below has been determined based on reasonably possible changes of each significant assumption on the defined benefit obligation as at the end of the reporting period, assuming all other assumptions were held constant:
Shown below are the maturity analyses of the undiscounted benefit payments:
Actual contributions to the defined benefit pension plan amounted to P160.7 million and P171.3 million in 2018 and 2017, respectively.
The Parent Company expects to contribute P163.8 million to the defined benefit pension plan in 2019.
2018
Increase (Decrease) in Basis Points Increase (Decrease) in Amount
Discount rate 100 (P106,811)
(100) 127,187
Salary increase rate 100 134,108
(100) (114,589)
Turnover rate 100 (6,502)
(100) 1,952
2017
Increase (Decrease) in Basis Points Increase (Decrease) in Amount
Discount rate 100 (P125,923)
(100) 151,534
Salary increase rate 100 155,932
(100) (132,198)
Turnover rate 100 (19,972)
(100) 21,373
2018
Normal Retirement Other thanNormal Retirement
Total
Less than one year P49,047 P27,261 P76,308
More than one year to five years 586,397 121,235 707,632
More than 5 years to 10 years 571,516 174,275 745,791
More than 10 years to 15 years 278,317 250,995 529,312
More than 15 years to 20 years 621,495 372,691 994,186
More than 20 years 7,571,458 1,119,077 8,690,535
P9,678,230 P2,065,534 P11,743,764
2017
Normal Retirement Other thanNormal Retirement
Total
Less than one year P1,687 P21,976 P23,663
More than one year to five years 443,296 121,545 564,841
More than 5 years to 10 years 644,024 162,184 806,208
More than 10 years to 15 years 316,911 204,726 521,637
More than 15 years to 20 years 504,381 317,416 821,797
More than 20 years 6,566,750 1,145,522 7,712,272
P8,477,049 P1,973,369 P10,450,418

148 Sustaining Growth
In 2017, the Parent Company launched a Redundancy and Right-Sizing Program offering a separation package based on the number of years, or fractions thereof, on a pro-rated basis, of service with the Company plus monetary equivalent of some benefits for identified redundant positions. The Parent Company incurred a total of P276.9 million as incremental cost of redundancy program in 2017.
Phil HydroPhil Hydro recognized pension liability amounting to P0.8 million and P0.6 million in 2018 and 2017, respectively, in the consolidated statements of financial position determined in accordance with Republic Act No. 7641. Pension cost (income) included under “Salaries, wages and benefits” account in the consolidated statements of income amounted to P0.3 million, P0.2 million and nil in 2018, 2017 and 2016, respectively.
Interest Expense and Other Financing Charges
Basic/Diluted Earnings Per Share
Contingent Liabilities
Following are the significant contingent liabilities of the Company as at December 31, 2018 and 2017:
a. Additional Tranche B Concession Fees and interest penalty are being claimed by MWSS in excess of the amount recommended by the Receiver. Such additional charges being claimed by MWSS (in addition to other miscellaneous claims) amounted to P5.1 billion as at December 31, 2018 and 2017. The Rehabilitation Court has resolved to deny and disallow the said disputed claims of MWSS in its December 19, 2007 Order, upholding the recommendations of the Receiver on the matter. Following the termination of the Parent Company’s rehabilitation proceedings, the Parent Company and MWSS sought to resolve this matter in accordance with the dispute requirements of the TCA (see Notes 3, 7 and 10).
b. On October 13, 2005, the Parent Company and Manila Water (the “Concessionaires”) were jointly assessed by the Municipality of Norzagaray, Bulacan for real property taxes on certain common purpose facilities purportedly due from 1998 to 2005 amounting to P357.1 million. It is the position of the Concessionaires that it is the Republic of the Philippines that owns these properties, and is therefore, exempt from real property taxes.
18.
19.
20.
2018 2017 2016
Bank loans (see Note 11) P1,506,173 P1,139,820 P1,257,103
Accretion on service concession obligation payable to MWSS(see Note 10)
548,737 614,827 533,037
Accretion of customers’ deposits 22,941 13,391 10,816
Amortization of debt issuance costs (see Note 11) 42,667 9,988 9,619
P2,120,518 P1,778,026 P1,810,575
2018 2017 2016
Net income (a) P7,367,777 P6,852,973 P6,748,172
Weighted average number of shares at beginning and end of year for basic earnings per share (b)
4,458,482 4,458,482 4,458,482
Weighted average number of ESOP shares at beginning of year 88,500 83,586 88,283
Add weighted average potential dilutive shares from ESOP (see Note 13) − 2,066 −
Less weighted average number of treasury shares (see Note 13) (1,639) (14,906) (3,641)
Weighted average number of shares at end of year for diluted earnings per share (c)
4,545,343 4,529,228 4,543,124
Basic earnings per share (a/b) P1,652.53 P1,537.06 P1,513.56
Diluted earnings per share (a/c) P1,620.95 P1,513.06 P1,485.36
Notes to Consolidated Financial Statements

FinancialStatements
MAYNILAD 2018 ANNUAL REPORT 149
The supposed joint liability of the Concessionaires for real property tax, including interests, amounted to about P1.0 billion as at December 31, 2018 and 2017.
After the Local Board of Assessment Appeals (LBAA) ruled in favor of the Municipality of Norzagaray, Bulacan, the Concessionaires elevated the ruling of the LBAA to the Central Board of Assessment Appeals (CBAA) by filing separate appeals.
On May 23, 2018, Court of Tax Appeals’ (CTA) Notice of Decision dated May 11, 2018 was received, denying Petitioner’s Petition for Certiorari (for an interlocutory order) (“CTA Decision”). Thus, the CTA ordered that the case be remanded to CBAA and for the proceedings to continue.
On September 3, 2018, Maynilad received the CTA’s Resolution dated June 4, 2018 noting the compliance of Maynilad and MWSS informing the CTA of their respective dates of receipt of the CTA Decision.
c. The Parent Company is a party to various civil and labor cases relating to breach of contracts with damages, illegal dismissal of employees, and nonpayment of backwages, benefits and performance bonus, among others.
Significant Contracts with Manila Water (East Concessionaire) In relation to the Concession Agreement, the Parent Company entered into the following contracts with the East Concessionaire:
a. Interconnection Agreement wherein the two Concessionaires shall form an unincorporated joint venture that will manage, operate, and maintain interconnection facilities. The terms of the agreement provide, among others, the cost and the volume of water to be transferred between zones; and
b. Common Purpose Facilities Agreement that provides for the operation, maintenance, renewal, and, as appropriate, decommissioning of the Common Purpose Facilities, and performance of other functions pursuant to and in accordance with the provisions of the Concession Agreement and performance of such other functions relating to the Concession (and the Concession of the East Concessionaire) as the Parent Company and the East Concessionaire may choose to delegate to the Joint Venture, subject to the approval of MWSS.
Commitments
Concession AgreementSignificant commitments under the Concession Agreement follow:
a. To pay Concession Fees (see Note 7)b. To post Performance Bond (see Note 6)
Under Section 6.9 of the Concession Agreement, the Parent Company is required to post a performance bond to secure the performance of its obligations under certain provisions of the Concession Agreement. The aggregate amount drawable in one or more installments under such performance bond during the Rate Rebasing Period to which it relates is set out below.
21.
22.
Rate Rebasing Period Aggregate Amount Drawable Under Performance Bond
(In Millions)
First (August 1, 1997 – December 31, 2002) US$120.0
Second (January 1, 2003 – December 31, 2007) 120.0
Third (January 1, 2008 – December 31, 2012) 90.0
Fourth (January 1, 2013 – December 31, 2017) 80.0
Fifth (January 1, 2018 – May 6, 2022) 60.0

150 Sustaining Growth
Within 30 days from the commencement of each renewal date, the Parent Company shall cause the performance bond to be reinstated to the full amount applicable to the rate rebasing period as set forth above.
In connection with the extension of the term of the Concession Agreement (see Note 1), certain adjustments to the obligation of the Parent Company to post the performance bond under Section 6.9 of the Concession Agreement have been approved and summarized as follows:
• The aggregate amount drawable in one or more installments under each performance bond during the Rate Rebasing Period to which it relates has been adjusted to US$30.0 million until the Expiration Date.
• The amount of the Performance Bond for the period covering 2023 to 2037 shall be mutually agreed upon in writing by the MWSS and the Parent Company consistent with the provisions of the Concession Agreement.
• The Parent Company posted the Surety Bond for the amount of US$90.0 million issued by Prudential Guarantee and Assurance, Inc. (the Surety) in favor of MWSS, as security for the Parent Company’s proper and timely performance of its obligations under the Concession Agreement. On December 6, 2012, the Parent Company renewed the Surety Bond for the amount of US$80.0 million issued by the Surety in favor of MWSS which has expired on December 31, 2017. The Surety Bond was renewed for US$60.0 million on December 23, 2017. The liability of the Surety under this bond will expire on January 1, 2021 (see Note 6).
c. To pay half of MWSS and MWSS-RO’s budgeted expenditures for the subsequent years, provided the aggregate annual budgeted expenditures do not exceed P200.0 million, subject to CPI adjustments. As a result of the extension of the life of the Concession Agreement, the annual budgeted expenditures shall increase by 100%, subject to CPI adjustments, effective January 2010 (see Notes 1 and 7).
d. To meet certain specific commitments in respect to the provision of water and wastewater services in the West Service Area, unless modified by the MWSS-RO due to unforeseen circumstances.
e. To operate, maintain, renew and, as appropriate, decommission facilities in a manner consistent with the National Building Standards and best industrial practices so that, at all times, the water and wastewater system in the West Service Area is capable of meeting the service obligations (as such obligations may be revised from time to time by the MWSS-RO following consultation with the Parent Company).
f. To repair and correct, on a priority basis, any defect in the facilities that could adversely affect public health or welfare, or cause damage to persons or third-party property.
g. To ensure that at all times the Parent Company has sufficient financial, material and personnel resources available to meet its obligations under the Concession Agreement.
h. To prevent incurrence of debt or liability that would mature beyond the term of the Concession Agreement, without prior notice to MWSS.
Failure of the Parent Company to perform any of its obligations under the Concession Agreement of a kind or to a degree which, in a reasonable opinion of the MWSS-RO, amounts to an effective abandonment of the Concession Agreement and which failure continues for at least 30 days after written notice from the MWSS-RO, may cause the Concession Agreement to be terminated.
Operating Lease CommitmentsThe Company leases the office space and branches where service outlets are located, several equipment and service vehicles, renewable under certain terms and conditions to be agreed upon by the parties. Total rent expense for the above operating leases amounted to P167.5 million, P158.0 million, and P143.7 million in 2018, 2017 and 2016, respectively (see Note 23).
Future minimum operating lease payments as at December 31 are as follows:
2018 2017
(In Millions)
Not later than one year P158.40 P140.20
More than one year and not later than five years 237.63 263.41
More than five years 136.46 127.73
Notes to Consolidated Financial Statements

FinancialStatements
MAYNILAD 2018 ANNUAL REPORT 151
Assets Held in Trust
Materials and SuppliesThe Parent Company has the right to use any items of inventory owned by MWSS in carrying out its responsibility under the Concession Agreement, subject to the obligation to return the same at the end of the concession period, in kind or in value at its current rate, subject to CPI adjustments.
FacilitiesThe Parent Company has been granted the right to operate, maintain in good working order, repair, decommission and refurbish the movable property required to provide the water and wastewater services under the Concession Agreement. MWSS shall retain legal title to all movable property in existence at the Commencement Date. However, upon expiration of the useful life of any such movable property as may be determined by the Parent Company, such movable property shall be returned to MWSS in its then-current condition at no charge to MWSS or the Parent Company (see Note 7).
The Concession Agreement also provides the Parent Company and the East Concessionaire to have equal access to MWSS facilities involved in the provision of water supply and wastewater services in both West and East Service Areas including, but not limited to, the MWSS management information system, billing system, telemetry system, central control room and central records.
The net book value of the facilities transferred to the Parent Company on Commencement Date based on MWSS’ closing audit report amounted to P7.3 billion with a sound value of P13.8 billion.
Beginning at the Commencement Date, MWSS’ corporate headquarters were made available for a one-year lease to the Parent Company and the East Concessionaire, subject to yearly renewal with the consent of the parties concerned. As at December 31, 2018, the lease has been renewed for another year. Rent expense amounted to P43.2 million in 2018, P41.0 million in 2017 and P38.0 million in 2016 (see Note 22).
Financial Risk Management Objectives and Policies
The Company’s principal financial instruments are its debts to the local banks and concession fees payable to MWSS per Concession Agreement. Other financial instruments of the Company are cash and cash equivalents, short-term investments, and trade and other receivables. The main purpose of those financial instruments is to finance the Company’s operations.
The main risks arising from the Company’s principal financial instruments are interest rate risk, foreign currency risk, credit risk and liquidity risk.
The BOD reviews and approves the policies for managing the Company’s financial risks. The Company monitors risks arising from all financial instruments and regularly reports financial management activities and the results of these activities to the BOD.
Interest Rate RiskInterest rate risk is the risk that the future cash flows of financial instruments will fluctuate because of the changes in market interest rates. The Company’s exposure to market risk for changes in interest rates relates primarily to the Company’s interest-bearing loans.
The Company maintains a mix of floating and fixed rate interest-bearing loans, at a ratio of 18% floating and 82% fixed, and 17% floating and 83% fixed in 2018 and 2017, respectively, per abovementioned loan agreements. The floating rate interest-bearing loans will increase to a higher portion over time because of future drawdowns in connection to the MWMP loan agreement.
23.
24.

152 Sustaining Growth
The following table shows the Company’s significant financial liabilities that are exposed to cash flow interest rate risk:
Interest on financial liabilities classified as fixed rate is fixed until the maturity of the instrument.
The following tables show information about the Company’s financial assets and financial liabilities that are exposed to cash flow and fair value interest rate risks.
US$137.5 million Loan (US$116.7 million drawdown) Floating rate benchmark+1.25% (4.80%, November 15, 2018 to May 15, 2019)
P4.8 billion Corporate Notes (1st drawdown) Fixed rate benchmark (6.00%, March 2, 2015 to March 2, 2035)
P4.8 billion Corporate Notes (2nd drawdown) Fixed rate benchmark (6.00%, October 4, 2016 to March 2, 2035)
P4.8 billion Corporate Notes (3rd drawdown) Fixed rate benchmark (6.00%, August 1, 2017 to March 2, 2035)
P4.8 billion Corporate Notes (4th drawdown) Fixed rate benchmark (6.00%, March 5, 2018 to March 2, 2035)
P18.5 billion Fixed Corporate Notes - 7Y (1st drawdown) Fixed rate benchmark+0.60% (6.3836%, March 23, 2018 to March 23, 2025)
P18.5 billion Fixed Corporate Notes - 10Y (1st drawdown) Fixed rate benchmark+0.70% (6.8229%, March 23, 2018 to March 23, 2028)
P18.5 billion Fixed Corporate Notes - 15Y (1st drawdown) Fixed rate benchmark+0.60% (6.4920%, March 23, 2018 to March 23, 2026)
P18.5 billion Fixed Corporate Notes - 7Y (2nd drawdown) Fixed rate benchmark+0.60% (6.5083%, April 27, 2018 to March 23, 2025)
P18.5 billion Fixed Corporate Notes - 10Y (2nd drawdown) Fixed rate benchmark+0.70% (6.8388%, April 27, 2018 to March 23, 2028)
P18.5 billion Fixed Corporate Notes - 15Y (2nd drawdown) Fixed rate benchmark+0.60% (6.5489%, April 27, 2018 to March 23, 2026)
¥7.9 billion Facility Loan (1st drawdown) Fixed rate benchmark+0.90% (1.22%, August 20, 2018 to June 7, 2027)
¥7.9 billion Facility Loan (1st drawdown) Fixed rate benchmark+0.90% (1.23%, August 20, 2018 to June 7, 2027)
¥7.9 billion Facility Loan (2nd drawdown) Fixed rate benchmark+0.90% (1.22%, November 28, 2018 to June 7, 2027)
P1.4 billion Facility Loan (1st drawdown) Fixed rate benchmark (6.39%, May 18, 2018 to October 15, 2024)
P1.4 billion Facility Loan (2nd drawdown) Fixed rate benchmark (6.75%, September 25, 2018 to October 15, 2024)
P1.4 billion Facility Loan (3rd drawdown) Fixed rate benchmark (7.30%, December 21, 2018 to October 15, 2024)
Peso-denominated Bank Loan Fixed rate benchmark (5.50%, June 29, 2015 to June 29, 2025)
2018
Within 1 Year More than 1 Year Total (In US$) Total (In P)
Liabilities:
Interest-bearing loans:
Interest rate 4.80%, 6.38%, 6.82%, 6.49%, 6.51%, 6.84%,
6.55%, and 5.5%
4.80%, 6.38%, 6.82%, 6.49%, 6.51%, 6.84%, 6.55%, 6.00%, 1.22%, 1.23%, 6.39%, 6.75%,
7.30%, and 5.5%
Current - foreign $3,245 – $3,245 P170,643
Current - local P183,575 – – 183,575
Noncurrent - foreign – $183,068 $183,068 9,625,693
Noncurrent - local – P24,425,689 – 24,425,689
Total (Carried Forward) 34,405,600
2018
Within 1 Year Total
Short-term cash investments:
Cash and cash equivalents (1-90 days)* P11,530,868 P11,530,868
Short-term investments (91-364 days) 15,774 15,774
P11,546,642 P11,546,642*Excludes cash on hand amounting to P2,180.
Notes to Consolidated Financial Statements

FinancialStatements
MAYNILAD 2018 ANNUAL REPORT 153
*Excludes cash on hand amounting to P38,854.
2018
Within 1 Year More than 1 Year Total (In US$) Total (In P)
Total (Brought Forward) P34,405,600
Service concession obligation payable to MWSS:
Interest rate 7.96%
Current - foreign $11,284 – $11,284 593,315
Current - local P445,449 – – 445,449
Noncurrent - foreign – $54,991 $54,991 2,891,407
Noncurrent - local – P3,120,443 – 3,120,443
7,050,614
P41,456,214
2017
Within 1 Year Total
Short-term cash investments:
Cash and cash equivalents (1-90 days)* P3,479,640 P3,479,640
Short-term investments (91-364 days) 1,501,000 1,501,000
P4,980,640 P4,980,640
2017
Within 1 Year More than 1 Year Total (In US$) Total (In P)
Liabilities:
Interest-bearing loans:
Interest rate 5.75% 5.75%, 3.53%, 6.00% and 5.50%
Current - local P1,816,070 – – P1,816,070
Noncurrent - foreign – $90,809 $90,809 4,534,111
Noncurrent - local – P20,746,905 – 20,746,905
27,097,086
Service concession obligation payable to MWSS:
Interest rate 8.24%
Current - foreign $8,962 – $8,962 447,451
Current - local P769,587 – – 769,587
Noncurrent - foreign – $68,447 $68,447 3,417,569
Noncurrent - local – P2,824,916 – 2,824,916
7,459,523
P34,556,609
The following table demonstrates the sensitivity of the Company’s profit before tax to a reasonably possible change in interest rates for the years ended December 31, 2018 and 2017, with all variables held constant (through the impact on floating rate borrowings). The estimates are based on the management’s annual financial forecast. There is no impact on the Company’s equity other than those already affecting income.
2018
Increase/Decrease in Basis Points Effect on Income Before Tax
Floating rate borrowings +50 30,550
-50 (30,550)

154 Sustaining Growth
2017
Increase/Decrease in Basis Points Effect on Income Before Tax
Floating rate borrowings +50 22,671
-50 (22,671)
Foreign Currency RiskForeign currency risk is the risk that the fair value or future value of financial instruments will fluctuate because of changes in foreign exchange rates.
The Company’s foreign currency risk arises primarily from movements of the Philippine Peso against the United States Dollar, Euro and Japanese Yen. The servicing of foreign currency denominated loans of MWSS is among the requirements of the Concession Agreement. Revenues are generated in Philippine Peso. However, there is a mechanism in place as part of the Concession Agreement wherein the Company (or the end consumers) can recover currency fluctuations through the FCDA that is approved by the Regulatory Office.
Information on the Company’s foreign currency-denominated monetary assets and liabilities and the Philippine Peso equivalent of each as at December 31, 2018 and 2017 is presented as follows:
2018
US Dollar Euro JPY Total PesoEquivalent
Asset
Cash and cash equivalents,short term investments and sinking fund
$11,141 €– ¥1,132 P586,356
Liabilities
Interest-bearing loans ($116,204) €– (¥7,759,098) (P9,796,336)
Service concession obligation payable to MWSS (64,668) – (177,771) (3,484,722)
(180,872)
– (7,936,869) (13,281,058)
Net foreign currency denominated liabilities ($169,731) (€–) (¥7,935,737) (P12,694,702)
The spot exchange rates used were P52.58:US$1, P60.31:EUR1, and P0.48:JPY1 as at December 31, 2018.
The spot exchange rates used were P49.93:US$1, P59.61:EUR1, and P0.44:JPY1 as at December 31, 2017.
2017
US Dollar Euro JPY Total Peso Equivalent
Asset
Cash and cash equivalents,short term investments and sinking fund
$1,577 €– ¥– P78,729
Liabilities
Interest-bearing loans ($90,809) €– ¥– (P4,534,111)
Service concession obligation payable to MWSS (75,685) (28) (194,636) (3,865,020)
(166,494) (28) (194,636) (8,399,131))
Net foreign currency denominated liabilities ($164,917) (€28) (¥194,636) (P8,320,402)
Notes to Consolidated Financial Statements

FinancialStatements
MAYNILAD 2018 ANNUAL REPORT 155
The following table demonstrates the sensitivity to a reasonably possible change in foreign exchange rates, with all variables held constant, of the Company’s profit before tax (due to changes in the fair value of monetary assets and liabilities) and equity as at December 31, 2018 and 2017. The estimates in the movement of the foreign exchange rates were based on the management’s annual financial forecast.
The Company recognized net foreign exchange loss of P1.1 billion and P0.6 billion in 2018 and 2017, respectively, mainly arising from the translation of the Company’s cash and cash equivalents, short-term investments, deposits, interest-bearing loans and service concession obligation payable to MWSS. However, the net foreign exchange gain or loss on interest-bearing loans and service concession obligation payable to MWSS is subject to foreign exchange recovery mechanisms under the Concession Agreement (see Note 2).
Credit RiskCredit risk is the risk that a counter party will not meet its obligations under a financial instrument or customer contract, leading to a financial loss.
The Company trades only with recognized, creditworthy third parties. It is the Company’s policy that except for connection fees and other highly meritorious cases, it does not offer credit terms to its customers. Because of the basic need service, it provides, historical collections of the Company are relatively high. Credit exposure is widely dispersed. Receivable balances are monitored on an ongoing basis.
With respect to credit risk arising from the other financial assets of the Company, consisting of cash and cash equivalents, short-term cash investments, deposits and sinking fund and miscellaneous deposits, the Company’s exposure to credit risk arises from default of the counterparty, with a maximum exposure equal to the carrying amount of these instruments. The Company transacts only with institutions or banks which have demonstrated financial soundness for the past five years.
Maximum exposure to credit risk of financial assets not subject to impairmentThe Company has unquoted equity shares measured at fair value through other comprehensive income amounting to P124.9 million as at December 31, 2018 (see Note 9).
Increase(Decrease) in Peso,U.S Dollar, Euro and JPY
Exchange Rates
ForeignExchange Rate
Effect on IncomeBefore Income Tax
2018
U.S Dollar +1% 52.58 (P89,245)
JPY +1% 0.48 (37,703)
U.S Dollar -1% 52.58 89,245
JPY -1% 0.48 37,703
Increase(Decrease) in Peso,U.S Dollar, Euro and JPY
Exchange Rates
ForeignExchange Rate
Effect on Income Before Income Tax
2017
U.S Dollar +1% 49.93 (P82,343)
Euro +1% 59.61 (17)
JPY +1% 0.44 (861)
U.S Dollar -1% 49.93 82,343
Euro -1% 59.61 17
JPY -1% 0.44 861
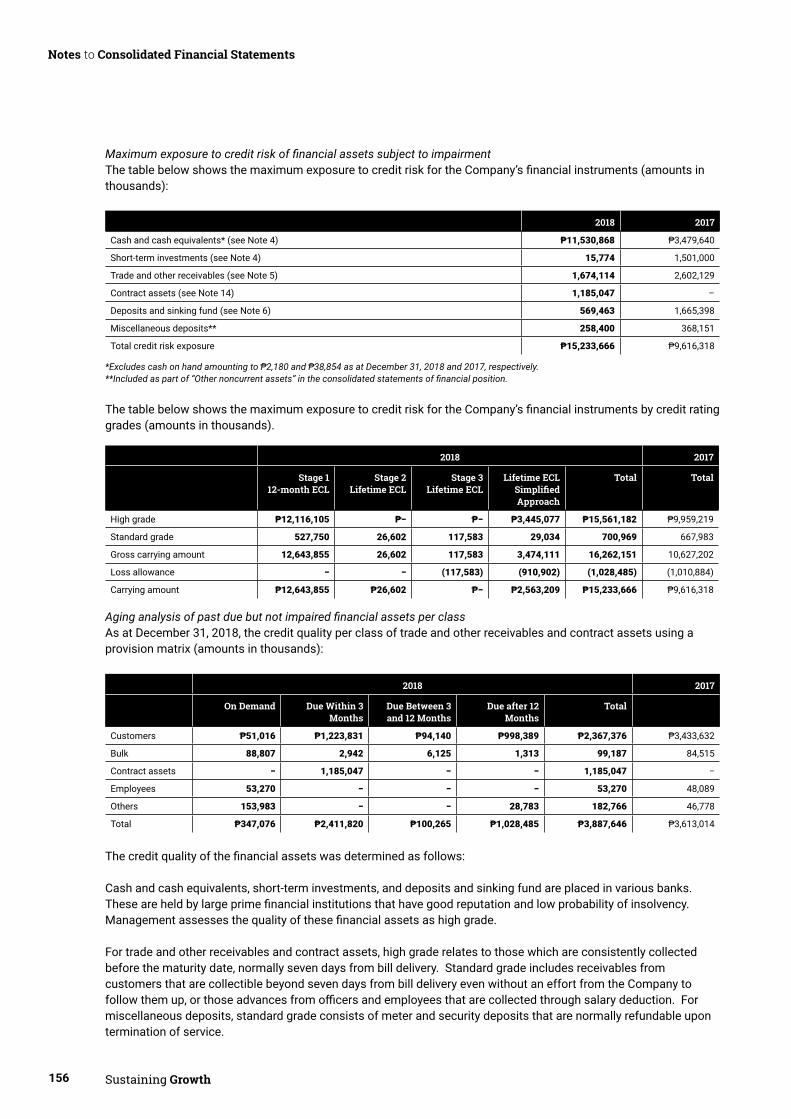
156 Sustaining Growth
Maximum exposure to credit risk of financial assets subject to impairmentThe table below shows the maximum exposure to credit risk for the Company’s financial instruments (amounts in thousands):
The table below shows the maximum exposure to credit risk for the Company’s financial instruments by credit rating grades (amounts in thousands).
Aging analysis of past due but not impaired financial assets per classAs at December 31, 2018, the credit quality per class of trade and other receivables and contract assets using a provision matrix (amounts in thousands):
The credit quality of the financial assets was determined as follows:
Cash and cash equivalents, short-term investments, and deposits and sinking fund are placed in various banks. These are held by large prime financial institutions that have good reputation and low probability of insolvency. Management assesses the quality of these financial assets as high grade.
For trade and other receivables and contract assets, high grade relates to those which are consistently collected before the maturity date, normally seven days from bill delivery. Standard grade includes receivables from customers that are collectible beyond seven days from bill delivery even without an effort from the Company to follow them up, or those advances from officers and employees that are collected through salary deduction. For miscellaneous deposits, standard grade consists of meter and security deposits that are normally refundable upon termination of service.
*Excludes cash on hand amounting to P2,180 and P38,854 as at December 31, 2018 and 2017, respectively.**Included as part of “Other noncurrent assets” in the consolidated statements of financial position.
2018 2017
Cash and cash equivalents* (see Note 4) P11,530,868 P3,479,640
Short-term investments (see Note 4) 15,774 1,501,000
Trade and other receivables (see Note 5) 1,674,114 2,602,129
Contract assets (see Note 14) 1,185,047 –
Deposits and sinking fund (see Note 6) 569,463 1,665,398
Miscellaneous deposits** 258,400 368,151
Total credit risk exposure P15,233,666 P9,616,318
2018 2017
Stage 1 12-month ECL
Stage 2Lifetime ECL
Stage 3Lifetime ECL
Lifetime ECL Simplified Approach
Total Total
High grade P12,116,105 P− P− P3,445,077 P15,561,182 P9,959,219
Standard grade 527,750 26,602 117,583 29,034 700,969 667,983
Gross carrying amount 12,643,855 26,602 117,583 3,474,111 16,262,151 10,627,202
Loss allowance − − (117,583) (910,902) (1,028,485) (1,010,884)
Carrying amount P12,643,855 P26,602 P− P2,563,209 P15,233,666 P9,616,318
2018 2017
On Demand Due Within 3 Months
Due Between 3 and 12 Months
Due after 12 Months
Total
Customers P51,016 P1,223,831 P94,140 P998,389 P2,367,376 P3,433,632
Bulk 88,807 2,942 6,125 1,313 99,187 84,515
Contract assets − 1,185,047 − − 1,185,047 −
Employees 53,270 − − − 53,270 48,089
Others 153,983 − − 28,783 182,766 46,778
Total P347,076 P2,411,820 P100,265 P1,028,485 P3,887,646 P3,613,014
Notes to Consolidated Financial Statements

FinancialStatements
MAYNILAD 2018 ANNUAL REPORT 157
Excessive risk concentrationGiven the Company’s diverse base of counterparties in its financial assets, it is not exposed to large or excessive concentrations of credit risk in any geographical region or industry.
Write-off policyThe Company writes-off a financial asset, in whole or in part, when the asset is considered uncollectible, it has exhausted all practical recovery efforts and has concluded that it has no reasonable expectations of recovering the financial asset in its entirety or a portion thereof. The Company writes off an account when either of the following conditions is met:
• unpaid bill(s) of former owner/tenant who can no longer be found. The amount to be written off shall be net of any customer deposit posted by the previous owner/tenant;
• the customer is deceased and left no estate, or the heir is not financially capable of settling the account;• the unpaid bill(s) of a customer who has been declared bankrupt by the court;• the filing of legal action to collect the unpaid bill(s) does not seem prudent under the circumstances, as
determined by the Legal and Regulatory Affairs (“LRA”); • a final judgment favoring the customer was issued in a case filed against the customer for collection of money.
In this case, the amount to be written off shall be equal to the amount recommended by the court;• any unpaid bills(s), more than three years old, of disconnected services and which remain uncollected after
exerting all diligent efforts, as supported by the disconnection letter and/or demand letter; and • the water service connection no longer exists and the customer has no other account with Maynilad.• The Company also monitors loans written-off and any recoveries made. There are no written- off receivables
during the current year.
Liquidity RiskLiquidity risk is the potential for not meeting the obligations as they become due because of an inability to liquidate assets or obtain adequate funding.
The Company monitors its risk to a shortage of funds using a recurring liquidity planning. Cash planning considers the maturity of both its financial investments and financial assets (e.g., trade and other receivables, other financial assets) and projected cash flows from operations. The Company’s objective is to maintain a balance between continuity of funding and flexibility through the use of bank drafts, bank loans and debentures.
The tables below summarize the maturity profile of the Company’s financial liabilities as at December 31, 2018 and 2017 based on contractual undiscounted payments.
2018
On Demand Due Within 3 Months
Due Between 3 and 12 Months
Due after 12 Months Total
Interest-bearing loans*
P– P702,490 P 4,182,525 P52,477,394 P57,362,409
Trade and other payables**
839,108 3,675,478 10,333,406 – 14,847,992
Service concession obligation payable to MWSS
– – 1,038,764 6,011,850 7,050,614
Customers’ deposits – – – 1,081,572 1,081,572
P839,108 P4,377,968 P15,554,695 P59,570,816 P 80,342,587 *Principal plus interest payment**Excludes taxes payable and interest payable

158 Sustaining Growth
The table below shows the maturity profile of the Company’s financial assets based on contractual undiscounted cash flows as at December 31, 2018 and 2017:
2017
On Demand Due Within 3 Months
Due Between 3 and 12 Months
Due after 12 Months Total
Interest-bearing loans*
P– P1,406,952 P2,001,405 P33,216,552 P36,624,909
Trade and other payables**
855,900 3,206,906 7,823,886 – 11,886,692
Service concession obligation payable to MWSS
– – 1,217,038 6,242,485 7,459,523
Customers’ deposits – – – 1,007,180 1,007,180
P855,900 P4,613,858 P11,042,329 P40,466,217 P56,978,304
*Principal plus interest payment**Excludes taxes payable and interest payable
2018
On Demand Due Within 3 Months
Due Between 3 and 12 Months
Due after 12 Months Total
Cash and cashequivalents
P1,635,351 P9,897,697 P– P– P11,533,048
Short-terminvestments
– – 15,774 – 15,774
Trade and other receivables
347,076 1,226,773 100,265 – 1,674,114
Contract assets – 1,185,047 – – 1,185,047
Deposits and sinking fund
– – 569,463 – 569,463
Financial assets at FVOCI
124,864 – – – 124,864
Miscellaneous deposits
– – – 258,400 258,400
P2,107,291 P12,309,517 P685,502 P258,400 P15,360,710
2017
On Demand Due Within 3 Months
Due Between 3 and 12 Months
Due after 12 Months Total
Cash and cashequivalents
P1,147,144 P2,371,350 P– P– P3,518,494
Short-terminvestments
– – 1,501,000 – 1,501,000
Trade and other receivables
1,223,734 1,161,888 216,507 – 2,602,129
Deposits and sinking fund
1,507,673 – 157,725 – 1,665,398
AFS financial assets 124,864 – – – 124,864
Miscellaneous deposits
– – – 333,004 333,004
P4,003,415 P3,533,238 P1,875,232 P333,004 P9,744,889
Notes to Consolidated Financial Statements

FinancialStatements
MAYNILAD 2018 ANNUAL REPORT 159
Capital ManagementThe primary objective of the Company’s capital management strategy is to ensure that it maintains a healthy capital structure in order to maintain a strong credit standing while it maximizes shareholder value.
The Company closely manages its capital structure vis-a-vis a certain target gearing ratio, which is net debt divided by total capital plus net debt. The Company’s target gearing ratio is 75%. This target is to be maintained over the next five years by managing the Company’s level of borrowings and dividend payments to shareholders. For purposes of computing its net debt, the Company includes the outstanding balance of its long-term interest-bearing loans, service concession obligation payable to MWSS and trade and other payables, less the outstanding cash and cash equivalents, short-term investments, deposits and sinking fund. To compute its capital, the Company uses net equity.
For purposes of monitoring debt ratio covenants, the Company computes using both interest-bearing debt and total liabilities. The Company closely monitors its debt covenants and maintains a capital expenditure program and dividend declaration policy that keeps the compliance of these covenants into consideration.
Fair Value of Financial Assets and Financial LiabilitiesThe following table summarizes the carrying values and fair values of the Company’s financial assets and financial liabilities as at December 31, 2018 and 2017:
The following methods and assumptions were used to estimate the fair value of each class of financial assets and financial liabilities for which it is practicable to estimate such value:
Cash and Cash Equivalents, Short-term Investments, Trade and Other Receivables, Deposits and Sinking Fund, and Trade and Other Payables. Due to the short-term nature of these transactions, the carrying values approximate the fair values as at the reporting date.
2018 2017
Interest-bearing loans and service concession obligation payable to MWSS (see Notes 10 and 11) P41,456,214 P34,556,609
Trade and other payables (see Note 12) 16,220,796 13,050,315
Less cash and cash equivalents, short-term investments, deposits and sinking fund (see Notes 4 and 6)
(12,118,285) (6,684,892)
Net debt (a) 45,558,725 40,922,032
Net equity 48,281,615 43,820,286
Net equity and debt (b) P93,840,340 P84,742,318
Gearing ratio (a/b) 49% 48%
25.
2018 2017
Carrying Value Fair Value Carrying Value Fair Value
Financial Assets
At amortized cost - Miscellaneous deposits (included under “Other noncurrent assets” account)
P276,620 P179,120 P333,004 P280,345
Financial Liabilities
Other financial liabilities:
Interest-bearing loans P34,405,600 P32,631,776 P27,097,086 P28,606,312
Service concession obliga-tion payable to MWSS
7,050,614 7,763,361 7,459,523 8,344,432
Customers’ deposits 349,479 290,620 320,347 344,165
P41,805,693 P40,685,757 P34,876,956 P37,294,909

160 Sustaining Growth
AFS Financial Assets. Fair value is equivalent to the carrying value because the Company’s AFS financial assets pertain to unquoted equity investments.
Interest-bearing Loans. For floating rate loans, the carrying value approximates the estimated fair value as at the reporting date due to quarterly repricing of interest rates. For fixed rate loans, the estimated fair value is based on the discounted value of future cash flows using the applicable rates for similar types of financial instruments.
Miscellaneous Deposits, Service Concession Obligation Payable to MWSS and Customers’ Deposits. Estimated fair value is based on the discounted value of future cash flows using the applicable rates for similar types of financial instruments.
The fair values of fixed rate interest-bearing loans, miscellaneous deposits, service concession obligation payable to MWSS and customers’ deposits are determined using Fair Value Hierarchy Level 3.
Supplemental Disclosure of Cash Flow Information
In 2018, the noncash operating activities pertain to MWSS loan drawdown for Angat Water Transmission Improvement Project (AWTIP) amounting to P168.6 million, borrowing costs capitalized as part of service concession assets amounting to P598.8 million and effect of change in rebase rates amounting to P648.9 million (see Note 7).
Events After the Reporting Period
On February 19, 2019, Amayi Water Solutions, Inc., a wholly-owned subsidiary of Maynilad Water Service, Inc., entered into a concession agreement with the Municipality of Boac, Marinduque. The concession agreement shall be effective for a period of 25 years beginning on the commencement date.
On February 26, 2019, during the regular meeting, the Parent Company’s BOD set and approved the declaration of cash dividends of P1,100.49 per common share amounting to P5.0 billion to all shareholders.
Changes in Liabilities Arising from Financing Activities
26.
27.
28.
January 1, 2018 Cash Flows Foreign Exchange Movement
Other* December 31, 2018
Current portion of interest-bearing loans (Note 11)
P1,816,070 (P18,487,067) P– P17,025,215 P354,218
Noncurrent portion of interest-bearing loans (Note 11)
25,281,016 25,582,742 247,994 (17,060,370) 34,051,382
Current portion of service concession obligation payable to MWSS(Note 10)
1,217,038 (1,007,342) 38,746 P790,322 P1,038,764
Noncurrent portion of service concession obligation payable to MWSS (Note 10)
6,242,485 – 186,425 (417,060) 6,011,850
Interest payable (Note 12) 357,011 (1,668,934) 26,775 1,708,790 423,642
Dividends payable(Note 13)
2,061 (2,999,548) – 3,000,000 2,513
Total liabilities from financing activities
P34,915,681 P1,419,851 P499,940 P5,046,897 P41,882,369
*Other includes the effect of reclassification of non-current portion of interest-bearing loans and service concession obligation payable to current due to passage of time, accrual of dividends, amortization of debt issue cost and accretion on service concession obligation payable.
Notes to Consolidated Financial Statements

FinancialStatements
MAYNILAD 2018 ANNUAL REPORT 161
29.
*Other includes the effect of reclassification of non-current portion of interest-bearing loans and service concession obligation payable to current due to passage of time, accrual of dividends, amortization of debt issue cost and accretion on service concession obligation payable.
January 1, 2017 Cash Flows Foreign Exchange Movement
Other* December 31, 2017
Current portion of interest-bearing loans (Note 11)
P1,808,101 (P1,808,101) P– P1,816,070 P1,816,070
Noncurrent portion of interest-bearing loans (Note 11)
24,879,755 2,077,784 (2,564) (1,673,959) 25,281,016
Current portion of service concession obligation payable to MWSS(Note 10)
1,328,978 (1,007,387) (191) 895,638 1,217,038
Noncurrent portion of service concession obligation payable to MWSS (Note 10)
6,500,131 – 23,056 (280,702) 6,242,485
Interest payable (Note 12) 347,100 (1,514,018) (18,437) 1,542,366 357,011
Dividends payable(Note 13)
2,639 (3,000,578) – 3,000,000 2,061
Total liabilities from financing activities
P34,866,704 (P5,252,300) P1,864 P5,299,413 P34,915,681
Reclassification
The Company made reclassification of advances to contractors amounting to P1.6 billion under the “Other current assets” account to “Other noncurrent assets” account in the consolidated statement of financial position as at December 31, 2017 to conform with the December 31, 2018 presentation.

Maynilad Water Services, Inc.MWSS Complex, Katipunan Ave., Balara
1119 Quezon City, Philippines
www.mayniladwater.com.ph981 3333