mayor’s citizen task force diego... · table of contents. introduction. task force findings and...
TRANSCRIPT

Mayor’s Citizen task ForCeon the san diego convention center projectFinal Report - September 2009
�
table oF Contents
Introduction
Task Force Findings and Recommendations
Executive Summary
I. The San Diego Convention Center: An Economic Engine......16
II. Market Demand and the Feasibility of an Expansion......19
III. Impact of the Economic Downturn on the Convention Industry......29
IV. Public Access, Resource Conservation & Waterfront Enhancements......34
V. Program for Proposed Convention Center Expansion......38
VI. Financing Options......45
VII. Potential Economic Impact......52
VIII. Public Comments and Letters......53
Appendices
• Appendix One: Task Force Mission......56
• Appendix Two: Meeting Schedule......57
• Appendix Three: Overview of Tourism Marketing Districts, Business Improvement Districts and Lease-Revenue Bonds......58
• Appendix Four: Agendas and Meeting Notes Web Site; Presentations Web Site; Other Meeting Documents and Reports; and Public Comments and Letters Web Site......59
• Appendix Five: Overview of Possible Revenue Sources......61

�
About the Task Force & Mission In January 2009, San Diego Mayor Jerry Sanders formed the Mayor’s Citizen Task Force on the Convention Center Project to evaluate and recommend the necessary steps to ensure San Diego’s ability to retain and enhance its market position in the convention and meeting industry.
Mayor sanders gave the Following Charge to the task ForCe:
• To review the state of the convention and meeting industry, San Diego’s success and profile among its competitive set, and
evaluate the market demand for an expanded facility.
• To review and evaluate the feasibility of an expansion to the current Convention Center and related developments or
enhancements and the impact on generating new jobs; and to identify key issues related to public access, resource
conservation and waterfront enhancement.
• To identify and evaluate various financing options for an expanded convention center that relies mainly on revenues
generated by the Convention Center and/or related developments or enhancements.
• To encourage public comment on the convention center project by holding meetings at locations and times accessible
to the public.
• To present a final set of findings and recommendations to Mayor Sander’s no later than September 2009. All meetings be
conducted in accordance with the Brown Act.
over the Course oF eight Months, the task ForCe ConduCted the Following:
• Launched and maintained a web site, www.conventioncentertaskforce.org where all materials were posted and public
comments could be made to the Task Force.
• Encouraged public and stakeholder participation.
• Convened 11 times at various times and locations, and held at least one meeting in each of the eight City Council Districts.
• Had 12 industry analysts and consultants present studies and industry trends during Task Force meetings. We encouraged
and received a range of viewpoints and,
• Received numerous comments regarding the various topics under discussion by the Task Force.
introduCtion

44
Co-Chairs Cheryl Kendrick, Co-Chair Stephen Cushman, Co-Chair
Members
• Richard Bartell
• Susie Baumann
• Gordon Boerner
• Patrick Duffy
• Bill Evans
• Pete Garcia
• Lorena Gonzalez
• Lani Lutar
• Fred Maas
• Mike McDowell
• Vince Mudd
• Bob Nelson
• Bill Sauls
• Mark Steele
• Diane Takvorian
TASK FORCE COMMITTEE CHAIRS AND MEMBERS
Cheryl Kendrick, Co-Chair
Cheryl Kendrick is the past board chair of both the San Diego Convention Center Corp. and the California State Commission on the Status of Women. She has served on the boards of the National Conference for Community and Justice and the Huntington’s Disease Society of America. Ms. Kendrick received her Bachelor of Arts degree in French from the University of Connecticut.
Stephen Cushman, Co-Chair
Stephen Cushman is president of Cushman Enterprises. He is currently the board chair of the Port Commissioners, board chair of the College of Business Administration at San Diego State University and board chair of the San Diego Hospital Association. Mr. Cushman holds a degree in business administration from California Western University.
Richard Bartell
Mr. Bartell is general partner of Bartell Hotels. He serves on the board of directors of the San Diego Tourism Promotion Corporation.
Susie Baumann
Susie Baumann owns the Bali Hai and Lighthouse restaurants in Shelter Island. Ms. Baumann is board treasurer for the California Restaurant Association and has served as a board member for the association since 1988. She currently serves as secretary for San Diego Convention and Visitors Bureau Board of Directors and is active in the Shelter Island Association.
Gordon Boerner
Gordon Boerner is senior vice president and administrative services manager of San Diego National Bank. Mr. Boemer serves on the San Diego Downtown Partnership Board of Directors and is board chair of the Local Initiatives Support Corporation.
�
Patrick Duffy
Patrick Duffy is general manager of the Hilton La Jolla Torrey Pines Hotel. Mr. Duffy currently serves as board president to the San Diego Hotel Motel Association. He is a member of the San Diego Tourism Promotion Corporation’s board of directors.
Bill Evans
Bill Evans is executive vice president of the Evans Hotel Group. Mr. Evans has served as a board member for the San Diego Convention Center Corporation, San Diego Regional Chamber of Commerce, California Hotel-Motel Association, San Diego Convention and Visitors Bureau and the San Diego Historical Society. He is currently a board member and past president & chair of the San Diego Hotel-Motel Association. Mr. Evans earned a degree from Cornell University’s School of Hotel and Restaurant Administration.
Pete Garcia
Pete Garcia is retired and previously served as president and CEO of the University Mechanical and Engineering Contractors. Mr. Garcia is chair of the San Diego Economic Development Foundation and is a member of the SDSU Science and Engineering Advisory Board. He previously served as vice chair of the State of California Commission for Economic Development. A native Cuban, Mr. Garcia graduated from the University of Florida with a degree in industrial engineering.
Lorena Gonzalez
Lorena Gonzalez is the secretary-treasurer & CEO of the San Diego and Imperial Counties Labor Council. She is the first woman to lead the Labor Council since its charter in 1902. Ms. Gonzalez previously served as the Labor Council’s political director from September 2006 to January 2008. A native San Diegan, Ms. Gonzalez holds degrees from Stanford University, Georgetown University and the UCLA School of Law.
Lani Lutar
Lani Lutar is president and chief executive officer of the San Diego County Taxpayers Association. She served as executive director of the Asian Business Association of San Diego and as a board member of the San Diego Asian Film Foundation and the Japan Society of San Diego and Tijuana. Ms. Lutar graduated from San Diego State University and earned a master’s degree from the School of International Relations & Pacific Studies at the University of California, San Diego.
Fred Maas
Fred Maas is the president and CEO of Black Mountain Ranch LLC. He is board chair of the Centre City Development Corporation. Mr. Maas is a founding director of Move San Diego and CleanTECH San Diego. He is an attorney and graduate of Hobart College and Syracuse University College of Law.
Mike McDowell
Mike McDowell is executive vice president for corporate affairs at Atlas Hotels and is CEO of the San Diego Lodging Industry Association. Mr. McDowell is also vice president of the House of Hospitality Association Board and board chair of the San Diego County Taxpayers Association. Mr. McDowell received his degree from University of the Redlands.
Vince Mudd
Vince Mudd is president and owner of Office Interiors, a full-service commercial design/build office interior firm. Mr. Mudd currently serves as board chair of the San Diego Red Cross and as treasurer of the San Diego Regional Economic Development Corporation. Mr. Mudd also serves as member to the City of San Diego’s Charter Review Committee as well as the State Compensation Insurance Fund’s Audit Committee.

�
Bob Nelson
Bob Nelson is the Vice Chair of the San Diego Convention Center Corporation Board of Directors. Mr. Nelson is an advertising and public relations executive with 30 years of experience in government and communications. His company, Bob Nelson Associates, advises a diverse list of clients, including public utilities, labor unions, and non-profit corporations. Mr. Nelson currently serves as Secretary-Treasurer of San Diego Theatres, Inc, manager of the San Diego Civic Theatre and Balboa Theatre.
Bill Sauls
Bill Sauls is an attorney with his own law firm is downtown San Diego practicing in the areas of business law and estate planning. With over 20 years of community involvement, he currently serves as a member of the Centre City Advisory Committee, on the Executive Committee and Board of Directors for the Downtown San Diego Partnership, and as a member of the Executive Committee and Board of Directors of the East Village Association.
Mark Steele
Mark Steele owns his own planning and architectural firm, The MW Steele Group. Mr. Steele previously worked with Dale Naegle Associates and served as chair of the City of San Diego’s Planning Commission, president of the San Diego Chapter of the American Institute of Architects, and president of Lambda Alpha International. Mr. Steele is a graduate of the University of Kentucky.
Diane Takvorian
Diane Takvorian is executive director and co-founder of the Environmental Health Coalition. She is the recipient of a 2008 James Irvine Foundation Leadership Award for her effective approach to creating a healthier environment for low income communities across the state. Ms. Takvorian earned a Bachelor of Science and a Masters of Social Work with public policy, community organization, and administration emphasis from San Diego State University.
Contents of this ReportThis report incorporates a summary of the Task Force’s final work and recommendations. We believe the recommendations
will ensure that Mayor Sanders has the information and facts to help guide his future actions related to expanding the San Diego
Convention Center.
�
task ForCe Findings and reCoMMendations
MissionThe mission of the Mayor’s Citizen Task Force on the Convention Center Project is to evaluate and recommend to Mayor Sanders the necessary steps required to ensure San Diego’s ability to protect and expand local jobs and retain and enhance its current market position in the convention and meeting industry.
Charge & FindingsTo review the state of the convention and meeting industry, San Diego’s success and profile among its competitive set, and evaluate the market demand for an expanded facility;
Finding: It is the view of the Task Force that an expanded Convention Center would provide a significant positive economic impact to our City and region.
To review and evaluate the feasibility of an expansion to the current Convention Center and related developments or enhancements and the impact on generating new jobs;
Finding: It is the view of the Task Force that expansion of the Convention Center is feasible and that new jobs will be generated.
To identify and evaluate various financing options for an expanded convention center that relies mainly on revenues generated by the Convention Center and/or related developments or enhancements
Finding: It is the view of the Task Force that various financing options have been identified and evaluated relative to Convention Center Expansion.
To identify key issues related to public access, resource conservation and waterfront enhancement;
The role of the Task Force has not been to review design and planning issues, however brief presentations have been made to illustrate site capacity and potential massing of Phase 3 which have identified some overall design subjects of concern. Recognizing that the impact of Phase 3 on the public realm surrounding the Convention Center is important to the Citizens of San Diego and influences their City’s relationship to the bay;
Finding: It is the view of the Task Force, that in order to respect and improve public access and environmental conditions at the waterfront, urban design, sustainability and environmental guidelines should be adopted for the design of Phase 3.
To encourage public comment on the convention center project by holding meetings at locations and times accessible to the public;
Finding: It is the view of the Task Force that our meetings have been accessible and public comment encouraged.
To present a final set of findings and recommendations to Mayor Sander’s no later than September 2009. All meetings will be conducted in accordance with the Brown Act.
Recommendations: Based on seven months of testimony and presentations it is the view of the Task Force that we recommend to the Mayor that, based on the findings herein, he: finalize the scope and cost of the proposed Convention Center expansion project; work with the primary stakeholders to identify the revenue and financing necessary to bring it to fruition; then move forward on the expansion of the Convention Center.

�
exeCutive suMMary
In January 2009, San Diego Mayor Jerry Sanders formed the Mayor’s Citizen Task Force on the Convention Center Project to evaluate and recommend the necessary steps required to ensure San Diego’s ability to retain and enhance its current market position in the convention and meeting industry. Seventeen members of the public have served 8 months, attended 11 meetings, and heard a dozen professional presentations and numerous comments from the public in an effort to complete our evaluation and make our recommendations. Attached to this summary are documents, presentations and links to additional materials that were given to the Task Force over its tenure. They are provided as reference and resource to our conclusions here.
The San Diego Convention Center has proven to be a powerful economic engine for the City of San Diego and the entire local region. Since opening in 1989 it has hosted over 4,000 events that utilized more than 10 million hotel room nights. It is estimated that the economic impact of these events has been more than $17 billion to the region. Currently, more than 12,000 local jobs are directly connected to, or indirectly supported by, events held in the current facility. In addition, the convention center has been a catalyst for substantial change within our community, helping to transform downtown into a vibrant urban setting, complete with hundreds of restaurants, shops, entertainment venues and attractions that not only serve visitors but local residents as well.
As the numbers and concepts submitted above are a significant, measurable return on investment to our community, it is important to establish that the San Diego Convention Center is not a tourist attraction. In fact, the meeting and convention business has relatively little to do with the leisure sector that makes up the bulk of tourism here and throughout most of the world. Conventions and convention centers are more closely aligned with business and economic development than tourism. The nexus between the meetings and convention market and leisure tourism is the common need for accommodations, transportation and other destination amenities. Meetings and conventions are typically a business-to-business enterprise, focused on unique markets, reached through unique messaging, and not consumer driven like tourism; a single sale of a meeting can generate thousands of visits. Following this model, the San Diego Convention Center has proven to be an efficient and effective economic engine that delivers multiple levels of economic impact throughout our community.
Yet, while the convention industry is not about tourism, it nevertheless supports tourism, in many different ways. First, meetings and conventions grow the visitor base by attracting people who are coming to town to attend their event, not necessarily having chosen our destination exclusively on its own merits. As a result, the convention attendees are typically incremental visitors consisting of people who might otherwise not come at all. And it’s not just that they come, it is when they come – often at times of the year when other kinds of visitors can’t or won’t. This off-season and incremental business helps support and maintain the tourism infrastructure and jobs, such as hotels, attractions, and transportations services so that they are plentiful and available to support all of the other types of visitors. Additional benefits delivered by convention attendees include pre-or-post-event tourist experiences, return visit opportunities, and community prestige generated by a major national or international event.
The premise and measure of success of publicly funded municipal convention facilities is not without its critics. In an examination of the convention business and city and state spending on host venues, Heywood Sanders, PhD, a professor from the Department of Public Administration at the University of Texas at San Antonio, in a 2005 Research Brief published by the Brookings Institute finds that, “conventions are big business, attracting free-spending visitors booking downtown hotel rooms, eating at restaurants, and thronging theaters and night spots. At any rate, that’s the theory. So in the last decade, state and local governments have made massive commitments to tourism and conventions as part of their central economic development strategies. From Atlanta to Austin, Charlotte to Chicago, cities, states, and public authorities have invested billions in an arms race with competing cities to lure conventions and their attendees to new or expanded convention centers. Many of these same places have also invested in publicly-owned hotels, new and expanded airports, and downtown-oriented rail transit systems, all designed to support their hunt for conventions and trade shows.
“However, while the supply of exhibit space in the United States has expanded steadily, the demand for convention and tradeshow exhibit space, and the attendees these events bring to a city, has actually plummeted. Many cities have seen their convention attendance fall by 40 percent, 50 percent, and more since the peak years of the late 1990s. The sharp drop has occurred across a range of communities, including a number of the historically most successful convention locales in the nation.” Yet Dr. Sanders concludes his brief by acknowledging “there is no doubt that local meeting and
�
event space provides an important public amenity for communities of all sizes. And few would disagree that even large-scale convention centers can be an asset for certain highly competitive cities, and certainly for the industries and visitors they host.” (Emphasis added)
Dr. Sanders is right, not every city, Austin or Charlotte, Bemidji or Boise, or any of the dozens of other proud municipalities, that are second, third or even fourth tier meetings markets, can successfully support a major convention venue. But he recognizes that “certain highly competitive cities,” like San Diego can be and are successful for reasons that go far beyond bricks and mortar. The San Diego Convention Center, over its 20 year history, has a demonstrated track-record of attracting valuable meetings and conventions to our destination, and then leveraging the venue, first-class service, and the West Coast “wow” factor to establish relationships that ensure their return. They have been so successful that an expansion of the convention center completed in 2001 can no longer meet the current demand. According to Michael Hughes of Tradeshow Magazine, San Diego Convention Center has the brand, team, track record, experience, location, demographics, airport and hotel partners, but NOT the venue size to compete at the highest level of the convention and tradeshow industry.
The Mayor has asked what it would take to attain that highest competitive level. To that end we have attempted to succinctly address the Mayor’s charge in this document and in the supporting documents and information.
To review the state of the convention and meeting industry, San Diego’s success and profile among its
competitive set, and evaluate the market demand for an expanded facility.
State of the convention and meeting industry –
• Historically, the convention and exhibition industry experiences a 10 to 12 year business cycle that moves through expansion
to peak, into slowdown then recovery, before expanding again. The current state of the convention and meeting industry, as
with the economy in general, is in a period of slowdown, and is expected to recover with the economy. And while the current
recession is having a negative impact on attendance, number of exhibitors, and association spending the long term
importance of conventions and tradeshows remains unchanged to their underlying industries.
• Large conventions and tradeshows are not immune to economic downturns but they are the most resilient types of meeting
events by far. In fact attendance rebounded quickly (2 Qtrs.) following the 1991 recession. After 9/11, the industry began to
grow in early 2003, with strong growth until the first quarter of 2008.
San Diego’s success and profile among its competitive set –
• Few major conventions and tradeshows are launched annually therefore the “supply of demand” is relatively static. Yet, San
Diego has been able to effectively compete for the finite number of available conventions with several well documented
features and benefits, that include:
4 Authentic city experience, with optimal weather
4 Great, unique convention district, hotels; good hotel supply near SDCC
4 Tourism amenities, Waterfront area, Gaslamp, etc.
4 Diverse business community; demographics
4 One of the closest convention centers to a major airport
4 Well respected and experienced SDCC staff
4 SDCC high occupancy, near full capacity, demonstrates user confidence

10
• Nationally, there has been a 25 year convention center building and expansion boom, which is still underway. As a result, available convention center space in the United States has grown by 95%, nearly doubling over the twenty-year period 1988 to 2008. During this growth, in addition to publicly owned facilities, hotels have invested aggressively in convention and meeting facilities (i.e., Gaylord, Las Vegas, and other leading hotel owners/managers).
• This expansion and building boom, while slowed by the current recession, continues with 5.8 million square feet of new space in the pipeline.
• San Diego Convention Center Competitive Set Expansion Planning and Build-out
4 McCormick Place in Chicago added 500,000 sq. ft. of exhibit and meeting space in 2007 (to reach a total of 2.7 million sq. ft.)
4 Phoenix Convention Center added over 400,000 sq. ft. in 2008
4 Anaheim Convention Center is studying expansion/renovation
4 Las Vegas Convention Center is planning a major $800 million renovation (on hold)
4 San Jose McEnery Convention Center is studying expansion/renovation
4 Washington State Convention Center in Seattle is studying expansion/renovation
4 Ernst N. Morial Convention Center in New Orleans is planning a renovation
4 Salt Palace Convention Center in Salt Lake City expanded in 2006 to 700,000 sq. ft.
4 Los Angeles Convention Center and Staples Center district – new hotels and LA Live project
4 Moscone Convention Center in San Francisco-a 25% expansion with 180,000 square feet of new meeting space.
• When measured by gross square feet, the San Diego Convention Center is ranked 24th nationally among all venues. And most importantly, by the same measure, is ranked 8th among its primary competitors in the West.
• The most vocal critic of publicly funded convention centers, Dr. Heywood Sanders of the University of Texas at San Antonio, when asked by Task Force members about San Diego Convention Center’s relative performance against its competitors, characterized San Diego as a “conundrum.” In 2004, when asked about the then three year old expansion of the convention center he said, “(T)here are two places that have historically done well in expanding their convention business: that’s Las Vegas and Orlando. And historically, they have managed to grow their business with great regularity. New Orleans for a long time in the 1990s seemed to be successful. Anaheim and San Diego may, but because of a lack of available information that I’ve been able to get my hands on, it’s not entirely clear. But there’s something in common certainly about the first two of
them, and to some extent, about the other three, that’s worth noting.”
• General Success Factors for Convention Centers:
4 Center able to meet market expectations
4 Strong and visible reputation for quality
4 A balanced destination package
4 Attractive destination to drive attendance
4 Business, academic, professional links
4 Center well integrated with the city
4 Responsive to evolving trends (flexibility)
4 Diversified business base

11
• What’s Driving San Diego’s Success?
4 Center “delivers the destination,” West Coast wow factor
4 High service, facility standards
4 Facility evolved with market opportunity
4 Hotel growth has kept pace
4 Integration of center precinct / city
4 Highly focused marketing process
4 Diversified business base
4 Community engagement and support
• Established Centers Have an Advantage
4 They have a business history as a base for their projections
4 They understand how various destination components interact
4 They have a “captive” sample as a base for accurate survey data
4 They understand their clients evolving needs
4 Lost business reports quantify demand
Market demand for an expanded facility –
• For the past several years market demand has surpassed the current supply of space the building offers. In fact, 39.7% of
prospective customers that do not book San Diego Convention Center attribute that decision to “Center Unavailable,” or a lack
of space. As a result SDCC is losing many highly desirable and lucrative events to our competitor cities.
• These loses are not only existing business outgrowing the building, but fresh, new business that would like to come to San
Diego, but simply can not be accommodated because the building is too small. While it is not assumed that all lost business
would eventually be captured as a result of the proposed expansion, the additional space would allow the San Diego
Convention Center to aggressively compete for new business from among a pool of customers desiring (demanding) to come
to San Diego. Over the recent past, this pool of lost business translated into substantial prospective room nights:
4 810,000 room nights lost in 2006
4 975,000 room nights lost in 2007
4 705,000 room nights lost in 2008
• There are over 100 major shows that need between 600,000 and 800,000+ gross square feet of exhibit space (expanded size)
that average 20,000+ in attendance. Annually booking only three to five of these types of new events alone would make the
expansion successful in terms of new economic impact.
• It is an industry idiosyncrasy that there are really only about 20 weeks of the year that meeting planners consider “prime” for
major meetings and conventions, and as a result of the current size limitations, 40% of the convention centers “lost business”
can’t get prime dates in the Winter, Spring and Fall. Expansion will create demand through flexibility, with the opportunity to
hold a range of events simultaneously, such as two large events that require 300,000 to 400,000 gross square feet each.

1�
• Customer (meeting planner) interviews unequivocally reflect a perception that San Diego is one of the most desirable (in
demand) destinations in North America for meetings business. This is borne out by the Center’s occupancy data that far
exceeds the national average.
• Demand will be generated by keeping current clients that are growing, and will grow again following the recession, in San
Diego – this would be particularly true of major medical shows that rotate through the country’s other leading venues.
• Summary Points of Demand as Presented by Michael Hughes:
4 Center is operating at or above practical maximum capacity
4 Loss of potential business most frequently due to lack of available dates/space
4 San Diego’s hotel supply has continued to expand
4 Competitors are moving forward with enhancements
4 Past and potential customers have expressed interest in an expanded Center
4 Past events have and existing events are at risk of outgrowing the Center
4 There is room night loss from these events outgrowing the Center
4 Center has outperformed many of its competitors and the industry
To review and evaluate the feasibility of an expansion to the current Convention Center and related developments or enhancements and the impact on generating new jobs; and to identify key issues related to public access, resource conservation and waterfront enhancement.
• The San Diego Convention Center generates high valued visitors. There were more than 630,000 registered attendees for
primary events at the SDCC during 2007. Including non-registered friends and relatives in the event attendee’s travel group, there
were an estimated 743,000 convention center visitors to San Diego. About 84% (625,500 est.) of the SDCC visitors reported hotel
accommodations in San Diego and they reported an average of almost 1.4 people per room. The average length of hotel stay was
3.73 nights generating an estimated 1,688,000 total hotel room nights during 2007.
• The 630,000 primary event attendees spent an average of $1,462 each in San Diego (vs. $458 for all other overnight visitors).
This generated total direct spending of almost $921 million in San Diego. Lodging spending generated by San Diego Convention
Center primary events totaled nearly $374 million including about $35.5 million in transient lodging taxes.
• There is a convention and tradeshow “ecosystem” in San Diego that benefits greatly from the success of the convention
center, delivering economic benefit far beyond the convention center and hotels. That “ecosystem” represents:
4 Visits to Restaurants 92%
4 Other Entertainment 52%
4 Shopping 44%
4 Stay-over Post-event 25%
4 Pre-Event Sight-seeing 19%
4 Cultural & Education 17%
4 Sports Events 12%

1�
4 Other Activities 10%
4 Outdoor Recreation 6%
4 Family Events 2%
• Of 381 events turned away,
4 89% could be accommodated by an expansion of 225,000 sq. ft.
4 82% could be accommodated by an expansion of 175,000 sq. ft.
• Architects presented a proposal for a feasible contiguous expansion on the 5th Avenue site that features:
4 197,665 sq ft. Exhibition Hall on Level 2
4 108,000 sq. ft. Meeting Room(s)
4 80,000 sq. ft. Ballroom
4 154’ Overall Building Height
4 Creative suggestions for
n Public Access – an elevated pedestrian bridge over Harbor Dr.
n Resource Conservation – rooftop solar generated electricity
n Waterfront Enhancement – retail promenade at the waterfront
• Assuming an expansion of 225,000 sq. ft. of Exhibit Space and a total of 1,219,400 sq. ft. of Indoor Rentable Space, the annual
economic impacts are projected to be:
4 Economic Impacts:
n $372 Million per year in Direct Spending.
n $698 Million per year in Countywide Economic Impact
n 6,885 new permanent jobs created
4 Hotel Sector and City Tax Revenues:
n $155.6 Million per year in gross room sales for hotels
n $17.1 Million per year in Direct City Tax Revenues
• $16.3 Million per year in Transient Occupancy Tax
• $ 0.8 Million per year in Sales Tax
• The goal for the San Diego Convention Center is to host more large shows (that don’t fit currently); and host more events
simultaneously; and make move-in/move-out more efficient, therefore the highest probability for success could be expected
from an expansion that utilizes contiguous space.
• A non-contiguous building if it is further than directly across the street, is not an expansion by definition to meeting planners
– it would result in two completely different venues; basically no major conventions and tradeshows (or consumer shows)
would book both venues at the same time.

1�
• 86% of convention and tradeshow producers say their IDEAL convention center has the primary exhibition hall in one building,
on one level.
• 61 % of Convention Center GM’s surveyed in 2009 responded with “all in one facilities” when asked, “(W)hat types of new
convention center new build and expansion projects will be the most common going forward?”
• Fundamental assumptions to financing/funding the Convention Center expansion:
4 Do not utilize any General Fund revenue not currently utilized or obligated for Convention Center Bond debt service;
4 Revenue for expansion must come from sources that have a nexus of benefit from the expanded Center;
4 Revenue available for Center expansion may not be available for other civic purposes because it may only be available due to a
direct measurable benefit.
• Construction Consultant Estimates: (as of July 6, 2009)
4 Gross square footage 1,266,719 GSF
4 Building cost $710.8 million
4 Pedestrian bridge cost $41.9 million
4 Total Cost $752.7 million
4 Estimated annual debt obligation of $52.98 million.
• Possible Revenue Sources (to meet bond obligation):
4 Adjacent, new convention center hotel
n Residual cash flow
4 Convention Center Retail
n Net income
4 Convention Center Hotel Business Improvement District Assessment
n By geographic proximity to Center
4 Convention Center Entertainment District Assessment
n All non-hotel businesses, by geographic proximity to Center
4 Convention Center Restaurant Business Improvement District Assessment
n By geographic proximity to Center
4 Convention Center Parking District (BID)
n By geographic proximity
4 Convention Center Taxi District
n Drop-off/Pick-up Surcharge
4 Rental Car Surcharge
4 Convention Center Service Contractor Fee
4 Incremental Convention Center Parking Fees
n 100% of all above 2007 baseline
4 Contribution of land and other concessions from Unified Port of San Diego

1�
4 Contribution from other public entities included CCDC and County of San Diego.
• The American Hotel & Lodging Industry Association, in its report IMPACT of Room Tax Increases on the Lodging Industry,
concludes that, “non-travel earmarked uses of bed taxes do not benefit tourism and act only as a travel deterrent by increasing a
guest’s cost without attracting more guests.” That “the negative impact of bed taxes can be mitigated if they are used for travel
promotion.” And that “a number of markets designate a portion of the bed tax to support convention and visitor bureaus, travel
advertising and other activities aimed at increasing travel and tourism.”
• Several Task Force members expressed concern about how the impact of increased supply in the market may have an impact
on the price the San Diego Convention Center can charge, and therefore the revenue which will be generated from an expansion
to support operations.
To encourage public comment on the convention center project by holding meetings at locations and
times accessible to the public;
• Over the course of 8 months the Citizens Taskforce on the Convention Center Project:
4 Launched and maintained a web site, www.conventioncentertaskforce.org where all materials were posted and public comments
could be made to the Task Force;
4 Encouraged public participation;
4 Met 11 times at various locations and held at least one meeting in each of the 8 City Council Districts;
4 Had 28 speakers from the public participate in Public Comment;
4 Received 39 correspondence/written comments regarding the activities of the Task Force.
1�
i.) the san diego Convention Center:an eConoMiC engine
Finding: It is the view of the Task Force that an expanded Convention Center would provide a significant
positive economic impact to our City and region.
The San Diego Convention Center has been a powerful economic engine for the City of San Diego and the entire local region. Since opening in 1989 the facility has hosted over 4,000 events that utilized more than 11 million hotel room nights. It is estimated that the economic impact of these events has been more than $18 billion to the region. Currently, more than 12,000 local jobs are directly connected to or indirectly supported by events held in the current facility.
In addition, the convention center has been a catalyst for substantial change within our community, helping to transform downtown into a vibrant urban setting, complete with hundreds of restaurants, retail shops, entertainment venues and attractions that not only serve visitors but local residents as well.
It is important to consider that conventions and convention centers are more closely aligned with business and economic development than tourism, according to industry expert Rod Cameron who presented “Making Sense of Today’s Convention Industry” to the Task Force. Meetings and conventions are typically a business-to-business enterprise and are not consumer driven like tourism. In fact, a single booking of a convention and meeting can generate thousands of visits to the City. Following this model, the San Diego Convention Center has proven to be an efficient and effective economic engine that delivers multiple levels of economic impact throughout our community.
While the convention industry is not primarily about tourism, it nevertheless supports tourism in many ways. The nexus between the meetings and convention market and leisure tourism is the shared need for hotel accommodations, transportation and other destination amenities. Meetings and conventions grow the visitor base by attracting people who come to town to attend events, not necessarily having chosen our destination exclusively on its own merits. As a result, convention attendees are typically incremental visitors consisting of people who might otherwise not visit the City at all.
Meetings and conventions are also often held at times of the year when other kinds of visitors do not visit the City. This off-season and incremental business helps support and maintain the tourism infrastructure and jobs at hotels, attractions and transportation providers. Additional benefits derived from convention attendees include pre- or-post-event tourist experiences, return visits, and the community prestige generated by hosting a major national or international event.
These event attendees and “business tourists” help support a meeting and convention “ecosystem” of jobs, services and facilities in San Diego. The heart of this ecosystem is the San Diego Convention Center, which delivers economic benefit well beyond the activities in the Center and hotels. According to a January 2009 study of U.S. convention and tradeshow producers conducted by Tradeshow Week, the following activities represent the behavior of at least 25% of event attendees when they are “in-town” for an event:
• Visit restaurants: 91%
• Participate in “Other Entertainment”: 52%
• Shopping: 44%
• Stay Over in the City or Region Post-Event: 25%
• Arrive Early for Pre-Event Site-Seeing: 19%
• Cultural and Educational Activities: 17%
• Sports Events: 12%
• Outdoor Recreation: 6%
• Family Events: 2%
• Other Activities: 10%

1�
The same survey found that event producers estimate that 17% of their event attendees bring a spouse or friend with them to the event host city.
San Diego Convention Center Record of SuccessThe results over the last two decades tell a story of success that has made San Diego the envy of our competition in the meeting and convention industry:
• $18.3 billion in regional economic impact.
• $7.6 billion in direct attendee spending.
• $364.4 million in tax revenues.
• 11 million hotel room nights for city hoteliers.
• Over 1,000 conventions and trade shows.
• More than 3,000 other community and local events.
• 15.8 million guests, including 7.7 million out-of-town visitors who spend money in our hotels, restaurants and attractions,
infusing fresh dollars into our local economy.
Conventions translate into results for taxpayers. And an expansion would increase both economic impact and tax revenue at a time when new sources of revenue to fund city services are needed.
San Diego Convention Center Visitor Profile The San Diego Convention Center generates both high value and high spending visitors. According to the 2007 San Diego Visitor Profile Study by CIC Research, there were more than 630,000 registered attendees for primary events at the San Diego Convention Center during 2007. Including non-registered friends and relatives in the event attendee’s travel group, there were an estimated 743,000 San Diego Convention Center visitors to San Diego. About 84% (625,500 est.) of the San Diego Convention Center visitors reported hotel accommodations in San Diego and they reported an average of almost 1.4 people per room. The average length of hotel stay was 3.73 nights generating an estimated 1,688,000 total hotel room nights during 2007. This clearly shows that while the facility only reports an estimated 744,782 hotel room nights, in reality due to people that book “outside of the block” the Center is generating an estimated 1.688 million room nights.
The 630,000 primary event attendees spent an average of $1,462 each in San Diego (vs. $458 for all other overnight visitors). It is important to note that these are the highest value visitors for San Diego as they spend three times more than the typical tourist.
average attendee & visitor spendingPer SDCC Attendee $1,462
Per SD Overnight Visitor $458
These visitors generated total direct spending of almost $921 million in San Diego. Lodging spending generated by San Diego Convention Center primary events totaled nearly $374 million including about $35.5 million in transient lodging taxes.

1�
Source: CIC; * Spending by category includes all applicable taxes and tips.
Convention Center visitors spend money throughout the local economy in hotels, restaurants, shops. According to CIC Research, Inc., the table below outlines the significant spending by category by convention attendees compared to traditional visitors
A Critical Part of Downtown RedevelopmentThe San Diego Convention Center has been and is expected to continue to be a key driver of downtown redevelopment. The Center helps contribute to new revenues to fund essential city services.
Jeff Graham, Assistant VP of Redevelopment with the Center City Development Corporation presented “A Vision for the Future” to the Task Force which outlined the redevelopment impact. According to Mr. Graham, the Convention Center has served as an anchor for downtown redevelopment and holds the key to our city’s future economic success. The Convention Center has been a catalyst for revitalizing a blighted and often forgotten downtown. It transformed the area into a vibrant and exciting place that visitors and locals both enjoy. New restaurants, shopping and beautification programs were launched, and thousands of jobs were created. New hotels sprang up along Tideland Property and in the City center to support Convention Center events. The Gaslamp Quarter has gone through a renaissance and boasts over 100 casual and fine dining options, boutiques and galleries, arts and cultural venues, and world-class entertainment. These businesses generate millions of dollars in tax revenue for the Port to serve the public interests and for the City of San Diego’s general fund.
As a result of the Phase II Convention Center expansion completed in 2001, hotel development boomed. A few of the new hotel projects developed in the last five years include:
• Omni San Diego
• Hotel Solomar
• Hard Rock Hotel
• US Grant (restoration project)
• Hilton San Diego Bayfront
It is clear that the San Diego Convention Center is a vital part of the San Diego economy. Opened in 1989, then expanding in 2001, the convention center has helped make San Diego one of the top 10 convention and meeting destinations in North America. With tourism being the third largest industry in San Diego, the focus of the Mayor’s Task Force was to evaluate and recommend the necessary steps to ensure the City’s ability to retain and enhance its strong market position and continue to be a critical engine economic development.

1�
ii.) Market deMand and theFeasibility oF an expansion
Finding: It is the view of the Task Force that an expanded Convention Center would provide a significant
positive economic impact to our City and region.
One of the critical questions examined by the Task Force focused on if there is sufficient demand by conventions, tradeshows and meetings to drive significant new economic impact for an expanded San Diego Convention Center.
The specific requirement from Mayor Sanders was:
• To review the state of the convention and meeting industry, San Diego’s success and profile among its competitive set, and
evaluate the market demand for an expanded facility.
A number of industry consultants and analysts presented studies to the Task Force on convention and meeting industry trends and San Diego’s current industry standing and projected demand for an expansion. The studies found that there is indeed strong market demand by convention, tradeshow and meeting planners for an expanded San Diego Convention Center. A summary of these findings and opinions are provided in this section of the report.
The San Diego Convention Center – An Industry Leader Michael Hughes with Tradeshow Week presented an overview of the convention and tradeshow industry and San Diego’s standing in the industry to the Task Force. Some of the key issues impacting the San Diego Convention Center include:
• The Center is operating at or above practical maximum capacity.
• The loss of potential business is most frequently due to lack of available dates/space.
• Past and potential customers have expressed interest in an expanded Center.
• Past events have and existing events are at risk of outgrowing the Center.
• San Diego’s hotel supply has continued to expand.
• There is hotel room night loss from these events outgrowing the Center.
• Competitors are moving forward with venue expansions and enhancements.
• Center has outperformed many of its competitors and the industry.
Michael Hughes pointed out that few major conventions and tradeshows are launched annually and therefore, the “supply of demand” is relatively static. Yet, San Diego has been able to effectively compete for the finite number of available conventions with several well documented features and benefits that include:
• An authentic city experience, with optimal weather.
• A unique convention district with excellent hotel supply near the Convention Center.
• World class tourism amenities, Waterfront area, Gaslamp, etc.
• Diverse business community and professional demographics.
• One of the closest convention centers to a major airport.
• High Center occupancy, near full capacity, demonstrating user confidence.

�0
In short, the City of San Diego and the San Diego Convention Center are leading convention and meeting destinations and are held in high standing by event planners. But more exhibition space capacity is needed. Michael Hughes also pointed out that it can be argued there is a disconnect in San Diego between the level of convention hotel room capacity and exhibition space. When measured by gross square feet, the San Diego Convention Center is ranked 24th nationally among all venues. Additionally, the City is ranked 8th among its primary competitors in the West in terms of total number of hotel rooms near-by the Convention Center. This is actually a good development as meeting and convention planners require quality hotel capacity near-by their convention centers.
Projected Performance vs. Actual PerformanceThe track record shows that the original convention center development and the Phase II expansion in 2001 were highly successful. The table below outlines the projected performance vs. actual when the original Convention Center was planned, then opened and the second expansion against projections.
Convention Center Original Projections vs. Actual Performance
Gladstone1 93-97 Actuals2
Primary Event Attendance 372,860 282,133
TOT3 $11,465,689 $11,971,057
Primary Events 35 53
Source: Gladstone
Convention Center Expansion: PricewaterhouseCoopers Original Projections vs. Actual Performance
1 Amounts are stabilized year estimates per Gladstone study.2 Gladstone amount provided ($4,840,000.) has been escalated to mid-point of stabilized years (FY 1995) and at 9.0% hotel tax rate. 3 Amounts are averages from initial stabilized years (FY 1993 - FY 1997) and calculated at 9.0% hotel tax rate.4 Amounts are “midpoint” estimates from PwC 1991 Expansion Analysis.
Source: Pricewaterhouse Coopers
Primary Business Attendance 430,0004 553,4555
TOT6 $11,381,202 $24,865,010
Exhibit Hall Occupancy 55.0% 73.1%
PricewaterhouseCoopers Actual
�1
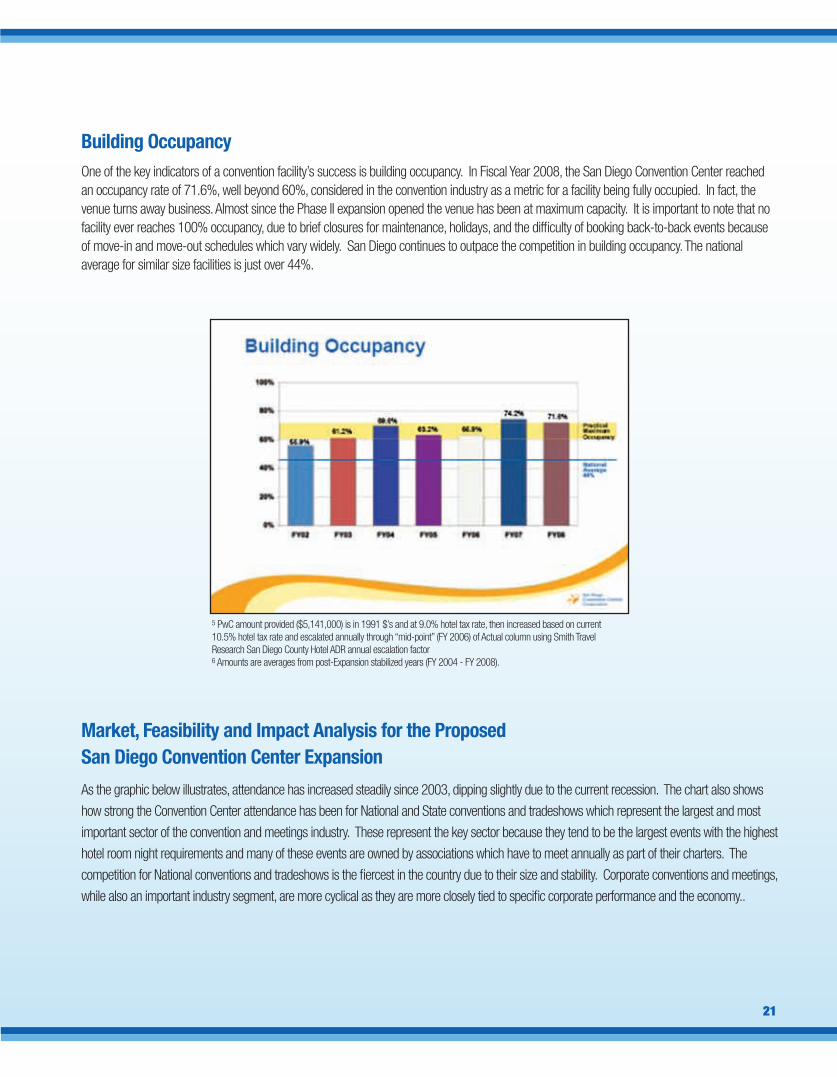
Building OccupancyOne of the key indicators of a convention facility’s success is building occupancy. In Fiscal Year 2008, the San Diego Convention Center reached an occupancy rate of 71.6%, well beyond 60%, considered in the convention industry as a metric for a facility being fully occupied. In fact, the venue turns away business. Almost since the Phase II expansion opened the venue has been at maximum capacity. It is important to note that no facility ever reaches 100% occupancy, due to brief closures for maintenance, holidays, and the difficulty of booking back-to-back events because of move-in and move-out schedules which vary widely. San Diego continues to outpace the competition in building occupancy. The national average for similar size facilities is just over 44%.
5 PwC amount provided ($5,141,000) is in 1991 $’s and at 9.0% hotel tax rate, then increased based on current 10.5% hotel tax rate and escalated annually through “mid-point” (FY 2006) of Actual column using Smith Travel Research San Diego County Hotel ADR annual escalation factor6 Amounts are averages from post-Expansion stabilized years (FY 2004 - FY 2008).
Market, Feasibility and Impact Analysis for the Proposed San Diego Convention Center Expansion
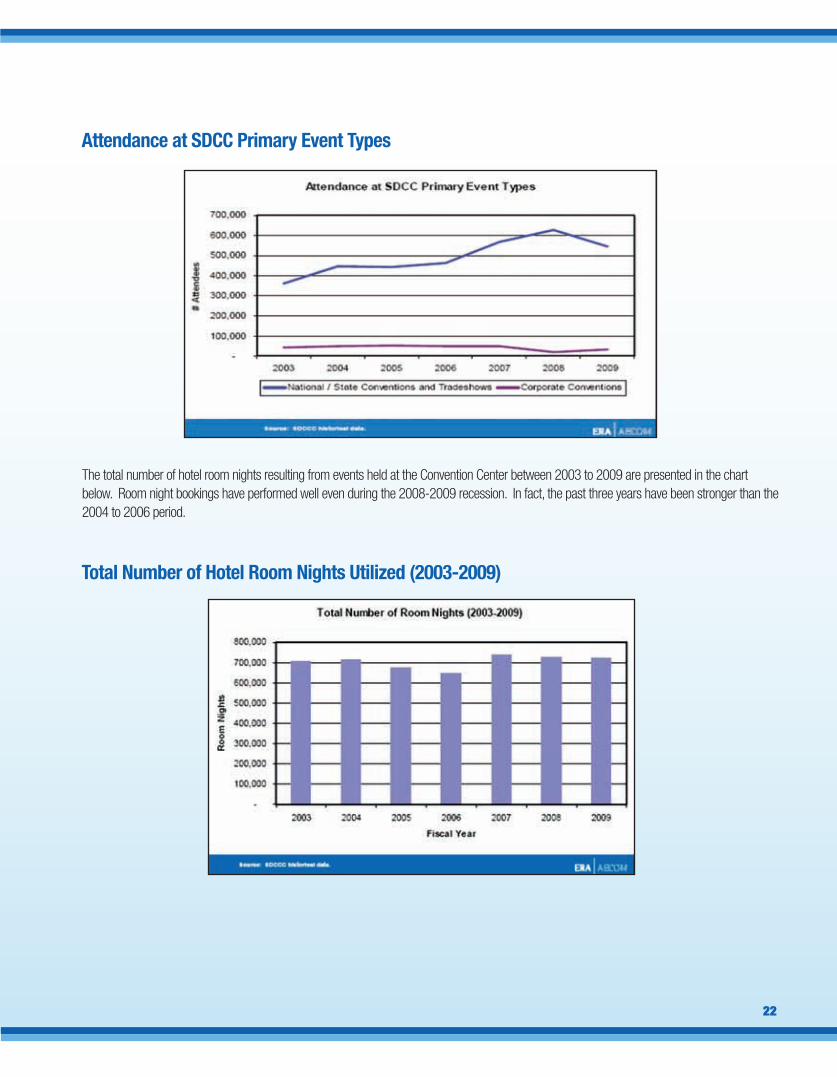
As the graphic below illustrates, attendance has increased steadily since 2003, dipping slightly due to the current recession. The chart also shows
how strong the Convention Center attendance has been for National and State conventions and tradeshows which represent the largest and most
important sector of the convention and meetings industry. These represent the key sector because they tend to be the largest events with the highest
hotel room night requirements and many of these events are owned by associations which have to meet annually as part of their charters. The
competition for National conventions and tradeshows is the fiercest in the country due to their size and stability. Corporate conventions and meetings,
while also an important industry segment, are more cyclical as they are more closely tied to specific corporate performance and the economy..
��
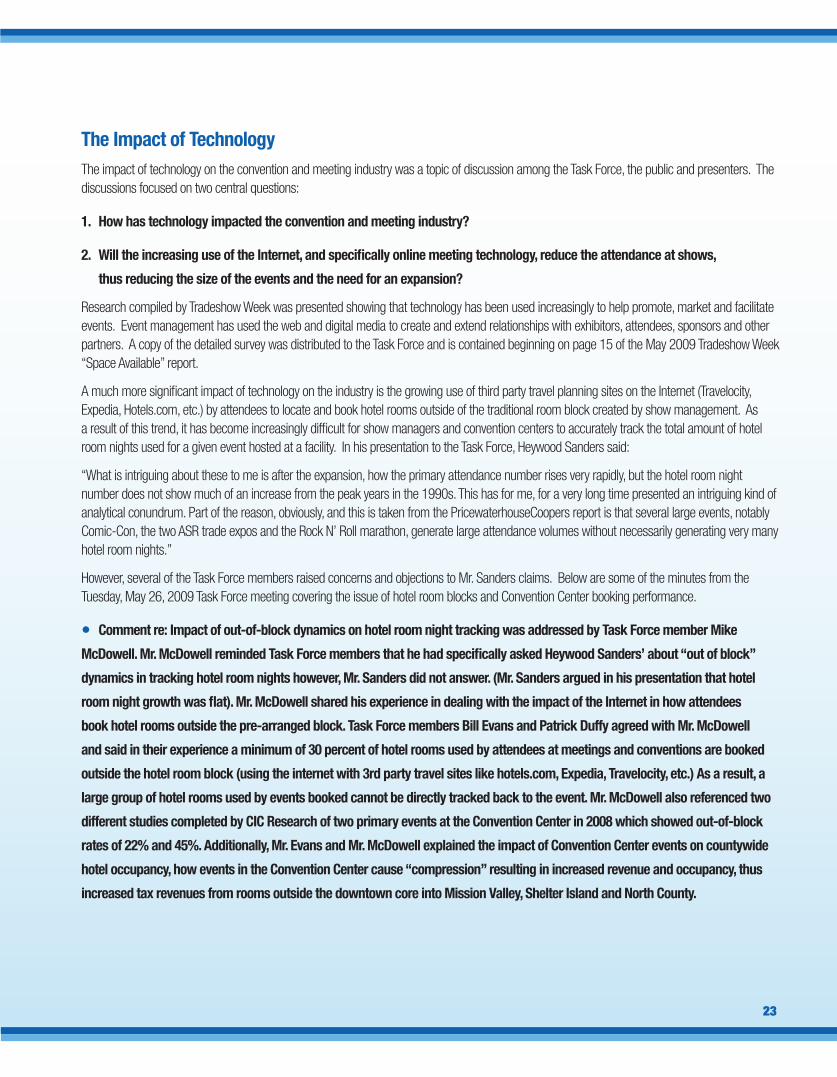
The total number of hotel room nights resulting from events held at the Convention Center between 2003 to 2009 are presented in the chart below. Room night bookings have performed well even during the 2008-2009 recession. In fact, the past three years have been stronger than the 2004 to 2006 period.
Attendance at SDCC Primary Event Types
Total Number of Hotel Room Nights Utilized (2003-2009)
��
The Impact of Technology The impact of technology on the convention and meeting industry was a topic of discussion among the Task Force, the public and presenters. The discussions focused on two central questions:
1. How has technology impacted the convention and meeting industry?
2. Will the increasing use of the Internet, and specifically online meeting technology, reduce the attendance at shows,
thus reducing the size of the events and the need for an expansion?
Research compiled by Tradeshow Week was presented showing that technology has been used increasingly to help promote, market and facilitate events. Event management has used the web and digital media to create and extend relationships with exhibitors, attendees, sponsors and other partners. A copy of the detailed survey was distributed to the Task Force and is contained beginning on page 15 of the May 2009 Tradeshow Week “Space Available” report.
A much more significant impact of technology on the industry is the growing use of third party travel planning sites on the Internet (Travelocity, Expedia, Hotels.com, etc.) by attendees to locate and book hotel rooms outside of the traditional room block created by show management. As a result of this trend, it has become increasingly difficult for show managers and convention centers to accurately track the total amount of hotel room nights used for a given event hosted at a facility. In his presentation to the Task Force, Heywood Sanders said:
“What is intriguing about these to me is after the expansion, how the primary attendance number rises very rapidly, but the hotel room night number does not show much of an increase from the peak years in the 1990s. This has for me, for a very long time presented an intriguing kind of analytical conundrum. Part of the reason, obviously, and this is taken from the PricewaterhouseCoopers report is that several large events, notably Comic-Con, the two ASR trade expos and the Rock N’ Roll marathon, generate large attendance volumes without necessarily generating very many hotel room nights.”
However, several of the Task Force members raised concerns and objections to Mr. Sanders claims. Below are some of the minutes from the Tuesday, May 26, 2009 Task Force meeting covering the issue of hotel room blocks and Convention Center booking performance.
• Comment re: Impact of out-of-block dynamics on hotel room night tracking was addressed by Task Force member Mike
McDowell. Mr. McDowell reminded Task Force members that he had specifically asked Heywood Sanders’ about “out of block”
dynamics in tracking hotel room nights however, Mr. Sanders did not answer. (Mr. Sanders argued in his presentation that hotel
room night growth was flat). Mr. McDowell shared his experience in dealing with the impact of the Internet in how attendees
book hotel rooms outside the pre-arranged block. Task Force members Bill Evans and Patrick Duffy agreed with Mr. McDowell
and said in their experience a minimum of 30 percent of hotel rooms used by attendees at meetings and conventions are booked
outside the hotel room block (using the internet with 3rd party travel sites like hotels.com, Expedia, Travelocity, etc.) As a result, a
large group of hotel rooms used by events booked cannot be directly tracked back to the event. Mr. McDowell also referenced two
different studies completed by CIC Research of two primary events at the Convention Center in 2008 which showed out-of-block
rates of 22% and 45%. Additionally, Mr. Evans and Mr. McDowell explained the impact of Convention Center events on countywide
hotel occupancy, how events in the Convention Center cause “compression” resulting in increased revenue and occupancy, thus
increased tax revenues from rooms outside the downtown core into Mission Valley, Shelter Island and North County.
��
• Mr. McDowell also addressed comments made by Mr. Sanders in his presentation when he stated that events like Comic
Con, Action Sports Retail and Rock-n-Roll Marathon generate large attendance but do not necessarily generate large hotel room
demand. Mr. McDowell explained how the four days of Comic Con are the highest occupancy and revenue days for hotels in the
County of San Diego consistently from year to year. He explained that there was no doubt that Comic Con, which draws more than
126,000 attendees, utilizes many more hotel room nights than the 20,000 hotel room nights reported as part of the room block by
the Convention Center.
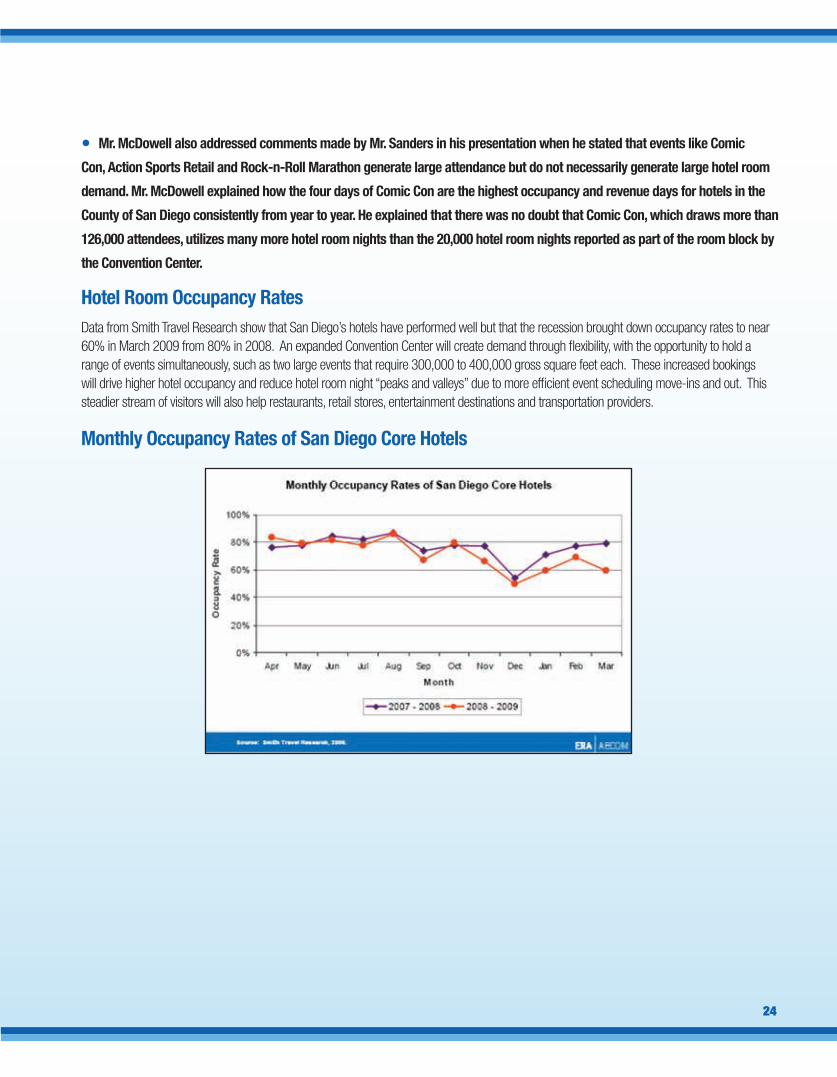
Hotel Room Occupancy RatesData from Smith Travel Research show that San Diego’s hotels have performed well but that the recession brought down occupancy rates to near 60% in March 2009 from 80% in 2008. An expanded Convention Center will create demand through flexibility, with the opportunity to hold a range of events simultaneously, such as two large events that require 300,000 to 400,000 gross square feet each. These increased bookings will drive higher hotel occupancy and reduce hotel room night “peaks and valleys” due to more efficient event scheduling move-ins and out. This steadier stream of visitors will also help restaurants, retail stores, entertainment destinations and transportation providers.
Monthly Occupancy Rates of San Diego Core Hotels
Event ProjectionsERA has projected the expansion to add 13 national or state conventions and tradeshows by 2016, and a total of 36 events over the same period. The consulting firm projects a reduction in the number of events if the Convention Center is not expanded.
As mentioned in other parts of this report, the Primary Events – National and State conventions and tradeshows, and corporate meetings – represent the largest and most important sector of the convention and meetings industry. These are the largest events with the highest hotel room night requirements.
��
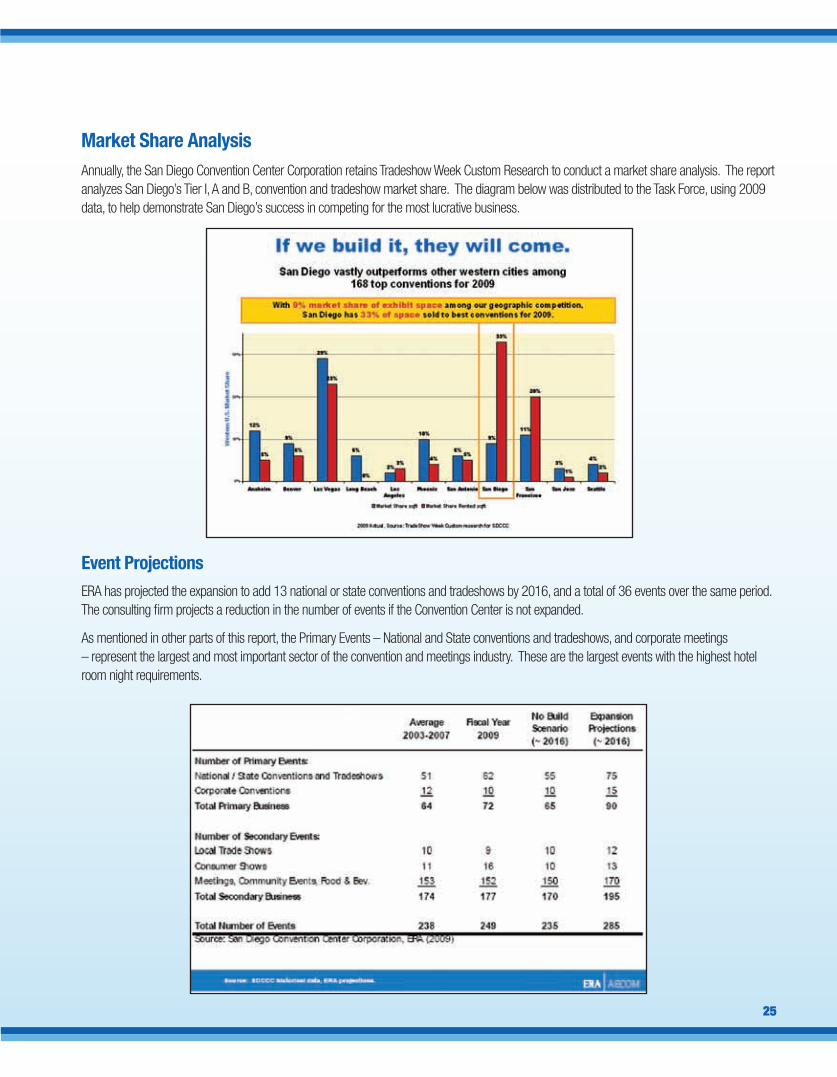
Market Share AnalysisAnnually, the San Diego Convention Center Corporation retains Tradeshow Week Custom Research to conduct a market share analysis. The report analyzes San Diego’s Tier I, A and B, convention and tradeshow market share. The diagram below was distributed to the Task Force, using 2009 data, to help demonstrate San Diego’s success in competing for the most lucrative business.

��
Lost BusinessBesides the ERA estimates of the risk of reducing the total number of events, there is a cost of doing nothing and it is already seen in “lost business” reports maintained by Convention Center management. For the past several years market demand has surpassed the current supply of exhibit space in the building. In fact, 39.7% of prospective customers that do not book the San Diego Convention Center attribute that decision to “Center Unavailable,” or a lack of space. As a result the San Diego Convention Center is losing many highly desirable and lucrative events to our competitor cities.
These loses are not only existing event clients that are outgrowing the building, but new business that would like to come to San Diego but simply can not be accommodated because the building is too small. While it is not assumed that all lost business would eventually be captured as a result of the proposed expansion, the additional space would allow the San Diego Convention Center to aggressively compete for new business from among a pool of customers desiring to come to San Diego. Over the recent past, this pool of lost business translated into substantial prospective room nights:
• 810,000 room nights lost in 2006
• 975,000 room nights lost in 2007
• 705,000 room nights lost in 2008
According to the San Diego Convention Center, 381 events have been turned away due to lack of exhibit space or dates. Of these events, 89% could be accommodated by an expansion of 225,000 square feet and 82% could be accommodated by an expansion of 175,000 square feet.
San Diego Convention Center Customer and Client Interviews and Analysis ERA conducted interviews with clients which are summarized in this section. In fact the verbatim analysis has been copied below. The research findings show the strength among the convention and meeting planner community for San Diego as a destination.
ERA completed telephone interviews with a number of meeting and event executives who are familiar with the San Diego Convention Center. ERA interviewed groups that are regular users of the SDCC, groups that have booked but may no longer be able to book in the future due to lack of space, and “lost business” groups.
ERA contacted more than 90 representatives of past and potential events. In the end, we were able to conduct interviews and/or correspond with a total of 26 meeting and event executives, some of whom represent multiple events on behalf of third-party groups. Approximately 25 percent of the responses were considered to be “lost” events, and the remaining are either future users or currently booked events. The results of these interviews are described below.
ERA’s executive interviewing research has unequivocally confirmed the attractiveness of San Diego as a convention destination.
Lost Business SurveysOf the facility’s “lost” events, most reported not using the San Diego Convention Center due to its lack of space and available dates, as well as “other” reasons that often included the cost of the facility and/or local hotels. These events were primarily conventions or combination conventions and trade shows.
San Diego was stated by many to be the top West Coast location and would be the number one pick on a rotation if they had more square footage of exhibit space. It was stated to be important to have more exhibit space than Los Angeles and Anaheim.
Though many of the groups stated that they need between 550,000-650,000 square feet of exhibit space (preferably contiguous), at least 30 percent of the lost business interviewees stated that their group could not use San Diego without 1 million square feet of total exhibit space. These

��
groups also need at least 150,000 square feet of meeting space and between 50-100 individual breakout rooms. A couple groups also stated that they need a 100,000 square foot ballroom. Exhibit halls were explained to not be suitable for ballroom functions.
The second most common reason for lost business was the lack of ability to obtain preferred dates. Especially difficult have been the spring and fall months. The lack of available dates for many years into the future is representative of strong demand and a potential need for expansion. The expanded facility will considerably open the number of date’s available and booking capacity of the Center.
Top facility competitors listed by the lost business groups are: Orlando, Atlanta, Las Vegas, Houston and Chicago. San Diego and Boston are noted to be the two large biotech hubs and are important to that industry.
Booked Events SurveysOf the facility’s events that are currently booked to be held at the San Diego Convention Center in the future, and/or have recently been held at the facility, the most common reason for selecting San Diego was its general destination appeal and draw for attendees. The next-most common responses were San Diego’s location and its hotel inventory. Most booked events that responded were conventions or combination conventions/trade shows, although a few were meetings and conferences. The main intent of the booked events interviews was to identify these events’ interest in using the expansion facility on its own in the future or in conjunction with the existing facilities space as well as understand prevailing industry trends.
In terms of customer service, knowledgeable staff, physical location and strong collaboration from city partners, San Diego is listed in the top three event centers among current and future users of the facility.
Though many groups consider San Diego their preferred conference location, there has been a serious issue with lack of availability. Some groups have stated that they are not able to get into San Diego for the next 6 years. It is especially difficult for those groups with annual conferences between July and November.
Most user groups stated that San Diego has one of the best hotel packages in the U.S., but that rates are often too high. Given the reduction in many group’s 2009 and 2010 budgets, the cost of hotel rates is going to be a key factor in deciding where groups book in the future. A couple groups stated that if they were not able to get favorable hotel rates, they might have to consider moving their events to second tier cities which offer lower facility rental fees and discount hotel packages.
According to the ERA research, at least 30 percent of the groups are outgrowing the facility and expect not to be able to use the SDCC by 2012-2016. Many groups increase the amount of necessary square footage by 10-20 percent per year. Groups that are not outgrowing the facility usually book San Diego on a 3, 4 or 6 year rotation given that dates are available.
Additional Comments from ERA Interview RespondentsIn general, most respondents indicated that they love meeting in San Diego and cite the city’s draw as a major plus for their events. Most groups have San Diego as part of their top 5 desired locations and most see it is as the top west coast locale.
Venue meeting planner, client, and prospect interviews unequivocally reflect a perception that San Diego is one of the most desirable destinations in North America for meetings business. This is borne out by the Center’s occupancy data that far exceeds the national average.

����
100 major conventions, tradeshows and Average 10,000+ Annually booking meetings require between 600,000 and in attendance only three to five of 800,000 gross square feet of exhibit space these types of new
Number of Events Attendace Opportunity
Source: TradeshowWeek Research
It is an industry idiosyncrasy that there are primarily only about 20 weeks of the year that meeting planners consider “prime” for major meetings and conventions, and as a result of the current size limitations, 40% of San Diego Convention Center’s “lost business” can’t get prime dates in the Winter, Spring and Fall.
Convention Centers Throughout the Country Continue to Expand Nationally, there has been a 25-year convention center building and expansion boom, which is still underway. As a result, available convention center space in the U.S. has grown by 95%, nearly doubling over the twenty-year period 1988 to 2008, according to Tradeshow Week. In addition to municipal facilities, hotels have invested aggressively in convention and meeting facilities (e.g., Gaylord Entertainment, various Las Vegas hotels and resorts, and other leading hotel companies).
This venue expansion and building boom, while slowed by the current recession, continues with 5.8 million square feet of new space in the pipeline. San Diego’s western regional competitive set as well as other major convention centers throughout the U.S. have aggressively expanded – often multiple times – over the past few decades to remain competitive. The table below lists a number or recent or in-process new buildings and expansions across the U.S.
Several Task Force members expressed concern about how the impact of increased supply in the market may have an impact on the price the San Diego Convention Center can charge, and therefore the revenue which will be generated from an expansion to support operations. The Task Force was informed this issue would be addressed in the Operating Pro Forma which will be made available to the Mayor.
New Market Opportunity According to Tradeshow Week, there are over 100 major conventions, tradeshows and meetings that need between 600,000 and 800,000+ gross square feet of exhibit space that average 10,000+ in attendance. Annually booking only three to five of these types of new events alone would make the expansion successful in terms of new economic impact.
San Diego Convention Center Competitive Set Recent or Current Expansions
Source: Tradeshow Week
Convention Center Recent or Current Expansion McCormick Place in Chicago Added 500,000 sq. ft. of exhibit and meeting space in 2007 (to reach a total of 2.7 million sq. ft.)
Phoenix Convention Center Added over 400,000 sq. ft. in 2008
Anaheim Convention Center Studying expansion/renovation
Las Vegas Convention Center Planning a major $800 million renovation (on hold)
San Jose McEnery Convention Center Studying expansion/renovation
Washington State Convention Center in Seattle Studying expansion/renovation
New Orleans Morial Convention Center Planning a renovation
Salt Palace Convention Center in Salt Lake City Expanded in 2006 to 700,000 sq. ft.
Los Angeles Convention Center, Staples Center district New hotels and LA Live project

The graphs below show how quickly conventions and tradeshows – the Convention Center’s primary event types – rebounded following the past two recessions in 1991 and the 2001/2002 period. The industry rebounds were also driven by attendees.
��
In light of the recession, the Task Force discussed the impact of the economic downturn on the convention industry. There was also discussion concerning whether business people are changing their meeting behavior such as using online or video conferencing that make large shows less desirable.
The table below illustrates how the convention and tradeshow industry rebounded following the last recession in 2001. Attendance at the annual shows in the Tradeshow 200, the top 200 U.S. tradeshows ranked by net square feet, increased by 3.5% in 2005, 3.1% in 2006, and 1.6% in 2007. Conventions and tradeshows track the industries that they serve and collectively the overall health of the U.S. economy.
iii.) iMpaCt oF the eConoMiC downturnon the Convention industry
Year Net Square Feet Exhibiting Companies Attendees 2008 -1.6% -2.7% -3.0%
2007 2.5% 2.3% 1.6%
2006 2.6% 1.4% 3.1%
2005 3.2% 1.5% 3.5%
2004 2.3% 2.8% 2.5%
2003 -0.7% 1.2% 3.4%
2002 -6.0% -2.6% -4.4%
2001 -1.3% -2.0% -4.5%
2000 3.2% 3.4% 2.8%
1999 2.8% 1.1% 4.4%
1998 5.2% 3.4% 2.4%Source: Tradeshow Week 200

Recent survey data of major event exhibitors and attendees is provided below which speaks to the positive outlook for major events.
Corporate Exhibitor Outlook Even in light of the current recession, the outlook for large conventions and tradeshows, those that use 200,000 gross square feet of exhibit space or more, is good. According to a recent Tradeshow Week survey, 69% of corporate exhibitors said the importance of large conventions and tradeshows to their companies is expected to remain the same or greater to over the next few years.
Attendee and Buyer Outlook on Conventions and Tradeshows Research conducted in June 2009 by Tradeshow Week has found that 96% of CEOs and other senior executives say they are attending their industry’s most important events this year.
In the face of the challenging economic environment, Tradeshow Week surveyed a cross-section of executives and managers in a range of industry sectors that attend or have attended business events. A total of 323 executives and managers responded to the survey. Forty-eight percent of the respondents were company owners, CEOs, presidents or other senior executives.
The findings indicate that in a challenging economy it is even more important to keep up-to-date with industry trends, see new products and services, and maintain and build relationships – all areas in which events provide significant value and efficiency. In short, attending leading conventions and tradeshows during a recession keeps executives informed and competitive.
As one event attendee said about going to events, “If you don’t keep up with what is going on in your business, a recession can keep you going down.” A different attendee commented, “(Going to the show) is actually a savings in travel costs. All my suppliers and potential suppliers are available at one venue.” And another provided this reason to attend in a recession, “We still have to keep up with changes in the industry and be prepared for the upswing.”
�0
After the very challenging period for tourism and business travel following 9/11, the hotel industry began to grow by 2003 and started to boom by 2004.

A series of questions on the value of events received highly positive responses, including:
• A significant 89% of the survey respondents said they are going to the most important events in their industry.
• Eighty-eight percent of attendees said they consider conventions and tradeshows to be an important part of their product
sourcing and buying process.
• Eighty-seven percent agree that conventions and tradeshows are essential for comparing products and meeting
suppliers in person.
• Fifty-four percent said that smaller crowds at events this year have enabled them to be more efficient when at the show.
• Fifty percent of attendees said that missing key events may negatively impact their future personal or organizational
performance.
Reasons for Attending Conventions and Tradeshows The survey asked attendees their reasons for attending conventions and tradeshows this year. The top reasons are “keep up-to-date on trends and issues”, followed by “see new products”, “network” and “see many companies at once”.
Interestingly, the survey found that 52% of attendees said they go to shows to “see products in person first seen online”. This finding fits with recent corporate buying trends. Increasingly, product information gathering and research starts on the internet and ends with the purchase made online. Events are becoming important in the middle of the buying process as buyers need to “touch and feel” products and assess people behind brands.
�1
Reasons for Attending Shows % of Attendees Keep up-to-date on trends and issues 84%
See new products 82%
Network 70%
See many companies at once 70%
Create and strengthen relationships and partnerships 68%
Source: TradeshowWeek
Travel Budget Outlook Today travel budgets are under scrutiny in nearly every industry. Yet 59% of attendees believe their travel budgets will rebound within a year after seeing an economic or sales turnaround, and 42% say their company’s travel budgets will increase within six months after spotting the recovery.
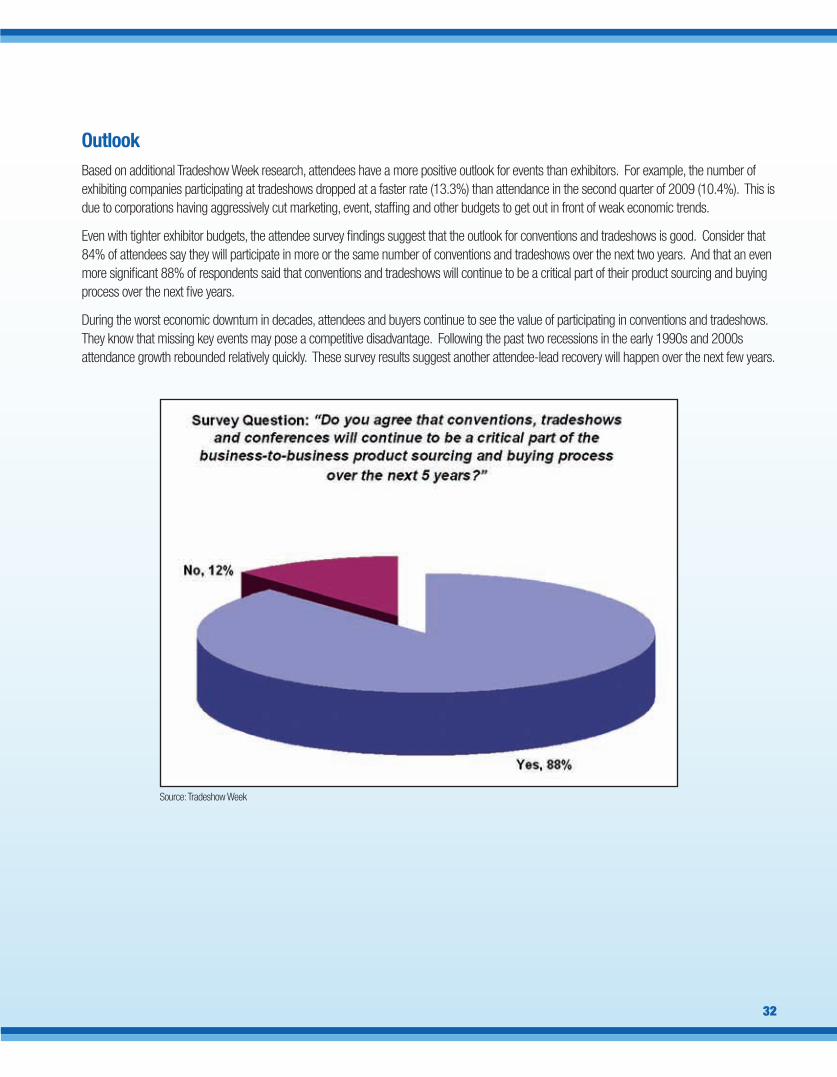
OutlookBased on additional Tradeshow Week research, attendees have a more positive outlook for events than exhibitors. For example, the number of exhibiting companies participating at tradeshows dropped at a faster rate (13.3%) than attendance in the second quarter of 2009 (10.4%). This is due to corporations having aggressively cut marketing, event, staffing and other budgets to get out in front of weak economic trends.
Even with tighter exhibitor budgets, the attendee survey findings suggest that the outlook for conventions and tradeshows is good. Consider that 84% of attendees say they will participate in more or the same number of conventions and tradeshows over the next two years. And that an even more significant 88% of respondents said that conventions and tradeshows will continue to be a critical part of their product sourcing and buying process over the next five years.
During the worst economic downturn in decades, attendees and buyers continue to see the value of participating in conventions and tradeshows. They know that missing key events may pose a competitive disadvantage. Following the past two recessions in the early 1990s and 2000s attendance growth rebounded relatively quickly. These survey results suggest another attendee-lead recovery will happen over the next few years.
��
Source: Tradeshow Week
��
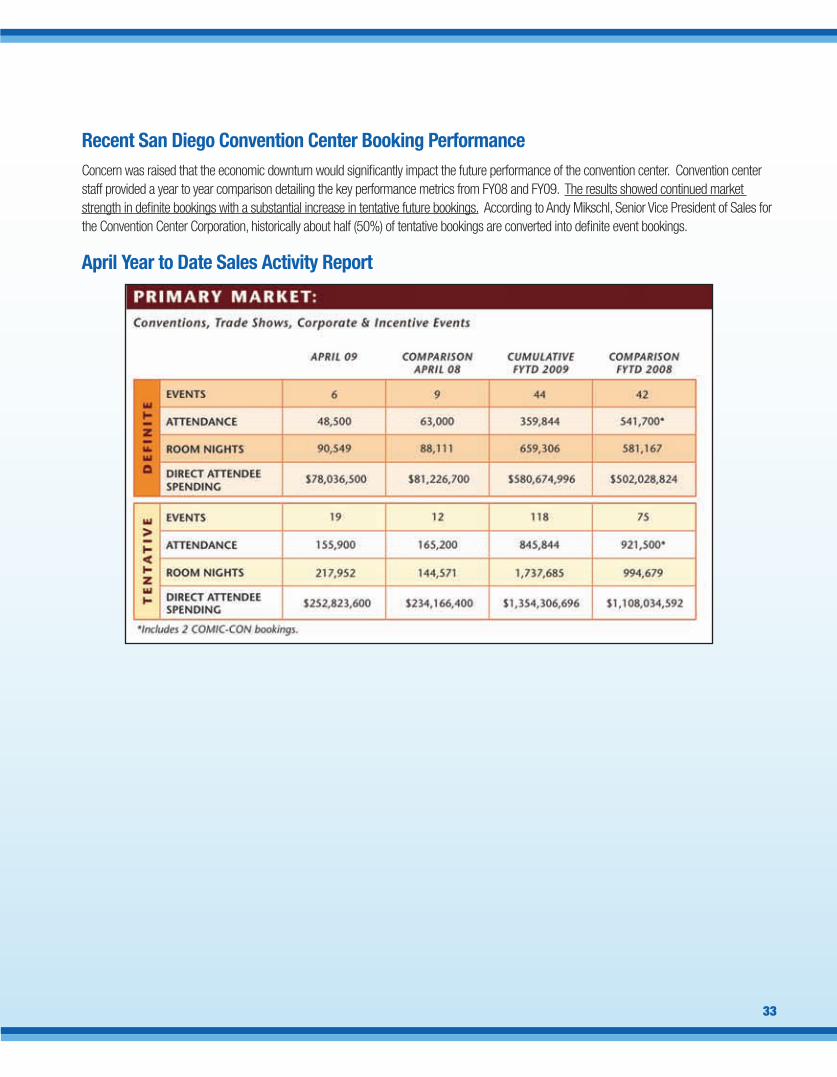
April Year to Date Sales Activity Report
Recent San Diego Convention Center Booking PerformanceConcern was raised that the economic downturn would significantly impact the future performance of the convention center. Convention center staff provided a year to year comparison detailing the key performance metrics from FY08 and FY09. The results showed continued market strength in definite bookings with a substantial increase in tentative future bookings. According to Andy Mikschl, Senior Vice President of Sales for the Convention Center Corporation, historically about half (50%) of tentative bookings are converted into definite event bookings.
��
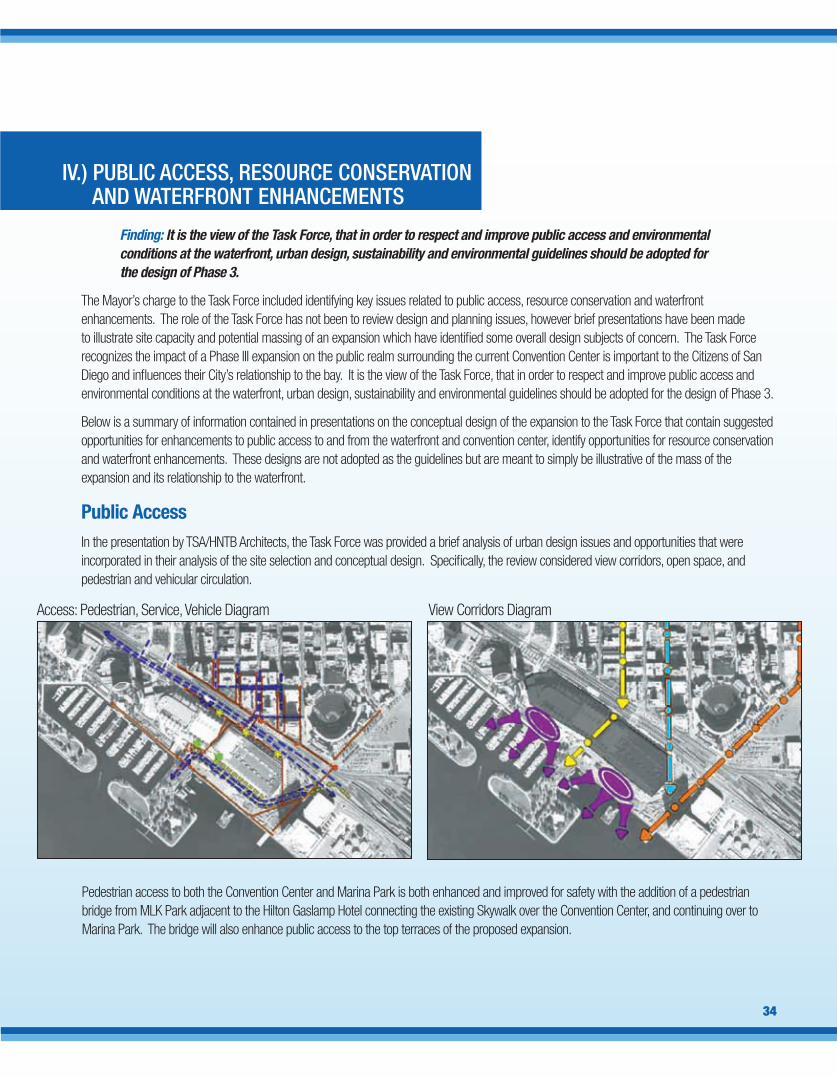
Access: Pedestrian, Service, Vehicle Diagram View Corridors Diagram
Pedestrian access to both the Convention Center and Marina Park is both enhanced and improved for safety with the addition of a pedestrian bridge from MLK Park adjacent to the Hilton Gaslamp Hotel connecting the existing Skywalk over the Convention Center, and continuing over to Marina Park. The bridge will also enhance public access to the top terraces of the proposed expansion.
iv.) publiC aCCess, resourCe Conservationand waterFront enhanCeMents
Finding: It is the view of the Task Force, that in order to respect and improve public access and environmental conditions at the waterfront, urban design, sustainability and environmental guidelines should be adopted for the design of Phase 3.
The Mayor’s charge to the Task Force included identifying key issues related to public access, resource conservation and waterfront enhancements. The role of the Task Force has not been to review design and planning issues, however brief presentations have been made to illustrate site capacity and potential massing of an expansion which have identified some overall design subjects of concern. The Task Force recognizes the impact of a Phase III expansion on the public realm surrounding the current Convention Center is important to the Citizens of San Diego and influences their City’s relationship to the bay. It is the view of the Task Force, that in order to respect and improve public access and environmental conditions at the waterfront, urban design, sustainability and environmental guidelines should be adopted for the design of Phase 3.
Below is a summary of information contained in presentations on the conceptual design of the expansion to the Task Force that contain suggested opportunities for enhancements to public access to and from the waterfront and convention center, identify opportunities for resource conservation and waterfront enhancements. These designs are not adopted as the guidelines but are meant to simply be illustrative of the mass of the expansion and its relationship to the waterfront.
Public AccessIn the presentation by TSA/HNTB Architects, the Task Force was provided a brief analysis of urban design issues and opportunities that were incorporated in their analysis of the site selection and conceptual design. Specifically, the review considered view corridors, open space, and pedestrian and vehicular circulation.
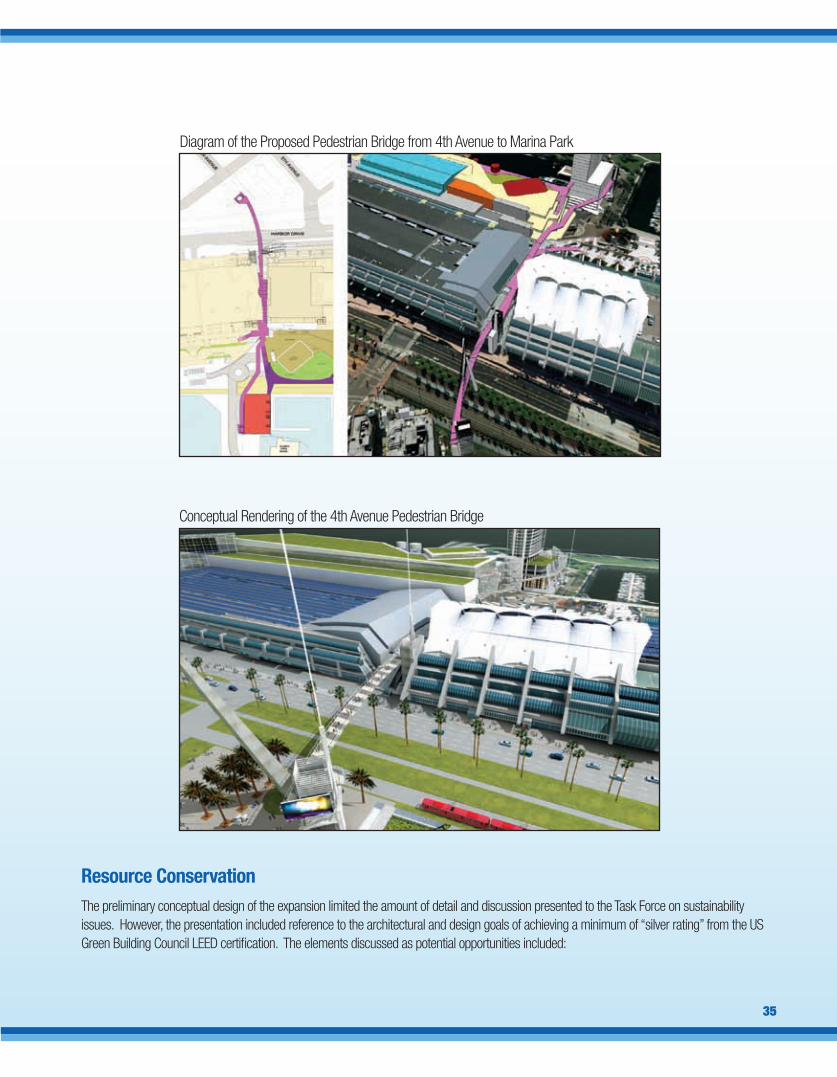
��
Diagram of the Proposed Pedestrian Bridge from 4th Avenue to Marina Park
Conceptual Rendering of the 4th Avenue Pedestrian Bridge
Resource ConservationThe preliminary conceptual design of the expansion limited the amount of detail and discussion presented to the Task Force on sustainability issues. However, the presentation included reference to the architectural and design goals of achieving a minimum of “silver rating” from the US Green Building Council LEED certification. The elements discussed as potential opportunities included:
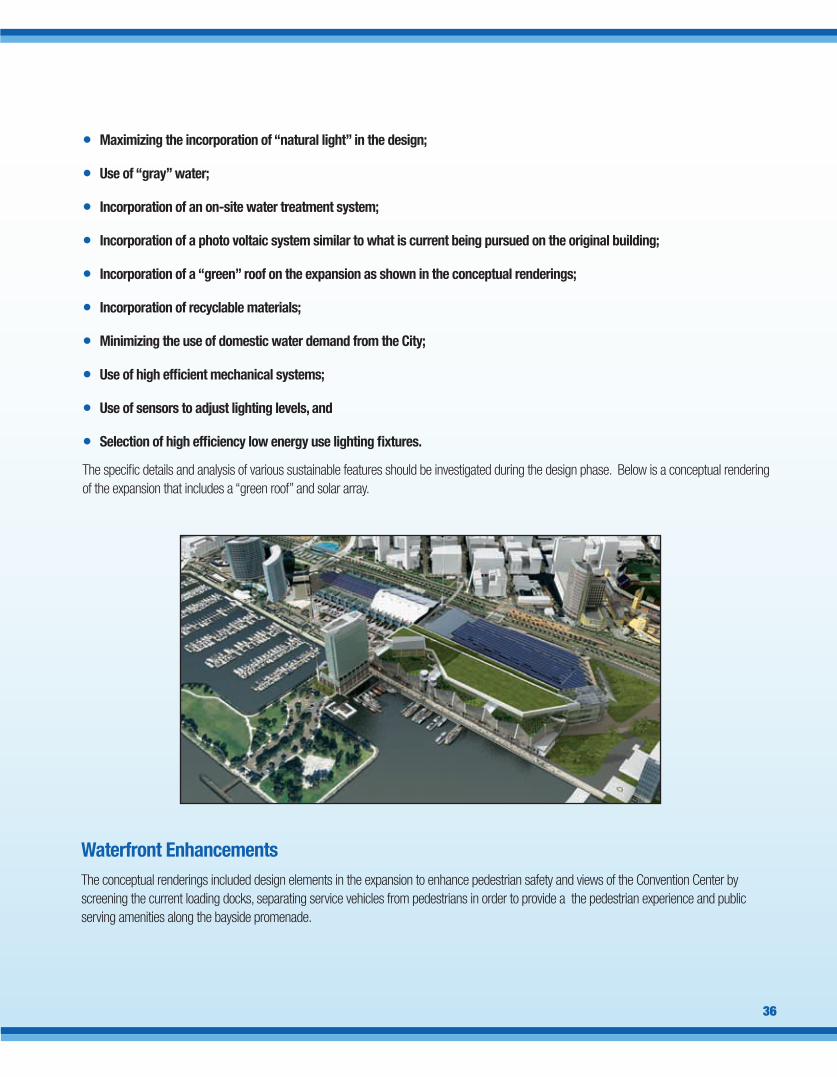
��
• Maximizing the incorporation of “natural light” in the design;
• Use of “gray” water;
• Incorporation of an on-site water treatment system;
• Incorporation of a photo voltaic system similar to what is current being pursued on the original building;
• Incorporation of a “green” roof on the expansion as shown in the conceptual renderings;
• Incorporation of recyclable materials;
• Minimizing the use of domestic water demand from the City;
• Use of high efficient mechanical systems;
• Use of sensors to adjust lighting levels, and
• Selection of high efficiency low energy use lighting fixtures.
The specific details and analysis of various sustainable features should be investigated during the design phase. Below is a conceptual rendering of the expansion that includes a “green roof” and solar array.
Waterfront EnhancementsThe conceptual renderings included design elements in the expansion to enhance pedestrian safety and views of the Convention Center by screening the current loading docks, separating service vehicles from pedestrians in order to provide a the pedestrian experience and public serving amenities along the bayside promenade.
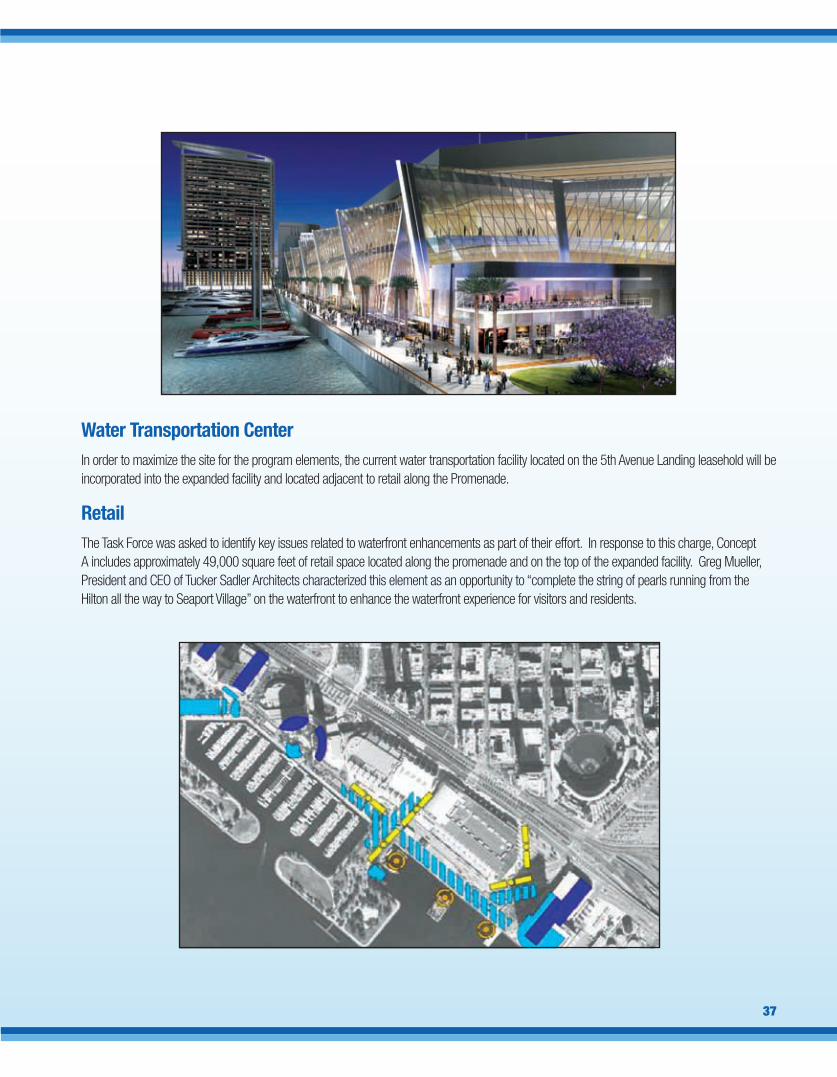
��
Water Transportation CenterIn order to maximize the site for the program elements, the current water transportation facility located on the 5th Avenue Landing leasehold will be incorporated into the expanded facility and located adjacent to retail along the Promenade.
RetailThe Task Force was asked to identify key issues related to waterfront enhancements as part of their effort. In response to this charge, Concept A includes approximately 49,000 square feet of retail space located along the promenade and on the top of the expanded facility. Greg Mueller, President and CEO of Tucker Sadler Architects characterized this element as an opportunity to “complete the string of pearls running from the Hilton all the way to Seaport Village” on the waterfront to enhance the waterfront experience for visitors and residents.

This section of the report details the recommendation that the expansion be contiguous, site analysis and recommendation including the program for an expansion, recommended facility size and ancillary developments.
Recommendation for a Contiguous Expansion The Task Force recommends that the expansion be contiguous with the current venue. Market experts presented information showing that a non-contiguous building, if it is built further than directly across the street, is not an expansion by definition to meeting planners. In fact, a non-contiguous building would result in two completely different venues. Essentially no major conventions and tradeshows, or consumer shows, would book both venues at the same time.
According to Tradeshow Week, 86% of convention and tradeshow producers say their ideal convention center has the primary exhibition hall in one building, on one level. A survey of convention center General Managers in 2008, found that 61% said “all in one facilities” will be the most common types of new convention center new building and expansion projects going forward.
Site Analysis and RecommendationThe Task Force received a presentation from Tucker Sadler/HNTB Architects detailing sites considered for a possible expansion of the convention center. For all of the sites considered, a range of criteria were used to evaluate the feasibility of the location.
The following criteria were used:
• Facility Requirements (size, service area, pedestrian access, vehicular access, public transit access, parking, proximity)
• Environmental Criteria (water, air, habitat, acoustic, remediation)
• Urban Design (size and scale, urban space, views to and from site, view corridors, visual connection).
• Constructability
• Cost
• Land Use/Ownership
Between 2003 and 2007, nine sites were identified and eliminated as either not feasible due to cost, the land was no longer available, simply not feasible (ie: building over the bay or railroad yard) or a combination of reasons. The diagrams below identify the nine sites.
��
v.) prograM For proposedConvention Center expansion

5th Avenue Landing and Tailgate Park Site OptionsTwo additional sites were evaluated as part of the current study. The first, identified as the 5th Avenue Landing site, is located immediately behind the loading docks of the Phase II expansion and San Diego Bay. The second site identified as the Tailgate Park site is located east of Petco Park along Park Boulevard.
��
OPTION 7“16th Avenue/Tailgate Park”
OPTION 8“Concourse”
OPTION 9“Bayside Option”
OPTION 4“Port Site with Separation”
OPTION 5“Port Site Contiguous”
OPTION 6“Harbor Peninsula”
OPTION 1“Above Rail Yard”
OPTION 2“On Rail Yard”
OPTION 3“Adjacent Underground

The Tailgate site evaluation found that an active earthquake fault ran through the middle of the proposed site. Six different concepts were evaluated however the site was eliminated as feedback from convention center clients indicated the facility would not meet their primary needs of a contiguous space and was located too far from the current facility to be considered for use by large clients needing more space than currently exists in the current convention center.
�0
Additionally, it was determined that to be marketable the Tailgate site would require a minimum of 400,000 square feet of exhibit space as well as meeting space. However, the bulk and scale of a facility of the size necessary to meet the program was deemed as another fatal flaw. The renderings below show the required size and scale of two scenarios in context with the current size and scale of Petco Park. As a result, the Tailgate Park site was eliminated as a viable alternative.

The 5th Avenue Landing site plan was identified as the recommended site location for the proposed expansion program. Two design concepts using the 5th Avenue site were studied and presented, one that provided a larger facility, however the building would impact the Hilton leasehold. The second concept provided a somewhat smaller facility using only land within the Fifth Avenue Landing leasehold. After reviewing the required mitigations necessary to build on the larger site, it was eliminated for consideration.
A conceptual plan (Concept A) showing how the expansion would fit on the site was presented. The site was preferred for a
number of reasons including:
• Allows for an expansion adjacent to the current facility that allows large groups to utilize the entire building for a single show
as well as allowing for multiple large events to use the facility concurrently;
• Provides a functional and direct connection to the existing facility;
• Adds visitor and resident serving retail along the waterfront promenade;
• Creates improved access to and from the facility from the bayside and the Hilton Bayside;
• Improves the waterfront views of the facility by screening loading docks;
• Improves pedestrian access to and from the waterfront.
�1
Tailgate Park Bulk and Scale Diagrams

Securing the 5th Avenue Landing SiteThe San Diego Convention Center Corporation is in a year-long due diligence process with the Unified Port of San Diego to secure the 5th Avenue Landing leasehold which is on Port tidelands. If the 5th Avenue Landing site is not secured, it will eliminate the last remaining option for an expansion that is contiguous to the current facility.
Suggested Expansion Program ElementsConcept A incorporates the following major programmatic leasable spaces in five levels:
��
Site Plan Concept A
Architects and design consultants advising the Task Force presented a proposal for a feasible contiguous expansion on the 5th Avenue site.
Expansion Specifications Square Feet and Height Total Square Feet of the Exhibition Hall on Level 2 197,665 sf
Total Square Feet of the Meeting Rooms 108,000 sf
Square Feet of Ballroom Space 80,000 sf
Retail Space (Ground level and 5th floor) 49,400 sf
Overall Building Height 154’
Source: Tucker Sadler, HNTB
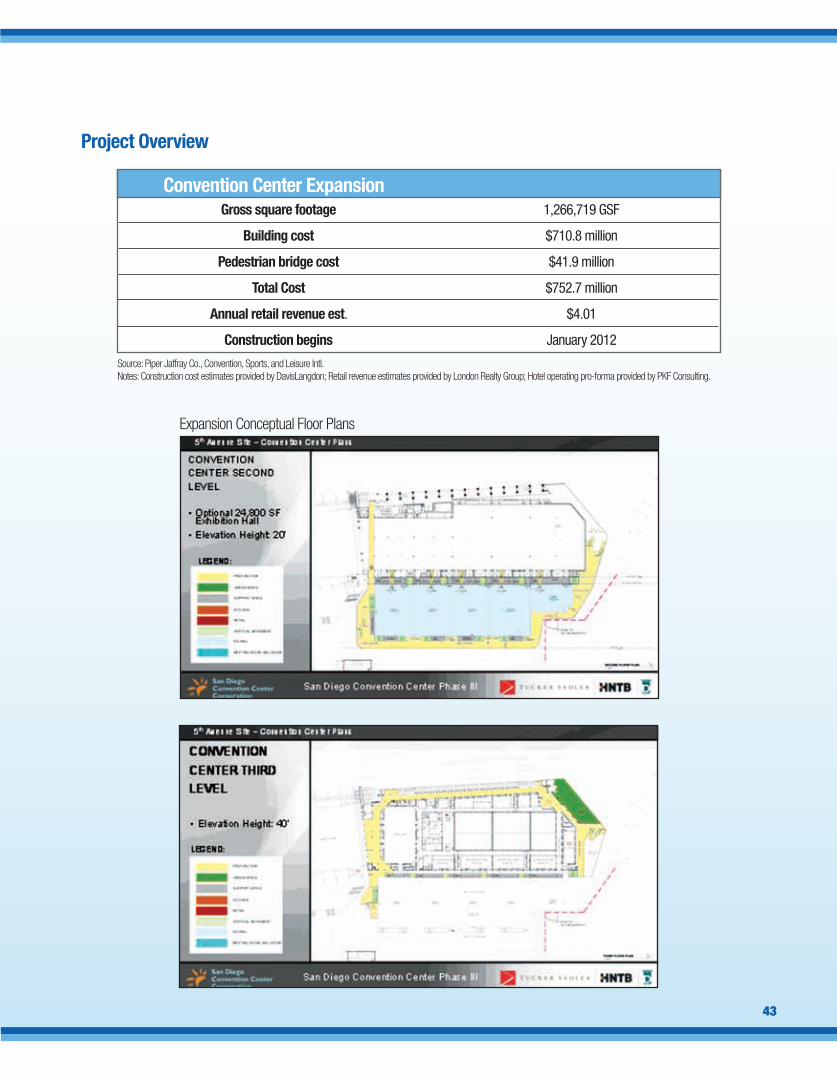
��
Expansion Conceptual Floor Plans
Source: Piper Jaffray Co., Convention, Sports, and Leisure Intl. Notes: Construction cost estimates provided by DavisLangdon; Retail revenue estimates provided by London Realty Group; Hotel operating pro-forma provided by PKF Consulting.
Project Overview
Convention Center Expansion Gross square footage 1,266,719 GSF
Building cost $710.8 million
Pedestrian bridge cost $41.9 million
Total Cost $752.7 million
Annual retail revenue est. $4.01
Construction begins January 2012

��
Hotel ProgramA new hotel program has also been discussed and initial information has been provided by consultants, but the Task Force is not making a recommendation with respect to the hotel as part of the report to the Mayor. The Task Force has not determined whether or not construction of a hotel is essential for the success of the expanded convention center. As a result, the materials presented to the Task Force on the proposed Hotel Program will not be included in the body of the report but will be included in the attachments.

45
VI.) FINANCING OPTIONS
Finding: It is the view of the Task Force that various financing options have been identified and evaluated relative to Convention Center Expansion.
Mayor Sanders asked the Task Force to determine the estimated cost of an expansion and identify possible financing options. Specifically, the charge was:
• To identify and evaluate various financing options for an expanded convention center that relies mainly on revenues
generated by the Convention Center and/or related developments or enhancements.
The advisors were asked to consider these fundamental assumptions when analyzing the financing:
• Do not utilize any General Fund revenue not currently utilized or obligated for Convention Center Bond debt service, capital
replacement or marketing support.
• Revenue for expansion must come from sources that benefit from the expanded Center.
• Revenue available for the Center expansion would not otherwise be available for other civic purposes as these funds will only
be available due to a direct measurable benefit.
Financial advisors and construction consultants to the Task Force determined the following cost estimates for the proposed expansion and pedestrian bridge.
Convention Center Pedestrian Bridge TotalConstruction Costs $560,792 $33,104 $593,896
Escalation $26,055 $1,538 $27,593
Design Fees and Bond $42,546 $2,512 $45,058
Owner soft costs including land $81,450 $4,808 $86,258
Total $710,843 $41,962 $752,8057 As of July 6, 2009.
Construction Cost Estimates ($000)7Convention Center Funding Requirements
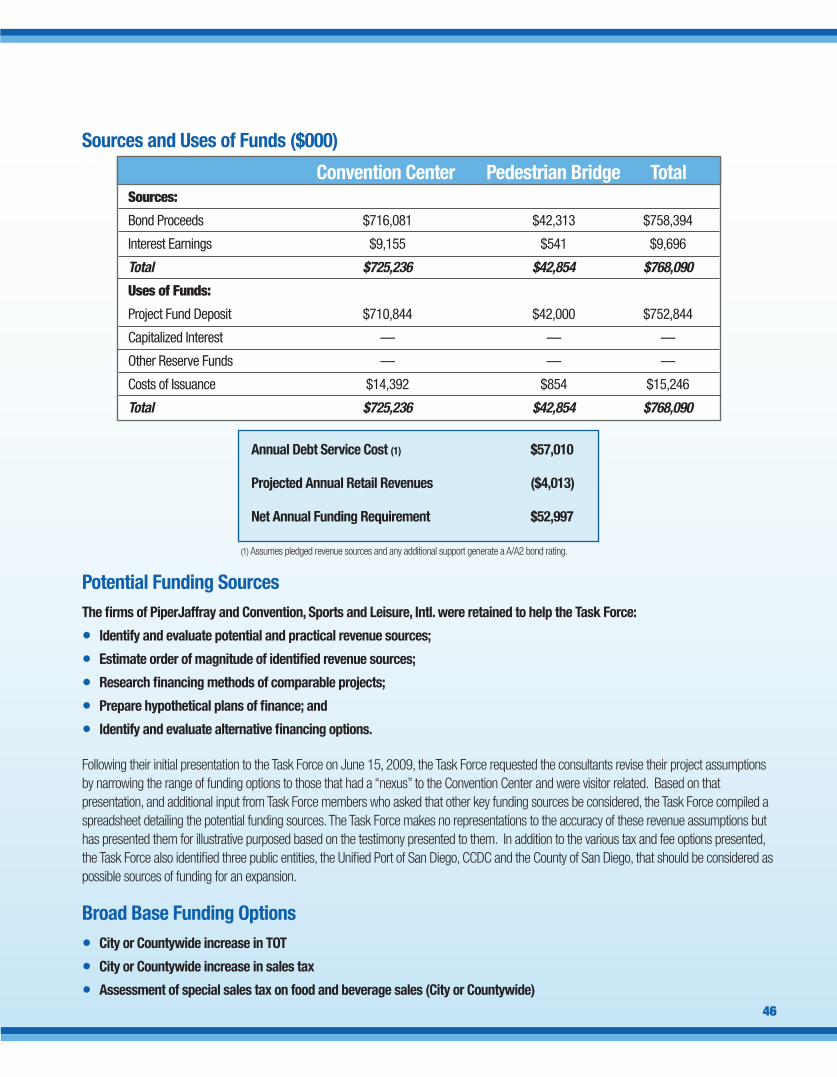
Annual Debt Service Cost (1) $57,010
Projected Annual Retail Revenues ($4,013)
Net Annual Funding Requirement $52,997
��
Sources and Uses of Funds ($000)
Convention Center Pedestrian Bridge TotalSources:
Bond Proceeds $716,081 $42,313 $758,394
Interest Earnings $9,155 $541 $9,696
Total $725,236 $42,854 $768,090
Uses of Funds:
Project Fund Deposit $710,844 $42,000 $752,844
Capitalized Interest — — —
Other Reserve Funds — — —
Costs of Issuance $14,392 $854 $15,246
Total $725,236 $42,854 $768,090
(1) Assumes pledged revenue sources and any additional support generate a A/A2 bond rating.
Potential Funding SourcesThe firms of PiperJaffray and Convention, Sports and Leisure, Intl. were retained to help the Task Force:
• Identify and evaluate potential and practical revenue sources;
• Estimate order of magnitude of identified revenue sources;
• Research financing methods of comparable projects;
• Prepare hypothetical plans of finance; and
• Identify and evaluate alternative financing options.
Following their initial presentation to the Task Force on June 15, 2009, the Task Force requested the consultants revise their project assumptions by narrowing the range of funding options to those that had a “nexus” to the Convention Center and were visitor related. Based on that presentation, and additional input from Task Force members who asked that other key funding sources be considered, the Task Force compiled a spreadsheet detailing the potential funding sources. The Task Force makes no representations to the accuracy of these revenue assumptions but has presented them for illustrative purposed based on the testimony presented to them. In addition to the various tax and fee options presented, the Task Force also identified three public entities, the Unified Port of San Diego, CCDC and the County of San Diego, that should be considered as possible sources of funding for an expansion.
Broad Base Funding Options• City or Countywide increase in TOT
• City or Countywide increase in sales tax
• Assessment of special sales tax on food and beverage sales (City or Countywide)

Targeted Funding Options• Create Tourism Improvement District – additional TOT tax based on proximity to CC (i.e., San Francisco)• Assessment of food and beverage tax on restaurants near CC • Extension/Increase in TMD assessment
Additional Tourist Specific Charges • Rental car surcharge• Ticket tax on certain tourist activities (Zoo, Sea World) • Ticket tax on sports and concert events at Petco Park, Cricket Wireless, Cox Arena• Charge on taxicab airport drops/pickups
Property Based and Other Options• Citywide or Countywide parcel assessment• Tax increment financing• State or County government financial assistance; Unified Port of San Diego, CCDC.
��
Possible Revenue Sources (to Meet Bond Obligation)
Source: PiperJaffray Co., Convention, Sports, and Leisure Intl.
In her presentation to the Task Force, member Lani Lutar used data collected by the San Diego Convention Center Corporation (SDCCC) staff on recently completed convention center expansion projects. SDCTA prepared statistical information of the data provided to highlight trends. If the report noted that a convention center did not increase taxes but listed taxes, it was assumed the taxes were in existence prior to the expansion project. It should also be noted that of these twelve (12) convention centers, only four (4) are within San Diego’s competitive set: Washington DC, Phoenix, Boston, and Vancouver.
Source Type of Revenue Adjacent, New Convention Center Hotel Residual cash flow
Convention Center Retail Net income
Convention Center Hotel Business Improvement District Assessment By geographic proximity to Center
Convention Center Entertainment All non-hotel businesses, District Assessment by geographic proximity to Center
Convention Center Restaurant Business Improvement District Assessment By geographic proximity to Center
Convention Center Parking District (BID) By geographic proximity
Convention Center Taxi District Drop-off/Pick-up Surcharge
Rental Car Surcharge
Convention Center Service Contractor Fee
Incremental Convention Center Parking Fees 100% of all above 2007 baseline
Contribution of Land from Unified Port of San Diego commensurate with appreciation in leasehold values resulting from Convention Center expansion.
Financial investment by Centre City Development Corporation (CCDC) and any other public, private or other governmental agencies commensurate with projected increase in tax increment resulting from Convention Center expansion.

����
Possible Revenue Sources (The task force makes no representations to the accuracy of these revenue assumptions but has presented them for illustrative purpose based on the testimony presented to the task force.)
Conv. Center Hotel Base Revenue Tax, Fee Approving Actions Needed toFunding Source Description Unit Amount or Assessment Authority ImplementCitywide TOT Citywide increase of 1% $14,700,00 Special Tax City TOT requires submit to Voters, 2/3 approval. TOT vs. TMD 2% $29,400,000 Citywide BID 3% $44,100,000 TMD Members TMD requires TMD members vote 50+%
Downtown TOT Downtown increase of 1% $5,160,000 Special Tax City TOT requires submit to Voters, 2/3 approval. TOT vs. TMD 2% $10,320,000 Downtown TMD 3% $15,480,000 TMD Members TMD requires TMD members vote 50%+
Extend or increase Extend or increase % assessment Assessment City/TMD members Amend/prepare new assessment engineer’sexisting TMD existing TMD not defined report; follow state law and local ordinance procedures for voting on amended plan and related assessment
Create new Convention Create new Convention % assessment Assessment City/proposed Engage in assessment district formationCenter BID Center BID not defined BID members process per state law and local ordinance
Conv. Center Hotel Adjacent hotel $ $0 Business net profit City, Port, Coastal Majority approval by each agency Commission approval
Conv. Center Retail 40,000 sq. ft. $ $0 Business net profit City, Port, Coastal Retail component Commission approval
Entertainment District Business Improvement District % no district has Assessment City/ BID members 50%+ vote of BID membersBID Assessment for all non-hotel businesses been defined Restaurant District Business Improvement District .05% $720,000 Assessment City/ BID members 50%+ vote of BID membersBID Assessment for all non-hotel businesses. 1% $1,440,000 (Assuming 60% sales are food) Percentage of gross food sales
Parking BID Assessment - A. Hybrid of BID model to % Option not defined Assessment City/ BID members 50%+ vote of Parking BID membersfor specific parking provide greater revenue jurisdiction B. Only incl. parking contractors/business that can self assess C. Inclusion of parking companies in entertainment BID
Taxi District - Drop Off/Pick Up Surcharge $ No $ analysis Fee City City Council vote subject to Mayoral vetoDrop Off/Pick Up (1 of 2)
Taxi District - Airport pick-up/drop off surcharge: $1 $1,500,000 Can be a City; subject to Tax-submit to votersAirport Taxicab per trip $3 $4,500,000 tax or fee limitations, if any, of airport pick-up/drop off $5 $7,500,000 authority’s jurisdiction Fee-City process(2 of 2)
Rental Car Surcharge Rental Car Surcharge: $1 $1,150,000 Can be a tax or fee City: also potentially Tax - submit to voters per rental $5 $5,750,000 depending on primary Port District and/or Fee- Processed per City department $10 $11,500,000 purpose (revenue Airport Authority request/Council approval or regulation) (may not be applicable to rental operations on Port District/Authority lands)
Service Contractor Fee Service Contractor fee 2% No $ analysis Fee San Diego Convention Center (gross sales in the CC) Corporation, City
Parking Fees Incremental parking fees 100% No $ analysis Fee City; Port of San Diego (of all above ‘07 baseline)
Downtown food Tax on food/beverage sales 1% $2,400,000 Special Tax City (except City cannot Tax-submit to 2/3 voter approvaland beverage in vicinity of Convention Center 2% $4,800,000 impose it’s own tax on sales tax 3% $7,200,00 0 alcoholic beverage sales)
Ticket surcharge Ticket surcharge $1 $5,000,000 Can be a City (may be subject to Tax - submit to 2/3 voter approval(tourist attractions) (tourist attractions) $3 $15,000,000 tax or fee limitations in leases or other $5 $25,000,000 contractual agreements) Fee- City Process
Ticket tax/fee (venues) Ticket tax/fee on $ No $ analysis Can be a • PETCO governed by agreement Tax-submit to 2/3 voter approval particular venues tax or fee between City and Padres limiting (e.g. PETCO park, new taxes, fees or assessments Fee-City process Cricket Amphitheater, • Cricket located in Chula Vista, CA Cox Arena) • Cox Arena on property of CSUSD; may be able to impose tax on types of business conducted there
Source: Piper Jaffray Co., Convention, Sports, and Leisure Intl.

��
Public Agencies
Source: Piper Jaffray Co., Convention, Sports, and Leisure Intl.
Visitor Related Funding Options
Base Revenue Tax, Fee Approving Actions Needed toFunding Source Description Unit Amount or Assessment Authority Implement
Port of San Diego Land, rent concessions, $ Unkown Port of San Diego Majority approval by Port other general funding
CCDC Tax increment financing $ Unkown CCDC, City of San Diego CCDC Board, City Council
County of San Diego General $ Unkown Board of Supervisor Support Board Vote
Lodging & Restaurant Unit Funds GeneratedCitywide TOT or TMD 1% $14,700,000
Citywide TOT or TMD 2% $29,400,000
Citywide TOT or TMD 3% $44,100,000
Downtown TOT or TMD 1% $5,160,000
Downtown TOT or TMD 2% $10,320,000
Downtown TOT or TMD 3% $15,480,000
Downtown F&B Sales Tax 1% $2,400,000
Downtown F&B Sales Tax 2% $4,800,000
Downtown F&B Sales Tax 3% $7,200,000
Transportation Unit Funds GeneratedRental Car Surcharge $1 per rental $1,150,000
Rental Car Surcharge $5 per rental $5,750,000
Rental Car Surcharge $10 per rental $11,500,000
Surcharge – Airport Taxi $1 per trip $1,500,000
Surcharge – Airport Taxi $3 per trip $4,500,000
Surcharge – Airport Taxi $5 per trip $7,500,000
Other Unit Funds GeneratedTicket Surcharge (Tourist Attractions) $1 per ticket $5,000,000
Ticket Surcharge (Tourist Attractions) $3 per ticket $15,000,000
Ticket Surcharge (Tourist Attractions) $5 per ticket $25,000,000

Opportunity Costs
• During Task Force meetings the issue of “opportunity costs” related to spending $759 million on an expansion versus
other economic development activities was raised and discussed. The charge limited the Task Force to focus on the
convention center and the merits of expansion. In identifying possible funding sources to pay for an expansion, the Task
Force focused on identifying funding that would be tied to increased economic activity from events in the expanded facility.
As a result, the revenues would not otherwise be available for other civic purposes as these funds will only be available due to
a direct measurable benefit from an expansion.
Impact of Various Tax Increases on San Diego’s CompetitivenessLani Lutar, President and Chief Executive Officer of the San Diego County Taxpayers Association presented an analysis of Price Elasticity of Demand. She raised concerns during the August 4th meeting that new taxes could make San Diego less competitive. The table below, from the May 26, 2009 ERA report, provides a list of site-selection criteria deemed to be important by various types of meeting planners.
�0
Total Funding Requirements ($000)
Funding requireMents:Convention Center & Pedestrian Bridge $52,997Hotel Residual (Stabilized Year) ($8,995)
Total Requirements $44,002
Coverage FaCtor:1.25x $55,0001.50x $66,000

Additionally, Lutar provided a comparison of how San Diego tax rates tied to hotels, rental cars and restaurants would compare to San Diego’s competitive convention cities if a range of possible revenue sources were adopted.
�1

Finding: It is the view of the Task Force that expansion of the Convention Center is feasible and that new jobs
will be generated.
The mission of the Task Force as established by Mayor Sanders was to evaluate and recommend the necessary steps required to ensure San Diego’s ability to protect and expand local jobs and retain and enhance its current market position in the convention and meeting industry.
Municipal convention centers are primarily developed to stimulate new direct spending and economic impact in a city and metropolitan area. What is “new” about this spending is that it would not take place in the city if the convention center and related infrastructure was not built. Most of this spending results from event attendees and delegates that are based outside the region visiting the area as a result of an annual event or an event that rotates into the city. Spending is also generated by event managers and corporate exhibitors who spend on show services. These show services are often provided by local union labor.
According to the Task Force’s economic consultants the additional economic impacts from an expansion are projected to be significant8. Although these estimates are based on a facility slightly larger than the proposed expansion program (225,000 sq. feet of exhibit space vs. 198,000 sq. feet), the projections provide a reasonable estimate of the economic impacts of a proposed expansion.
��
vii.) potential eConoMiC iMpaCt
Economic ImpactsAnnual Direct Spending $372 Million
Annual Countywide Economic Impact $698 Million
New Permanent Jobs Created 6,885 jobs
Economic Impacts
Source: Economic Research Associates
Hotel Sector and City Tax Revenues
Tax RevenuesAnnual Gross Room Sales for Hotels $155.6 Million
Annual Transient Occupancy Tax $16.3 Million
Annual Sales Tax $0.8 Million
Annual Direct City Tax Revenues $17.1 Million
Source: Economic Research Associates
8 Assuming an expansion of 225,000 square feet of exhibit space and a total of 1,219,400 square feet of indoor rentable space.

Finding: To encourage public comment on the convention center project by holding meetings at locations and
times accessible to the public.
A range of concerns were raised from the public in letters and public testimony. These issues included:
• That the building expansion might block views to the bay.
• That it might take public space for private events.
• Any reduction in park space.
• There is a water shortage and it would require more water to operate.
• That we ensure any expansion follow US Green Building Council’s LEED certification for environmental standards
Below are excerpts from some of the public comments and letters to the Task Force.
June 26, 2009
I saw power point phase 3 expansion of SDCC, I believe the hotel project between sdcc and south embarcadero park is a LOUSY LOUSY idea it kills the view and the openness san diego citizens enjoy, I visit seaport village and park 2-3 times a week and walk up and down the promenade. The hotel should go to tailgate park or surrounding vicinity.
Sammy Tejani
June 22, 2009
Attention: Cheryl Kendrick & Stephen Cushman
In the Sunday Union-Tribune, the editorial espouses moving to a realistic funding plan. Let’s take a step backward first and look at the whole idea more realistically.
The editorial – and, indeed, the entire development proposal – is predicated on the falsehood that the expansion “…would be a boon to the hotel industry…” which would benefit from increased bookings generated by a larger Convention Center. The project proponents argue that “if we build it, they will come.” But this is truly a belief with no hard evidence to back it up. There are only a few mega-conventions at the top of the pyramid;
there are many more smaller conferences further down the scale.
...Continued tech advances are diminishing the need for business travel; large convention attendance is sharply reduced; San Diego hotel bookings are down by about one-fourth; the W hotel has just gone into bankruptcy – when was the last time that happened, especially in San Diego? It is obvious that the very nature of the convention industry is changing; San Diego must adjust with it, not simply continue with outdated brick-and-
mortar expansions.
...Increasing the TOT to 14.5% would make San Diego’s rate higher than Las Vegas (13%), New York City (13.25%) or even LA (14%). Is that fair?
It is growing ever clearer that no viable market exists for an expanded convention center for the foreseeable future.
Michael-Leonard
Creditor��
viii.) publiC CoMMentsand letters

May 27, 2009
Attention: Cheryl Kendrick & Stephen Cushman
… I for one recommend that additional individuals and organizations be identified who might take a more balanced position and be asked to present to the Task Force as well. This will create a much more transparent process in making a recommendation to the Mayor.
One of the charges is:
• To identify key issues related to public access, resource conservation and waterfront enhancement
To my knowledge this charge has not been addresses yet and will be one that many memebers of the public will be interested in. The existing CC and the subsequent expansion have done an outstanding job of walling off the waterfront from the City. Additional in today’s climate of limited natural resources, water shortages and climate change, the way the Convention center positions itself will become extremely imporatnt. is it possible to have a LEED Platinum facility? What about a zero carbo footprint? How WILL the public access the waterfront?
In the recent Red Bull races citizens were removed from the Convention Center steps. Are we to expect more of the same?
What about traffic, parking, bus staging accomodation?
Any expansion of the CC must not cost the City. Subject any agreements to an independent analysis with public vetting.
Charles Kaminski
May 27, 2009
Attention: Cheryl Kendrick & Stephen Cushman
1. COMPOSITION OF THE TASK FORCE This group is supposed to represent diverse interests of San Diego. Taxpayers, the Convention Center’s fellow port tenants, the hospitality industry, organized labor, the business and economic development community are here. However, there is nobody to represent the fiscally conservative position of not expanding. Only one person on the panel possibly represents anti-development viewpoint – Ms. Takvorian. This lack of true representation has the effect of turning the panel into a virtual “kangaroo court,” totally biased in favor of expansion before even beginning its work…
Michael-Leonard
Creditor
May 26, 2009
Attention: Chairman Steve Cushman
Subject: Privatizing Paradise: Comments to Convention Center Expansion Task Force
...Having created a massive concrete wall on the south embarcadero, we proceeded to exacerbate the problem with the first center expansion in the early part of this decade. Now your task force, the convention center corporation and many private parties who stand to make money if the center is further expanded, propose to spread the malignancy by paving over and blocking off even more publicly owned tidelands on downtowns waterfront.
Once again, the public’s right to access its own downtown bayfront tidelands would be overridden by special interests seeking to cordon off public space for private gain. Eventually we will have paved over every square inch of the south embarcadero in the name of profits. Imagine if the City of San Diego were to fence off Balboa Park and charge citizens to go there. What you are doing is far worse then that, since downtown’s waterfront is a unique place. I know of no other waterfront city in the world that has worked so hard to wall off its bayfront from its own citizen’s to benefit private profit-making interests.
Don Wood��

May 7, 2009
To the members of the Mayor’s Task Force Convention Center Expansion Proposal
I object to the Convention Center Expansion Proposal because it will continue to the walling off of the bay and designate more of our public tidelands to private enterprise. The latest studies report that there is no need for convention expansion especially in this economic climate. Thank you for the opportunity to comment.
Cathy O’Leary Carey
��
Comments and Letters in Support of the Expansion
Convention Center Critic on San Diego
All of the Public Comments and Letters are posted on this web site: http://www.conventioncentertaskforce.org/MCTFdocs-letters.shtml
The most vocal critic of publicly funded convention centers, Dr. Heywood Sanders of the University of Texas at San Antonio, when asked by Task Force members about San Diego Convention Center’s relative performance against its competitors, characterized San Diego as a “conundrum,” because it did not fit his profile of failed or failing convention centers across the country. In 2004, when asked about the then three year old expansion of San Diego Convention Center he paid San Diego a compliment in an interview:
“(T)here are two places that have historically done well in expanding their convention business: that’s Las Vegas and Orlando. And historically, they have managed to grow their business with great regularity. New Orleans for a long time in the 1990s seemed to be successful. Anaheim and San Diego may, but because of a lack of available information that I’ve been able to get my hands on, it’s not entirely clear. But there’s something in common certainly about the first two of them, and to some extent, about the other three, that’s worth noting.”

appendiCes
• Appendix One: Task Force Mission
• Appendix Two: Meeting Schedule
• Appendix Three: Overview of Tourism Marketing Districts, Business Improvement Districts and Lease-Revenue Bonds
• Appendix Four: Agendas and Meeting Notes Web Site; Presentations Web Site; Other Meeting Documents and Reports; and Public Comments and Letters Web Site
• Appendix Five: Overview of Possible Revenue Sources
��
Appendix One: Task Force Mission
Mission
The mission of the Mayor’s Citizen Task Force on the Convention Center Project is to evaluate and recommend to Mayor Sanders the necessary steps required to ensure San Diego’s ability to protect and expand local jobs and retain and enhance its current market position in the convention and meeting industry.
Charge
• To review and evaluate the feasibility of an expansion to the current Convention Center and related developments or
enhancements and the impact on generating new jobs.
• To identify and evaluate various financing options for an expanded convention center that relies mainly on revenues
generated by the Convention Center and/or related developments or enhancements.
• To identify key issues related to public access, resource conservation and waterfront enhancement.
• To encourage public comment on the convention center project by holding meetings at locations and times accessible to the
public.
• To present a final set of findings and recommendations to Mayor Sander’s no later than September 2009. All meetings will be
conducted in accordance with the Brown Act.
Co-Chairs Roles and Responsibilities
The Co-Chairs for this Task Force will serve in the public’s interest to provide the requisite leadership to guide the discovery and analysis process in order to make recommendations to the Mayor on the expansion of the Convention Center as an economic driver for the City. To make certain there is clear understanding of the Co-Chairs’ roles and responsibilities for all concerned the following information delineates their functions.
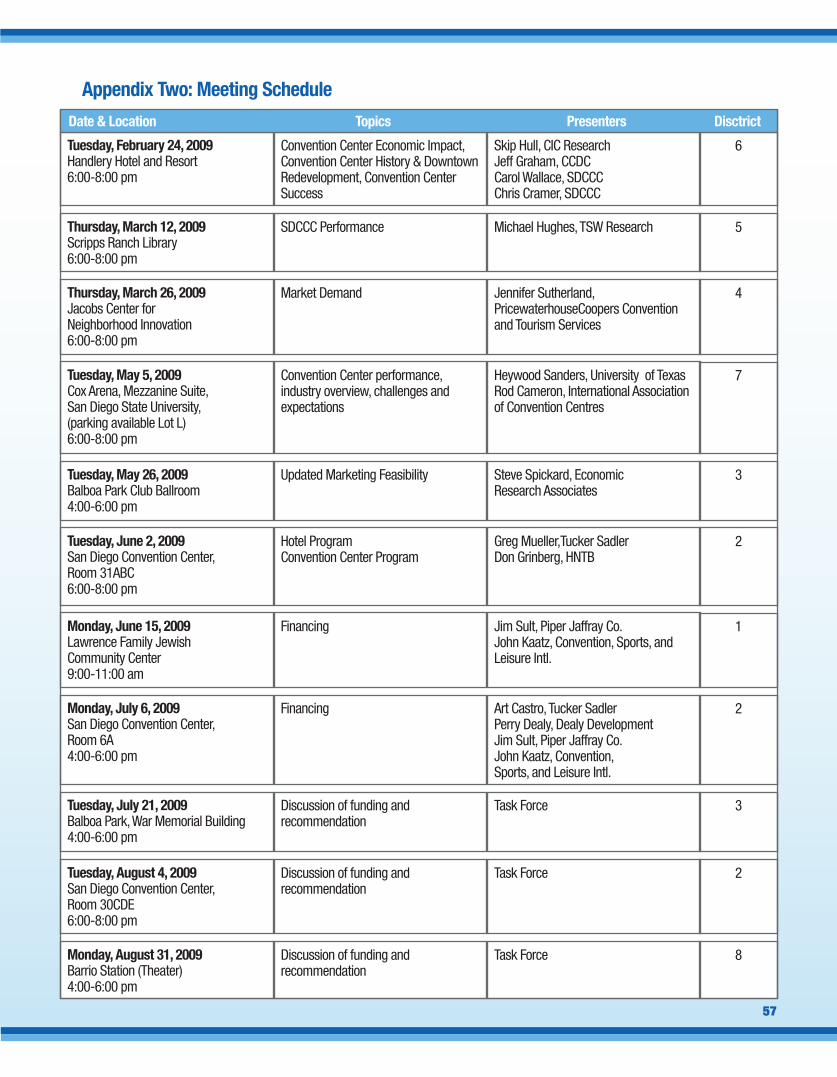
��
Appendix Two: Meeting Schedule Conv. Center Hotel
Skip Hull, CIC ResearchJeff Graham, CCDCCarol Wallace, SDCCCChris Cramer, SDCCC
Tuesday, February 24, 2009Handlery Hotel and Resort6:00-8:00 pm
Convention Center Economic Impact, Convention Center History & Downtown Redevelopment, Convention Center Success
6
Date & Location Topics Presenters Disctrict
Michael Hughes, TSW ResearchThursday, March 12, 2009Scripps Ranch Library6:00-8:00 pm
SDCCC Performance 5
Jennifer Sutherland, PricewaterhouseCoopers Convention and Tourism Services
Thursday, March 26, 2009Jacobs Center for Neighborhood Innovation6:00-8:00 pm
Market Demand 4
Heywood Sanders, University of TexasRod Cameron, International Association of Convention Centres
Tuesday, May 5, 2009Cox Arena, Mezzanine Suite, San Diego State University,(parking available Lot L)6:00-8:00 pm
Convention Center performance, industry overview, challenges and expectations
7
Steve Spickard, EconomicResearch Associates
Tuesday, May 26, 2009Balboa Park Club Ballroom4:00-6:00 pm
Updated Marketing Feasibility 3
Greg Mueller,Tucker SadlerDon Grinberg, HNTB
Tuesday, June 2, 2009San Diego Convention Center, Room 31ABC 6:00-8:00 pm
Hotel Program Convention Center Program
2
Jim Sult, Piper Jaffray Co.John Kaatz, Convention, Sports, and Leisure Intl.
Monday, June 15, 2009Lawrence Family Jewish Community Center9:00-11:00 am
Financing 1
Art Castro, Tucker SadlerPerry Dealy, Dealy Development Jim Sult, Piper Jaffray Co.John Kaatz, Convention,Sports, and Leisure Intl.
Monday, July 6, 2009San Diego Convention Center,Room 6A4:00-6:00 pm
Financing 2
Task ForceTuesday, July 21, 2009Balboa Park, War Memorial Building4:00-6:00 pm
Discussion of funding and recommendation
3
Task ForceTuesday, August 4, 2009San Diego Convention Center,Room 30CDE6:00-8:00 pm
Discussion of funding and recommendation
2
Task ForceMonday, August 31, 2009Barrio Station (Theater) 4:00-6:00 pm
Discussion of funding and recommendation
8

��
Appendix Three: Overview of Tourism Marketing Districts, Business Improvement Districts and Lease-Revenue Bonds
Tourism Marketing Districts
What is a Tourism Marketing District?
The San Diego Tourism Marketing District follows the model of Tourism Business Improvement Districts (BID’s) that utilize the efficiencies of private sector operation in the market-based promotion of local and regional tourism. Tourism BID’s, such as the SDTPC allow lodging and other tourism-related business owners to organize their efforts to increase tourism. In San Diego, lodging business owners within the district assess themselves to fund the District and those funds will be used to provide programs and services that specifically benefit the assessed lodging businesses.
History: As a result of diminishing public resources available for effective and competitive destination marketing, local lodging industry leadership began discussing alternative funding sources and available options in 2003. A working group comprised of lodging industry representatives held dozens of meetings with proposed assessed businesses, stakeholder groups and interested parties. On May 8, 2007 the San Diego City Council adopted an enabling Procedural Ordinance that allowed for the formation of a Tourism Marketing District. In December of 2007, the qualifying businesses voted to establish the assessment district, and the Tourism Marketing District (TMD) was approved by San Diego City Council.
The Tourism Marketing District began on January 1, 2008.
The enabling Procedural Ordinance and the Management District Plan provide that the City contract with the San Diego Tourism Promotion Corporation (SDTPC), a nonprofit mutual benefit corporation, to plan and carry out specified activities, subject to the terms and conditions enumerated in the contract between SDTPC and the City. In April 2008, City Council gave final approval of the contract between SDTPC and the City, thus establishing the terms for SDTPC to manage the District assessments and to contract for implementation of the proposed marketing programs and services outlined in the Management District Plan.
Location: The Tourism Marketing District is citywide, inclusive of all areas within the city limits of the City of San Diego. A map of the District is included with the San Diego Tourism Marketing District Management District Plan.
Funding Source Entirely from Assessed Businesses: The TMD assessment is designed to benefit, and is levied upon, lodging businesses with 70 or more sleeping rooms in the City of San Diego. Business means any and all types of hotels where a structure, or any portion of a structure, is held out to the public as being occupied, or designed for occupancy, by transients for dwelling, lodging or sleeping purposes. The owner(s), operator(s), or an authorized representative who is noted on City records as the responsible party for remitting and reporting Transient Occupancy Tax for each lodging business is responsible for paying the assessment. The annual assessment is based upon 2% of gross room revenue from transient stays in the lodging business as described above.
More information can be found at: http://www.sandiego.gov/treasurer/taxesfees/tot/tmdfaq.shtml
Business Improvement DistrictsBusiness Improvement Districts (BIDs) are a type of assessment district in which business owners choose to be assessed a fee, which is collected on their behalf by the City, for use in promoting and improving the business area. In California, BIDs date back to 1965 with the approval of Assembly Bill 103 - the “Parking and Business Improvement Area Law.” Today there are approximately 200 BIDs in the state.

��
Appendix Four: Agendas and Meeting Notes Web Site; Presentations Web Site;Other Meeting Documents and Reports; and Public Comments and Letters Web Site
San Diego’s ProgramThe City of San Diego’s BID program, the largest in the state of California and one of the most active in the nation, is administered by the City’s Office of Small Business. San Diego’s program dates back to 1970 with the creation of the Downtown Improvement Area, California’s first metropolitan downtown district. Since that time, the small business community and the City of San Diego have created 18 separate districts, with another two in the preliminary stages of formation. More than 11,000 small businesses participate in these self-assessment districts, raising more than $1 million annually.
• San Diego’s Program
• Benefits
• Marketing Activities
• Additional Funding
• Other City Assistance
• Forming a BID
• Assessment Fees
• BID Locations
• Contact Information
A complete overview can be found online at:http://www.sandiego.gov/economic-development/business-assistance/small-business/bids.shtml
Lease-Revenue Bonds Lease Revenue Bonds and Certificates of Participation are lease obligations secured by an installment sale agreement or by a lease-back arrangement with a public entity, where the general operating revenues are pledged to pay the lease payments, which are, in turn, used to pay debt service on the bonds or Certificates of Participation. These obligations do not constitute indebtedness under the state constitutional debt limitation and, therefore, are not subject to voter approval. Payments to be made under valid leases are payable only in the year in which use and occupancy of the leased property is available, and lease payments may not be accelerated. The governmental lessee is obligated to place in its annual budget the rentals that are due and payable during each fiscal year the lessee has use of the leased property.
Revenue Bonds are payable solely from net or gross non-ad valorem tax revenues derived from General Fund revenues, tax increment revenues, rates or tolls, or fees, charges or rents paid by users of the facility constructed with the proceeds of the bond issue. Pursuant to Section 90 of the City Charter, the City may incur bonded indebtedness for the purpose of acquiring, constructing, or completing any municipal improvements, not including improvements to the City’s water facilities, in an amount not to exceed 10% of the total assessed valuation of all real and personal property in the City subject to an annual property tax levy. The City may also incur bonded indebtedness for the purpose of acquiring, constructing, or completing water facilities in an amount not to exceed 15% of the total assessed valuation. The combined limit on outstanding indebtedness for both non-utility related improvements and water related improvements is an amount not to exceed 25% of the total assessed valuation.
For more information: http://www.sandiego.gov/fm/annual/pdf/fy07/debtobligations.pdf
�0
Agendas and Meeting Notes Web Site
http://www.conventioncentertaskforce.org/taskforcemeetingagendas.shtml
Presentations
http://www.conventioncentertaskforce.org/MCTFdocs-presentations.shtml
Other Meeting Documents and Reports
http://www.conventioncentertaskforce.org/MCTFdocs-other.shtml
Public Comments and Letters
http://www.conventioncentertaskforce.org/MCTFdocs-letters.shtml
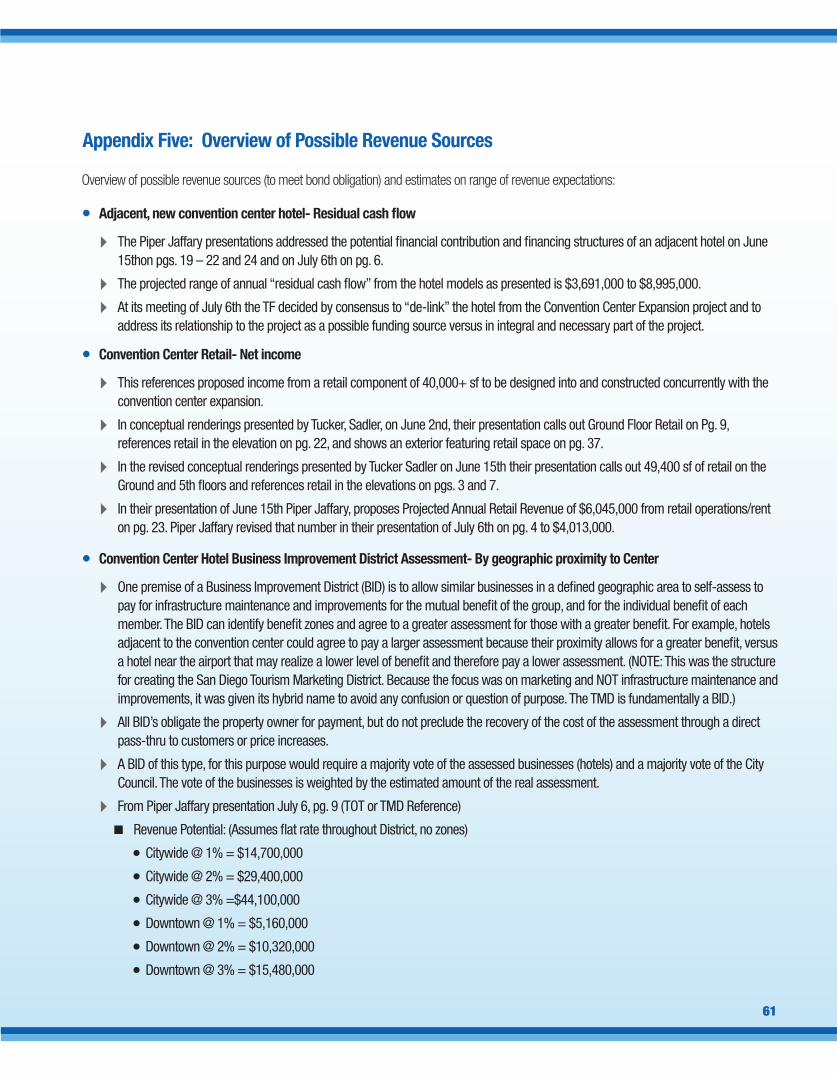
�1
Appendix Five: Overview of Possible Revenue Sources
Overview of possible revenue sources (to meet bond obligation) and estimates on range of revenue expectations:
• Adjacent, new convention center hotel- Residual cash flow
4 The Piper Jaffary presentations addressed the potential financial contribution and financing structures of an adjacent hotel on June 15thon pgs. 19 – 22 and 24 and on July 6th on pg. 6.
4 The projected range of annual “residual cash flow” from the hotel models as presented is $3,691,000 to $8,995,000.
4 At its meeting of July 6th the TF decided by consensus to “de-link” the hotel from the Convention Center Expansion project and to address its relationship to the project as a possible funding source versus in integral and necessary part of the project.
• Convention Center Retail- Net income
4 This references proposed income from a retail component of 40,000+ sf to be designed into and constructed concurrently with the convention center expansion.
4 In conceptual renderings presented by Tucker, Sadler, on June 2nd, their presentation calls out Ground Floor Retail on Pg. 9, references retail in the elevation on pg. 22, and shows an exterior featuring retail space on pg. 37.
4 In the revised conceptual renderings presented by Tucker Sadler on June 15th their presentation calls out 49,400 sf of retail on the Ground and 5th floors and references retail in the elevations on pgs. 3 and 7.
4 In their presentation of June 15th Piper Jaffary, proposes Projected Annual Retail Revenue of $6,045,000 from retail operations/rent on pg. 23. Piper Jaffary revised that number in their presentation of July 6th on pg. 4 to $4,013,000.
• Convention Center Hotel Business Improvement District Assessment- By geographic proximity to Center
4 One premise of a Business Improvement District (BID) is to allow similar businesses in a defined geographic area to self-assess to pay for infrastructure maintenance and improvements for the mutual benefit of the group, and for the individual benefit of each member. The BID can identify benefit zones and agree to a greater assessment for those with a greater benefit. For example, hotels adjacent to the convention center could agree to pay a larger assessment because their proximity allows for a greater benefit, versus a hotel near the airport that may realize a lower level of benefit and therefore pay a lower assessment. (NOTE: This was the structure for creating the San Diego Tourism Marketing District. Because the focus was on marketing and NOT infrastructure maintenance and improvements, it was given its hybrid name to avoid any confusion or question of purpose. The TMD is fundamentally a BID.)
4 All BID’s obligate the property owner for payment, but do not preclude the recovery of the cost of the assessment through a direct pass-thru to customers or price increases.
4 A BID of this type, for this purpose would require a majority vote of the assessed businesses (hotels) and a majority vote of the City Council. The vote of the businesses is weighted by the estimated amount of the real assessment.
4 From Piper Jaffary presentation July 6, pg. 9 (TOT or TMD Reference)
n Revenue Potential: (Assumes flat rate throughout District, no zones)
• Citywide @ 1% = $14,700,000
• Citywide @ 2% = $29,400,000
• Citywide @ 3% =$44,100,000
• Downtown @ 1% = $5,160,000
• Downtown @ 2% = $10,320,000
• Downtown @ 3% = $15,480,000
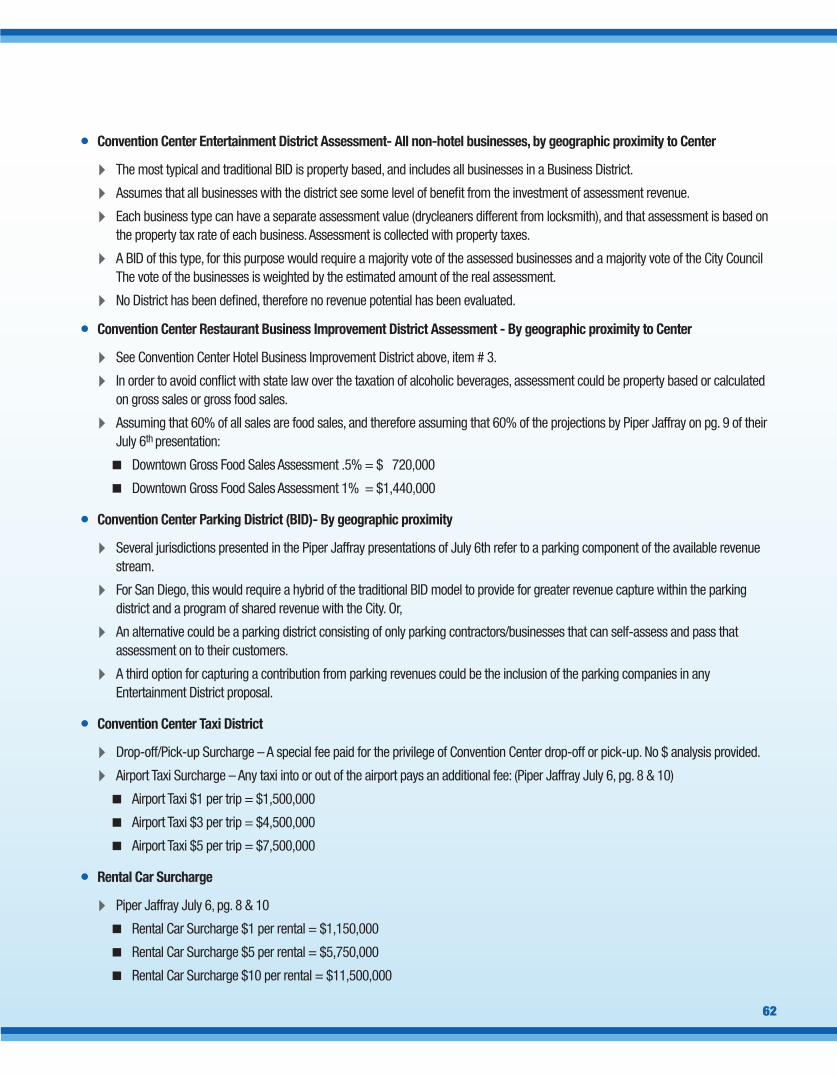
��
• Convention Center Entertainment District Assessment- All non-hotel businesses, by geographic proximity to Center
4 The most typical and traditional BID is property based, and includes all businesses in a Business District.
4 Assumes that all businesses with the district see some level of benefit from the investment of assessment revenue.
4 Each business type can have a separate assessment value (drycleaners different from locksmith), and that assessment is based on the property tax rate of each business. Assessment is collected with property taxes.
4 A BID of this type, for this purpose would require a majority vote of the assessed businesses and a majority vote of the City Council The vote of the businesses is weighted by the estimated amount of the real assessment.
4 No District has been defined, therefore no revenue potential has been evaluated.
• Convention Center Restaurant Business Improvement District Assessment - By geographic proximity to Center
4 See Convention Center Hotel Business Improvement District above, item # 3.
4 In order to avoid conflict with state law over the taxation of alcoholic beverages, assessment could be property based or calculated on gross sales or gross food sales.
4 Assuming that 60% of all sales are food sales, and therefore assuming that 60% of the projections by Piper Jaffray on pg. 9 of their July 6th presentation:
n Downtown Gross Food Sales Assessment .5% = $ 720,000
n Downtown Gross Food Sales Assessment 1% = $1,440,000
• Convention Center Parking District (BID)- By geographic proximity
4 Several jurisdictions presented in the Piper Jaffray presentations of July 6th refer to a parking component of the available revenue stream.
4 For San Diego, this would require a hybrid of the traditional BID model to provide for greater revenue capture within the parking district and a program of shared revenue with the City. Or,
4 An alternative could be a parking district consisting of only parking contractors/businesses that can self-assess and pass that assessment on to their customers.
4 A third option for capturing a contribution from parking revenues could be the inclusion of the parking companies in any Entertainment District proposal.
• Convention Center Taxi District
4 Drop-off/Pick-up Surcharge – A special fee paid for the privilege of Convention Center drop-off or pick-up. No $ analysis provided.
4 Airport Taxi Surcharge – Any taxi into or out of the airport pays an additional fee: (Piper Jaffray July 6, pg. 8 & 10)
n Airport Taxi $1 per trip = $1,500,000
n Airport Taxi $3 per trip = $4,500,000
n Airport Taxi $5 per trip = $7,500,000
• Rental Car Surcharge
4 Piper Jaffray July 6, pg. 8 & 10
n Rental Car Surcharge $1 per rental = $1,150,000
n Rental Car Surcharge $5 per rental = $5,750,000
n Rental Car Surcharge $10 per rental = $11,500,000

��
• Convention Center Service Contractor Fee
4 Piper Jaffray June 15, pg. 15
4 New Orleans
n Convention Center service contractor fee of 2.0 percent of gross sales in the Center.
• Incremental Convention Center Parking Fees - 100% of all above 2007 baseline
4 An increase in Convention Center business will potentially increase demand for Convention Center and adjacent Port owned parking.
Establish a revenue baseline before expansion and then dedicate any incremental increase in parking revenue to off-set expansion
costs.
• Contribution of land and other concessions from Unified Port of San Diego
4 Piper Jaffray July 6, pg. 4
n Convention Center Construction Cost Estimate
• Owner Soft costs including land = $86,258,000 (partial?)
4 Other Concessions
n As negotiated
