mba busadmin 774 - cgb multiples 30 may 2014 .pdf · market multiples are a result of valuation –...
TRANSCRIPT

Valuation Multiples
Jai Basrur
30 May 2014
MBA BUSADMIN 774
Discussion Outline
Participant Objectives
Trends and current issues
Principles
Valuation Methods and Considerations
Cases
Questions and Discussion
2
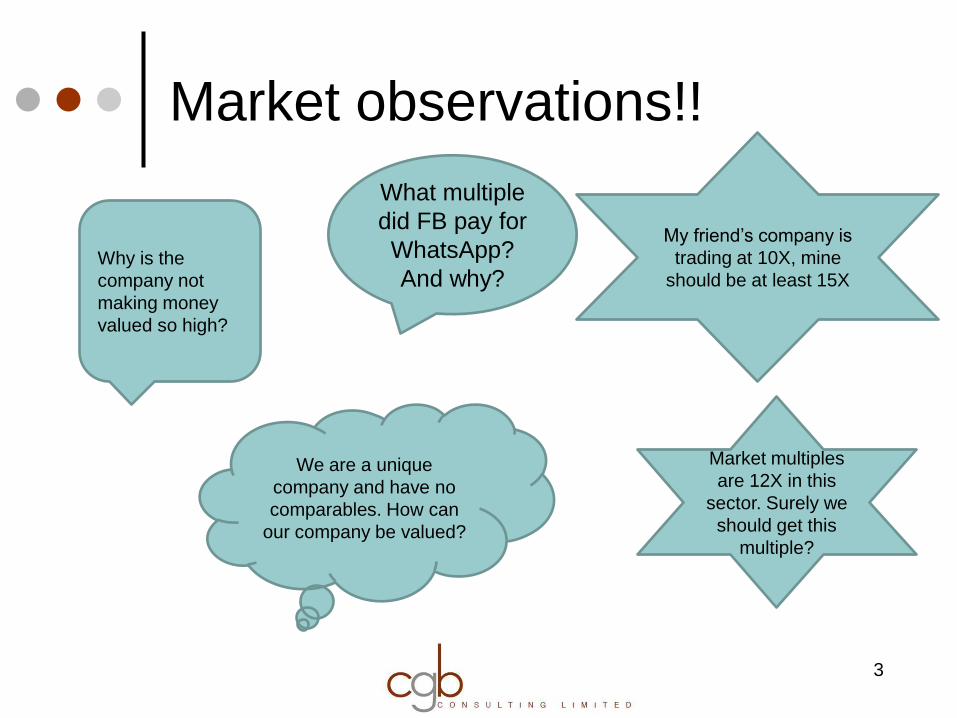
Market observations!!
3
Why is the
company not
making money
valued so high?
My friend’s company is
trading at 10X, mine
should be at least 15X
We are a unique
company and have no
comparables. How can
our company be valued?
Market multiples
are 12X in this
sector. Surely we
should get this
multiple?
What multiple
did FB pay for
WhatsApp?
And why?
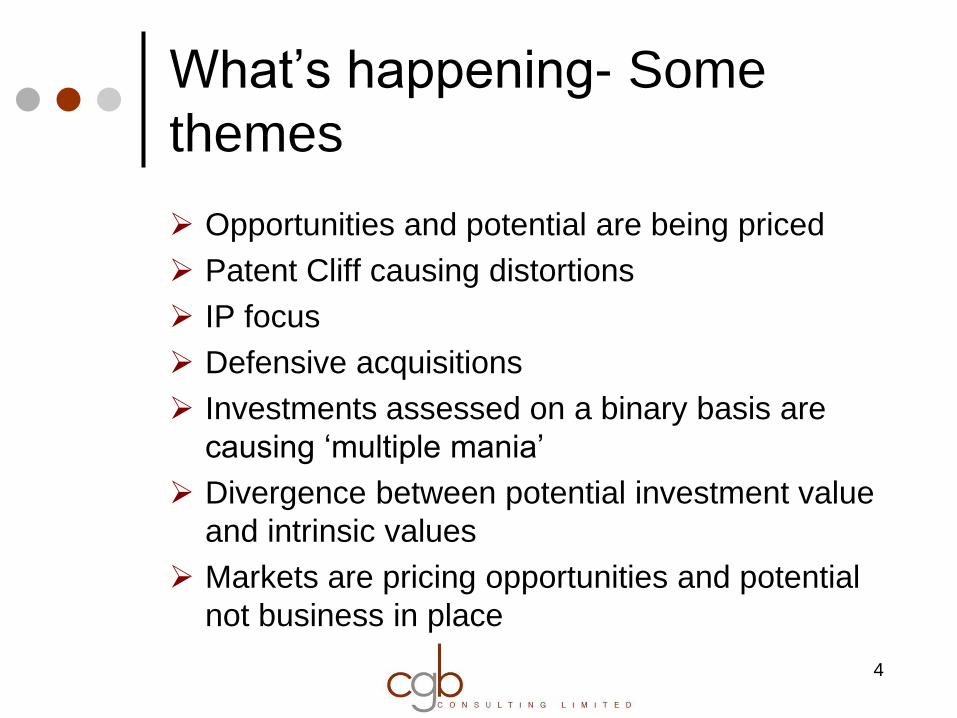
What’s happening- Some
themes
Opportunities and potential are being priced
Patent Cliff causing distortions
IP focus
Defensive acquisitions
Investments assessed on a binary basis are
causing ‘multiple mania’
Divergence between potential investment value
and intrinsic values
Markets are pricing opportunities and potential
not business in place
4
5
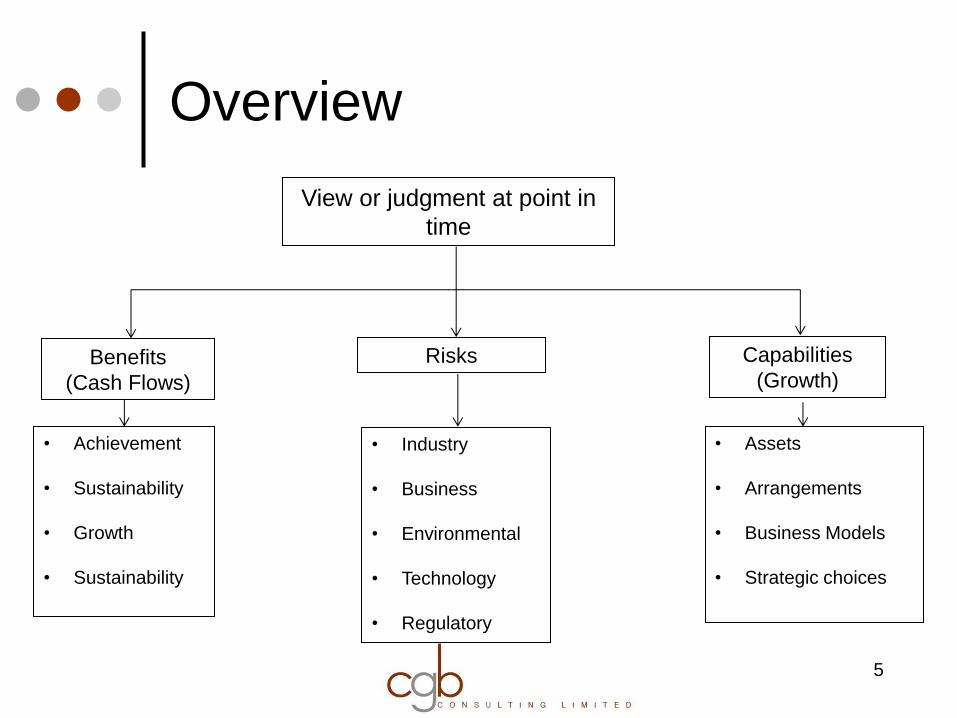
Overview
Benefits
(Cash Flows)
Risks
View or judgment at point in
time
• Achievement
• Sustainability
• Growth
• Sustainability
• Industry
• Business
• Environmental
• Technology
• Regulatory
Capabilities
(Growth)
• Assets
• Arrangements
• Business Models
• Strategic choices
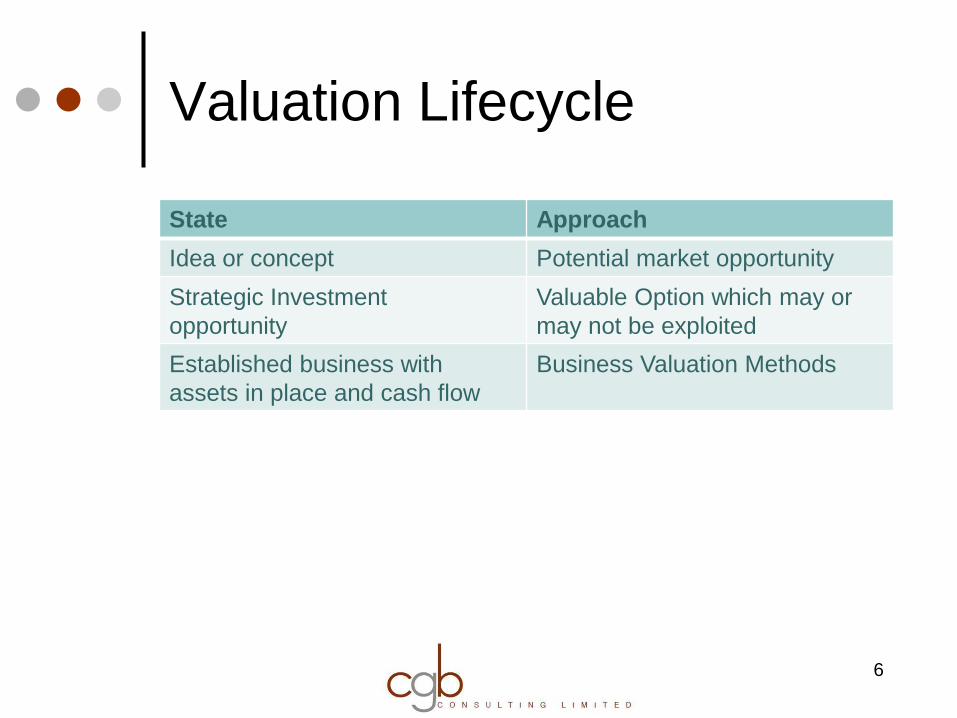
Valuation Lifecycle
State Approach
Idea or concept Potential market opportunity
Strategic Investment
opportunity
Valuable Option which may or
may not be exploited
Established business with
assets in place and cash flow
Business Valuation Methods
6
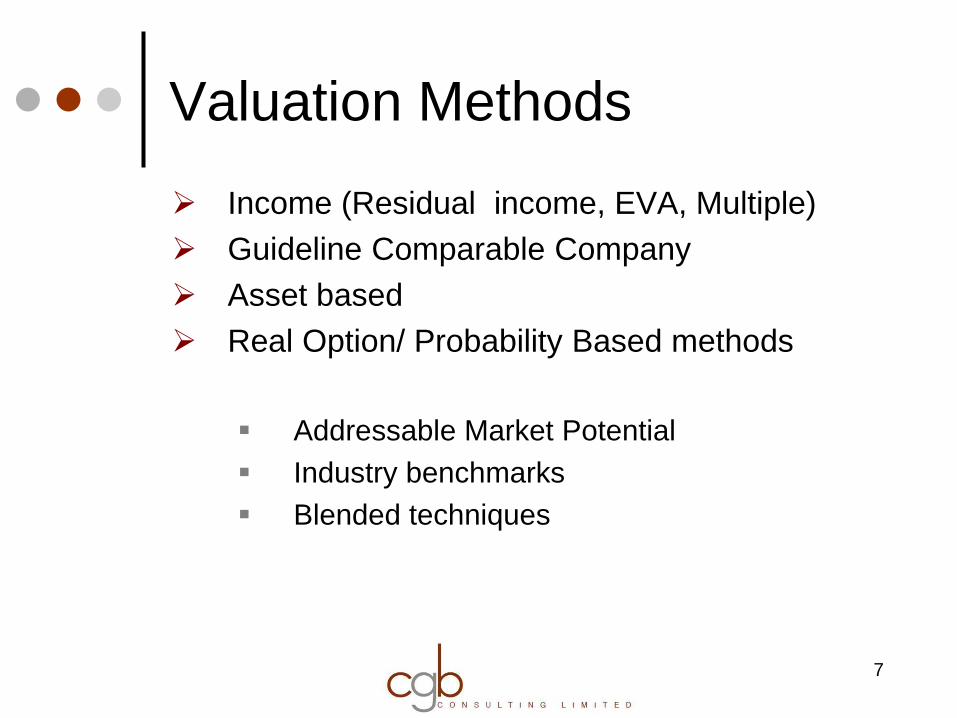
Valuation Methods
Income (Residual income, EVA, Multiple)
Guideline Comparable Company
Asset based
Real Option/ Probability Based methods
Addressable Market Potential
Industry benchmarks
Blended techniques
7
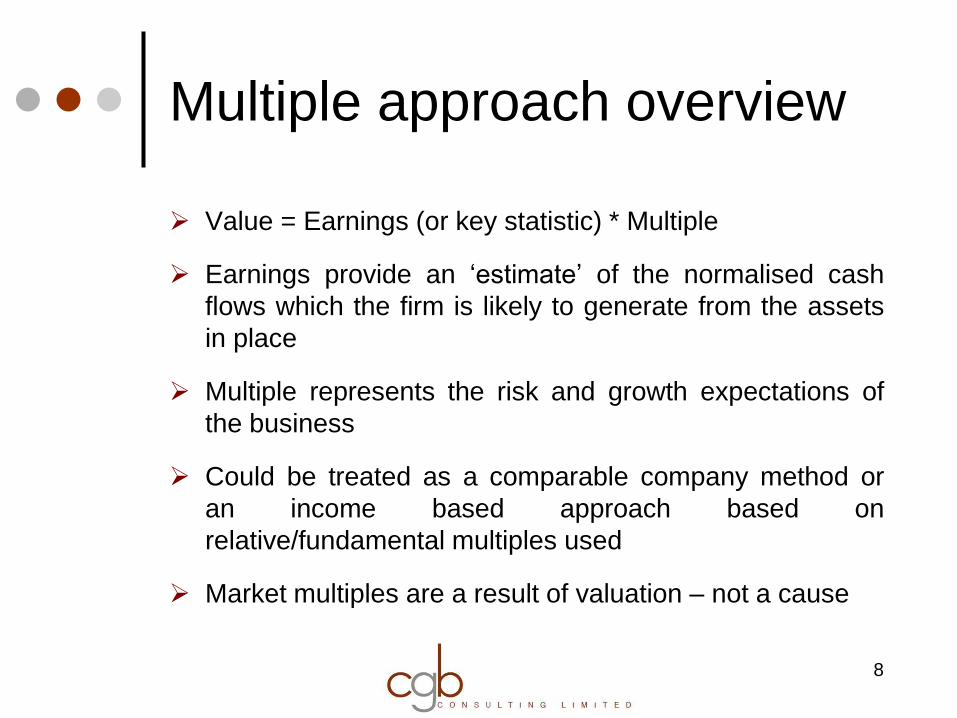
Multiple approach overview
Value = Earnings (or key statistic) * Multiple
Earnings provide an ‘estimate’ of the normalised cash
flows which the firm is likely to generate from the assets
in place
Multiple represents the risk and growth expectations of
the business
Could be treated as a comparable company method or
an income based approach based on
relative/fundamental multiples used
Market multiples are a result of valuation – not a cause
8
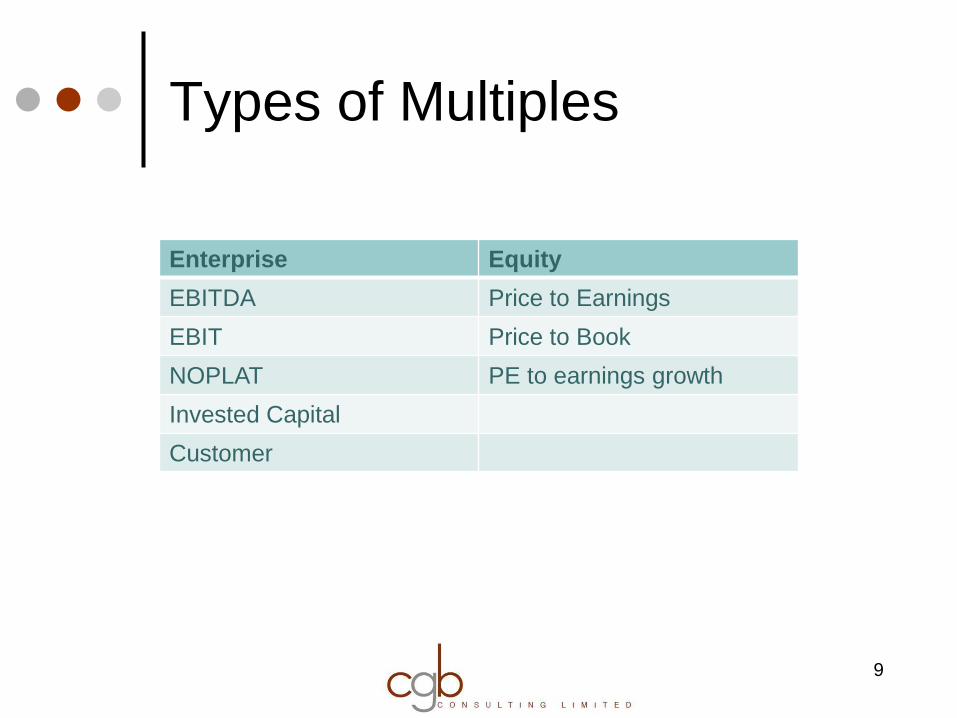
Types of Multiples
9
Enterprise Equity
EBITDA Price to Earnings
EBIT Price to Book
NOPLAT PE to earnings growth
Invested Capital
Customer
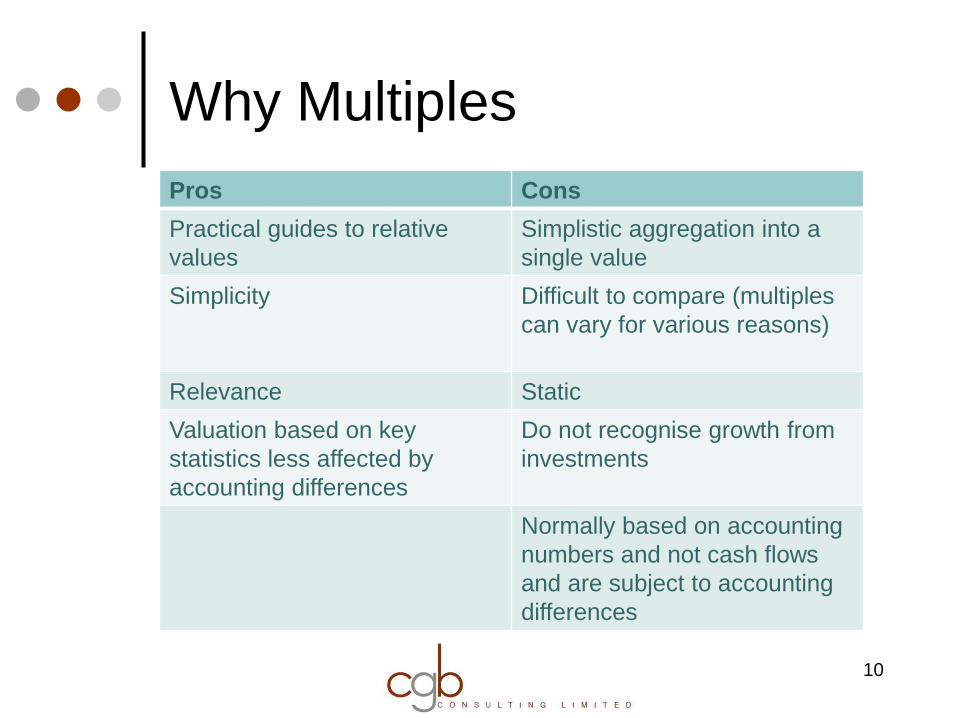
Why Multiples
10
Pros Cons
Practical guides to relative
values
Simplistic aggregation into a
single value
Simplicity Difficult to compare (multiples
can vary for various reasons)
Relevance Static
Valuation based on key
statistics less affected by
accounting differences
Do not recognise growth from
investments
Normally based on accounting
numbers and not cash flows
and are subject to accounting
differences
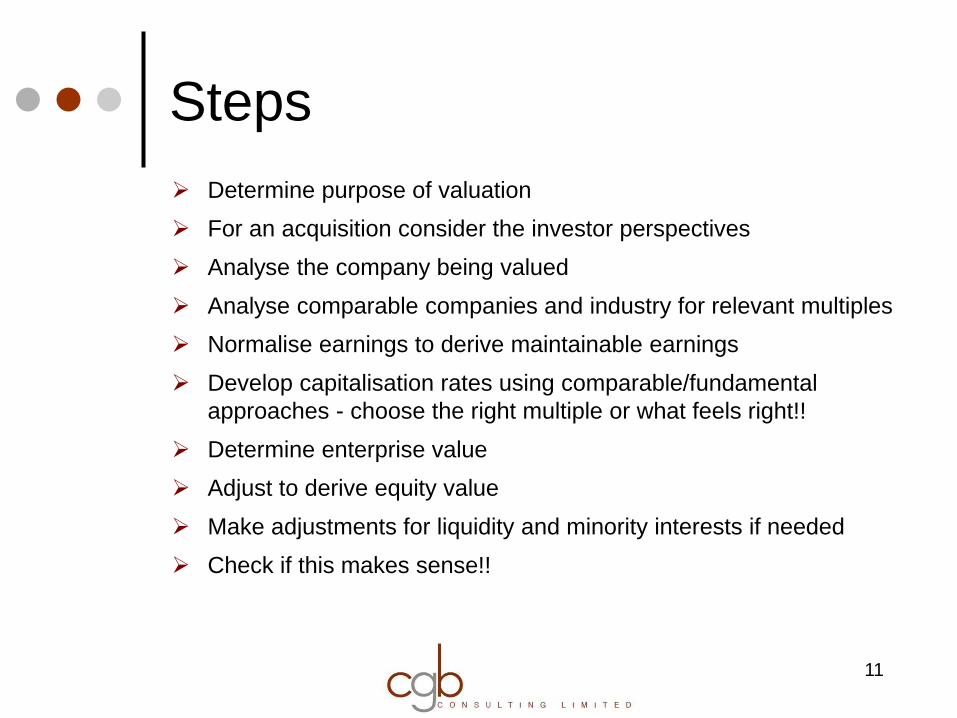
Steps
Determine purpose of valuation
For an acquisition consider the investor perspectives
Analyse the company being valued
Analyse comparable companies and industry for relevant multiples
Normalise earnings to derive maintainable earnings
Develop capitalisation rates using comparable/fundamental
approaches - choose the right multiple or what feels right!!
Determine enterprise value
Adjust to derive equity value
Make adjustments for liquidity and minority interests if needed
Check if this makes sense!!
11
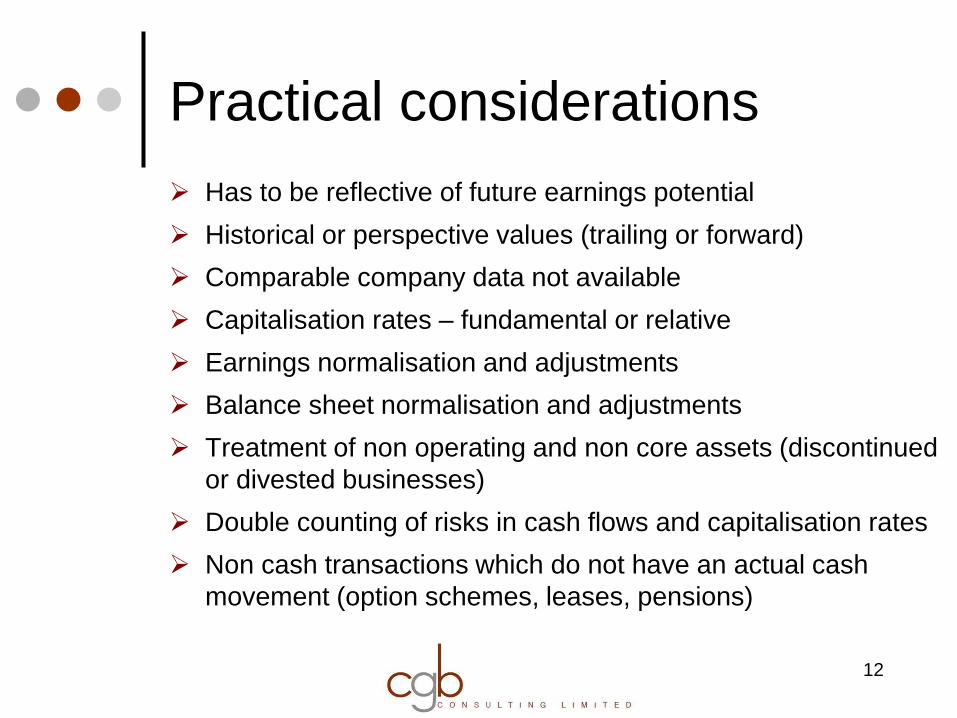
Practical considerations
Has to be reflective of future earnings potential
Historical or perspective values (trailing or forward)
Comparable company data not available
Capitalisation rates – fundamental or relative
Earnings normalisation and adjustments
Balance sheet normalisation and adjustments
Treatment of non operating and non core assets (discontinued
or divested businesses)
Double counting of risks in cash flows and capitalisation rates
Non cash transactions which do not have an actual cash
movement (option schemes, leases, pensions)
12
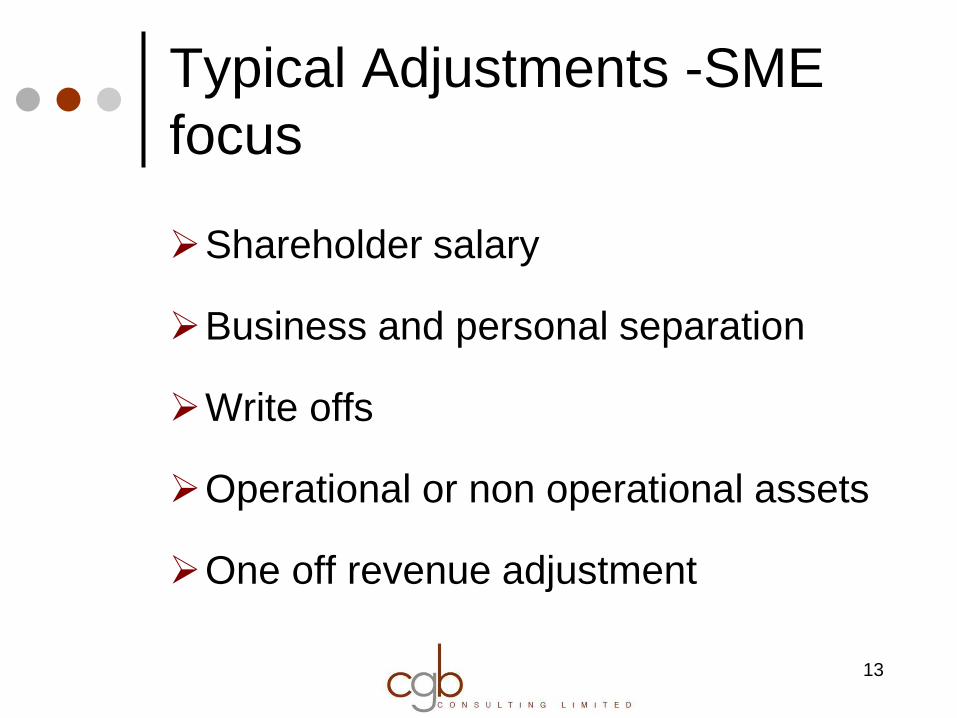
Typical Adjustments -SME
focus
Shareholder salary
Business and personal separation
Write offs
Operational or non operational assets
One off revenue adjustment
13
Balance sheet adjustments
Working capital
Net debt
Shareholder loans and shareholder
current account
14
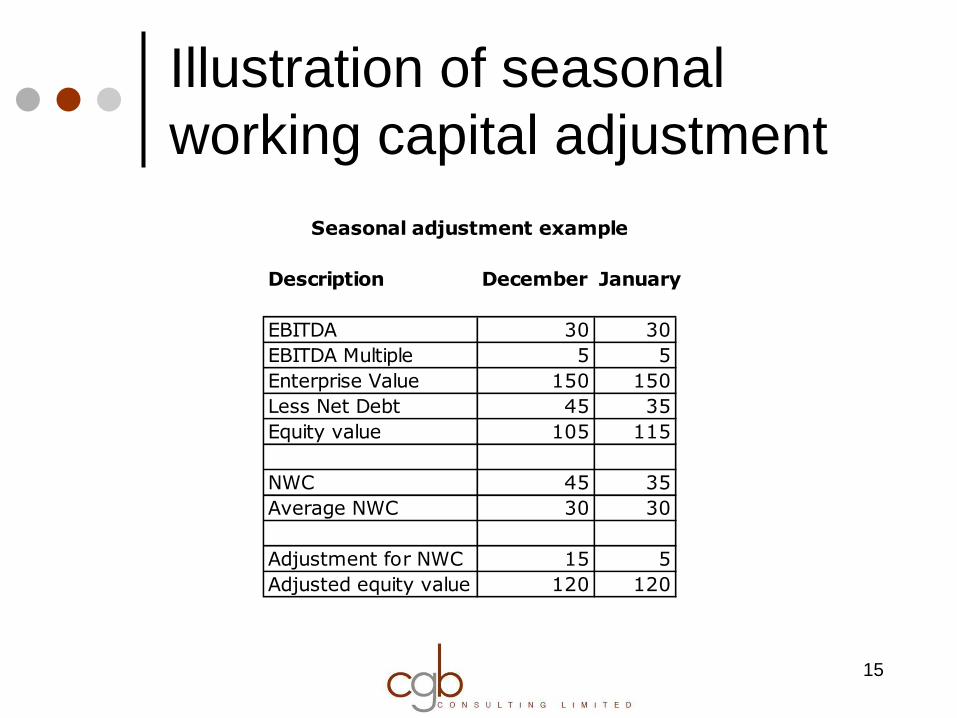
Illustration of seasonal
working capital adjustment
15
Description December January
EBITDA 30 30
EBITDA Multiple 5 5
Enterprise Value 150 150
Less Net Debt 45 35
Equity value 105 115
NWC 45 35
Average NWC 30 30
Adjustment for NWC 15 5
Adjusted equity value 120 120
Seasonal adjustment example
Choosing an appropriate
multiple
Matter of individual judgment and common sense
Be careful in using transaction multiples as they
represent specific investor perspectives/control/specific
synergy considerations
Check multiples correspond to equivalent stages in
company’s development
Consider relative and fundamental multiples
16
Buildup approach
Risk free rate
Risk premium
Small company risk adjustment
Specific risk adjustments for investment
stratification, key person dependencies
Pragmatism
17
Valuation Adjustments
Discount and premium adjustments
Liquidity
Marketability
Restricted stock
No blanket rule!!
18
Case: Acquisition valuation
F and B business
Strong value chain
Established presence in a growing
beverage category
Involved in contract processing and
own brand production
At cross roads; exiting shareholder
Strategic assessment of options
19
20
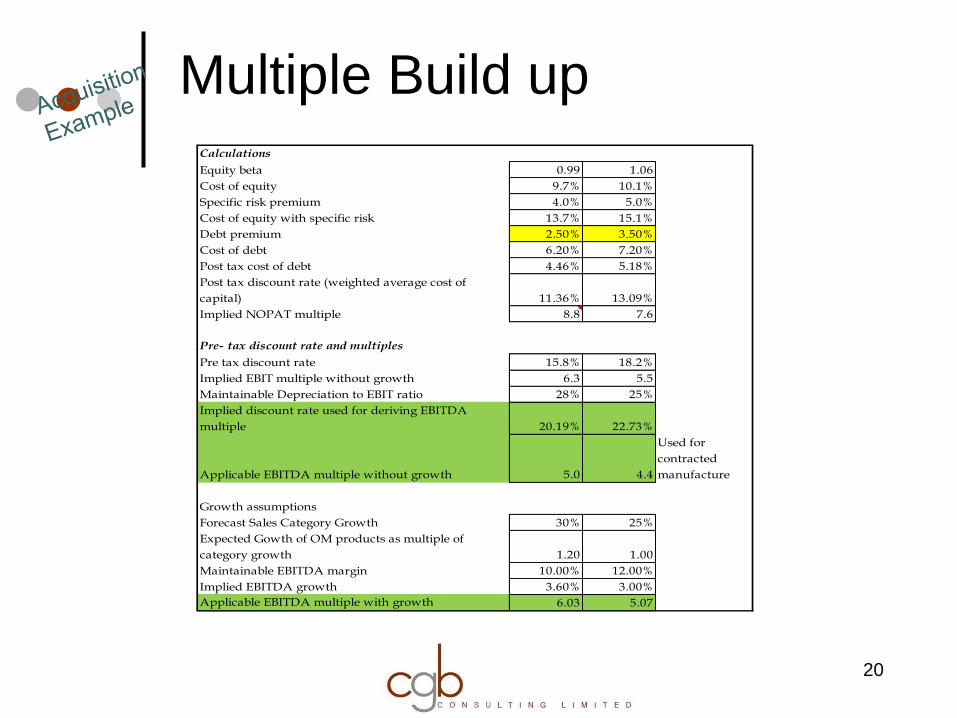
Calculations
Equity beta 0.99 1.06
Cost of equity 9.7% 10.1%
Specific risk premium 4.0% 5.0%
Cost of equity with specific risk 13.7% 15.1%
Debt premium 2.50% 3.50%
Cost of debt 6.20% 7.20%
Post tax cost of debt 4.46% 5.18%
Post tax discount rate (weighted average cost of
capital) 11.36% 13.09%
Implied NOPAT multiple 8.8 7.6
Pre- tax discount rate and multiples
Pre tax discount rate 15.8% 18.2%
Implied EBIT multiple without growth 6.3 5.5
Maintainable Depreciation to EBIT ratio 28% 25%
Implied discount rate used for deriving EBITDA
multiple 20.19% 22.73%
Applicable EBITDA multiple without growth 5.0 4.4
Used for
contracted
manufacture
Growth assumptions
Forecast Sales Category Growth 30% 25%
Expected Gowth of OM products as multiple of
category growth 1.20 1.00
Maintainable EBITDA margin 10.00% 12.00%
Implied EBITDA growth 3.60% 3.00%
Applicable EBITDA multiple with growth 6.03 5.07
Multiple Build up
21
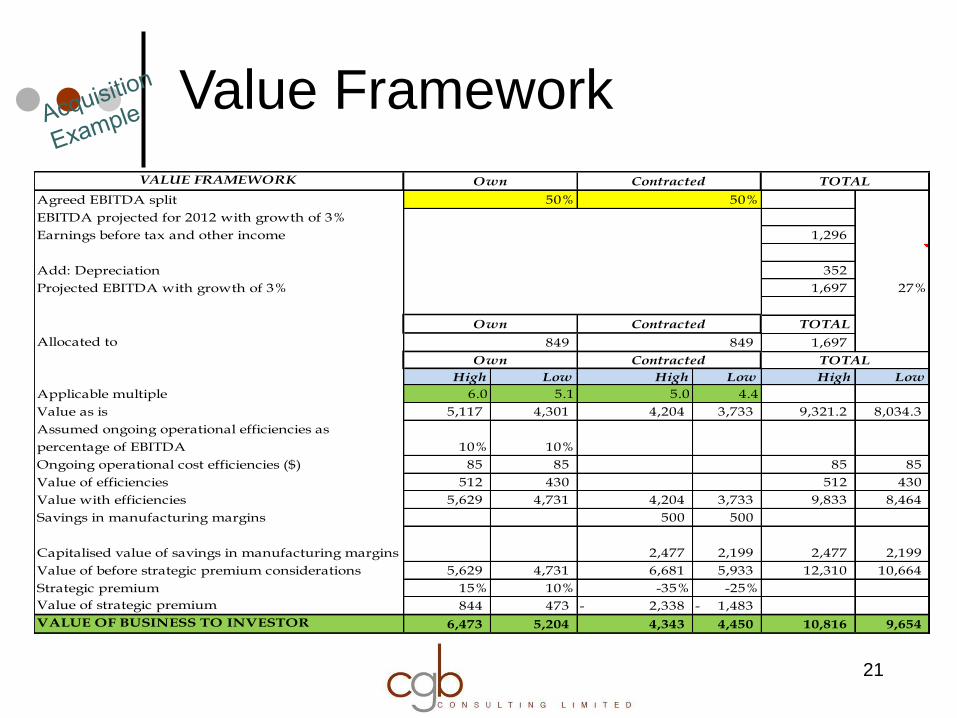
VALUE FRAMEWORK
Agreed EBITDA split
EBITDA projected for 2012 with growth of 3%
Earnings before tax and other income 1,296
Add: Depreciation 352
Projected EBITDA with growth of 3% 1,697 27%
TOTAL
Allocated to 1,697
High Low High Low High Low
Applicable multiple 6.0 5.1 5.0 4.4
Value as is 5,117 4,301 4,204 3,733 9,321.2 8,034.3
Assumed ongoing operational efficiencies as
percentage of EBITDA 10% 10%
Ongoing operational cost efficiencies ($) 85 85 85 85
Value of efficiencies 512 430 512 430
Value with efficiencies 5,629 4,731 4,204 3,733 9,833 8,464
Savings in manufacturing margins 500 500
Capitalised value of savings in manufacturing margins 2,477 2,199 2,477 2,199
Value of before strategic premium considerations 5,629 4,731 6,681 5,933 12,310 10,664
Strategic premium 15% 10% -35% -25%
Value of strategic premium 844 473 2,338- 1,483-
VALUE OF BUSINESS TO INVESTOR 6,473 5,204 4,343 4,450 10,816 9,654
TOTAL
Own Contracted
849 849
Own Contracted
Own
50%
Contracted
50%
TOTAL
Value Framework
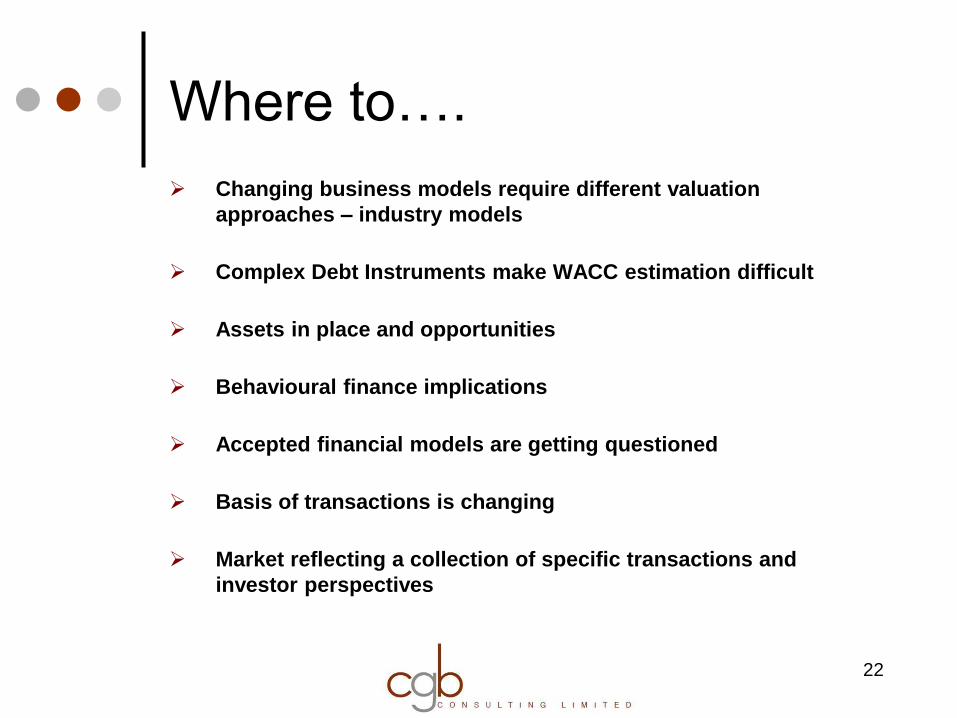
Where to….
Changing business models require different valuation
approaches – industry models
Complex Debt Instruments make WACC estimation difficult
Assets in place and opportunities
Behavioural finance implications
Accepted financial models are getting questioned
Basis of transactions is changing
Market reflecting a collection of specific transactions and
investor perspectives
22
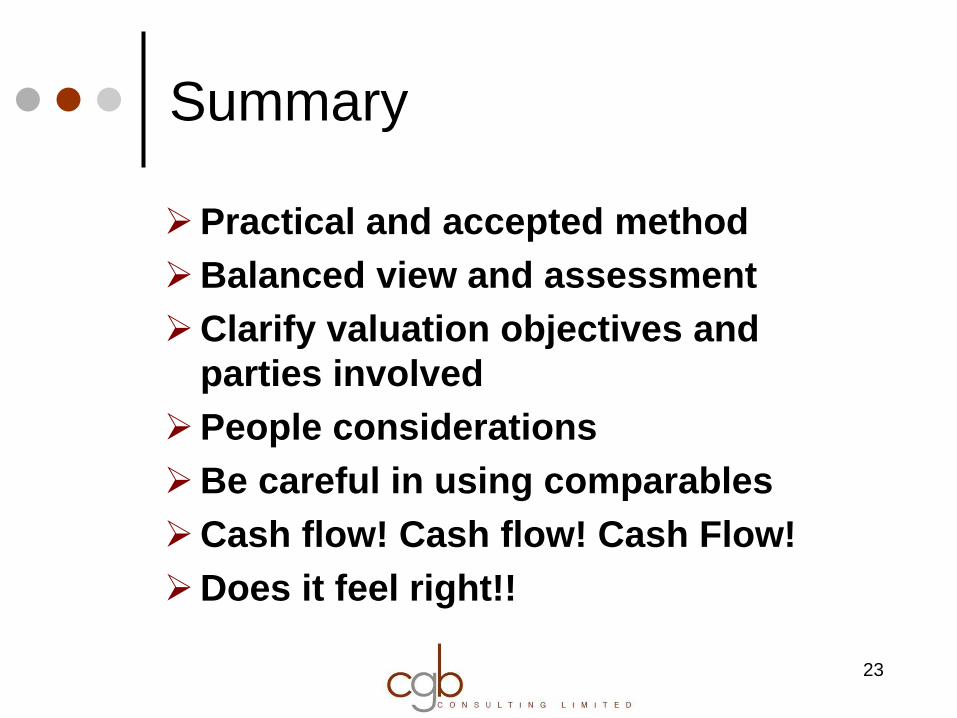
Summary
Practical and accepted method
Balanced view and assessment
Clarify valuation objectives and
parties involved
People considerations
Be careful in using comparables
Cash flow! Cash flow! Cash Flow!
Does it feel right!!
23

Questions and Sharing
24

Thank you for the
opportunity to share!!
25
Jai Basrur
CGB Consulting Limited
Auckland
Tel: (09) 366 5072
Mob: 021 707 775
E-mail: [email protected]