mbta youth pass pilot evaluation youth pass pilot evaluation final report project manager laurel...
TRANSCRIPT

MBTA Youth Pass Pilot Evaluation
Final Report
Project Manager
Laurel Paget-Seekins, MBTA
Data Analysts
Ian Thistle, MBTA
Joaquin Osio-Norgaard, MBTA
Annette Demchur, CTPS
Andrew Reker, CTPS
Michelle Scott, CTPS
Linghong Zou, CTPS
June 2016

Youth Pass FINAL Report 060616 Page 2 of 93
ABSTRACT
The Youth Pass Pilot has increased transit access for primarily low-income and minority
youth, allowing them access to recreational opportunities, work, school, and medical
appointments they would not have had otherwise. Participants are 92 percent minority
and 76 percent low-income, and their MBTA usage on average increased approximately
30 percent during school months and 60 percent during summer months. Participants
report that without the Youth Pass they would have still taken 60 percent of their trips on
the MBTA, but they would have been unable to make13 percent of their trips. Seventy-
three percent of the applicants for the Youth Pass are eligible for the existing MBTA
reduced-fare Student Monthly LinkPass, but unable to access it due to their school not
offering it or the limitations on summer months.
The pilot is having minimum impacts on the MBTA revenues and service because of low
participation. Data does suggest it is reducing payments in cash onboard vehicles. The
collaborative partnership with municipalities has yielded an auditable reduced fare
program with limited administrative impact for the MBTA. However, there is a high
burden on the municipal partners due to the cash handling; the recommendation to
continue the program past a pilot would be to put payment for the pass on the MBTA
fare vending machines.
After the mid-pilot review, the MBTA Fiscal and Management Control Board voted to
extend the Student Pass year round and put access to the pass on the fare vending
machines. This left two categories of youth in the pilot without access to a reduced-fare pass: 12–18 year olds not in high school or middle school and 19–21 year olds who
pass a means-tested screen. Using data collected during the pilot about MBTA usage,
the cost to extend the Youth Pass to these two groups was estimated. The range of lost
fare revenue estimates is based on assumptions of municipal opt-in and participation
rates by eligible youth.
Using an estimate of 15 percent participation, the estimated cost of a full Youth Pass
program in annual lost fare revenue would range from $406,000 for the existing partner
cities to $593,000 if all 17 MBTA core municipalities join the program. The estimated
fare revenue loss at a more conservative estimate of 30 percent participation would
range from $812,000 to $1,186,000. The impact of the additional trips on MBTA service
is expected to be minimal.

Youth Pass FINAL Report 060616 Page 3 of 93
TABLE OF CONTENTS PAGE
ABSTRACT ............................................................................................................... 2
Chapter 1—Youth Pass Pilot Program Background ........................................................ 4
1.1 MBTA and Partner Collaboration ............................................................ 4
1.2 Youth Pass Pilot Program ....................................................................... 5
1.3 Pilot Evaluation ....................................................................................... 6
Chapter 2—Pilot Impacts on Youth Riders ..................................................................... 8
2.1 Pilot Program Applicant Characteristics .................................................. 8
2.2 Youth Pass Participant Characteristics ................................................. 12
2.3 Youth Pass Participant’s Use of Public Transit ..................................... 15
2.4 Trip Purpose and Potential Foregone Trips........................................... 20
2.5 Youth Riders’ Attitudes about the MBTA and Public Transit ................. 24
Chapter 3—Pilot Impacts on the MBTA ........................................................................ 27
3.1 Impacts on MBTA Fare Revenues ........................................................ 27
3.2 Impacts on MBTA Service ..................................................................... 34
3.3 Summary of Title VI Fare Equity Analysis ............................................. 39
3.4 Impacts on MBTA Service (Cash Handling, Conflicts with Employees, Fare
Evasion) ................................................................................................ 40
Chapter 4—Pilot Administrative Feasibility ................................................................... 42
4.1 Pilot Administrative Procedures ............................................................ 42
4.2 Administrative Feasibility ....................................................................... 44
Chapter 5—Pilot Program Evaluation and Next Steps .................................................. 46
5.1 Summary of Program Evaluation Findings ............................................ 46
5.2 Program Evaluation Challenges and Limitations ................................... 46
5.3 Factors Affecting the Future of the Youth Pass ..................................... 47
5.4 Full Program Recommendations ........................................................... 48
5.5 Youth Pass Program Scenario Evaluation ............................................ 48
5.6 Conclusions ........................................................................................... 72
Appendices 74
A. Data Sources ................................................................................................ 74
B. Scenario Evaluation Methodology Details ..................................................... 77

Youth Pass FINAL Report 060616 Page 4 of 93
Chapter 1—Youth Pass Pilot Program Background
The Massachusetts Bay Transportation Authority (MBTA) conducted a pilot program for
a Youth Pass, a reduced-fare product that complements the existing Student Monthly
LinkPass. The existing Student Monthly LinkPass provides unlimited travel on MBTA
rapid transit and buses for middle and high school students for $26 per month (going to
$30 on July 1, 2016). However, youth access to the Student Monthly LinkPass was
limited by the following factors:
• Boston Public Schools subsidizes the pass only for the students who meet the
minimum-distance-from-school requirement.
• Many other schools in the MBTA service area do not distribute Student Monthly
LinkPasses (either subsidized or for sale) to their students.
• The Student Monthly LinkPass is available only to currently enrolled full-time
students, which excludes many youth who are enrolled in alternative education
programs.
• Most students could not obtain reduced-fare passes during the summer months.
In order to explore ways to address some of these barriers, the MBTA, along with
community stakeholders and municipal partners, developed a Youth Pass pilot program.
This pilot program was designed to test the feasibility of implementing a full Youth Pass
program, which would provide all eligible youth in participating municipalities with equal
access to a reduced-fare product and close some of the access gaps in the current
Student Pass program. This program also pilots providing the same reduced-fare pass
to young people 19 to 21 years old who are either enrolled in an alternative education
program or satisfy a means test. This pilot program was approved by the
MBTA/MassDOT Board of Directors in December 2014 and officially launched in July
2015, with the intention of running for one year. The pilot program is scheduled to end
on June 30, 2016.
1.1 MBTA and Partner Collaboration
The Youth Pass Pilot is the result of a multi-year campaign by youth transportation
advocates. In the summer of 2014, the leadership of MBTA/MassDOT created a Youth
Pass Working Group with members of the advocacy community to develop the details of
a pilot program. The pilot was approved by the MBTA/MassDOT Board in December
2014. Four municipalities agreed to participate in the pilot: Boston, Chelsea, Malden,
and Somerville (with a non-profit serving as the implementing agency in Chelsea). The
details of the program were developed through a collaborative effort between the MBTA
and the municipal partners. Each implementing agency signed a Memorandum of
Understanding with the MBTA and agreed to follow the rules for the program laid out in

Youth Pass FINAL Report 060616 Page 5 of 93
a policy handbook written by the MBTA. After the program launched on July 1, 2015,
the MBTA and the municipal partners met monthly to review the program’s progress.
1.2 Youth Pass Pilot Program
The Youth Pass Pilot program was limited to 1,500 participants between the ages of 12
and 21 in the cities of Boston, Chelsea, Malden, and Somerville, which serve as
municipal partners in administering the program. For the pilot program, all individuals
ages 12 through 18 who live in participating municipalities were eligible, and individuals
19 to 21 years old were eligible if they meet needs-based criteria by demonstrating one
or more of the following: enrollment in high school, a General Education Development
(GED) program, or another education program; a job training program; a state or federal
public benefit program (such as the Supplemental Nutrition Assistance Program
(SNAP), the Special Supplemental Nutrition program for Women, Infants, and Children
(WIC), Transitional Aid for Families with Dependent Children (TAFDC), public housing
or other assistance programs); or Mass Health. Youth who were accepted into the pilot
program could purchase a Youth Pass product through their local municipal partner
organization. The Youth Pass functions like a LinkPass (providing unlimited travel on
MBTA local bus and subway), but is branded as a Youth Pass. Monthly Youth passes
were sold at the Student Monthly LinkPass price of $26. The 7-day Youth Pass cost $7.
The Youth Pass Pilot was designed to meet the following major goals:
• Create affordable transit access for pilot participants
• Provide the data required to assess the impact of a Youth Pass on the mobility of
youth and their engagement in civic and community activities
• Have a limited impact on the MBTA’s revenue
• Provide the data required to estimate the impact of a permanent Youth Pass
program on MBTA fare revenue and service delivery
• Assess whether municipal partners can distribute reduced fare MBTA passes in
an audit-proof manner that minimizes the MBTA’s administrative burden
Municipal partners were responsible for the following aspects of the program:
• Recruiting participants
• Receiving enrollment forms and verifying eligibility for the program (including the
collection of required documents)
• Taking photos and producing the Youth Pass cards using card printers provided
by the MBTA. The Youth Pass Card is a picture ID printed on a blank Charlie
Card with its own unique design
• Administering surveys to participants

Youth Pass FINAL Report 060616 Page 6 of 93
• Collecting payment from participants for passes each month (or week, if
applicable) and using MBTA-provided retail sales terminals (RSTs) to add the
appropriate product onto the pass
• Administering the program in a way that could be tracked and audited
• Providing language assistance, including interpretation and translation of
materials into languages other than English, based on the needs of their
community and consistent with the protocols identified in the MBTA’s Limited
English Proficiency Plan
The MBTA and the partners worked together to market the Youth Pass pilot. Youth
interested in participating in the program were able to apply via an online form on the
MBTA website through the end of April 2016. During the initial application period,
waiting lists were established because the number of applicants exceeded the number
of available pilot slots in some municipalities. All applicants were given a chance to
participate after these initial waiting lists were cleared.
Youth from the applicant pool were contacted by the municipal partner agency to
arrange a time to come into their office to enroll. When enrolling youth, the municipal
partner determined applicant eligibility, and applicants completed an intake survey.
Enrollees also filled out a permission form allowing the MBTA to anonymously track
their trips for 30 days so that the MBTA would have pre-pilot trip usage data to compare
to data gathered during the pilot program. If enrollees did not already have a
CharlieCard that the MBTA could track, they received one without value to use to gather
30 days of pre-pilot trip data (participants had to add value to the card during the first 30
days).
After 30 days, the participant could return and have their picture taken for a Youth Pass
card. Once they completed this process, participants could purchase a monthly or
Youth Pass, depending on availability in each municipality. Chelsea, Malden, and
Somerville offered both monthly and weekly passes, while Boston initially only offered
the monthly pass, but added the weekly midway through the pilot. Participants were
required to fill out a survey each month when they returned to purchase the pass.
1.3 Pilot Evaluation
The proposal for the Youth Pass Pilot, passed by the MBTA/MassDOT Board of
Directors, identified research questions the pilot was designed to answer. A mid-point
evaluation of the program was completed in December 2015, along with a Title VI fare
equity analysis, as required by the Federal Transit Administration (FTA) for the pilot to
proceed beyond six months. This report provides a final evaluation of these questions,
using data collected through March 2016. It focuses on three main areas: the benefits of
the program to the participants, the costs of the program to the MBTA, and the
administrative feasibility of the program model.

Youth Pass FINAL Report 060616 Page 7 of 93
1. Impacts on Youth Riders
a. Does the Youth Pass increase use of public transit and access to opportunities
for program participants?
b. Does the Youth Pass change youth riders’ attitudes toward the MBTA and public
transit?
2. Impacts on the MBTA
a. What is the impact of the Youth Pass program on MBTA fare revenues?
b. Does increased ridership from the Youth pass result in violations of MBTA
service standards? In particular, does the Youth Pass program result in
additional trips taken during peak ridership periods?
c. Does the Youth Pass improve MBTA service by decreasing cash handling,
conflict with MBTA employees, and fare evasion?
3. Administrative Feasibility
a. What are the administrative costs of the pilot program to the MBTA?
b. What are the administrative costs to the municipal partners, and is it sustainable?
c. Does the pilot create a procedure that is audit-proof, limits fraud, and is able to
be replicated?
This report also describes two scenarios for a permanent Youth Pass program, should it
be continued after June 30, 2016.
Much of the data for the analysis in this report comes from the participants, either from
surveys or from the Automated Fare Collection (AFC) system records of their transit
usage. A full list of the data sources used for this report is in Appendix A. MBTA staff
and the Central Transportation Planning Staff (CTPS) conducted the analysis of this
data.

Youth Pass FINAL Report 060616 Page 8 of 93
Chapter 2—Pilot Impacts on Youth Riders
This chapter describes the characteristics of Youth Pass applicants and pilot
participants, and discusses the impact of the Youth Pass on pilot participants’ travel
behavior.
2.1 Pilot Program Applicant Characteristics
Tables 2-1, 2-2, and 2-3 describe the applicants from each municipality and within each
reported age group, or reported school-enrollment category. This data is taken from
applications received as of May 1, 2016, after which applications for the pilot program
were no longer accepted. In total, 4,531 youth applied to the program, and CTPS used
data from 4,509 of these applicants for further analysis.1
Table 2-1 shows that most applicants reported that they live in Boston (approximately
78 percent), and most were in the 13-to-18-year-old age group (approximately 74
percent).
TABLE 2-1
Pilot Program Applicants
by Reported Municipality and Age Group
City
13–18 Years
Old
Percent 19–-21
Years Old
Percent Total
Boston 2,589 57.4% 939 20.8% 3,528
Chelsea 342 7.6% 63 1.4% 405
Malden 301 6.7% 109 2.4% 410
Somerville 103 2.3% 63 1.4% 166
Total 3,335 74.0% 1,174 26.0% 4,509
Data source: MBTA Youth Pass Pilot program application data
Note: All percentages are of total applicants.
1 The MBTA was restricted by law from collecting data on youth ages 12 and under as part of the pilot
program. According to applicant-provided birth years, 22 applicants were 12 years old or younger.
Their data is not included in Tables 2-1 through 2-4.

Youth Pass FINAL Report 060616 Page 9 of 93
Table 2-2 shows that approximately three quarters of applicants were enrolled in school.
TABLE 2-2
Pilot Program Applicants
by Reported Municipality and School Enrollment
City Enrolled
in School
Percent
Not Enrolled
in School
Percent Total
Boston 2,505 56.3% 983 22.1% 3,488
Chelsea 323 7.3% 76 1.7% 399
Malden 299 6.7% 102 2.3% 401
Somerville 112 2.5% 51 1.1% 163
Total 3,239 72.8% 1,212 27.2% 4,451
Data source: MBTA Youth Pass Pilot program application data. Note: All percentages are of total applicants. Fifty-eight applicants who did not provide school enrollment data, or provided conflicting school enrollment information, were not included in this table.
Table 2-3 categorizes applicants based on both age and school enrollment. The largest
group of applicants was made up of youth ages 13-18 who are enrolled in school, while
the second largest group was made up of youth aged 19-21 who were not enrolled in
school. About 73 percent of Youth Pass pilot program applicants were enrolled in
middle or high school, though this share varied by reported age group. Approximately
90 percent of applicants under the age of 18 were enrolled in school, while 79 percent
of applicants between 19 and 21 years old were not enrolled in school.
TABLE 2-3
Pilot Program Applicants
by Reported Age and School Enrollment
Age of Applicant Enrolled in
School
Percent Not Enrolled
in School
Percent Total
13–18 Years Old 3,000 67.4% 319 7.2% 3,319
19–-21 Years Old 239 5.4% 893 20.1% 1,132
Total 3,239 72.8% 1,212 27.2% 4,451
Data source: MBTA Youth Pass Pilot program application data
Note: All percentages are of total applicants.

Youth Pass FINAL Report 060616 Page 10 of 93
Figure 2-1 describes the fare products that applicants reported using to pay MBTA
fares. In general, Youth Pass pilot program applicants used different methods of
payment depending on their school-enrollment status. Predictably, more school-enrolled
applicants used student fare products, such as the Student Monthly LinkPass, while
applicants who were not enrolled in school more commonly used a CharlieCard, cash,
or a 7-Day LinkPass.
FIGURE 2-1 Fare Payment Methods used by Pilot Program Applicants
Data source: MBTA Youth Pass Pilot program application data
Note: Applicants were allowed to select more than one option.
Table 2-4 focuses more specifically on applicants who have reported paying for MBTA
trips with student fare media. Approximately 50 percent of school-enrolled applicants
and approximately 6 percent of out-of-school applicants reported using Student Monthly
LinkPasses; fewer in each group reported using Student Stored-Value CharlieCards.
0
200
400
600
800
1,000
1,200
1,400
1,600
1,800
Paid withStudent
Monthly Pass
Paid withCash
Paid withCharlieCard
Paid withStudent
CharlieCard
Paid withCharlie Ticket
Paid with 7-day Pass
Num
ber
of
Applic
ants
Enrolled in School Not Enrolled in School

Youth Pass FINAL Report 060616 Page 11 of 93
TABLE 2-4
Student Fare Media used by Pilot Program Applicants
School Enrollment Category
Have paid with a
Student Monthly
LinkPass Percent
Have paid with
S-Card Percent
Have paid with
S-Card or
Monthly Pass Percent
Total Applicants
in Category Enrolled in
School 1,633 50.4% 688 21.2% 2,321 71.7% 3,239
Not Enrolled in School 71 5.9% 34 2.8% 105 8.7% 1,212
Total 1,704 38.3% 722 16.2% 2,426 54.5% 4,451
Data source: MBTA Youth Pass Pilot program application data
Note: All percentages are of the row total.
Approximately 73 percent of all applicants are enrolled in school, and are therefore
eligible for student fare products, as shown in Table 2-3; youth who are not enrolled in
school may be able to obtain student passes if they are enrolled in GED/High School
Equivalency, adult education, or other programs. Table 2-4 shows that approximately 72
percent of the applicants who are enrolled in school reported having used a monthly
Student Monthly LinkPass or having paid for trips at the student reduced fare using the
stored value purse on their student CharlieCard. This suggests that there are barriers or
problems that prevent some students from obtaining student-price fare products.
Table 2-4 also shows that only about half of the school-enrolled youth who applied to
the program reported having paid for trips with a Student Monthly LinkPass. The MBTA
and CTPS hypothesize that many applicants who have used the Student Monthly
LinkPass applied to the program to get access to reduced-price passes during summer
months. This hypothesis is supported by the finding that Boston experienced a large
turnover of Youth Pass users when the school year started. However, the findings from
the Youth Pass pilot application process, discussed above, highlight some other
distribution problems that may exist in the current Student Pass program. The
applicants who reported using a Student CharlieCard with a stored-value purse meet
the eligibility requirements for the Student Monthly LinkPass, but likely have no easy
method to obtain one. Some of the barriers they face may be institutional; for example,
Malden High School provides students with Student Stored Value cards but no method
to purchase the Student Monthly LinkPass. Chapter 5 discusses MBTA initiatives to
address these barriers to access, and how these initiatives may affect the target market
of a potential permanent Youth Pass program.

Youth Pass FINAL Report 060616 Page 12 of 93
2.2 Youth Pass Participant Characteristics
Pilot Participation Rates
The MBTA and CTPS reviewed the available data on Youth Pass usage, from the end
of June 2015 through March 2016.2 Because pilot participants needed to provide 30
days of pre-pilot travel data prior to receiving a Youth Pass, pilot participants who used
a Youth Pass throughout March 2016 would likely have had to enroll in the program on
or before January 31, 2016. As of January 31, 2016, 919 applicants had taken an
enrollment survey.3
To learn more about Youth pass sales and the number of people using Youth Passes,
the MBTA and CTPS reviewed two sets of data for the period between June 2015 and
March 2016:
• Youth Pass purchases, according to data from the Retail Sales Terminals (RSTs)
provided to participating municipalities4
• Youth Pass usage data from the MBTA’s Automated Fare Collection (AFC)
system
The AFC usage data showed that 770 individuals had used monthly and/or weekly
Youth Passes to make trips from July 2015 through March 31, 2016, and CTPS
analyzed data from 762 of these individuals.5 For the period between June 25, 2015
and March 21, 2016, CTPS identified 897 individual serial numbers associated with
Youth Pass purchases, according to data from the Retail Sales Terminals (RSTs)
provided to participating municipalities. This time window was selected in order to better
compare AFC and RST data. In general, RST sales activity increases significantly after
the 21st of each month, which suggests that after this date, many people may be
purchasing passes to use during the following month. The difference in the count of
individual serial numbers in the RST sales data and the number of individuals appearing
in the AFC usage data may occur because some youth may have lost and replaced
2 Automated Fare Collection system transaction data (AFC data) is created when people interact with
fare gates at MBTA stations or with fare boxes on MBTA transit vehicles. It can take several weeks to
retrieve all data from MBTA stations and vehicles, so AFC data for a particular month is typically not
available until several weeks after the end of that month. March 2016 was the last month with
complete data that could be used in the development of this report. 3 Ten of these individuals would have been excluded from further analysis because they were 12 or
younger or because they lacked information on their school enrollment. 4 This information likely approximates the number of individuals who are participating in the pilot
program, although it may overestimate the number of total participants, as some individuals received
replacement Youth Passes and thus would have more than one number in the RST records. 5 This information is based on data provided by the MBTA on May 3, 2016. There were a total of 770
individuals who used a Youth Pass between July 2015 and March 2016; however, eight individuals
were removed from the data set because their application forms listed incomplete or conflicting
school-enrollment information, or because the participants were 12 years old.

Youth Pass FINAL Report 060616 Page 13 of 93
cards, or because insufficient information was available from municipal records to link
purchases to specific participants. In any case, both counts are less than the number of
participants who took an enrollment survey. This may indicate that a number of
participants were unwilling or unable to commit the time and complete the multiple steps
necessary to fully enroll in the program and receive a Youth Pass.
Throughout this report, CTPS uses the application and pass usage data available for
the 762 participants identified in the AFC data to make inferences about the larger
population of Youth Pass users.
Table 2-6 categorizes the Youth Pass users identified in the AFC system by their age
and school-enrollment characteristics. Approximately 68 percent of these individuals are
between 13 and 18 years old, while the remaining 32 percent are between 19 and 21
years old. Most are between 13 and 18 years old and are enrolled in school (60
percent). Youth who are 19 to 21 years old and are not enrolled in school make up the
second largest subcategory of Youth Pass users (26 percent).
TABLE 2-6
School Enrollment and Age Characteristics
of Youth Pass Participants in AFC Data (July 2015 – March 2016)
School Enrollment
13–18 Years
Old Percent
19–21 Years
Old Percent
All Youth Pass
Users Middle School 39 5.1% 0 0.0% 39
High School 413 54.2% 45 5.9% 458
Not Enrolled in School 69 9.1% 196 25.7% 265
Total 521 68.4% 241 31.6% 762
Data sources: MBTA Youth Pass pilot program application data; MBTA Youth Pass pilot AFC data Note: This includes those who purchased Youth Passes that were active in late June 2015. All percentages are of total applicants.
The results in Table 2-6 also show that the samples of Youth Pass participants in some
of these age- and school-enrollment categories are small. To increase sample sizes for
analysis and estimation purposes, CTPS examined Youth Pass user behavior according
to whether or not a participant was in school. Table 2-7 shows the shares of Youth Pass
participants in the AFC data by whether or not they were enrolled in school.
TABLE 2-7
Youth Pass FINAL Report 060616 Page 14 of 93
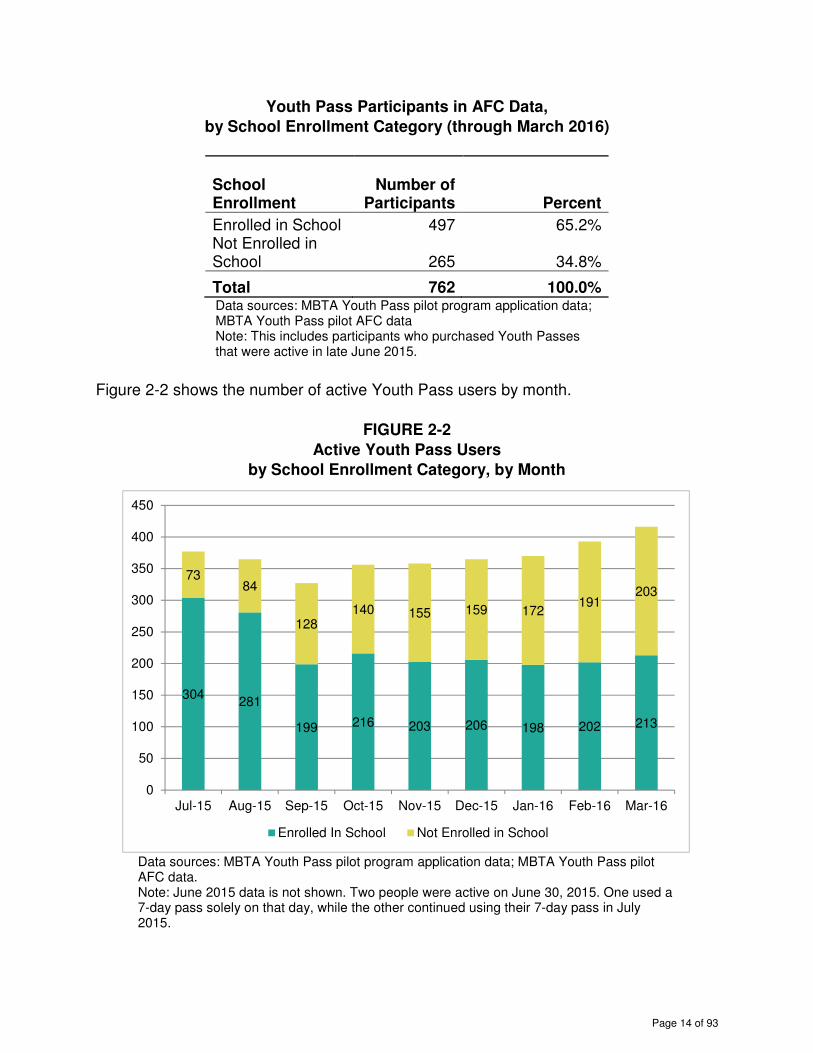
Youth Pass Participants in AFC Data,
by School Enrollment Category (through March 2016)
School Enrollment
Number of Participants Percent
Enrolled in School 497 65.2% Not Enrolled in School 265 34.8%
Total 762 100.0% Data sources: MBTA Youth Pass pilot program application data; MBTA Youth Pass pilot AFC data Note: This includes participants who purchased Youth Passes that were active in late June 2015.
Figure 2-2 shows the number of active Youth Pass users by month.
FIGURE 2-2
Active Youth Pass Users
by School Enrollment Category, by Month
Data sources: MBTA Youth Pass pilot program application data; MBTA Youth Pass pilot AFC data. Note: June 2015 data is not shown. Two people were active on June 30, 2015. One used a 7-day pass solely on that day, while the other continued using their 7-day pass in July 2015.
304281
199 216 203 206 198 202 213
7384
128140 155 159 172
191203
0
50
100
150
200
250
300
350
400
450
Jul-15 Aug-15 Sep-15 Oct-15 Nov-15 Dec-15 Jan-16 Feb-16 Mar-16
Enrolled In School Not Enrolled in School

Youth Pass FINAL Report 060616 Page 15 of 93
Overall, the number of people in the Youth Pass program has grown since its launch in
July 2015. During the nine months covered by this report, the number of participants
who were enrolled in school peaked during summer months and stayed at a stable level
during school months. This is likely because the participants who were enrolled in
school may have been able to take advantage of Student Monthly LinkPasses (which
cost the same as the Youth Pass), or reduced single-ride fares for students, and thus no
longer found it advantageous to obtain a Youth Pass. Meanwhile, participation by youth
not enrolled in school increased steadily from July 2015 to March 2016 (the end of our
analysis dataset). During July 2015, approximately 19 percent of Youth Pass users
were not enrolled in school. By comparison, in March 2016, approximately 49 percent of
Youth Pass users were not enrolled in school. The number of youth not enrolled in
school also increased over time, from 73 active during July 2015 to 203 active during
March 2016.
2.3 Youth Pass Participant’s Use of Public Transit
Pre-Pilot Data
As discussed in Chapter 1, youth who enrolled in the Youth Pass program were asked
to provide 30 days of pre-pilot trip data so that it would be possible for the MBTA and
CTPS to compare their travel behavior and expenditures before the pilot program to
those during the pilot program. Each participant was given a blank CharlieCard, which
they could load with passes and/or stored value. To date, 814 youth have provided pre-
pilot data. Of these, only 653 provided data and later made trips with a Youth Pass,
which may suggest that a large number of youth completed some steps in the Youth
Pass enrollment process, but then never returned to obtain a Youth Pass product. Of
these, CTPS selected a subset of 634 pre-pilot participants for further analysis; these
individuals 1) were older than 12, 2) provided sufficient school-enrollment information,
and 3) made trips using a Youth Pass product before March 31, 2016. Table 2-8
displays these pre-pilot participants by school enrollment status. As shown,
approximately two-thirds of these pre-pilot participants are enrolled in school.
TABLE 2-8
Pre-Pilot Participants in Youth Pass Program,
by School Enrollment Category
School Enrollment
Number of Participants Percent
Enrolled in School 408 64.4% Not Enrolled in School 226 35.6%
Total 634 100.0% Data sources: MBTA Youth Pass pilot program application data; MBTA pre-pilot AFC data

Youth Pass FINAL Report 060616 Page 16 of 93
CTPS hypothesized that the average number of trips youth might make in a month
would vary depending on the time of year, particularly a summer month versus a school
month. This was expected to be particularly true for youth enrolled in school. As part of
testing this hypothesis, CTPS classified pre-pilot participants according to whether they
provided data during school months (late May through June 2015, and September 2015
through March 2016), or during summer months (July and August 2015). Table 2-9
shows the breakdown of pre-pilot participants by these two time categories. Twenty-five
pre-pilot data participants were excluded because their data could not be easily
classified into one of these categories.6
TABLE 2-9
Number of Pre-Pilot Participants,
by School Enrollment and Time-of-Year Categories
School Enrollment
School Months Percent
Summer Months Percent Total
Enrolled in School 314 51.6% 76 12.5% 390 Not Enrolled in School 161 26.4% 58 9.5% 219
Total 475 78.0% 134 22.0% 609
Data sources: MBTA Youth Pass pilot program application data; MBTA pre-pilot AFC data.
Note: Percentages are of total pre-pilot participants.
As shown in Table 2-9, most pre-pilot participants provided data during school months.
This is likely driven by the fact that there are more school year months than summer
months, and by the fact that the majority of pre-pilot participants made their first
identified trip in late May or June 2015, as shown in Figure 2-3.
6 If data from a pre-pilot participant was split between a school and summer month, CTPS looked at
whether there was a span of 21 days or greater between her first and last trips in the pre-pilot AFC
data set. If so, CTPS examined whether more than two-thirds of those days fell in a school or summer
month, and assigned the participant to the school month group or summer month group, accordingly.
Twenty-five pre-pilot participants could not be classified using this method, and so were excluded
from further analysis.

Youth Pass FINAL Report 060616 Page 17 of 93
FIGURE 2-3
Pre-Pilot Participants, by Month of First-Identified Trip
in Pre-Pilot AFC Data
Data sources: MBTA Youth Pass pilot program application data; MBTA pre-pilot AFC data
General Changes in Trip Behavior
CTPS analyzed the average number of trips made by youth each month during the
school year and during the summer. Comparisons between Youth Pass data and pre-
pilot data show that in each school enrollment category and in general, Youth Pass
participants increased their ridership once they received the pass.
Table 2-10 describes the average number of unlinked trips that youth made during a
school month, using data from the “School” period category of pre-pilot participants, and
Youth Pass Pilot program data for school months during the pilot program (September
2015 through March 2016).7 Estimates of trips made during the Youth Pass program
include any trips on local buses, the Silver Line, and the rapid transit system, which are
trips that are covered by LinkPasses. These estimates include trips that were made
using the stored value purses on the Youth Pass CharlieCards. On average, youth
using Youth Passes during a given month made one of these trips or fewer; but in some
cases youth may have paid single-ride or transfer fares before they could renew their
7 An unlinked trip is an individual trip on any single transit vehicle; a single journey, often composed of
many unlinked trips on multiple vehicles, is a “linked” trip. These estimates of unlinked trips are based
on the number of times people tapped their CharlieCard to interact with an AFC faregate or farebox.
0
20
40
60
80
100
120
140
160
180
200

Youth Pass FINAL Report 060616 Page 18 of 93
monthly or 7-day Youth Pass. Including these trips makes it possible to provide a more
comprehensive picture of trip-making behavior during the Youth Pass pilot.
TABLE 2-10
Average Unlinked Trips per Month for School Months
Participant Category
Pre-Data: School Month
Youth Pass:
School Month
Change (Total)
Change (Percentage)
Enrolled in School 48.3 54.1 +5.8 +12.0% Not Enrolled in School 37.3 62.2 +24.9 +66.8% Average for All Participants 44.6 57.6 +13.0 +29.1%
Data sources: MBTA Youth Pass pilot program application data; MBTA pre-pilot AFC data; MBTA Youth Pass pilot AFC data;
Note: The pre-pilot and Youth Pass average monthly trip estimates do not include any trips that were paid for in cash, because these cannot be tracked on the AFC system.
Participants who are not enrolled in school show the largest increase in average
unlinked trips per month when the pre-pilot data and Youth Pass pilot program data are
compared. In an average school month, out-of-school participants make an additional
25 unlinked trips, or an increase of 67 percent. Prior to the Youth Pass pilot program, on
average, these individuals were making fewer trips per school month than those who
were enrolled in school, and they are making more trips per month on average than
youth enrolled in school once they are in the pilot program.
The average numbers of trips per month in Table 2-10 include all youth enrolled in
school in the School pre-pilot category, regardless of the fare product that they used to
pay for their trips. Table 2-11 looks more closely at trip-making by youth that did not use
a monthly Student Monthly LinkPass when providing pre-data during school months.

Youth Pass FINAL Report 060616 Page 19 of 93
TABLE 2-11
Average Unlinked Trips per Month for School Months
(No Student Monthly LinkPass Use in Pre-Pilot Data)
Participant Category
Pre-Data: School Month
Youth Pass:
School Month
Change (Total)
Change (Percentage)
Enrolled in School (Did not use monthly Student Pass) 27.4 54.1 +26.9 +97.4% Not Enrolled in School 37.3 62.2 +24.9 +66.8% Average for All Participants 32.6 57.6 +25.0 +76.7% Data sources: MBTA Youth Pass pilot program application data; MBTA pre-pilot AFC data; MBTA Youth Pass pilot AFC data.
Note: The pre-pilot and Youth Pass average monthly trip estimates do not include any trips that were paid for in cash, because these cannot be tracked on the AFC system.
When youth who used Student Monthly LinkPasses are removed from the analysis, the
number of trips per month made by youth enrolled in school increases by almost 100
percent once they have access to a Youth Pass. This increase speaks to the ways that
multi-trip pass products, like the Student Monthly LinkPass, may help youth increase
their mobility.
Table 2-12 describes the average unlinked trips per month that youth made during a
summer month, according to data from the pre-pilot participants in the “Summer” time
category, and youth pass pilot program data from the Summer months of the pilot
program. As for the school months, estimates of trips made during the Youth Pass
program include any trips that were made using the stored value purses on the Youth
Pass CharlieCards (on average, active Youth Pass participants made less than one
stored-value trip per month during July or August). This table shows the net difference
and percentage change in the average number of monthly trips across the two data
sets.

Youth Pass FINAL Report 060616 Page 20 of 93
TABLE 2-12
Average Unlinked Trips per Month for Summer Months
Participant Category Pre-Data:
Summer Month
Youth Pass: Summer
Month Change
(Total) Change
(Percentage)
Enrolled in School 32.1 57.6 +25.5 +79.4%
Not Enrolled in School 43.1 63.7 +20.6 +47.8% Average for All Participants 36.9 58.9 +22.0 +59.6% Data sources: MBTA Youth Pass pilot program application data; MBTA pre-pilot AFC data; MBTA Youth Pass pilot AFC data Note: The pre-pilot and Youth Pass average monthly trip estimates do not include any trips that .were paid for in cash, because these cannot be tracked on the AFC system.
Participants who are enrolled in school made the largest increase in average monthly
unlinked trips in a typical summer month, when the pre-pilot data and Youth Pass pilot
program data are compared. In an average summer month, in-school participants made
an additional 26 unlinked trips, or an increase of 79 percent, once they obtained a Youth
Pass. However, participants who are not enrolled in school also made a significant
increase in trips, making an additional 21 trips per month, on average.
2.4 Trip Purpose and Potential Foregone Trips
The MBTA conducted monthly surveys of Youth Pass participants to measure the
impact of the program on their travel behavior. Each month, participants were asked
questions about all of the trips they took on the day prior to the day they received the
survey. Participants were asked to describe the purposes of these trips and how they
would have made the trips (or whether they would have made them) if they did not have
a Youth Pass. As with the other data in this report, the survey results were divided into
two groups: those surveyed during the “summer” months of July and August, and those
surveyed during the rest of the year (school months). The results of these surveys are
displayed in Figures 2-4 through 2-7. It should be noted that since respondents were
asked about the previous day, the trips in question nearly all took place from Sunday
through Thursday. This is because youth would have taken these surveys at municipal
partner offices, which are typically only open Monday through Friday.
Figures 2-4 and 2-5 describe the purposes of trips taken during the summer and during
the school year.

Youth Pass FINAL Report 060616 Page 21 of 93
FIGURE 2-4
Purpose of Trips Taken during July and August 2015, All Municipalities
Data source: MBTA Youth Pass Pilot program July and August monthly surveys. n = 1158 trips surveyed.
FIGURE 2-5
Purpose of Trips Taken during All School-Year Months, 2015-16,
All Municipalities
Data source: MBTA Youth Pass Pilot program school year monthly surveys. n = 4,629 trips surveyed. Note: Data was collected through April 15, 2016, to include trips made during the month of March.
1.2%
2.4%
3.0%
5.6%
8.8%
12.3%
17.9%
48.7%
0% 10% 20% 30% 40% 50% 60%
Extracurricular activities
Volunteer or religious activities
Medical appointments
Entertainment, recreation, and fun activities
Visit friends or family
School
Shopping/Errands
Work
0.7%
1.3%
1.6%
2.8%
4.8%
6.7%
22.8%
59.3%
0% 10% 20% 30% 40% 50% 60% 70%
Extracurricular activities
Medical appointments
Volunteer or religious activities
Entertainment, recreation, and funactivities
Visit friends or family
Shopping/Errands
Work
School

Youth Pass FINAL Report 060616 Page 22 of 93
As Figures 2-4 and 2-5 show, the vast majority of trips among participants were either to
or from work or school, depending on the season. These two categories combined
accounted for 61 percent of the trips in the summer, and 82 percent of the reported trips
during the school year. The Shopping/Errands category accounted for the next largest
portion of trips.
Figures 2-6 and 2-7 describe how Youth Pass participants would have otherwise made
their Youth Pass trips during summer and school year months, respectively.
FIGURE 2-6
Participants’ Responses to the Question
“Without a Youth Pass, how would you have made the trip?”
(All Municipalities, July and August 2015)
Data source: MBTA Youth Pass Pilot program July and August monthly surveys. n = 1,231 trips surveyed.
0.4%
0.7%
0.7%
1.5%
1.8%
2.0%
5.3%
14.5%
14.9%
58.2%
0% 10% 20% 30% 40% 50% 60% 70%
Schoolbus
Drove myself
Other
Non-MBTA shuttle or bus
Biked
Taxi or TNC
Gotten a ride
I wouldn't have taken the trip
Walked
Paid for the T some other way

Youth Pass FINAL Report 060616 Page 23 of 93
FIGURE 2-7
Participant Responses to the Question
“Without a Youth Pass, how would you have made the trip?”
(All Municipalities, School Months)
Data source: MBTA Youth Pass Pilot program school year monthly surveys. n = 4,705 trips surveyed. Note: Data was collected through April 15, 2016, to include trips made during the month of March
The majority of participants responded that they would have paid to ride the MBTA
system another way if they did not have a Youth Pass (approximately 58 percent
respondents during both summer and school year groups, as shown in Figures 2-6 and
2-7). Approximately 15 percent of respondents said they would have walked if they did
not have the Youth Pass; this was the case for both summer and school-year months.
Finally, 14.5 percent of respondents in the summer and just over 13 percent during the
school year responded that they wouldn’t have made the trip in question at all without a
Youth Pass.
In surveys administered between July 2015 and April 2016, participants responded that
they would have foregone 13 to 14 percent of their reported trips if they did not have a
Youth Pass. Conversely, they would have found another way to make approximately 87
percent of those trips, primarily by paying another way to ride the transit system.
Although the surveys did not ask the reason why participants would forego making trips,
it is likely because of their cost. Table 2-12 shows the percent of trips that survey
respondents would not have taken, by type of trip. The highest category is school trips,
followed by shopping/errands trips, and work trips.
0.4%
0.5%
0.6%
1.3%
1.3%
2.5%
7.2%
13.2%
14.8%
58.3%
0% 10% 20% 30% 40% 50% 60% 70%
Schoolbus
Other
Drove myself
Biked
Non-MBTA shuttle or bus
Taxi or TNC
Gotten a ride
I wouldn't have taken the trip
Walked
Paid for the T some other way

Youth Pass FINAL Report 060616 Page 24 of 93
TABLE 2-12
Trips Survey Respondents Would Not Have Taken without a Youth Pass
Trip Purpose
Percent of Trips Foregone
without Youth Pass
Entertainment, recreation, and fun activities 11% Extracurricular activities (sports, music, tutoring) or trips for your job (but not to it) 1%
Medical appointments 2%
School 24%
Shopping/Errands (for yourself or your family) 21%
Visit friends or family 14%
Volunteer or religious activities 2% Work 17%
N/A 8%
Data source: MBTA Youth Pass Pilot program monthly surveys July 2015-April 2016.
These results indicate that the Youth Pass is increasing young people’s mobility. As
expected, transit usage increases with a reduced-fare pass. The first nine months of
Youth Pass data show a 30 percent average increase in the number of trips for all
participants during school months, and a 60 percent average increase in trips during the
summer months. The survey results show that without a Youth Pass nearly 42 percent
of trips would not have been taken on the MBTA, and 13 percent of trips would not have
been taken at all.
2.5 Youth Riders’ Attitudes about the MBTA and Public Transit
One objective of the Youth Pass Pilot research is to determine whether or not the
availability of the Youth Pass changes participants’ attitudes towards the MBTA and
public transit. To gather information on this, the MBTA surveyed Youth Pass
participants regarding their level of satisfaction with the MBTA, both overall and in
specific categories. Participants were asked to complete these surveys when they
enrolled in the pilot program (the month may vary by participant), in October 2015, and
then at the end of the program in May 2016. The questions in these surveys matched
those that were asked of all MBTA riders during a system-wide customer satisfaction
survey from earlier in 2015.
Figure 2-8 shows the net satisfaction for each category across three groups: Youth
Pass participants at the time of pilot program enrollment, Youth Pass participants in
October 2015 and May 2016, and all MBTA customers from the system-wide customer
satisfaction survey. The MBTA determined the net satisfaction rating for each category

Youth Pass FINAL Report 060616 Page 25 of 93
by subtracting the percentage of respondents answering below neutral satisfaction (1, 2,
or 3) from the percentage answering better than neutral satisfaction (5, 6, or 7).
FIGURE 2-8
Net Satisfaction with Various Aspects of MBTA Service
Data sources: MBTA Youth Pass Pilot enrollment surveys; MBTA Youth Pass pilot October 2015 and May 2016 monthly surveys; MBTA 2015 System-wide Customer Satisfaction Survey
Youth Pass enrollees tended to have an equal or more favorable opinion of the MBTA
than respondents to the 2015 system-wide customer satisfaction survey, except in the
“cost” and “safety” categories. Youth Pass participants were slightly less satisfied with
safety on the MBTA than all passengers, but the vast majority still responded positively.
When asked to rate their satisfaction with the MBTA’s cost, Youth Pass participants’
responses differed somewhat from the survey of all passengers. In fact, the majority of
Youth Pass participants rated their satisfaction with the MBTA’s cost as negative, which
was the only net negative response for both the Youth Pass enrollment and Youth Pass
October and May survey groups.
In general, satisfaction with the MBTA decreased slightly among Youth Pass
participants between the enrollment survey group and the October and May survey
groups, with the exception of the “cost” category. It is important to note that the two
surveys do not provide a perfect comparison, as not everyone who took the first survey
remained in the program long enough to participate in the second or third survey, or
even completed the requirements to obtain a Youth Pass. It is possible that as their use
-30%
-20%
-10%
0%
10%
20%
30%
40%
50%
60%
70%
On-Time andReliableService
Hours ofService
ScheduleFrequency
Helpfulness /Courtesy of
Staff Safety Cost Overall
Youth Pass Enrollment (681) Youth Pass October (192) Youth Pass May (209) All Customers

Youth Pass FINAL Report 060616 Page 26 of 93
of the MBTA services increases, Youth Pass participant satisfaction with the MBTA will
decrease. This effect appeared in the 2015 system-wide customer satisfaction survey,
with regular users expressing less satisfaction than people who use the system less
frequently.
Youth Pass respondents’ satisfaction with the MBTA’s cost improved for the mid-point
survey, but then decreased again for the final survey. This could be because of the way
the question was asked. Respondents were not told to assume that the Youth Pass
Pilot would continue past June 30, 2016 when answering the second and third survey,
so some respondents could have answered this question thinking that the program
would be ending.

Youth Pass FINAL Report 060616 Page 27 of 93
Chapter 3—Pilot Impacts on the MBTA
This chapter describes estimates of the impacts the Youth Pass pilot may have on
MBTA revenues and service.
3.1 Impacts on MBTA Fare Revenues
Youth Pass Use Profile
During each month of the pilot, participants could purchase a monthly Youth Pass for
$26. Chelsea, Malden, and Somerville also offered 7-day Youth Passes throughout the
pilot, while Boston began to sell these passes in January. The 7-day Youth Passes cost
$7 each.
As mentioned in Chapter 2, CTPS identified 770 individuals who used youth passes
through March 2016, according to the MBTA’s AFC data for Youth Pass participants.
CTPS analyzed the behavior of 762 of these individuals.8 Figure 3-1 shows the number
of individuals who purchased each type of Youth Pass product during each month.
FIGURE 3-1
Active Participants Who Purchased 7-Day or Monthly Youth Passes,
by Month
Data source: MBTA Youth Pass Pilot AFC Data Note: The number of individuals who purchased 7-Day passes in July includes one person who purchased a 7-Day pass in June only.
8 Eight of these 770 youth were identified as being age 12, based on their reported date of birth, or their
applications had incomplete or conflicting school enrollment data.
0
50
100
150
200
250
300
350
400
450
Jul-15 Aug-15 Sep-15 Oct-15 Nov-15 Dec-15 Jan-16 Feb-16 Mar-16
Used Monthly Passes Only Used 7-Day Passes Only Used Both Monthly and 7-Day Passes

Youth Pass FINAL Report 060616 Page 28 of 93
During each month of the pilot, the majority of youth that were “active,” or using at least
one Youth Pass product to pay for their trips, used a monthly Youth Pass only. During
most months of the pilot, fewer than seven percent of active participants used one or
more 7-day Youth Passes to pay for their trips. In January 2016, Boston began offering
the 7-day pass, but even during that month, only about 10 percent of all active
participants used this type of pass. Of the youth who used a 7-day pass during a given
month, the majority only purchased one or two passes during the month.
Estimated Youth Pass Revenues
Pre-Pilot Fare Data
Chapter 2 describes the processes that CTPS used to develop samples of pre-pilot data
to represent youth travel behavior during the school year or the summer. Figure 3-2
shows the types of fare media that youth in the School pre-pilot data sample used to
make trips on the MBTA system.
FIGURE 3-2
Fare Types Used By Pre-Pilot Participants (School Period)
Data source: MBTA pre-pilot AFC data Notes: Participants may have used more than one fare type during their 30-day pre-pilot data collection period. Stored-value fare types include both trip and transfer fares. Information about fares paid in cash is unknown. Two youth in the “Not in School” group and one in the “In School” group used multiple types of passes; these results are not shown. Three youth in the “In School” group paid for trips with a combination of full-price and student fares, only; these results are not shown.
TAP = Transportation Access Pass.
0 20 40 60 80 100 120 140 160 180
Student Monthly LinkPass
Stored Value Only
Student Stored Value Only
Monthly LinkPass
7-Day LinkPass
Monthly Local Bus Pass
TAP Reduced-Fare Stored Value
Number of Individuals Using Fare Type
In School (314 youth) Not in School (161 youth)

Youth Pass FINAL Report 060616 Page 29 of 93
Based on the data shown in Figure 3-2, of pre-pilot participants who provided data
during the School period, slightly more than half of students used Student Monthly
LinkPasses, while about 25 percent only paid for trips using their student stored-value
purse on their CharlieCard, which enables them to obtain a reduced fare. Only a few
used another type of pass (Monthly LinkPass, 7-day LinkPass, or a monthly Local Bus
pass). Among youth not-enrolled in school, the largest number of participants paid for
their trips using stored-value only, though approximately 32 percent used a monthly
LinkPass, and approximately 16 percent used a 7-day LinkPass.
Figure 3-3 shows the types of fare media that youth in the Summer pre-pilot data
sample used to ride the MBTA system.
FIGURE 3-3
Fare Types Used By Pre-Pilot Participants (Summer Period)
Data source: MBTA pre-pilot AFC data Notes: Participants may have used more than one fare type during their 30-day pre-pilot data collection period. Stored Value fare types may include both trip and transfer fares. Information about fares paid in cash is unknown. One person was excluded from the “In School” category because they only paid for Express Bus trips during their pre-data month, which would not be covered by a LinkPass.
Figure 3-3 shows that, of pre-pilot participants who provided data during the Summer
period, about 62 percent of students paid for trips using only their stored-value purse
(either at standard or reduced-price fares). Approximately 17 percent of students made
trips using monthly LinkPasses, while another 17 percent made trips using 7-day
LinkPasses. Among youth not enrolled in school, approximately 43 percent paid for trips
0 10 20 30 40 50 60 70 80
Stored Value Only
Monthly LinkPass
7-Day LinkPass
Student Stored Value Only
Local Monthly Bus Pass
Student Monthly LinkPass
Number of Individuals Using Fare Type
In School (75 Youth) Not In School (58 Youth)

Youth Pass FINAL Report 060616 Page 30 of 93
using a monthly LinkPass, while another 40 percent paid for trips using their Charlie
Card stored-value purse only.
Estimated Youth Pass Revenues
To estimate the net Youth Pass revenues for the first nine months of the pilot program,
CTPS followed these steps:
• Step 1: CTPS identified each month in the pilot program as either a Summer
month (July and August 2015) or a School month (September 2015 through
March 2016).
• Step 2: CTPS identified the share of youth pass participants in each month who
reported being enrolled in school, based on their Youth Pass application data.
• Step 3: CTPS estimated the total expenditures each Youth Pass participant
made during months when they were “active,” or using a Youth Pass to pay for
trips. These estimated total expenditures include the cost of Youth Passes
(monthly and/or 7-day), and the cost of any stored-value trips. CTPS assumed
that youth participants had purchased one monthly Youth Pass if they had made
any monthly Youth Pass trips, and estimated the number of 7-day passes
purchased based on the time periods during which 7-day Youth Pass trips were
made, as shown in the Youth Pass pilot AFC data. As discussed in Chapter 2, on
average, youth using Youth Passes during a given month made one stored-value
trip or fewer; but in some cases youth may have paid single-ride or transfer fares
before they could renew their monthly or 7-day youth pass. Including these trips
makes it possible to provide a more comprehensive picture of trip-making
behavior for a given month.
Table 3-1 shows the outputs of steps 1 through 3.

Youth Pass FINAL Report 060616 Page 31 of 93
TABLE 3-1
Youth Pass Participant Spending,
by Month and School Enrollment Category
Pilot-Program Month
Month Type
Total Participants
Estimated MBTA Revenues during Youth Pass Pilot
Program
July 2015 Summer 377 $9,590
August 2015 Summer 365 $9,390
September 2015 School 327 $8,460
October 2015 School 356 $9,440
November 2015 School 358 $9,520
December 2015 School 365 $9,700
January 2016 School 370 $9,610
February 2016 School 393 $10,410
March 2016 School 416 $11,030
Total $87,150
Data source: MBTA Youth Pass pilot AFC Data Notes: These amounts exclude one 7-day pass purchased in June 2015, which was only used on June 30, 2015. Amounts are rounded to the nearest $10.
• Step 4: CTPS estimated the average cost a participant would have paid per
month to ride the MBTA local bus or rapid transit system if they did not have a
Youth Pass, depending on the time of year and the participant’s school-
enrollment category. CTPS used the pre-pilot data sets to develop these
estimates. The average monthly cost for each participant is based on the
estimated number and types of passes that the individual purchased and the
cost of any trips paid for using stored-value. CTPS assumed that youth
participants had purchased a certain type of monthly pass if they had had paid
for any trips during the month using that pass-type, and estimated the number of
7-day passes purchased based on the time periods during which 7-day Youth
Pass trips were made, as shown in the pre-pilot AFC data. Table 3-2 shows the
average monthly expenditure values for each school-enrollment and time-period
category.

Youth Pass FINAL Report 060616 Page 32 of 93
TABLE 3-2
Average Monthly Pre-Pilot Spending,
by Month and School Enrollment Category
Category
Average Monthly Expenditure:
Summer Pre-Pilot Data Group
Average Monthly Expenditure:
School Pre-Pilot Data Group
Enrolled in School $42.00 $26.50
Not Enrolled in School $52.50 $50.00
Data source: MBTA pre-pilot AFC data
Note: Amounts are rounded to the nearest $0.50.
• Step 5: For each month, CTPS multiplied the appropriate average monthly pre-
pilot expenditure amount by the number of participants in the “enrolled-in-
school” and “not-enrolled-in-school” categories, and summed the two categories
together to get a total pre-pilot spending amount for each month. This amount
will serve as an estimate of the revenue the MBTA would have earned if these
youth did not have access to Youth Passes.
• Step 6: CTPS subtracted the total monthly foregone revenues from the Youth
Pass program revenues for each month, to determine the net revenues per
month. For the first nine months of the pilot program. CTPS estimates that
participants in the program spent approximately $87,200 between July 2015 and
March 2016. The net revenue loss for the program for these nine months, based
on the methodology described above, is about $38,200.

Youth Pass FINAL Report 060616 Page 33 of 93
TABLE 3-3
Estimated Net MBTA Foregone Revenue during the Youth Pass Pilot Program
Pilot-Program Month
Month Type
Total Participants
Estimated MBTA
Revenues during Youth
Pass Pilot Program
Estimated Foregone
MBTA Revenues
Estimated Net MBTA Revenues
July 2015 Summer 377 $9,580 $16,570 ($6,990)
August 2015 Summer 365 $9,400 $13,540 ($4,150)
September 2015 School 327 $8,470 $11,630 ($3,170)
October 2015 School 356 $9,440 $12,680 ($3,250)
November 2015 School 358 $9,520 $13,090 ($3,570)
December 2015 School 365 $9,690 $13,370 ($3,680)
January 2016 School 370 $9,610 $13,820 ($4,200)
February 2016 School 393 $10,410 $14,870 ($4,460)
March 2016 School 416 $11,030 $15,760 ($4,720)
Total $87,150 $125,330 ($38,180)
Data sources: MBTA pre-pilot AFC data, MBTA Youth Pass pilot AFC data Note: Amounts have been rounded to the nearest $10. The differences in the net revenues column may not be exact due to rounding.
To estimate the net revenue for a full year of the pilot program at the current
participation rate, CTPS applied the number of Youth Pass users that were estimated to
be active in March 2016 (416) to the remaining three months of the school year, with the
same shares of youth enrolled in school and not enrolled in school. CTPS also assumed
the March 2016 Youth Pass revenue amount (approximately $11,030) and the March
foregone revenue amount (approximately $15,760) for the three remaining months.
Using this approach, CTPS estimated that a full year of the pilot would generate
approximately $120,200 in revenue (Youth Pass sales plus other stored value), and a
net revenue loss of approximately $52,400 as shown in Table 3-5.

Youth Pass FINAL Report 060616 Page 34 of 93
TABLE 3-5
Estimated Net Youth Pass Pilot Program Revenues
(July 2015 – June 2016)
Pilot Program Month Youth Pass
Revenues
Estimated Foregone Revenues
Net Revenues
July 2015 – March 2016 $87,150 $125,330 ($38,180) April 2016 – June 2016 (projection) $33,090 $47,270 ($14,170)
Total $120,240 $172,600 ($52,350)
Data sources: MBTA pre-pilot AFC data, MBTA Youth Pass pilot AFC data Note: Amounts are rounded to the nearest $10. The differences in the net revenues column may not be exact due to rounding.
When the cost of program administration by MBTA staff is included (an estimated
$200,000), the net loss of the pilot is approximately $252,400.
3.2 Impacts on MBTA Service
Chapter 2 describes the estimated number of unlinked trips that Youth Pass participants
made based on several characteristics or circumstances:
• Whether the participants were enrolled in school, or not enrolled in school
• Whether the participants were making trips before or after they had access to a
Youth Pass
• Whether the trip was taking place during a school or summer month
This section looks more closely at the magnitude of additional unlinked trips per
weekday, and at the magnitude of unlinked trips being made during the AM and PM
peak periods, in particular. According to the MBTA’s current Service Delivery Policy
(2010), the AM peak period takes place between 7:00 AM and 8:59 AM, while the PM
peak period takes place between 4:00 PM and 6:30 PM. CTPS also looked at
participants’ trips on different parts of the MBTA system (bus, rapid transit, light-rail, or
Silver Line) during a given weekday.
To estimate the net change in the number of trips on the MBTA local bus and rail
system on a weekday, CTPS completed the following steps:
• Step 1: CTPS identified each month in the pilot program as either a Summer
month (July and August 2015) or a School month (September 2015 through
March 2016).

Youth Pass FINAL Report 060616 Page 35 of 93
• Step 2: CTPS identified the share of youth pass participants in each month who
reported being enrolled in school, based on their Youth Pass application data.
• Step 3: CTPS estimated the trips per weekday made by youth using Youth
Passes, by calculating the total number of trips made by active Youth Pass
participants on weekdays during each month of the program. CTPS then divided
these trip values by the number of weekdays during each month (excluding
holidays) to determine the estimated number of trips per day, during each time
period.
• Step 4: CTPS estimated the trips per weekday that youth may have made before
they had access to a youth pass by using the pre-pilot AFC data. To estimate the
total number of trips made by pre-pilot participants during a summer month,
CTPS calculated the average numbers of weekday trips per month made by
participants (both those enrolled in school, and not enrolled in school) during the
Summer time period. These were multiplied by the number of each type of Youth
Pass participant (school-enrolled, and not-school-enrolled) during each Summer
month. This process was repeated for school months, using data from pre-pilot
participants in the School category.
• Step 5: CTPS estimated the additional trips per weekday made by youth using
Youth Passes by subtracting the results of step 4 from the results of step 3.
A summary of the results of steps 1 through 5 are shown in Table 3-6.
TABLE 3-6
Estimated Weekday Trips by Youth Pass Participants, by Service Period
(July 2015 – March 2016)
Month Type
Range of Trips per Weekday
(from Pre-Pilot Data)
Range of Trips per Weekday
(Youth Pass Participants)
Range Estimated Net
Additional Trips Per Weekday
Average Estimated
Net Additional Trips Per Weekday
Summer 490 – 500 800 – 900 +310 – +400 +350
School 600 – 740 770 – 950 +110 – +230 +180
Data sources: MBTA Youth Pass pilot AFC data
Note: Amounts are rounded to the nearest 10 trips.
During summer months, an estimated average 350 trips were added to the MBTA bus
and rapid transit system each weekday. During school months, an estimated average
180 trips were added to the MBTA bus and rapid transit system each weekday.

Youth Pass FINAL Report 060616 Page 36 of 93
Meanwhile, there were approximately 1.2 million weekday boardings on the MBTA bus
and rapid transit systems in fiscal year (FY) 2013. The net growth in trips on the bus
and rapid transit system from the Youth Pass pilot program is very small by
comparison.9
AM and PM Peak Period Trip Share Changes
Table 3-7 shows changes in the share of weekday unlinked trips that youth made during
the AM peak period, the PM peak period, and during non-peak periods, once they had a
Youth Pass, compared to the share they made during these periods before they had a
Youth Pass. These shares have been calculated for both summer (July and August
2015) and school (September 2015 to March 2016) months. To provide a pre-pilot
comparison to the Youth Pass pilot shares in each period, CTPS calculated the share of
weekday trips made by the Summer group of pre-pilot participants, and the School
group of pre-pilot participants made in each period, respectively. This table shows the
change in the share of peak period trips between the pre-pilot and Youth Pass AFC
data sets in terms of both percentage points and percentage change.
TABLE 3-7
Change in Service-Period Trip Share
between Pre-Pilot and Youth Pass Data
Month Type And Service Period
Pre-Pilot Data
Youth Pass Data
Change in Percentage
Points Percentage
Change School: AM-Peak-Period Share 14.7% 14.7%
(Less than 0.1%)
(Less than 0.1%)
School: PM-Peak-Period Share 17.4% 19.8% +2.4 +13.6%
School: Non-Peak-Period Share 67.9% 65.5% (2.4) (3.5%)
Summer: AM-Peak-Period Share 13.7% 15.7% +1.9 +13.9%
Summer: PM-Peak-Period Share 21.8% 21.6% (0.2) (1.0%)
Summer: Non-Peak-Period Share 64.5% 62.8% (1.7) (2.6%)
Data sources: MBTA Youth Pass pilot AFC data, MBTA pre-pilot AFC Data
9 Source: Massachusetts Bay Transportation Authority. 2014. Ridership and Service Statistics:
Fourteenth Edition.
http://www.mbta.com/uploadedfiles/documents/2014%20BLUEBOOK%2014th%20Edition.pdf.
Accessed May 24, 2015.

Youth Pass FINAL Report 060616 Page 37 of 93
As shown in Table 3-7, Youth pass participants make approximately 15 percent of their
trips during the AM peak period and about 20 percent during the PM peak period during
school months. During summer months, these percentages rise to 16 percent and 21
percent, respectively. When comparing the Youth Pass pilot and pre-pilot data, CTPS
estimates that Youth Pass participants make more of their trips during the PM Peak
period during School months than before the pilot. Meanwhile, during summer months,
Youth Pass participants make more of their trips during the AM peak period than they
did prior to the pilot.
Table 3-8 combines the information in Tables 3-6 and 3-7 to show the approximate
number of additional weekday trips taking place during the AM and PM peak periods.
As shown below, there are fewer than 100 additional trips in either the AM or PM peak
on an average weekday, regardless of the time of year.
TABLE 3-8
Estimated Additional Trips by Youth Pass Participants, by Service Period
(July 2015 – March 2016)
Month Type
Range of Additional AM Peak Trips Per
Weekday
Average Additional
AM Peak Trips Per Weekday
Range of Additional
PM Peak Trips Per Weekday
Average Additional
PM Peak Trips Per Weekday
Summer 60 – 70 65 70 – 80 75
School 20 – 30 27 40 – 60 52
Data source: MBTA Youth Pass pilot AFC data
Note: Ranges are rounded to the nearest 10 trips.
AM and PM Peak Period Trip Shares by Bus and Rapid Transit Line
Table 3-9 shows the change in AM peak period, PM peak period, and non-peak trip
share for the local bus network as a whole, each rapid transit line, and the Silver Line
during school months (September 2015 – March 2016). CTPS compared this trip-
making activity to that which occurred prior to the Youth Pass pilot, using data from the
School group of pre-pilot participants. The highlighted cells show an increase in trip
share from the pre-pilot data set to the Youth Pass data set.

Youth Pass FINAL Report 060616 Page 38 of 93
TABLE 3-9
Change in Peak-Period Trip Share
for Bus Network and Rapid Transit Lines
(Pre-Pilot and Youth Pass Pilot Data, School Month)
Service Period and Data Set
Bus: All Routes
Rapid Transit:
Blue Line
Rapid Transit:
Green Line
Rapid Transit: Orange
Line
Rapid Transit:
Red Line
Rapid Transit:
Silver Line
AM-Peak-Period Share: Pre-Pilot 17.1% 17.8% 7.1% 10.9% 16.4% 18.6% AM-Peak-Period Share: Youth Pass 16.7% 26.4% 6.8% 13.6% 14.6% 15.2%
PM-Peak-Period Share: Pre-Pilot 16.0% 10.1% 23.0% 19.0% 18.4% 13.4% PM-Peak-Period Share: Youth Pass 20.5% 12.0% 20.1% 19.7% 19.1% 19.9%
Non-Peak-Period Share: Pre-Pilot 66.9% 72.1% 69.9% 70.1% 65.2% 68.0% Non-Peak-Period Share: Youth Pass 62.8% 61.6% 73.1% 66.7% 66.3% 64.8%
Data sources: MBTA Youth Pass pilot AFC data, MBTA pre-pilot AFC Data
During school months, the share of trips made by Youth Pass participants increased
during the AM-Peak period on bus routes and on the Blue and Orange lines. During the
PM-Peak period, the share of trips made by Youth Pass participants increased on all
bus routes, and the Blue, Orange, Red, and Silver lines. During non-peak periods, the
share of trips made by Youth Pass participants increased on the Green and Red lines.
The use of different MBTA rapid transit lines and the bus network is determined in part
by the municipalities participating in the program, as Youth Pass participants will be
making their home-based trips on the bus and rapid transit lines that serve their home
communities.
Table 3-10 shows the change in AM Peak period, PM Peak period, and non-peak trip
share for the local bus network as a whole, each rapid transit line, and the Silver Line
during summer months (July and August 2015). CTPS compared this trip-making
activity to that which occurred prior to the Youth Pass pilot, using data from the Summer
group of pre-pilot participants. Highlighted cells show an increase from the value
calculated from the pre-pilot data set to the value calculated for the Youth Pass pilot
data set.

Youth Pass FINAL Report 060616 Page 39 of 93
TABLE 3-10
Change in Peak-Period Trip Share
for Bus Network and Rapid Transit Lines
(Pre-Pilot and Youth Pass Pilot Data, Summer Month)
Service Period and Data Set
Bus: All
Routes
Rapid Transit:
Blue Line
Rapid Transit:
Green Line
Rapid Transit: Orange
Line
Rapid Transit:
Red Line
Rapid Transit:
Silver Line
AM-Peak-Period Share: Pre-Pilot 16.8% 24.6% 6.6% 11.3% 14.3% 7.8%
AM-Peak-Period Share: Youth Pass 18.3% 16.2% 6.3% 13.8% 17.6% 15.3%
PM-Peak-Period Share: Pre-Pilot 21.9% 13.7% 24.7% 21.9% 20.7% 24.1%
PM-Peak-Period Share: Youth Pass 21.2% 24.9% 27.0% 19.5% 22.3% 25.2%
Non-Peak-Period Share: Pre-Pilot 61.3% 61.7% 68.7% 66.8% 65.0% 68.1% Non-Peak-Period Share: Youth Pass 60.6% 58.5% 66.7% 66.7% 60.2% 59.5%
Data sources: MBTA Youth Pass pilot AFC data, MBTA pre-pilot AFC Data
During summer months, the share of trips made by Youth Pass participants increased
on bus routes and on the Orange, Red, and Silver lines during the AM Peak period.
During the PM Peak period, the share of trips made by Youth Pass participants
increased on the Blue, Green, Red and Silver lines. As mentioned previously, though
there are changes in the share of trips Youth Pass participants made across modes and
across service periods, the overall net impact of their trip-making activity is small.
3.3 Summary of Title VI Fare Equity Analysis
The Federal Transit Administration (FTA) requires that the MBTA conduct a fare equity
analysis for any fare change that lasts longer than six months—as is the case for the
Youth Pass Pilot program—to evaluate whether the fare changes would have a
disparate impact based on race, color, or national origin, and whether low-income riders
would bear a disproportionate burden or non-low-income riders would receive
disproportionate benefits because of the changes. CTPS conducted a Title VI Fare
Equity Analysis of the Youth Pass Pilot program using program data available through
October 15, 2015, in order to meet these federal requirements and support continuation

Youth Pass FINAL Report 060616 Page 40 of 93
of the pilot program beyond six months. This analysis is detailed in the Youth Pass Pilot
Program: Title VI Fare Equity Analysis memorandum (December 15, 2015).
With respect to the analysis findings, the Youth Pass monthly and weekly fare products
provide a benefit to eligible users because they provide access to the bus and rapid
transit system at a significant discount compared to similar pass products. The monthly
Youth Pass, which is priced the same as MBTA Student Monthly ($26), represents a 65
percent discount compared to a full-price monthly LinkPass ($75). When analyzing the
effective per-trip costs for minority, low-income, and all Youth Pass participants, CTPS
found that the two Youth Pass products (monthly and 7-day) result in no disparate
benefit to non-minority youth in the program, and no disproportionate benefit to non-low-
income youth in the program, according to the MBTA’s Disparate Impact and
Disproportionate Burden Policy.
3.4 Impacts on MBTA Service (Cash Handling, Conflicts with Employees,
Fare Evasion)
In addition to the other topics discussed in this chapter, the Youth Pass Pilot was
intended to examine whether the pass improved the MBTA’s operations and riders’
experiences on the system. The Youth Pass Working Group theorized that additional
passes would:
• Reduce the amount of cash used on-board buses and above-ground trolleys,
which slows boarding and increases dwell times
• Reduce the amount of fare evasion by pass-holders
• Improve interactions between MBTA staff and pilot participants
These impacts proved difficult to assess, but the preliminary data does suggest minor
impacts, which are explained below.
First, it is likely that the Youth Pass decreased cash payment on-board vehicles for
participants. While detailed data is not available on cash transactions as there was no
way to track cash payments, youth who applied for the pass reported a high level of
cash payment when compared to the population of all riders. Twenty-six percent of
applicants reported that they pay for rides with cash at some point recently. While we do
not know exactly how many trips were paid for with cash, this is significantly higher than
the system-wide average cash payment rate of 2 percent. With a pass, participants
would not use cash to board buses and other vehicles.
The MBTA also asked participants their opinions of the Youth Pass’s impact on fare
evasion and interactions between participants and MBTA employees. When asked if

Youth Pass FINAL Report 060616 Page 41 of 93
they thought the Youth Pass reduces fare evasion, 75 percent of respondents said yes,
while just 3 percent responded no (the remainder were not sure). When asked if the
Youth Pass reduces conflicts between riders and employees, 59 percent believed that it
did, while just 11 percent responded no. While this is subjective data, the perception is
that the Youth Pass impacts both these issues positively.

Youth Pass FINAL Report 060616 Page 42 of 93
Chapter 4—Pilot Administrative Feasibility
4.1 Pilot Administrative Procedures
Municipal Partnerships
The MBTA and the partner organizations worked together for six months to create the
pilot program structure. Each partner signed a Memorandum of Understanding with the
MBTA that specified each organization’s responsibilities. The MBTA wrote a Policy
Handbook that detailed the rules of the program for the partners to use in
implementation. After the program was launched, the MBTA and representatives of the
partner municipalities held monthly meetings to check in on the administration of the
program and resolve outstanding issues.
The municipal partners were free to develop their own administration procedures, so
long as these procedures could be later audited, and the municipalities collected and
verified the necessary paperwork. Some scanned the necessary documents and stored
them in an online filing system, while others stored hard copies in folders. The MBTA
provided the partners with a spreadsheet to track participants, their enrollment, and their
payment status. For the means-tested participants, municipal partners were expected to
collect documentation of their enrollment in a means-tested program. They also were
expected to conduct a “second-step” verification of 10 percent of their means-tested
participants. This was conducted via phone calls to the organizations or programs that
participants claimed they were enrolled in; the “second-step” verification revealed no
cases of fraud. Staff at the MBTA also reviewed the pass-usage data and found no
evidence of suspicious usage (very high numbers of trips on one pass).
The MBTA conducted site visits of each municipal office to observe operations, ensure
that partners followed proper procedure, and interview partner staff about their
experiences administering the Youth Pass. This section details the results of these
audits. Overall, the municipal partners seemed to follow the agreed-upon procedure.
While there were some slight irregularities, there were no major problems in
administration, nor did MBTA oversight reveal any major errors or cases of fraud. The
major concerns expressed by the partners will be largely addressed by making the pass
available on fare vending machines.
Municipal Partner Feedback
Partners generally believed the Youth Pass was an important program and wanted it to
become permanent, but expressed concerns about the resources required to handle the program in its current design — particularly the handling of cash.
Major positive feedback from the partners included:

Youth Pass FINAL Report 060616 Page 43 of 93
• General appreciation of the program by the youth participants. This showed
partners that it was a valuable program for these participants and that their work
was appreciated. Additionally, the program helped partner offices to fulfill their
mission and connect face-to-face with youth constituents who may be difficult to
reach via other methods.
• The RSTs provided by the MBTA to refill the cards were reliable and easy to use.
• Invoicing from the MBTA was smooth, and no major errors were reported by
either the MBTA or municipal partners.
Negative feedback from the partners included:
• Partners reported that the workload was highly variable. For example, the
workload was very high during the initial enrollment period, but there was little to
do at mid-month times when few participants were coming in.
• The card printers used to print the Youth Passes were very slow (especially for
the first printing of the day) and sometimes created duplicates.
• Participants often wished they could purchase passes online or with a credit or
debit card rather than cash.
Finally, partners expressed concerns about having enough staff and other resources to
administer the program if continued, especially if the enrollment were expanded. It was
clear from partner comments that continuing to vend passes monthly via RSTs in
municipal partner offices was not only infeasible for their staff, but also presented
barriers to participants, which reduced the reach of the pass and could prevent a full
program from meeting its goal of providing access to those who need it.
Most of the negative feedback is addressed by having the passes available on fare
vending machines throughout the MBTA system, similar to the Student Pass change
approved by the Fiscal and Management Control Board.
Those enrolled in school could purchase passes without ever needing to go to a
separate office. Youth who are not enrolled in school would need to visit a partner office
to be approved for the program and receive a Youth Pass card, but would not have to
return to the office each month because they could re-load their passes at fare vending
machines. The workload would still be variable, as most participants would likely enroll
in September, but would be far lower overall. The cash handling for the partners would
be eliminated as well.

Youth Pass FINAL Report 060616 Page 44 of 93
4.2 Administrative Feasibility
The Youth Pass Pilot proposal included three questions about the administration of the
program. First, what are the administrative costs of the pilot program to the MBTA?
The administrative cost of the pilot is currently estimated at approximately $200,000,
significantly less than the $443,000 of administrative costs presented in the December
2014 proposal. This is mostly due to changes in the structure of the pilot’s
administration and low participation rates.
The pilot consumes staff resources to:
• Design the program with the partners and write the legal documents
• Train the partners to use the RST and card-printer machines
• Design and order the special cards, work with Scheidt & Bachmann (the MBTA’s
fare systems contractor) to make tariff changes, and deal with lost cards
• Design the data collection and survey components of the research aspect of the
pilot
• Analyze the data from the pilot and oversee CTPS’s work
• Meet with the partners monthly to address issues
• Make site visits to audit the partners
Some of those resources would not be necessary for a full program, but the MBTA
would still supply the cards and card printers to partners, provide oversight and auditing
of partners, and handle lost cards and other administrative issues. This would require a
new staff position dedicated to overseeing the program and assisting with the changes
to the Student Pass program.
The second question posed in the proposal is, “What are the administrative costs to the
municipal partners, and is it sustainable?” The interviews with the partners revealed that
the current model of the Youth Pass, with participants paying at the partner’s offices, is
not sustainable. The City of Boston reported that they cannot continue the program after
the pilot is over under this model. However, the partners believe that the program could
continue if the passes are sold on the fare vending machines.
The third question posed in the proposal is, “Does the pilot create a procedure that is
audit proof, limits fraud, and replicable?” The pilot created a procedure that is auditable
and limits fraud. This was in part due to the collaborative nature of the development of
the program so that the partners and the MBTA were in agreement with the goals.
There will likely be some challenges with extending the program to other municipal
partners who were not involved in the initial program design. The requirements for the
means-testing, and procedures for storing documents and verifying eligibility will need to

Youth Pass FINAL Report 060616 Page 45 of 93
be standardized. The MBTA will have to develop a new Memorandum of Understanding
and policy handbook for the partners.

Youth Pass FINAL Report 060616 Page 46 of 93
Chapter 5—Pilot Program Evaluation and Next Steps 5.1 Summary of Program Evaluation Findings
The Youth Pass Pilot was designed to meet the following five major goals.
Goal 1. Create affordable transit access for pilot participants
The pilot has accomplished this goal for the applicants who finished all of the steps to
enroll in the pilot.
Goal 2: Provide the data required to assess the impact of a Youth Pass on the mobility
of youth and their engagement in civic and community activities
The pilot has collected data, and the preliminary results indicate that the Youth Pass
has increased access to a range of activities for participants.
Goal 3: Have a limited impact on the MBTA’s revenue
The pilot is estimated to have a very limited impact on MBTA fare revenue.
Goal 4: Provide the data required to estimate the impact of a permanent Youth Pass
program on MBTA fare revenue and service delivery
The pilot has generated data to assist in the estimates of a full Youth Pass, but these
estimates still require assumptions outside the scope of the pilot data collection.
Goal 5: Assess whether municipal partners can distribute reduced fare MBTA passes in
an audit-proof manner that minimizes the MBTA administrative burden
The pilot has demonstrated a proof of concept for a collaborative model of administering
reduced fare MBTA products that is auditable and limits the MBTA administrative
burden.
5.2 Program Evaluation Challenges and Limitations
The MBTA and CTPS encountered several challenges and limitations while conducting
the pilot program evaluation:
• As discussed in Chapter 2, this report uses AFC data from the start of the
program in July 2015 through March 2016, which was the last month of complete
data available for the development of this report, to analyze Youth Pass usage.
As a result, this report does not reflect information about Youth Pass purchases
and use during the spring.
• The number of steps required to enroll and participate in the pilot has resulted in
limited youth participation.

Youth Pass FINAL Report 060616 Page 47 of 93
• As discussed in Section 2.3, most participants began providing their 30 days of
pre-pilot trip data during May and June 2015, just before the start of the Youth
Pass pilot program. This means that there is limited pre-pilot data that reflects the
fall, winter, and spring months of the school year.
• The AFC data and resulting analyses may be missing some of the Youth Pass
users. MBTA staff worked to match municipal records of Youth Pass participants
to as many pass sales recorded in the RST data as possible, but it was still not
possible to match some pass sales to Youth Pass pilot program participants.
5.3 Factors Affecting the Future of the Youth Pass
The Youth Pass pilot program has provided valuable insights into youth transportation
needs and behavior. It has also provided an opportunity to evaluate how to most-
effectively close gaps that may prevent youth from accessing reduced-price passes,
including those available through the existing Student Pass program. To date, findings
from the pilot program showed that Youth Pass participants made more trips than they
did prior to the pilot program, expanding their ability to be active in their communities.
However, MBTA staff also found that cash-handling created a large burden for
municipalities that were administering the program, and that it may be challenging for
youth to purchase and renew Youth Passes if they have to continue to return to their
municipal office.
The MBTA’s most recent package of fare changes addresses some of these issues for
both the Youth Pass and student fare products. On March 7, 2016, the MBTA’s Fiscal
Management and Control Board voted on a package of fare changes, effective July 1,
2016, that includes several relevant provisions:
• The cost of a Student Monthly LinkPass (valid 7 days per week) will increase
from $26 to $30. The price of a monthly Youth Pass would equal the cost of a
Student Monthly LinkPass, and so the cost of the Youth Pass, if implemented,
would increase from $26 to $30.
• Students will be able to purchase Student Monthly LinkPasses 12 months of the
year, instead of only 10 months.
• During the 2016–17 school year, the MBTA will pilot-test sales of Student
Monthly LinkPasses on MBTA fare vending machines. This would make it
possible to sell monthly Youth Passes on fare vending machines as well.

Youth Pass FINAL Report 060616 Page 48 of 93
In sum, these elements of the fare change package increase the price of the monthly
student passes, but they also expand access to the Student Monthly LinkPass, and
potentially to the Youth Pass. Students with a Student CharlieCard will be able to
access a reduced-price pass through the Student Pass program year round. This will
address 73 percent of the demand in the Youth Pass pilot.
These changes would make it possible to limit the scope of the Youth Pass program so that it specifically targets 12–18-year-old youth who are not enrolled in middle school or
high school and 19–21-year-old means-tested youth. Youth that are eligible for Youth
Passes would also be able to purchase and renew their passes at any fare vending
machine, as opposed to returning to their city or town partner office each month to do
so.
5.4 Full Program Recommendations
The preliminary results of the Youth Pass pilot resulted in the following
recommendations for changes to the program if the Youth Pass is implemented as a full
program:
• Allow sales of the monthly pass on the MBTA fare vending machines to ease the
administrative burden on the municipal partners
• Continue to have municipal partners verify eligibility and provide the photo ID
cards with an annual expiration date
• Allow additional municipalities to opt-in to the program
• Continue to analyze the means-testing portion of the program for future
extensibility
5.5 Youth Pass Program Scenario Evaluation
To assess the possible revenue and service impacts of a full Youth Pass program, this
section explores two possible scenarios for continuing or expanding the Youth Pass
program beyond the 12-month pilot period. This analysis assumes that a future Youth
Pass program, and the Student Pass program, would have the following structural
characteristics:
• Only the monthly Youth Pass will be available in a future Youth Pass program.
The 7-Day Youth Pass offered during the pilot will be discontinued.
• Monthly Youth Passes and Student Monthly LinkPasses would each cost $30.
• Middle and high dchool students would be able to obtain Student Monthly
LinkPasses year round, by receiving the Student S-Card from their school.
• Both monthly Youth Passes and Student Monthly LinkPasses will be available for
purchase on MBTA fare vending machines (FVMs), once youth have confirmed

Youth Pass FINAL Report 060616 Page 49 of 93
their eligibility for either program. Once they have enrolled, youth in the Youth
Pass program would not need to return to their municipal partner office each
month to pay for their pass.
As discussed in Section 5.3, the MBTA fare change package effective July 1, 2016,
addresses many barriers that limit student access to Student Monthly LinkPasses. This
makes it possible to limit the scope of the Youth Pass program so that it specifically
targets youth who may not be able to afford a monthly pass at the full price or obtain it
through another program. As a result, these two scenarios have the following features in
terms of program eligibility:
• Middle and high school students would no longer be eligible to obtain monthly
passes through the Youth Pass program because they would be able to obtain Student Monthly LinkPasses year-round. Youth 12–18 years old, not enrolled in
middle or high school would be eligible for the Youth Pass.
• Youth in the 19-to-21-year-old age range would need to demonstrate that they
meet means testing requirements to be eligible for the Youth Pass program. For
the purposes of this scenario analysis, youth would need to be identified as living
in a low-income household.10 This is used as a proxy for meeting the eligibility
screens of enrollment in a state or federal benefit program like MassHealth,
SNAP and public housing.
The two scenarios described in this report represent a low number and high number of
municipalities that might participate in the program. The “Few Towns” scenario only
includes the municipalities that have been participating in the pilot program. The “Many
Towns” scenario includes the 14 communities that were part of the original Metropolitan
Transit Authority’s (MTA) service area when the MBTA was formed, plus three
additional municipalities that receive supplemental school bus service from the MBTA
(Lynn, Melrose, and Quincy).11 Table 5-1 lists the municipalities that were included in
each scenario. The Many Towns scenario is not based on any discussion with the
additional 13 municipalities; it only serves to provide a potential “upper-bound” case for
a full Youth Pass program.
10 The threshold for low income is based on the median household income for the full 175-town MBTA
service area estimated from 2010-2014 American Community Survey (ACS) data, which is $73,587.
The low income threshold is 60 percent of the median household income value, or $44,152. 11 The 14 communities that were part of the original Metropolitan Transit Authority’s (MTA) service area
when the MBTA was formed include Arlington, Belmont, Boston, Brookline, Cambridge, Chelsea,
Everett, Malden, Medford, Milton, Newton, Revere, Somerville, and Watertown.

Youth Pass FINAL Report 060616 Page 50 of 93
TABLE 5-1
Possible Future Youth Pass Scenarios
Scenario Representative Participating Municipalities “Few Towns” (Original pilot participants)
Boston, Chelsea, Malden, Somerville
“Many Towns”
Arlington, Belmont, Boston, Brookline, Cambridge, Chelsea, Everett, Lynn, Malden,
Medford, Melrose, Milton, Newton, Quincy, Revere, Somerville, Watertown
The sections below describe the three components of the scenarios:
• The market of youth eligible and likely to participate in a Youth Pass program
• The estimated net revenues for the MBTA, based on market size and various
levels of program participation
• The estimated impacts to MBTA service, based on market size and various
levels of program participation
Youth Eligible for a Future Youth Pass Program
To estimate the number of youth that would be eligible and likely to participate in a
Youth Pass program under each scenario, CTPS applied a sequence of steps designed
to capture youth that met age, school enrollment, and income (if applicable) criteria; and
live near and are likely to use transit. These steps are described below. Several of the
data sources mentioned in each step are described in Appendix A: Data Sources.
Additional details for a number of these steps are available in Appendix B: Scenario
Evaluation Methodology Details.
• Step 1: Estimate the population of eligible youths, based on age, income,
and school enrollment characteristics. Eligible youth include those that are:
o Ages 12 to 18 years old and are not enrolled in middle or high school or
college
o Ages 12 to 18 years old, who are enrolled in college
o Ages 19 to 21 years old, who live in low-income households and are not
enrolled in middle or high school or college
o Ages 19 to 21 years old, who live in low-income households and are
enrolled in college
CTPS developed these estimates using data from the 2014 American
Community Survey (ACS), including data from the five-year summary file and

Youth Pass FINAL Report 060616 Page 51 of 93
the five-year Public Use Microdata Sample (PUMS). These estimates only
include youth in households; they exclude youth living in group quarters, such as
college dormitories. Table B-1 in Appendix B shows the estimates for eligible
youth in this group.
• Step 2: Estimate the population of eligible youths who live near transit
CTPS conducted a geographic information systems (GIS) analysis to determine
the portion of the youth population that is eligible for a Youth Pass that lives
within one-quarter mile walking distance of an MBTA bus stop or one-half mile
walking distance of an MBTA rapid transit station. Table B-2 in Appendix B
shows these results.
• Step 3: Estimate the population of eligible youths who live near transit that
are likely to use transit
CTPS used data from the 2010–11 Massachusetts Travel Survey (MTS)—a
statewide survey of how people use the Commonwealth’s multimodal
transportation system—to estimate the percentage of people, by age group, who
live in the densely-populated areas of the 17 municipalities included in the two
scenarios and are likely to use transit. Appendix A provides additional details
about the MTS, while Appendix B describes how information from the MTS was
used to determine the share of youth, by age group, who are likely to use transit.
Using the MTS data, CTPS estimated that approximately 37 percent of the 12-
to-18-year-old population living near transit, and approximately 55 percent of the
19-to-21-year-old population living near transit, reported at least one transit trip
as part of their survey response.12 As a result, CTPS assumes these shares of
each population segment reflect those who are likely to use transit.
Table 5-2 summarizes the results of steps 1 through 3, and shows the estimated
number of people in each scenario that would be eligible, and may wish to
participate, in a future Youth Pass program.
12 The estimate of 19-21 year olds who reported at least one transit trip as part of their MTS response
reflects youth in this age group, regardless of income. This estimate does not specifically reflect the
transit usage of 19-21 year olds in low-income households.

Youth Pass FINAL Report 060616 Page 52 of 93
TABLE 5-2
Estimated Youth Population Eligible for a Youth Pass,
Who Lives Near Transit and Uses Transit
Category Few Towns
Scenario Many Towns
Scenario
Age 12-18, Not Enrolled in School 800 1,300
Age 12-18, In College 700 1,300 Age 19-21, Low-Income, Not Enrolled in School 2,300 3,500
Age 19-21, Low-Income, In College 4,500 6,100
Total 8,400 12,200
Data sources: 2014 American Community Survey (ACS) 5-Year Summary File; 2014 ACS 5-Year Public Use Microdata Sample (PUMS); CTPS GIS Analysis; 2010-11 Massachusetts Travel Survey. Note: Values have been rounded to the nearest 100 people. Totals may not sum due to rounding. Population values reflect youth in households only.
The populations of youth in either age group that are enrolled in school vary in
comparison to the population groups shown in Table 5-2. In the Few Towns
scenario, the estimated 12-to-18-year-old population enrolled in middle or high
school is about 17,800. The 19-to-21 year old population that is a) enrolled in
middle or high school; and b) living in low income households is about 500
people. Meanwhile, in the Many Towns scenario, the estimated 12-to-18-year-old
population enrolled in middle or high school is approximately 32,900.The 19-to-
21 year old population that is a) enrolled in middle or high school; and b) living in
low income households is about 700 people.
Estimating Future Youth Pass Program Revenues
After estimating the markets of youth who would be eligible and may wish to participate
in a Youth Pass program, CTPS applied several assumptions to calculate MBTA
revenues under each program scenario. These assumptions are shaped by the MBTA
fare-change package described earlier in this chapter and by the findings from the pilot
program, as described in Chapters 2 and 3.
• Youth Pass Cost: The Youth Pass will cost $30, the same as a Student Monthly
LinkPass, based on the new fares that will go into effect on July 1, 2016.
• Passes on Fare Vending Machines (FVMs). When reviewing the Youth Pass
AFC data, CTPS noticed cases where participants were paying single-ride and

Youth Pass FINAL Report 060616 Page 53 of 93
transfer fares for trips for short periods between using their Youth Passes. They
may have been paying for trips this way as a stop-gap measure until they could
return to their municipal partner office to renew their pass. With the availability of
passes on fare vending machines, after enrolling, participating youth will be able
to buy their passes on FVMs; this will eliminate their need to pay for “between-
pass” trips. As a result, youth participating in the program would only pay the
cost of the pass ($30) each month.
• Estimates of Monthly “Foregone” Revenues per person. CTPS used pre-
pilot AFC data to estimate the amount that pilot participants would spend during
either a school year month or summer month if they were not in a Youth Pass
program. These monthly expenditure values, when multiplied by the estimated
number of participants in the program during a given month, provide a way to
estimate the amount of revenue the MBTA would take in if the Youth Pass
program did not exist. Details about how CTPS created these estimates are
available in Appendix B.
Table 5-3 shows the estimated monthly foregone revenue amount for each type
of month (school or summer). During a given year, summer months include July
and August, while school year months include September through June.
TABLE 5-3
Estimated Foregone Revenue Amounts, by Month
Groups Represented Month Type Foregone Revenue
Amount
12-18, not enrolled in school or enrolled in college
School $56.50
12-18, not enrolled in school or enrolled in college
Summer $59.00
19-21 and low income, not enrolled in school or enrolled in college
School $56.50
19-21 and low income, not enrolled in school or enrolled in college
Summer $60.50
Data source: CTPS pre-pilot AFC data.
Note: Values have been rounded to the nearest $0.50

Youth Pass FINAL Report 060616 Page 54 of 93
• Ongoing Participation. CTPS assumed that youth participating in a future
Youth Pass program would participate all months of the year. In reality,
individual participation in the program would likely fluctuate over time, with youth
entering, remaining in, or exiting the program as they learn about it, participate in
it, and determine whether it continues to meet their needs.
• Adding in passes for GED/HiSET program enrollees that would not
otherwise be eligible for a Youth Pass. Currently, some youth who are not
enrolled in school may still have access to Student Monthly LinkPasses,
particularly if they participate in a General Educational Development (GED) /
High School Equivalency (HiSET) testing program that purchases monthly
passes on behalf of their students. In the future, youth in these programs will not
be able to receive reduced-price passes through the Student Pass program;
MBTA staff anticipates that these individuals would be able to obtain passes
through a Youth Pass program. Many of these youth are already eligible for the
Youth Pass program based on other criteria, but youth aged 19 to 21 who do not
live in low-income households would not be eligible based on the other criteria.
CTPS estimated the number of passes that may currently be sold to youth in this
category through the Student Pass program, and added this number of passes
to estimated Youth Pass sales during school or summer months. Appendix B
provides additional details on how CTPS estimated the number of passes for
GED/HiSET program enrollees for each scenario.
To calculate estimated Youth Pass program revenues and foregone revenues, CTPS
completed the following steps for each of the four market categories of participants (12
to 18 years old and not in school; 12 to 18 years old and in college; 19 to 21 years old,
low-income, and not enrolled in school; and 19 to 21 years old, low-income, and in
college):
• Step 1: CTPS developed a range of possible program participation levels,
ranging from 10 percent of the eligible market participating in the program, to
100 percent (full participation).
Example: 1,000 youth in category at a 10 percent participation level
1,000 * 0.10 = 100 potential participants
• Step 2: CTPS estimated the pass sales for summer months by multiplying the
number of expected participants at each participation level by two (2). Any
Student Monthly LinkPasses that were expected to be sold to participants in
GED programs during summer months were added to these total pass sales.
This adjusted number of passes was multiplied by $30 to determine the
estimated program revenues for the summer.

Youth Pass FINAL Report 060616 Page 55 of 93
Example: 100 potential participants * 2 months = 200 passes.
Add 10 pass sales for GED program enrollees during summer = 210
passes.
210 passes * $30 = $6,300
• Step 3: CTPS estimated the foregone revenues for summer months by
multiplying the number of passes sold by the appropriate average foregone
revenue amount for that market category. In this calculation, each pass
represents one month of youth travel.
Example: Summer monthly foregone revenue for category: $59.00
210 passes * $59.00 = $12,390
• Step 4: CTPS estimated the pass sales for school months by multiplying the
number of expected participants at each participation level by ten (10). Any
Student Monthly LinkPasses that were expected to be sold to participants in
GED programs during school months were added to total pass sales. This
adjusted number of passes was multiplied by $30 to determine the estimated
program revenues for the school year.
Example: 100 potential participants * 10 months = 1,000 passes
Add 50 pass sales for GED program enrollees during the school year
= 1,050 passes
1,050 passes * $30 = $31,500
• Step 5: CTPS estimated the foregone revenues for school year months by
multiplying the number of passes sold by the appropriate average foregone
revenue amount for that market category. In this calculation, each pass
represents one month of youth travel.
Example: School monthly foregone revenue for category: $55.00
1,050 passes * $55.00 = $57,750
• Step 6: CTPS summed the Youth Pass revenues for the full year, and summed
the estimated foregone revenues for the full year. The foregone revenues were
subtracted from the Youth Pass revenues to determine the net program
revenues at each participation level.
Example: Total Youth Pass revenues: $6,300 + $31,500 = $37,800
Total foregone revenues: $12,390 + $57,750 = $70,140
Total net revenue loss: $70,140 - $37,800 = $32,340

Youth Pass FINAL Report 060616 Page 56 of 93
CTPS followed this process for all four market categories of participants in order to
develop net revenue estimates for the Few Towns scenario. This process was then
repeated to develop estimates for the Many Towns scenario.
Few Towns Scenario: Net Program Revenues
Table 5-4 summarizes the ranges of net Youth Pass Program revenues for the Few
Towns scenario, which includes Boston, Chelsea, Malden, and Somerville. CTPS
created these ranges by varying the percent of each market category that would be
likely to participate in a Youth Pass program. Values were calculated for each market
category at 10 percent and at 100 percent. These ranges are shown for each individual
market category, and then in total.
Under the Few Towns Scenario, net revenue losses would range from $271,000 (at 10
percent participation) to approximately $2.7 million (at 100 percent participation) per
year, assuming all market categories are included in the program.
TABLE 5-4
Few Towns Scenario: Ranges of Estimated Net Program Revenues, by Category
Market Category
Range of Estimated
Participants
Range of Youth
Passes Sold, Per
Year1
Total Annual
Youth Pass
Program Revenues
Total
Annual Foregone Revenues
Total
Net Program
Revenues
Age 12–18, Not Enrolled in School
100 – 800 1,000 –
9,500 $29,000 – $285,000
$54,000 – $540,000
($26,000 – $255,000)
Age 12–18, In College
100 – 700 900 – 8,600
$26,000 –$259,000
$49,000 – $491,000
($23,000 – $232,000)
Age 19–21, Low-Income, Not Enrolled in School
200 – 2,330 2,800 – 28,100
$84,000 –$843,000
$160,000 – $1,603,000
($76,000 – $760,000)
Age 19–21, Low-Income, In College
500 - 4500 5,400 – 54,000
$162,000 –$1,621,000
$308,000 – $3,082,000
($146,000 –
$1,461,000)
Total
800 – 8,400 10,000 – 100,300
$301,000 – $3,009,000
$572,000 – $5,716,000
($271,000 –
$2,708,000)

Youth Pass FINAL Report 060616 Page 57 of 93
Data sources: 2014 American Community Survey (ACS) 5-Year Summary File; 2014 ACS 5-Year Public Use Microdata Sample (PUMS); CTPS GIS Analysis; 2010–11 Massachusetts Travel Survey; CTPS pre-pilot AFC data. Note: Participants and pass sales have been rounded to the nearest 100. Dollar values have been rounded to the nearest thousand. Totals may not sum due to rounding. (1) The total annual pass sales have been adjusted to account for Youth Pass sales to 19-to-21-year-old
youth in GED/HiSET programs that are not accounted for in the estimated range of participants.
Table 5-5 shows the estimated net program revenues for all categories combined at
various participation levels. To estimate the number of eligible youth who might choose
to participate in a future Youth Pass program, CTPS calculated the pilot program
application rate for eligible youth in the participating municipalities. To do so, CTPS first
determined the total number of youth who applied to the Youth Pass pilot program that
would meet the eligibility criteria of the Youth Pass program under the scenarios (12 to
18-year-old youth not enrolled in middle or high school; and 19 to 21-year-old youth not
enrolled in middle or high school, that are also low-income). These values were then
compared to the total eligible youth population in the four pilot municipalities that live
near transit and are estimated to use transit.
Using this approach, CTPS determined that approximately 14 percent of eligible youth
expressed interest in the program under current marketing conditions. As a result,
CTPS has highlighted the 15 percent participation rate row in the table to indicate the
expected level of participation in a future Youth Pass program. This percentage does
not account for increased interest in the program in response to availability of Youth
Passes on the fare vending machines or different methods to market the program.

Youth Pass FINAL Report 060616 Page 58 of 93
TABLE 5-5
Few Towns Scenario: Estimated Net Program Revenues (All Categories) at
Various Participation Levels
Market (All Categories) Participation Level
Age Category
Estimated
Youth Passes
Sold, Per Year1
Total Annual
Youth Pass
Program Revenues
Total
Annual Foregone Revenues
Total
Net Program
Revenues
10% participation
12 to 18 1,800 $54,000 $103,000 ($49,000)
19 to 21 8,200 $246,000 $468,000 ($222,000)
All 10,000 $301,000 $572,000 ($271,000)
15% participation
12 to 18 2,700 $82,000 $155,000 ($73,000)
19 to 21 12,300 $370,000 $703,000 ($333,000)
All 15,000 $451,000 $857,000 ($406,000)
20% participation
12 to 18 3,600 $109,000 $206,000 ($97,000)
19 to 21 16,400 $493,000 $937,000 ($444,000)
All 20,100 $602,000 $1,143,000 ($542,000)
30% participation
12 to 18 5,400 $163,000 $310,000 ($146,000)
19 to 21 24,600 $739,000 $1,405,000 ($666,000)
All 30,100 $903,000 $1,715,000 ($812,000)
100% participation
12 to 18 18,100 $544,000 $1,032,000 ($487,000)
19 to 21 82,100 $2,464,000 $4,685,000 ($2,220,000)
All 100,300 $3,009,000 $5,716,000 ($2,708,000) Data sources: 2014 American Community Survey (ACS) 5-Year Summary File; 2014 ACS 5-Year Public Use Microdata Sample (PUMS); CTPS GIS Analysis; 2010-11 Massachusetts Travel Survey; CTPS pre-pilot AFC data. Note: Pass sales have been rounded to the nearest 100. Dollar values have been rounded to the nearest thousand. Totals may not sum due to rounding. (1) The total annual pass sales have been adjusted to account for Youth Pass sales to 19-to-21 year old
youth in GED/HiSET programs.
At the 15 percent participation level, estimated net revenue losses are approximately
$73,000 for the 12-to-18-year-old group (including both youth not enrolled in school and
in college), and $333,000 for the 19-to-21-year-old group (including both youth not
enrolled in school and in college). At the 15 percent participation level, the estimated net
revenue loss for all categories is approximately $406,000.

Youth Pass FINAL Report 060616 Page 59 of 93
Appendix B includes four tables that provide the information shown in Table 5-5, but are
specific to each of the four market categories.
Many Towns Scenario: Net Program Revenues
Table 5-6 summarizes the ranges of net Youth Pass Program revenues for the Many
Towns scenario, which includes the 17 core-area communities listed in Table 5-1. CTPS
created these ranges by varying the percent of each market category that would be
likely to participate in a Youth Pass program from 10 percent to 100 percent. These
ranges are shown for each individual market category, and in total.
TABLE 5-6
Many Towns Scenario: Ranges of Estimated Net Program Revenues, by Category
Market Category
Range of
Estimated Participants
Range of Youth
Passes Sold, Per
Year1
Total Annual
Youth Pass
Program Revenues
Total
Annual Foregone Revenues
Total
Net Program
Revenues Age 12–18, Not Enrolled in School 100 – 1,300
1,500 – 15,400
$46,000 – $464,000
$88,000 – $878,000
($41,000 – $415,000)
Age 12–18, In College 100 – 1,300
1,600 – 16,000
$48,000 – $481,000
$91,000 –$911,000
($43,000 – $431,000)
Age 19–21, Low-Income, Not Enrolled in School 300 – 3,500
4,200 – 41,800
$125,000 – $1,253,000
$238,000 – $2,382,000
($113,000 –
$1,129,000)
Age 19–21, Low-Income, In College 600 – 6,100
7,300 – 73,300
$220,000 – $2,198,000
$418,000 – $4,178,000
($198,000 –
$1,980,000)
Total 1,200 – 12,200
14,700 – 146,500
$440,000 – $4,396,000
$835,000 – $8,350,000
($395,000 –
$3,955,000)
Data sources: 2014 American Community Survey (ACS) 5-Year Summary File; 2014 ACS 5-Year Public Use Microdata Sample (PUMS); CTPS GIS Analysis; 2010-11 Massachusetts Travel Survey; CTPS pre-pilot AFC data. Note: Note: Participants and pass sales have been rounded to the nearest 100. Dollar values have been rounded to the nearest thousand. Totals may not sum due to rounding.
(1) The total annual pass sales have been adjusted to account for Youth Pass sales to 19-to-21 year old youth in GED/HiSET programs that are not accounted for in the estimated range of participants.

Youth Pass FINAL Report 060616 Page 60 of 93
Under the Many Towns Scenario, net revenue losses would range from $395,000 (at 10
percent participation) to approximately $4 million (at 100 percent participation) per year,
assuming all market categories are included in the program.
Table 5-7 shows the estimated net program revenues for all categories combined at
various participation levels. As discussed in the Few Towns scenario section, CTPS
determined that approximately 14 percent of eligible youth expressed interest in the
program under current marketing conditions. As a result, CTPS has highlighted a 15
percent participation row in the table to indicate the expected level of participation in a
future Youth Pass program.
TABLE 5-7
Many Towns Scenario: Estimated Net Program Revenues (All Categories) at
Various Participation Levels
Market (All Categories) Participation Level
Age Category
Estimated
Youth Passes
Sold, Per Year1
Total Annual
Youth Pass
Program Revenues
Total
Annual Foregone Revenues
Total
Net Program
Revenues
10% participation
12 to 18 3,100 $94,000 $179,000 ($85,000) 19 to 21 11,500 $345,000 $656,000 ($311,000)
All 14,700 $440,000 $835,000 ($395,000)
15% participation
12 to 18 4,700 $142,000 $268,000 ($127,000) 19 to 21 17,300 $518,000 $984,000 ($466,000)
All 22,000 $659,000 $1,253,000 ($593,000)
20% participation
12 to 18 6,300 $189,000 $358,000 ($169,000) 19 to 21 23,000 $690,000 $1,312,000 ($622,000)
All 29,300 $879,000 $1,670,000 ($791,000)
30% participation
12 to 18 9,400 $283,000 $537,000 ($254,000) 19 to 21 34,500 $1,035,000 $1,968,000 ($933,000)
All 44,000 $1,319,000 $2,505,000 ($1,186,000)
100% participation
12 to 18 31,500 $945,000 $1,790,000 ($845,000) 19 to 21 115,000 $3,451,000 $6,560,000 ($3,109,000)
All 146,500 $4,396,000 $8,350,000 ($3,955,000) Data sources: 2014 American Community Survey (ACS) 5-Year Summary File; 2014 ACS 5-Year Public Use Microdata Sample (PUMS); CTPS GIS Analysis; 2010-11 Massachusetts Travel Survey; CTPS pre-pilot AFC data. Note: Pass sales have been rounded to the nearest 100. Dollar values have been rounded to the nearest thousand. Totals may not sum due to rounding (1) The total annual pass sales have been adjusted to account for Youth Pass sales to 19-to-21 year old
youth in GED/HiSET programs.

Youth Pass FINAL Report 060616 Page 61 of 93
At the 15 percent participation level, estimated net revenue losses are approximately
$127,000 for the 12-to-18-year-old group (including both youth not enrolled in school
and in college), and $466,000 for the 19-to-21-year-old group (including both youth not
enrolled in school and in college). At the 15 percent participation level, the estimated net
revenue loss for all categories is approximately $593,000.
Appendix B includes four tables that provide the information shown in Table 5-7, but are
specific to each of the four market categories.
Estimating Future Youth Pass Program Service Impacts
CTPS also estimated the additional number of unlinked weekday trips that may take
place on the MBTA local bus and rapid transit system under the Few Towns and Many
Towns Youth Pass program scenarios.13 Two sets of estimates were calculated for each
scenario: one for additional weekday trips taking place during a summer month, and
one for additional weekday trips taking place during a school-year month. To do this,
CTPS used the estimated number of Youth Pass program participants to determine the
number of passes that would be sold during a school-year or summer month.14 Each
pass represents one month of youth travel. CTPS then applied several assumptions,
which are determined by the MBTA fare-change package described earlier in this
chapter, and by the findings from the pilot program.
• Passes on Fare Vending Machines (FVMs). When reviewing the Youth Pass
AFC data, CTPS noticed cases where participants were paying single-ride and
transfer fares for trips for short periods between using their Youth Passes. After
enrolling in the Youth Pass program, participating youth will be able to buy their
passes on FVMs, which will eliminate their need to make “between-pass” trips.
Therefore, CTPS assumed that a monthly Youth Pass will cover all of a
participant’s monthly trips on the local bus and rapid transit system.
• Ongoing Participation. CTPS assumed that youth participating in a future
Youth Pass program would participate all months of the year.
• Estimates of Weekday Trips per Month (Pre-Pilot Data). CTPS used pre-pilot
AFC data to estimate the number of unlinked weekday trips that youth made per
month before they received a Youth Pass. These values are based on different
samples of pre-pilot participants, which varied depending on:
13 An unlinked trip is an individual trip on any single transit vehicle; a single journey, often composed of
many unlinked trips on multiple vehicles, is a “linked” trip. These estimates of unlinked trips are based
on the number of times people tapped their CharlieCard to interact with an AFC fare gate or fare box. 14 These pass estimates were later adjusted to include estimates of passes for 19-to-21-year old youth
(not low income) in GED/HiSET programs that would be purchased in a given month.

Youth Pass FINAL Report 060616 Page 62 of 93
o Whether the participants were enrolled in school
o Whether the participants lived in a low-income household
o Whether they provided their 30-days of pre-pilot data during school
months (late May through June 2015, and September 2015 through
March 2016), or during summer months (July and August 2015)
Appendix B includes details about how CTPS created these estimates.
AFC data for taps against MBTA fare gates or fare boxes includes a time stamp,
which makes it possible to determine the day of the week and the time of day a
trip was made. CTPS used this information to determine whether trips made on
weekdays were made during the AM peak period (between 7:00 AM and 8:59
AM), the PM peak period (between 4:00 PM and 6:30 PM), or during non-peak
times. In addition to calculating an average number of weekday trips pre-pilot
participants made per month, CTPS could also estimate the average number of
weekday trips participants made during each service period, as shown in Table
B-15 in Appendix B.
• Estimates of Weekday Trips per Month (Youth Pass Data). CTPS also used
AFC data from Youth Pass participants to estimate the number of unlinked
weekday trips that youth made per month with a Youth Pass. These values were
calculated using a process similar to the one used to develop the pre-pilot
values. CTPS created samples of Youth Pass participants based on whether or
not they were enrolled in school, and whether or not they lived in low-income
households. Only participants who used monthly Youth Passes were included in
these samples, because only the monthly Youth Pass will be offered under these
scenarios. CTPS estimated average weekday trips per month (by service period
and overall) using per-person averages calculated over school months, and over
summer months. These values are shown in Table B-16 in Appendix B.
Using these assumptions, CTPS calculated the net unlinked trips that would be added
to the MBTA local bus and rapid transit system each weekday, depending on service
period and month type, for the Few Towns and Many Towns scenarios. CTPS
completed the following steps for each of the four market categories of participants (12
to 18 years old, not in school; 12 to 18 years old, in college; 19 to 21 years old, low
income, and not enrolled in school; 19 to 21 years old, low income, and in college):
• Step 1: Using pre-pilot and Youth Pass estimates of net weekday trips per
month (by service period), CTPS calculated the net number of additional trips a
Youth Pass participant would make per month during each of these periods.
Table 5-8 shows these values.

Youth Pass FINAL Report 060616 Page 63 of 93
TABLE 5-8
Estimated Average Net Weekday Trips per Month, by Service Period
Groups Represented Month Type
AM-Peak Period
Non-Peak
Period
PM-Peak
Period Total
12–18, not-enrolled-in-school or enrolled–in-college
School 3 13 5 21
12–18, not-enrolled-in-school or enrolled–in-college
Summer 3 14 2 19
19–21 and low-income, not-enrolled-in-school or enrolled-in-college
School 3 14 5 22
19–21 and low-income, not-enrolled-in-school or enrolled-in-college
Summer 3 14 3 19
Data source: MBTA Youth Pass pilot AFC data, MBTA pre-pilot AFC data
• Step 2: As in the net revenue calculations, CTPS developed a range of possible
program participation levels, ranging from 10 percent of the eligible market
participating in the program, to 100 percent (full participation).
• Step 3: CTPS used the estimated number of Youth Pass program participants in
each market category to determine the number of passes that would be sold
during a summer month, including any passes for 19-to-21-year-old youth (not
low-income) in GED/HiSET programs. As mentioned above, each pass
represents one month of youth travel. CTPS then multiplied the number of
passes in each market category by net weekday trip values for that category, as
shown in Table 5-8.
Example: 100 potential participants * 1 month = 100 passes.

Youth Pass FINAL Report 060616 Page 64 of 93
Add 2 pass sales for GED program enrollees during a summer = 102
passes.
102 passes * 3 additional AM Peak weekday trips per month = 306
additional AM Peak weekday trips per month.
• Step 4: CTPS divided the number of additional weekday trips per summer
month, for each service period, by 20.75, which is the average number of
weekdays per month when accounting for holidays. This makes it possible to
determine the net additional trips in that service period on a given weekday
during a summer month.
Example: 306 additional AM Peak weekday trips per month / 20.75 = 15
additional AM Peak trips per weekday.
• Step 5: CTPS repeated the process outlined in step 3, using data on
participants, passes, and net additional weekday trips, to estimate the additional
weekday trips per month (by service period) during a school year month.
• Step 6: CTPS repeated the process outlined in Step 4 to determine the net
additional trips in that service period on a given weekday during a school year
month.
Few Towns Scenario: Net Additional Weekday Trips
Tables 5-9 and 5-10 summarize the ranges of net additional weekday trips, by service
period, that may be made on the MBTA local bus and rapid transit system for the Few
Towns Youth Pass program scenario. Table 5-9 provides this information for a summer
month, while Table 5-10 provides this information for a school year month. CTPS
created these ranges by varying the percent of each market category that would be
likely to participate in a Youth Pass program. Values were calculated for each market
category at 10 percent and at 100 percent. These ranges are shown for each individual
market category, and then in total. The columns for the peak periods are highlighted in
each table.
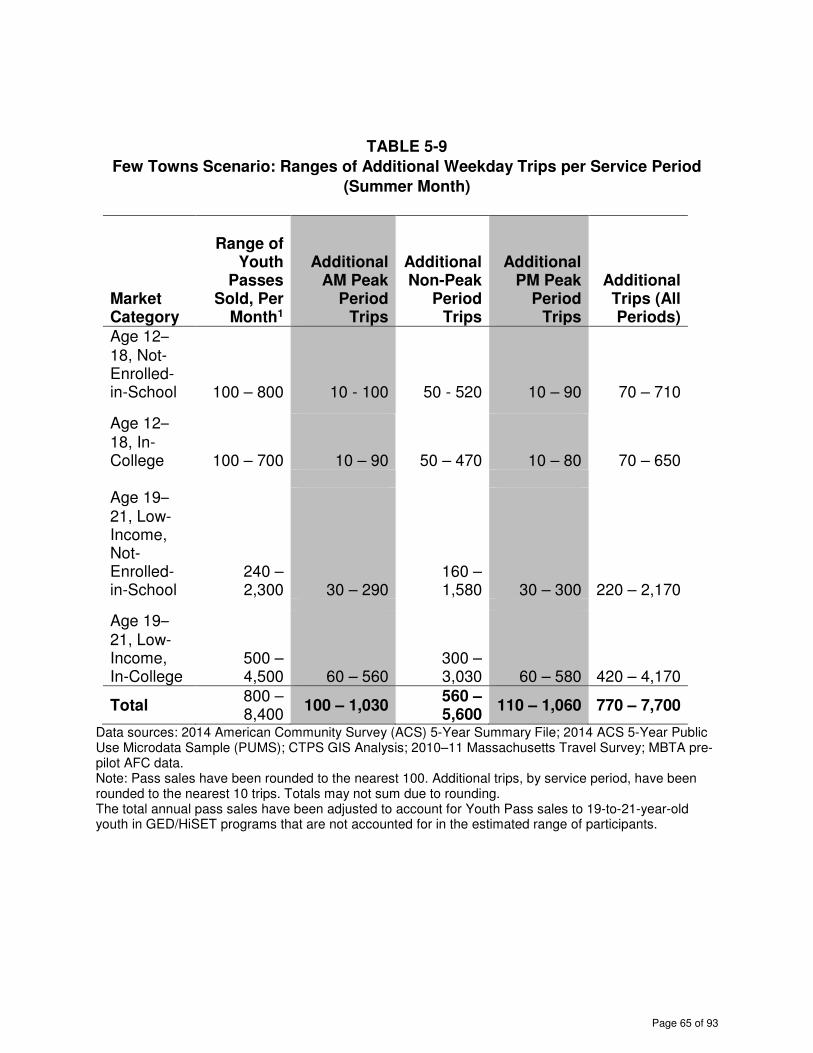
Youth Pass FINAL Report 060616 Page 65 of 93
TABLE 5-9
Few Towns Scenario: Ranges of Additional Weekday Trips per Service Period
(Summer Month)
Market Category
Range of
Youth Passes
Sold, Per Month1
Additional AM Peak
Period Trips
Additional Non-Peak
Period Trips
Additional PM Peak
Period Trips
Additional Trips (All Periods)
Age 12–
18, Not-Enrolled-in-School 100 – 800 10 - 100 50 - 520 10 – 90 70 – 710
Age 12–
18, In-College 100 – 700 10 – 90 50 – 470 10 – 80 70 – 650
Age 19–
21, Low-Income, Not-Enrolled-in-School
240 – 2,300 30 – 290
160 – 1,580 30 – 300 220 – 2,170
Age 19–
21, Low-Income, In-College
500 – 4,500 60 – 560
300 – 3,030 60 – 580 420 – 4,170
Total 800 – 8,400
100 – 1,030 560 – 5,600
110 – 1,060 770 – 7,700
Data sources: 2014 American Community Survey (ACS) 5-Year Summary File; 2014 ACS 5-Year Public Use Microdata Sample (PUMS); CTPS GIS Analysis; 2010–11 Massachusetts Travel Survey; MBTA pre-pilot AFC data. Note: Pass sales have been rounded to the nearest 100. Additional trips, by service period, have been rounded to the nearest 10 trips. Totals may not sum due to rounding. The total annual pass sales have been adjusted to account for Youth Pass sales to 19-to-21-year-old youth in GED/HiSET programs that are not accounted for in the estimated range of participants.

Youth Pass FINAL Report 060616 Page 66 of 93
TABLE 5-10
Few Towns Scenario: Ranges of Additional Weekday Trips per Service Period
(School Month)
Market Category
Range of
Youth Passes
Sold, Per Month1
Additional AM Peak
Period Trips
Additional Non-Peak
Period Trips
Additional PM Peak
Period Trips
Additional Trips (All Periods)
Age 12–
18, Not-Enrolled-in-School 100 – 800 10 – 130 50 – 500 20 – 180 80 - 800
Age 12–
18, In-College 100 – 700 10 – 110 50 – 460 20 – 160 70 – 730
Age 19–
21, Low-Income, Not-Enrolled-in-School
230 – 2,300 40 – 380
160 – 1,570 50 – 530
250 – 2,500
Age 19–
21, Low-Income, In-College
500 – 4,500 70 – 730
300 – 3,010 100 – 1,010
480 – 4,760
Total 800 – 8,400
130 – 1,340 550 – 5,540
190 – 1,890 880 – 8,760
Data sources: 2014 American Community Survey (ACS) 5-Year Summary File; 2014 ACS 5-Year Public Use Microdata Sample (PUMS); CTPS GIS Analysis; 2010–11 Massachusetts Travel Survey; MBTA pre-pilot AFC data. Note: Pass sales have been rounded to the nearest 100. Additional trips, by service period, have been rounded to the nearest 10 trips. Totals may not sum due to rounding. (1) The total annual pass sales have been adjusted to account for Youth Pass sales to 19-to-21-year-old youth in GED/HiSET programs that are not accounted for in the estimated range of participants.
These tables show that under the Few Towns scenario, the additional trips that may be
made during the AM peak period range from around 100 trips (at the 10 percent
participation level) to around 1,340 trips (at the 100 percent participation level),
depending on the month type. During the PM peak period, estimated additional trips
range from around 110 trips (at the 10 percent participation level) to nearly 1,900 trips
(at the 100 percent participation level), depending on the month type. These estimates
show that participants would likely make more peak-period trips during school months

Youth Pass FINAL Report 060616 Page 67 of 93
compared to summer months. Overall, additional weekday trips, regardless of service
period, range from 770 (at the 10 percent participation level) to approximately 8,800 (at
the 100 percent participation level). As mentioned in Chapter 3, there were
approximately 1.2 million weekday boardings on the MBTA bus and rapid transit
systems in fiscal year (FY) 2013. This projected net growth in trips on the bus and rapid
transit system is very small by comparison, and would likely be dispersed throughout
the bus and rapid transit networks.
Tables 5-11 and 5-12 show the estimated additional weekday trips for all categories
combined at various participation levels. CTPS has highlighted a 15 percent
participation-rate row in the table to indicate the expected level of participation in a
future Youth Pass program, based on pilot conditions.
TABLE 5-11
Few Towns Scenario: Estimated Additional Weekday Trips at Various
Participation Levels (Summer Month)
Market (All Categories) Participation Level
Estimated
Youth Passes
Sold, Per Month1
Additional AM Peak
Period Trips
Additional Non-Peak
Period Trips
Additional PM Peak
Period Trips
Additional Trips (All Periods)
10% participation 800 100 560 110 770
15% participation 1,300 160 840 160 1,150
20% participation 1,700 210 1,120 210 1,540
30% participation 2,500 310 1,680 320 2,310
100% participation 8,400 1,030 5,600 1,060 7,700 Data sources: 2014 American Community Survey (ACS) 5-Year Summary File; 2014 ACS 5-Year Public Use Microdata Sample (PUMS); CTPS GIS Analysis; 2010–-11 Massachusetts Travel Survey; MBTA pre-pilot AFC data. Note: Pass sales have been rounded to the nearest 100. Additional trips, by service period, have been rounded to the nearest 10 trips. Totals may not sum due to rounding. (1) The total annual pass sales have been adjusted to account for Youth Pass sales to 19-to-21-year-old youth in GED/HiSET programs that are not accounted for in the estimated range of participants

Youth Pass FINAL Report 060616 Page 68 of 93
TABLE 5-12
Few Towns Scenario: Estimated Additional Weekday Trips at Various
Participation Levels (School Month)
Market (All Categories) Participation Level
Estimated Youth
Passes Sold, Per
Month1
Additional AM Peak
Period Trips
Additional Non-Peak
Period Trips
Additional PM Peak
Period Trips
Additional Trips (All Periods)
10% participation 800 130 550 190 880
15% participation 1,300 200 830 280 1,310
20% participation 1,700 270 1,110 380 1,750
30% participation 2,500 400 1,660 570 2,630
100% participation 8,400 1,340 5,540 1,880 8,760 Data sources: 2014 American Community Survey (ACS) 5-Year Summary File; 2014 ACS 5-Year Public Use Microdata Sample (PUMS); CTPS GIS Analysis; 2010–11 Massachusetts Travel Survey; MBTA pre-pilot AFC data. Note: Pass sales have been rounded to the nearest 100. Additional trips, by service period, have been rounded to the nearest 10 trips. Totals may not sum due to rounding. (1) The total annual pass sales have been adjusted to account for Youth Pass sales to 19-to-21-year-old youth in GED/HiSET programs that are not accounted for in the estimated range of participants
Tables 5-11 and 5-12 show that, at the 15 percent participation level, CTPS estimates
that Youth Pass program participants would add 160 trips to the MBTA local bus and
rapid transit system during the AM and PM peak periods during summer months. During
school months, they would add approximately 200 trips during the AM peak on a given
weekday, and approximately 300 trips during the PM peak.
Many Towns Scenario: Net Additional Weekday Trips
Tables 5-13 and 5-14 summarize the ranges of net additional weekday trips, by service
period that may be made on the MBTA local bus and rapid transit system for the Many
Towns Youth Pass program scenario. Table 5-13 provides this information for a
summer month, while Table 5-14 provides this information for a school-year month.
CTPS created these ranges by varying the percent of each market category that would
be likely to participate in a Youth Pass program. Values were calculated for each market
category at 10 percent and at 100 percent. These ranges are shown for each individual
market category, and then in total. The columns for the peak periods are highlighted in
each table.

Youth Pass FINAL Report 060616 Page 69 of 93
TABLE 5-13
Many Towns Scenario: Ranges of Additional Weekday Trips per Service Period
(Summer Month)
Market Category
Range of
Youth Passes
Sold, Per Month1
Additional AM Peak
Period Trips
Additional Non-Peak
Period Trips
Additional PM Peak
Period Trips
Additional Trips (All Periods)
Age 12–
18, Not-Enrolled-in-School
100 – 1,300 20 – 160 90 – 850 20 – 150 120 – 1,160
Age 12–
18, In-College
100 – 1,300 20 – 170 90 – 170 20 – 160 120 – 1200
Age 19–
21, Low-Income, Not-Enrolled-in-School
300 – 3,500 40 – 430
230 – 2,340 50 – 450 320 – 3,220
Age 19–
21, Low-Income, In-College
600 – 6,100 80 – 760
410 – 4,110 80 – 790 570 – 5,650
Total 1,200 – 12,200
150 – 1,510 820 – 8,180
150 – 1,540 1,120 – 11,230
Data sources: 2014 American Community Survey (ACS) 5-Year Summary File; 2014 ACS 5-Year Public Use Microdata Sample (PUMS); CTPS GIS Analysis; 2010–11 Massachusetts Travel Survey; MBTA pre-pilot AFC data. Note: Pass sales have been rounded to the nearest 100. Additional trips, by service period, have been rounded to the nearest 10 trips. Totals may not sum due to rounding. The total annual pass sales have been adjusted to account for Youth Pass sales to 19-to-21-year-old youth in GED/HiSET programs that are not accounted for in the estimated range of participants.

Youth Pass FINAL Report 060616 Page 70 of 93
TABLE 5-14
Many Towns Scenario: Ranges of Additional Weekday Trips per Service Period
(School Month)
Market Category
Range of
Youth Passes
Sold, Per Month1
Additional AM Peak
Period Trips
Additional Non-Peak
Period Trips
Additional PM Peak
Period Trips
Additional Trips (All Periods)
Age 12–
18, Not-Enrolled-in-School
100 – 1,300 20 – 200 80 – 820 30 – 290
130 – 1,310
Age 12–
18, In-College
100 – 1,300 20 – 210 90 – 850 30 – 300
140 – 1,360
Age 19–
21, Low-Income, Not-Enrolled-in-School
300 – 3,500 60 - 560
230 – 2,330 80 – 790
370 – 3,680
Age 19–
21, Low-Income, In-College
600 – 6,100 100 – 990
410 – 4,090 140 – 1,380
650 – 6,450
Total 1,200 – 12,200
200 – 1,960 810 – 8,070
280 – 2,760 1,280 – 12,790
Data sources: 2014 American Community Survey (ACS) 5-Year Summary File; 2014 ACS 5-Year Public Use Microdata Sample (PUMS); CTPS GIS Analysis; 2010–-11 Massachusetts Travel Survey; MBTA pre-pilot AFC data. Note: Pass sales have been rounded to the nearest 100. Additional trips, by service period, have been rounded to the nearest 10 trips. Totals may not sum due to rounding. (1) The total annual pass sales have been adjusted to account for Youth Pass sales to 19-to-21-year-old youth in GED/HiSET programs that are not accounted for in the estimated range of participants.
These tables show than under the Many Towns scenario, the additional trips that may
be made during the AM peak period range from around 150 trips (at the 10 percent
participation level) to around 2,000 trips (at the 100 percent participation level),
depending on the month type. During the PM peak period, estimated additional trips
range from around 150 trips (at the 10 percent participation level) to nearly 2,800 trips
(at the 100 percent participation level), depending on the month type. As with the Few
Towns scenario, these estimates show that participants would likely make more peak-

Youth Pass FINAL Report 060616 Page 71 of 93
period trips during school months compared to summer months. Overall, additional
weekday trips, regardless of service period, range from 1,120 (at the 10 percent
participation level) to approximately 12,800 (at the 100 percent participation level). The
Many Towns scenario reflects about a 45 percent increase in average weekday trips
compared to the Few Towns scenario. However, this growth would likely be dispersed
throughout the bus and rapid transit networks and is still small compared to total
weekday boardings for the local bus and rapid transit system as a whole.
Tables 5-15 and 5-16 show the estimated additional weekday trips for all categories
combined at various participation levels. CTPS has highlighted a 15 percent
participation row in the table to indicate the expected level of participation in a future
Youth Pass program, based on pilot conditions.
TABLE 5-15
Many Towns Scenario: Estimated Additional Weekday Trips at Various
Participation Levels (Summer Month)
Market (All Categories) Participation Level
Estimated Youth
Passes Sold, Per
Month1
Additional AM Peak
Period Trips
Additional Non-Peak
Period Trips
Additional PM Peak
Period Trips
Additional Trips (All Periods)
10% participation 1,200 150 820 150 1,120
15% participation 1,800 230 1,230 230 1,680
20% participation 2,400 300 1,630 310 2,250
30% participation 3,700 450 2,450 460 3,370
100% participation 12,200 1,510 8,180 1,540 11,230 Data sources: 2014 American Community Survey (ACS) 5-Year Summary File; 2014 ACS 5-Year Public Use Microdata Sample (PUMS); CTPS GIS Analysis; 2010–11 Massachusetts Travel Survey; MBTA pre-pilot AFC data. Note: Pass sales have been rounded to the nearest 100. Additional trips, by service period, have been rounded to the nearest 10 trips. Totals may not sum due to rounding. (1) The total annual pass sales have been adjusted to account for Youth Pass sales to 19-to-21-year-old youth in GED/HiSET programs that are not accounted for in the estimated range of participants

Youth Pass FINAL Report 060616 Page 72 of 93
TABLE 5-16
Many Towns Scenario: Estimated Additional Weekday Trips at Various
Participation Levels (School Month)
Market (All Categories) Participation Level
Estimated
Youth Passes
Sold, Per Year1
Additional AM Peak
Period Trips
Additional Non-Peak
Period Trips
Additional PM Peak
Period Trips
Additional Trips (All Periods)
10% participation 1,200 200 810 280 1,280
15% participation 1,800 290 1,210 410 1,920
20% participation 2,400 390 1,610 550 2,560
30% participation 3,700 590 2,420 830 3,840
100% participation 12,200 1,960 8,070 2,750 12,780 Data sources: 2014 American Community Survey (ACS) 5-Year Summary File; 2014 ACS 5-Year Public Use Microdata Sample (PUMS); CTPS GIS Analysis; 2010–11 Massachusetts Travel Survey; MBTA pre-pilot AFC data. Note: Pass sales have been rounded to the nearest 100. Additional trips, by service period, have been rounded to the nearest 10 trips. Totals may not sum due to rounding. (1) The total annual pass sales have been adjusted to account for Youth Pass sales to 19-to-21-year-old youth in GED/HiSET programs that are not accounted for in the estimated range of participants
Tables 5-15 and 5-16 show that at the 15 percent participation level, CTPS estimates
that Youth Pass program participants would add 230 trips to the MBTA local bus and
rapid transit system during the AM and PM peak periods during summer months. During
school months, they would make approximately 290 trips during the AM peak on a given
weekday, and approximately 410 trips during the PM peak.
5.6 Conclusions
The Youth Pass Pilot has increased transit access for primarily low-income and minority
youth, allowing them access to recreational opportunities, work, school, and medical
appointments they would not have had otherwise. The collaborative partnership with
municipalities has yielded an auditable reduced-fare program with limited administrative
impact for the MBTA. A key finding of the pilot is that 73 percent of the applicants were
eligible for an existing MBTA reduced-fare pass, but they are unable to access it due to
their school not offering it or the limitations on summer months. These problems were
addressed when the MBTA Fiscal and Management Control Board voted to sell the
Student Pass on the fare vending machines and make it available year round.

Youth Pass FINAL Report 060616 Page 73 of 93
This decision leaves youth 12–18 years old and not in middle or high school and 19–21
year olds who meet the means-tested eligibility criteria without access to the reduced
fare when the Youth Pass pilot ends. CTPS and the MBTA used data from the pilot to
calculate the cost in lost fare revenue from extending the pilot to these groups and the
impact on service from the additional trips they would make. The estimates for the full
program range widely based on assumptions of municipal opt in and participation rates
by eligible youth.
Using an estimate of 15 percent market participation, the cost of the program in annual
lost fare revenue ranges from $406,000 if the four existing partner cities continue to
participate to $593,000 if all 17 MBTA core municipalities join the program. The
estimated cost at a more conservative estimate of 30 percent participation would range
from $812,000 to $1,186,000. The impact on service of the additional trips is expected
to be minimal.

Youth Pass FINAL Report 060616 Page 74 of 93
Appendices A. DATA SOURCES
Youth Pass Application, Enrollment Survey, and Monthly Survey Data
Youth who were interested in participating in the pilot program filled out an online
application, as mentioned in Chapter 1. They were asked to identify their date of birth,
home zip code, age group (13 to 18 years old or 19 to 21 years old), race and ethnicity,
household income, and whether they were enrolled in middle or high-school.15
Applicants who were 19 to 21 years old were asked to identify whether they were
enrolled in a jobs program, a benefit program (such as the Special Supplemental
Nutrition program for Women, Infants, and Children (WIC) or MassHealth), or a General
Education Development (GED) or other adult education program; municipal partners
used this information to help municipalities determine whether these applicants met
means-testing requirements. The application survey also included questions about the
number of trips applicants take on the MBTA bus or rapid transit system during the
school year and summer, as well as questions about how applicants currently pay
MBTA fares.
All applicants, regardless of whether they were ultimately enrolled in the program, were
issued a participant number. The MBTA and CTPS used these participant numbers to
identify automated fare collection (AFC) system transactions made by specific
individuals (without needing their CharlieCard serial numbers or their personal
information), and to link this data with the participants age, household income, school-
and program-enrollment, and other information included in the application survey. This
information enabled the MBTA and CTPS to make comparisons between sub-groups
within the overall Youth Pass population, such as between students and youth not
enrolled in school.
Youth who were accepted into the Youth Pass pilot program were asked to complete
additional surveys, both during the enrollment process and on a monthly basis
throughout the pilot. The enrollment survey requested that participants provide
information about the purposes of the trips they make on the transit system and the
other modes of transportation they regularly use. It also asked participants to indicate
their level of satisfaction with various aspects of MBTA service, such as safety, cost,
reliability, and interactions with MBTA staff. The monthly surveys included questions
about the number and purposes of the trips participants took on the transit system the
day before they received the survey, as well as questions about whether and how they
might have made those trips if they did not have access to a Youth Pass.
15 While youth younger than 13 were permitted to sign up for the program, data they submitted online
was not included in the analyses in this report. CTPS identified whether applicants were younger than
13 by calculating their age using the date of birth they reported on the online application form.

Youth Pass FINAL Report 060616 Page 75 of 93
Interviews and Audit of Partner Agencies
The MBTA conducted an audit of each partner agency to ensure they were following the
procedures for the program as detailed in the MOU and Policy Handbook. The MBTA
also asked staff at the partner agencies a series of qualitative questions about the
administration of the program.
MBTA Data
Automated-Fare-Collection-System Data (AFC Data)
The MBTA’s automated fare collection (AFC) system records information about the
date, time, and location at which a rider made a transaction at a fare gate or fare box,
along with information about the price of the trip and the fare product that was used to
pay for the trip. The MBTA and CTPS used two sets of AFC data from the Youth Pass
Pilot program:
• Transaction data generated by the fare cards enrollees used prior to the
beginning of the pilot (“pre-pilot data”)
• Transaction data generated by Youth Passes
Pre-Pilot AFC Data
When Youth Pass applicants enrolled in the pilot program, municipal partners provided
them with a blank CharlieCard and requested that they sign a release allowing MBTA
staff to access AFC data associated with the card. This allowed MBTA staff to track a
participant’s interactions with the AFC system for 30 days prior to that participant
receiving and using a Youth Pass. This information enabled the MBTA and CTPS to
analyze whether participants’ travel behavior changed after they obtained a Youth Pass.
To preserve anonymity, the MBTA used the Youth Pass participant numbers generated
during the application process to identify individual participants, while the participant’s
personal information (name, email address, etc.) was kept confidential.
Youth Pass AFC Data
After they provided 30 days of pre-pilot data, Youth Pass participants could return to
municipal partner offices to purchase monthly or 7-day youth passes. These passes
would be loaded onto their CharlieCard, which the MBTA could track through the AFC
system. The Youth Pass AFC data set included the same general content as the pre-
pilot AFC data set, and included participant numbers that could be linked to Youth Pass
applications and surveys.
Retail Sales Terminal (RST) Data
The MBTA and CTPS also used transaction data from the retail sales terminals (RSTs)
distributed to the four participating municipalities. This Retail Sales Terminal (RST) data
identifies the date and time of pass purchases, the type and price of the pass that was
purchased, and the serial number associated with the card or ticket on which the pass

Youth Pass FINAL Report 060616 Page 76 of 93
was loaded. Using this serial number, CTPS could determine how many and what type
of Youth Passes (monthly or 7-day) individuals purchased over time. Each RST also
had a unique identifier, which made it possible to determine the number of passes sold
in individual cities. Unlike the AFC data, however, it was not possible to link RST
transaction data to information about the person who purchased the pass. This
information was used to check findings from the AFC data, and to estimate whether
there are Youth Pass pilot participants that may not be reflected in the AFC data.
Scenario Data Sets
2014 American Community Survey 5-Year Summary File
The American Community Survey (ACS) is an ongoing survey that provides data every
year, and covers a broad range of topics about social, economic, demographic, and
housing characteristics of the U.S. population.16 CTPS used the 2014 ACS 5-year
summary file to obtain total population and age information for the municipalities
included in each of the scenarios. The 5-year estimates from the ACS are referred to as
“period” estimates, which represent data collected over a period of time. The advantage
of these multi-year estimates is the increased statistical reliability of the data for less-
populated areas and small population subgroups.
2014 ACS 5-Year Public Use Microdata Sample (PUMS) Data
Public Use Microdata Sample (PUMS) data contain a sample of actual responses to the
ACS, as opposed to data that has already been tabulated for specific geographic
areas.17 The geography associated with Public Use Microdata (PUM) is the Public Use
Microdata Area (PUMA). A PUMA is a relatively large geographic area; each PUMA
contains at least 100,000 residents. While the geography is large and imprecise, the
Census Bureau provides extremely detailed American Community Survey (ACS) data
that is not available for smaller geographies. A PUMA may contain more than one
municipality, and a municipality can contain more than one PUMA. For example, PUMA
2700 encompasses Arlington, Belmont, Lexington, Watertown, and Waltham; Boston
includes PUMAs 3301–3305.
CTPS used 2014 5-Year PUMS data to estimate Youth Pass eligible-populations in
relevant municipalities based on school-enrollment and age characteristics, and based
on the number of youth in low-income households.
16 Powell, Logan T. “American Community Survey 5-Year Data (2005-2009 to 2010-2014).” 2016.
http://www.census.gov/data/developers/data-sets/acs-survey-5-year-data.html. Accessed May 31,
2016. 17 Source 1: U.S. Census Bureau, American Community Survey Office. American Community Survey
2010-2014 ACS 5-Year PUMS files Readme. 2016. http://www2.census.gov/programs-
surveys/acs/tech_docs/pums/ACS2010_2014_PUMS_README.pdf. Accessed May 31, 2016.
Source 2: American Community Survey. “Public Use Microdata Sample (PUMS) Documentation.”
2015. https://www.census.gov/programs-surveys/acs/technical-documentation/pums.html. Accessed
May 31, 2016.

Youth Pass FINAL Report 060616 Page 77 of 93
2010–2011 Massachusetts Travel Survey
CTPS determined the percentage of youths who live within walking distance of transit in
the scenario study areas who might purchase a Youth Pass using the Massachusetts
Travel Survey (MTS). The MTS was a large-scale, statewide survey that collected data
on people’s travel patterns. The survey was distributed to over 15,000 households
between June 2010 and November 2011. From this survey, CTPS determined the
percentage of the survey’s respondents by age that lived within the study area who
used transit on any of their trips, as they should be more likely to purchase a Youth
Pass than those who did not use transit. The level of geography associated with the
MTS for this analysis is the “ring”—two roughly concentric circles emanating from
downtown Boston extending out to Route 128. CTPS used these rings because of their
relationship to the study areas associated with the scenarios. Ring 0 and the dense
portions of Ring 2 are included because they roughly overlap with people who live near
transit in the 17 municipalities that are included in the two scenarios.
Data on Student Monthly LinkPass (M-7) sales to GED/Non-Middle or High School
Programs
CTPS obtained MBTA data on sales of Student Monthly (M-7) LinkPasses to General
Educational Development (GED) / High School Equivalency (HiSET), alternative
education, and other programs outside of middle and high schools. This data was used
in the scenarios discussed in Chapter 5 to develop estimates of the number of Youth
Passes that may be sold to youth aged 19 to 21 and enrolled in GED/HiSET programs,
who previously received passes through the Student Pass program.
B. SCENARIO EVALUATION METHODOLOGY DETAILS
This section provides some additional detail on the three steps used in the scenario
evaluation process:
• The market of youth eligible and likely to participate in a Youth Pass program
• The estimated net revenues for the MBTA, based on market size and various
levels of program participation
• The estimated impacts to MBTA service, based on market size and various
levels of program participation
Youth Eligible for a Future Youth Pass Program
To estimate the number of youth that would be eligible and likely to participate in a
Youth Pass program under each scenario, CTPS applied a sequence of steps designed
to capture youth that met age, school-enrollment, and income (if applicable) criteria; and
that live near and are likely to use transit. These steps are described below. Several of
the data sources mentioned in each step are described in Appendix A: Data Sources.

Youth Pass FINAL Report 060616 Page 78 of 93
• Step 1: Estimate the population of eligible youths, based on age, income,
and school-enrollment characteristics
Eligible youth include those that are:
o Ages 12 to 18, who are not in middle or high school and are not enrolled
in college
o Ages 12 to 18, who are enrolled in college
o Ages 19 to 21, who live in low-income households and are not enrolled in
middle or high school or in college
o Ages 19 to 21, who live in low-income households and are enrolled in
college
CTPS developed these estimates using data from the 2014 American
Community Survey (ACS), including data from the five-year summary file and
the five-year Public Use Microdata Sample (PUMS). The ACS Summary file
provides information about the overall population in the relevant municipalities,
while the PUMS data provides detailed information about large geographic
areas, called Public Use Microdata Areas (PUMAs). Age, school-enrollment, and
income factors were calculated using the PUMS data and then applied to the
populations of each set of municipalities, depending on the overlap between
these municipalities and particular PUMAs.
Table B-1 shows the population in each school-enrollment category for the Few
Towns and Many Towns scenarios. These estimates only include youth in
households; they exclude youth living in group quarters, such as college
dormitories.

Youth Pass FINAL Report 060616 Page 79 of 93
TABLE B-1
Estimated Youth Population Eligible for a Youth Pass, based on Age,
School Enrollment and Income Characteristics
Category Few Towns
Scenario Many Towns
Scenario
Age 12–18, Not Enrolled in School 2,200 3,700
Age 12–18, In College 2,000 3,900 Age 19–21, Low Income, Not Enrolled in School 4,300 6,600
Age 19–21, Low Income, In College 8,300 11,800
Total 16,800 26,000
Data sources: 2014 American Community Survey (ACS) 5-Year Summary File; 2014 ACS 5-Year Public Use Microdata Sample (PUMS). Note: Values have been rounded to the nearest 100 people. Totals may not sum due to rounding. Population values reflect youth in households only.
The populations of youth in either age group that are enrolled in school vary in
comparison to the population groups shown in Table B-2. In the Few Towns
scenario, the estimated 12-to-18-year-old population enrolled in middle or high
school is about 49,000. The 19-to-21 year old population that is a) enrolled in
middle or high school; and b) living in low income households is about 900
people. Meanwhile, in the Many Towns scenario, the estimated 12-to-18-year-old
population enrolled in middle or high school is approximately 97,900.The 19-to-
21 year old population that is a) enrolled in middle or high school; and b) living in
low income households is about 1,300 people.
• Step 2: Estimate the population of eligible youths who live near transit
CTPS conducted a geographic information systems (GIS) analysis to determine
the portion of the youth population that is eligible for a Youth Pass and lives
within one-quarter mile walking distance of an MBTA bus stop or one-half mile
walking distance of an MBTA rapid transit station. Table B-2 shows these
results.
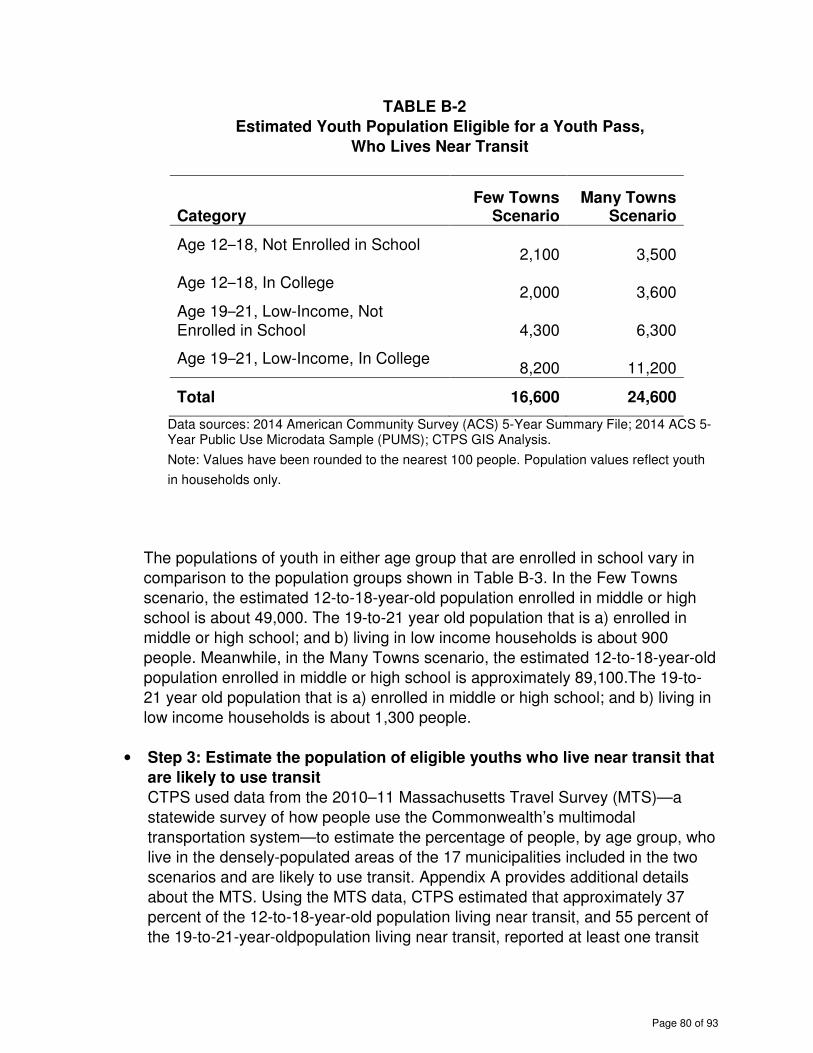
Youth Pass FINAL Report 060616 Page 80 of 93
TABLE B-2
Estimated Youth Population Eligible for a Youth Pass,
Who Lives Near Transit
Category Few Towns
Scenario Many Towns
Scenario
Age 12–18, Not Enrolled in School 2,100 3,500
Age 12–18, In College 2,000 3,600
Age 19–21, Low-Income, Not Enrolled in School 4,300 6,300
Age 19–21, Low-Income, In College 8,200 11,200
Total 16,600 24,600
Data sources: 2014 American Community Survey (ACS) 5-Year Summary File; 2014 ACS 5-Year Public Use Microdata Sample (PUMS); CTPS GIS Analysis.
Note: Values have been rounded to the nearest 100 people. Population values reflect youth
in households only.
The populations of youth in either age group that are enrolled in school vary in
comparison to the population groups shown in Table B-3. In the Few Towns
scenario, the estimated 12-to-18-year-old population enrolled in middle or high
school is about 49,000. The 19-to-21 year old population that is a) enrolled in
middle or high school; and b) living in low income households is about 900
people. Meanwhile, in the Many Towns scenario, the estimated 12-to-18-year-old
population enrolled in middle or high school is approximately 89,100.The 19-to-
21 year old population that is a) enrolled in middle or high school; and b) living in
low income households is about 1,300 people.
• Step 3: Estimate the population of eligible youths who live near transit that
are likely to use transit
CTPS used data from the 2010–11 Massachusetts Travel Survey (MTS)—a
statewide survey of how people use the Commonwealth’s multimodal
transportation system—to estimate the percentage of people, by age group, who
live in the densely-populated areas of the 17 municipalities included in the two
scenarios and are likely to use transit. Appendix A provides additional details
about the MTS. Using the MTS data, CTPS estimated that approximately 37
percent of the 12-to-18-year-old population living near transit, and 55 percent of
the 19-to-21-year-oldpopulation living near transit, reported at least one transit

Youth Pass FINAL Report 060616 Page 81 of 93
trip as part of their survey response.18 As a result, CTPS assumes these shares
of each population segment reflect those who are likely to use transit.
Table B-3 summarizes the results of steps 1 through 3, and shows the estimated
number of people in each scenario that would be eligible, and may wish to
participate, in a future Youth Pass program.
TABLE B-3
Estimated Youth Population Eligible for a Youth Pass,
Who Lives Near Transit and Uses Transit
Category Few Towns
Scenario Many Towns
Scenario
Age 12–18, Not Enrolled in School 800 1,300
Age 12–18, In College 700 1,300 Age 19–21, Low-Income, Not Enrolled in School 2,300 3,500
Age 19–21, Low-Income, In College 4,500 6,100
Total 8,400 12,200
Data sources: 2014 American Community Survey (ACS) 5-Year Summary File; 2014 ACS 5-Year Public Use Microdata Sample (PUMS); CTPS GIS Analysis; 2010-11 Massachusetts Travel Survey. Note: Values have been rounded to the nearest 100 people. Totals may not sum due to rounding. Population values reflect youth in households only.
The populations of youth in either age group that are enrolled in school vary in
comparison to the population groups shown in Table B-4. In the Few Towns
scenario, the estimated 12-to-18-year-old population enrolled in middle or high
school is about 17,800. The 19-to-21 year old population that is a) enrolled in
middle or high school; and b) living in low income households is about 500
people. Meanwhile, in the Many Towns scenario, the estimated 12-to-18-year-old
population enrolled in middle or high school is approximately 32,900.The 19-to-
21 year old population that is a) enrolled in middle or high school; and b) living in
low income households is about 700 people.
18 The estimate of 19-21 year olds who reported at least one transit trip as part of their MTS response
reflects youth in this age group, regardless of income. This estimate does not specifically reflect the
transit usage of 19-21 year olds in low-income households.

Youth Pass FINAL Report 060616 Page 82 of 93
Revenue Estimation Methodology
After estimating the markets of youth who would be eligible and may choose to
participate in a Youth Pass program, CTPS applied several assumptions to calculate
MBTA revenues under each program scenario. These assumptions are shaped by the
MBTA fare-change package described earlier in this chapter, and by the findings from
the pilot program, as described in Chapters 2 and 3.
• Youth Pass Cost: The Youth Pass will cost $30, the same as a Student Monthly
LinkPass, based on the new fares that will go into effect on July 1, 2016.
• Passes on Fare Vending Machines (FVMs). When reviewing the Youth Pass
AFC data, CTPS noticed cases where participants were paying single-ride and
transfer fares for trips for short periods between using their Youth Passes. They
may have been paying for trips this way as a stop-gap measure until they could
return to their municipal partner office to renew their pass. With the availability of
passes on fare vending machines, after enrolling, participating youth will be able
to buy their passes on FVMs; this will eliminate their need to pay for “between-
pass” trips. As a result, youth participating in the program would only pay the
cost of the pass ($30) each month.
• Estimates of Monthly “Foregone” Revenues per person. CTPS used pre-
pilot AFC data to estimate the amount that pilot participants would spend during
either a school year month or summer month if they were not in a Youth Pass
program. These monthly expenditure values, when multiplied by the estimated
number of participants in the program during a given month, provide a way to
estimate the amount of revenue the MBTA would take in if the Youth Pass
program did not exist.
To create these estimates, CTPS examined the trips that pre-pilot participants
made and whether they paid for these trips using particular types of passes or at
particular stored-value rates, and applied fare and pass prices that will be in
effect after July 1, 2016. CTPS then determined monthly expenditure values
using samples of participants who were not enrolled in school and did not use
Student Monthly LinkPasses or Student CharlieCards to pay for their trips. To
reflect the spending of low-income participants who are not enrolled in middle or
high school, CTPS created a separate set of monthly expenditure values using
samples of low-income pre-pilot participants.19
19 Youth pass applicants reported their household income level on the Youth Pass application form.
Youth who identified their household income as less than $42,000 were flagged as being from low-
income households, because at the start of the pilot program, the threshold used to identify low

Youth Pass FINAL Report 060616 Page 83 of 93
Table B-4 shows the estimated monthly foregone revenue amount for each type
of month (school or summer). During a given year, summer months include July
and August, while school year months include September through June.
TABLE B-4
Estimated Foregone Revenue Amounts, by Month
Groups Represented Month Type Foregone Revenue
Amount
12–18, not enrolled in school or enrolled in college School $56.50
12–18, not enrolled in school or enrolled in college Summer $59.00 19–21 and low-income, not enrolled in school or enrolled in college School $56.50 19-21 and low-income, not enrolled in school or enrolled in college Summer $60.50
Data source: CTPS pre-pilot AFC data.
Note: Values have been rounded to the nearest $0.50
• Ongoing Participation. CTPS assumed that youth participating in a future
Youth Pass program would participate all months of the year. In reality,
individual participation in the program would likely fluctuate over time, with youth
entering, remaining in, or exiting the program as they learn about it, participate in
it, and determine whether it continues to meet their needs.
• Adding in passes for GED/HiSET program enrollees that would not
otherwise be eligible for a Youth Pass. Currently, some youth who are not
enrolled in school may still have access to Student Monthly Link Passes,
particularly if they participate in a General Educational Development (GED) /
High School Equivalency (HiSET) testing programs that purchases monthly
income households was 60 percent of the median 2011 household income in the MBTA 175 town
service area, or $41,636. Since the start of the pilot program, a new low income threshold of $44,162
has been established using 2014 American Community Survey (ACS) data. As a result, the income
threshold used to flag Youth Pass participants as low income, and the threshold to identify the low-
income population that may participate in a future Youth Pass program are close, but do not match
exactly.

Youth Pass FINAL Report 060616 Page 84 of 93
passes on behalf of their students. In the future, youth in these programs will not
be able to receive reduced-price passes through the Student Pass program;
MBTA staff anticipates that these individuals would be able to obtain these
passes through a Youth Pass program. Many of these youth are already eligible
for the Youth Pass program based on other criteria, though youth aged 19 to 21
who do not live in low-income households would not be eligible based on the
other criteria. CTPS estimated the number of passes that may currently be sold
to youth in this category through the Student Pass program, and added this
number of passes to estimated Youth Pass sales during school or summer
months.
CTPS obtained MBTA data on sales of Student Monthly LinkPasses to
GED/HiSET, alternative education, and other programs outside of middle and
high schools, and attempted to identify GED/HiSET programs from this list
based on internet research into the programs. CTPS used information on passes sold to these programs during summer 2015 and the 2015–16 academic year,
through May 26. This may underestimate the number of passes that are sold to
these programs, as they are currently able to purchase passes for a given
academic year through June 15.
Of the estimated pass sales to GED/HiSET programs, CTPS assumed that
approximately 50 percent are being sold to youth. This is based on a 1997 study,
using data from the 1995 National Household Education Survey, which estimated
that from a national survey, 16-to-24 year olds made up approximately 47
percent of those enrolled in GED or other high school completion programs.20
This study did not contain information about the income levels of youth
participating in GED/HiSET programs in the United States. In the absence of
available information, CTPS assumed that 60 percent of these passes for
GED/HiSET programs are being sold to youth who are not low-income. This
assumption is based on the share of the youth population in Boston, Chelsea,
Malden, and Somerville (where many of these programs are based), near transit,
that is not enrolled in school and not low-income. Approximately 80 percent of
these passes were expected to go to 19-to-21 year olds, as these make up about
80 percent of the share of youth who are not low-income and not enrolled in
school. Tables B-5 and B-6 show estimates of passes sales during summer and
school months, respectively.
TABLE B-5
20 Kim, K., M.Collins, P. Stowe. Participation in Basic Skills Education: 1994-95. 1997. U.S. Department
of Education National Center for Education Statistics. http://nces.ed.gov/pubs97/97325.pdf. Accessed
June 1, 2016.
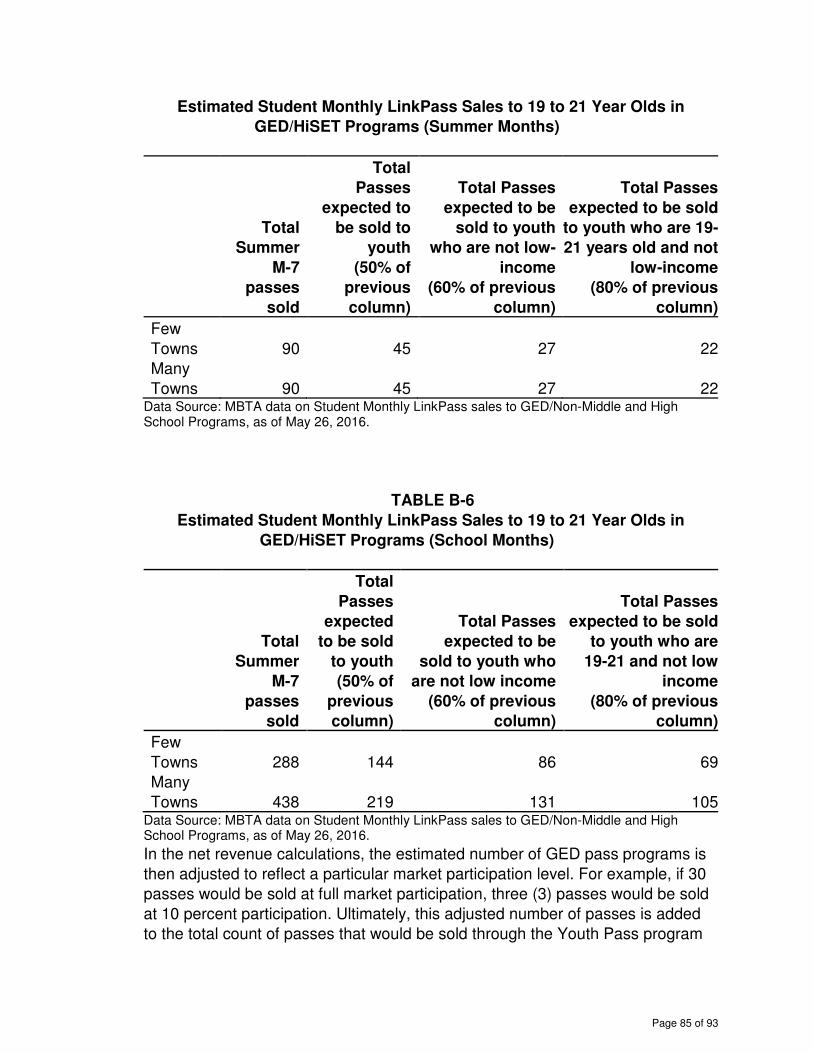
Youth Pass FINAL Report 060616 Page 85 of 93
Estimated Student Monthly LinkPass Sales to 19 to 21 Year Olds in
GED/HiSET Programs (Summer Months)
Total
Summer
M-7
passes
sold
Total
Passes
expected to
be sold to
youth
(50% of
previous
column)
Total Passes
expected to be
sold to youth
who are not low-
income
(60% of previous
column)
Total Passes
expected to be sold
to youth who are 19-
21 years old and not
low-income
(80% of previous
column)
Few
Towns
90 45 27 22
Many
Towns 90 45 27 22Data Source: MBTA data on Student Monthly LinkPass sales to GED/Non-Middle and High School Programs, as of May 26, 2016.
TABLE B-6
Estimated Student Monthly LinkPass Sales to 19 to 21 Year Olds in
GED/HiSET Programs (School Months)
Total
Summer
M-7
passes
sold
Total
Passes
expected
to be sold
to youth
(50% of
previous
column)
Total Passes
expected to be
sold to youth who
are not low income
(60% of previous
column)
Total Passes
expected to be sold
to youth who are
19-21 and not low
income
(80% of previous
column)
Few
Towns
288 144 86 69
Many
Towns 438 219 131 105Data Source: MBTA data on Student Monthly LinkPass sales to GED/Non-Middle and High School Programs, as of May 26, 2016.
In the net revenue calculations, the estimated number of GED pass programs is
then adjusted to reflect a particular market participation level. For example, if 30
passes would be sold at full market participation, three (3) passes would be sold
at 10 percent participation. Ultimately, this adjusted number of passes is added
to the total count of passes that would be sold through the Youth Pass program

Youth Pass FINAL Report 060616 Page 86 of 93
during either the summer or school year. CTPS has made the assumptions in the
absence of more detailed data about the number and characteristics of people
participating in GED/HiSET programs in the MBTA service area, and
recommends that more detailed data on these programs be collected if the
MBTA chooses to implement a permanent Youth Pass program.
Chapter 5 also provides information on estimated net revenues under the Few Towns
and Many Towns Youth Pass program scenarios. Tables B-7 through B-10 provide
detail on net revenues specific to each of the four market categories in the Few Towns
scenario presented in Chapter 5.
TABLE B-7
Few Towns Scenario: Estimated Net Program Revenues (12 to 18 Years Old, Not-
in-School Category) at Various Participation Levels
Market (All Categories) Participation Level
Estimated
Youth Passes Sold,
Per Year1
Total Annual
Youth Pass Program
Revenues
Total
Annual Foregone Revenues
Total
Net Program
Revenues
10% participation 1,000 $29,000 $54,000 ($26,000)
15% participation 1,400 $43,000 $81,000 ($38,000)
20% participation 1,900 $57,000 $108,000 ($51,000)
30% participation 2,900 $86,000 $162,000 ($77,000)
100% participation 9,500 $285,000 $540,000 ($255,000) Data sources: 2014 American Community Survey (ACS) 5-Year Summary File; 2014 ACS 5-Year Public Use Microdata Sample (PUMS); CTPS GIS Analysis; 2010–11 Massachusetts Travel Survey; CTPS pre-pilot AFC data. Note: Pass sales have been rounded to the nearest 100. Dollar values have been rounded to the nearest thousand. Totals may not sum due to rounding. (1) The total annual pass sales have been adjusted to account for Youth Pass sales to 19-to-21-year-old
youth in GED/HiSET programs.

Youth Pass FINAL Report 060616 Page 87 of 93
TABLE B-8
Few Towns Scenario: Estimated Net Program Revenues (19 to 21 Years Old, Low-
Income, Not-in-School Category) at Various Participation Levels
Market (All Categories) Participation Level
Estimated Youth
Passes Sold, Per Year1
Total Annual Youth Pass
Program Revenues
Total Annual
Foregone Revenues
Total Net
Program Revenues
10% participation 2,800 $84,000 $160,000 ($76,000)
15% participation 4,200 $126,000 $240,000 ($114,000)
20% participation 5,600 $169,000 $321,000 ($152,000)
30% participation 8,400 $253,000 $481,000 ($228,000)
100% participation 28,100 $843,000 $1,603,000 ($760,000) Data sources: 2014 American Community Survey (ACS) 5-Year Summary File; 2014 ACS 5-Year Public Use Microdata Sample (PUMS); CTPS GIS Analysis; 2010–11 Massachusetts Travel Survey; CTPS pre-pilot AFC data. Note: Pass sales have been rounded to the nearest 100. Dollar values have been rounded to the nearest thousand. Totals may not sum due to rounding. (1) The total annual pass sales have been adjusted to account for Youth Pass sales to 19-to-21-year-old
youth in GED/HiSET programs.
TABLE B-9
Few Towns Scenario: Estimated Net Program Revenues (12 to 18 Years Old, In-
College Category) at Various Participation Levels
Market (All Categories) Participation Level
Estimated Youth
Passes Sold, Per Year1
Total Annual Youth Pass
Program Revenues
Total Annual
Foregone Revenues
Total Net
Program Revenues
10% participation 860 $26,000 $48,000 ($23,000)
15% participation 1,300 $39,000 $72,000 ($35,000)
20% participation 1,700 $52,000 $96,000 ($46,000)
30% participation 2,600 $78,000 $145,000 ($70,000)
100% participation 8,600 $259,000 $482,000 ($232,000) Data sources: 2014 American Community Survey (ACS) 5-Year Summary File; 2014 ACS 5-Year Public Use Microdata Sample (PUMS); CTPS GIS Analysis; 2010–11 Massachusetts Travel Survey; CTPS pre-pilot AFC data. Note: Pass sales have been rounded to the nearest 100. Dollar values have been rounded to the nearest thousand. Totals may not sum due to rounding. (1) The total annual pass sales have been adjusted to account for Youth Pass sales to 19-to-21-year-old
youth in GED/HiSET programs.

Youth Pass FINAL Report 060616 Page 88 of 93
TABLE B-10
Few Towns Scenario: Estimated Net Program Revenues (19 to 21 Years Old, Low-
Income, In-College Category) at Various Participation Levels
Market (All Categories) Participation Level
Estimated Youth
Passes Sold, Per
Year1
Total Annual Youth Pass
Program Revenues
Total Annual
Foregone Revenues
Total
Net Program Revenues
10% participation 5,400 $162,000 $308,000 ($146,000)
15% participation 8,100 $243,000 $462,000 ($219,000)
20% participation 10,800 $324,000 $616,000 ($292,000)
30% participation 16,200 $486,000 $925,000 ($438,000)
100% participation 54,000 $1,621,000 $3,082,000 ($1,461,000) Data sources: 2014 American Community Survey (ACS) 5-Year Summary File; 2014 ACS 5-Year Public Use Microdata Sample (PUMS); CTPS GIS Analysis; 2010–11 Massachusetts Travel Survey; CTPS pre-pilot AFC data. Note: Pass sales have been rounded to the nearest 100. Dollar values have been rounded to the nearest thousand. Totals may not sum due to rounding. (1) The total annual pass sales have been adjusted to account for Youth Pass sales to 19-to-21-year-old
youth in GED/HiSET programs.
Tables B-11 through B-14 provide detail on net revenues specific to each of the four
market categories in the Many Towns scenario presented in Chapter 5.
TABLE B-11
Many Towns Scenario: Estimated Net Program Revenues (12 to 18 Years Old,
Not-in-School Category) at Various Participation Levels
Market (All Categories) Participation Level
Estimated Youth
Passes Sold, Per Year1
Total Annual Youth Pass
Program Revenues
Total Annual
Foregone Revenues
Total Net
Program Revenues
10% participation 1,500 $46,000 $88,000 ($41,000)
15% participation 2,300 $70,000 $132,000 ($62,000)
20% participation 3,100 $93,000 $176,000 ($83,000)
30% participation 4,600 $139,000 $264,000 ($124,000)
100% participation 15,500 $464,000 $878,000 ($415,000) Data sources: 2014 American Community Survey (ACS) 5-Year Summary File; 2014 ACS 5-Year Public Use Microdata Sample (PUMS); CTPS GIS Analysis; 2010–11 Massachusetts Travel Survey; CTPS pre-pilot AFC data. Note: Pass sales have been rounded to the nearest 100. Dollar values have been rounded to the nearest thousand. Totals may not sum due to rounding.

Youth Pass FINAL Report 060616 Page 89 of 93
(1) The total annual pass sales have been adjusted to account for Youth Pass sales to 19-to-21-year-old youth in GED/HiSET programs.
TABLE B-12
Many Towns Scenario: Estimated Net Program Revenues (19 to 21 Years Old,
Low-Income, Not-in-School Category) at Various Participation Levels
Market (All Categories) Participation Level
Estimated Youth
Passes Sold, Per
Year1
Total Annual Youth Pass
Program Revenues
Total Annual
Foregone Revenues
Total
Net Program Revenues
10% participation 4,200 $125,000 $238,000 ($113,000)
15% participation 6,300 $188,000 $357,000 ($169,000)
20% participation 8,400 $251,000 $476,000 ($226,000)
30% participation 12,500 $376,000 $715,000 ($339,000)
100% participation 41,800 $1,253,000 $2,382,000 ($1,129,000) Data sources: 2014 American Community Survey (ACS) 5-Year Summary File; 2014 ACS 5-Year Public Use Microdata Sample (PUMS); CTPS GIS Analysis; 2010–11 Massachusetts Travel Survey; CTPS pre-pilot AFC data. Note: Pass sales have been rounded to the nearest 100. Dollar values have been rounded to the nearest thousand. Totals may not sum due to rounding. (1) The total annual pass sales have been adjusted to account for Youth Pass sales to 19-to-21-year-old
youth in GED/HiSET programs.
TABLE B-13
Many Towns Scenario: Estimated Net Program Revenues (12 to 18 Years Old, In-
College Category) at Various Participation Levels
Market (All Categories) Participation Level
Estimated Youth
Passes Sold, Per Year1
Total Annual Youth Pass
Program Revenues
Total Annual
Foregone Revenues
Total Net
Program Revenues
10% participation 1,600 $48,000 $91,000 ($43,000)
15% participation 2,400 $72,000 $137,000 ($65,000)
20% participation 3,200 $96,000 $182,000 ($86,000)
30% participation 4,800 $144,000 $273,000 ($129,000)
100% participation 16,000 $481,000 $911,000 ($431,000) Data sources: 2014 American Community Survey (ACS) 5-Year Summary File; 2014 ACS 5-Year Public Use Microdata Sample (PUMS); CTPS GIS Analysis; 2010–11 Massachusetts Travel Survey; CTPS pre-pilot AFC data.

Youth Pass FINAL Report 060616 Page 90 of 93
Note: Pass sales have been rounded to the nearest 100. Dollar values have been rounded to the nearest thousand. Totals may not sum due to rounding. (1) The total annual pass sales have been adjusted to account for Youth Pass sales to 19-to-21-year-
old youth in GED/HiSET programs. TABLE B-14
Many Towns Scenario: Estimated Net Program Revenues (19 to 21 Years Old,
Low-Income, In-College Category) at Various Participation Levels
Market (All Categories) Participation Level
Estimated Youth
Passes Sold, Per
Year1
Total Annual Youth Pass
Program Revenues
Total Annual
Foregone Revenues
Total
Net Program Revenues
10% participation 7,300 $220,000 $418,000 ($198,000)
15% participation 11,000 $330,000 $627,000 ($297,000)
20% participation 14,700 $440,000 $836,000 ($396,000)
30% participation 22,000 $659,000 $1,253,000 ($594,000)
100% participation 73,300 $2,198,000 $4,178,000 ($1,980,000) Data sources: 2014 American Community Survey (ACS) 5-Year Summary File; 2014 ACS 5-Year Public Use Microdata Sample (PUMS); CTPS GIS Analysis; 2010–11 Massachusetts Travel Survey; CTPS pre-pilot AFC data. Note: Pass sales have been rounded to the nearest 100. Dollar values have been rounded to the nearest thousand. Totals may not sum due to rounding. (1) The total annual pass sales have been adjusted to account for Youth Pass sales to 19-to-21-year-
old youth in GED/HiSET programs. Service Impacts Estimation Methodology
Chapter 5 describes the process CTPS followed to estimate the additional weekday
trips that might be made under the Few Towns and Many Towns Youth Pass program
scenarios, along with the results of that process. This appendix provides some
additional detail on several assumptions that CTPS applied to make these calculations,
particularly those related to estimates of weekday trips per month that were drawn from
the pre-pilot and Youth Pass AFC data.
• Estimates of Weekday Trips per Month (Pre-Pilot Data). CTPS used pre-pilot
AFC data to estimate the number of unlinked weekday trips that youth made per
month before they received a Youth Pass. These values are based on samples
of pre-pilot participants, which varied depending on:
o Whether the participants were enrolled in school
o Whether the participants lived in a low-income household

Youth Pass FINAL Report 060616 Page 91 of 93
o Whether they provided their 30-days of pre-pilot data during school
months (late May through June 2015, and September 2015 through
March 2016), or during summer months (July and August 2015)
CTPS then determined an average number of unlinked trips per month for each
sample, excluding any participants who used Student Monthly LinkPasses or
Student CharlieCards to pay for their trips. To reflect the spending of low-income
participants who are not enrolled in middle or high school, CTPS created a
separate set of average monthly trip values using samples of low-income pre-
pilot participants.21
AFC data for taps against MBTA fare gates or fare boxes includes a time stamp,
which makes it possible to determine the day of the week and the time of day a
trip was made. CTPS used this information to determine whether trips made on
weekdays were made during the AM peak period (between 7:00 AM and 8:59
AM), the PM peak period (between 4:00 PM and 6:30 PM), or during non-peak
times. In addition to calculating an average number of weekday trips pre-pilot
participants made per month, CTPS could also estimate the average number of
weekday trips participants made during each service period, as shown in Table
B-15.
TABLE B-15
Pre-Pilot Data: Estimated Average Weekday Trips per Month, by Service Period
Groups Represented Month Type
AM Peak Period
Non-Peak
Period
PM Peak
Period Total
12–18, not-enrolled-in-school or enrolled-in-college
School 4 21 6 31
12–18, not-enrolled-in-school or enrolled-in-college
Summer 5 22 9 36
19–21 and low-income, not-enrolled-in-school or enrolled-in-college
School 5 21 6 32
21 For more information about how these participants were identified, see the section in Appendix B
titled “Revenue Estimation Methodology.”

Youth Pass FINAL Report 060616 Page 92 of 93
19–21 and low-income, not-enrolled-in-school or enrolled-in-college
Summer 5 22 9 36
Data source: MBTA pre-pilot AFC data.
• Estimates of Weekday Trips per Month (Youth Pass Data). CTPS also used
AFC data from Youth Pass participants to estimate the number of unlinked
weekday trips that youth made per month with a Youth Pass. These values were
calculated using a process similar to the one used to develop the pre-pilot
values. CTPS created samples of Youth Pass participants based on whether or
not they were enrolled in school, and whether or not they lived in low-income
households. Only participants who used monthly Youth Passes were included in
these samples, because only the monthly Youth Pass will be offered under these
scenarios. CTPS estimated average weekday trips per month (by service period
and overall) using per-person averages calculated over school months, and over
summer months. These values are shown in Table B-16.
TABLE B-16
Youth Pass Data: Average Estimated Weekday Trips per Month, by Service
Period
Groups Represented Month Type
AM Peak Period
Non-Peak
Period
PM Peak
Period Total
12–18, not-enrolled-in-school or enrolled-in-college
School 8 34 10 53
12–18, not-enrolled-in-school or enrolled-in-college
Summer 7 36 11 55
19–21 and low-income, not-enrolled-in-school or enrolled-in-college
School 8 35 10 53
19–21 and low-income, not-enrolled-in-school or enrolled-in-college
Summer 8 36 11 55

Youth Pass FINAL Report 060616 Page 93 of 93
Data source: MBTA Youth Pass pilot AFC data
Please see Chapter 5 for details on how CTPS applied these values to estimate the
number of additional weekday trips, by service period, under the two Youth Pass
program scenarios.