mcarthur river mine overburden management project · overburden management project ... a failure...
TRANSCRIPT

Appendix FFailure Modes and
Effects Analysis Report
FMcArthur River Mine
Overburden Management Project
Draft Environmental Impact Statement

McArthur River Mine – May 2016 Failure Modes
and Effects Analysis Workshop Summary
Report 1 August 2016

McArthur River Mine – May 2016 Failure Modes and Effects Analysis Workshop Summary Report
750/36
August 2016
Prepared for:
Glencore
McArthur River Mine Environmental Planning
Zinc Assets Australia
Prepared by:
O'Kane Consultants Pty Ltd
193D Given Terrace
Paddington QLD 4064
Australia
Telephone: (07) 3367 8063
Facsimile: (07) 3367 8052
Web: www.okc-sk.com
Rev. # Rev. Date Author Reviewer PM Sign-off
1 May 22, 2016 LT MOK LT
2 May 29, 2016 LT MOK LT
3 June 6, 2016 LT MOK LT
4 June 29, 2016 MOK LT PG
5 July 10, 2016 MOK LT PG
Final August 31, 2016 MOK MOK PG

DISCLAIMER
This document has been provided by O'Kane Consultants Pty Ltd (OKC) subject to the following limitations: 1. This document has been prepared for the client and for the particular purpose outlined in the
OKC proposal and no responsibility is accepted for the use of this document, in whole or in part, in any other contexts or for any other purposes.
2. The scope and the period of operation of the OKC services are described in the OKC proposal and are subject to certain restrictions and limitations set out in the OKC proposal.
3. OKC did not perform a complete assessment of all possible conditions or circumstances that may exist at the site referred to in the OKC proposal. If a service is not expressly indicated, the client should not assume it has been provided. If a matter is not addressed, the client should not assume that any determination has been made by OKC in regards to that matter.
4. Variations in conditions may occur between investigatory locations, and there may be special conditions pertaining to the site which have not been revealed by the investigation, or information provided by the client or a third party and which have not therefore been taken into account in this document..
5. The passage of time will affect the information and assessment provided in this document. The opinions expressed in this document are based on information that existed at the time of the production of this document.
6. The investigations undertaken and services provided by OKC allowed OKC to form no more than an opinion of the actual conditions of the site at the time the site referred to in the OKC proposal was visited and the proposal developed and those investigations and services cannot be used to assess the effect of any subsequent changes in the conditions at the site, or its surroundings, or any subsequent changes in the relevant laws or regulations.
7. The assessments made in this document are based on the conditions indicated from published sources and the investigation and information provided. No warranty is included, either express or implied that the actual conditions will conform exactly to the assessments contained in this document.
8. Where data supplied by the client or third parties, including previous site investigation data, has been used, it has been assumed that the information is correct. No responsibility is accepted by OKC for the completeness or accuracy of the data supplied by the client or third parties.
9. This document is provided solely for use by the client and must be considered to be confidential information. The client agrees not to use, copy, disclose reproduce or make public this document, its contents, or the OKC proposal without the written consent of OKC.
10. OKC accepts no responsibility whatsoever to any party, other than the client, for the use of this document or the information or assessments contained in this document. Any use which a third party makes of this document or the information or assessments contained therein, or any reliance on or decisions made based on this document or the information or assessments contained therein, is the responsibility of that third party.
11. No section or element of this document may be removed from this document, extracted, reproduced, electronically stored or transmitted in any form without the prior written permission of OKC.

Glencore McArthur River Mine - Failure Modes and Effects Analysis Workshop Summary Report iv
O’Kane Consultants 1 August 2016 750/36
EXECUTIVE SUMMARY
A Failure Modes and Effects Analysis (FMEA) workshop was conducted at the Glencore Brisbane
office from May 16 to 20, 2016 to support closure planning and the Environmental Impact
Statement (EIS) currently in progress for McArthur River Mining (MRM). The May 2016 FMEA
workshop builds off of a March 2016 Conceptual Model (CM) workshop, as well as a July 2015
FMEA workshop.
The FMEA approach is an engineering tool, which can be used to inform and support the design
process at any stage of a project. As information is developed during different stages of a project,
failure modes and effects can be re-visited and a reduction in risk, as well as residual risk and/or
more cost effective means to manage the risk can be clearly and transparently communicated.
An FMEA is a top-down / expert-system approach, which systematically identifies risk(s),
quantifies potential risk magnitude, and prioritises risks that are identified. In addition, as part of
the FMEA process, mitigation measures as well as further studies are developed and/or identified,
in order to manage / address the risk(s). Fundamentally, FMEAs are successful when “experts”
around the table are not only those from different science and engineering disciplines, but also
those intimately familiar with mine site operations and corporate perspectives; the May 2016
MRM FMEA workshop included these people.
The FMEA workshop evaluated and refined conceptual models developed during the March 2016
CM workshop. The CMs were refined based on available information at the time of the FMEA
workshop. CMs are tools to communicate and inform design, and design intent both internally
and externally to the project. CMs are developed on a domain and sub-domain specific basis and
identify key processes and mechanisms, as well as controls on these processes and
mechanisms, that are expected to influence performance; in short, CMs are key components of
closure planning and EIS development.
Key Facets and Outcomes from the May 2016 FMEA Workshop:
The following are key facets of the May 2016 FMEA workshop; each of these facets are
discussed further in this report.
1) Confirmation that the EIS schedule can be achieved as a result of work product and work
flow arising from the workshop;
2) Refinement of MRM’s December 2015 Draft Closure Objectives;
3) Definition of short-term and long-term timeframes for closure planning;
4) Development of site-specific consequence / severity categories to inform risk rankings;
5) Development of timeframe, domain, and site-specific failure modes and effects-pathways
(FMs/EPs);
6) Evaluation of these FMs/EPs in the context of the closure objectives to identify, prioritise,
and communicate risk; and
7) Refinement of the domain specific CMs during the risk assessment process to identify
and define further work flow for the EIS.

Glencore McArthur River Mine - Failure Modes and Effects Analysis Workshop Summary Report v
O’Kane Consultants 1 August 2016 750/36
Closure Objectives (and Timeframes):
The ten site-specific closure objectives, refined from previous MRM work, are provided in the
body of this report. Conceptually, there should be no closure objective “more important” than
another; practically however, it is typical for a few specific objectives to drive the process,
particularly at key stages of a project. In the case of the May 2016 FMEA workshop, the following
objectives were key considerations during risk evaluation.
1) Closure Objective #1 of 10:
o Post mining landscape will be left in a condition safe and secure for humans and animals;
Safe and secure for short-term (0-100 years); and
Safe for long-term (100-1,000 years).
2) Closure Objective #2 of 10:
o Construction of stable landforms that are compatible with post mining land use;
Stability is defined as that pertaining to geotechnical stability, erosional stability, and geochemical stability.
3) Closure Objective #5 of 10:
o Manage surface water and groundwater such that environmental values and ecosystems are maintained downstream of the lease boundary in the short term (0-100 years), and within McArthur River in the long term (100-1,000 years).
Refinement of Conceptual Models:
Development of domain specific CMs is not a static exercise; refinement occurs on the basis of
additional study and work. The body of this report includes a comprehensive description of the
CMs for each domain. CM refinements arising from the May 2016 FMEA workshop since the
March 2016 CM workshop are as follows.
MRM refined the waste schedule and stages of construction of the NOEF since March
2016; the FMEA was undertaken using the refined NOEF landform.
Reactive Potentially Acid Forming (PAF-RE) material from 2018-onward is to be stored in
the core zone of the NOEF landform in one designated area;
o PAF-RE material is to be placed in lifts that are a maximum 2m thick, with oxygen barriers; and
o Metalliferous Saline High Capacity Non-Acid Forming (MS-NAF) material armour layers are to be placed over oxygen barriers in between RPAF mining campaigns.
Prior to waste placement;
o A network of NOEF toe seepage collection points will be established;
o Locations will be optimised to be along natural drainage paths that will be within the
NOEF footprint; which
o Will create positive drainage under the NOEF to low points and seepage collection
dams.

Glencore McArthur River Mine - Failure Modes and Effects Analysis Workshop Summary Report vi
O’Kane Consultants 1 August 2016 750/36
Inclusion of specific design features at the base of the NOEF will limit the influence of the presence of these seepage / drainage networks functioning as conduits for oxygen into the NOEF.
Placement of SOEF material to buttress the southwest corner within the open cut to
mitigate potential bedding plane failure that could damage the levee to the south and
west of the pit lake.
In the event that a pit lake flow through scenario is selected, on the basis of water quality
criteria being achieved, relocation of the inlet to the pit lake further east away from the
potential slip plane and the original McArthur River alignment.
Key Overarching and Technical Risks Identified during the May 2016 FMEA Workshop:
Key overarching and technical risks identified during the FMEA workshop are presented below.
Mitigation measures and studies to address these risks were discussed in the FMEA workshop
and are documented in the body of this report.
1) Failure to meet stakeholder expectations for landform aesthetics (cultural significance) in
regards to the height of the NOEF, leading to failure to obtain approval of proposed landform
(short term during planning, 0-30 yrs).
Ranked High (H), primarily due to the consequence categories defined by:
o Costs
o Regulatory compliance and approval; and
o Community and stakeholders.
2) Unable to convince regulator(s) that proposed EIS approach will work without changes,
leading to EIS being delayed and temporary cessation of operations (short term during
planning,
0-30 yrs).
Ranked as a risk in the High range, and in the context of this FMEA requiring proactive management, further study, or mitigation, primarily due to the consequence categories defined by:
o Costs;
o Regulatory compliance and approval; and
o Community and stakeholders.
3) Unable to convince regulator(s) that proposed EIS approach will work without changes,
leading to EIS being rejected (short term during planning, 0-30 yrs).
Ranked Moderate to High (Mo-H), primarily due to a lower likelihood than the EIS being delayed, as well as the consequence categories defined by:
o Costs;
o Regulatory compliance and approval; and
o Community and stakeholders.
4) EIS is rejected, leading to a need to provide a closure bond that assumes all waste will be
placed in the open cut (short term during planning, 0-30 yrs).
Although determined to be a Low (L) likelihood, ranked Mo-H, primarily due to the consequence categories defined by:
o Costs; and
o Community and stakeholders.

Glencore McArthur River Mine - Failure Modes and Effects Analysis Workshop Summary Report vii
O’Kane Consultants 1 August 2016 750/36
5) A change in the block model for NAF/PAF ratio during the life of NOEF placement, leading to
Territory regulatory agencies requesting an environmental impact assessment be conducted
(short term during operations, 0-30 yrs).
Although determined to be Not Likely (NL), ranked Mo-H, primarily due to the consequence categories defined by:
o Costs.
6) Pit lake water quality does not reach requirements, leading to inability to relinquish site.
Ranked Mo-H, primarily due to the consequence categories defined by:
o Costs;
o Regulatory compliance and approval; and
o Community and stakeholders.
7) Site wide flood as a result of McArthur River overtopping the levee (30-100yr), leading to
widespread erosion, overwhelming of water treatment facilities, disruption of operations, lack
of access.
Ranked Mo-H, primarily due to the consequence categories defined by:
o Costs; and
o Regulatory compliance and approval.
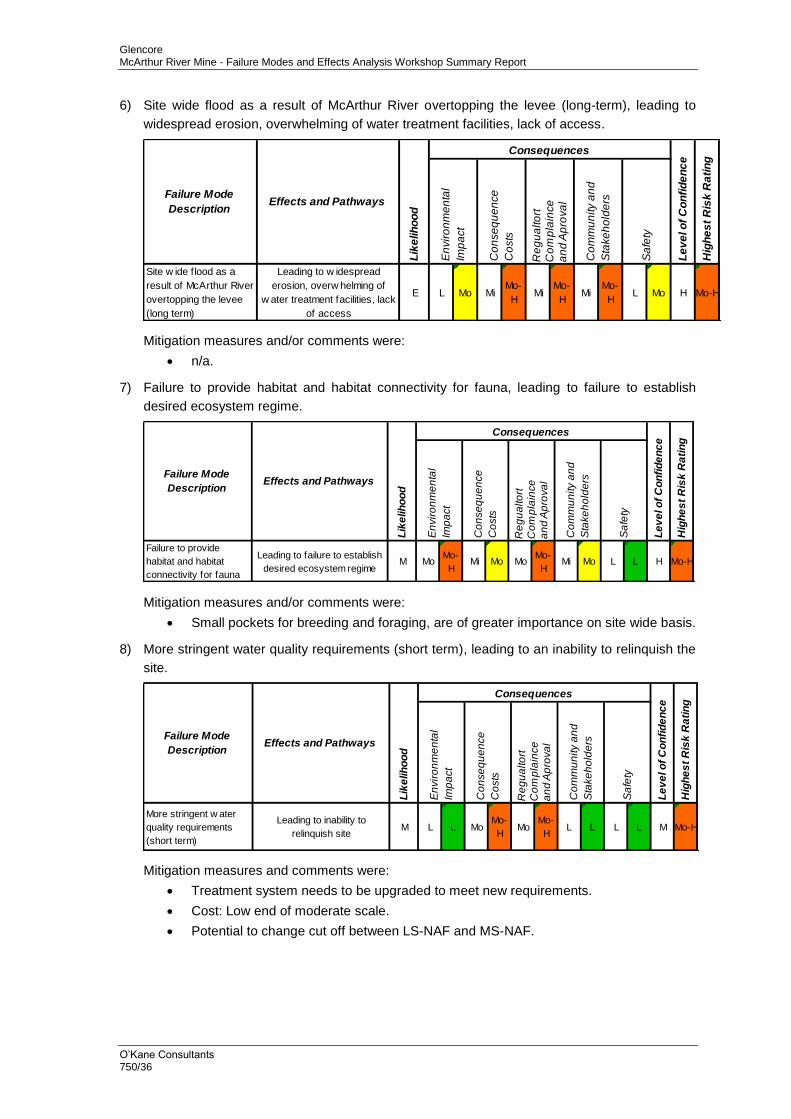
8) Site wide flood as a result of McArthur River overtopping the levee (long-term), leading to
widespread erosion, overwhelming of water treatment facilities, lack of access.
Ranked Mo-H, primarily due to the consequence categories defined by:
o Costs;
o Regulatory compliance and approval; and
o Community and stakeholders.
9) Failure to provide habitat and habitat connectivity for fauna, leading to failure to establish
desired ecosystem regime.
Ranked Mo-H, primarily due to the consequence categories defined by:
o Environmental impact; and
o Regulatory compliance and approval.
10) More stringent water quality requirements (short term), leading to an inability to relinquish the
site.
Ranked Mo-H, and in the context of this FMEA requiring active management, further study, or mitigation, primarily due to the consequence categories defined by:
o Costs; and
o Regulatory compliance and approval.
11) Severe fire event across the site (short term time frame excluding operations; 30-100yr),
leading to destruction of rehabilitated areas.
Ranked Mo-H, primarily due to the consequence categories defined by:
o Regulatory compliance and approval.
12) Inability to adequately pump trapped flood water from behind the NOEF levee during
operations (short term during operation, 0-30 yrs), as a result of poor water quality in excess
of water discharge criteria.
Ranked H, primarily due to the consequence categories defined by:
o Costs.

Glencore McArthur River Mine - Failure Modes and Effects Analysis Workshop Summary Report viii
O’Kane Consultants 1 August 2016 750/36
13) Failure to meet water quality commitments (short term) due to higher geochemical loading
than predicted from the NOEF resulting from poor hydrogeological understanding around the
facility.
Ranked Mo-H, primarily due to the consequence categories defined by:
o Environmental impacts;
o Costs;
o Regulatory compliance and approval; and
o Community and stakeholders.
14) Failure to meet water quality commitments (short term), due to underestimation of source
loading from the NOEF, and leading to failing water quality commitments.
Ranked Mo-H, primarily due to the consequence categories defined by:
o Environmental impacts;
o Costs;
o Regulatory compliance and approval; and
o Community and stakeholders.
15) Failure to meet water quality commitments (short term), due to incorrect assessment for
timing (wetting up takes sooner) and flux of source loading from the NOEF, and leading to
failing water quality commitments.
Ranked Mo-H, primarily due to the consequence categories defined by:
o Community and stakeholders.
16) Failure to meet water quality commitments (short term), due to failure of surface water
management system within/around the NOEF, and leading to failing water quality
commitments.
Ranked Mo-H, primarily due to the consequence categories defined by:
o Regulatory compliance and approval; and
o Community and stakeholders.
17) Failure to meet water quality commitments (short term), due to closure cover system not
meeting water transport requirements and further oxidation products being developed within
the NOEF, and leading to failing water quality commitments.
Ranked Mo-H, primarily due to the consequence categories defined by:
o Regulatory compliance and approval; and
o Community and stakeholders.
18) Failure to meet water quality commitments (short term) due to higher geochemical loading
than predicted from the NOEF resulting from poor hydrogeological understanding around the
facility.
Ranked Mo-H, primarily due to the consequence categories defined by:
o Regulatory compliance and approval; and
o Community and stakeholders.
19) Dynamic geotechnical failure of existing NOEF landform (west side), leading to loss of
functionality of the cover system and loss of gas and water management of the NOEF (short
term and long-term).
Although determined to be Not Likely (NL), ranked Mo-H, primarily due to the consequence categories defined by:
o Safety.

Glencore McArthur River Mine - Failure Modes and Effects Analysis Workshop Summary Report ix
O’Kane Consultants 1 August 2016 750/36
20) Dynamic geotechnical failure of existing NOEF landform (whole), leading to loss of
functionality of the cover system and loss of gas and water management of the NOEF (short
term and long-term).
Although determined to be Not Likely (NL), ranked Mo-H, primarily due to the consequence categories defined by:
o Safety.
Next Steps:
First and foremost, the May 2016 FMEA workshop provided the necessary direction and focus of
work flow and further study requirements to confirm that the EIS schedule can be achieved.
There are a number of critical project management and scheduling issues, which were discussed
during the FMEA workshop; these include:
Clear linkages, communication, and work flow between EIS project team members and
consultants in order for the work product to be delivered in a timely manner;
Over a 2-3 week period following the FMEA workshop, any fatal flaws in the base case
design would be investigated using simple analyses.;
Immediate refinement of the base case design and conceptual models from the fatal flaw
assessment if required;
Initiation of all detailed numerical modelling and design work required for the EIS
immediately after refinement of the base case and conceptual models and development
of the associated mining schedule; and
Continued and improved communication with Territory regulators in regards to the base
case, current conceptual models, closure objectives, and work product prior to
submission of the EIS in December 2016.

Glencore McArthur River Mine - Failure Modes and Effects Analysis Workshop Summary Report x
O’Kane Consultants 1 August 2016 750/36
TABLE OF CONTENTS
1 INTRODUCTION .................................................................................................... 1
1.1 Introduction to Failure Modes and Effects Analysis................................................. 1
1.2 May 2016 FMEA Workshop ..................................................................................... 2
1.3 Objectives and Scope .............................................................................................. 3
1.4 Report Organisation ................................................................................................. 3
2 REFINEMENT OF CONCEPTUAL MODELS DURING FMEA WORKSHOP ........ 4
2.1 Conceptual Model Domains for Closure Planning and MRM’s EIS ......................... 4
2.2 CM Workshop CMs and Updates / Refinements arising from FMEA Workshop .... 4
3 SUMMARY OF REFINED CLOSURE OBJECTIVES FOR WORKSHOP ............ 10
4 FRAMEWORK FOR RISK EVALUATION DURING FMEA ................................. 12
4.1 Risk Definitions ...................................................................................................... 12
4.2 Timeframe Definition .............................................................................................. 12
4.3 Likelihood Definition ............................................................................................... 15
4.4 Consequences / Severity of Effects Definitions ..................................................... 15
4.5 Level of Confidence Definition ............................................................................... 17
5 FMEA WORKSHOP OUTCOMES ....................................................................... 18
5.1 Overarching Key Failure Modes, Mitigation Measures, and Commentary ............ 18
5.2 NOEF Specific Key Failure Modes, Mitigation Measures, and Commentary ........ 22
5.3 Open Cut Specific Key Failure Modes, Mitigation Measures, and Commentary .. 29
5.4 Other Failure Modes, Mitigation Measures, and Commentary .............................. 29
5.5 Further Work Identified .......................................................................................... 30
Appendix A December 2015 Rehabilitation Objectives
Appendix B FMEA Worksheets
Appendix C FMEA Workshop Whiteboard Photographs

Glencore McArthur River Mine - Failure Modes and Effects Analysis Workshop Summary Report xi
O’Kane Consultants 1 August 2016 750/36
LIST OF TABLES
Table 1.1: FMEA workshop participants 2
Table 2.1: Summary of Conceptual Model for the Open Cut Domain 5
Table 2.2: Summary of Conceptual Model for the NOEF Domain 5
Table 2.3: Summary of Conceptual Model for NOEF Cover System and Landform 7
Table 2.4: Summary of Conceptual Model for the TSF Domain 9
Table 4.1: Likelihood of occurrence for environmental and public concern consequences over the given assessment period
15
Table 4.2: Severity of effects as agreed to at the outset of the FMEA workshop 16
Table 4.3: Levels of confidence designated by workshop participants 17

Glencore McArthur River Mine - Failure Modes and Effects Analysis Workshop Summary Report xii
O’Kane Consultants 1 August 2016 750/36
LIST OF FIGURES
Figure 2.1: Outline of PAF cell in existing NOEF (yellow) and batters / final plateau for NOEF EIS expansion
8
Figure 3.1: MRM site surface water monitoring locations; and highlight of location for meeting water quality closure objective as defined for the FMEA workshop
11
Figure 4.1: Risk matrix defined for the FMEA workshop 13
Figure 4.2: Timeframe defined for the FMEA workshop 14

Glencore McArthur River Mine - Failure Modes and Effects Analysis Workshop Summary Report 1
O’Kane Consultants 1 August 2016 750/36
1 INTRODUCTION
1.1 Introduction to Failure Modes and Effects Analysis
Generally, a well-established risk assessment approach exists within a mine site, which can be
used to identify material and non-material risks, existing controls and knowledge gaps. However,
closure plans and site-specific domains are particularly complex and further detail is often
required to refine the critical risk controls for specific closure aspects or domains. Hence, a
Failure Modes and Effects Analysis (FMEA) is used as it is a more detailed examination of the
potential closure issues and the subsequent health and safety, environment, community,
reputation, legal, and/or financial implications. Where closure issues are particularly complex, the
FMEA approach expedites the identification and evaluation of closure alternatives.
A clear and transparent evaluation of risk is required for the conceptual closure models of the site
domains. Risks are catalogued and characterised as part of the FMEA workshop. The purpose
of the workshop was to document the failure modes and effects pathways for the base case
conceptual closure models and the targeted set of alternatives. The FMEA process also identifies
mitigation-measures and studies required for various aspects of the design.
An FMEA is a top down systematic approach to risk appraisal, and identification of controls. The
aim is to foresee the potential risks associated with a system and therefore build redundancy or
mitigation measures as required. The analysis can be used as a tool to support and
communicate adopted strategies and to determine whether further research or analysis may be
required. Its value and effectiveness depend on having experts with the appropriate knowledge
and experience participate in the evaluation process during which failure modes are identified and
assessed, and to develop controls to reduce the likelihood of a particular failure or consequence
occurring. The environmental community often uses this type of process for conducting
environmental risk assessments and engineers use this type of method to assess the risk of
engineered systems. Mining companies can use this assessment method to evaluate the risk that
their Closure Plans impose on the surrounding environment, workers and the public. This
analysis methodology has been adapted for many applications over numerous industries
including 'systems' approach and 'criticality' analysis.
An FMEA provides evaluators with the ability to perform a systematic and comprehensive
evaluation of potential failure modes of the base case designs in order to identify potential
hazards. The technique is not limited to this, but is applied as such in this instance. An FMEA
can be used to evaluate potential for failures in a closure plan that could result in environmental
impacts, legal and other obligations, effects to reputation with stakeholders, and human health
and safety concerns. A risk profile can be developed for each of these concern areas. Once the
failure modes and measures with the highest risk have been identified, it is possible to consider
mitigation or alternative designs to reduce risks. FMEAs are therefore an essential part of any
risk- and liability-reduction program.

Glencore McArthur River Mine - Failure Modes and Effects Analysis Workshop Summary Report 2
O’Kane Consultants 1 August 2016 750/36
1.2 May 2016 FMEA Workshop
An FMEA workshop was conducted from 16 to 20 May, 2016 at Glencore’s Brisbane offices. The
meeting was facilitated by Mike O’Kane of O’Kane Consultants Pty Ltd. (OKC), and included key
personnel from Glencore and other consultants on MRM’s EIS team. The purpose of the meeting
was to conduct a systematic and rigorous assessment of the risks inherent in the base case
closure configurations for the major mine domains at the McArthur River mine.
A primary strength of an FMEA is the collaborative nature of the process. Output from the FMEA
workshop is optimised with input from key personnel with diverse areas of expertise and
experience. Table 2.1 lists the May 2016 workshop participants.
Table 1.1: FMEA workshop participants
Name Company Name Company
Gary Taylor McArthur River Mine Mike O’Kane OKC
Drew Herbert McArthur River Mine Peter Scott OKC
Pyramo Marianelli McArthur River Mine Phil Garneau OKC
Thaison La Vender McArthur River Mine Brent Usher KCB
Karen Heazlewood McArthur River Mine Chris Langton KCB
Jamie Hacker McArthur River Mine Alireza Naderian AECOM
John Nortier McArthur River Mine Julian Orth WRM
Steven Rooney McArthur River Mine David Moss Metserve
Jason Jones Mount Isa Mines Jim Barker Metserve
Atul Jamwal McArthur River Mine
The major mine domains included the open cut void, Tailings Storage Facility (TSF), and the
Northern Overburden Emplacement Facility (NOEF), as well as the cover system and landform for
the NOEF. Base case closure designs were largely developed prior to the FMEA workshop at a
conceptual model development workshop, also facilitated by OKC, which was held on the 21 to
23 March, 2016. Whereas the CM workshop allowed participants to develop a common
understanding of how the site domains are expected to be configured at closure, the FMEA
workshop allowed for a critical review of expected failure modes and effects pathways.
The FMEA workshop began with a comprehensive review of the proposed base case designs for
the site domains. The base case designs were then evaluated with specific reference to the
closure objectives, which were refined during the workshop.
Glencore McArthur River Mine - Failure Modes and Effects Analysis Workshop Summary Report 3
O’Kane Consultants 1 August 2016 750/36
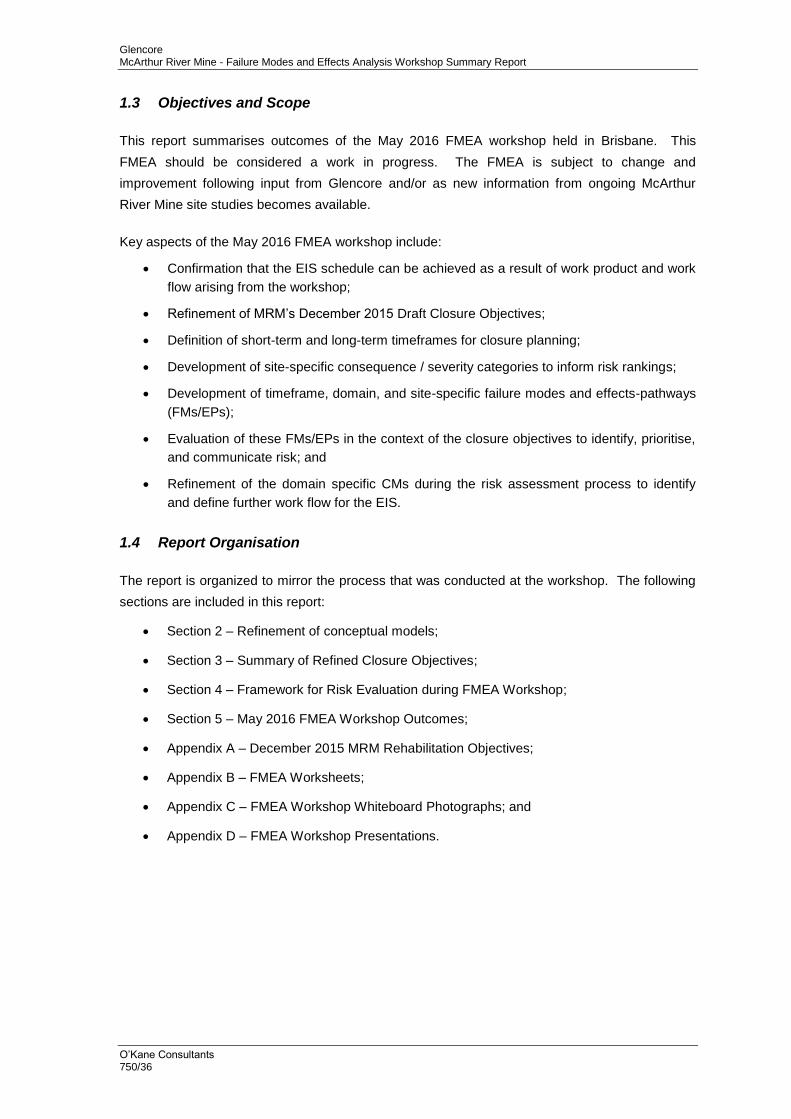
1.3 Objectives and Scope
This report summarises outcomes of the May 2016 FMEA workshop held in Brisbane. This
FMEA should be considered a work in progress. The FMEA is subject to change and
improvement following input from Glencore and/or as new information from ongoing McArthur
River Mine site studies becomes available.
Key aspects of the May 2016 FMEA workshop include:
Confirmation that the EIS schedule can be achieved as a result of work product and work
flow arising from the workshop;
Refinement of MRM’s December 2015 Draft Closure Objectives;
Definition of short-term and long-term timeframes for closure planning;
Development of site-specific consequence / severity categories to inform risk rankings;
Development of timeframe, domain, and site-specific failure modes and effects-pathways
(FMs/EPs);
Evaluation of these FMs/EPs in the context of the closure objectives to identify, prioritise,
and communicate risk; and
Refinement of the domain specific CMs during the risk assessment process to identify
and define further work flow for the EIS.
1.4 Report Organisation
The report is organized to mirror the process that was conducted at the workshop. The following
sections are included in this report:
Section 2 – Refinement of conceptual models;
Section 3 – Summary of Refined Closure Objectives;
Section 4 – Framework for Risk Evaluation during FMEA Workshop;
Section 5 – May 2016 FMEA Workshop Outcomes;
Appendix A – December 2015 MRM Rehabilitation Objectives;
Appendix B – FMEA Worksheets;
Appendix C – FMEA Workshop Whiteboard Photographs; and
Appendix D – FMEA Workshop Presentations.

Glencore McArthur River Mine - Failure Modes and Effects Analysis Workshop Summary Report 4
O’Kane Consultants 1 August 2016 750/36
2 REFINEMENT OF CONCEPTUAL MODELS DURING FMEA WORKSHOP
This section summarises the refinement of domain specific conceptual models during the FMEA
workshop. The CMs were first developed during the March 2016 CM workshop.
2.1 Conceptual Model Domains for Closure Planning and MRM’s EIS
The MRM EIS and closure planning domains are defined as follows.
1) Open Cut Domain:
Open cut;
Southern Overburden Emplacement Facility (SOEF);
Eastern Overburden Emplacement Facility (EOEF);
Western Overburden Emplacement Facility (WOEF);
Plant and power infrastructure;
The levee surrounding the open cut; and
McArthur River, and the McArthur River Diversion.
2) Northern Overburden Emplacement Facility (NOEF) Domain:
NOEF;
Barney Creek Diversion;
Emu Creek; and
The NOEF cover system and landform.
3) NOEF Cover System and Landform Domain (a sub-domain of the NOEF for CM
workshop):
Cover system(s) on sloping surfaces;
Cover system(s) on plateau surfaces;
Surface water and interflow water management; and
Vegetation.
4) Tailings Storage Facility (TSF) Domain:
Cell 1;
Cell 2;
Cells 3 (Water Management Dam) and the previously proposed Cell 4; and
Surprise Creek.
2.2 CM Workshop CMs and Updates / Refinements arising from FMEA Workshop
Tables 2.1, 2.2, 2.3, and 2.4 summarise the CMs, as well as updates and refinements arising
from the FMEA workshop, for the Open Cut, NOEF, NOEF Cover System / Landform, and TSF
domains, respectively.

Glencore McArthur River Mine - Failure Modes and Effects Analysis Workshop Summary Report 5
O’Kane Consultants 1 August 2016 750/36
Table 2.1: Summary of Conceptual Model for the Open Cut Domain
Conceptual Model: March 2016 CM Workshop Conceptual Model Refinements / Updates May 2016
FMEA Workshop
In-pit dumping of limited waste rock (including the SOEF MS-NAF) for the last five to seven years of the mine life
Confirmed, plus
Place SOEF material to buttress SW corner of open cut to mitigate potential bedding plane failure that could damage levee
Placement of all tailings into the pit void, which is expected to fill to approximately 175m below the pit crest, over a period of around 10 years;
Confirmed, plus
Time frame changed to 5-10 years, to be confirmed
Construct a levee to protect the WOEF and power station
Confirmed
Place a cover system on the WOEF Confirmed
Harvest water in wet season from McArthur River after tailings works have finished to provide a water cover over the placed materials
o Rapid filling to occur over five years
Confirmed, plus
Pumps to transfer water from McArthur River to cut.
o Must be of sufficient capacity to transfer water over limited period of time when river level is sufficient
o Require 40Mm3 per year over two months
Implement Open Cut Closure Scenario #2:
o “Isolated Pit with Active Filling”
o Evaluate hydrodynamics and water quality of the pit lake without inflow and outflow until a “steady state” condition is demonstrated
Confirmed
Implement Open Cut Closure Scenario #5:
o “Pit as a Backwater”: remove a section of the downstream levee to allow for McArthur River floodwaters to flow into open cut from the northeast.
o Evaluate hydrodynamics and water quality of the pit lake to confirm maintenance of “steady state” condition
Confirmed
Implement Open Cut Closure Scenario #4:
o “Flow Through Pit – Pit as Secondary Flow Path”
o Evaluate hydrodynamics and water quality of the pit lake to confirm maintenance of “steady state” condition
Confirmed, plus
Move inlet to pit further east away from potential slip plane and original McArthur River alignment
Table 2.2: Summary of Conceptual Model for the NOEF Domain
Conceptual Model: March 2016 CM Workshop Conceptual Model Refinements / Updates May 2016
FMEA Workshop
Construct an advection limiting cover around the existing NOEF to restrict oxygen entry
Confirmed, plus
To occur prior to CW Expansion
Place an interim store-and-release cover system on the surface of the existing NOEF PAF cell to reduce wet season net percolation and erosion
Confirmed, plus
To occur prior to CW Expansion
For new footprint, construct a gas barrier at the base (natural and engineered materials), tying into the barrier layer of the external cover system, which also provides flood proofing to above the 100 year flood level
Refined:
o MS-NAF material at base placed in 2m lifts will provide advective gas management
Place MS-NAF above the gas barrier to the 100 year flood level in low lifts to reduce gas flow to diffusion only (i.e. no advective gas transport)
Confirmed
There is no 'wedge' or CCL on top of a wedge as runoff lengths to the perimeter dams are too long to practically prevent significant infiltration
Confirmed

Glencore McArthur River Mine - Failure Modes and Effects Analysis Workshop Summary Report 6
O’Kane Consultants 1 August 2016 750/36
Table 2.2: Summary of Conceptual Model for the NOEF Domain (cont’d)
Conceptual Model: March 2016 CM Workshop Conceptual Model Refinements / Updates May 2016
FMEA Workshop
Place a core of PAF types, with Reactive PAF in 2m lifts and other materials possibly in higher lifts, with installation of regular oxygen barriers as needed, depending on cost-benefit optimisation of higher lift heights and oxygen barriers versus lower lift heights; oxygen barriers to be constructed using finer-textured materials with compaction and moisture conditioning as required
Confirmed, plus
Reactive PAF from 2018-on to be stored in the core zone in one designated area, in 2m lifts, withO2 barriers.
MS-NAF armour layers to be placed over oxygen barriers in between R PAF mining campaigns.
Place a 'halo' (preferably of MS-NAF(HC) around the PAF core, in lift heights compatible with the cover lifts on the sides but <= 5m, to a true thickness of 5-20m (subject to material availability), to displace PAF from under the batters where possible
Confirmed
Construct a cover system outside this, with a to-be-determined performance expectation for Net Percolation (NP) and oxygen (current thought is low to very low NP)
Refined:
o Refer to cover system / landform CM
A very low NP cover (strong preference for a geosynthetic) is desired above the existing PAF cell due to the potential for oxidation products in this portion of the dump
Place alluvials, LS-NAF rock and topsoil outside this for protection of the barrier layer and as a growth medium
A trade-off between initial placement thickness and on-going maintenance will provide the opportunity to optimise / tune the thickness of the rock layer in the cover system
Confirmed
Geometry to be up to 140m high, with steep tri-linear batters, giving a restricted footprint
Confirmed
Some collection and treatment of toe seepage expected in the southeast (Barney Creek) and northeast (Emu Creek) areas until the dump drains down; then subject to monitoring results
Confirmed, plus
Removal of topsoil and clay borrow material under NOEF
Seepage points from NOEF are to be based on natural topography prior to waste placement.
Create positive drainage in borrow pits under the dump to low points on the dump perimeter to manage toe seepage
Place coarser-textured rock in the drainage lines to enhance NOEF toe seepage, and extend to a sump outside the dump cover for removal of seepage.
Drain not expected to function as a conduit for oxygen into NOEF as the MS-NAF layer is placed at base.
Floodwater inflow expected to be minimal due to short duration and small openings.
N/A Base of NOEF constructed above "worst" wet season water table R.L. (based on current knowledge)
RL is known; if borrow pit is to extend under water table; either leave in place, or backfill with alluvium

Glencore McArthur River Mine - Failure Modes and Effects Analysis Workshop Summary Report 7
O’Kane Consultants 1 August 2016 750/36
Table 2.3: Summary of Conceptual Model for NOEF Cover System and Landform
Conceptual Model: March 2016 CM Workshop Conceptual Model Refinements / Updates May 2016
FMEA Workshop
Geometry for existing NOEF south and west face:
o 4.5H:1V
o Nominally 50m to 60m elevation
Confirmed
NOEF south and west face cover system and landform
o Place advection / thermal barrier to mitigate potential for PAF cell in existing NOEF to influence performance of NOEF EIS expansion.
Confirmed, plus
Referring to Figure 2.1; yellow line is the footprint of the current PAF cell and green lines represent the final NOEF EIS expansion
Placement of an advection/thermal barrier around the existing PAF cell during upcoming dry season, to start subduing the reaction rate
In addition, this will keep the Central West expansion separated from the elevated temperature(s) in the PAF cell
Final cover system likely not possible to construct until EIS is accepted (based on the relationship to date
Once EIS is approved, then NOEF landform can be constructed higher
Build immediately on top of the existing PAF cell, getting up to full height
During the dry of 2019, construction of the final closure cover system would commence around the south and west faces of the existing NOEF, which is coincident with the NOEF EIS expansion footprint and slope
Cover system to follow progression of the NOEF EIS expansion as it is constructed to higher elevations
Geometry for NOEF Expansion – Outer Batters
o Lower slope section
0m-70m elevation
4.5H:1V
o Mid-slope section
70m-110m elevation
3.5H:1V
o Upper-slope section
110m-140m elevation
2.5H:1V
Confirmed
NOEF Expansion outer batter cover system and landform
o L net percolation
5% to 10% of annual rainfall
o L oxygen ingress
5 to 10 mol/m2/yr
PAF placement plan within NOEF provides management of advective gas transport
o Moderate (M) to low (L) erosion rates in short-term
o Low (L) to VL erosion rates in long-term
Moderate erosion rate:
15 - 25 m3/ha/yr
Maximum erosion depth >2m
Low erosion rate:
10 - 15 m3/ha/yr
Maximum erosion depth <2m
Very low erosion rate:
<10 m3/ha/yr
Maximum erosion depth <1.5m
Confirmed, plus
In the event a compacted clay layer (CCL) is utilised as a component of the cover system, historic (URS original dump design, and subsequent OKC cover system numerical modelling) has assumed a 0.6m thick CCL
The CCL thickness will be re-visited during further EIS support work owing to the challenges of constructing the 0.6m thick CCL layer cost effectively
o At 0.6m and for two lifts, this requires a 0.3m compacted lift, which requires putting down 0.35m to 0.40m of material prior to compaction
o A sheepsfoot, with feet of about 0.15m to 0.20m is used for compaction
o Hence, the layers need to me thicker than 0.3m to allow for trimming the surface back to grade
o Hence, the 0.6m thickness is challenging to construct in two lifts
If the 0.6m lift is constructed in three lifts, then an additional set of testing and evaluation is required, thus increasing cost and adding to construction time.

Glencore McArthur River Mine - Failure Modes and Effects Analysis Workshop Summary Report 8
O’Kane Consultants 1 August 2016 750/36
Table 2.3: Summary of Conceptual Model for NOEF Cover System and Landform (cont’d)
Conceptual Model: March 2016 CM Workshop Conceptual Model Refinements / Updates May 2016 FMEA Workshop
Geometry for NOEF Expansion – Plateau
o ~150ha
o Nominal slope to achieve surface water management requirements
o Separate plateau into six catchments and surface water to be conveyed down ramps
Confirmed, plus
Plateau grades to be confirmed to ensure acceptable NP through defects in the cover barrier layer
NOEF Expansion Plateau cover system and landform
o VL net percolation
<5% of annual rainfall
o L oxygen ingress
5 to 10 mol/m2/yr
PAF placement plan within NOEF provides management of advective gas transport
o Moderate (M) to low (L) erosion rates in short-term
o Low (L) to VL erosion rates in long-term
Moderate erosion rate:
15 - 25 m3/ha/yr
Maximum erosion depth >2m
Low erosion rate:
10 - 15 m3/ha/yr
Maximum erosion depth <2m
Very low erosion rate:
<10 m3/ha/yr
Maximum erosion depth <1.5m
Confirmed, plus
As above for CCL layer discussion.
Figure 2.1: Outline of PAF cell in existing NOEF (yellow) and batters / final plateau for NOEF EIS expansion.

Glencore McArthur River Mine - Failure Modes and Effects Analysis Workshop Summary Report 9
O’Kane Consultants 1 August 2016 750/36
Table 2.4: Summary of Conceptual Model for the TSF Domain
Conceptual Model: March 2016 CM Workshop Conceptual Model Refinements / Updates May 2016 FMEA Workshop
Operate TSF after consolidating Cells 1 and 2 as a conventional wet tailings storage facility during operations.
Confirmed
Utilise mud-farming if trials highlight benefits, while minimising gas entry, to assist with consolidation
Confirmed
Place buttress at toe of Cell 1 and Cell 2 to meet stability design criteria
Confirmed
Upon cessation of processing, hydraulically pump tailings into the open cut void
o Current conceptual model for closure does not include processing through the plant
o Processing is subject to future economics; to be evaluated at a later date
Confirmed

Glencore McArthur River Mine - Failure Modes and Effects Analysis Workshop Summary Report 10
O’Kane Consultants 1 August 2016 750/36
3 SUMMARY OF REFINED CLOSURE OBJECTIVES FOR WORKSHOP
Development of site specific closure objectives were required before evaluating risk during the
FMEA workshop. MRM’s December 2015 Draft Closure Objectives, included as Appendix A,
were used as a basis for developing and refining site specific closure objectives. Following
further modelling and assessment, and in relation to the site-specific closure objectives, specific
design criteria will be developed from which to evaluate and measure construction quality control,
as well as in-service performance of elements and components of the designs within the domains
and sub-domains.
Ten site-specific closure objectives were refined during the FMEA workshop; these are
summarised below.
1) Closure Objective #1 of 10:
Post mining landscape will be left in a condition safe and secure for humans and animals;
o Safe and secure for short-term (0-100 years); and
o Safe for long-term (100-1,000 years).
2) Closure Objective #2 of 10:
Construction of stable landforms that are compatible with post mining land use;
o Stability pertains to geotechnical, erosional, and geochemical stability;
Geotechnical stability; maintainable at these standards:
i. NOEF: Maximum Design Earthquake (MDE) – 1 in 1,000 year event;
ii. Pit walls as per operations; detail to be added; and
iii. TSF as per per ANCOLD Guidelines.
Erosional stability; maintainable for these aspects:
i. Cover system and landform to maintain functionality;
ii. Sediment release from erosion does not adversely impact on water quality;
iii. Erosion does not affect functionality of the landform; and
iv. Resulting suspended solids can be mitigated.
Geochemical stability; defined / managed / monitored:
i. Seepage water quality at toe/base of landforms; and
ii. Water quality within the pit lake.
3) Closure Objective #3 of 10:
Landform will host suitable vegetation for post-mining land use;
o For traditional land use areas:
Have similar environmental values as surrounding areas; and
o For cattle grazing land use areas:
Grasslands.
4) Closure Objective #4 of 10:
Rehabilitated areas will provide appropriate habitat for fauna utilization - abundance and diversity will be appropriate.
Glencore McArthur River Mine - Failure Modes and Effects Analysis Workshop Summary Report 11
O’Kane Consultants 1 August 2016 750/36
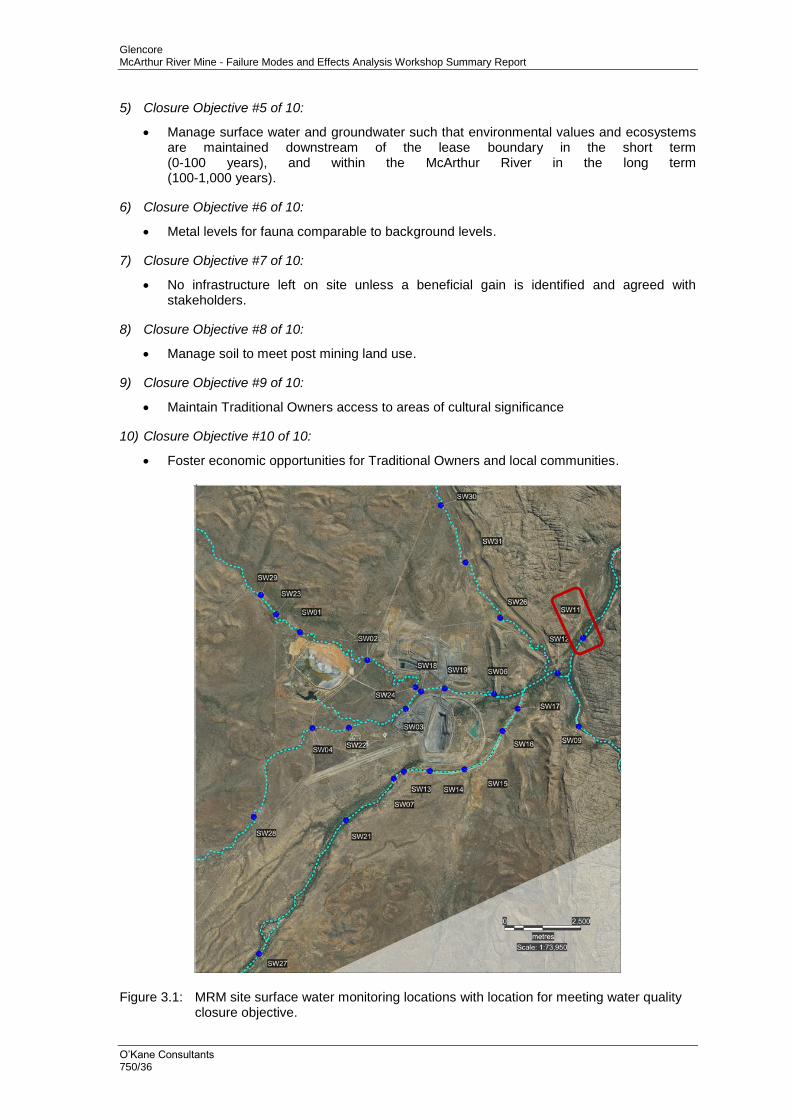
5) Closure Objective #5 of 10:
Manage surface water and groundwater such that environmental values and ecosystems are maintained downstream of the lease boundary in the short term (0-100 years), and within the McArthur River in the long term (100-1,000 years).
6) Closure Objective #6 of 10:
Metal levels for fauna comparable to background levels.
7) Closure Objective #7 of 10:
No infrastructure left on site unless a beneficial gain is identified and agreed with stakeholders.
8) Closure Objective #8 of 10:
Manage soil to meet post mining land use.
9) Closure Objective #9 of 10:
Maintain Traditional Owners access to areas of cultural significance
10) Closure Objective #10 of 10:
Foster economic opportunities for Traditional Owners and local communities.
Figure 3.1: MRM site surface water monitoring locations with location for meeting water quality closure objective.

Glencore McArthur River Mine - Failure Modes and Effects Analysis Workshop Summary Report 12
O’Kane Consultants 1 August 2016 750/36
4 FRAMEWORK FOR RISK EVALUATION DURING FMEA
This section defines the framework for risk evaluation during the FMEA workshop. This is in
terms of timeframe, likelihood, consequences, the risk matrix, and completing the FMEA.
4.1 Risk Definitions
An FMEA is a methodology for assessment of risk, which is a combination of likelihood and
consequences of failure. The goal is to provide a useful analysis technique that can be used to
assess the potential for, or likelihood of, failure of structures, equipment or processes. The
analysis technique evaluates the effects, including human health and safety, of such failures on
the larger systems of which they form a part, and on the surrounding ecosystems. For the
purposes of this document, failure is defined as any component of the base case design, or
conceptual model, which does not meet performance expectations and/or a specific closure
objective (or objectives).
The term 'risk' encompasses both the likelihood of failure, or expected frequency of failures, and
the ‘severity of the expected consequences' if such failures were to occur. It is an imprecise
process because predictive risk assessment involves foreseeing the future. There is a difference
between risk of a failure and uncertainty in the estimate of that risk. There are also separate
uncertainties associated with both expected frequency and expected consequences.
A risk matrix combines the likelihood of occurrence with the severity of effects for each of the
failure modes and assigns a risk level (ranging from low to critical) to it (Figure 4.1). The ‘High’
and ‘Critical’ risk levels should be viewed as unacceptable and steps taken to reduce these risks.
The ‘Moderate’ and ‘Moderately High’ levels are acceptable if they are ‘As Low as Reasonably
Practical’ (ALARP). For a risk to be ALARP it must be possible to demonstrate that the cost
involved in reducing the risk further would be grossly disproportionate to the benefit gained. The
‘Low’ risk designation is broadly acceptable.
4.2 Timeframe Definition
In order to conduct a risk assessment, it is required to agree upon a time frame over which the
likelihood will be evaluated. For the FMEA workshop, as illustrated in Figure 4.2, it was decided
to separate timeframes into “short term” and “long term”. These terms are defined as follows:
Short term: 0-100 years, which includes:
o Planning and execution (operation) ~20-30 years;
o Adaptive management ~ 70-80 years;
Plans must be developed as part of the EIS project to ensure “true adaptive management” is implemented, rather than simply “monitoring and reacting”;
Further modelling and evaluation as part of the EIS project, as well as consultation with Territory regulatory agencies, is used to better define the appropriate adaptive management timeframe; and
Demonstration of a performance trajectory, as per modelling conducted as part of the EIS project.

Glencore McArthur River Mine - Failure Modes and Effects Analysis Workshop Summary Report 13
O’Kane Consultants 1 August 2016 750/36
Long term: 100-1000 years, which includes:
o Proactive monitoring (timeframe to be determined through numerical modelling as part of the EIS project);
To continue illustrating that performance is on the appropriate trajectory; and
But with a reduced frequency as compared to the adaptive management phase.
o Reactive monitoring (timeframe to be determined as part of additional risk
assessment);
Where relinquishment or custodial transfer can be achieved because there is well defined risk that can be appropriately managed and costed, and which may be phased.
Figure 4.1: Risk matrix defined for the FMEA workshop.

Glencore McArthur River Mine - Failure Modes and Effects Analysis Workshop Summary Report 14
O’Kane Consultants 1 August 2016 750/36
Further to defining adaptive management, it was agreed during the FMEA workshop that “true”
adaptive management must be adopted in order to properly address risks during this phase of
closure, which will allow for appropriate risk evaluation for the same failure mode in the long term.
For example, with “true” adaptive management, there is a commitment to:
Utilising the observational method for monitoring during this phase;
Developing conceptual models for performance;
Designing for the most likely conditions;
Identifying all failure modes (and effects and pathways);
Developing actual, available, allowable, and cost effective contingencies for all identified
risks;
Developing designs that address these contingencies, which are put in place up front and
as part of the overall design;
Monitoring closely, on a frequent basis, and at source, compliance points, and “in
between” to address issues such that contingencies can be implemented before being
non-compliant;
Implement mitigation measures as needed and in a timely manner;
Undertake regular audits against the performance and compliance program; and
Scan for opportunities to continually improve.
Figure 4.2: Timeframe defined for the FMEA workshop.
All
oca
tio
n o
f R
es
ou
rce
s t
o
Clo
su
re
Time
Adaptive
Management
Proactive
Monitoring
Reactive
Monitoring
Regularly
scheduled
monitoring to
confirm
trajectory
Much less
frequently than
A.M.
Monitoring in response to site
conditions/events
- Fire
- Flood
- Earthquake
- Extreme Precipitation
Very well defined and understood risk
- Could achieve custodial transfer if
desired
1. Regulatory
direction
2. Closure
experience
(accumulated
knowledge)
3. Site-specific
process
Planning
Execution
Monitoring
Short-Term
~ 0 to 100 Years
Long-Term
~ 100 - 1000 Years
Glencore McArthur River Mine - Failure Modes and Effects Analysis Workshop Summary Report 15
O’Kane Consultants 1 August 2016 750/36
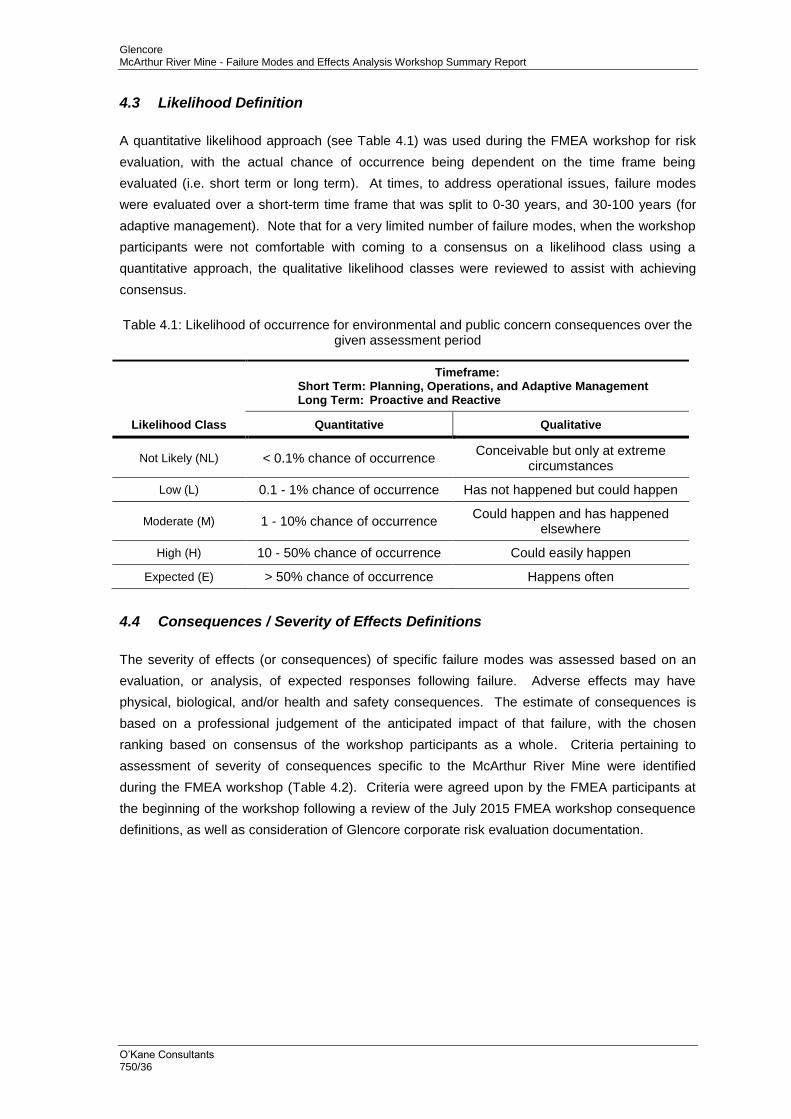
4.3 Likelihood Definition
A quantitative likelihood approach (see Table 4.1) was used during the FMEA workshop for risk
evaluation, with the actual chance of occurrence being dependent on the time frame being
evaluated (i.e. short term or long term). At times, to address operational issues, failure modes
were evaluated over a short-term time frame that was split to 0-30 years, and 30-100 years (for
adaptive management). Note that for a very limited number of failure modes, when the workshop
participants were not comfortable with coming to a consensus on a likelihood class using a
quantitative approach, the qualitative likelihood classes were reviewed to assist with achieving
consensus.
Table 4.1: Likelihood of occurrence for environmental and public concern consequences over the given assessment period
Likelihood Class
Timeframe: Short Term: Planning, Operations, and Adaptive Management Long Term: Proactive and Reactive
Quantitative Qualitative
Not Likely (NL) < 0.1% chance of occurrence Conceivable but only at extreme
circumstances
Low (L) 0.1 - 1% chance of occurrence Has not happened but could happen
Moderate (M) 1 - 10% chance of occurrence Could happen and has happened
elsewhere
High (H) 10 - 50% chance of occurrence Could easily happen
Expected (E) > 50% chance of occurrence Happens often
4.4 Consequences / Severity of Effects Definitions
The severity of effects (or consequences) of specific failure modes was assessed based on an
evaluation, or analysis, of expected responses following failure. Adverse effects may have
physical, biological, and/or health and safety consequences. The estimate of consequences is
based on a professional judgement of the anticipated impact of that failure, with the chosen
ranking based on consensus of the workshop participants as a whole. Criteria pertaining to
assessment of severity of consequences specific to the McArthur River Mine were identified
during the FMEA workshop (Table 4.2). Criteria were agreed upon by the FMEA participants at
the beginning of the workshop following a review of the July 2015 FMEA workshop consequence
definitions, as well as consideration of Glencore corporate risk evaluation documentation.

Glencore McArthur River Mine - Failure Modes and Effects Analysis Workshop Summary Report 16
O’Kane Consultants 1 August 2016 750/36
Table 4.2: Severity of effects as agreed to at the outset of the FMEA workshop
Consequence Categories Low Minor Moderate Major Catastrophic
Environmental Impact (air emissions, dust, water
quality, and its adverse effects on human health,
chronic and acute)
No observable effect Minor localised or short-term effects
6-12 months, or within domain
Deleterious effect on valued ecosystem component.
1-5 years, or within mine lease
Extensive deleterious effect on valued ecosystem component with medium-term impairment of ecosystem function.
5-20 years (LOM)
Off mine lease, downstream catchment
Serious long-term impairment of ecosystem function
Off lease
Regulatory Compliance and Approval
No non-compliance but lack of conformance with department policy requirement.
Order of direction issued for additional information
Provide information on investigation.
Technical/ administrative non-compliance with permit, approval or regulatory requirement.
Order of direction issued for additional information.
Minor non-conformance with approved Mining Management Plan.
Breach of regulations, permits, or approval (e.g. 1 day violation of discharge limits).
Order or direction issued for action.
Moderate non-conformance with approved Mining Management Plan.
Substantive breach of multiple agencies regulations, permits, or approvals (e.g. multi-day violation of discharge limits).
Temporary Cessation of Operations.
Major non-conformance with approved Mining Management Plan and Environmental Approval.
Major breach of regulation; willful violation.
Permanent cessation of Operations.
Consequence Costs
Very Low Low Moderate
Example: Partial re-work of cover systems; 10%.
High
Example Partial re-work of cover systems; 20-50% Required water treatment (new plant)
Very High
Example: Major failure of NOEF, TSF, open cut, tailings down river, pit water goes acid
Community and
Stakeholders
Local concerns, but no local complaints or adverse press coverage.
Public concern restricted to local complaints or local adverse press coverage.
Heightened concern by local community, criticism by NGOs or adverse local/ regional media attention.
Wide-spread adverse national public, NGO, or media attention.
Serious public outcry/ demonstrations or adverse international NGO attention or media coverage.
Safety
Low-level short-term subjective symptoms.
No measurable physical effect.
No medical treatment.
Reversible disability/impairment and/or medical treatment.
Injuries requiring hospitalization.
Moderate irreversible disability or impairment to one or more people.
Single fatality and/or severe irreversible disability or impairment to one or more people.
Multiple fatalities.

Glencore McArthur River Mine - Failure Modes and Effects Analysis Workshop Summary Report 17
O’Kane Consultants 1 August 2016 750/36
4.5 Level of Confidence Definition
For each failure mode (and effects and pathway), workshop participants developed consensus on
the level of confidence for the risk ranking determined. This level of confidence varied based on
the knowns and unknowns at the site and the failure mechanism. The level of confidence of
participants for each evaluation was identified and documented using the designations described
in Table 4..
Table 4.3: Levels of confidence designated by workshop participants
Confidence Description
Low (L) Do not have confidence in the estimate or ability to control during implementation.
Medium (M) Have some confidence in the estimate or ability to control during implementation,
conceptual level analyses.
High (H) Have lots of confidence in the estimate or ability to control during implementation,
detailed analyses following a high standard of care.
In few instances, as documented in the FMEA worksheets, when a low level of confidence in the
risk ranking was identified, the highest risk ranking was increased one level, as shown in Figure
4.1, in order to increase the level of awareness for a particular failure mode when reviewing the
FMEA workshop outcomes.

Glencore McArthur River Mine - Failure Modes and Effects Analysis Workshop Summary Report 18
O’Kane Consultants 1 August 2016 750/36
5 FMEA WORKSHOP OUTCOMES
Outcomes from the FMEA workshop are intentionally collaborative. The strength of the workshop
format is provision of “time and space” for discussion and debate, leading to outcomes upon
which all participants are in agreement. Thus, it was important to allow time to revisit the
conceptual models developed for the site domains, prior to progressing with evaluation of a failure
mode, in order to properly assess the risk. As summarised in this report, outcomes include
development and refinement of closure objectives from which to measure the conceptual models
for the different domains; in addition, the conceptual models themselves were refined, and
timeframes for closure were defined.
Appendix B includes the detailed FMEA worksheets, along with mitigation measures and
comments discussed and developed while ranking each failure mode.
Appendix C includes the whiteboard photographs from the FMEA workshop.
Appendix D includes the presentations developed during and for the FMEA workshop.
5.1 Overarching Key Failure Modes, Mitigation Measures, and Commentary
Overarching key failure modes, mitigation measures, and commentary as identified during the
FMEA workshop are as follows.
1) Failure to meet stakeholder expectations for landform aesthetics (cultural significance) in
regards to the height of the NOEF, leading to failure to obtain approval of proposed landform
(short term during planning, 0-30 yrs).
Mitigation measures and/or comments were:
July 2015 FMEA workshop likelihood: High. 140m approval vs. 80m as approved.
Meetings with Traditional Owners have occurred, with discussions being favourable and it is felt approval will be negotiated, but no formal agreement as yet.
$75M incremental cost to develop to 80m height restriction instead of 140m.
700ha (80m) vs. 550ha (140m) footprint is likely to result in an increase in contaminant loads to the environment.
Failure to meet
stakeholder
expectations for
landform aesthetics
(cultural signif icance) in
regards to the height of
the NOEF
Leading to failure for approval
of landformM Mi Mo Ma H Mo
Mo-
HMo
Mo-
HL L M H
Hig
he
st
Ris
k R
ati
ng
Failure Mode
DescriptionEffects and Pathways
Lik
elih
oo
d
Le
ve
l o
f C
on
fid
en
ce
Consequences
En
vir
on
me
nta
l
Imp
act
Co
nse
qu
en
ce
Co
sts
Le
ga
l a
nd
Oth
er
Ob
lig
atio
ns
Co
mm
un
ity a
nd
Sta
ke
ho
lde
rs
Sa
fety
Re
gu
alto
rt
Co
mp
lain
ce
an
d A
pro
va
l
Glencore McArthur River Mine - Failure Modes and Effects Analysis Workshop Summary Report 19
O’Kane Consultants 1 August 2016 750/36
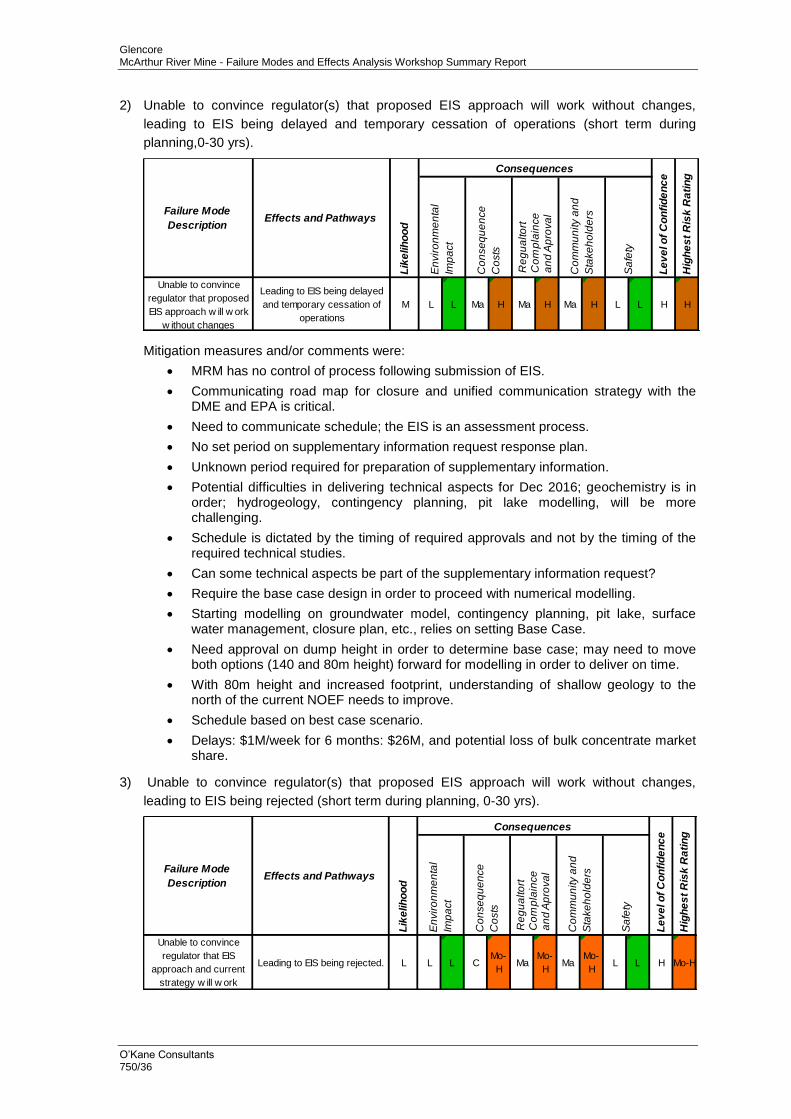
2) Unable to convince regulator(s) that proposed EIS approach will work without changes,
leading to EIS being delayed and temporary cessation of operations (short term during
planning,0-30 yrs).
Mitigation measures and/or comments were:
MRM has no control of process following submission of EIS.
Communicating road map for closure and unified communication strategy with the DME and EPA is critical.
Need to communicate schedule; the EIS is an assessment process.
No set period on supplementary information request response plan.
Unknown period required for preparation of supplementary information.
Potential difficulties in delivering technical aspects for Dec 2016; geochemistry is in order; hydrogeology, contingency planning, pit lake modelling, will be more challenging.
Schedule is dictated by the timing of required approvals and not by the timing of the required technical studies.
Can some technical aspects be part of the supplementary information request?
Require the base case design in order to proceed with numerical modelling.
Starting modelling on groundwater model, contingency planning, pit lake, surface water management, closure plan, etc., relies on setting Base Case.
Need approval on dump height in order to determine base case; may need to move both options (140 and 80m height) forward for modelling in order to deliver on time.
With 80m height and increased footprint, understanding of shallow geology to the north of the current NOEF needs to improve.
Schedule based on best case scenario.
Delays: $1M/week for 6 months: $26M, and potential loss of bulk concentrate market share.
3) Unable to convince regulator(s) that proposed EIS approach will work without changes,
leading to EIS being rejected (short term during planning, 0-30 yrs).
Unable to convince
regulator that proposed
EIS approach w ill w ork
w ithout changes
Leading to EIS being delayed
and temporary cessation of
operations
M L L Ma H Ma H Ma H L L H H
Hig
he
st
Ris
k R
ati
ng
Failure Mode
DescriptionEffects and Pathways
Lik
elih
oo
d
Le
ve
l o
f C
on
fid
en
ce
Consequences
En
vir
on
me
nta
l
Imp
act
Co
nse
qu
en
ce
Co
sts
Le
ga
l a
nd
Oth
er
Ob
lig
atio
ns
Co
mm
un
ity a
nd
Sta
ke
ho
lde
rs
Sa
fety
Re
gu
alto
rt
Co
mp
lain
ce
an
d A
pro
va
l
Unable to convince
regulator that EIS
approach and current
strategy w ill w ork
Leading to EIS being rejected. L L L CMo-
HMa
Mo-
HMa
Mo-
HL L H Mo-H
Hig
he
st
Ris
k R
ati
ng
Failure Mode
DescriptionEffects and Pathways
Lik
elih
oo
d
Le
ve
l o
f C
on
fid
en
ce
Consequences
En
vir
on
me
nta
l
Imp
act
Co
nse
qu
en
ce
Co
sts
Le
ga
l a
nd
Oth
er
Ob
lig
atio
ns
Co
mm
un
ity a
nd
Sta
ke
ho
lde
rs
Sa
fety
Re
gu
alto
rt
Co
mp
lain
ce
an
d A
pro
va
l

Glencore McArthur River Mine - Failure Modes and Effects Analysis Workshop Summary Report 20
O’Kane Consultants 1 August 2016 750/36
Mitigation measures and/or comments were:
If EIS rejected, need to repeat the process, represents a time and cost commitment.
2005 EIS was rejected.
Consequence costs: NPV $1B, loss opportunity cost >$200M
4) EIS is rejected, leading to a need to provide a closure bond that assumes all waste will be
placed in the open cut (short term during planning, 0-30 yrs).
Mitigation measures and/or comments were:
EIS still has to be presented to DME for approval.
Probability of having to put waste back in open cut if EIS doesn’t go through.
5) Site wide flood as a result of McArthur River overtopping the levee (30-100yr), leading to
widespread erosion, overwhelming of water treatment facilities, disruption of operations, lack
of access.
Mitigation measures and/or comments were:
Mitigation: insurance.
With higher levee level around power plant, reduced risk.
Power Plant: external contractor responsibility.
EIS rejected.
Leading a need to provide a
closure bond that assumes all
w aste w ill need to be placed
in the open pit
L Mi L CMo-
Hn/a C
Mo-
HL L L Mo-H
Hig
he
st
Ris
k R
ati
ng
Failure Mode
DescriptionEffects and Pathways
Lik
elih
oo
d
Le
ve
l o
f C
on
fid
en
ce
Consequences
En
vir
on
me
nta
l
Imp
act
Co
nse
qu
en
ce
Co
sts
Le
ga
l a
nd
Oth
er
Ob
lig
atio
ns
Co
mm
un
ity a
nd
Sta
ke
ho
lde
rs
Sa
fety
Re
gu
alto
rt
Co
mp
lain
ce
an
d A
pro
va
l
Site w ide flood as a
result of McArthur River
overtopping the levee
(30-100yr)
Leading to w idespread
erosion, overw helming of
w ater treatment facilities,
disruption of operations, lack
of access
M Mi Mo MoMo-
HMo
Mo-
HMi Mo L L H Mo-H
Hig
he
st
Ris
k R
ati
ng
Failure Mode
DescriptionEffects and Pathways
Lik
elih
oo
d
Le
ve
l o
f C
on
fid
en
ce
Consequences
En
vir
on
me
nta
l
Imp
act
Co
nse
qu
en
ce
Co
sts
Le
ga
l a
nd
Oth
er
Ob
lig
atio
ns
Co
mm
un
ity a
nd
Sta
ke
ho
lde
rs
Sa
fety
Re
gu
alto
rt
Co
mp
lain
ce
an
d A
pro
va
l
Glencore McArthur River Mine - Failure Modes and Effects Analysis Workshop Summary Report 21
O’Kane Consultants 1 August 2016 750/36
6) Site wide flood as a result of McArthur River overtopping the levee (long-term), leading to
widespread erosion, overwhelming of water treatment facilities, lack of access.
Mitigation measures and/or comments were:
n/a.
7) Failure to provide habitat and habitat connectivity for fauna, leading to failure to establish
desired ecosystem regime.
Mitigation measures and/or comments were:
Small pockets for breeding and foraging, are of greater importance on site wide basis.
8) More stringent water quality requirements (short term), leading to an inability to relinquish the
site.
Mitigation measures and comments were:
Treatment system needs to be upgraded to meet new requirements.
Cost: Low end of moderate scale.
Potential to change cut off between LS-NAF and MS-NAF.
Site w ide flood as a
result of McArthur River
overtopping the levee
(long term)
Leading to w idespread
erosion, overw helming of
w ater treatment facilities, lack
of access
E L Mo MiMo-
HMi
Mo-
HMi
Mo-
HL Mo H Mo-H
Hig
he
st
Ris
k R
ati
ng
Failure Mode
DescriptionEffects and Pathways
Lik
elih
oo
d
Le
ve
l o
f C
on
fid
en
ce
Consequences
En
vir
on
me
nta
l
Imp
act
Co
nse
qu
en
ce
Co
sts
Le
ga
l a
nd
Oth
er
Ob
lig
atio
ns
Co
mm
un
ity a
nd
Sta
ke
ho
lde
rs
Sa
fety
Re
gu
alto
rt
Co
mp
lain
ce
an
d A
pro
va
l
Failure to provide
habitat and habitat
connectivity for fauna
Leading to failure to establish
desired ecosystem regimeM Mo
Mo-
HMi Mo Mo
Mo-
HMi Mo L L H Mo-H
Hig
he
st
Ris
k R
ati
ng
Failure Mode
DescriptionEffects and Pathways
Lik
elih
oo
d
Le
ve
l o
f C
on
fid
en
ce
ConsequencesE
nvir
on
me
nta
l
Imp
act
Co
nse
qu
en
ce
Co
sts
Le
ga
l a
nd
Oth
er
Ob
lig
atio
ns
Co
mm
un
ity a
nd
Sta
ke
ho
lde
rs
Sa
fety
Re
gu
alto
rt
Co
mp
lain
ce
an
d A
pro
va
l
More stringent w ater
quality requirements
(short term)
Leading to inability to
relinquish siteM L L Mo
Mo-
HMo
Mo-
HL L L L M Mo-H
Hig
he
st
Ris
k R
ati
ng
Failure Mode
DescriptionEffects and Pathways
Lik
elih
oo
d
Le
ve
l o
f C
on
fid
en
ce
Consequences
En
vir
on
me
nta
l
Imp
act
Co
nse
qu
en
ce
Co
sts
Le
ga
l a
nd
Oth
er
Ob
lig
atio
ns
Co
mm
un
ity a
nd
Sta
ke
ho
lde
rs
Sa
fety
Re
gu
alto
rt
Co
mp
lain
ce
an
d A
pro
va
l

Glencore McArthur River Mine - Failure Modes and Effects Analysis Workshop Summary Report 22
O’Kane Consultants 1 August 2016 750/36
9) Severe fire event across the site (short term time frame excluding operations; 30-100yr),
leading to destruction of rehabilitated areas.
Mitigation measures and/or comments were:
Assets are in place and fire protection will be as appropriate for the asset(s).
Personal will be on site, as monitoring is ongoing during adaptive management phase.
5.2 NOEF Specific Key Failure Modes, Mitigation Measures, and Commentary
NOEF specific key failure modes, mitigation measures, and commentary as identified during the
FMEA workshop are as follows.
1) A change in the block model for NAF/PAF ratio during the life of NOEF placement, leading to
Territory regulatory agencies requesting an environmental impact assessment be conducted
(short term during operations, 0-30 yrs).
Mitigation measures and/or comments were:
Essentially the reason for the current EIS.
2) Inability to adequately pump trapped flood water from behind the NOEF levee during
operations (short term during operation, 0-30 yrs), as a result of poor water quality in excess
of water discharge criteria.
Severe fire event
across the site (short
term,
30-100yr)
Leading to destruction of
rehabilitataed areasM Mi Mo Mi Mo Mo
Mo-
HMi Mo Mi Mo M Mo-H
Hig
he
st
Ris
k R
ati
ng
Failure Mode
DescriptionEffects and Pathways
Lik
elih
oo
d
Le
ve
l o
f C
on
fid
en
ce
Consequences
En
vir
on
me
nta
l
Imp
act
Co
nse
qu
en
ce
Co
sts
Le
ga
l a
nd
Oth
er
Ob
lig
atio
ns
Co
mm
un
ity a
nd
Sta
ke
ho
lde
rs
Sa
fety
Re
gu
alto
rt
Co
mp
lain
ce
an
d A
pro
va
l
A change in the Block
model for NAF/PAF ratio
during the life of NOEF
placement
Leading to State regulatory
agencies requesting an
environmental impact
assessment be conducted
NL Mi L CMo-
HMa Mo Ma Mo L L H Mo-H
Hig
he
st
Ris
k R
ati
ng
Failure Mode
DescriptionEffects and Pathways
Lik
elih
oo
d
Le
ve
l o
f C
on
fid
en
ce
Consequences
En
vir
on
me
nta
l
Imp
act
Co
nse
qu
en
ce
Co
sts
Le
ga
l a
nd
Oth
er
Ob
lig
atio
ns
Co
mm
un
ity a
nd
Sta
ke
ho
lde
rs
Sa
fety
Re
gu
alto
rt
Co
mp
lain
ce
an
d A
pro
va
l

Glencore McArthur River Mine - Failure Modes and Effects Analysis Workshop Summary Report 23
O’Kane Consultants 1 August 2016 750/36
Mitigation measures and/or comments were:
Water trapped behind the levee, starts as clean water trapped behind levee, then potentially mixes with NOEF pore-water.
1:20yr levee for next 4 years.
Capacity to pump water out if not contaminated?
Authorization to release trapped water.
High pumping rate of trapped water in short term, gets discharged license as water quality is good, monitor water quality during pumping.
Then, smaller volumes from dump seepage to be pumped to PRODs.
Need to model what the water quality would be.
Water to go to open cut if pumping is insufficient
Likely a month of water sitting behind levee that would result in the need to pump water into open cut as water quality is unlikely to be impacted in the short timeframe.
3) Failure to meet water quality commitments (short term) due to higher geochemical loading
than predicted from the NOEF resulting from poor hydrogeological understanding around the
facility.
Mitigation measures and/or comments were:
Mitigation: groundwater model, mixing zones and water quality modelling downstream.
Modelling to determine trigger value at toe of the NOEF.
Monitoring at toe to capture issue prior to dispersion of plume; mitigation methods to be evaluated.
If issue caught early (from monitoring and modelling), cost of mitigation measures can be reduced.
If water is collected, can be sent to water treatment plant.
If PRODs are still in use, water goes back to PRODs; can be pumped to open cut depending on water quality.
Inability to pump high
flow rates after f lood
event
As a result of poor w ater
quality in excess of designM L L Ma H Mi Mo L L L L L H
Hig
he
st
Ris
k R
ati
ng
Failure Mode
DescriptionEffects and Pathways
Lik
elih
oo
d
Le
ve
l o
f C
on
fid
en
ce
Consequences
En
vir
on
me
nta
l
Imp
act
Co
nse
qu
en
ce
Co
sts
Le
ga
l a
nd
Oth
er
Ob
lig
atio
ns
Co
mm
un
ity a
nd
Sta
ke
ho
lde
rs
Sa
fety
Re
gu
alto
rt
Co
mp
lain
ce
an
d A
pro
va
l
Higher than required
performance for
geochemical loading
from facility
Due to lack of understanding
for hydrogeology around the
NOEF
Leading to failing w ater quality
commitments
M MoMo-
HMo
Mo-
HMo
Mo-
HMo
Mo-
HL L M Mo-H
Hig
he
st
Ris
k R
ati
ng
Failure Mode
DescriptionEffects and Pathways
Lik
elih
oo
d
Le
ve
l of
Co
nfi
de
nc
e
Consequences
En
viro
nm
en
tal
Imp
act
Co
nse
qu
en
ce
Co
sts
Le
ga
l an
d O
the
r
Ob
liga
tion
s
Co
mm
un
ity a
nd
Sta
keh
old
ers
Sa
fety
Re
gu
alto
rt
Co
mp
lain
cea
nd
Ap
rova
l

Glencore McArthur River Mine - Failure Modes and Effects Analysis Workshop Summary Report 24
O’Kane Consultants 1 August 2016 750/36
Substantial modelling to be completed and an updated hydrogeological investigation is planned after geological and geophysical compilation has been completed, building on conceptual model.
Monitoring to catch the elevated values, adaptive management phase, monitoring within the mixing zone and at toe.
Remediation measures put in place within short time frame.
The potential for clean-up would occur in less than 5 years.
Post-operations (35 years), does a contaminated plume go to the open cut? Barney Creek? Potential to block off Barney Creek during dry season, catch seepage until wet season.
Risk considered during operations: likelihood is high and mitigation measures are currently being put in place.
Risk considered in the short term timeframe (100 years): likelihood is moderate, mitigation measures can be put in place within a short time frame.

Glencore McArthur River Mine - Failure Modes and Effects Analysis Workshop Summary Report 25
O’Kane Consultants 1 August 2016 750/36
4) Failure to meet water quality commitments (short term), due to underestimation of source
loading from the NOEF, and leading to failing water quality commitments.
Mitigation measures and/or comments were:
Increased capacity of water treatment system to handle additional load (not additional volume).
Preliminary estimate: 10-20k mg/l sulfate, failure is seeing 30-40k mg/L.
Uncertainties relating to the spatial variability of loading source within the NOEF.
Current thought process is that interpretation of MNAF, PAF and RPAF will not vary and/or evolve to a great extent, resulting in minimal impact to the load source understanding.
Likely an overestimation of the volume of PAF within the existing NOEF facility.
Understanding the nature of the pyrite and the reaction rate still evolving.
Determination of reaction rates are being evaluated from kinetic testing, as well as interpretation of internal NOEF field data, which increases confidence with estimates..
Breaking down of material also impacts reactivity (free surface for reaction), split on pyritic planes.
Dump records for lifts and timing are very good, which allows for appropriately conceptualisation of the dump and model the wetting up of the dump.
Actual data and monitoring from inside the dump, data from drilling, allows for calibrating of the models; field data is available for model calibration.
Not acid seepage, circum-neutral seepage with sulfate and metal concentrations; pH is neutral.
For a seepage rate of 2mm/day, and a 140m high NOEF footprint, this results in 3.65M m
3/yr for treatment (based on 2mm/day) --> 0.01M m
3/day
McArthur River flow (in the wet): 25,000 ML/day (25M m3/day)
McArthur River flow (in the dry): 1M m3/day (10mg/L sulfate) = 10 tonne/day
Increase of an order of magnitude of sulfate concentration in the river for the dry season; for wet season: 2-3x the load.
Higher than required
performance for
geochemical loading
from facility
Due to underestimation of
source loading from the NOEF
Leading to failing w ater quality
commitments
M MoMo-
HMo
Mo-
HMo
Mo-
HMo
Mo-
HL L M Mo-H
Hig
he
st
Ris
k R
ati
ng
Failure Mode
DescriptionEffects and Pathways
Lik
elih
oo
d
Le
ve
l o
f C
on
fid
en
ce
Consequences
En
vir
on
me
nta
l
Imp
act
Co
nse
qu
en
ce
Co
sts
Le
ga
l a
nd
Oth
er
Ob
lig
atio
ns
Co
mm
un
ity a
nd
Sta
ke
ho
lde
rs
Sa
fety
Re
gu
alto
rt
Co
mp
lain
ce
an
d A
pro
va
l
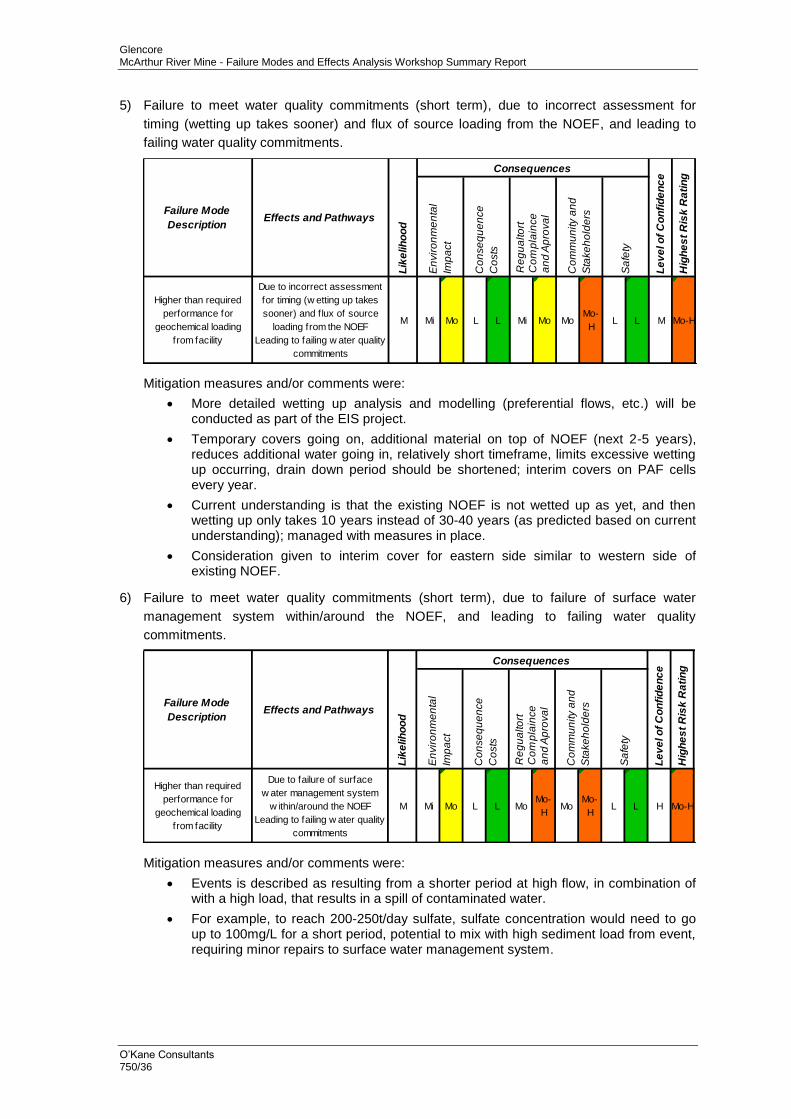
Glencore McArthur River Mine - Failure Modes and Effects Analysis Workshop Summary Report 26
O’Kane Consultants 1 August 2016 750/36
5) Failure to meet water quality commitments (short term), due to incorrect assessment for
timing (wetting up takes sooner) and flux of source loading from the NOEF, and leading to
failing water quality commitments.
Mitigation measures and/or comments were:
More detailed wetting up analysis and modelling (preferential flows, etc.) will be conducted as part of the EIS project.
Temporary covers going on, additional material on top of NOEF (next 2-5 years), reduces additional water going in, relatively short timeframe, limits excessive wetting up occurring, drain down period should be shortened; interim covers on PAF cells every year.
Current understanding is that the existing NOEF is not wetted up as yet, and then wetting up only takes 10 years instead of 30-40 years (as predicted based on current understanding); managed with measures in place.
Consideration given to interim cover for eastern side similar to western side of existing NOEF.
6) Failure to meet water quality commitments (short term), due to failure of surface water
management system within/around the NOEF, and leading to failing water quality
commitments.
Mitigation measures and/or comments were:
Events is described as resulting from a shorter period at high flow, in combination of with a high load, that results in a spill of contaminated water.
For example, to reach 200-250t/day sulfate, sulfate concentration would need to go up to 100mg/L for a short period, potential to mix with high sediment load from event, requiring minor repairs to surface water management system.
Higher than required
performance for
geochemical loading
from facility
Due to incorrect assessment
for timing (w etting up takes
sooner) and flux of source
loading from the NOEF
Leading to failing w ater quality
commitments
M Mi Mo L L Mi Mo MoMo-
HL L M Mo-H
Hig
he
st
Ris
k R
ati
ng
Failure Mode
DescriptionEffects and Pathways
Lik
elih
oo
d
Le
ve
l o
f C
on
fid
en
ce
Consequences
En
vir
on
me
nta
l
Imp
act
Co
nse
qu
en
ce
Co
sts
Le
ga
l a
nd
Oth
er
Ob
lig
atio
ns
Co
mm
un
ity a
nd
Sta
ke
ho
lde
rs
Sa
fety
Re
gu
alto
rt
Co
mp
lain
ce
an
d A
pro
va
l
Higher than required
performance for
geochemical loading
from facility
Due to failure of surface
w ater management system
w ithin/around the NOEF
Leading to failing w ater quality
commitments
M Mi Mo L L MoMo-
HMo
Mo-
HL L H Mo-H
Hig
he
st
Ris
k R
ati
ng
Failure Mode
DescriptionEffects and Pathways
Lik
elih
oo
d
Le
ve
l o
f C
on
fid
en
ce
Consequences
En
vir
on
me
nta
l
Imp
act
Co
nse
qu
en
ce
Co
sts
Le
ga
l a
nd
Oth
er
Ob
lig
atio
ns
Co
mm
un
ity a
nd
Sta
ke
ho
lde
rs
Sa
fety
Re
gu
alto
rt
Co
mp
lain
ce
an
d A
pro
va
l

Glencore McArthur River Mine - Failure Modes and Effects Analysis Workshop Summary Report 27
O’Kane Consultants 1 August 2016 750/36
7) Failure to meet water quality commitments (short term), due to closure cover system not
meeting water transport requirements and further oxidation products being developed within
the NOEF, and leading to failing water quality commitments.
Mitigation measures and/or comments were:
For example, if NP is modelled to be 5%, but is instead 10-15%.
This results in faster wetting up; geochemical load released sooner and reporting as seepage sooner.
Monitoring to pick up issue.
8) Failure to meet water quality commitments (short term), due to inadequate construction
QA/QC during construction of existing NOEF foundation, and leading to failing water quality
commitments.
Mitigation measures and/or comments were:
98% of area will be stripped of topsoil to be used as part of cover system.
Some removal of clays; sandier patches boxed out w/ compacted clay and no QA/QC done.
Likelihood of actual impact on SW11?
Timeframe before remedial measures are put in place, paleo-channels location, etc.; next dry season could show impact on surface waters.
Current seepage likely mostly due to PRODs.
Conceptual model has wetting up of perimeter of dumps only at current time.
Nothing done so far to cut off paleo-channels; but, proposed remediation measures are planned and costed/budgeted (consequence costs are for measures beyond what is already planned).
Regulatory: non-compliance with mining plan.
Higher than required
performance for
geochemical loading
from facility
Due to closure cover system
not meeting w ater transport
requirements and further
oxidation products being
developed w ithin the NOEF
Leading to failing w ater quality
commitments
L Mo Mo Mo Mo MaMo-
HMa
Mo-
HL L L Mo-H
Hig
he
st
Ris
k R
ati
ng
Failure Mode
DescriptionEffects and Pathways
Lik
elih
oo
d
Le
ve
l o
f C
on
fid
en
ce
Consequences
En
vir
on
me
nta
l
Imp
act
Co
nse
qu
en
ce
Co
sts
Le
ga
l a
nd
Oth
er
Ob
lig
atio
ns
Co
mm
un
ity a
nd
Sta
ke
ho
lde
rs
Sa
fety
Re
gu
alto
rt
Co
mp
lain
ce
an
d A
pro
va
l
Higher than required
performance for
geochemical loading
from facility
Due to inadequate
construction QA/QC for
EXISTING NOEF foundation
Leading to failing w ater quality
commitments
M Mi Mo Mi Mo MoMo-
HMo
Mo-
HL L M Mo-H
Hig
he
st
Ris
k R
ati
ng
Failure Mode
DescriptionEffects and Pathways
Lik
elih
oo
d
Le
ve
l o
f C
on
fid
en
ce
Consequences
En
vir
on
me
nta
l
Imp
act
Co
nse
qu
en
ce
Co
sts
Le
ga
l a
nd
Oth
er
Ob
lig
atio
ns
Co
mm
un
ity a
nd
Sta
ke
ho
lde
rs
Sa
fety
Re
gu
alto
rt
Co
mp
lain
ce
an
d A
pro
va
l

Glencore McArthur River Mine - Failure Modes and Effects Analysis Workshop Summary Report 28
O’Kane Consultants 1 August 2016 750/36
9) Dynamic geotechnical failure of existing NOEF landform (west side), leading to loss of
functionality of the cover system and loss of gas and water management of the NOEF (short
term and long-term).
Mitigation measures and comments were:
Complete loss of functionality implies gas management, water management, access management are lost.
300m x 100m wide = 30,000m2 = 3ha x $400,000/ha = $1.2M
2m deep: 60,000m3 of material.
Potential for multiple fatalities.
10) Dynamic geotechnical failure of existing NOEF landform (whole), leading to loss of
functionality of the cover system and loss of gas and water management of the NOEF (short
term and long-term).
Mitigation measures and comments were:
Complete loss of functionality implies gas management, water management, access management are lost.
500m x 100m wide = 50,000m2 = 5ha x $400,000/ha = $2M
2m deep: 100,000m3
Potential for multiple fatalities.
Dynamic geotechnical
failure of existing NOEF
landform ( West side)
Leading to loss of functionality
of the cover system and loss
of gas and w ater management
of the NOEF
NL Mi L Mi L Ma Mo Ma Mo CMo-
HH Mo-H
Hig
he
st
Ris
k R
ati
ng
Failure Mode
DescriptionEffects and Pathways
Lik
elih
oo
d
Le
ve
l o
f C
on
fid
en
ce
Consequences
En
vir
on
me
nta
l
Imp
act
Co
nse
qu
en
ce
Co
sts
Le
ga
l a
nd
Oth
er
Ob
lig
atio
ns
Co
mm
un
ity a
nd
Sta
ke
ho
lde
rs
Sa
fety
Re
gu
alto
rt
Co
mp
lain
ce
an
d A
pro
va
l
Dynamic geotechnical
failure of NOEF
landform (w hole)
Leading to loss of functionality
of the cover system and loss
of gas and w ater management
of the NOEF
NL Mi L Mi L Ma Mo Ma Mo CMo-
HH Mo-H
Hig
he
st
Ris
k R
ati
ng
Failure Mode
DescriptionEffects and Pathways
Lik
elih
oo
d
Le
ve
l o
f C
on
fid
en
ce
Consequences
En
vir
on
me
nta
l
Imp
act
Co
nse
qu
en
ce
Co
sts
Le
ga
l a
nd
Oth
er
Ob
lig
atio
ns
Co
mm
un
ity a
nd
Sta
ke
ho
lde
rs
Sa
fety
Re
gu
alto
rt
Co
mp
lain
ce
an
d A
pro
va
l

Glencore McArthur River Mine - Failure Modes and Effects Analysis Workshop Summary Report 29
O’Kane Consultants 1 August 2016 750/36
5.3 Open Cut Specific Key Failure Modes, Mitigation Measures, and Commentary
Open cut specific key failure modes, mitigation measures, and commentary as identified during
the FMEA workshop are as follows.
1) Pit lake water quality does not reach requirements, leading to inability to relinquish site.
Mitigation measures and comments were:
Refers to adaptive management phase, can't get to Case #5 (open cut as a backwater flood after breaching downstream open cut levee) due to water quality; in pit treatment (passive and active), not effective.
After adaptive management period: unable to reach acceptable WQ.
Would revert to Case #6 (open cut as a groundwater sink; isolated) if this happens to provide capacity for water retention, which would increase the cost of water treatment.
5.4 Other Failure Modes, Mitigation Measures, and Commentary
Risk rankings for all of the site-specific failure modes identified during the FMEA workshop are
provided in Appendix B. In general, these failure modes resulted in a low or medium level risk
ranking, and hence are not reported in the main body of this report. However, mitigation
measures, commentary, and updates to the conceptual model(s) for domains are utilised, as
appropriate, within the body of the report, and included in Appendix B.
Pit lake w ater quality
does not reach
requirements
Leading to inability to
relinquish siteM Mi Mo Mo
Mo-
HMo
Mo-
HMo
Mo-
HL L H Mo-H
Hig
he
st
Ris
k R
ati
ng
Failure Mode
DescriptionEffects and Pathways
Lik
elih
oo
d
Le
ve
l o
f C
on
fid
en
ce
Consequences
En
vir
on
me
nta
l
Imp
act
Co
nse
qu
en
ce
Co
sts
Le
ga
l a
nd
Oth
er
Ob
lig
atio
ns
Co
mm
un
ity a
nd
Sta
ke
ho
lde
rs
Sa
fety
Re
gu
alto
rt
Co
mp
lain
ce
an
d A
pro
va
l

Glencore McArthur River Mine - Failure Modes and Effects Analysis Workshop Summary Report 30
O’Kane Consultants 1 August 2016 750/36
5.5 Further Work Identified
The FMEA process identified additional studies, or work, that was required to address risk and
issues that arose during the assessment. Details of these are provided in the FMEA worksheets,
located in Appendix B. Following, are a summary of these studies (work).
Development of a work scope of assessment of the existing and EIS expansion NOEF
landform in terms of evaluating gas transport, and therefore generation of oxidation
products as a function of dump lift height and alternative methods for managing diffusion
and advection of gas.
Develop a design, with specifications, for a cover, or “blanket” for managing advection of
gas, as per the above.
Conduct a preliminary seepage estimate of the NOEF.
Conduct a preliminary cover system alternatives assessment in regards to cover system
type, net percolation rates, oxygen ingress rates, and related costs.
Interpret the in situ temperature and oxygen conditions from monitoring of the existing
NOEF.
Develop a preliminary NOEF waste placement design and schedule.
Look at opportunities for placing instrumentation within LG 6-8 back filling regions within
the NOEF.
Conduct NOEF density tests.
Confirm LS-NAF thickness for the cover system growth medium layer such that
appropriate saturation conditions are maintained with an underlying compacted clay layer
to provide the required level of gas management.
Conduct geotechnical stability modelling on the NEOF design including clay layers.
Complete geotechnical investigations around stability of using alluvials.
Evaluate the differences in cover system performance, in terms of runoff and net
percolation rates, for the plateau area and batter slopes of the NOEF.
Identify restricted work areas parallel to the highway.

Appendix A December 2015 MRM Rehabilitation Objectives

www.mcarthurrivermine.com.au | [email protected] | 1800 211 573 | PO Box 36821 Winnellie NT 0821
Mine Closure and Rehabilitation December 2015
Mine Closure is an integral part of all mining operations and having a plan serves as a road map to direct, refine and implement closure at the end of the mine’s economic life. This ensures that the integrity of the environment is sustained after mining operations have ceased.
The closure objective for the McArthur River Mine, in line with past views expressed during stakeholder consultations, is to return as much of the project area as practical to pre-‐‑mining land uses including:
• Low intensity cattle grazing; and
• Traditional cultural uses
This will be achieved by rehabilitating the disturbed areas to environmentally sustainable conditions consistent with the above stated land uses. Sensitive ecosystems, such as those associated with site waterways and adjacent riparian areas are to be reinstated or maintained in as close to original or undisturbed condition as possible. Areas where full rehabilitation consistent with the above land uses will not be practical will be managed appropriately as exclusion zones.
The McArthur River Station is 8,000 km2 in area and the total mining lease area is 122.04 km2. The area disturbed by current operations is approximately 5.05 km2 (505 ha). The total proposed disturbance over the life of the mine is 5.21 km2 (521 ha), constituting less than 5% of the total mining lease area. This represents less than 0.1% of the McArthur River Station area, so the return of the mining impacted area to grazing will
be insignificant in terms of the contribution to local grazing industry.
The initial post-‐‑mining objective will be to stabilise disturbed areas and make all areas safe. Once this has occurred, the focus will be on the promotion of ecological values and the enhancement of local economically sustainable industries such as grazing. The development of post-‐‑mining land use strategies will continue over the life of the mine in consultation with the government and relevant stakeholders.
The environmental values that have been considered in relation to closure of MRM include:
• The health and well-‐‑being of people;
• The diversity of ecological processes and associated ecosystems;
• Maintaining soil resources and agricultural land capability;
• Maintaining water quality and flows in waterways; and
• The creation of safe, stable, non-‐‑polluting and sustainable landforms.
Specific objectives for closure are outlined below:
Landforms • Construction of landforms that are
compatible with local surrounding landscape.
• Construction of stable landforms that minimise erosion and ensures long term

www.mcarthurrivermine.com.au | [email protected] | 1800 211 573 | PO Box 36821 Winnellie NT 0821
performance
• Landform will host suitable native vegetation that will maintain ecological functions and values
• The post mining landscape will be left in a condition safe for humans and animals
Revegetation • Vegetation in rehabilitated areas will be
resilient and have similar environmental values as surrounding natural ecosystems.
Water • Maintain the quality and quantity of surface
water such that existing environmental values and ecosystems are maintained.
• Maintain the quality and quantity of ground water such that existing environmental values and ecosystems are maintained.
• Continuing active intervention should not be required for site water management.
• All potential Acid and Metalliferous Drainage generating materials are appropriately contained in a suitably designed facility to minimise contamination of surface and groundwater
• The water quality in the post mining final void will be impacted to the minimal amount practicable
Fauna • Rehabilitated areas will provide appropriate
habitat for fauna and have comparable environmental values as surrounding natural ecosystems.
• Fauna utilisation, abundance and diversity are appropriate given the specified post-‐‑mining land use.
• Metal levels in fauna comparable to regional background levels.
Infrastructure and non-‐‑mining waste • No infrastructure left on site unless agreed to
by stakeholders.
• Transfer ownership of beneficial infrastructure for stakeholder gain.
• Minimise land contamination and practically remediate any contaminated soils.
• Ensure that wastes are securely contained in a manner that prevents adverse environmental impacts
Legacy areas • Where necessary (for example erosion control
on landforms), access to legacy areas will be restricted.
Cultural Heritage and Community • The condition of heritage and archaeological
sites will meet the requirements of relevant authorities.
• Access to current sites of significance within the mine area will be retained for the appropriate local Traditional Owners to meet traditional obligations.
• The integrity and accessibility of the adjacent and downstream land and waterways will be retained to enable ongoing gathering and hunting for Traditional Owners.
• Minimise the impact of closure on the local community.
In order to successfully rehabilitate and complete closure objectives MRM align specific criteria against these objectives and then track these using specific tools. These tools may be in the form of monitoring data, assessment reports, inspections or surveys.
Closure planning at MRM is not a static process and as activities and associated risks on site change so to does the requirements for closure. Every year MRM updates rehabilitation and closure activities within the site Mining Management Plan however the most recent standalone Closure Plan was submitted in the Phase Three project in 2012.
Currently MRM are in the process of collating an updated Closure Plan which reflects current activities and approvals until the finalisation and acceptance of the current Overburden Management Project Environmental Impact Assessment.
Over the coming months local stakeholders will be consulted in forums such as the Community Reference Group meeting, site meetings and tours and specific discussions with Traditional Owners. Government departments will also play an integral role in the consultation and assessment process.
For more information contact: Rebecca Gentle Senior Community Relations Adviser Phone: 08 8975 8216

Appendix B
FMEA Worksheets

Table B.1: Overarching Concerns FMEA Worksheet (includes short-term (and operational in S-T), and long-term evaluations as noted)
Failure Mode Description
Effects and Pathways L
ikelih
oo
d
Consequences
Le
vel
of
Co
nfi
den
ce
Hig
he
st
Ris
k R
ati
ng
Comments/ Mitigation Environm
enta
l
Imp
act
Consequence C
osts
Regula
tory
Com
plia
nce a
nd
Appro
val
Com
munity a
nd
Sta
kehold
ers
Safe
ty
Failure to achieve accepted groundwater quality requirements (short-term)
Leading to inability to relinquish site
L
L
L
L
L
L
L
L
L
L
L
M
L
Base case design for hydrogeology makes water quality issues mainly with surface water.
The NOEF drives water to surface and may be main issue.
NOEF g/water seepage contained close to NOEF and managed.
TSF gone.
Open pit managed.
Failure to achieve accepted surface water quality requirements (long term)
Leading to inability to relinquish site
E
L
Mo
L
Mo
L
Mo
L
Mo
L
Mo
M
Mo
NOEF is at higher risk of not being able to be relinquished.
Ongoing maintenance costs in the long term (100-1000yr) and included into NPV --> not much.
More stringent water quality requirements (short term)
Leading to inability to relinquish site
M
L
L
Mo
Mo
-
H
Mo
Mo
-
H
L
L
L
L
M
Mo
-
H
Treatment system needs to be upgraded to meet new requirements.
Cost: Low end of moderate scale.
Potential to change cut off between LS-NAF and MS-NAF.
More stringent water quality requirements (long term)
Leading to inability to relinquish site
L
L
L
L
L
L
L
L
L
L
L
M
L
Sulphates goes from 341ppm to 125ppm
Pit lake water quality does not reach requirements
Leading to inability to relinquish site
M
Mi
Mo
Mo
Mo
-H
Mo
Mo
-H
Mo
Mo
-H
L
L
H
Mo
-H
Refers to adaptive management phase, can't get to Case #5 (open cut as a backwater flood after breaching downstream open cut levee) due to water quality; in pit treatment (passive and active), not effective.
After adaptive management period: unable to reach acceptable WQ.
Would revert to Case #6 (open cut as a groundwater sink; isolated) if this happens to provide capacity for water retention, which would increase the cost of water treatment.
Cumulative site wide water balance and water quality exceeds compliance
Leading to extension of the adaptive management
period
L
Mo
Mo
Mo
Mo
Mi
L
L
L
L
L
M
Mo
Including brine streams from various WTPs.
Additional modelling to be done
additional treatment may be required
Cumulative footprint for rehabilitation is not properly defined
Leading to further rehabilitation requirements than planned on site and extension of AM period
L
L
L
Mi
L
Mi
L
Mi
L
L
L
H
L
A re-vegetation plan is in place.
Failure of plan approved during the EIS to be properly implemented during operations
Leading to breach of EIS commitments, delays in
MMP approval
NL
L
L
Mi
L
Ma
Mo
Mo
L
L
L
H
Mo
Major non-conformance
No cessation of activities expected.
Severe fire event across the site (short term)
Leading to destruction of rehabilitated areas
M
Mi
Mo
Mi
Mo
Mo
Mo
-H
Mi
Mo
Mi
Mo
M
Mo
-H Asset in place to protect. People on site. Monitoring ongoing. Fire protection, burn offs,
fire breaks, etc. ongoing.
Leading to destruction of infrastructure, access,
L
Mo
Mo
Mi
L
Mo
Mo
Mo
Mo
L
L
H
Mo Asset in place to protect. People on site. Monitoring ongoing. Fire protection, burn offs,
fire breaks, etc. ongoing.

Failure Mode Description
Effects and Pathways L
ikelih
oo
d
Consequences
Le
vel
of
Co
nfi
den
ce
Hig
he
st
Ris
k R
ati
ng
Comments/ Mitigation Environm
enta
l
Imp
act
Consequence C
osts
Regula
tory
Com
plia
nce a
nd
Appro
val
Com
munity a
nd
Sta
kehold
ers
Safe
ty
Severe fire event across the site (long term)
Leading to destruction of infrastructure, access
M
Mi
Mo
Mi
Mo
Mi
Mo
Mi
Mo
L
L
H
Mo
Site wide flood as a result of McArthur River overtopping the levee (short-term)
Leading to widespread erosion, overwhelming of water treatment facilities, disruption of operations,
lack of access
M
Mi
Mo
Mo
Mo
-H
Mo
Mo
-H
Mi
Mo
L
L
H
Mo
-H
Mitigation: insurance.
With higher levee level around power plant, reduced risk.
Power Plant: external contractor responsibility.
Site wide flood as a result of McArthur River overtopping the levee (long term)
Leading to widespread erosion, overwhelming of water treatment facilities, disruption of operations,
lack of access E
L
Mo
Mi
Mo
-H
Mi
Mo
-H
Mi
Mo
-H
L
Mo
H
Mo
-H
Spread of invasive/feral species
Leading to monoculture, reveg objectives not met
M
L
L
Mi
Mo
Mi
Mo
L
L
L
L
H
Mo
Weed management in place, people on site. Rangers monitoring.
Anthropogenic activities, vandalism, sabotage
Leading to failure of rehabilitation and closure
objectives
NL
L
L
L
L
L
L
Mi
L
L
L
H
L
Failure to provide habitat and habitat connectivity for fauna
Leading to failure to establish desired
ecosystem regime
M
Mo
Mo
-H
Mi
Mo
Mo
Mo
-H
Mi
Mo
L
L
H
Mo
-H Small pockets for breeding and foraging, greater importance on site at wide.
Inappropriate land use Leading to failure to meet
closure objectives NL
Mo
L
Mi
L
Mi
L
L
L
L
L
H
L
Failure to protect Indigenous cultural heritage places/features
Leading to failure to meet closure objectives N
L
L
L
L
L
Mo
L
Mo
L
L
L
H
L
END OF TABLE B.1

Table B.2: Open Cut Short Term FMEA Worksheet
Failure Mode Description
Effects and Pathways L
ikelih
oo
d
Consequences
Le
vel
of
Co
nfi
den
ce
Hig
he
st
Ris
k R
ati
ng
Comments / Mitigation Environm
enta
l
Imp
act
Consequence C
osts
Regula
tory
Com
plia
nce
and A
ppro
val
Com
munity a
nd
Sta
kehold
ers
Safe
ty
Inadequate characterization and
prediction of groundwater inflow and
water quality (short term)
Leading to incorrect pit lake water quality predictions
M
Mi
Mo
Mo
Mo
-H
Mo
Mo
-H
Mo
Mo
-H
L
L
M
Mo
-H
If pit water quality predictions found to be "off", possibility for in pit water treatment, either passive or active.
Current uncertainties with pit inflows. Period of time during adaptive management period to sort uncertainties and develop mitigation measures.
During isolated phase of pit rehab. Pit to stay isolated until pit water quality is acceptable and understood.
In order to have an impact on receiving environment: pit is full, flood happens, release of contaminated water
Moderate confidence from recognizing uncertainties and upcoming work to raise confidence
Inadequate characterization and
prediction of groundwater inflow and
water quality (long term)
Leading to incorrect pit lake water quality predictions N
L
Mo
L
Mo
L
Ma
Mo
Mo
L
L
L
H
Mo
Flow through system in place. Long term GW quality prediction is worse than expected.
If pit water quality is unacceptable: pit to return to isolated function with levee building, monitoring, treatment, etc. Channel needs to be maintained to be able to handle flood flow.
Multiple agencies involved and non-compliance of environmental approvals.
Failure of the base case to meet expected
pit lake functionality
leading to implementation of Case 7 (IPD over tailings to surface and terrestrial cover
system)
NL
Mi
L
C
Mo
-H
Ma
Mo
Ma
Mo
C
Mo
-H
H
Mo
-H
Monitoring in place, multitude of proven in-pit lake treatment possibilities before implementing Case 7. Revert back to Case 2 (isolated pit) before reverting to Case 7.
Would require disturbance of NOEF landform and cover system in order to complete Case 7.
Costs to backfill in excess of $500M-$1B
Multiple agencies, non-conformance with approvals.
Safety issues with implementation of pit WR backfill over deposited tailings.
Geotechnical failure of the pit wall once pit lake is at final level
(operational)
Leading to loss of functionality of levee on West side and failure to meet downstream water
quality objectives
L
Mo
Mo
Mo
Mo
Ma
Mo
-H
Ma
Mo
-H
L
L
L
Mo
-H
Clay banding under the levee. May become unstable with rising water table from pit filling. Geotechnical analysis to evaluate risk of clay plane impacting levee 100m from pit crest. (plane @ 20deg, tailings backfill to 175m of surface)
Need for buttressing pit wall to prevent failure, added to Base Case. Potential need for LsNAF for buttress above water level. MsNAF under water level.
Air strip prevents relocating the levee at this time. More geotechnical study/investigation required to confirm Contained in pit.
$10-12M to rebuild levee in new location No cost to build buttress in pit (included in SOEF waste relocation)
Buttress may lead to disruption of water column?, refer to Ridgeway mine, SC.
Slow failure, safety measure, exclusion zones in place prior to failure.
Geotechnical failure of the pit wall once pit lake is at final level
(short-term)
Leading to loss of functionality of levee on West side and failure to meet downstream water
quality objectives
NL
Mo
L
Mo
L
Ma
Mo
Ma
Mo
L
L
H
Mo
If failure occurs, happens soon after filling of pit water, mitigation measures are in place.
Requirement to build the levee ($20M)

Failure Mode Description
Effects and Pathways L
ikelih
oo
d
Consequences
Le
vel
of
Co
nfi
den
ce
Hig
he
st
Ris
k R
ati
ng
Comments / Mitigation Environm
enta
l
Imp
act
Consequence C
osts
Regula
tory
Com
plia
nce
and A
ppro
val
Com
munity a
nd
Sta
kehold
ers
Safe
ty
Geotechnical failure of the pit wall once pit lake is at final level
(long term)
Leading to loss of functionality of levee on West side and failure to meet downstream water
quality objectives
NL
Mi
L
Mo
L
Ma
Mo
Mi
L
L
L
H
Mo
Failure mode more likely early on, unlikely in the long term.
Not rebuilding the levee.
Drew need to provide levee break location to step back from potential failure zone (200m offset). Base case: levee break to be set back 200m to the East of potential failure zone in the pit
Suspended solids issue
Effect on downstream effects related to environmental consequence.
Geotechnical failure of the pit wall once pit lake is at final level
(long term)
Leading to incorrect location of McArthur River inflow and
levee break location L
L
L
Mi
L
L
L
L
L
L
L
H
L
Base Case: Moving inlet to pit further East away potential slip plane.
Dramatic reduction of base flow in diversion, need to reinstate level control (levee) in order to re-establish base flow in diversion
Inability to complete filling of pit within 5-
year timeframe in one dry season
Leading to change in chemistry within the pit lake and inability to meet water
quality criteria
L
L
L
L
L
L
L
L
L
L
L
M
L
Base Case: Pumps used to transfer water from McArthur River to pit. Must be of sufficient capacity to transfer water over limited period of time when river level is sufficient. Need 40M m3 per year over 2 months.
If filling period is longer: cost of pump rental increases Could be done in <5yrs if wet year.
May be able to design a weir system to control inflow so that inflow is only when McArthur River is above a certain level.
Upset of water treatment system
(operational)
Leading to change in chemistry within the pit lake and inability to meet water
quality criteria
M
Mi
Mo
Mi
Mo
Mo
Mo
-H
Mo
Mo
-H
L
L
H
Mo
-H
Water treatment of TSF pore water, seepage treatment, upset leads to higher sulphates. Relying on dilution to meet criteria. Water treatment fix in a 6-12 month span.
Ongoing monitoring of water treatment plant performance. Variation in incoming water quality causes imbalance of treatment.
Upset of water treatment system
(short-term)
Leading to change in chemistry within the pit lake and inability to meet water
quality criteria
L
Mi
L
Mi
L
Mo
Mo
Mo
Mo
L
L
H
Mo
Better understanding of water quality parameters, WQ variations less likely
Upset of water treatment system
(long-term)
Leading to change in chemistry within the pit lake and inability to meet water
quality criteria
NL
Mi
L
Mi
L
Mo
L
Mo
L
L
L
H
L
Only NOEF seepage treatment in the LT, smaller flows and loadings.
Tailings pore water chemistry shows higher
concentration than used for design
Leading to pit lake water quality not reaching steady
state within anticipated timeframe
M
L L Mi
Mo
Mi
Mo
L L L L L Mo
Target is reached within longer timeframe than anticipated, within adaptive management phase. Adaptive management monitoring timeframe may need to differ for different domains
Study to be done for pore water quality prediction, release rate, consolidation analysis, etc.
If all else fails and WT is unsuccessful, Reprocessing of tailings is possible, removing contaminants and adding alkalinity, potentially net-neutral cost vs. extensive WT of in pit water.
END OF TABLE B.2

Table B.3: NOEF Short Term FMEA Worksheet
Failure Mode Description
Effects and Pathways
Lik
elih
oo
d
Consequences
Le
vel
of
co
nfi
de
nce
Hig
he
st
Ris
k R
ati
ng
Comments / Mitigation
Environm
enta
l Im
pact
Consequence C
osts
Regula
tory
Com
plia
nce
and A
ppro
val
Com
munity a
nd
Sta
kehold
ers
Safe
ty
Failure to meet water quality commitments
(short term)
Due to lack of understanding for hydrogeology around the
NOEF
M
Mo
Mo
-H
Mo
Mo
-H
Mo
Mo
-H
Mo
Mo
-H
L
L
M
Mo
-H
Mitigation: groundwater model, mixing zones and water quality modelling downstream.
Modelling to determine trigger value at toe of the NOEF, and then monitoring at toe to capture issue prior to dispersion of plume; mitigation methods to be evaluated.
If issue caught early (from monitoring and modelling), cost of mitigation measures can be reduced.
If water is collected, can be sent to water treatment plant.
If PRODs are still in use, water goes back to PRODs; can be pumped to open cut depending on water quality.
Substantial modelling to be completed and an updated hydrogeological investigation is planned after geological and geophysical compilation has been completed, building on conceptual model.
Monitoring to catch the elevated values, adaptive management phase, monitoring within the mixing zone and at toe.
Remediation measures put in place within short time frame.
The potential for clean-up would occur in less than 5 years.
Post-operations (35 years), does a contaminated plume go to the open cut? Barney Creek? Potential to block off Barney Creek during dry season, catch seepage until wet season.
Risk considered during operations: likelihood is high and mitigation measures are currently being put in place.
Risk considered in the short term timeframe (100 years): likelihood is moderate, mitigation measures can be put in place within a short time frame.
Failure to meet water quality commitments
(short term)
Due to higher seepage rates from WPROD, SEPROD and
SPROD than expected
L
Mo
Mo
Mi
L
Mo
Mo
Mo
Mo
L
L
H
Mo
Mitigation measure put in place, lining of the PRODS, capture and re-pumping into PRODs, treatment.
Already happening at site and mitigated, therefore likelihood of further higher seepage rates than currently anticipated is low.
Failure to meet water quality commitments
(short term)
Due to incorrect assessment for timing (wetting up takes longer) and flux of source loading from the NOEF
L
L
L
L
L
L
L
L
L
L
L
H
L
Wetting up of dump longer, out of adaptive management period.
Can't trend.
Control already in place, longer period for presence and monitoring, management of site.

Failure Mode Description
Effects and Pathways
Lik
elih
oo
d
Consequences
Le
vel
of
co
nfi
de
nce
Hig
he
st
Ris
k R
ati
ng
Comments / Mitigation
Environm
enta
l Im
pact
Consequence C
osts
Regula
tory
Com
plia
nce
and A
ppro
val
Com
munity a
nd
Sta
kehold
ers
Safe
ty
Failure to meet water quality commitments
(short term)
Due to incorrect assessment for timing (wetting up takes sooner) and flux of source
loading from the NOEF
M
Mi
Mo
L
L
Mi
Mo
Mo
Mo
-H
L
L
M
Mo
-H
More detailed wetting up analysis and modelling (preferential flows, etc.) will be conducted as part of the EIS project.
Temporary covers going on, additional material on top of NOEF (next 2-5 years), reduces additional water going in, relatively short timeframe, limits excessive wetting up occurring, drain down period should be shortened; interim covers on PAF cells every year.
Current understanding is that the existing NOEF is not wetted up as yet, and then wetting up only takes 10 years instead of 30-40 years (as predicted based on current understanding); managed with measures in place.
Consideration given to interim cover for eastern side similar to western side of existing NOEF.
Higher than required performance for
geochemical loading from facility
Due to underestimation of source loading from the
NOEF Leading to failing water
quality commitments
M
Mo
Mo
-H
Mo
Mo
-H
Mo
Mo
-H
Mo
Mo
-H
L
L
M
Mo
-H
Increased capacity of water treatment system to handle additional load (not additional volume).
Preliminary estimate: 10-20k mg/l sulfate, failure is seeing 30-40k mg/L.
Uncertainties relating to the spatial variability of loading source within the NOEF.
Current thought process is that interpretation of MNAF, PAF and RPAF will not vary and/or evolve to a great extent, resulting in minimal impact to the load source understanding.
Likely an overestimation of the volume of PAF within the existing NOEF facility.
Understanding the nature of the pyrite and the reaction rate still evolving.
Determination of reaction rates are being evaluated from kinetic testing, as well as interpretation of internal NOEF field data, which increases confidence with estimates.
Breaking down of material also impacts reactivity (free surface for reaction), split on pyritic planes.
Dump records for lifts and timing are very good, which allows for appropriately conceptualisation of the dump and model the wetting up of the dump.
Actual data and monitoring from inside the dump, data from drilling, allows for calibrating of the models; field data is available for model calibration.
Not acid seepage, circum-neutral seepage with sulfate and metal concentrations; pH is neutral.
For a seepage rate of 2mm/day, and a 140m high NOEF footprint, this results in 3.65M m
3/yr for treatment (based on 2mm/day) --> 0.01M m
3/day
McArthur River flow (in the wet): 25,000 ML/day (25M m3/day)
McArthur River flow (in the dry): 1M m3/day (10mg/L sulfate) = 10 tonne/day
Increase of an order of magnitude of sulfate concentration in the river for the dry season; for wet season: 2-3x the load.
Higher than required performance for
geochemical loading from facility
Due to underestimation of source loading from the
PRODs Leading to failing water
quality commitments
L
L
L
L
L
L
L
L
L
L
L
H
L
Water quality instead of seepage volume Source of poorer water quality is from NOEF (sulphate issue), higher sulphate concentration from NOEF seepage, PRODs have poorer WQ as a result. Current PROD: 3,000 mg/L, could bump to 30,000 mg/L. Low flow expected. SEPROD: 0.5 ML/day --> 0.5t/day sulphate
Base case includes that all PRODs will be lined as SEPROD.

Failure Mode Description
Effects and Pathways
Lik
elih
oo
d
Consequences
Le
vel
of
co
nfi
de
nce
Hig
he
st
Ris
k R
ati
ng
Comments / Mitigation
Environm
enta
l Im
pact
Consequence C
osts
Regula
tory
Com
plia
nce
and A
ppro
val
Com
munity a
nd
Sta
kehold
ers
Safe
ty
Higher than required performance for
geochemical loading from facility
Due to lack of understanding for hydrology around the
NOEF Leading to failing water
quality commitments
NL
Mo
L
Mi
L
Mi
L
Mo
L
L
L
H
L
Managed by current water management infrastructure
May Lead to increasing capacity for surface water storage
The synthetic (SILO) dataset uses 715mm annual rainfall, 30yr site data shows 800mm
Higher than required performance for
geochemical loading from facility
Due to rainfall climate database not representing
future conditions Leading to failing water
quality commitments
L
Mi
L
L
L
Mi
L
L
L
L
L
H
L
May Lead to increasing capacity for surface water storage
The synthetic (SILO) dataset uses 715mm annual rainfall, 30yr site data shows 800mm
Incorporating climate change scenarios for the site (RCP4.5, RCP6, etc.). Define and agree on a climate change scenario. Challenge in the region is increased climate variability from CC. Effect limited to cover system and hydrology.
MR climate goes drier, basal flow is therefore lower for longer periods.
Higher than required performance for
geochemical loading from facility
Due to failure of surface water management system
within/around the NOEF Leading to failing water
quality commitments
M
Mi
Mo
L
L
Mo
Mo
-H
Mo
Mo
-H
L
L
H
Mo
-H
Events is described as resulting from a shorter period at high flow, in combination of with a high load, that results in a spill of contaminated water.
For example, to reach 200-250t/day sulfate, sulfate concentration would need to go up to 100mg/L for a short period, potential to mix with high sediment load from event, requiring minor repairs to surface water management system.
Higher than required performance for
geochemical loading from facility
Due to incorrect prediction of the partitioning of basal and
toe seepage Leading to failing water
quality commitments
L
Mo
Mo
Mo
Mo
Mo
Mo
Mo
Mo
L
L
H
Mo
Current understanding is that all seepage has quick pathway to shallow groundwater and surface water, most seepage goes to toe instead of basal. In effect, more seepage to basal than toe results in Longer time for the problem to appear in monitoring. Monitoring bores pick up basal seepage contamination. Impact on surface water quality is low.
Consequence the same as misunderstanding of hydrogeology if mitigation is required, costly solutions.
Higher than required performance for
geochemical loading from facility
Due to failure of flood protection for McArthur River
Leading to failing water quality commitments
L
Mi
L
L
L
Mi
L
Mi
L
L
L
L
L
Flood ingress into the base of NOEF. MR backs up and overflows into BC. Levees. Cover system built as a flood prevention system. Immediate term: levees for 1:20yr. Future levees (4 year timeframe): 1:100 yrs.
Flood event leads to a minor increase in loads. Dealt with by retaining water following flood. High dilution during event. Weeks for flooded base to express seepage.
cost to fix levee
expected loads need to be integrated into the surface water management model
Flood water levels are maintained behind
levee for 6-12 month period
Leading to excessive settlement and potential
failure of NOEF embankment
L
L
L
L
L
L
L
L
L
L
L
H
L
Worst case is sump in CW, haul road then going up to PAF cell. Undermine CCL under PAF cell. Maximum 10m failure. Can get significant settlement under fully saturated conditions, with truck compacted conditions.
PAF cell is offset from crest.

Failure Mode Description
Effects and Pathways
Lik
elih
oo
d
Consequences
Le
vel
of
co
nfi
de
nce
Hig
he
st
Ris
k R
ati
ng
Comments / Mitigation
Environm
enta
l Im
pact
Consequence C
osts
Regula
tory
Com
plia
nce
and A
ppro
val
Com
munity a
nd
Sta
kehold
ers
Safe
ty
Inability to pump high flow rates after flood
event (short term, 30-100 yrs)
As a result of poor water quality in excess of design
H
L
Mo
Mo
Mo
-H
Mi
Mo
L
Mo
L
Mo
L
Mo
-H
Water trapped behind the levee, starts as clean water trapped behind levee, then potentially mixes with NOEF pore-water.
1:20yr levee for next 4 years.
Capacity to pump water out if not contaminated?
Authorization to release trapped water.
High pumping rate of trapped water in short term, gets discharged license as water quality is good, monitor water quality during pumping.
Then, smaller volumes from dump seepage to be pumped to PRODs.
Need to model what the water quality would be.
Water to go to open cut if pumping is insufficient
Likely a month of water sitting behind levee that would result in the need to pump water into open cut as water quality is unlikely to be impacted in the short timeframe.
Inability to pump high flow rates after flood
event (short term, 0-30yrs)
As a result of poor water quality in excess of design
M
L
L
Ma
H
Mi
Mo
L
L
L
L
L
H
Water trapped behind the levee, starts as clean water trapped behind levee, then potentially mixes with NOEF pore-water.
1:20yr levee for next 4 years.
Capacity to pump water out if not contaminated?
Authorization to release trapped water.
High pumping rate of trapped water in short term, gets discharged license as water quality is good, monitor water quality during pumping.
Then, smaller volumes from dump seepage to be pumped to PRODs.
Need to model what the water quality would be.
Water to go to open cut if pumping is insufficient
Likely a month of water sitting behind levee that would result in the need to pump water into open cut as water quality is unlikely to be impacted in the short timeframe.
Rapid pumping after flood event
Leading to rapid draw down resulting in instability of the
NOEF, shallow failure resulting in deep-seated
failure
L
Mi
L
L
L
L
L
L
L
L
L
M
L
Pumping over days would lead to rapid draw down, water table would have established within the NOEF.
Would take weeks for water to seep out.
100 yr flood, 8m high, 8m to be pumped in 14 days, 0.50m/day.
Low likelihood as water doesn’t have time to seep into the dump during the flood event.
Flood water levels are maintained behind
levee for 6-12 month period
Leading to excessive settlement and potential
failure of NOEF embankment
L
L
L
L
L
L
L
L
L
L
L
H
L
Worst case is sump in CW, haul road then going up to PAF cell. Undermine CCL under PAF cell.
Maximum 10m failure.
Can get significant settlement under fully saturated conditions, with truck compacted conditions.
PAF cell is offset from crest. 1:100yr levee
Rapid pumping after flood event
Leading to rapid draw down resulting in instability of the
NOEF, shallow failure resulting in deep-seated
failure
M
Mi
Mo
L
L
L
L
L
L
L
L
M
Mo
Pumping over days would lead to rapid draw down, water table would have established within the NOEF.
Would take weeks for water to seep out. 100 yr flood, 8m high, 8m to be pumped in 14 days, 0.50m/day.
Low likelihood as water doesn’t have time to seep into the dump during the flood event. 1:100 yr levee

Failure Mode Description
Effects and Pathways
Lik
elih
oo
d
Consequences
Le
vel
of
co
nfi
de
nce
Hig
he
st
Ris
k R
ati
ng
Comments / Mitigation
Environm
enta
l Im
pact
Consequence C
osts
Regula
tory
Com
plia
nce
and A
ppro
val
Com
munity a
nd
Sta
kehold
ers
Safe
ty
Higher than required performance for
geochemical loading from facility
Due to power failure and failure of pumping system for
seepage collection sumps Leading to failing water
quality commitments
NL
L
L
L
L
L
L
L
L
L
L
H
L
Seepage coming from NOEF, impossible to put back in PRODs.
Diesel pumps backup, prioritize
Higher than required performance for
geochemical loading from facility
Due to incorrect operation of water management system
(pumping to incorrect discharge point)
Leading to failing water quality commitments
L
Mi
L
L
L
Mo
Mo
Mo
Mo
L
L
H
Mo
Human error from operator / management. Pumping straight from PROD to river. River testing every 2 weeks
Automation reduces risk
Higher than required performance for
geochemical loading from facility
Due to deeper static geotechnical failure and
exposure of reactive material under the cover system Leading to failing water
quality commitments
NL
Mo
L
Mo
L
Mo
L
Ma
Mo
L
L
M
Mo
40m deep seated instability. Requires rework weekly monitoring of tension cracks, etc.
Stability analysis to be done
Higher than required performance for
geochemical loading from facility
Due to deeper dynamic geotechnical failure and
exposure of reactive material under the cover system Leading to failing water
quality commitments
L
Mo
Mo
Mo
Mo
Mo
Mo
Ma
Mo
-H
L
L
L
Mo
-H
Max design event MDE: 1:1000 yr. instead of 1:500yr (TSF is 1:10,000 yr)
Need to model
Liquefaction is irrelevant for NOEF
Higher than required performance for
geochemical loading from facility
Due to cover system not meeting water requirements
and further oxidation products being developed
within the NOEF Leading to failing water quality
commitments
L
Mo
Mo
Mo
Mo
Ma
Mo
-H
Ma
Mo
-H
L
L
L
Mo
-H
For example, if NP is modelled to be 5%, but is instead 10-15%.
This results in faster wetting up; geochemical load released sooner and reporting as seepage sooner.
Monitoring to pick up issue.

Failure Mode Description
Effects and Pathways
Lik
elih
oo
d
Consequences
Le
vel
of
co
nfi
de
nce
Hig
he
st
Ris
k R
ati
ng
Comments / Mitigation
Environm
enta
l Im
pact
Consequence C
osts
Regula
tory
Com
plia
nce
and A
ppro
val
Com
munity a
nd
Sta
kehold
ers
Safe
ty
Higher than required performance for
geochemical loading from facility
Due to closure cover system not meeting O2 transport requirements and further oxidation products being
developed within the NOEF Leading to failing water
quality commitments
NL
Mo
L
Ma
Mo
Ma
Mo
Ma
Mo
Mo
L
L
Mo
Not from stored acidity products, but from acidity production
Requires cover system to perform as a 1m water cover, requires 80-90% saturation of soil cover.
Corresponds 1mol/m2/yr. Reduction in saturation and VWC not from drainage, rather evapotranspiration, demand for moisture from vegetation has to come from growth medium, not from deeper CCL. Influence of root penetration is spatially restricted, failure relates to global failure of cover system.
Depending on which cover fails, consequences vary (south side being more problematic from presence of historical PAF). 10-15% of dump material is historical PAF.
This considers current dump and planned cover system for the current PAF area of the dump
Acidity production (from O2 ingress), not necessarily acidity mobilization and transport, but, if O2 goes in, water likely goes in as well.
Failure of cover system in the old dump has farther reaching consequences than failure of cover in new dump (due to construction methods in old dump)
Low level of confidence from modelling and field work still to come. Detailed monitoring over next 2-5 yrs to increase that level of confidence
Difficulties with compacting the CCL wet of OMC, potential issues from plasticity of CCL, compaction field trials to be done to understand the challenge, including slope constructability
Costs: monitoring of wet-dry cycling, vegetation progression, modelling of growth medium addressing preferential flows (bimodal k-function and WRC). Modelling taking into account air permeability from evolution of degree of saturation and K as cover system evolves from self-compaction and vegetation influence.
Consequence costs based on 50ha * $200k/ha (increased with NAF material requirements)
Internal temperatures in current dump with advection from east and west side, Tout is 20-40C, Tin is 60-200C. Pulling of O2 from outside toe with T difference, and release of gas (low O2, high CO2) with invert Tdiff. Potential safety issue with gas release. Need to confine gases in defined areas (if required), need to model. Institutional control of gas "pooling" areas. With current monitoring and knowledge, gas release issues are known and monitored, human safety challenges known
Monitor cover over 100yr. Mature vegetation. Cover fixed during the adaptive management period. After 1,000yrs: lower likelihood of cover failure leading to WQ issues
Keeping likelihood Low due to cycling of climate and climate unknowns in the long term.
Adaptive management period is long enough to test success of updated cover strategies. What's to say that 2nd and 3rd iteration won't be unsuccessful as well?
Consequence cost for 100-1000yr period after 100yr of adaptive management should be lower to fix cover system.
Cost of repair: 500ha * $200k --> $100M --> NPV back to $10M (2% of current closure costs)
Additional adaptive management ($10M), under $50M. Dump construction (thin lifts) has a bigger impact on contaminant release than the cover system. So that cover system failure doesn’t have as catastrophic an effect. Commitment to building the dump in order to manage adjective gas transport. Incremental cost of waste placement to manage O2 ingress ($100M) has bigger impact than cover construction. Cover system is not the primary defence against O2 ingress.
Material in cover system will weather and ultimately permeabilities will decrease.

Failure Mode Description
Effects and Pathways
Lik
elih
oo
d
Consequences
Le
vel
of
co
nfi
de
nce
Hig
he
st
Ris
k R
ati
ng
Comments / Mitigation
Environm
enta
l Im
pact
Consequence C
osts
Regula
tory
Com
plia
nce
and A
ppro
val
Com
munity a
nd
Sta
kehold
ers
Safe
ty
Higher than required performance for
geochemical loading from facility
Due to inadequate construction QA/QC for
foundation Leading to failing water
quality commitments
L
Mi
L
Mi
L
Mo
Mo
Mo
Mo
L
L
H
Mo
Upcoming footprint: clear and grubbed, proof rolled, put clay material where rocky materials, test pits to assess K of sandy areas, address issue of preferential pathways (material addition / amendment). Geotechnically suspect areas or unsuitable hydraulic conductivity: amended as required. Clay borrow pits under NOPEF footprint to be designed to drain, cut drain prior to placement of foundation
Limited preferential pathways, waste placed in low lifts, reduces consequences.
QA/QC specification still to be done, but costing, additional time and tasks required for it are planned. Process is in place already and proven on current work on CW expansion.
Higher than required performance for
geochemical loading from facility
Due to inadequate construction QA/QC for
EXISTING NOEF foundation Leading to failing water
quality commitments
M
Mi
Mo
Mi
Mo
Mo
Mo
-H
Mo
Mo
-H
L
L
M
Mo
-H
98% of area will be stripped of topsoil to be used as part of cover system.
Some removal of clays; sandier patches boxed out w/ compacted clay and no QA/QC done.
Likelihood of actual impact on SW11?
Timeframe before remedial measures are put in place, paleo-channels location, etc.; next dry season could show impact on surface waters.
Current seepage likely mostly due to PRODs.
Conceptual model has wetting up of perimeter of dumps only at current time.
Nothing done so far to cut off paleo-channels; but, proposed remediation measures are planned and costed/budgeted (consequence costs are for measures beyond what is already planned).
Regulatory: non-compliance with mining plan.
Higher than required performance for
sediment loading from facility
Due to overflow of the PRODs and/or sediment
traps as a result of a storm event greater than the design
event Leading to failing water
quality commitments
M
L
L
L
L
L
L
L
L
L
L
H
L
During adaptive management period. Major storm event (above design): PRODs overflow. Overflow from sediment dams to happen annually. Overflow from PRODs have 5% exceedance probability.
Likelihood of sediments leading to adverse impact on surface WQ. Spill from sediment dam likely to happen, but consequence is low.
Potential geochemical loading from contaminated sediments.
During operations, soil management would pick up sediments. Sediment traps designed to spill annually, trapping sediments.
Higher than required performance for
sediment loading from facility
Due to inadequate sediment control required for clearing, grubbing and preparation of
NOEF footprint area Leading to failing water
quality commitments
L
L
L
L
L
L
L
L
L
L
L
H
L
98% of area: stripped topsoil. Some removal of clays. Sandier patches boxed out w/ compacted clay. No QA/QC done. Likelihood of actual impact on SW11? Timeframe before remedial measures are put in place, paleochannels location, etc., Next dry season could show impact on surface waters.
Current seepage likely mostly due to PRODs. Conceptual model has wetting up of perimeter of dumps. Nothing done so far to cut off paleochannels. Proposed remediation measures are actually planned and costed/budgeted. Consequence costs for measures beyond what is already planned.
Regulatory: non-compliance with mining plan.

Failure Mode Description
Effects and Pathways
Lik
elih
oo
d
Consequences
Le
vel
of
co
nfi
de
nce
Hig
he
st
Ris
k R
ati
ng
Comments / Mitigation
Environm
enta
l Im
pact
Consequence C
osts
Regula
tory
Com
plia
nce
and A
ppro
val
Com
munity a
nd
Sta
kehold
ers
Safe
ty
Higher than required performance for
sediment loading from facility
Due to erosion from halo cover on South, West and East embankments prior to
EIS approval Leading to failing water
quality commitments
L
L
L
L
L
L
L
L
L
L
L
H
L
Halo to be put in place, cover system NOT in place. Halo eroding. Sediment control in place as designed.
Higher than required performance for
sediment loading from facility
Due to erosion from plateau cover system prior to EIS
approval Leading to failing water
quality commitments L
L
L
L
L
L
L
L
L
L
L
H
L
Plateau interim cover to be put in place, cover system NOT in place. Eroding. Sediment control in place as designed.
Higher than required performance for
sediment loading from facility
Due to erosion of closure cover system on West and
South sides Leading to failing water
quality commitments
L
L
L
L
L
L
L
L
L
L
L
H
L
Adaptive management period. First cover to be built. Active monitoring during operations.
Higher than required performance for
sediment loading from facility
Due to failure of cover system surface water management system
within/around the NOEF Leading to failing water
quality commitments
L
L
L
L
L
L
L
L
L
L
L
M
L
Surface water management system for entire landform, after cover system construction.
Design of surface water management system has evolved since July 2015. Much better idea of design. Potential issues can be addressed during adaptive management period. Adaptation to differential settlement, etc.
Design to be further developed, hence moderate confidence
Higher than required performance for
sediment loading from facility
Due to shallow static geotechnical failure (dump
face) Leading to failing water
quality commitments
NL
Mi
L
Mi
L
Mo
L
Mo
L
Mi
L
H
L
Not likely, TBC with modelling analysis needs to be large enough failure to impact surface channel 300x100m failure: 30,000 m3 + cover: $1-10M
Active areas with inspections, tension cracks at crest, monitor movement
Non-active areas have no personnel (and no inspection)
Higher than required performance for
sediment loading from facility
Due to shallow dynamic geotechnical failure (dump
face) Leading to failing water
quality commitments
NL
Mi
L
Mi
L
Mo
L
Mo
L
C
Mo
-H
M
Mo
-H
Not likely, TBC with modelling analysis needs to be large enough failure to impact surface channel 300x100m failure: 30,000 m3 + cover: $1-10M
No warning prior to seismic event, potential fatalities shop located at toe of embankment
Need to develop dam failure assessment. Dump face into dam, water into creek.
Higher than required performance for
sediment loading from facility
Due to shallow dynamic geotechnical failure (dump
face) on western side leading to Impact on the functionality
of the highway
NL
L
L
Mi
L
Mo
L
Ma
Mo
C
Mo
-H
M
Mo
-H
Not likely, TBC with modelling analysis needs to be large enough failure to impact highway 300x100m failure: 30,000 m3 + cover: $1-10M
No warning prior to seismic event, potential fatalities highway.
Leaving debris on highway, potential MVA.
Need to develop dam failure assessment. Dump face into dam, water into creek.

Failure Mode Description
Effects and Pathways
Lik
elih
oo
d
Consequences
Le
vel
of
co
nfi
de
nce
Hig
he
st
Ris
k R
ati
ng
Comments / Mitigation
Environm
enta
l Im
pact
Consequence C
osts
Regula
tory
Com
plia
nce
and A
ppro
val
Com
munity a
nd
Sta
kehold
ers
Safe
ty
Higher than required performance for
sediment loading from facility
Due to shallow static geotechnical failure (dump
face) blocking a surface conveyance channel
Leading to failing water quality commitments
NL
Mi
L
Mi
L
Mo
L
Mo
L
L
L
H
L
Runoff from cover system is assumed clean
Higher than required performance for
sediment loading from facility
Due to shallow dynamic geotechnical failure (dump
face) blocking a surface conveyance channel
Leading to failing water quality commitments
NL
Mi
L
Mi
L
Mo
L
Mo
L
L
L
H
L
Runoff from cover system is assumed clean potential blockage of bridge crossing (culvert) leading to water on highway. Risk at night
Static geotechnical failure of existing
NOEF landform ( West side)
Leading to loss of functionality of the cover
system and loss of gas and water management of the
NOEF
NL
Mi
L
Mi
L
Ma
Mo
Ma
Mo
L
L
H
Mo
complete loss of functionality implies gas management, water management, access management are lost
300mx100m wide = 30,000m2 = 3ha * $400,000 = $1.2M
Static geotechnical failure of NOEF landform (whole)
Leading to loss of functionality of the cover
system and loss of gas and water management of the
NOEF
NL
Mi
L
Mi
L
Ma
Mo
Ma
Mo
L
L
H
Mo
Complete loss of functionality implies gas management, water management, access management are lost
500mx100m wide = 50,000m2 = 5ha * $400,000 = $2M
Dynamic geotechnical failure of existing
NOEF landform (west side)
Leading to loss of functionality of the cover
system and loss of gas and water management of the
NOEF
NL
Mi
L
Mi
L
Ma
Mo
Ma
Mo
C
Mo
-H
H
Mo
-H
Complete loss of functionality implies gas management, water management, access management are lost.
300m x 100m wide = 30,000m2 = 3ha x $400,000/ha = $1.2M
2m deep: 60,000m3 of material.
Potential for multiple fatalities.
Dynamic geotechnical failure of NOEF landform (whole)
Leading to loss of functionality of the cover
system and loss of gas and water management of the
NOEF
NL
Mi
L
Mi
L
Ma
Mo
Ma
Mo
C
Mo
-H
H
Mo
-H
Complete loss of functionality implies gas management, water management, access management are lost.
500m x 100m wide = 50,000m2 = 5ha x $400,000/ha = $2M
2m deep: 100,000m3
Potential for multiple fatalities.

Failure Mode Description
Effects and Pathways
Lik
elih
oo
d
Consequences
Le
vel
of
co
nfi
de
nce
Hig
he
st
Ris
k R
ati
ng
Comments / Mitigation
Environm
enta
l Im
pact
Consequence C
osts
Regula
tory
Com
plia
nce
and A
ppro
val
Com
munity a
nd
Sta
kehold
ers
Safe
ty
Disruption of cover system surface (existing dump)
Due to differential settlement as a result of differing lift heights within the NOEF
Leading to higher O2 entry than performance
expectation
M
L
L
Mi
Mo
Mi
Mo
L
L
L
L
H
Mo
No accurate surveys of current dump surface to pick up on settlement rates.
Most of primary settlement happens during operations. Not much once cover is in place. Settlement could be as high as 5-6% during construction, 0.5% creep following construction (25cm).
Settlement range even less for areas with 2m lift heights.
If significant water seeping into the material, potential for collapse settlement (material break downs with water) leading to rise in O2 ingress >5mol/m2/yr (to 10-15mol/m2/yr)
If happens after fleet demobilized: $2M to address.
Disruption of cover system surface (final
dump)
Due to differential settlement as a result of differing lift heights within the NOEF
Leading to higher O2 entry than performance
expectation
L
L
L
Mi
L
Mi
L
L
L
L
L
H
L
No accurate surveys of current dump surface to pick up on settlement rates.
Most of primary settlement happens during operations. Not much once cover is in place. Settlement could be as high as 5-6% during construction, 0.5% creep following construction (25cm).
Settlement range even less for areas with 2m lift heights.
If significant water seeping into the material, potential for collapse settlement (material break downs with water) leading to rise in O2 ingress >5mol/m2/yr (to 10-15mol/m2/yr) if happens after fleet demobilized: $2M to address.
Disruption of cover system surface (existing dump)
Due to differential settlement as a result of differing lift heights within the NOEF
Leading to higher water entry than performance
expectation
M
L
L
Mi
Mo
L
L
L
L
L
L
H
Mo
No accurate surveys of current dump surface to pick up on settlement rates.
Most of primary settlement happens during operations. Not much once cover is in place. Settlement could be as high as 5-6% during construction, 0.5% creep following construction (25cm).
Settlement range even less for areas with 2m lift heights.
If significant water seeping into the material, potential for collapse settlement (material break downs with water) leading to rise in water ingress NP >5% (5-10%) if happens after fleet demobilized: $2M to address.
Disruption of cover system surface (final
dump, plateau)
Due to differential settlement as a result of differing lift heights within the NOEF
Leading to higher water entry than performance
expectation
L
L
L
L
L
Mo
Mo
L
L
L
L
H
Mo
No accurate surveys of current dump surface to pick up on settlement rates.
Most of primary settlement happens during operations. Not much once cover is in place. Settlement could be as high as 5-6% during construction, 0.5% creep following construction (25cm).
Settlement range even less for areas with 2m lift heights.
If significant water seeping into the material , potential for collapse settlement (material break downs with water) leading to rise in water ingress NP>5% (5-10%) 25ha @ 350mm --> 100ML pooling, 50ML additional NP, prior: 500ha @ 50mm --> 250ML, so 20% additional NP for 1 year 1-2m added material over 10-15ha

Failure Mode Description
Effects and Pathways
Lik
elih
oo
d
Consequences
Le
vel
of
co
nfi
de
nce
Hig
he
st
Ris
k R
ati
ng
Comments / Mitigation
Environm
enta
l Im
pact
Consequence C
osts
Regula
tory
Com
plia
nce
and A
ppro
val
Com
munity a
nd
Sta
kehold
ers
Safe
ty
Disruption of cover system surface (final
dump, slope)
Due to differential settlement as a result of differing lift heights within the NOEF
Leading to higher water entry than performance
expectation
L
L
L
L
L
Mo
Mo
L
L
L
L
H
Mo
Most of primary settlement happens during operations. Not much once cover is in place. Settlement could be as high as 5-6% during construction, 0.5% creep following construction (25cm).
Settlement range even less for areas with 2m lift heights.
If significant seepage into mat’l, collapse settlement (mat’l breaks down with water) leading to NP>5% (5-10%) 25ha @ 350mm -> 100ML pooling, 50ML additional NP, prior: 500ha @ 50mm -> 250ML, so 20% additional NP for 1 year 1-2m added material over 10-15ha
Failure to meet stakeholder
expectations for landform aesthetics
(cultural significance) in regards to the height
of the NOEF
Leading to failure for approval of landform
M
Mi
Mo
Ma
H
n/a
Mo
Mo
-H
L
L H
July 2015 FMEA workshop likelihood: High. 140m approval vs. 80m as approved.
Meetings with Traditional Owners have occurred, with discussions being favourable and it is felt approval will be negotiated, but no formal agreement as yet.
$75M incremental cost to develop to 80m height restriction instead of 140m.
700ha (80m) vs. 550ha (140m) footprint is likely to result in an increase in contaminant loads to the environment.
Failure to meet stakeholder
expectations for building over site of
cultural significance in regards to MRM4
Leading to failure for approval of landform
L
L
L
Mo
Mo
n/a
n/a
n/a
Mo
Small surface area increase.
Formal agreement still to come.
Not dumping over cultural site. Actual moving of cultural site and informal community agreement with moving the site
Unable to convince regulator that proposed EIS approach will work
without changes
Leading to EIS being delayed and temporary cessation of
operations
M
L
L
Ma
H
Ma
H
Ma
H
L
L
H
H
MRM has no control of process following submission of EIS.
Communicating road map for closure and unified communication strategy with the DME and EPA is critical.
Need to communicate schedule; the EIS is an assessment process.
No set period on supplementary information request response plan.
Unknown period required for preparation of supplementary information.
Potential difficulties in delivering technical aspects for Dec 2016; geochemistry is in order; hydrogeology, contingency planning, pit lake modelling, will be more challenging.
Schedule is dictated by the timing of required approvals and not by the timing of the required technical studies.
Can some technical aspects be part of the supplementary information request?
Require the base case design in order to proceed with numerical modelling.
Starting modelling on groundwater model, contingency planning, pit lake, surface water management, closure plan, etc., relies on setting Base Case.
Need approval on dump height in order to determine base case; may need to move both options (140 and 80m height) forward for modelling in order to deliver on time.
With 80m height and increased footprint, understanding of shallow geology to the north of the current NOEF needs to improve.
Schedule based on best case scenario.
Delays: $1M/week for 6 months: $26M, and potential loss of bulk concentrate market share.

Failure Mode Description
Effects and Pathways
Lik
elih
oo
d
Consequences
Le
vel
of
co
nfi
de
nce
Hig
he
st
Ris
k R
ati
ng
Comments / Mitigation
Environm
enta
l Im
pact
Consequence C
osts
Regula
tory
Com
plia
nce
and A
ppro
val
Com
munity a
nd
Sta
kehold
ers
Safe
ty
Unable to convince regulator that EIS
approach and current strategy will work
Leading to EIS being rejected.
L
L
L
C
Mo
-H
Ma
Mo
-H
Ma
Mo
-H
L
L
Mo
-H
If EIS rejected, need to repeat the process, represents a time and cost commitment.
2005 EIS was rejected.
Consequence costs: NPV $1B, loss opportunity cost >$200M.
EIS rejected.
Leading a need to provide a closure bond that assumes
all waste will need to be placed in the open pit
L
Mi
L
C
Mo
-H
n/a
C
Mo
-H
L
L
L
Mo
-H EIS still has to be presented to DME for approval.
Probability of having to put waste back in open cut if EIS doesn’t go through.
A change in the Block model for NAF/PAF
ratio during the life of NOEF placement
Leading to State regulatory agencies requesting an environmental impact
assessment be conducted
NL
Mi
L
C
Mo
-H
Ma
Mo
Ma
Mo
L
L
H
Mo
-H
Essentially the reason for the current EIS
END OF TABLE B.3

Table B.4: NOEF Long Term FMEA Worksheet (note: if FMs and EPs not evaluated in Long Term, then they are considered to be not applicable or the same as the assessment described
for the NOEF Short Term)
Failure Mode Description
Effects and Pathways L
ikelih
oo
d
Consequences
Le
vel
of
Co
nfi
den
ce
Hig
he
st
Ris
k R
ati
ng
Comments / Mitigation Environm
enta
l
Imp
act
Consequence C
osts
Regula
tory
Com
plia
nce
and A
ppro
val
Com
munity a
nd
Sta
kehold
ers
Safe
ty
Higher than required performance for
geochemical loading from facility
Due to lack of understanding for hydrology around the
NOEF Leading to failing water
quality commitments N
L
Mo
L
Mi
L
Mi
L
Mo
L
L
L
H
L
Managed by current water management infrastructure May Lead to increasing capacity for surface water storage
The synthetic (SILO) dataset uses 715mm annual rainfall, 30yr site data shows 800mm
Higher than required performance for
geochemical loading from facility
Due to rainfall climate database not representing
future conditions Leading to failing water
quality commitments
NL
Mo
L
Mo
L
Mo
L
Mo
L
L
L
M
L
Better assessment of climate change.
For 1000 yr, running 100 yr climate database 10x, potential to run stochastic database to include more extreme events expected over the period. Extreme rainfall event is considered in the design, but not necessarily in the seepage modelling (using 10yr data 10x). Change in extreme rainfall event with climate change scenario, using current guidelines. X% increase in rainfall intensity or decrease.
Variation in flows from 1:100 to 1:1000 yr events may not be major increase (10-15%) 1:1000yr wet season rainfall volume to be included in modelling. Expected Effect on leakage rate through the dump, impact on seepage rate?
Potential for variability on weather patterns increases with climate change, more so than changes in average climate. Current variability in tropical climates includes much of expected variability from climate change.
Need to pick a climate change scenario and justify it. Need to agree on RCP4.5 and present it. Majority of drain down has happened. Potential lower flows in MR.
May Lead to increasing capacity for surface water storage
The synthetic (SILO) dataset uses 715mm annual rainfall, 30yr site data shows 800mm
Incorporating climate change scenarios for the site (RCP4.5, RCP6, etc.). Define and agree on a climate change scenario. Challenge in the region is increased climate variability from CC. Effect limited to cover system and hydrology.
MR climate goes drier, basal flow is therefore lower for longer periods.
Higher than required performance for
geochemical loading from facility
Due to failure of surface water management system
within/around the NOEF Leading to failing water
quality commitments
L
Mo
Mo
Mi
L
Mo
Mo
Mo
Mo
L
L
H
Mo
For toe drainage channels, surface drains (not cover)
Shorter timeframe to pick up issue (surface)
Monitoring point downstream (NT)
Communities can pick up issues
Trajectory is understood from adaptive management monitoring period, adapt future monitoring accordingly. Education in place to understand what comes from closed site, utilizing local communities for monitoring of site.
Shorter period at high flow, high load, spill of contaminated water.
200-250t/day sulphate, sulphate concentration go up to 100mg/L for a short period, potential to mix with high sediment load from event, minor repairs to surface water management system

Failure Mode Description
Effects and Pathways L
ikelih
oo
d
Consequences
Le
vel
of
Co
nfi
den
ce
Hig
he
st
Ris
k R
ati
ng
Comments / Mitigation Environm
enta
l
Imp
act
Consequence C
osts
Regula
tory
Com
plia
nce
and A
ppro
val
Com
munity a
nd
Sta
kehold
ers
Safe
ty
Higher than required performance for
geochemical loading from facility
Due to failure of flood protection for McArthur River
Leading to failing water quality commitments
NL
Mi
L
Mi
L
Mo
L
Mo
L
L
L
M
L
MR backing up against dump. Cover system in place would protect seepage from flood into the dump (1-2 week delay).
River may erode toe of the NOEF: mostly loss of topsoil and erosion protection (rock), sediment loss. Potential for major toe erosion, exposure of cover, path for water and O2 into dump material
1500m*25m height, 200,000m3 @ $10/m3 --> $2M need for mitigation plans for the long term and associated costs
Flood ingress into the base of NOEF. MR backs up and overflows into BC. Levees. Cover system built as a flood prevention system. Immediate term: levees for 1:20yr. Future levees (4 year timeframe): 1:100 yrs. Flood event leads to a minor increase in loads. Dealt with by retaining water following flood. High dilution during event. Weeks for flooded base to express seepage.
Cost to fix levee
Expected loads need to be integrated into the surface water management model
Higher than required performance for
geochemical loading from facility
Due to power failure and failure of pumping system
for seepage collection sumps
Leading to failing water quality commitments
NL
L
L
L
L
L
L
L
L
L
L
H
A
Assuming pumping carries on
Mitigation plan for power requirements, float systems, maintenance of pumping equipment, local communities to operate, redundancy required cost of diesel power vs. extending power lines from power station (long term) solar power?
Seepage coming from NOEF, impossible to put back in PRODs
Diesel pumps backup, prioritize
Higher than required performance for
geochemical loading from facility
Due to incorrect operation of water management system
(pumping to incorrect discharge point)
Leading to failing water quality commitments
NL
Mi
L
L
L
Mo
L
Mo
L
L
L
H
L
May take a few years to pick up. Commercial cattle station still running: pumping operation realistic. Contract for pump check up on a regular basis is feasible. Gravity fed systems
Human error from operator / management. Pumping straight from PROD to river. River testing every 2 weeks
Automation reduces risk

Failure Mode Description
Effects and Pathways L
ikelih
oo
d
Consequences
Le
vel
of
Co
nfi
den
ce
Hig
he
st
Ris
k R
ati
ng
Comments / Mitigation Environm
enta
l
Imp
act
Consequence C
osts
Regula
tory
Com
plia
nce
and A
ppro
val
Com
munity a
nd
Sta
kehold
ers
Safe
ty
Higher than required performance for
geochemical loading from facility
LONG TERM
Due to closure cover system not meeting O2 transport requirements and further oxidation products being
developed within the NOEF Leading to failing water
quality commitments
NL
Mo
L
Mo
L
Ma
Mo
Ma
Mo
Mo
L
L
Mo
Monitor cover over 100yr. Mature vegetation. Cover fixed during the adaptive management period. After 1,000yrs: lower likelihood of cover failure leading to WQ issues
Keeping likelihood Low due to cycling of climate and climate unknowns in the long term.
Adaptive management period is long enough to test success of updated cover strategies. What's to say that 2nd and 3rd iteration won't be unsuccessful as well?
Consequence cost for 100-1000yr period after 100yr of adaptive management should be lower to fix cover system. Cost of repair: 125ha * $400k --> $50M, corresponds to the entire plateau, or 1/3 of batters
Additional adaptive management ($10M), under $50M.
Dump construction (thin lifts) has a bigger impact on contaminant release than the cover system. So that cover system failure doesn’t have as catastrophic an effect. Commitment to building the dump in order to manage advective gas transport. Incremental cost of waste placement to manage O2 ingress ($100M) has bigger impact than cover construction. Cover system is not the primary defence against O2 ingress.
Material in cover system will weather and ultimately permeabilities will decrease
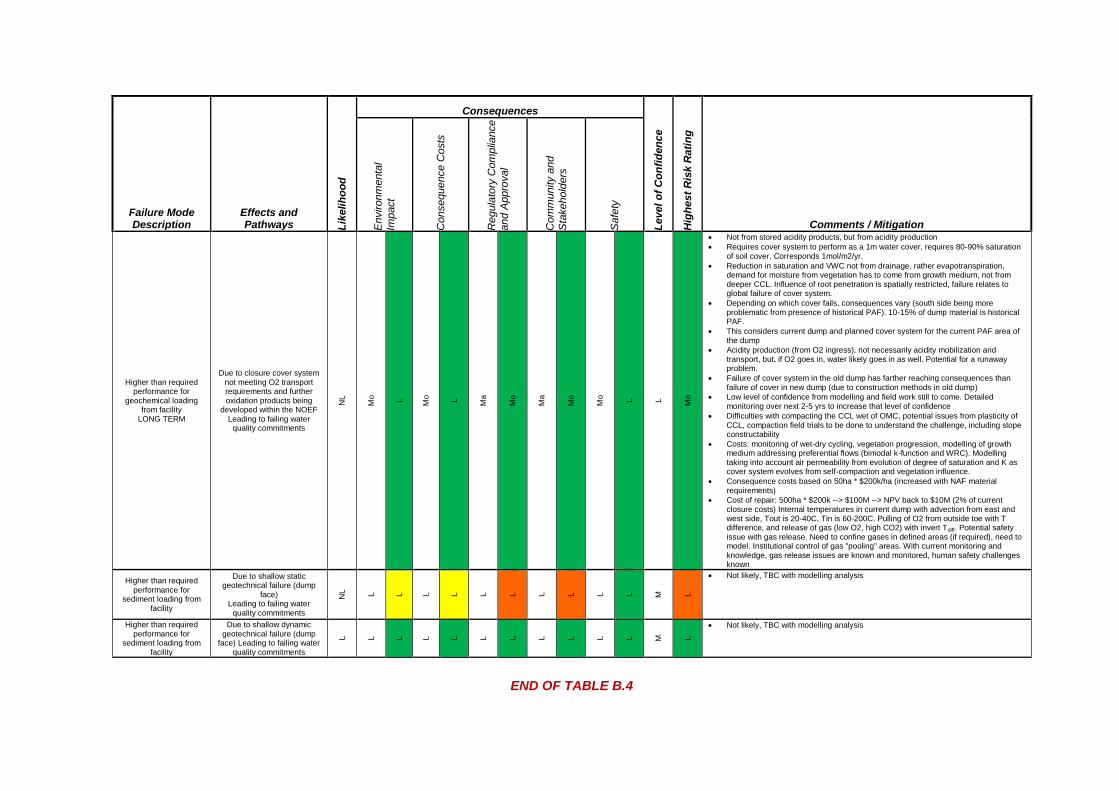
Failure Mode Description
Effects and Pathways L
ikelih
oo
d
Consequences
Le
vel
of
Co
nfi
den
ce
Hig
he
st
Ris
k R
ati
ng
Comments / Mitigation Environm
enta
l
Imp
act
Consequence C
osts
Regula
tory
Com
plia
nce
and A
ppro
val
Com
munity a
nd
Sta
kehold
ers
Safe
ty
Higher than required performance for
geochemical loading from facility
LONG TERM
Due to closure cover system not meeting O2 transport requirements and further oxidation products being
developed within the NOEF Leading to failing water
quality commitments
NL
Mo
L
Mo
L
Ma
Mo
Ma
Mo
Mo
L
L
Mo
Not from stored acidity products, but from acidity production
Requires cover system to perform as a 1m water cover, requires 80-90% saturation of soil cover. Corresponds 1mol/m2/yr.
Reduction in saturation and VWC not from drainage, rather evapotranspiration, demand for moisture from vegetation has to come from growth medium, not from deeper CCL. Influence of root penetration is spatially restricted, failure relates to global failure of cover system.
Depending on which cover fails, consequences vary (south side being more problematic from presence of historical PAF). 10-15% of dump material is historical PAF.
This considers current dump and planned cover system for the current PAF area of the dump
Acidity production (from O2 ingress), not necessarily acidity mobilization and transport, but, if O2 goes in, water likely goes in as well. Potential for a runaway problem.
Failure of cover system in the old dump has farther reaching consequences than failure of cover in new dump (due to construction methods in old dump)
Low level of confidence from modelling and field work still to come. Detailed monitoring over next 2-5 yrs to increase that level of confidence
Difficulties with compacting the CCL wet of OMC, potential issues from plasticity of CCL, compaction field trials to be done to understand the challenge, including slope constructability
Costs: monitoring of wet-dry cycling, vegetation progression, modelling of growth medium addressing preferential flows (bimodal k-function and WRC). Modelling taking into account air permeability from evolution of degree of saturation and K as cover system evolves from self-compaction and vegetation influence.
Consequence costs based on 50ha * $200k/ha (increased with NAF material requirements)
Cost of repair: 500ha * $200k --> $100M --> NPV back to $10M (2% of current closure costs) Internal temperatures in current dump with advection from east and west side, Tout is 20-40C, Tin is 60-200C. Pulling of O2 from outside toe with T difference, and release of gas (low O2, high CO2) with invert Tdiff. Potential safety issue with gas release. Need to confine gases in defined areas (if required), need to model. Institutional control of gas "pooling" areas. With current monitoring and knowledge, gas release issues are known and monitored, human safety challenges known
Higher than required performance for
sediment loading from facility
Due to shallow static geotechnical failure (dump
face) Leading to failing water
quality commitments
NL
L
L
L
L
L
L
L
L
L
L
M
L
Not likely, TBC with modelling analysis
Higher than required performance for
sediment loading from facility
Due to shallow dynamic geotechnical failure (dump
face) Leading to failing water quality commitments
L
L
L
L
L
L
L
L
L
L
L
M
L
Not likely, TBC with modelling analysis
END OF TABLE B.4
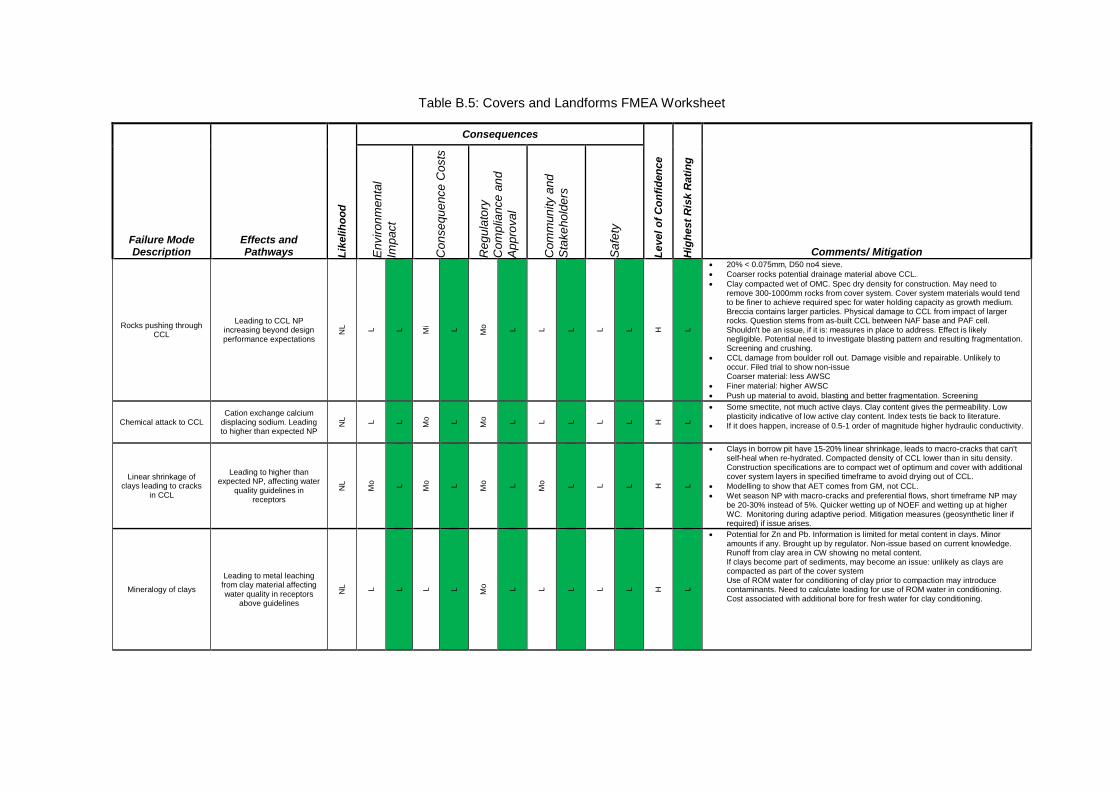
Table B.5: Covers and Landforms FMEA Worksheet
Failure Mode Description
Effects and Pathways L
ikelih
oo
d
Consequences
Le
vel
of
Co
nfi
den
ce
Hig
he
st
Ris
k R
ati
ng
Comments/ Mitigation En
vir
on
men
tal
Imp
act
Con
se
qu
ence
Costs
Reg
ula
tory
Com
plia
nce
an
d
Ap
pro
va
l
Com
mun
ity a
nd
Sta
ke
ho
lde
rs
Sa
fety
Rocks pushing through CCL
Leading to CCL NP increasing beyond design performance expectations
NL
L
L
Mi
L
Mo
L
L
L
L
L
H
L
20% < 0.075mm, D50 no4 sieve.
Coarser rocks potential drainage material above CCL.
Clay compacted wet of OMC. Spec dry density for construction. May need to remove 300-1000mm rocks from cover system. Cover system materials would tend to be finer to achieve required spec for water holding capacity as growth medium. Breccia contains larger particles. Physical damage to CCL from impact of larger rocks. Question stems from as-built CCL between NAF base and PAF cell. Shouldn't be an issue, if it is: measures in place to address. Effect is likely negligible. Potential need to investigate blasting pattern and resulting fragmentation. Screening and crushing.
CCL damage from boulder roll out. Damage visible and repairable. Unlikely to occur. Filed trial to show non-issue Coarser material: less AWSC
Finer material: higher AWSC
Push up material to avoid, blasting and better fragmentation. Screening
Chemical attack to CCL Cation exchange calcium
displacing sodium. Leading to higher than expected NP
NL
L
L
Mo
L
Mo
L
L
L
L
L
H
L
Some smectite, not much active clays. Clay content gives the permeability. Low plasticity indicative of low active clay content. Index tests tie back to literature.
If it does happen, increase of 0.5-1 order of magnitude higher hydraulic conductivity.
Linear shrinkage of clays leading to cracks
in CCL
Leading to higher than expected NP, affecting water
quality guidelines in receptors
NL
Mo
L
Mo
L
Mo
L
Mo
L
L
L
H
L
Clays in borrow pit have 15-20% linear shrinkage, leads to macro-cracks that can't self-heal when re-hydrated. Compacted density of CCL lower than in situ density. Construction specifications are to compact wet of optimum and cover with additional cover system layers in specified timeframe to avoid drying out of CCL.
Modelling to show that AET comes from GM, not CCL.
Wet season NP with macro-cracks and preferential flows, short timeframe NP may be 20-30% instead of 5%. Quicker wetting up of NOEF and wetting up at higher WC. Monitoring during adaptive period. Mitigation measures (geosynthetic liner if required) if issue arises.
Mineralogy of clays
Leading to metal leaching from clay material affecting water quality in receptors
above guidelines
NL
L
L
L
L
Mo
L
L
L
L
L
H
L
Potential for Zn and Pb. Information is limited for metal content in clays. Minor amounts if any. Brought up by regulator. Non-issue based on current knowledge. Runoff from clay area in CW showing no metal content. If clays become part of sediments, may become an issue: unlikely as clays are compacted as part of the cover system Use of ROM water for conditioning of clay prior to compaction may introduce contaminants. Need to calculate loading for use of ROM water in conditioning. Cost associated with additional bore for fresh water for clay conditioning.

Failure Mode Description
Effects and Pathways L
ikelih
oo
d
Consequences
Le
vel
of
Co
nfi
den
ce
Hig
he
st
Ris
k R
ati
ng
Comments/ Mitigation En
vir
on
men
tal
Imp
act
Con
se
qu
ence
Costs
Reg
ula
tory
Com
plia
nce
an
d
Ap
pro
va
l
Com
mun
ity a
nd
Sta
ke
ho
lde
rs
Sa
fety
Mineralogy of LsNAF materials
Leading to metal leaching from growth medium
material affecting water quality in receptors above
guidelines
NL
Mi
L
Mi
L
Mo
L
Mo
L
L
L
M
L
First flush from LsNAF is managed on site. Need to monitor runoff water quality to show it passes guidelines. Happens during adaptive management period. Potential capture of runoff if required by WQ data. First flush behaviour happens annually. WQ from first flush of LsNAF material. Data from rinse test of LsNAF: below discharge WQ criteria.
Cost relates to water containment and treatment of first flush, if required.
Placing MsNAF rather than LsNAF in growth
medium
Leading to metal leaching from growth medium
material
M
L
L
L
L
Mi
Mo
L
L
L
L
H
Mo
Block model improved from blast hole data Procedures in place to catch and mitigate (remove and replace material if required)
Wind shear leading to advective drying of
cover system
Leading to insufficient moisture for vegetation
L
Mi
L
Mi
L
Mo
Mo
Mi
L
L
L
L
Mo
Height of dump increases effect of wind shear for advective drying. Lower AWHC for vegetation, drying of CCL. Water holding capacity modifiers to address the effect of wind and modify cover system to address it.
Operational life of geosynthetic liner
Leading to loss of hydraulic conductivity properties and
NP rates higher than performance expectations
L
Mi
L
Mo
Mo
Mo
Mo
Mo
Mo
L
L
M
Mo
Holes happen, accounting for holes during modelling, 5% NP rate, which is MUCH higher than modelling results. Where needed, drainage layers to be used to minimize ponding above liner. No geofabrics used on slopes (breakdown). If needed for drainage capacity, filter layer material brought to surface.
Cost of replacing over 135ha --> $30M
Erosion rates on batters higher than
performance expectations
Leading to higher sediment loads in runoff
M
L
L
Mi
Mo
Mi
Mo
Mi
Mo
L
L
M
Mo
Trapped in sediment dams
Erosion rates on batters higher than
performance expectations (short
term)
Leading to lower degree of saturation in CCL than
design specifications leading to higher O2 ingress
M
Mi
Mo
Mo
Mo
-H
Mo
Mo
-H
Mo
Mo
-H
L
L
M
Mo
-H
During adaptive mgmt. period: gullies get fixed. Design updated if required (erosion more important than expected).
Surface areas to fix are limited, ($10M?)
Transitions in slopes not designed properly
Leading to higher erosion rates than design
expectations
M
L
L
Mi
Mo
Mi
Mo
L
L
L
L
L
Mo Design of transitions still to be done. Transitions are on a radius. Swales within the
slope to manage vertical drop of water
Erosion of CCL layer due to interflow
Leading to loss of CCL to manage NP and O2 ingress
L
L
L
Mi
L
Mi
L
L
L
L
L
M
L
CCL gets thinner and can't function as designed.
Pore water velocity are low (even on 1:2.5 slope.
50% of CCL has to disappear to make a difference on NP and O2 ingress
Picked during adaptive monitoring (from interflow water quality monitoring).
Fixed by additional layer above it (alluvium or LLDPE).
Toe drainage capacity insufficient to release
interflow
Leading to geotechnical stability issues at toe
M
L
L
Mi
Mo
Mi
Mo
L
L
L
L
L
Mo
Detailed design still to be developed.
END OF TABLE B.5

Table B.6: TSF Short Term FMEA Worksheet
Failure Mode Description
Effects and Pathways L
ikelih
oo
d
Consequences
Le
vel
of
Co
nfi
den
ce
Hig
he
st
Ris
k R
ati
ng
Comments/ Mitigation Environm
enta
l
Imp
act
Consequence C
osts
Regula
tory
Com
plia
nce
and A
ppro
val
Com
munity a
nd
Sta
kehold
ers
Safe
ty
Seepage collection system planned for
TSF during operations: efficiency lower than
expected
Leading to impact on surface water quality at
SW11
L
Mi
L
Mi
L
Mo
Mo
Mo
Mo
L
L
M
Mo
Additional water quality assessment points upstream of SW11 to act as trigger points to avoid poor water quality at SW11. Allows to react and further mitigation measures.
Surprise Creek requires filling in and
relocation
As a result of buttress requires additional width due
to earthquake stability issues
NL
Mo
L
Mi
L
Mo
L
Ma
Mo
L
L
H
Mo
Potential cessation of operations if EIS required. Would a new EIS be required?
Diversion 200m long - 2m deep, 5m wide
Surprise Creek requires filling in and
relocation
As a result of buttress requires additional width due
to failure of maximum buttress size being reached as a result of poor tailings
management practices
L
Mo
Mo
Mo
Mo
Mo
Mo
Ma
Mo
-H
L
L
H
Mo
-H
Heightened awareness for tailings management on site. Tailings review board. DME inspection on site / 3 months. Added level of control for tailings management,
Excess water needing to be removed from the
TSF decant pond
Insufficient capacity in lined Cell3 water management
system leading to pumping to pit and temporary
cessation of pit operations
NL
L
L
Ma
Mo
L
L
L
L
L
L
L
Mo
Need for a long term water management system, requirement for a contaminated water dam. Current strategy is to pump excess water to pit. Base case is to place excess water into a lined Cell 3. Capacity has to be sufficient for LOM.
PBOX system failure Leading to acidity released in tailings and consumption
of ANC
E
L
Mo
Mi
Mo
-H
L
Mo
L
Mo
L
Mo
L
Mo
-H
Can occur intermittently, not permanent, identified issue, mitigation measures. PBOX water added to tailings. Management strategy to be developed. In process of determining management strategy
Inadequate characterization and
identification of volumes required for
TSF construction
Leading to development of new borrow source further
away
M
L
L
Mi
Mo
Mo
Mo
-H
L
L
L
L
L
Mo
-H
Need to perform characterization of borrow sources for materials and volumes. Currently based on high level assessment. Material requirements are known. In short term, borrow area is known, however if used an alternate source has to be developed.
END OF TABLE B.6

Appendix C
FMEA Workshop Whiteboard Photographs

This appendix content has been intentionally removed to reduce unnecessary volume from the EIS.
Workshop outcomes are discussed in the preceding report.

For further information contact:
Mike O'Kane
Senior Technical Advisor
O'Kane Consultants Pty Ltd
193D Given Terrace
Paddington QLD 4064
Australia
Telephone: (07) 3367 8063
Facsimile: (07) 3367 8052
Web: www.okc-sk.com