mcb bank limited · adamjee insurance company limited euronet pakistan (pvt) limited subsidiaries...
TRANSCRIPT
MCB Bank Limited Investors Briefing December 31, 2017
Presented by: Hammad Khalid Head Investor Relations, Financial Reporting & Taxation
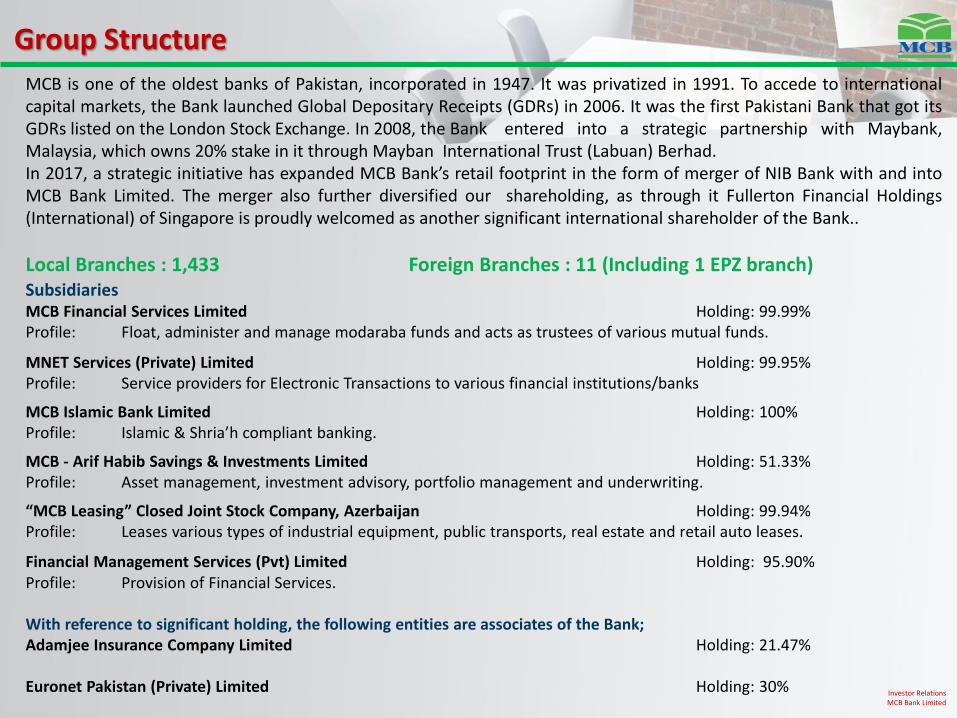
MCB is one of the oldest banks of Pakistan, incorporated in 1947. It was privatized in 1991. To accede to international capital markets, the Bank launched Global Depositary Receipts (GDRs) in 2006. It was the first Pakistani Bank that got its GDRs listed on the London Stock Exchange. In 2008, the Bank entered into a strategic partnership with Maybank, Malaysia, which owns 20% stake in it through Mayban International Trust (Labuan) Berhad. In 2017, a strategic initiative has expanded MCB Bank’s retail footprint in the form of merger of NIB Bank with and into MCB Bank Limited. The merger also further diversified our shareholding, as through it Fullerton Financial Holdings (International) of Singapore is proudly welcomed as another significant international shareholder of the Bank..
Local Branches : 1,433 Foreign Branches : 11 (Including 1 EPZ branch)
Subsidiaries MCB Financial Services Limited Holding: 99.99% Profile: Float, administer and manage modaraba funds and acts as trustees of various mutual funds.
MNET Services (Private) Limited Holding: 99.95% Profile: Service providers for Electronic Transactions to various financial institutions/banks
MCB Islamic Bank Limited Holding: 100% Profile: Islamic & Shria’h compliant banking.
MCB - Arif Habib Savings & Investments Limited Holding: 51.33% Profile: Asset management, investment advisory, portfolio management and underwriting.
“MCB Leasing” Closed Joint Stock Company, Azerbaijan Holding: 99.94% Profile: Leases various types of industrial equipment, public transports, real estate and retail auto leases.
Financial Management Services (Pvt) Limited Holding: 95.90% Profile: Provision of Financial Services. With reference to significant holding, the following entities are associates of the Bank; Adamjee Insurance Company Limited Holding: 21.47% Euronet Pakistan (Private) Limited Holding: 30%
Group Structure
Investor Relations MCB Bank Limited
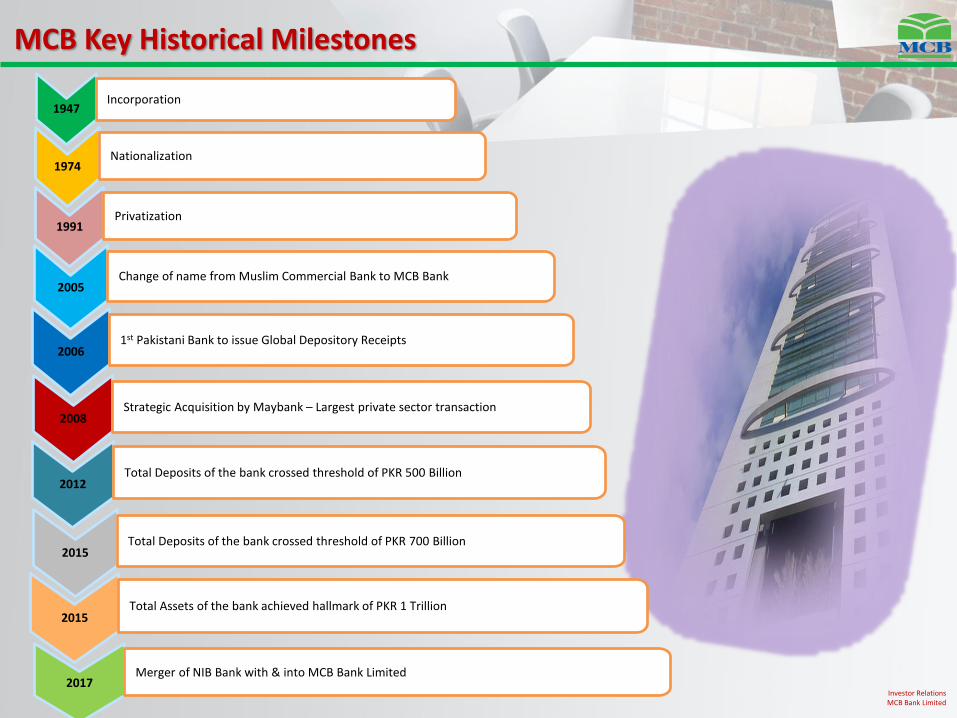
1947 Incorporation
1991 Privatization
2005 Change of name from Muslim Commercial Bank to MCB Bank
2006 1st Pakistani Bank to issue Global Depository Receipts
2008 Strategic Acquisition by Maybank – Largest private sector transaction
2015 Total Assets of the bank achieved hallmark of PKR 1 Trillion
1974 Nationalization
Investor Relations MCB Bank Limited
MCB Key Historical Milestones
2012 Total Deposits of the bank crossed threshold of PKR 500 Billion
2015 Total Deposits of the bank crossed threshold of PKR 700 Billion
2017 Merger of NIB Bank with & into MCB Bank Limited
MCB Core Values Integrity , Innovation, Excellence, Customer Centricity, Respect
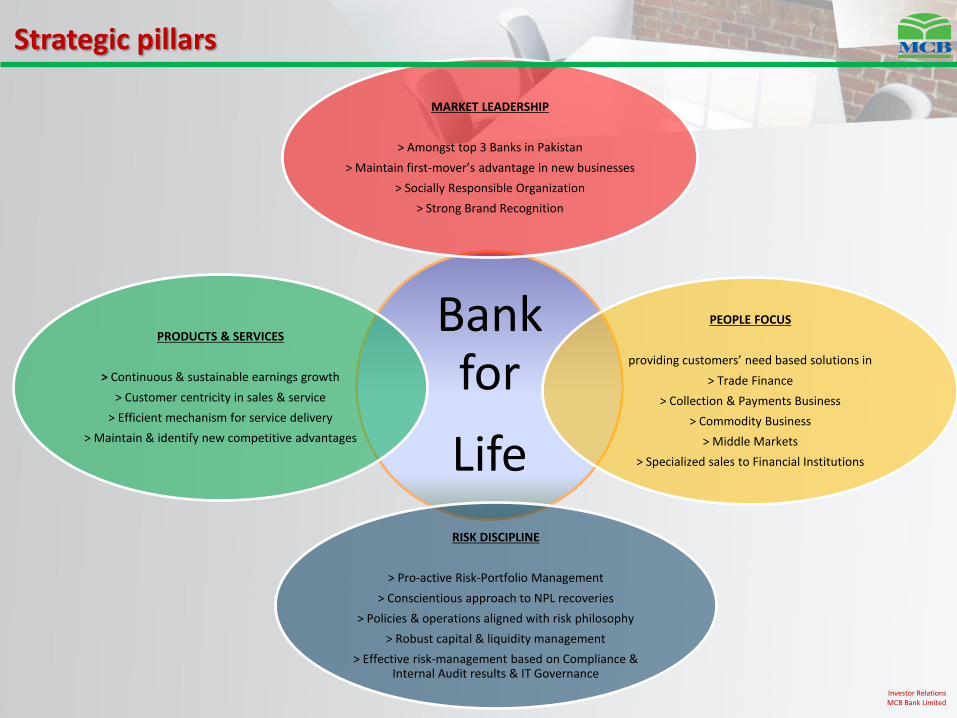
Bank for
Life
MARKET LEADERSHIP
> Amongst top 3 Banks in Pakistan
> Maintain first-mover’s advantage in new businesses
> Socially Responsible Organization
> Strong Brand Recognition
PEOPLE FOCUS
providing customers’ need based solutions in
> Trade Finance
> Collection & Payments Business
> Commodity Business
> Middle Markets
> Specialized sales to Financial Institutions
RISK DISCIPLINE
> Pro-active Risk-Portfolio Management
> Conscientious approach to NPL recoveries
> Policies & operations aligned with risk philosophy
> Robust capital & liquidity management
> Effective risk-management based on Compliance & Internal Audit results & IT Governance
PRODUCTS & SERVICES
> Continuous & sustainable earnings growth
> Customer centricity in sales & service
> Efficient mechanism for service delivery
> Maintain & identify new competitive advantages
Strategic pillars
Investor Relations MCB Bank Limited
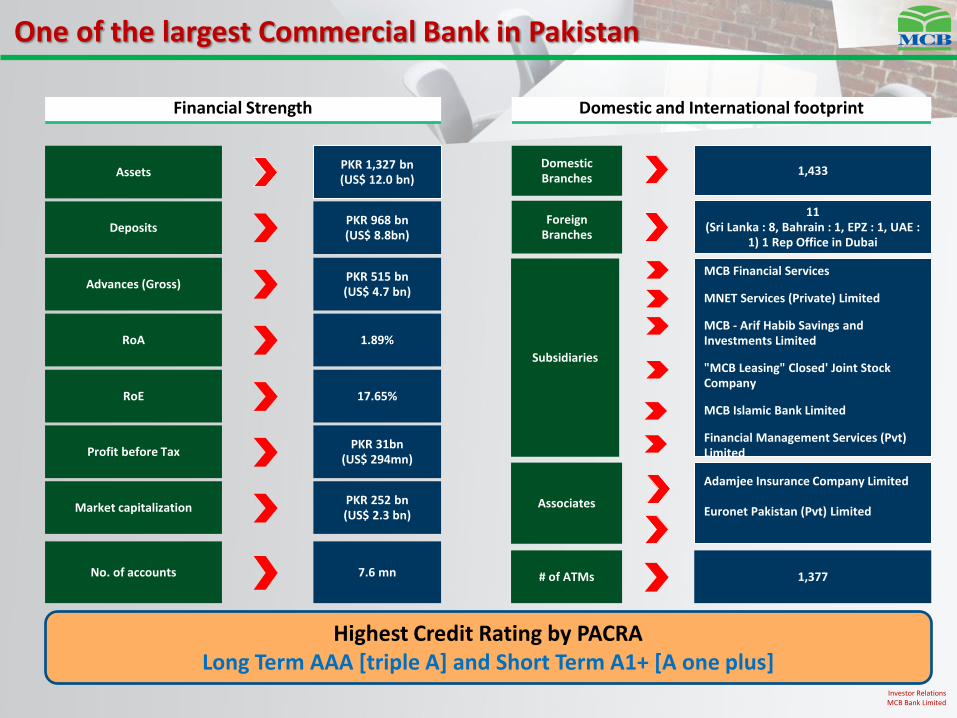
One of the largest Commercial Bank in Pakistan
Financial Strength Domestic and International footprint
Assets PKR 1,327 bn (US$ 12.0 bn)
Deposits PKR 968 bn (US$ 8.8bn)
RoA 1.89%
RoE 17.65%
Profit before Tax PKR 31bn
(US$ 294mn)
Advances (Gross) PKR 515 bn (US$ 4.7 bn)
Market capitalization PKR 252 bn (US$ 2.3 bn)
Domestic Branches
1,433
Associates
Adamjee Insurance Company Limited Euronet Pakistan (Pvt) Limited
Subsidiaries
MCB Financial Services
MNET Services (Private) Limited
MCB - Arif Habib Savings and Investments Limited
"MCB Leasing" Closed' Joint Stock Company
MCB Islamic Bank Limited
Financial Management Services (Pvt) Limited
Foreign Branches
11 (Sri Lanka : 8, Bahrain : 1, EPZ : 1, UAE :
1) 1 Rep Office in Dubai
Investor Relations MCB Bank Limited
No. of accounts 7.6 mn # of ATMs 1,377
Highest Credit Rating by PACRA Long Term AAA [triple A] and Short Term A1+ [A one plus]
6
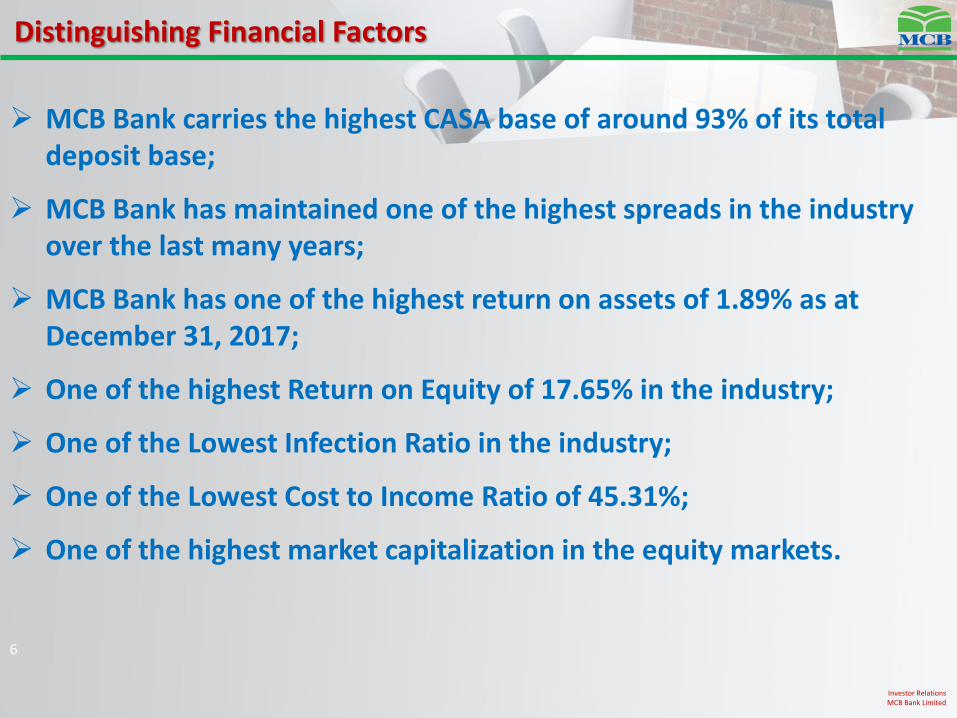
MCB Bank carries the highest CASA base of around 93% of its total deposit base;
MCB Bank has maintained one of the highest spreads in the industry over the last many years;
MCB Bank has one of the highest return on assets of 1.89% as at December 31, 2017;
One of the highest Return on Equity of 17.65% in the industry;
One of the Lowest Infection Ratio in the industry;
One of the Lowest Cost to Income Ratio of 45.31%;
One of the highest market capitalization in the equity markets.
Distinguishing Financial Factors
Investor Relations MCB Bank Limited
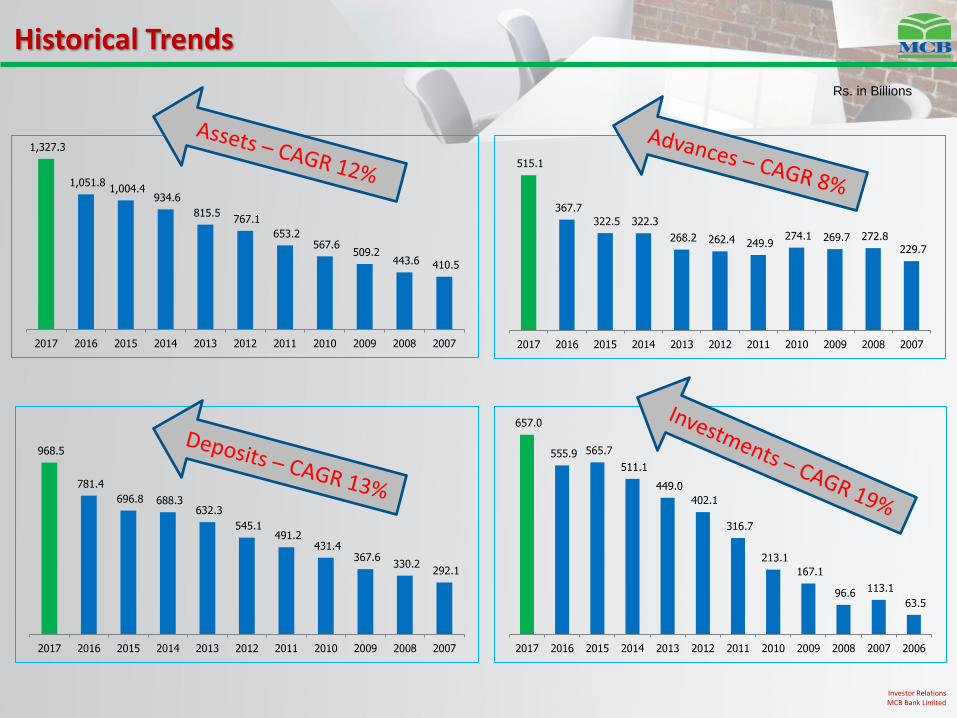
Historical Trends
Investor Relations MCB Bank Limited
Rs. in Billions
410.5 443.6 509.2
567.6 653.2
767.1 815.5
934.6 1,004.4
1,051.8
1,327.3
20072008200920102011201220132014201520162017
229.7
272.8 269.7 274.1 249.9 262.4 268.2
322.3 322.5
367.7
515.1
20072008200920102011201220132014201520162017
292.1 330.2
367.6 431.4
491.2 545.1
632.3 688.3 696.8
781.4
968.5
20072008200920102011201220132014201520162017
63.5
113.1 96.6
167.1
213.1
316.7
402.1
449.0
511.1
565.7 555.9
657.0
200620072008200920102011201220132014201520162017
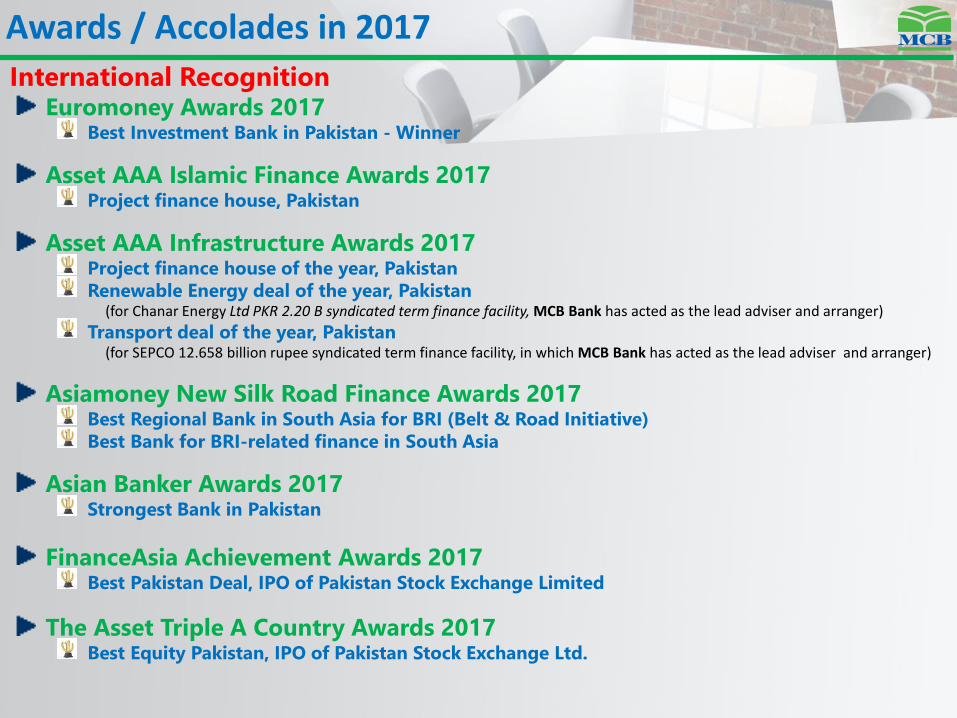
Awards / Accolades in 2017
International Recognition Euromoney Awards 2017
Best Investment Bank in Pakistan - Winner
Asset AAA Islamic Finance Awards 2017 Project finance house, Pakistan
Asset AAA Infrastructure Awards 2017 Project finance house of the year, Pakistan
Renewable Energy deal of the year, Pakistan (for Chanar Energy Ltd PKR 2.20 B syndicated term finance facility, MCB Bank has acted as the lead adviser and arranger)
Transport deal of the year, Pakistan (for SEPCO 12.658 billion rupee syndicated term finance facility, in which MCB Bank has acted as the lead adviser and arranger)
Asiamoney New Silk Road Finance Awards 2017 Best Regional Bank in South Asia for BRI (Belt & Road Initiative)
Best Bank for BRI-related finance in South Asia
Asian Banker Awards 2017 Strongest Bank in Pakistan
FinanceAsia Achievement Awards 2017 Best Pakistan Deal, IPO of Pakistan Stock Exchange Limited
The Asset Triple A Country Awards 2017 Best Equity Pakistan, IPO of Pakistan Stock Exchange Ltd.
Awards / Accolades in 2017
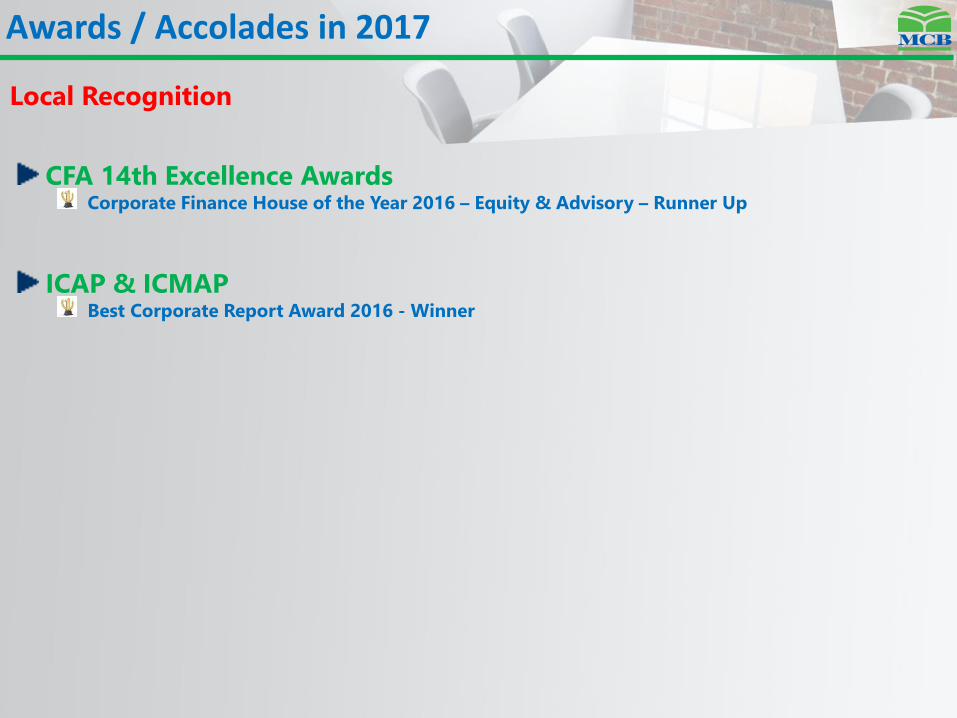
Local Recognition
CFA 14th Excellence Awards Corporate Finance House of the Year 2016 – Equity & Advisory – Runner Up
ICAP & ICMAP
Best Corporate Report Award 2016 - Winner
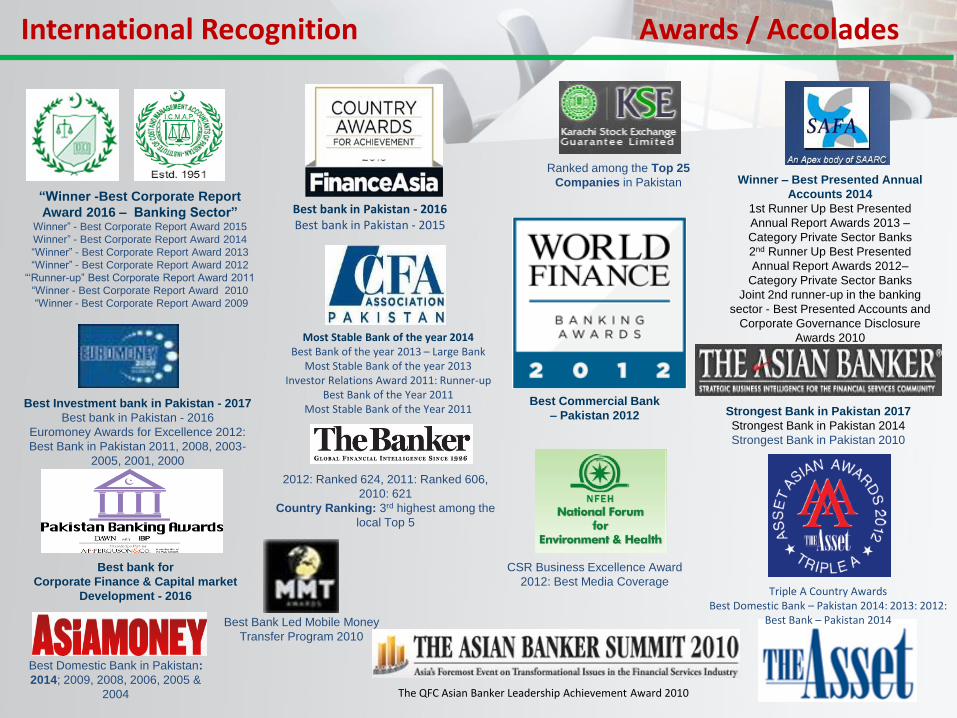
Best Bank Led Mobile Money
Transfer Program 2010
Winner – Best Presented Annual
Accounts 2014
1st Runner Up Best Presented
Annual Report Awards 2013 –
Category Private Sector Banks
2nd Runner Up Best Presented
Annual Report Awards 2012–
Category Private Sector Banks
Joint 2nd runner-up in the banking
sector - Best Presented Accounts and
Corporate Governance Disclosure
Awards 2010
2012: Ranked 624, 2011: Ranked 606,
2010: 621
Country Ranking: 3rd highest among the
local Top 5
Ranked among the Top 25
Companies in Pakistan
Strongest Bank in Pakistan 2017
Strongest Bank in Pakistan 2014
Strongest Bank in Pakistan 2010
“Winner -Best Corporate Report
Award 2016 – Banking Sector” Winner” - Best Corporate Report Award 2015
Winner” - Best Corporate Report Award 2014
“Winner” - Best Corporate Report Award 2013
“Winner” - Best Corporate Report Award 2012
“„Runner-up” Best Corporate Report Award 2011
“Winner - Best Corporate Report Award 2010
“Winner - Best Corporate Report Award 2009
Best Commercial Bank
– Pakistan 2012
Most Stable Bank of the year 2014 Best Bank of the year 2013 – Large Bank
Most Stable Bank of the year 2013 Investor Relations Award 2011: Runner-up
Best Bank of the Year 2011 Most Stable Bank of the Year 2011
Triple A Country Awards Best Domestic Bank – Pakistan 2014: 2013: 2012:
Best Bank – Pakistan 2014
Best Investment bank in Pakistan - 2017
Best bank in Pakistan - 2016
Euromoney Awards for Excellence 2012:
Best Bank in Pakistan 2011, 2008, 2003-
2005, 2001, 2000
Best Bank in Asia 2008
The QFC Asian Banker Leadership Achievement Award 2010
CSR Business Excellence Award
2012: Best Media Coverage
Best Domestic Bank in Pakistan:
2014; 2009, 2008, 2006, 2005 &
2004
Best bank in Pakistan - 2016 Best bank in Pakistan - 2015
Best bank for
Corporate Finance & Capital market
Development - 2016
International Recognition Awards / Accolades
MCB Bank Limited
Financial Performance December 31, 2017
Rs. in mln
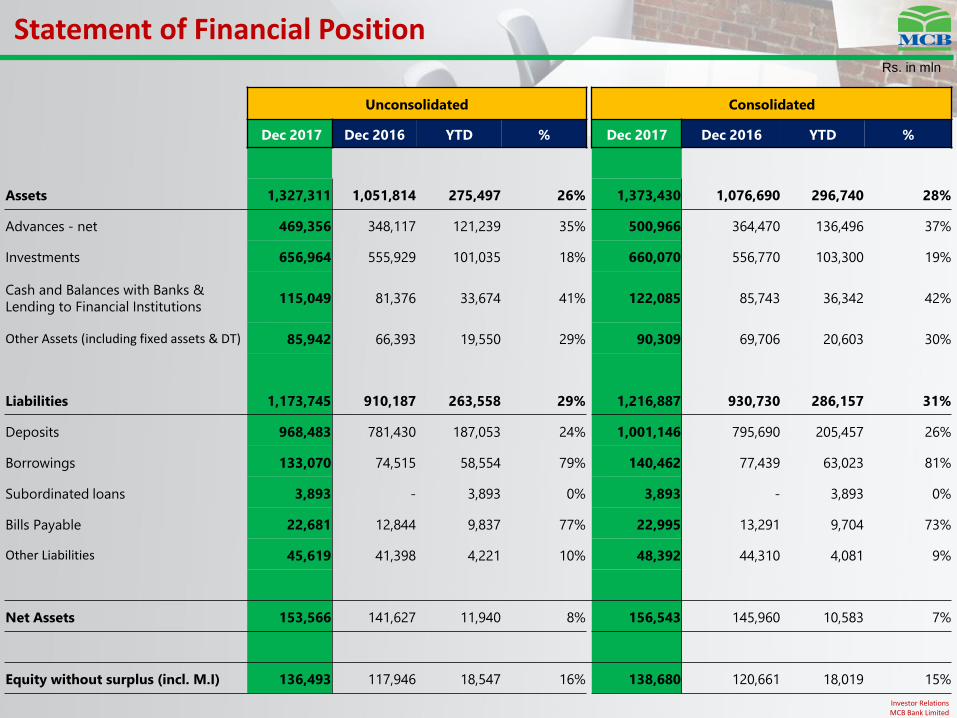
Statement of Financial Position
Investor Relations MCB Bank Limited
Unconsolidated Consolidated
Dec 2017 Dec 2016 YTD % Dec 2017 Dec 2016 YTD %
Assets 1,327,311 1,051,814 275,497 26% 1,373,430 1,076,690 296,740 28%
Advances - net 469,356 348,117 121,239 35% 500,966 364,470 136,496 37%
Investments 656,964 555,929 101,035 18% 660,070 556,770 103,300 19%
Cash and Balances with Banks &
Lending to Financial Institutions 115,049 81,376 33,674 41% 122,085 85,743 36,342 42%
Other Assets (including fixed assets & DT) 85,942 66,393 19,550 29% 90,309 69,706 20,603 30%
Liabilities 1,173,745 910,187 263,558 29% 1,216,887 930,730 286,157 31%
Deposits 968,483 781,430 187,053 24% 1,001,146 795,690 205,457 26%
Borrowings 133,070 74,515 58,554 79% 140,462 77,439 63,023 81%
Subordinated loans 3,893 - 3,893 0% 3,893 - 3,893 0%
Bills Payable 22,681 12,844 9,837 77% 22,995 13,291 9,704 73%
Other Liabilities 45,619 41,398 4,221 10% 48,392 44,310 4,081 9%
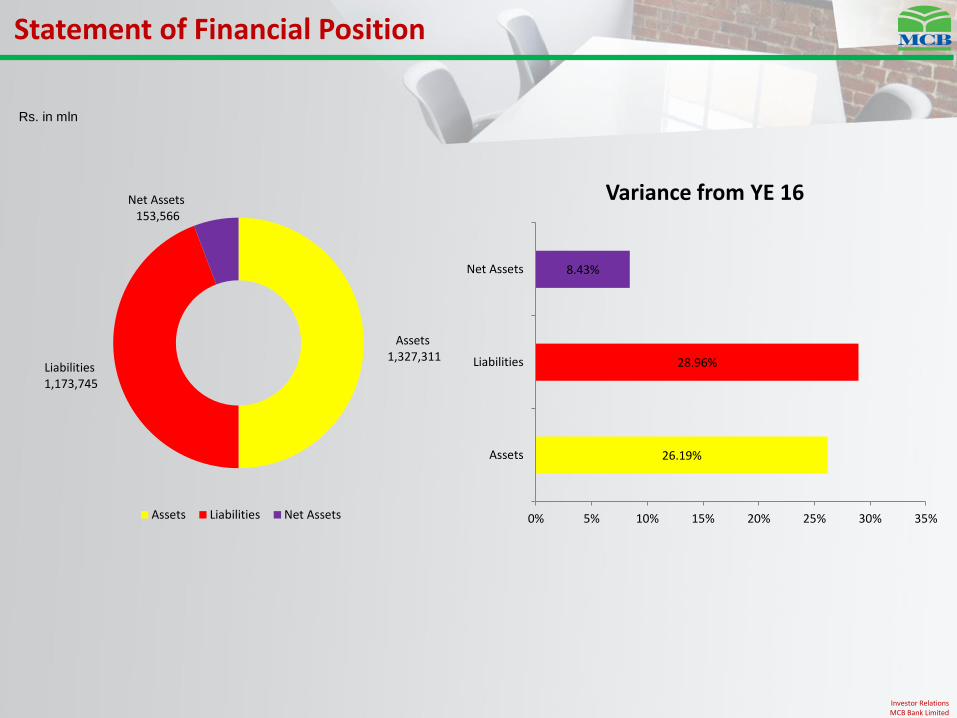
Net Assets 153,566 141,627 11,940 8% 156,543 145,960 10,583 7%
Equity without surplus (incl. M.I) 136,493 117,946 18,547 16% 138,680 120,661 18,019 15%
Statement of Financial Position
Investor Relations MCB Bank Limited
Rs. in mln
Assets 1,327,311
Liabilities 1,173,745
Net Assets 153,566
Assets Liabilities Net Assets
26.19%
28.96%
8.43%
0% 5% 10% 15% 20% 25% 30% 35%
Assets
Liabilities
Net Assets
Variance from YE 16
Cash Flows
Investor Relations MCB Bank Limited
Rs. in mln
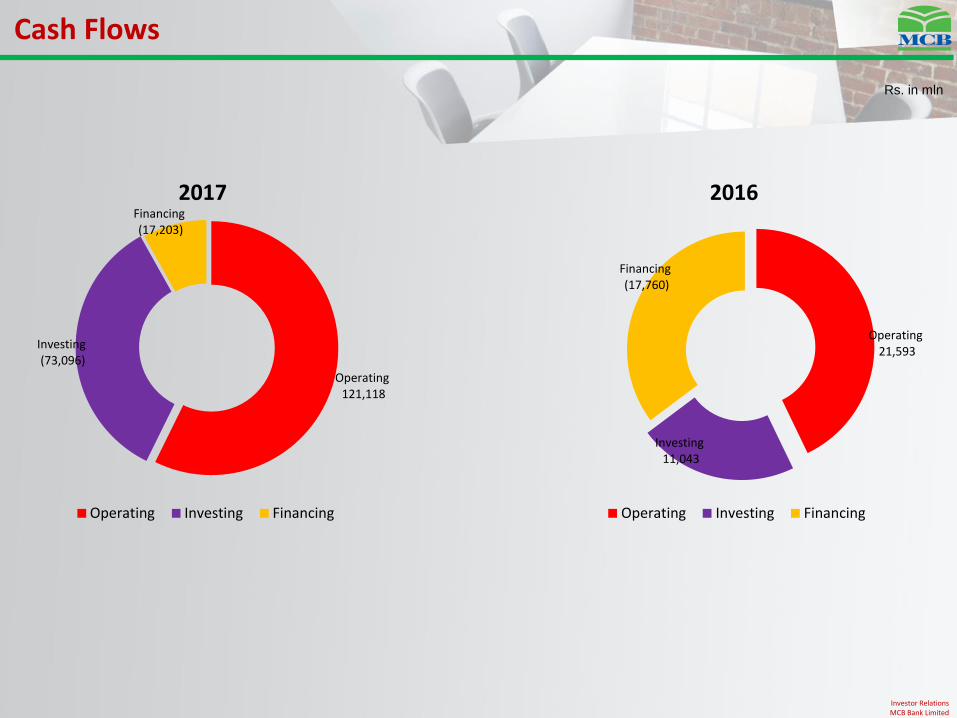
Operating 121,118
Investing (73,096)
Financing (17,203)
2017
Operating Investing Financing
Operating 21,593
Investing 11,043
Financing (17,760)
2016
Operating Investing Financing
Advances and NPLs
Investor Relations MCB Bank Limited
Rs. in mln
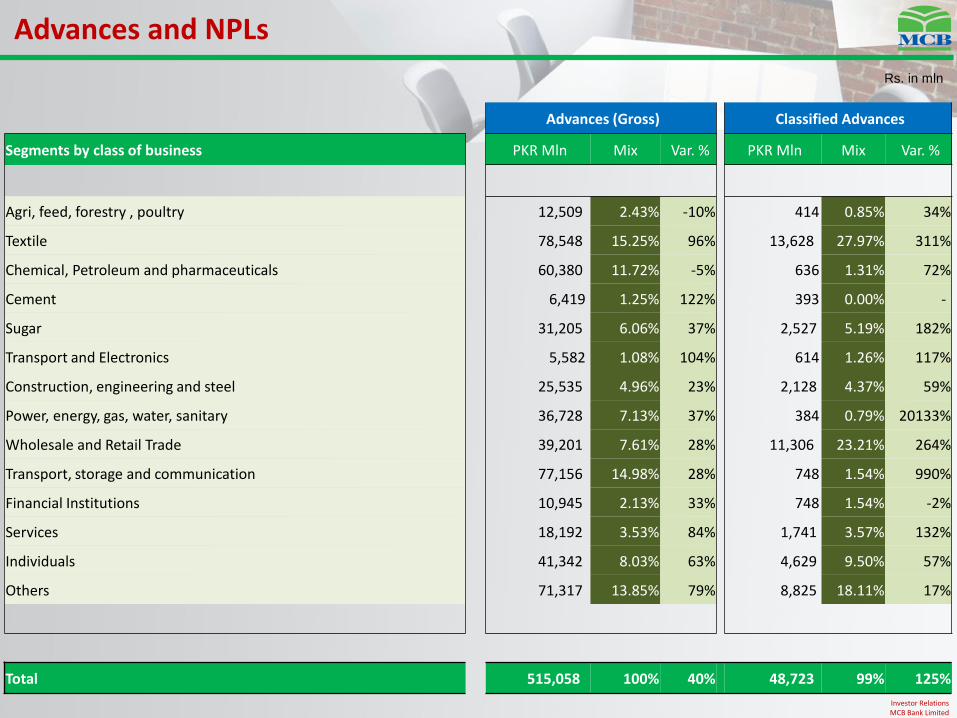
Advances (Gross) Classified Advances
Segments by class of business PKR Mln Mix Var. % PKR Mln Mix Var. %
Agri, feed, forestry , poultry 12,509 2.43% -10% 414 0.85% 34%
Textile 78,548 15.25% 96% 13,628 27.97% 311%
Chemical, Petroleum and pharmaceuticals 60,380 11.72% -5% 636 1.31% 72%
Cement 6,419 1.25% 122% 393 0.00% -
Sugar 31,205 6.06% 37% 2,527 5.19% 182%
Transport and Electronics 5,582 1.08% 104% 614 1.26% 117%
Construction, engineering and steel 25,535 4.96% 23% 2,128 4.37% 59%
Power, energy, gas, water, sanitary 36,728 7.13% 37% 384 0.79% 20133%
Wholesale and Retail Trade 39,201 7.61% 28% 11,306 23.21% 264%
Transport, storage and communication 77,156 14.98% 28% 748 1.54% 990%
Financial Institutions 10,945 2.13% 33% 748 1.54% -2%
Services 18,192 3.53% 84% 1,741 3.57% 132%
Individuals 41,342 8.03% 63% 4,629 9.50% 57%
Others 71,317 13.85% 79% 8,825 18.11% 17%
Total 515,058 100% 40% 48,723 99% 125%
Concentration Level
Investor Relations MCB Bank Limited
Rs. in mln
2.43%
15.25%
11.72%
1.25%
6.06%
1.08%
4.96%
7.13% 7.61%
14.98%
2.13%
3.53%
8.03%
13.85%
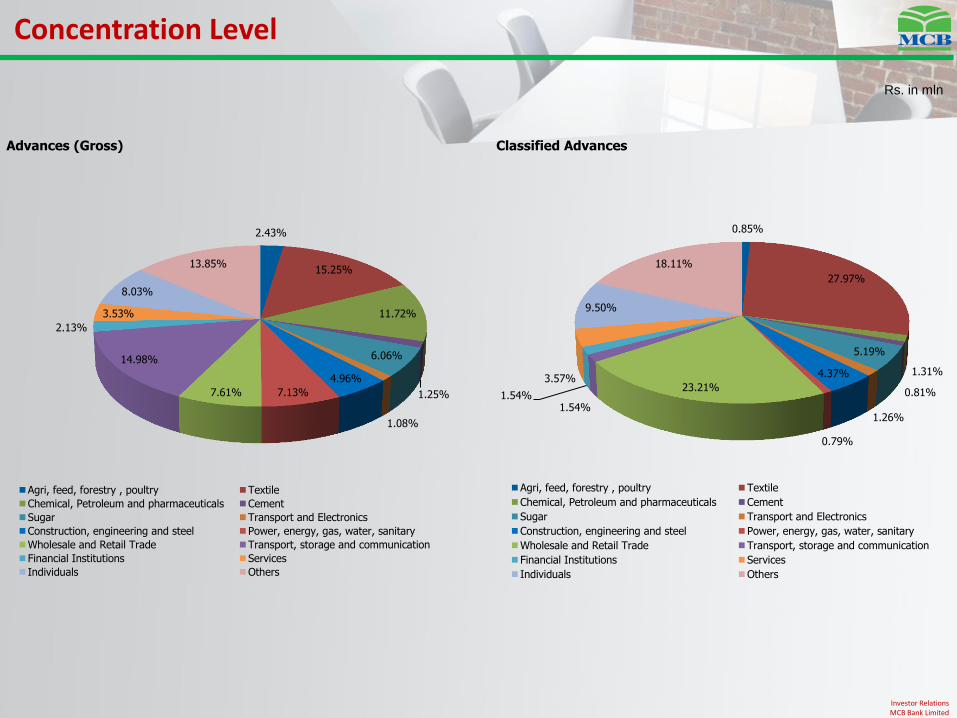
Advances (Gross)
Agri, feed, forestry , poultry Textile
Chemical, Petroleum and pharmaceuticals Cement
Sugar Transport and Electronics
Construction, engineering and steel Power, energy, gas, water, sanitary
Wholesale and Retail Trade Transport, storage and communication
Financial Institutions Services
Individuals Others
0.85%
27.97%
1.31%
0.81%
5.19%
1.26%
4.37%
0.79%
23.21%
1.54% 1.54%
3.57%
9.50%
18.11%
Classified Advances
Agri, feed, forestry , poultry Textile
Chemical, Petroleum and pharmaceuticals Cement
Sugar Transport and Electronics
Construction, engineering and steel Power, energy, gas, water, sanitary
Wholesale and Retail Trade Transport, storage and communication
Financial Institutions Services
Individuals Others
Rs. in mln
* Coverage ratio = Specific plus General Provision/NPLs
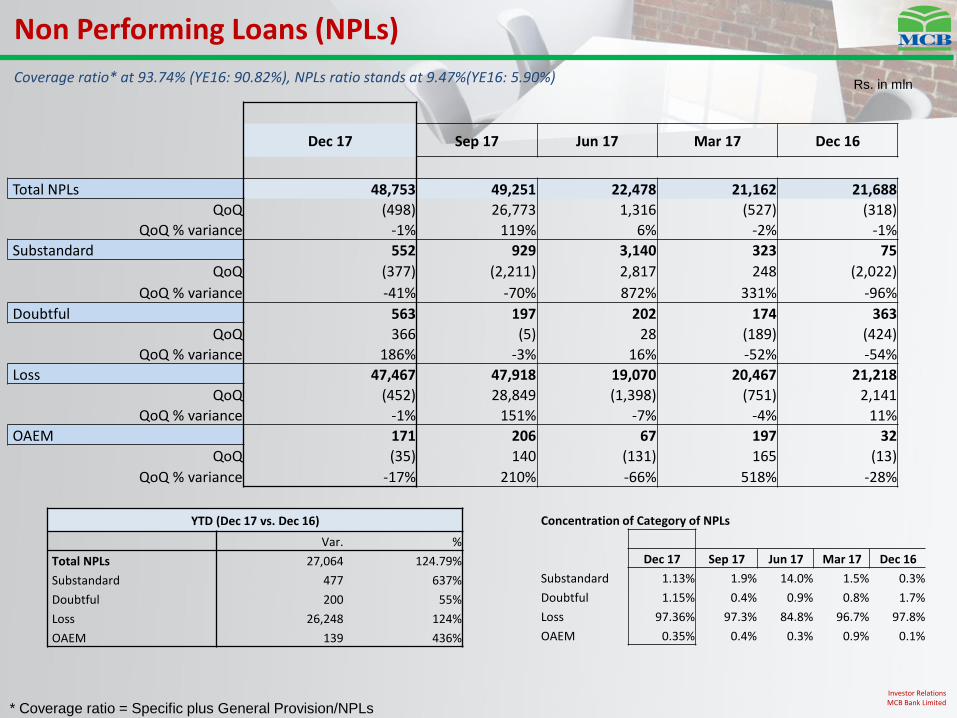
Non Performing Loans (NPLs)
Investor Relations MCB Bank Limited
Dec 17 Sep 17 Jun 17 Mar 17 Dec 16
Total NPLs 48,753 49,251 22,478 21,162 21,688
QoQ (498) 26,773 1,316 (527) (318)
QoQ % variance -1% 119% 6% -2% -1%
Substandard 552 929 3,140 323 75
QoQ (377) (2,211) 2,817 248 (2,022)
QoQ % variance -41% -70% 872% 331% -96%
Doubtful 563 197 202 174 363
QoQ 366 (5) 28 (189) (424)
QoQ % variance 186% -3% 16% -52% -54%
Loss 47,467 47,918 19,070 20,467 21,218
QoQ (452) 28,849 (1,398) (751) 2,141
QoQ % variance -1% 151% -7% -4% 11%
OAEM 171 206 67 197 32
QoQ (35) 140 (131) 165 (13)
QoQ % variance -17% 210% -66% 518% -28%
Coverage ratio* at 93.74% (YE16: 90.82%), NPLs ratio stands at 9.47%(YE16: 5.90%)
YTD (Dec 17 vs. Dec 16)
Var. %
Total NPLs 27,064 124.79%
Substandard 477 637%
Doubtful 200 55%
Loss 26,248 124%
OAEM 139 436%
Concentration of Category of NPLs
Dec 17 Sep 17 Jun 17 Mar 17 Dec 16
Substandard 1.13% 1.9% 14.0% 1.5% 0.3%
Doubtful 1.15% 0.4% 0.9% 0.8% 1.7%
Loss 97.36% 97.3% 84.8% 96.7% 97.8%
OAEM 0.35% 0.4% 0.3% 0.9% 0.1%
Rs. In mln
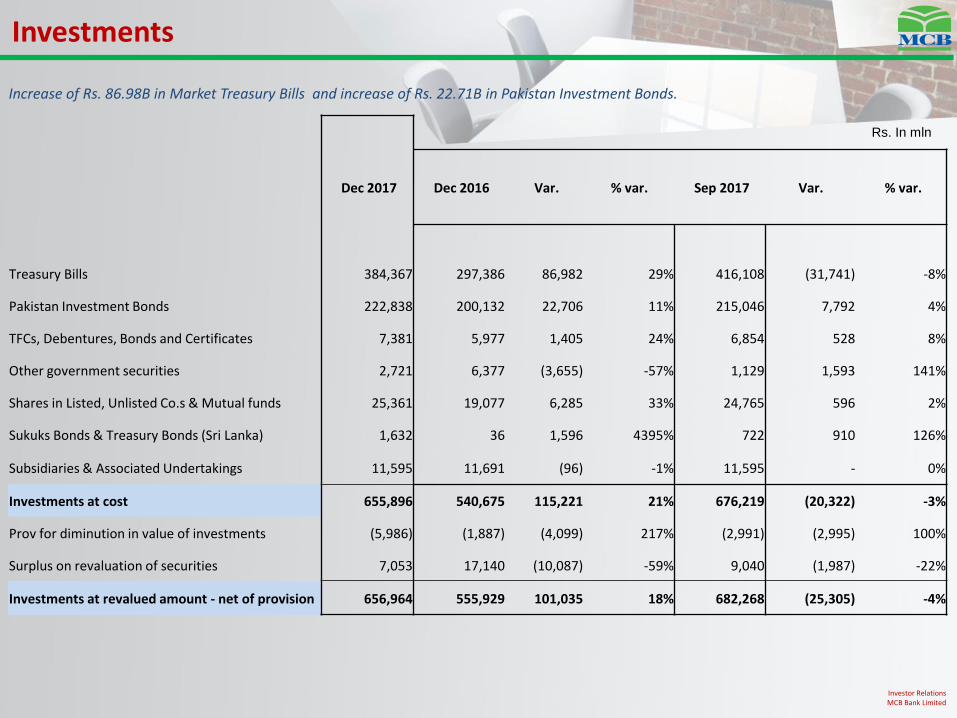
Investments
Investor Relations MCB Bank Limited
Increase of Rs. 86.98B in Market Treasury Bills and increase of Rs. 22.71B in Pakistan Investment Bonds.
Dec 2017 Dec 2016 Var. % var. Sep 2017 Var. % var.
Treasury Bills 384,367 297,386 86,982 29% 416,108 (31,741) -8%
Pakistan Investment Bonds 222,838 200,132 22,706 11% 215,046 7,792 4%
TFCs, Debentures, Bonds and Certificates 7,381 5,977 1,405 24% 6,854 528 8%
Other government securities 2,721 6,377 (3,655) -57% 1,129 1,593 141%
Shares in Listed, Unlisted Co.s & Mutual funds 25,361 19,077 6,285 33% 24,765 596 2%
Sukuks Bonds & Treasury Bonds (Sri Lanka) 1,632 36 1,596 4395% 722 910 126%
Subsidiaries & Associated Undertakings 11,595 11,691 (96) -1% 11,595 - 0%
Investments at cost 655,896 540,675 115,221 21% 676,219 (20,322) -3%
Prov for diminution in value of investments (5,986) (1,887) (4,099) 217% (2,991) (2,995) 100%
Surplus on revaluation of securities 7,053 17,140 (10,087) -59% 9,040 (1,987) -22%
Investments at revalued amount - net of provision 656,964 555,929 101,035 18% 682,268 (25,305) -4%
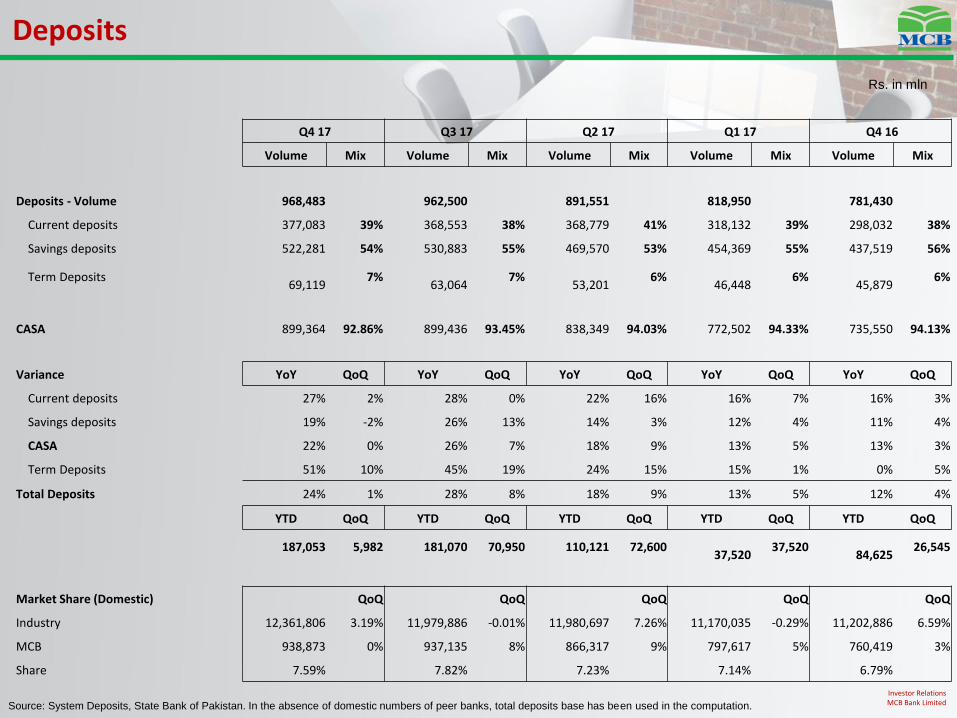
Source: System Deposits, State Bank of Pakistan. In the absence of domestic numbers of peer banks, total deposits base has been used in the computation.
Deposits
Rs. in mln
Investor Relations MCB Bank Limited
Q4 17 Q3 17 Q2 17 Q1 17 Q4 16
Volume Mix Volume Mix Volume Mix Volume Mix Volume Mix
Deposits - Volume 968,483 962,500 891,551 818,950 781,430
Current deposits 377,083 39% 368,553 38% 368,779 41% 318,132 39% 298,032 38%
Savings deposits 522,281 54% 530,883 55% 469,570 53% 454,369 55% 437,519 56%
Term Deposits
69,119 7%
63,064
7%
53,201 6%
46,448
6%
45,879 6%
CASA 899,364 92.86% 899,436 93.45% 838,349 94.03% 772,502 94.33% 735,550 94.13%
Variance YoY QoQ YoY QoQ YoY QoQ YoY QoQ YoY QoQ
Current deposits 27% 2% 28% 0% 22% 16% 16% 7% 16% 3%
Savings deposits 19% -2% 26% 13% 14% 3% 12% 4% 11% 4%
CASA 22% 0% 26% 7% 18% 9% 13% 5% 13% 3%
Term Deposits 51% 10% 45% 19% 24% 15% 15% 1% 0% 5%
Total Deposits 24% 1% 28% 8% 18% 9% 13% 5% 12% 4%
YTD QoQ YTD QoQ YTD QoQ YTD QoQ YTD QoQ
187,053 5,982 181,070 70,950 110,121 72,600
37,520 37,520
84,625
26,545
Market Share (Domestic) QoQ QoQ QoQ QoQ QoQ
Industry 12,361,806 3.19% 11,979,886 -0.01% 11,980,697 7.26% 11,170,035 -0.29% 11,202,886 6.59%
MCB 938,873 0% 937,135 8% 866,317 9% 797,617 5% 760,419 3%
Share 7.59% 7.82% 7.23% 7.14% 6.79%
Rs. In mln
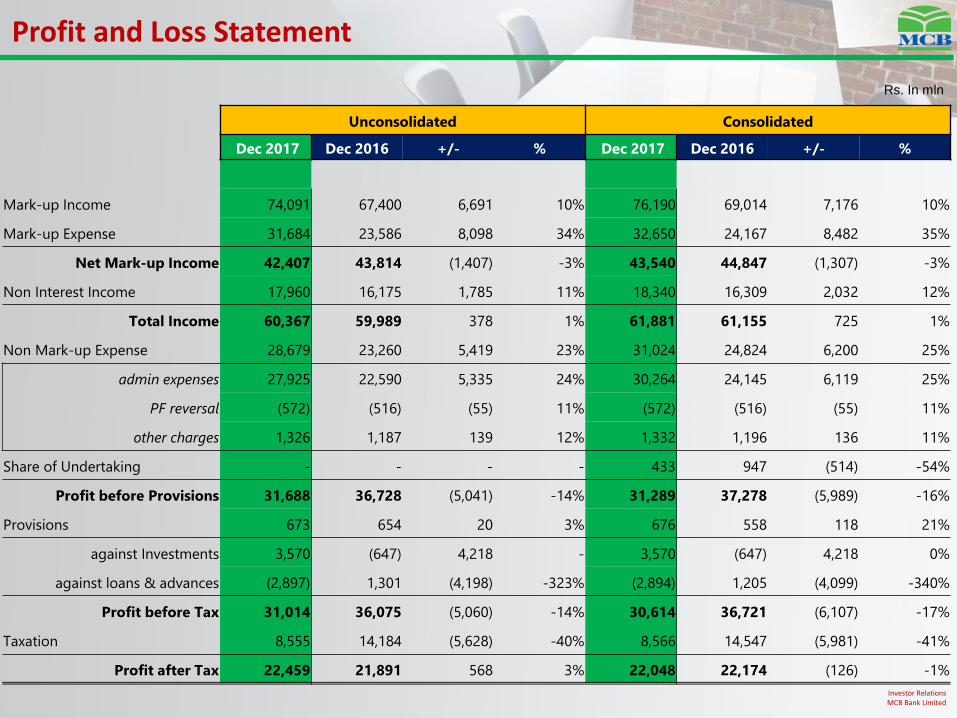
Profit and Loss Statement
Investor Relations MCB Bank Limited
Unconsolidated Consolidated
Dec 2017 Dec 2016 +/- % Dec 2017 Dec 2016 +/- %
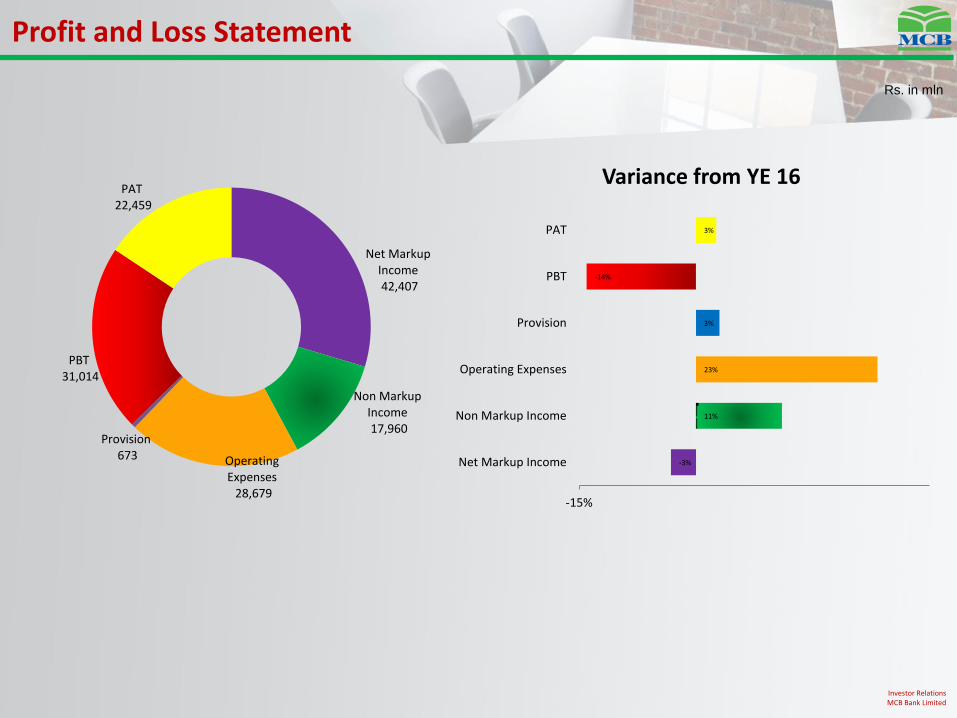
Mark-up Income 74,091 67,400 6,691 10% 76,190 69,014 7,176 10%
Mark-up Expense 31,684 23,586 8,098 34% 32,650 24,167 8,482 35%
Net Mark-up Income 42,407 43,814 (1,407) -3% 43,540 44,847 (1,307) -3%
Non Interest Income 17,960 16,175 1,785 11% 18,340 16,309 2,032 12%
Total Income 60,367 59,989 378 1% 61,881 61,155 725 1%
Non Mark-up Expense 28,679 23,260 5,419 23% 31,024 24,824 6,200 25%
admin expenses 27,925 22,590 5,335 24% 30,264 24,145 6,119 25%
PF reversal (572) (516) (55) 11% (572) (516) (55) 11%
other charges 1,326 1,187 139 12% 1,332 1,196 136 11%
Share of Undertaking - - - - 433 947 (514) -54%
Profit before Provisions 31,688 36,728 (5,041) -14% 31,289 37,278 (5,989) -16%
Provisions 673 654 20 3% 676 558 118 21%
against Investments 3,570 (647) 4,218 - 3,570 (647) 4,218 0%
against loans & advances (2,897) 1,301 (4,198) -323% (2,894) 1,205 (4,099) -340%
Profit before Tax 31,014 36,075 (5,060) -14% 30,614 36,721 (6,107) -17%
Taxation 8,555 14,184 (5,628) -40% 8,566 14,547 (5,981) -41%
Profit after Tax 22,459 21,891 568 3% 22,048 22,174 (126) -1%
Rs. in mln
Profit and Loss Statement
Investor Relations MCB Bank Limited
Net Markup Income 42,407
Non Markup Income 17,960
Operating Expenses 28,679
Provision 673
PBT 31,014
PAT 22,459
-3%
11%
23%
3%
-14%
3%
-15%
Net Markup Income
Non Markup Income
Operating Expenses
Provision
PBT
PAT
Variance from YE 16
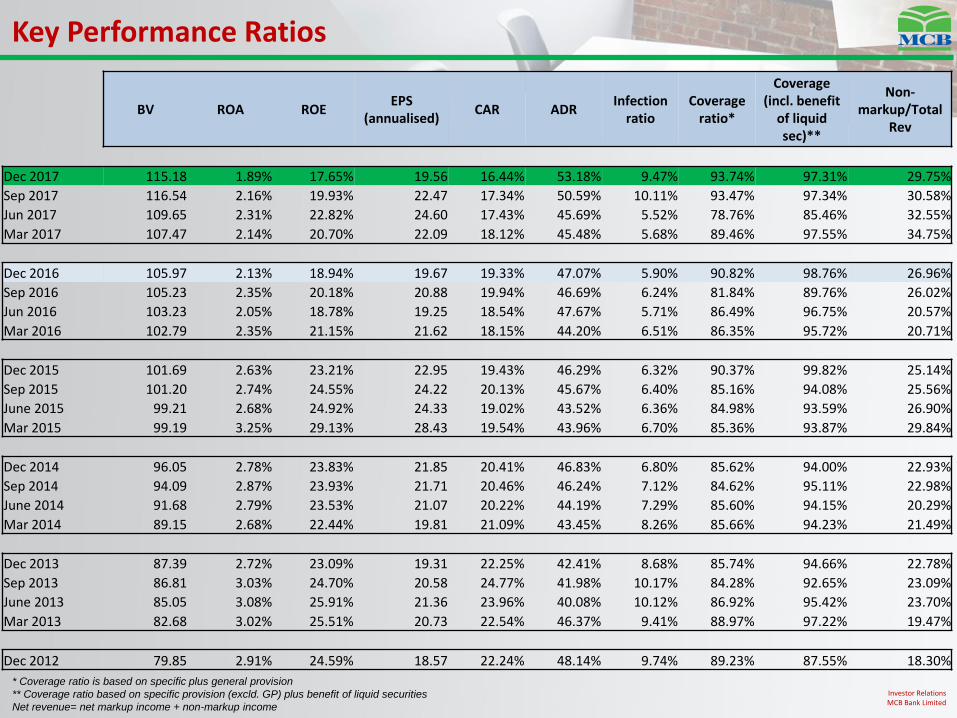
* Coverage ratio is based on specific plus general provision
** Coverage ratio based on specific provision (excld. GP) plus benefit of liquid securities
Net revenue= net markup income + non-markup income
Key Performance Ratios
Investor Relations MCB Bank Limited
BV ROA ROE EPS
(annualised) CAR ADR
Infection ratio
Coverage ratio*
Coverage (incl. benefit
of liquid sec)**
Non-markup/Total
Rev
Dec 2017 115.18 1.89% 17.65% 19.56 16.44% 53.18% 9.47% 93.74% 97.31% 29.75%
Sep 2017 116.54 2.16% 19.93% 22.47 17.34% 50.59% 10.11% 93.47% 97.34% 30.58%
Jun 2017 109.65 2.31% 22.82% 24.60 17.43% 45.69% 5.52% 78.76% 85.46% 32.55%
Mar 2017 107.47 2.14% 20.70% 22.09 18.12% 45.48% 5.68% 89.46% 97.55% 34.75%
Dec 2016 105.97 2.13% 18.94% 19.67 19.33% 47.07% 5.90% 90.82% 98.76% 26.96%
Sep 2016 105.23 2.35% 20.18% 20.88 19.94% 46.69% 6.24% 81.84% 89.76% 26.02%
Jun 2016 103.23 2.05% 18.78% 19.25 18.54% 47.67% 5.71% 86.49% 96.75% 20.57%
Mar 2016 102.79 2.35% 21.15% 21.62 18.15% 44.20% 6.51% 86.35% 95.72% 20.71%
Dec 2015 101.69 2.63% 23.21% 22.95 19.43% 46.29% 6.32% 90.37% 99.82% 25.14%
Sep 2015 101.20 2.74% 24.55% 24.22 20.13% 45.67% 6.40% 85.16% 94.08% 25.56%
June 2015 99.21 2.68% 24.92% 24.33 19.02% 43.52% 6.36% 84.98% 93.59% 26.90%
Mar 2015 99.19 3.25% 29.13% 28.43 19.54% 43.96% 6.70% 85.36% 93.87% 29.84%
Dec 2014 96.05 2.78% 23.83% 21.85 20.41% 46.83% 6.80% 85.62% 94.00% 22.93%
Sep 2014 94.09 2.87% 23.93% 21.71 20.46% 46.24% 7.12% 84.62% 95.11% 22.98%
June 2014 91.68 2.79% 23.53% 21.07 20.22% 44.19% 7.29% 85.60% 94.15% 20.29%
Mar 2014 89.15 2.68% 22.44% 19.81 21.09% 43.45% 8.26% 85.66% 94.23% 21.49%
Dec 2013 87.39 2.72% 23.09% 19.31 22.25% 42.41% 8.68% 85.74% 94.66% 22.78%
Sep 2013 86.81 3.03% 24.70% 20.58 24.77% 41.98% 10.17% 84.28% 92.65% 23.09%
June 2013 85.05 3.08% 25.91% 21.36 23.96% 40.08% 10.12% 86.92% 95.42% 23.70%
Mar 2013 82.68 3.02% 25.51% 20.73 22.54% 46.37% 9.41% 88.97% 97.22% 19.47%
Dec 2012 79.85 2.91% 24.59% 18.57 22.24% 48.14% 9.74% 89.23% 87.55% 18.30%
Thankyou For further details on MCB Bank Limited, please visit www.mcb.com.pk
For any query/comments/feedback, please e-mail [email protected]
MCB Bank Limited