mckinsey - mbb time for rationality
TRANSCRIPT
Mobile Data:Time For Rationality
McKinsey Telecom Extranet Webcast
September 23, 2010
1
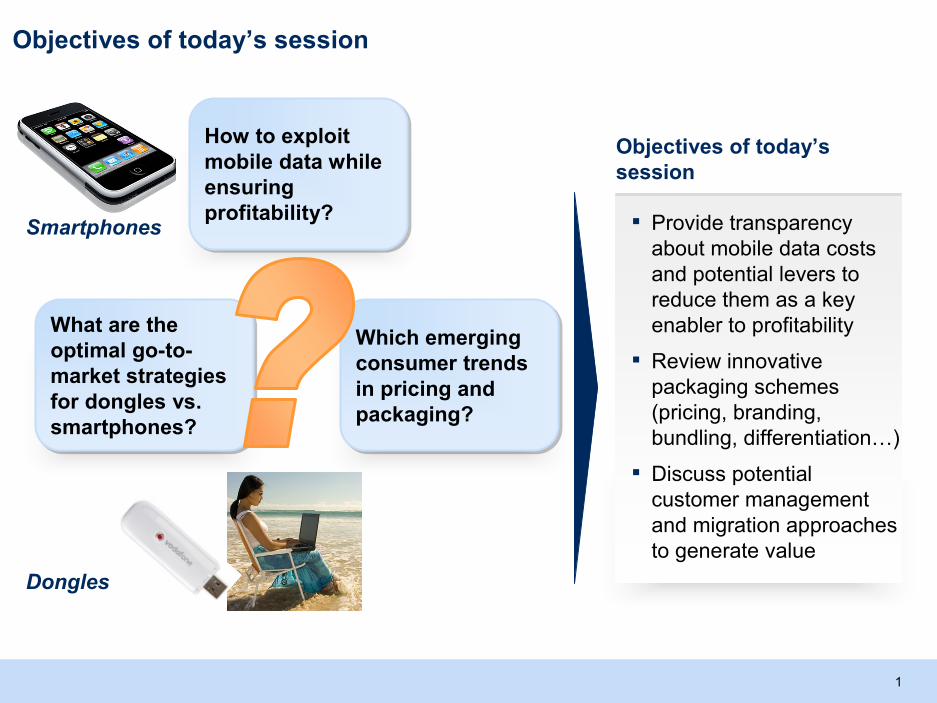
How to exploitmobile data whileensuringprofitability?
How to exploitmobile data whileensuringprofitability?
Which emergingconsumer trendsin pricing andpackaging?
Which emergingconsumer trendsin pricing andpackaging?
▪ Provide transparencyabout mobile data costsand potential levers toreduce them as a keyenabler to profitability
▪ Review innovativepackaging schemes(pricing, branding,bundling, differentiation…)
▪ Discuss potentialcustomer managementand migration approachesto generate value
Objectives of today’s session
Objectives of today’ssession
What are theoptimal go-to-market strategiesfor dongles vs.smartphones?
What are theoptimal go-to-market strategiesfor dongles vs.smartphones?
Smartphones
Dongles
2
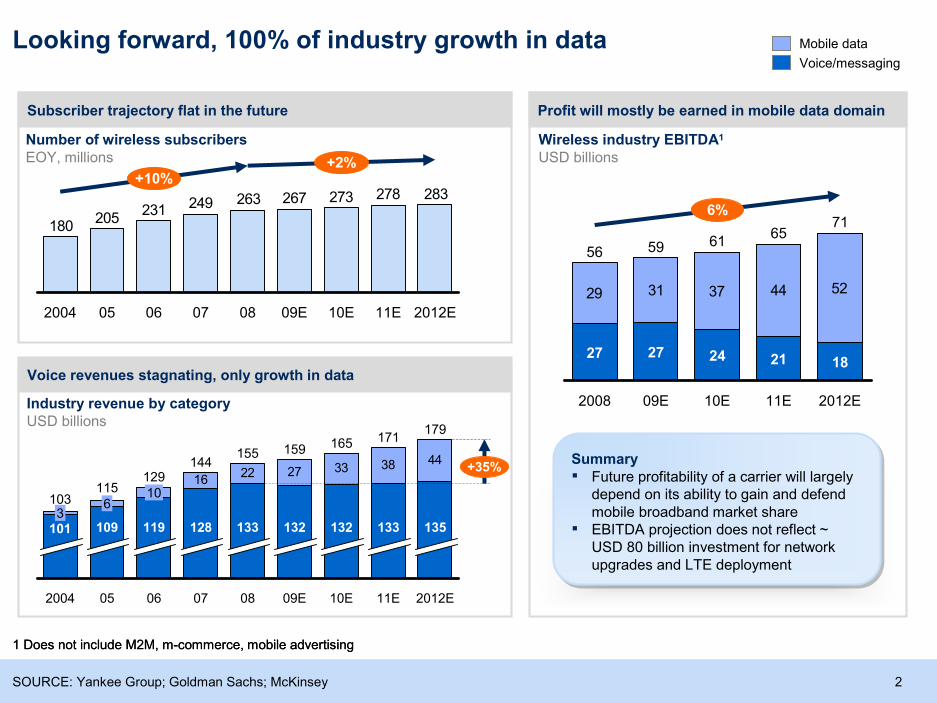
Profit will mostly be earned in mobile data domain
Looking forward, 100% of industry growth in data
SOURCE: Yankee Group; Goldman Sachs; McKinsey
Mobile data
Voice/messaging
1 Does not include M2M, m-commerce, mobile advertising
Subscriber trajectory flat in the future
Number of wireless subscribersEOY, millions
Industry revenue by categoryUSD billions
Wireless industry EBITDA1
USD billions
Voice revenues stagnating, only growth in data
1 Does not include M2M, m-commerce, mobile advertising
283278273267263249231205
180
10E
+2%+10%
2012E11E09E080706052004
22 27 33 38 44
16
133
07
144
133
179
06
129
119
10
05
115
109
6
2004
103
2012E
3
10E
165
135132
11E
128
171
09E
159
132
08
155
101
+35%
29 31 37 44 52
61
6%
2012E
24
71
18
09E
59
11E
27
65
21
2008
56
10E
27
Summary▪ Future profitability of a carrier will largely
depend on its ability to gain and defendmobile broadband market share
▪ EBITDA projection does not reflect ~USD 80 billion investment for networkupgrades and LTE deployment
3
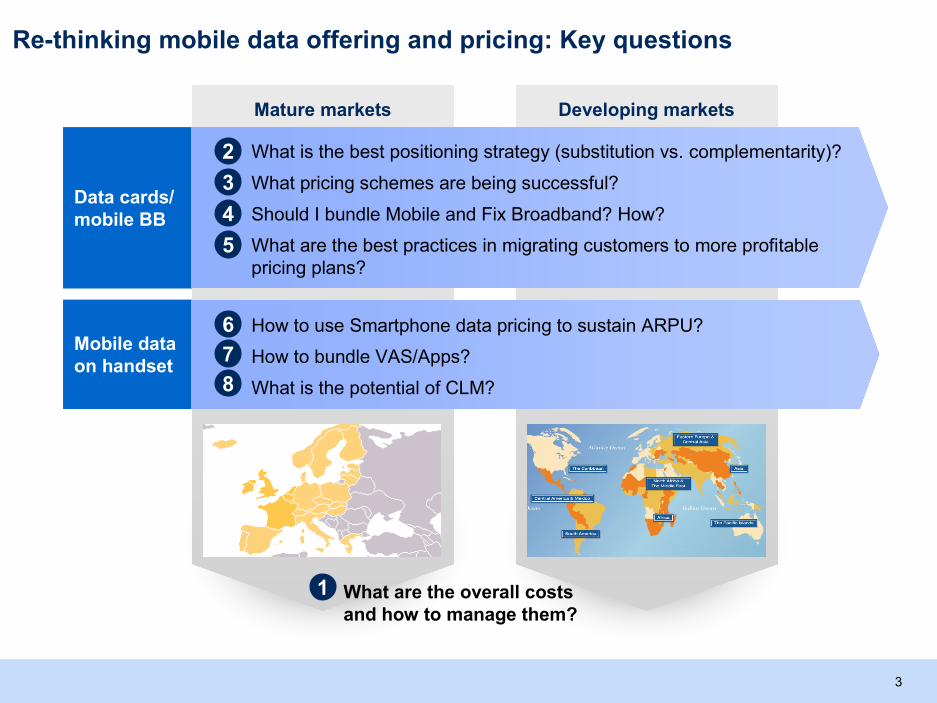
Re-thinking mobile data offering and pricing: Key questions
Developing marketsMature markets
What are the overall costsand how to manage them?
1
Mobile dataon handset
Data cards/mobile BB
What is the best positioning strategy (substitution vs. complementarity)?
What pricing schemes are being successful?
Should I bundle Mobile and Fix Broadband? How?
What are the best practices in migrating customers to more profitablepricing plans?
How to use Smartphone data pricing to sustain ARPU?
How to bundle VAS/Apps?
What is the potential of CLM?
2
3
4
5
6
7
8
4
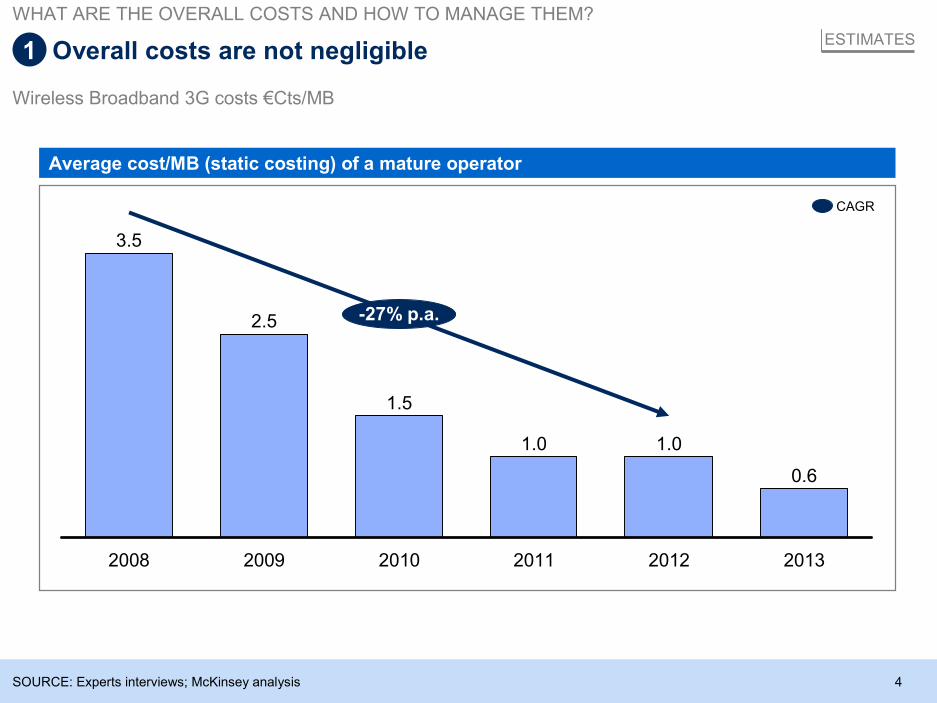
Average cost/MB (static costing) of a mature operator
ESTIMATES
Wireless Broadband 3G costs €Cts/MB
SOURCE: Experts interviews; McKinsey analysis
-27% p.a.
2013
0.6
2012
1.0
2011
1.0
2010
1.5
2009
2.5
2008
3.5
CAGR
Overall costs are not negligible
WHAT ARE THE OVERALL COSTS AND HOW TO MANAGE THEM?
1
5
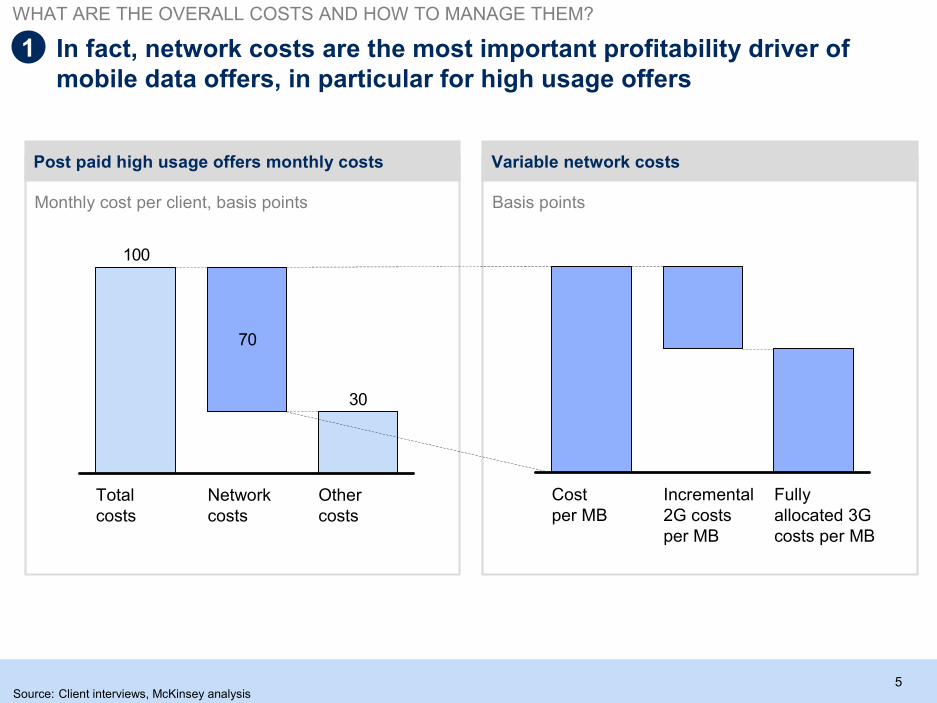
Post paid high usage offers monthly costs
Monthly cost per client, basis points
Variable network costs
Basis points
In fact, network costs are the most important profitability driver ofmobile data offers, in particular for high usage offers
30
70
100
Othercosts
Networkcosts
Totalcosts
Fullyallocated 3Gcosts per MB
Incremental2G costsper MB
Costper MB
Source: Client interviews, McKinsey analysis
1
WHAT ARE THE OVERALL COSTS AND HOW TO MANAGE THEM?
6
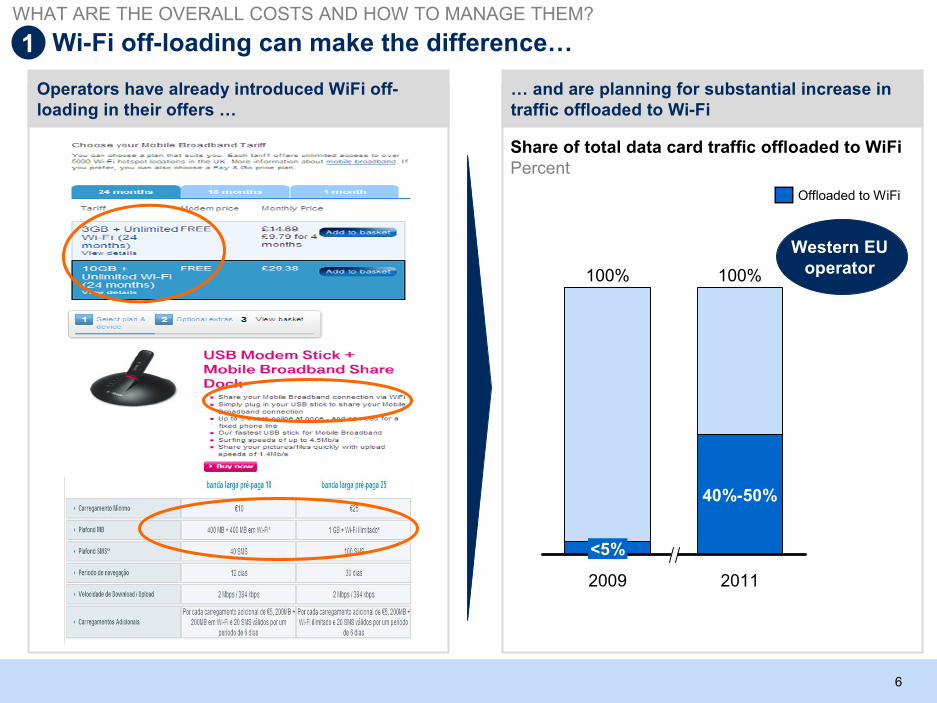
… and are planning for substantial increase intraffic offloaded to Wi-Fi
Operators have already introduced WiFi off-loading in their offers …
Wi-Fi off-loading can make the difference…
Share of total data card traffic offloaded to WiFiPercent
100%
2011
40%-50%
2009
100%
<5%
Western EUoperator
Offloaded to WiFi
1
WHAT ARE THE OVERALL COSTS AND HOW TO MANAGE THEM?
7
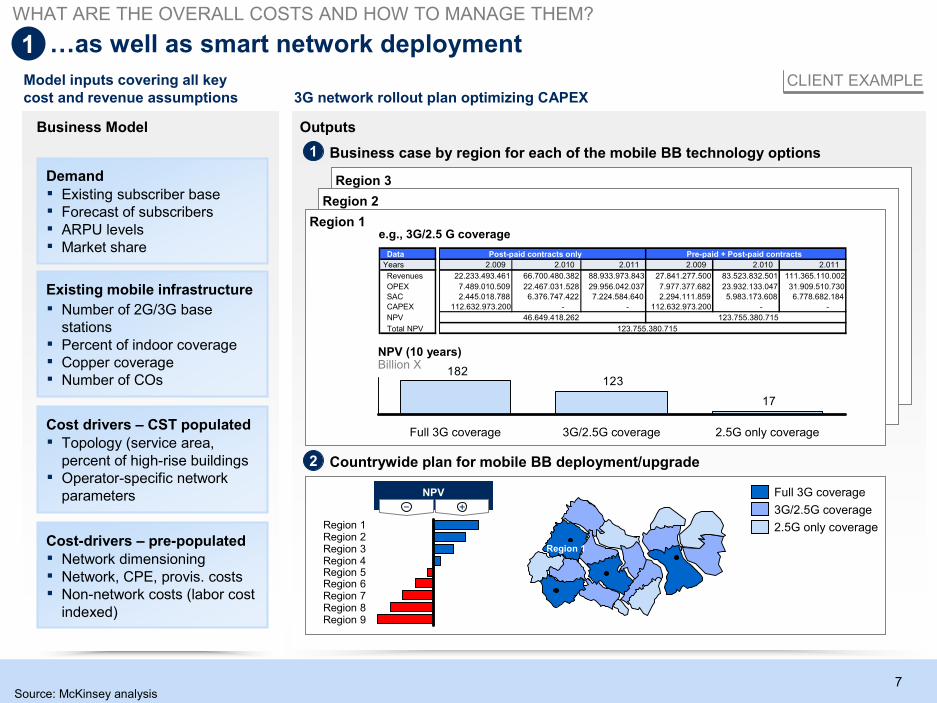
Business case by region for each of the mobile BB technology options
Countrywide plan for mobile BB deployment/upgrade
1
2
Region 3
Region 2
Region 1
…as well as smart network deployment
Source: McKinsey analysis
17
123182
NPV (10 years)Billion X
2.5G only coverage3G/2.5G coverageFull 3G coverage
Model inputs covering all keycost and revenue assumptions
Demand
▪ Existing subscriber base▪ Forecast of subscribers▪ ARPU levels▪ Market share
Existing mobile infrastructure
▪ Number of 2G/3G basestations
▪ Percent of indoor coverage▪ Copper coverage▪ Number of COs
Cost drivers – CST populated▪ Topology (service area,
percent of high-rise buildings▪ Operator-specific network
parameters
Cost-drivers – pre-populated▪ Network dimensioning▪ Network, CPE, provis. costs▪ Non-network costs (labor cost
indexed)
Business Model
e.g., 3G/2.5 G coverage
Data
Years 2.009 2.010 2.011 2.009 2.010 2.011
Revenues 22.233.493.461 66.700.480.382 88.933.973.843 27.841.277.500 83.523.832.501 111.365.110.002
OPEX 7.489.010.509 22.467.031.528 29.956.042.037 7.977.377.682 23.932.133.047 31.909.510.730
SAC 2.445.018.788 6.376.747.422 7.224.584.640 2.294.111.859 5.983.173.608 6.778.682.184
CAPEX 112.632.973.200 - - 112.632.973.200 - -
NPV 46.649.418.262 123.755.380.715
Total NPV
Post-paid contracts only Pre-paid + Post-paid contracts
123.755.380.715
3G network rollout plan optimizing CAPEX
Full 3G coverage
3G/2.5G coverage
2.5G only coverage
Region 1
Region 9Region 8Region 7Region 6Region 5Region 4Region 3Region 2Region 1
NPV
1
WHAT ARE THE OVERALL COSTS AND HOW TO MANAGE THEM?
CLIENT EXAMPLE
Outputs
8
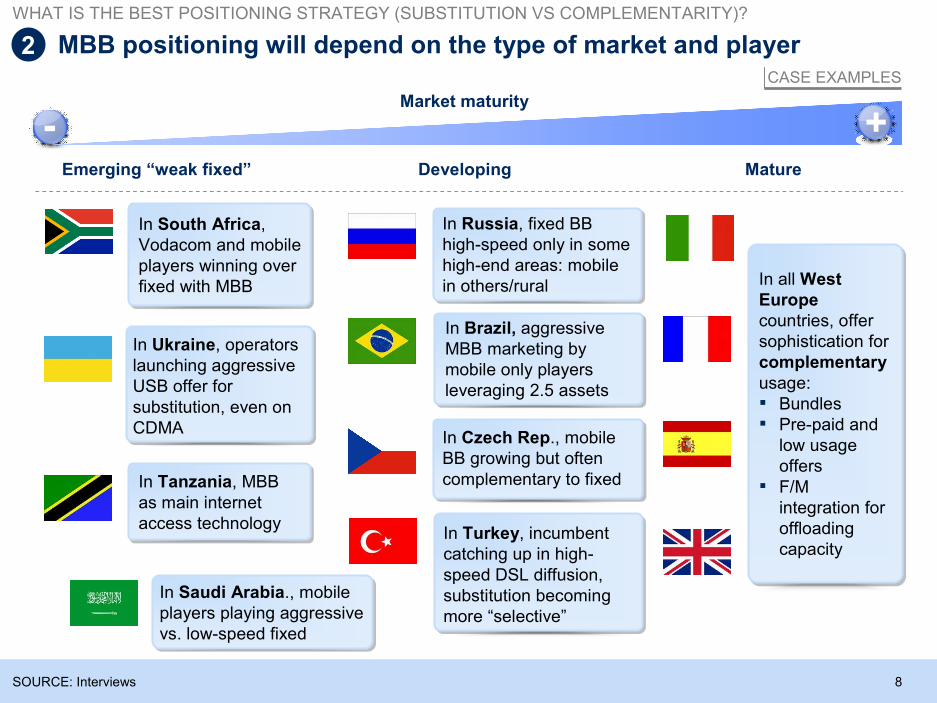
MBB positioning will depend on the type of market and player
SOURCE: Interviews
-MatureEmerging “weak fixed” Developing
Market maturity
+
In all WestEuropecountries, offersophistication forcomplementaryusage:▪ Bundles▪ Pre-paid and
low usageoffers
▪ F/Mintegration foroffloadingcapacity
In Ukraine, operatorslaunching aggressiveUSB offer forsubstitution, even onCDMA
In Russia, fixed BBhigh-speed only in somehigh-end areas: mobilein others/rural
In Tanzania, MBBas main internetaccess technology
In South Africa,Vodacom and mobileplayers winning overfixed with MBB
In Turkey, incumbentcatching up in high-speed DSL diffusion,substitution becomingmore “selective”
In Czech Rep., mobileBB growing but oftencomplementary to fixed
In Saudi Arabia., mobileplayers playing aggressivevs. low-speed fixed
In Brazil, aggressiveMBB marketing bymobile only playersleveraging 2.5 assets
2
WHAT IS THE BEST POSITIONING STRATEGY (SUBSTITUTION VS COMPLEMENTARITY)?
CASE EXAMPLES
9
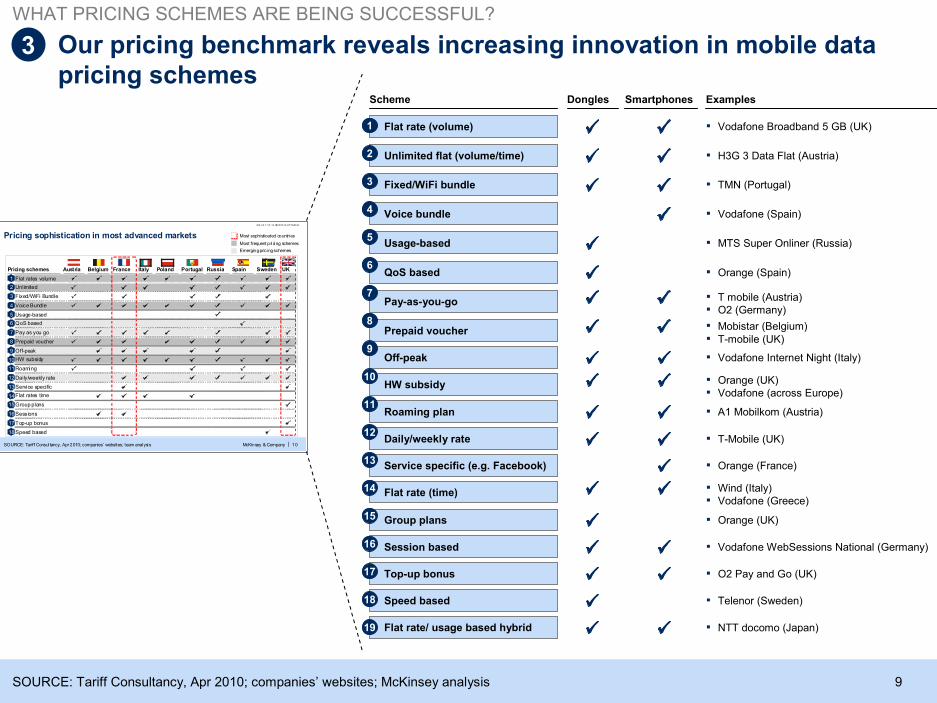
Our pricing benchmark reveals increasing innovation in mobile datapricing schemes
3
McKinsey & Company 10
M IL-24.1 /13 .12- 08022010 -67794/A B
|
Pricing sophistication in most advanced markets
SOURCE: Tariff Consul tancy, Apr 2010; companies’ websites; team analysis
Most sophisticated countries
Most frequent p ricing schemes
Emergingpricingschemes
Pricing schemes
1
Unlimited2
Fixed/WiFi Bundle3
Voice Bundle4
Usage-based5
Prepaid voucher8
Off-peak9
HW subsidy10
Roaming11
Daily/weekly rate12
Service specific13
Flat rates time14
Group plans15
Sessions16
Top-up bonus17
Speed based18
Pay as you go7
QoS based6
Belgium France Portugal RussiaPolandItalyAustria Spain Sweden
Flat rates volume
UK
WHAT PRICING SCHEMES ARE BEING SUCCESSFUL?
SOURCE: Tariff Consultancy, Apr 2010; companies’ websites; McKinsey analysis
▪ TMN (Portugal)
ExamplesSmartphones
▪ Vodafone Broadband 5 GB (UK)
▪ H3G 3 Data Flat (Austria)
▪ Orange (Spain)
▪ MTS Super Onliner (Russia)
▪ Vodafone (Spain)
▪ T mobile (Austria)▪ O2 (Germany)
▪ Mobistar (Belgium)▪ T-mobile (UK)
▪ Vodafone Internet Night (Italy)
▪ Orange (UK)▪ Vodafone (across Europe)
▪ A1 Mobilkom (Austria)
▪ T-Mobile (UK)
▪ Orange (France)
▪ Wind (Italy)▪ Vodafone (Greece)
▪ Orange (UK)
▪ Vodafone WebSessions National (Germany)
▪ O2 Pay and Go (UK)
▪ Telenor (Sweden)
▪ NTT docomo (Japan)
Scheme
Fixed/WiFi bundle
Dongles
Flat rate (volume)
Unlimited flat (volume/time)
QoS based
Usage-based
Voice bundle
Pay-as-you-go
Prepaid voucher
Off-peak
HW subsidy
Roaming plan
Daily/weekly rate
Service specific (e.g. Facebook)
Flat rate (time)
Group plans
Session based
Top-up bonus
Speed based
Flat rate/ usage based hybrid
3
1
2
6
5
4
7
8
9
10
11
12
13
14
15
16
17
18
19
10
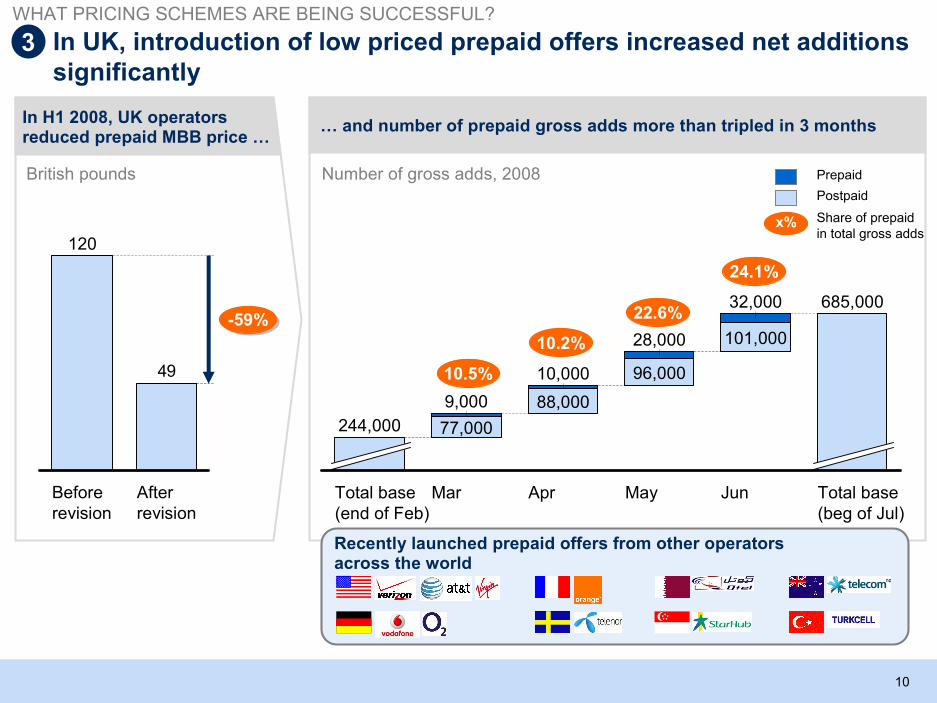
… and number of prepaid gross adds more than tripled in 3 months
In UK, introduction of low priced prepaid offers increased net additionssignificantly
Total base(beg of Jul)
685,000
Jun
101,000
32,000
May
96,000
28,000
Apr
88,000
10,000
Mar
77,000
9,000
Total base(end of Feb)
244,000
Prepaid
Postpaid
Share of prepaidin total gross adds
Number of gross adds, 2008
Recently launched prepaid offers from other operatorsacross the world
In H1 2008, UK operatorsreduced prepaid MBB price …
49
Beforerevision
120
Afterrevision
-59%-59%
British pounds
x%
10.2%
22.6%
24.1%
10.5%
3WHAT PRICING SCHEMES ARE BEING SUCCESSFUL?
11
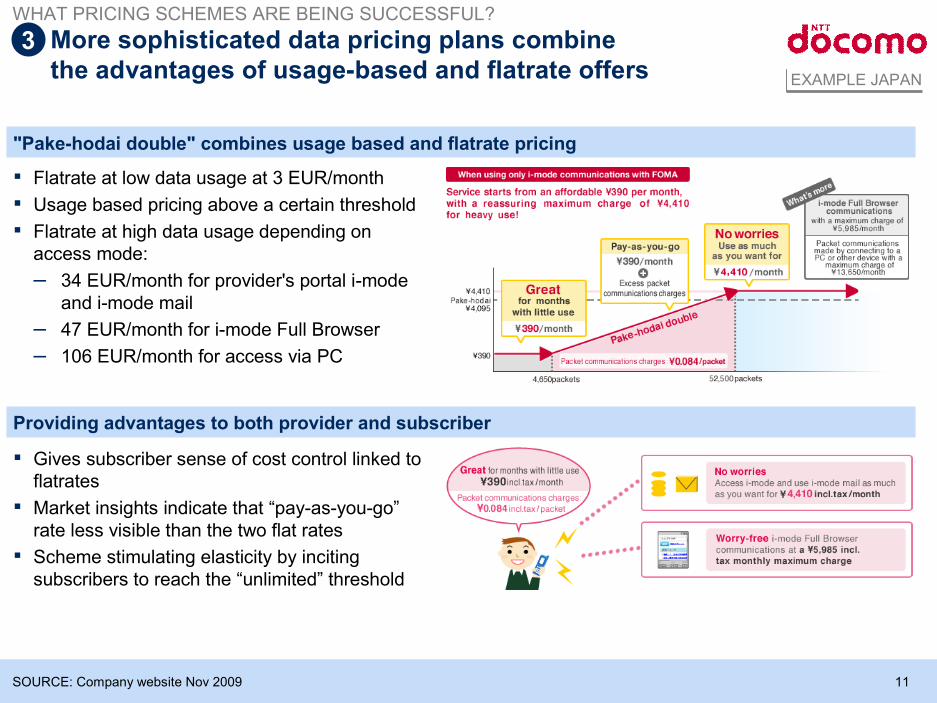
More sophisticated data pricing plans combinethe advantages of usage-based and flatrate offers
SOURCE: Company website Nov 2009
EXAMPLE JAPAN
"Pake-hodai double" combines usage based and flatrate pricing
Providing advantages to both provider and subscriber
▪ Flatrate at low data usage at 3 EUR/month
▪ Usage based pricing above a certain threshold
▪ Flatrate at high data usage depending onaccess mode:
– 34 EUR/month for provider's portal i-modeand i-mode mail
– 47 EUR/month for i-mode Full Browser
– 106 EUR/month for access via PC
▪ Gives subscriber sense of cost control linked toflatrates
▪ Market insights indicate that “pay-as-you-go”rate less visible than the two flat rates
▪ Scheme stimulating elasticity by incitingsubscribers to reach the “unlimited” threshold
3WHAT PRICING SCHEMES ARE BEING SUCCESSFUL?
12
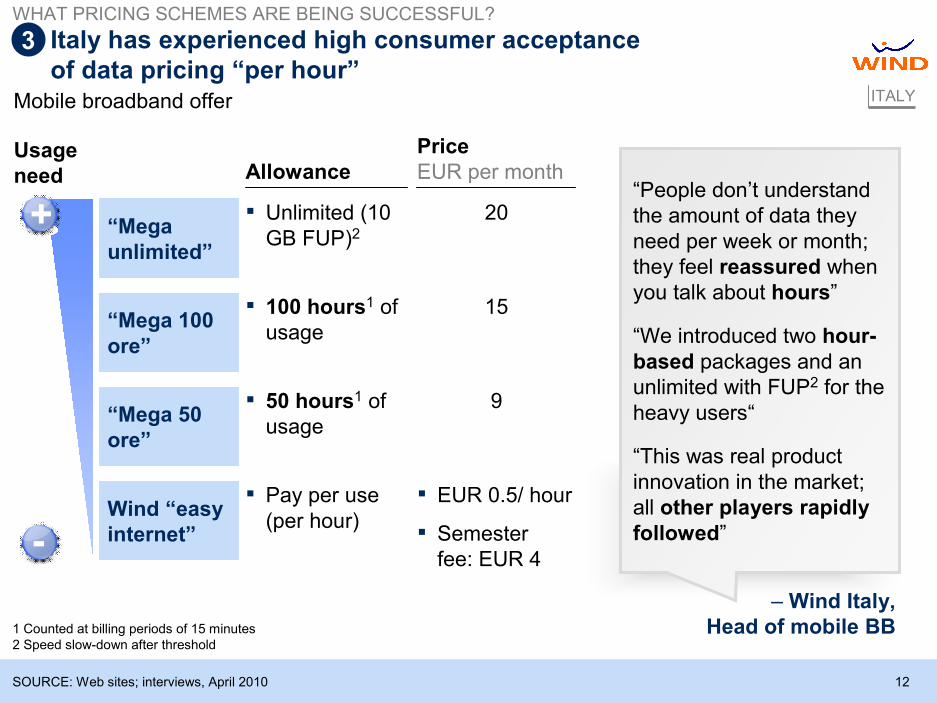
Italy has experienced high consumer acceptanceof data pricing “per hour”
1 Counted at billing periods of 15 minutes2 Speed slow-down after threshold
SOURCE: Web sites; interviews, April 2010
Mobile broadband offer ITALY
Usageneed Allowance
▪ 100 hours1 ofusage
“Mega 100ore”
▪ 50 hours1 ofusage
“Mega 50ore”
▪ Unlimited (10GB FUP)2“Mega
unlimited”
▪ Pay per use(per hour)
Wind “easyinternet”
“People don’t understandthe amount of data theyneed per week or month;they feel reassured whenyou talk about hours”
“We introduced two hour-based packages and anunlimited with FUP2 for theheavy users“
“This was real productinnovation in the market;all other players rapidlyfollowed”
– Wind Italy,Head of mobile BB
PriceEUR per month
15
9
20
▪ EUR 0.5/ hour
▪ Semesterfee: EUR 4
WHAT PRICING SCHEMES ARE BEING SUCCESSFUL?
3
-
+
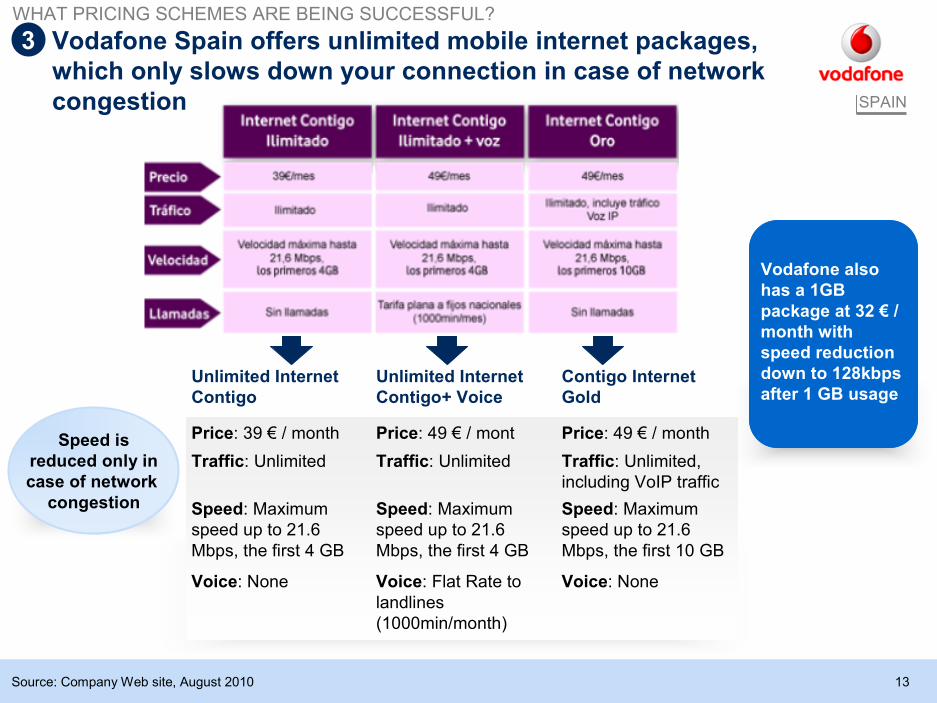
13Source: Company Web site, August 2010
SPAIN
Speed isreduced only incase of network
congestion
WHAT PRICING SCHEMES ARE BEING SUCCESSFUL?
Vodafone Spain offers unlimited mobile internet packages,which only slows down your connection in case of networkcongestion
Unlimited InternetContigo
Price: 39 € / month
Traffic: Unlimited
Speed: Maximumspeed up to 21.6Mbps, the first 4 GB
Voice: None
Unlimited InternetContigo+ Voice
Price: 49 € / mont
Traffic: Unlimited
Speed: Maximumspeed up to 21.6Mbps, the first 4 GB
Voice: Flat Rate tolandlines(1000min/month)
Contigo InternetGold
Price: 49 € / month
Traffic: Unlimited,including VoIP traffic
Speed: Maximumspeed up to 21.6Mbps, the first 10 GB
Voice: None
Vodafone alsohas a 1GBpackage at 32 € /month withspeed reductiondown to 128kbpsafter 1 GB usage
3
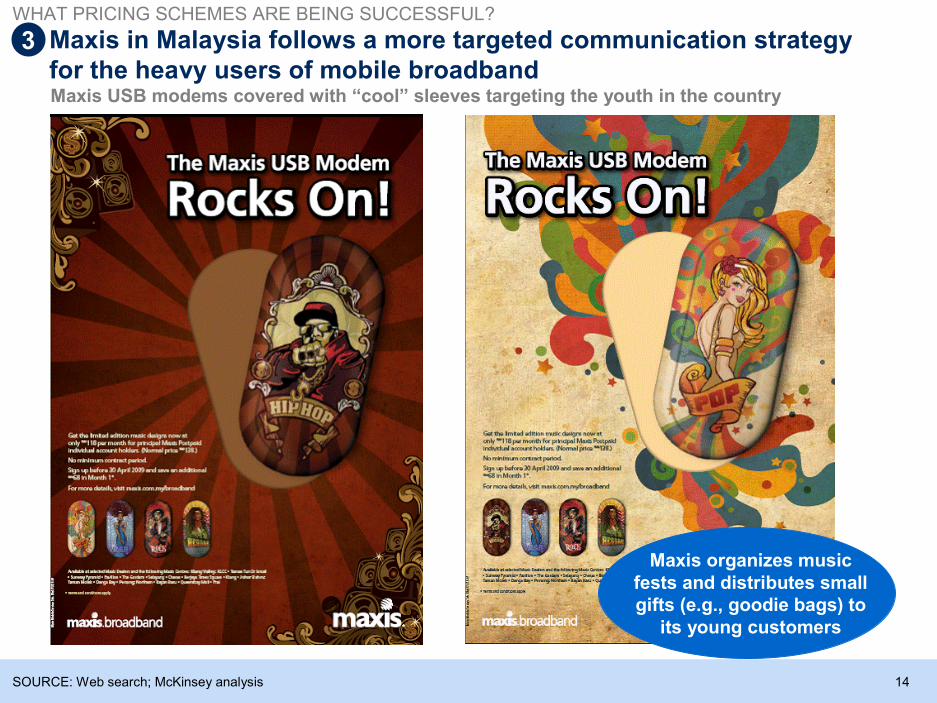
14
Maxis in Malaysia follows a more targeted communication strategyfor the heavy users of mobile broadbandMaxis USB modems covered with “cool” sleeves targeting the youth in the country
Maxis organizes musicfests and distributes smallgifts (e.g., goodie bags) to
its young customers
SOURCE: Web search; McKinsey analysis
3WHAT PRICING SCHEMES ARE BEING SUCCESSFUL?
15
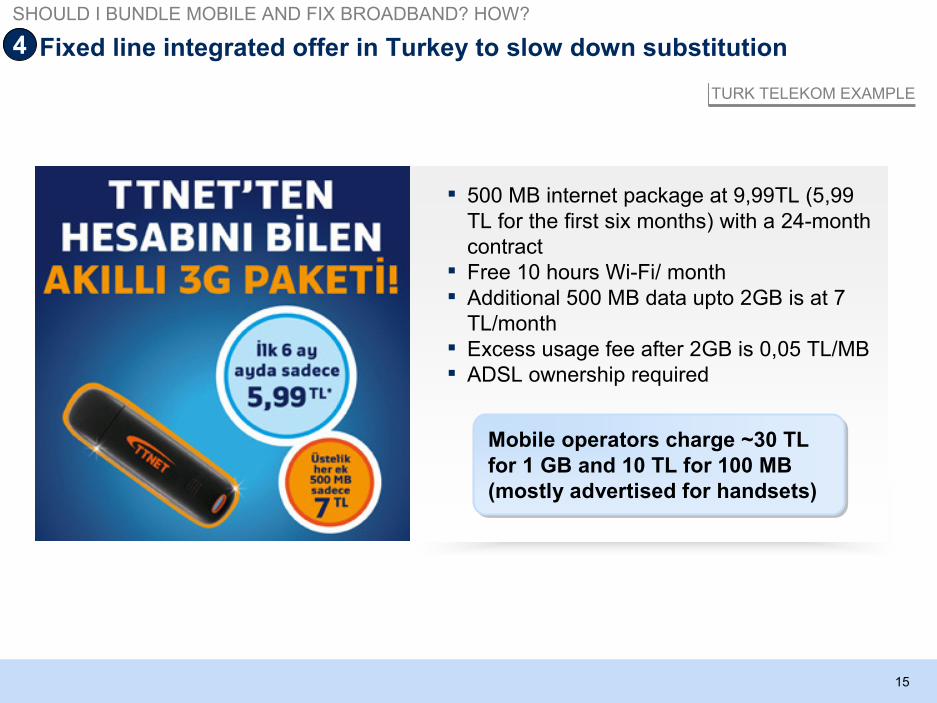
Fixed line integrated offer in Turkey to slow down substitution
▪ 500 MB internet package at 9,99TL (5,99TL for the first six months) with a 24-monthcontract
▪ Free 10 hours Wi-Fi/ month▪ Additional 500 MB data upto 2GB is at 7
TL/month▪ Excess usage fee after 2GB is 0,05 TL/MB▪ ADSL ownership required
Mobile operators charge ~30 TLfor 1 GB and 10 TL for 100 MB(mostly advertised for handsets)
TURK TELEKOM EXAMPLE
4
SHOULD I BUNDLE MOBILE AND FIX BROADBAND? HOW?
16
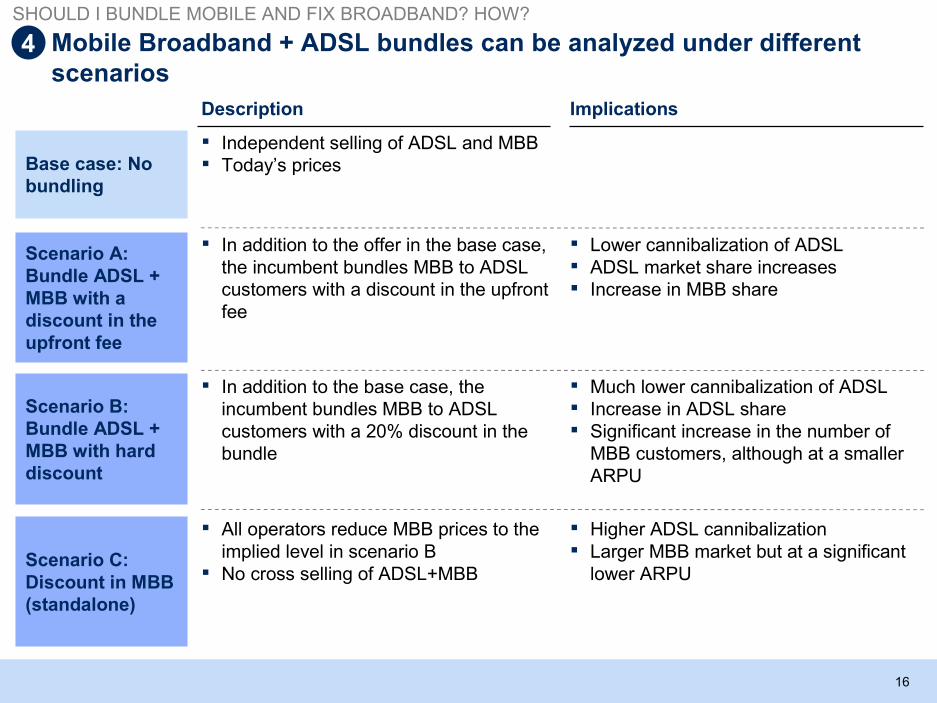
Mobile Broadband + ADSL bundles can be analyzed under differentscenarios
Scenario A:Bundle ADSL +MBB with adiscount in theupfront fee
▪ In addition to the offer in the base case,the incumbent bundles MBB to ADSLcustomers with a discount in the upfrontfee
▪ Lower cannibalization of ADSL▪ ADSL market share increases▪ Increase in MBB share
Description Implications
Scenario B:Bundle ADSL +MBB with harddiscount
▪ In addition to the base case, theincumbent bundles MBB to ADSLcustomers with a 20% discount in thebundle
▪ Much lower cannibalization of ADSL▪ Increase in ADSL share▪ Significant increase in the number of
MBB customers, although at a smallerARPU
Scenario C:Discount in MBB(standalone)
▪ All operators reduce MBB prices to theimplied level in scenario B
▪ No cross selling of ADSL+MBB
▪ Higher ADSL cannibalization▪ Larger MBB market but at a significant
lower ARPU
Base case: Nobundling
▪ Independent selling of ADSL and MBB▪ Today’s prices
4
SHOULD I BUNDLE MOBILE AND FIX BROADBAND? HOW?
17
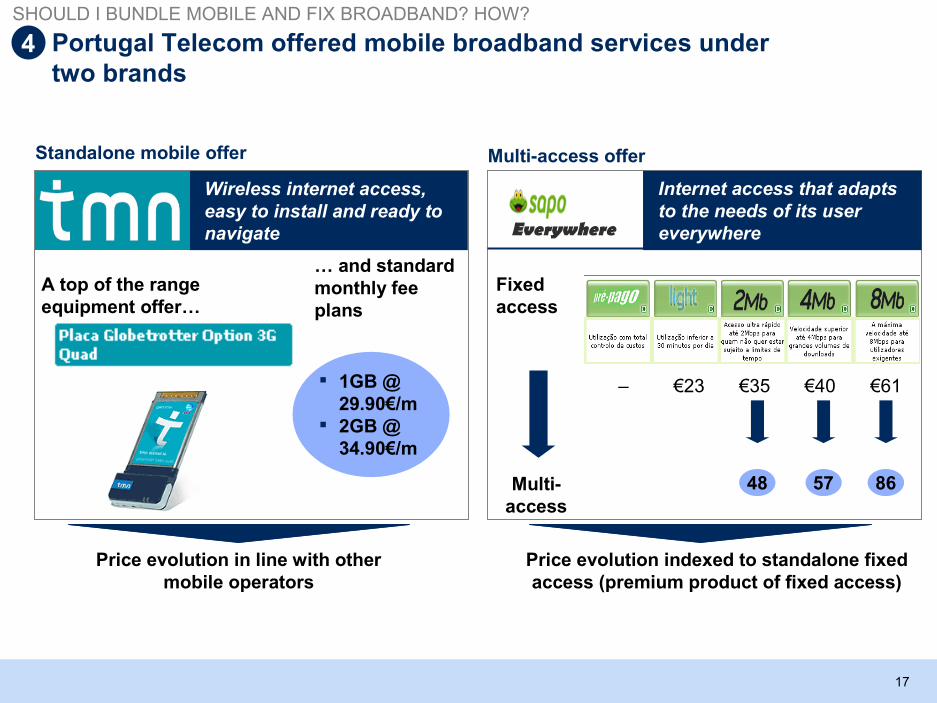
Portugal Telecom offered mobile broadband services undertwo brands
Standalone mobile offer Multi-access offer
Price evolution in line with othermobile operators
Price evolution indexed to standalone fixedaccess (premium product of fixed access)
Wireless internet access,easy to install and ready tonavigate Everywhere
▪ 1GB @29.90€/m
▪ 2GB @34.90€/m
Fixedaccess
– €61€40€35€23
Multi-access
48 57 86
Internet access that adaptsto the needs of its usereverywhere
A top of the rangeequipment offer…
… and standardmonthly feeplans
SHOULD I BUNDLE MOBILE AND FIX BROADBAND? HOW?
4
18
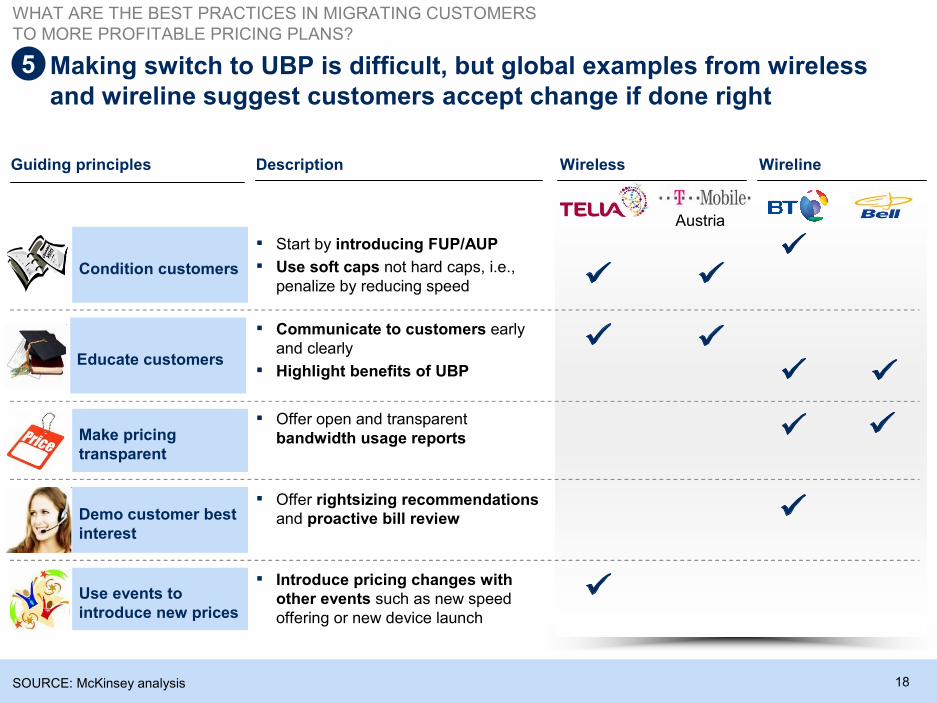
Making switch to UBP is difficult, but global examples from wirelessand wireline suggest customers accept change if done right
Guiding principles Wireless Wireline
Austria
Condition customers
▪ Start by introducing FUP/AUP
▪ Use soft caps not hard caps, i.e.,penalize by reducing speed
Educate customers
▪ Communicate to customers earlyand clearly
▪ Highlight benefits of UBP
Make pricingtransparent
▪ Offer open and transparentbandwidth usage reports
Demo customer bestinterest
▪ Offer rightsizing recommendationsand proactive bill review
Use events tointroduce new prices
▪ Introduce pricing changes withother events such as new speedoffering or new device launch
Description
SOURCE: McKinsey analysis
WHAT ARE THE BEST PRACTICES IN MIGRATING CUSTOMERSTO MORE PROFITABLE PRICING PLANS?
5
19
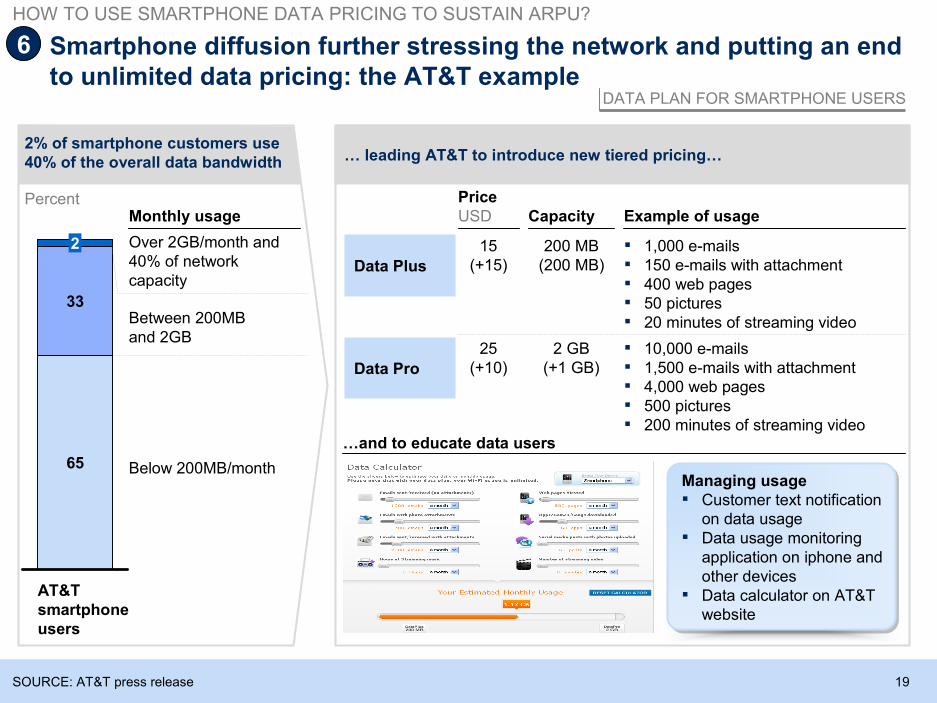
2% of smartphone customers use40% of the overall data bandwidth
Monthly usage
Over 2GB/month and40% of networkcapacity
Between 200MBand 2GB
Below 200MB/month
… leading AT&T to introduce new tiered pricing…
CapacityPriceUSD Example of usage
Data Plus
15(+15)
200 MB(200 MB)
▪ 1,000 e-mails▪ 150 e-mails with attachment▪ 400 web pages▪ 50 pictures▪ 20 minutes of streaming video
Data Pro
25(+10)
2 GB(+1 GB)
▪ 10,000 e-mails▪ 1,500 e-mails with attachment▪ 4,000 web pages▪ 500 pictures▪ 200 minutes of streaming video
…and to educate data users
Managing usage▪ Customer text notification
on data usage▪ Data usage monitoring
application on iphone andother devices
▪ Data calculator on AT&Twebsite
Smartphone diffusion further stressing the network and putting an endto unlimited data pricing: the AT&T example
SOURCE: AT&T press release
AT&Tsmartphoneusers
65
33
2
DATA PLAN FOR SMARTPHONE USERS
6
Percent
HOW TO USE SMARTPHONE DATA PRICING TO SUSTAIN ARPU?
20
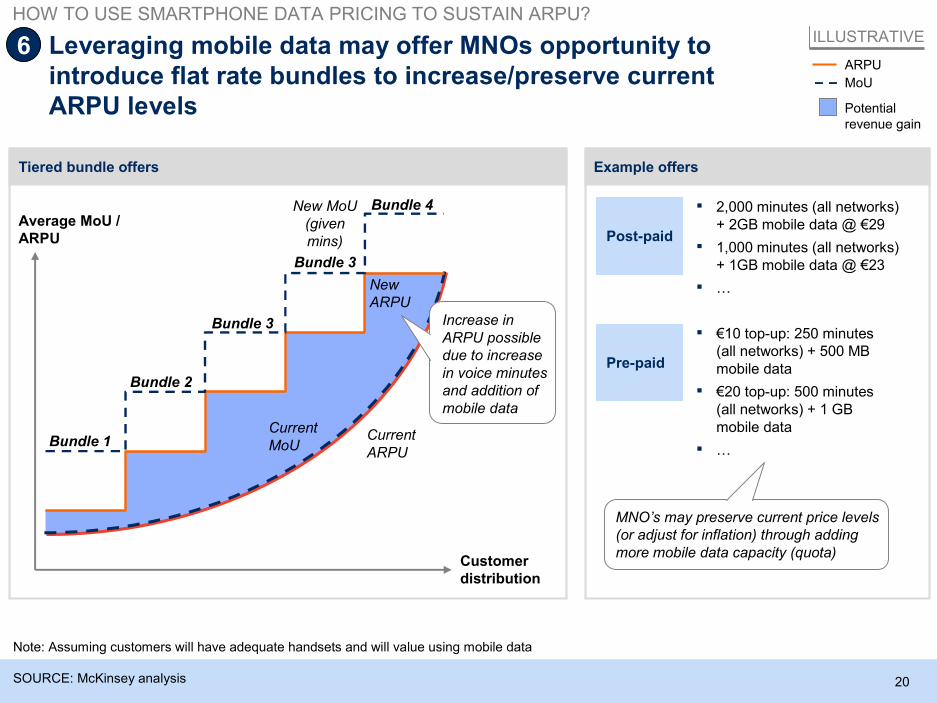
Example offersTiered bundle offers
Leveraging mobile data may offer MNOs opportunity tointroduce flat rate bundles to increase/preserve currentARPU levels
SOURCE: McKinsey analysis
Potentialrevenue gain
ARPU
MoU
ILLUSTRATIVE
▪ 2,000 minutes (all networks)+ 2GB mobile data @ €29
▪ 1,000 minutes (all networks)+ 1GB mobile data @ €23
▪ …
Post-paid
▪ €10 top-up: 250 minutes(all networks) + 500 MBmobile data
▪ €20 top-up: 500 minutes(all networks) + 1 GBmobile data
▪ …
Pre-paid
Average MoU /ARPU
Bundle 1
Bundle 2
Bundle 3
Bundle 4New MoU(givenmins)
CurrentMoU
CurrentARPU
NewARPU
Customerdistribution
Bundle 3
Increase inARPU possibledue to increasein voice minutesand addition ofmobile data
6
MNO’s may preserve current price levels(or adjust for inflation) through addingmore mobile data capacity (quota)
Note: Assuming customers will have adequate handsets and will value using mobile data
HOW TO USE SMARTPHONE DATA PRICING TO SUSTAIN ARPU?
21
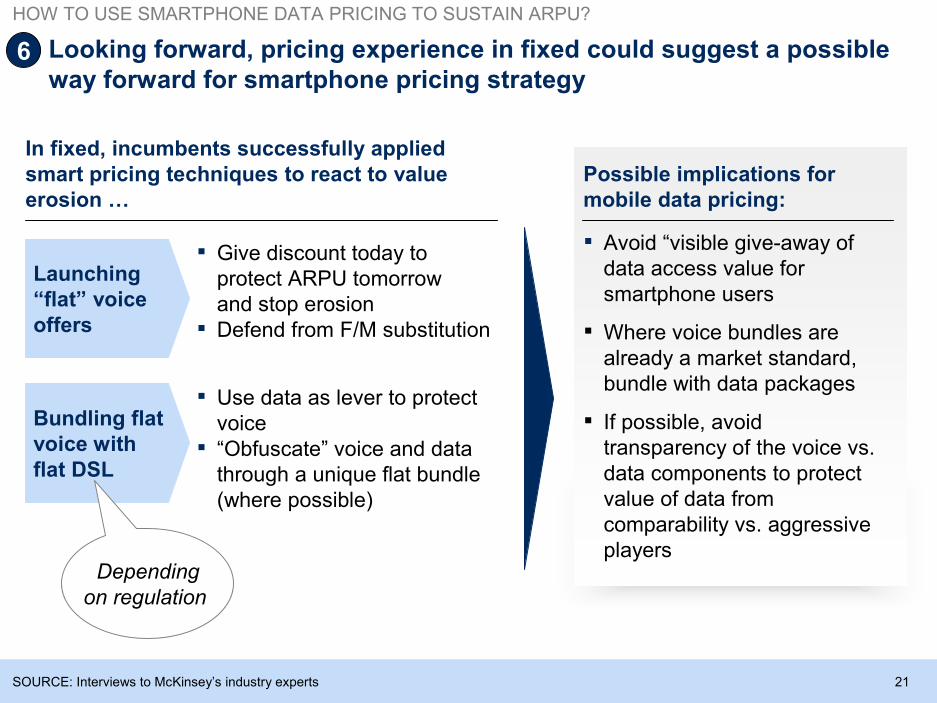
Looking forward, pricing experience in fixed could suggest a possibleway forward for smartphone pricing strategy
SOURCE: Interviews to McKinsey’s industry experts
Possible implications formobile data pricing:
▪ Avoid “visible give-away ofdata access value forsmartphone users
▪ Where voice bundles arealready a market standard,bundle with data packages
▪ If possible, avoidtransparency of the voice vs.data components to protectvalue of data fromcomparability vs. aggressiveplayers
In fixed, incumbents successfully appliedsmart pricing techniques to react to valueerosion …
Launching“flat” voiceoffers
▪ Give discount today toprotect ARPU tomorrowand stop erosion
▪ Defend from F/M substitution
Bundling flatvoice withflat DSL
▪ Use data as lever to protectvoice
▪ “Obfuscate” voice and datathrough a unique flat bundle(where possible)
Dependingon regulation
6
HOW TO USE SMARTPHONE DATA PRICING TO SUSTAIN ARPU?
22
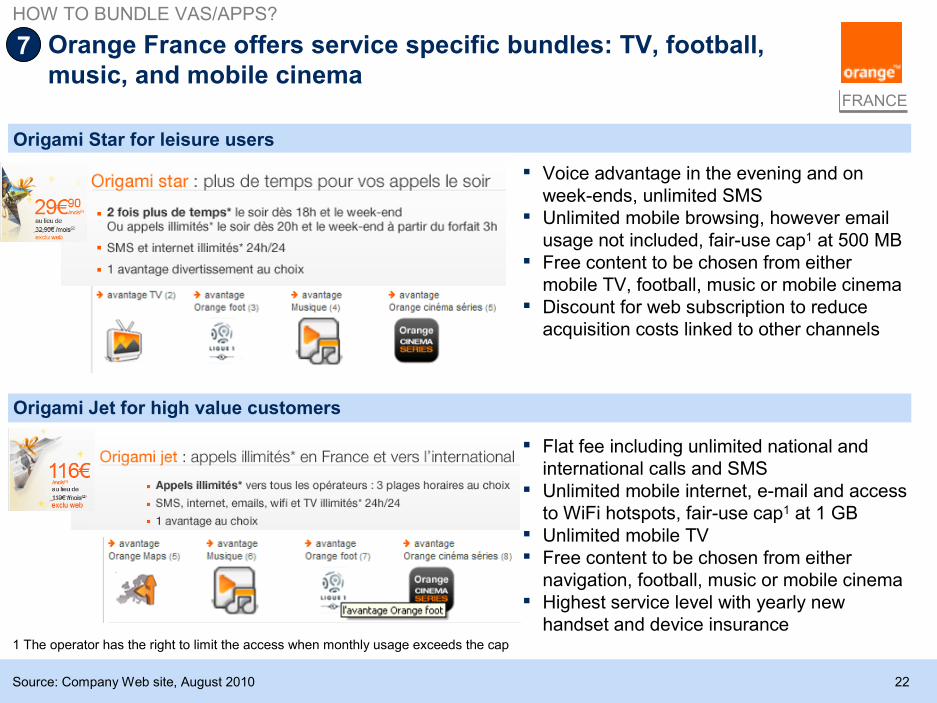
▪ Voice advantage in the evening and onweek-ends, unlimited SMS
▪ Unlimited mobile browsing, however emailusage not included, fair-use cap1 at 500 MB
▪ Free content to be chosen from eithermobile TV, football, music or mobile cinema
▪ Discount for web subscription to reduceacquisition costs linked to other channels
FRANCE
Origami Star for leisure users
Origami Jet for high value customers
▪ Flat fee including unlimited national andinternational calls and SMS
▪ Unlimited mobile internet, e-mail and accessto WiFi hotspots, fair-use cap1 at 1 GB
▪ Unlimited mobile TV▪ Free content to be chosen from either
navigation, football, music or mobile cinema▪ Highest service level with yearly new
handset and device insurance
Source: Company Web site, August 2010
1 The operator has the right to limit the access when monthly usage exceeds the cap
Orange France offers service specific bundles: TV, football,music, and mobile cinema
HOW TO BUNDLE VAS/APPS?
7
23
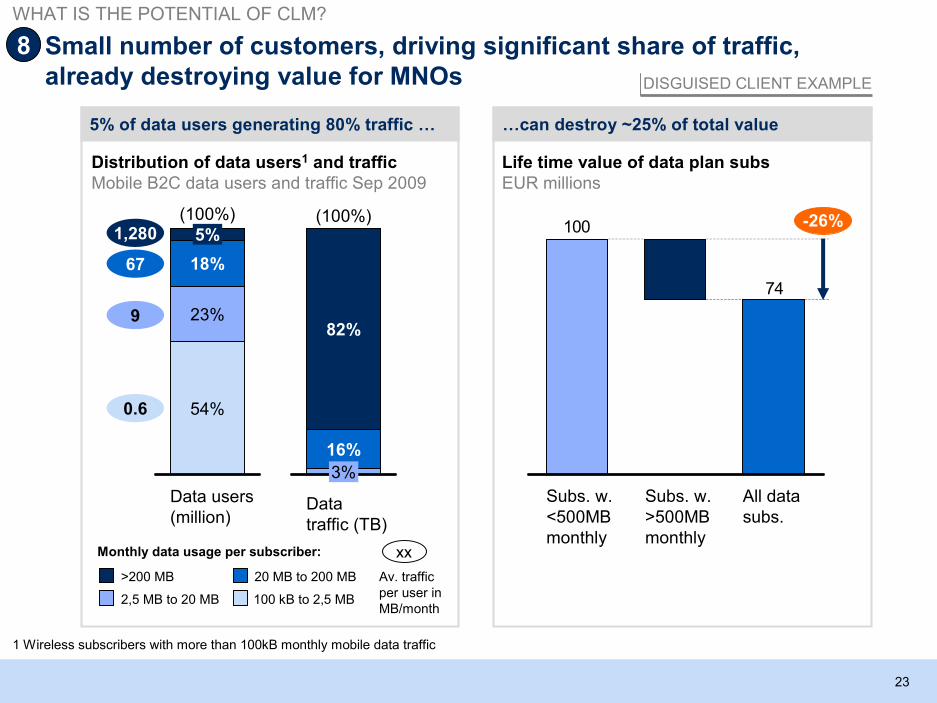
5% of data users generating 80% traffic … …can destroy ~25% of total value
Life time value of data plan subsEUR millions
Small number of customers, driving significant share of traffic,already destroying value for MNOs
74
100
All datasubs.
Subs. w.>500MBmonthly
Subs. w.<500MBmonthly
-26%
Distribution of data users1 and trafficMobile B2C data users and traffic Sep 2009
1,280
67
9
0.6
Data users(million)
(100%)
54%
23%
18%
5%
Datatraffic (TB)
(100%)
3%
16%
82%
Monthly data usage per subscriber:
2,5 MB to 20 MB
20 MB to 200 MB
100 kB to 2,5 MB
>200 MB
xx
Av. trafficper user inMB/month
1 Wireless subscribers with more than 100kB monthly mobile data traffic
DISGUISED CLIENT EXAMPLE
8
WHAT IS THE POTENTIAL OF CLM?
24
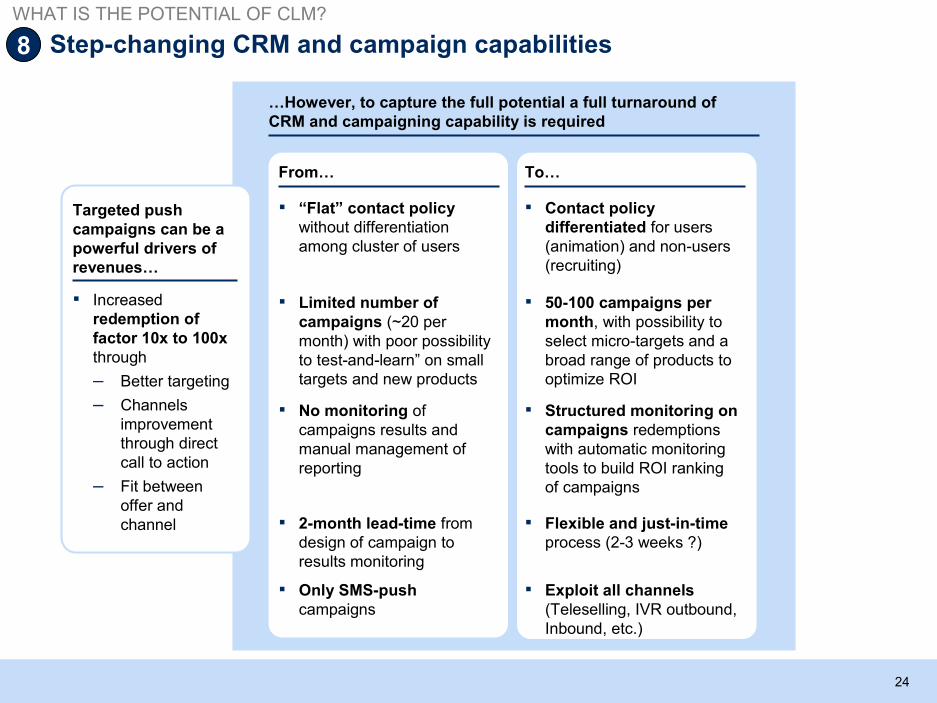
Step-changing CRM and campaign capabilities
WHAT IS THE POTENTIAL OF CLM?
8
…However, to capture the full potential a full turnaround ofCRM and campaigning capability is required
From… To…
▪ “Flat” contact policywithout differentiationamong cluster of users
▪ Contact policydifferentiated for users(animation) and non-users(recruiting)
▪ Limited number ofcampaigns (~20 permonth) with poor possibilityto test-and-learn” on smalltargets and new products
▪ 50-100 campaigns permonth, with possibility toselect micro-targets and abroad range of products tooptimize ROI
▪ No monitoring ofcampaigns results andmanual management ofreporting
▪ Structured monitoring oncampaigns redemptionswith automatic monitoringtools to build ROI rankingof campaigns
▪ 2-month lead-time fromdesign of campaign toresults monitoring
▪ Flexible and just-in-timeprocess (2-3 weeks ?)
▪ Only SMS-pushcampaigns
▪ Exploit all channels(Teleselling, IVR outbound,Inbound, etc.)
Targeted pushcampaigns can be apowerful drivers ofrevenues…
▪ Increasedredemption offactor 10x to 100xthrough
– Better targeting
– Channelsimprovementthrough directcall to action
– Fit betweenoffer andchannel
25
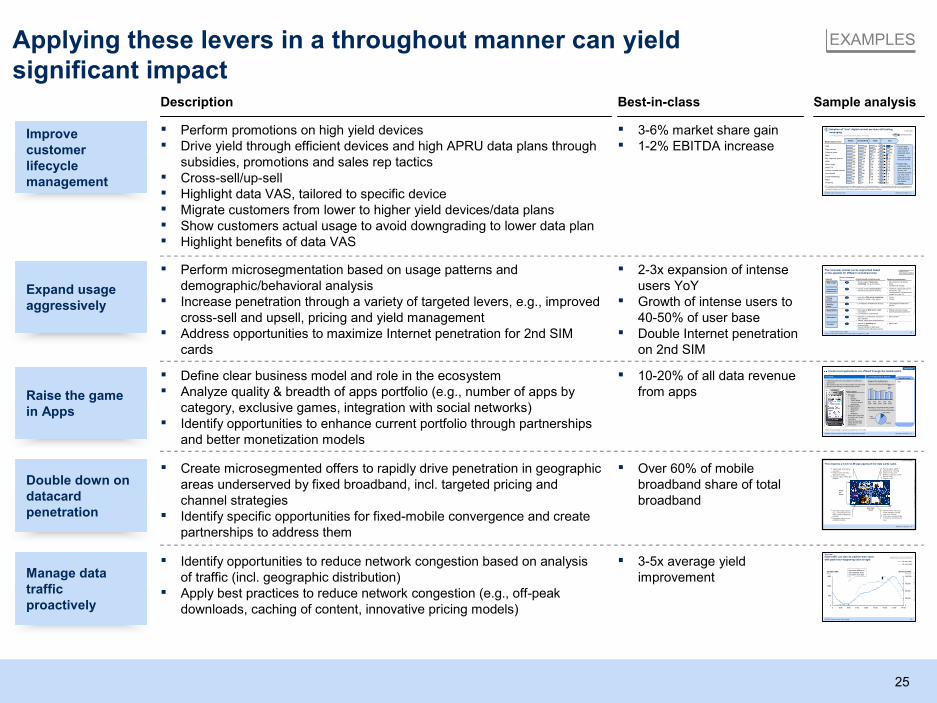
Applying these levers in a throughout manner can yieldsignificant impact
Description
Expand usageaggressively
Best-in-class
▪ Perform microsegmentation based on usage patterns anddemographic/behavioral analysis
▪ Increase penetration through a variety of targeted levers, e.g., improvedcross-sell and upsell, pricing and yield management
▪ Address opportunities to maximize Internet penetration for 2nd SIMcards
▪ 2-3x expansion of intenseusers YoY
▪ Growth of intense users to40-50% of user base
▪ Double Internet penetrationon 2nd SIM
Manage datatrafficproactively
▪ Identify opportunities to reduce network congestion based on analysisof traffic (incl. geographic distribution)
▪ Apply best practices to reduce network congestion (e.g., off-peakdownloads, caching of content, innovative pricing models)
▪ 3-5x average yieldimprovement
Raise the gamein Apps
▪ Define clear business model and role in the ecosystem▪ Analyze quality & breadth of apps portfolio (e.g., number of apps by
category, exclusive games, integration with social networks)▪ Identify opportunities to enhance current portfolio through partnerships
and better monetization models
▪ 10-20% of all data revenuefrom apps
Improvecustomerlifecyclemanagement
▪ Perform promotions on high yield devices▪ Drive yield through efficient devices and high APRU data plans through
subsidies, promotions and sales rep tactics▪ Cross-sell/up-sell▪ Highlight data VAS, tailored to specific device▪ Migrate customers from lower to higher yield devices/data plans▪ Show customers actual usage to avoid downgrading to lower data plan▪ Highlight benefits of data VAS
▪ 3-6% market share gain▪ 1-2% EBITDA increase
Sample analysis
EXAMPLES
56
Wo
rkin
gD
raft-L
ast
Mo
difie
d0
8/05/2
01
007
:27:4
7P
rinte
d0
7/0
5/201
01
7:0
9:06
3G voice trafficMinutes
75,000
50,000
25,000
100,000
0
3G data trafficMbps
500
1,500
1,000
00 12:00 24:0018:006:00 9:00 15:00 21:003:00
3G voice traffic
3G data traffic
DISGUISED CLIENT EXAMPLEData traffic can also be peakier than voice,with peak hour happening later at night
SOURCE: Client interv iews; Team analysis
Important differencealso between weekand week-end days
Short-term
45
Wo
rkin
gD
raft-L
ast
Mo
difie
d0
8/05/2
01
007
:36:1
1P
rinte
d0
7/0
5/201
01
7:0
9:06
Handsets
* France, Germany, U.K., Spain
Sources: Segmentation derived from Telecom Customer Insight Survey, 2008
CASE STUDY,WESTERN EUROPE
Share of consumers*%Segment Attitude toward content/services Other key characteristics
28“Web socials”▪ Strong usage of “Web social
networking”, IM, photo sharing,…▪ More “techies” and “fashion-
driven”▪ Younger than average
20 ▪ Utilizing mostly e-mails/calendars▪ Adverse to web social networking
▪ Traditional usage of devices (TV,fixed phone, etc.)
▪ Low penetration of entertainmentcontent (e.g., pay-TV)
“Conservativeprofessionals”
13 ▪ Keen about Web social networking▪ Appetite for music, video, games
▪ Young▪ Female
“Youngsocials”
12 ▪ Low utilization of fixed/home services ▪ Low utilization of fixed/homedevices
“Mobility-driven”
11 ▪ High usage of Web search, news,e-commerce
▪ Low interest for entertainment
▪ Slightly older than average▪ Somehow biased toward fixed
“Utility-driven”
11 ▪ Rejection of “professional ” services (e-mail, calendar)
▪ “Neutral” about other content/services
▪ Mostly female“Housewives”
▪ Appetite for gambling andringtones/logos
▪ Very low interest for Web socialnetworking and professional services
▪ Mostly male5“Frivolous”
The consumer market can be segmented basedon the appetite for different content/services
Double down ondatacardpenetration
▪ Create microsegmented offers to rapidly drive penetration in geographicareas underserved by fixed broadband, incl. targeted pricing andchannel strategies
▪ Identify specific opportunities for fixed-mobile convergence and createpartnerships to address them
▪ Over 60% of mobilebroadband share of totalbroadband
McKinsey & Company 6
Wo
rkin
gD
raft
-La
stM
od
ified
24/0
3/201
01
2:17:09
PM
Prin
ted
11
/02/2
010
13
:00:29
|
Aware Considered Tried UseMobile data service
▪ For pre-paidusers usage islower than forpost-paid users,howeverconversion ratesare quite similar
▪ Despite highawareness, trialrates continue tobe very lowacross the board.e.g. only 1 pre-paid user in 10has tried to usethe mobileinternet
SMS
Take pictures
Listen to music
Buy ringtones, games
MMS
Watch TV
93
92
97
Watch video
87
95
97
MSN
89
95
97
79
Search / browse internet
93
88
Send emails
Social Networking
Maps
82Shopping
54
59
69
72
83
29
31
36
44
48
36
42
49
62
57
42
77
39
13
14
18
22
27
19
29
24
6
7
8
9
10
12
13
13
20
20
43
48
5976%
XX% Conversion rate
77%
75%
47%
51%
46%
53%
64%
38%
41%
47%
48%
52%
Q72 - For each of the following mobile serv ices, please choose one of the following statements: (1) I have not heard of this serv ice, (2) I am aware of thisserv ice but have never considered using it, (3) I have considere d using this service on my phone but have not yet tried it, (4) I have tried this service onmy phone but rarely use it, or (5) I use this service regularly (e.g. few times a month) on my phone
PRE-PAID
SOURCE: LatAm mobile panel 2010
Adoption of “true” digital content services still trailingmessaging
2
% of respondents, post -paid users only, (N = 980)
McKinsey & Company 21|
The portals...
Content and applications are offered through the mobile portal
1 Based on surveys among x-y subscribers using internet on their mobile
SOURCE: Company website, interviews, Up-To-Data panelJune 2009
Aggregation
May2008
Nov2008
Aug2008
Feb2009
May2009
A
B
Usage of the mobile portalPercent of mobile data users1
Veryunlikely
Neutral
Very likely
Would you recommend the portal?% of mobile portal users1 - May 2009
...are not perceived as attractive
▪ Startpage:– News– Weather– Traffic update– Links to sites and
applications▪ Download section:
– Applications– Wallpapers– Music– Ringtones
▪ Email section with linksto emailing and instantmessaging
▪ Personal space withbilling and price planinformations
Portal content
▪ Partnership with xx for vast majority of content andapplications
▪ The company gets x% of revenue share from the partner▪ Billing is done through a company billing system
Key take-aways
▪ TBD
|McKinsey & Company 34
SPO-TFN386-20090206
Work
ingD
raft
-Last
Mo
dified
06/02
/200
90
9:02:0
0Prin
ted
7/2
/20
0901
:46:3
3
This requires a more CLM type approach for data cards sales
? Tighten data l imits and f air
use policy? Restr ict video and mus ic
application us ages
? Upsell to higher ARPU dataproducts
? Promote higher ARPU
products (e.g., roaming)
? Cross-sel l v oice and
WLAN t o maximise ov erallli fecycle value
? Target f or VAS
? Pus h dif ferentiated pricing
(e.g., cheap off-peak , best
effort speeds, limited hoursper day)
? Enc ourage higher use onprofitable products
? Seek out more users (e.g.,
senior managers, secondcard while roaming)
? Cros s-sel l v oic e and WLANto maximise overall lifecycle
value
Usage
per
month
L ow
Hi gh
Sp en d per
month
L ow Hig h
Upsel l to retai nContr ol & upsell
D rive for profitability Seek out & pr omote
26
Contacts
Gloria Macias-Lizaso Miranda
Partner in the Madrid office
Telephone: +34 (91) 346 58 35
E-mail: [email protected]
Yavuz Demirci
Associate Partner in the Istanbul office
Telephone: +90 (212) 339 4925
E-mail: [email protected]
Piero Trivellato
Associate Partner in the Milan office
Telephone: +39 (02) 72406-469
E-mail: [email protected]
27
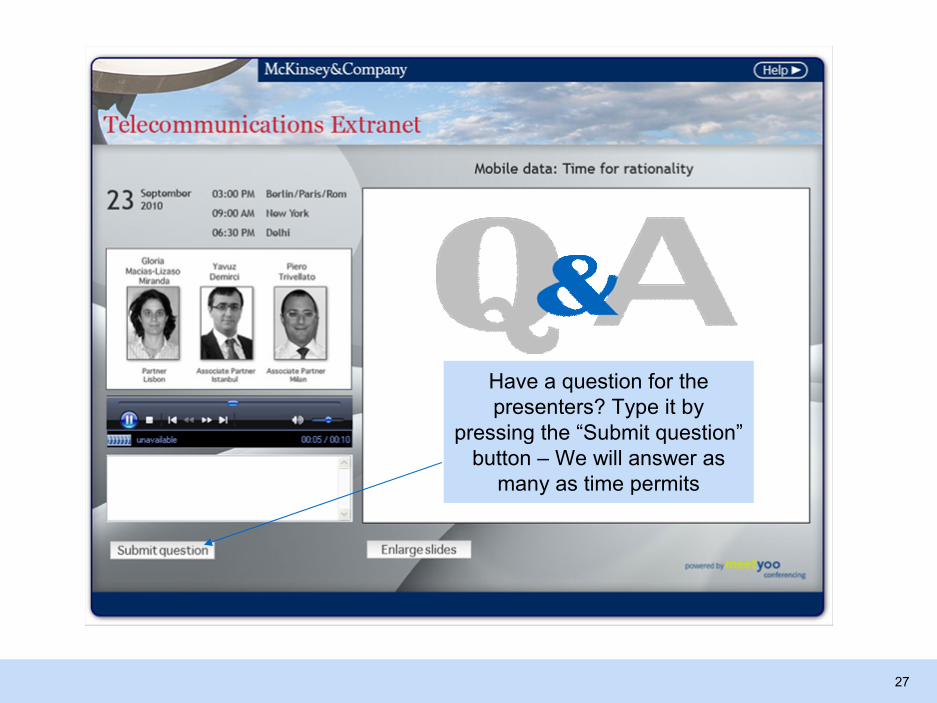
Have a question for thepresenters? Type it by
pressing the “Submit question”button – We will answer as
many as time permits