mds 3.0 quality measure (qm) · : we strongly urge users of the qm reports to consult the . mds 3.0...
TRANSCRIPT

12/2019 v1.04 Certification And Survey Provider Enhanced Reports MDS 3.0 QM 11-1 CASPER Reporting MDS Provider User’s Guide
11 MDS 3.0 QUALITY MEASURE (QM)
REPORTS
GENERAL INFORMATION ....................................................................................... 3 INTRODUCTION ..................................................................................................... 3 SUPPORTING QM CONCEPTS ................................................................................ 3 ACCESSING THE MDS 3.0 QM REPORTS ............................................................... 4
MDS 3.0 FACILITY CHARACTERISTICS REPORT ................................................. 6 MDS 3.0 FACILITY LEVEL QUALITY MEASURE REPORT ....................................10 MDS 3.0 RESIDENT LEVEL QUALITY MEASURE REPORT .................................15 MDS 3.0 MONTHLY COMPARISON REPORT .......................................................20 CASPER MDS 3.0 QM REPORTS VS. NURSING HOME COMPARE ....................23

12/2019 v1.04 Certification And Survey Provider Enhanced Reports MDS 3.0 QM 11-2 CASPER Reporting MDS Provider User’s Guide
NOTE: Unless otherwise noted, PDF is the recommended output format for the reports described herein. Excel and CSV output formats may result in a report that is not visually aesthetic.

12/2019 v1.04 Certification And Survey Provider Enhanced Reports MDS 3.0 QM 11-3 CASPER Reporting MDS Provider User’s Guide
GENERAL INFORMATION
Introduction This section of the CASPER Reporting User’s Guide explains the information that is presented in the MDS 3.0 Quality Measure (QM) reports in addition to how to access these reports. It does not provide a full explanation of either the ways in which the resident samples are selected to produce the reports or the calculation logic that is used for each of the QMs. For complete details of record selection and measure definitions refer to the MDS 3.0 Quality Measures User’s Manual that is posted on CMS’s web site.
NOTE: We strongly urge users of the QM reports to consult the MDS 3.0 Quality Measures User’s Manual to understand the reports and to use them properly.
Included at the end of this section of the CASPER Reporting User’s Guide is a description of the differences between the CASPER MDS 3.0 QM reports and the information available on the Nursing Home Compare web site.
Supporting QM Concepts An assessment’s target date is identified based on the value of A0310F, Entry/Discharge Reporting. The following is a list of target dates: • Discharge Date (A2000) for A0310F = 10, 11 or 12 • Entry Date (A1600) for A0310F = 01 • Assessment Reference Date (A2300) for A0310F = 99 Resident ID is an internal ID that the MDS 3.0 Submission system assigns to the resident. It is not an ID assigned to the resident by the Long Term Care facility. This ID number is not the same as the Resident ID field of the MDS data set.
NOTE: Only federally required (A0410 = 3) assessments and residents for whom federally required assessments were submitted are included in the MDS 3.0 QM reports.
The MDS 3.0 Quality Measures are as follows (“S” indicates a short-stay measure and “L” indicates long-stay measure; abbreviated measure names appear on the reports): • High-Risk/Unstageable Pressure Ulcers (L) • Physical Restraints (L) • Falls (L) • Falls with Major Injury (L)
12/2019 v1.04 Certification And Survey Provider Enhanced Reports MDS 3.0 QM 11-4 CASPER Reporting MDS Provider User’s Guide
• Residents Who Newly Received an Antipsychotic Medication (S) • Residents Who Received an Antipsychotic Medication (L) • Prevalence of Antianxiety/Hypnotic Medication Use (L) • Antianxiety/Hypnotic Medication Use % (L) • Behavior Symptoms Affecting Others (L) • Depressive Symptoms (L) • Urinary Tract Infection (L) • Catheter Inserted and Left in Bladder (L)* • Low-Risk Residents Who Lose Bowel/Bladder Control (L) • Excessive Weight Loss (L) • Need for Help with ADLs Has Increased (L) • Percent of Residents Whose Ability to Move Independently Worsened (L)* • Percent of Residents Who Made Improvements in Function (S)* • Percent of Residents With Pressure Ulcers That Are New or Worsened
(S)* (SNF Only) * Risk-adjusted Quality Measure using resident-level covariates for public reporting.
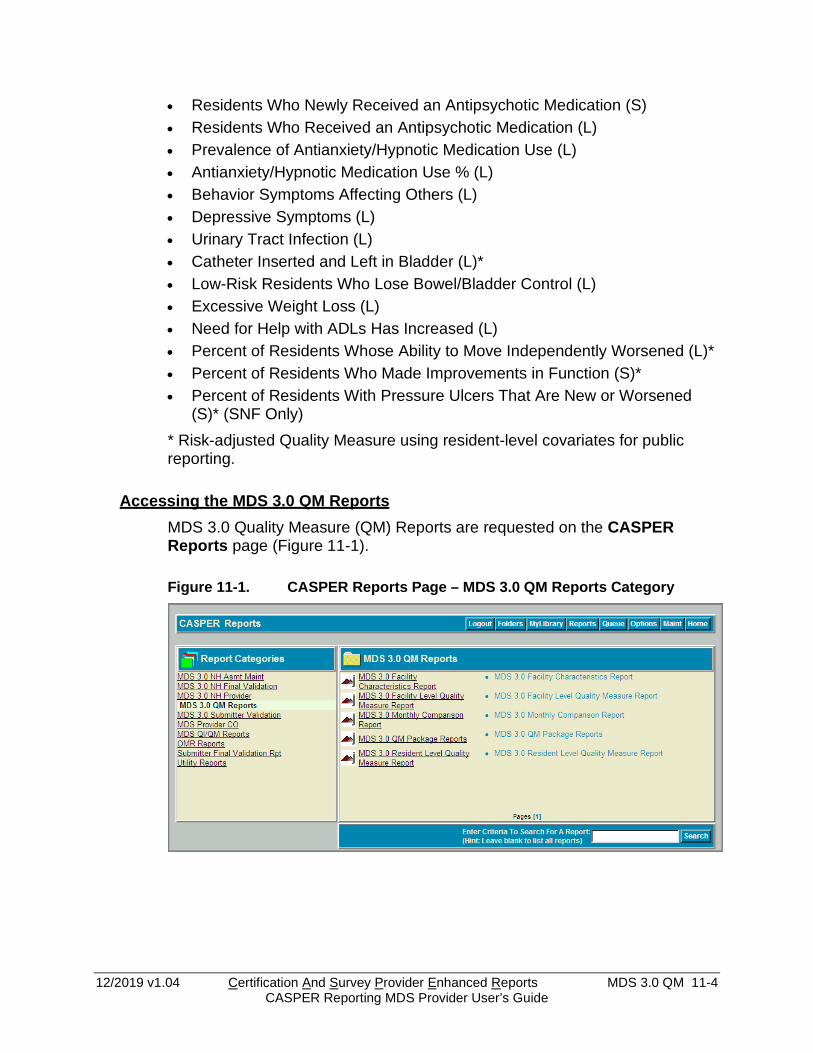
Accessing the MDS 3.0 QM Reports MDS 3.0 Quality Measure (QM) Reports are requested on the CASPER Reports page (Figure 11-1).
Figure 11-1. CASPER Reports Page – MDS 3.0 QM Reports Category

12/2019 v1.04 Certification And Survey Provider Enhanced Reports MDS 3.0 QM 11-5 CASPER Reporting MDS Provider User’s Guide
1. Select the MDS 3.0 QM Reports link from the Report Categories frame on the left. A list of the MDS 3.0 Quality Measure reports you may request displays in the right-hand frame.
NOTE: Only those report categories to which you have access are listed in the Report Categories frame.
2. Select the desired underlined report name link from the right-hand frame. One or more CASPER Reports Submit pages are presented providing criteria options with which you specify the information to include in your report. These options may differ for each report.
3. Choose the desired criteria and select the Submit or Next button.
NOTE: MDS 3.0 reports access detailed information and may require a significant amount of time to process. Once you submit your report request(s), you may consider exiting the CASPER Reporting application, and viewing the completed report(s) at a later time.
4. Refer to Section 2, Functionality, of the CASPER Reporting User’s Guide for assistance in viewing, printing, saving, and exporting the reports you request.
NOTE: MDS 3.0 reports are automatically purged after 60 days.
12/2019 v1.04 Certification And Survey Provider Enhanced Reports MDS 3.0 QM 11-6 CASPER Reporting MDS Provider User’s Guide
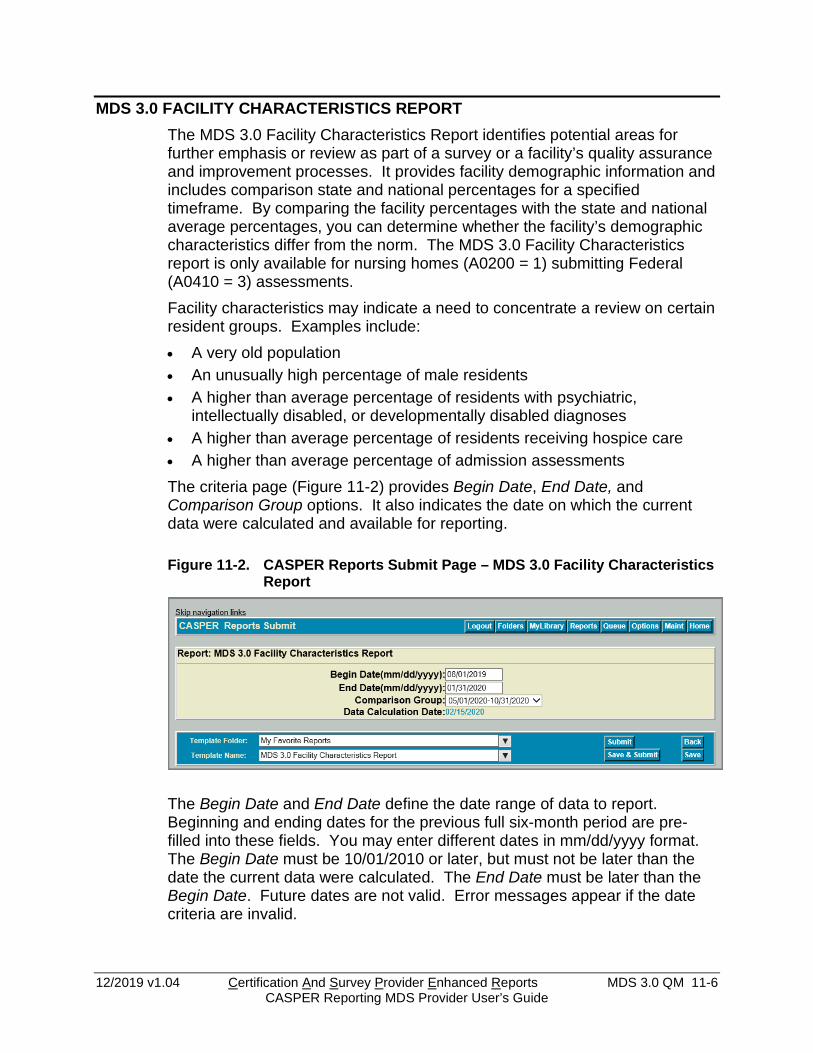
MDS 3.0 FACILITY CHARACTERISTICS REPORT The MDS 3.0 Facility Characteristics Report identifies potential areas for further emphasis or review as part of a survey or a facility’s quality assurance and improvement processes. It provides facility demographic information and includes comparison state and national percentages for a specified timeframe. By comparing the facility percentages with the state and national average percentages, you can determine whether the facility’s demographic characteristics differ from the norm. The MDS 3.0 Facility Characteristics report is only available for nursing homes (A0200 = 1) submitting Federal (A0410 = 3) assessments. Facility characteristics may indicate a need to concentrate a review on certain resident groups. Examples include: • A very old population • An unusually high percentage of male residents • A higher than average percentage of residents with psychiatric,
intellectually disabled, or developmentally disabled diagnoses • A higher than average percentage of residents receiving hospice care • A higher than average percentage of admission assessments The criteria page (Figure 11-2) provides Begin Date, End Date, and Comparison Group options. It also indicates the date on which the current data were calculated and available for reporting.
Figure 11-2. CASPER Reports Submit Page – MDS 3.0 Facility Characteristics Report
The Begin Date and End Date define the date range of data to report. Beginning and ending dates for the previous full six-month period are pre-filled into these fields. You may enter different dates in mm/dd/yyyy format. The Begin Date must be 10/01/2010 or later, but must not be later than the date the current data were calculated. The End Date must be later than the Begin Date. Future dates are not valid. Error messages appear if the date criteria are invalid.
12/2019 v1.04 Certification And Survey Provider Enhanced Reports MDS 3.0 QM 11-7 CASPER Reporting MDS Provider User’s Guide
State and national comparison data are delayed by two months in order to allow for the time it takes to finalize and publicize this data. The most recent six-month period available for reporting state and national comparison data are three months prior to the current month. The default value of the Comparison Group field is the most recent six-month period. You may select earlier periods from the drop-down list. The Data Calculation Date displays at the bottom of the criteria selection page.
The MDS 3.0 Facility Characteristics Report (Figure 11-3) is divided into two sections: the header and the body. The information contained in the header is as follows:
• Facility ID. The facility’s ID used for submission of MDS 3.0 records. • CCN. The facility’s CMS Certification Number. • Facility Name. The name of the facility. • City/State. The location of the facility. • Report Period. The dates in this field reflect the reporting period that was
selected by the user when the report was requested. • Comparison Group. State and national statistics are automatically
calculated for various time periods and these pre-calculated statistics are used to produce comparison group statistics in the body of the report. The dates in this field indicate the comparison group time period that was used for the report.
• Report Run Date. This is the date that the report was run. • Data Calculation Date. The QM statistics are automatically recalculated
weekly in order to account for newly submitted data. The date in this field shows the last date this system calculation occurred.
• Report Version Number. As the reporting system software is updated, this version number will change. This field shows the version that was used to produce the report.
The body of the MDS 3.0 Facility Characteristics Report details the Facility Numerator, Facility Denominator, Facility Observed Percentage, Comparison Group State Average, and Comparison Group National Average for each of the following resident characteristics for the selected facility and reporting period: • Gender
o Male o Female
• Age o <25 years old o 25-54 years old o 55-64 years old

12/2019 v1.04 Certification And Survey Provider Enhanced Reports MDS 3.0 QM 11-8 CASPER Reporting MDS Provider User’s Guide
o 65-74 years old o 75-84 years old o 85+ years old
• Diagnostic Characteristics o Psychiatric diagnosis o Intellectual or Developmental Disability o Hospice
• Prognosis o Life expectancy of less than 6 months
• Discharge Plan o Not already occurring o Already occurring
• Referral o Not needed o Is or may be needed but not yet made o Has been made
• Type of Entry o Admission o Reentry
• Entered Facility From o Community o Another nursing home o Acute Hospital o Psychiatric Hospital o Inpatient Rehabilitation Facility o ID/DD facility o Hospice o Long Term Care Hospital o Other
NOTE: The MDS 3.0 Facility Characteristics Report may contain protected privacy information that should not be released to the public. Any alteration to this report is strictly prohibited.

12/2019 v1.04 Certification And Survey Provider Enhanced Reports MDS 3.0 QM 11-9 CASPER Reporting MDS Provider User’s Guide
Figure 11-3. MDS 3.0 Facility Characteristics Report
Num indicates the number of residents with the identified characteristic and Denom indicates the number of residents in the facility. Simple average percentages are provided for each resident characteristic from 1) all facilities in the state and 2) the nation for the selected Comparison Group period.

12/2019 v1.04 Certification And Survey Provider Enhanced Reports MDS 3.0 QM 11-10 CASPER Reporting MDS Provider User’s Guide
MDS 3.0 FACILITY LEVEL QUALITY MEASURE REPORT For each QM, the MDS 3.0 Facility Level Quality Measure Report shows the facility percentage and how the facility compares with other facilities in their state and in the nation. This report helps facilities identify possible areas for further emphasis in facility quality improvement activities or investigation during the survey process. The MDS 3.0 Facility Level Quality Measure Report displays QM numerator and denominator counts for a select period. It includes the facility’s observed and adjusted triggered percentages as well as state and national average percentage comparisons and a national ranking for each measure. The criteria selection page (Figure 11-4) for the MDS 3.0 Facility Level Quality Measure Report presents Begin Date (mm/dd/yyyy), End Date (mm/dd/yyyy), and Comparison Group options. The date the most recent quality measure data were calculated is indicated.
Figure 11-4. CASPER Reports Submit Page - MDS 3.0 Facility Level Quality Measure Report
Begin Date (mm/dd/yyyy) and End Date (mm/dd/yyyy) dates are pre-filled for the most recent completed six-month period prior to the month the data were last calculated. You may enter alternate dates in mm/dd/yyyy format. An error message is presented if the date criteria are invalid. Examples include an incorrect date format, the Begin Date being after the End Date, the Begin Date being prior to 10/01/2010, the End Date being after the date on which the data were calculated, and the use of future dates or alpha characters.
NOTE: MDS 3.0 quality measure data are only available for assessments with target dates 10/01/2010 and later.
Comparison Group date range options include six-month intervals, beginning 10/01/2010. The most recent six-month period available for reporting state and national comparison data ends three months prior to the current month.

12/2019 v1.04 Certification And Survey Provider Enhanced Reports MDS 3.0 QM 11-11 CASPER Reporting MDS Provider User’s Guide
NOTE: State and National comparison group data are calculated monthly on the first day of the month. Data calculation is delayed by two months in order to allow for submission of late and corrected assessments. Comparison data are not recalculated if assessments with target dates that fall in periods for which comparison group data were already calculated are received.
The Data Calculation Date displays at the bottom of the criteria selection page.
NOTE: Quality Measure data are calculated weekly for the assessments submitted since the previous week’s data calculation.
The MDS 3.0 Facility Level Quality Measure Report (Figure 11-5) is divided into two sections: the header and the body. The information contained in these sections is as follows:
Header • Facility ID. The facility’s identifier. • CCN. The facility’s CMS Certification Number. • Facility Name. The name of the facility. • City/State. The location of the facility. • Report Period. The dates in this field reflect the reporting period that was
selected by the user when the report was requested. • Comparison Group. State and national statistics are automatically
calculated on a periodic basis for various time periods and these pre-calculated statistics are used to produce comparison group statistics in the body of the report. The dates in this field indicate the comparison group period that was used for the report.
• Report Run Date. This is the date that the report was run. • Data Calculation Date. The QM statistics are automatically recalculated
periodically to account for newly submitted data. The date in this field shows the last date this system calculation occurred.
• Report Version Number. As the reporting system software is updated, this version number will change. This field shows the version that was used to produce the report.
• Legend. The header contains the following notes that explain the symbols and abbreviations that are used in the body of the report: o Dashes represent a value that could not be computed o S = short stay, L = long stay o C = complete, data available for all days selected, I = incomplete; data
not available for all days selected o * is an indicator used to identify that the measure is flagged

12/2019 v1.04 Certification And Survey Provider Enhanced Reports MDS 3.0 QM 11-12 CASPER Reporting MDS Provider User’s Guide
o For the Improvement in Function (S) Measure, a single * indicates a Percentile of 25 or less (higher Percentile values are better)
Body • Measure Description. The first column of the report contains a brief
description of the measure. • CMS ID. This column contains the unique identification number assigned
by CMS to each measure. • Data. The letter “I” displays in this column if the measure was not active
during the entire selected report period. The letter “C” displays if data are available for the entire period selected.
• Num/Numerator. This column shows the number of residents who triggered the QM. These are the people who "have" the QM. For the purposes of calculating the facility percentage, it is the numerator.
• Denom/Denominator. This column shows the number of people in the facility who "could have" the QM. For the purposes of calculating facility percentage, it is the denominator. For some measures, the number of cases in the denominator equals the current number of short-stay or long-stay residents in the facility. For other measures, the denominator is smaller either because of risk group definitions or because of exclusions that were applied to the denominator.
• Facility Observed Percent. This column shows the percentage of residents who could have the QM and actually triggered it and is computed by dividing the numerator by the denominator. For example, if 60 people could trigger a measure (Denom column) and 30 people did trigger it (Num column), the Facility Observed Percent column is 50.0%.
• Facility Adjusted Percent. This column shows the Adjusted Percent, which is computed using a mathematical model that takes various resident characteristics and the national percent for the measure into account and adjusts the observed percent accordingly. This methodology is applied to only a subset of measures. Measures that are adjusted have a different value in the adjusted and observed percent columns. For measures that are not adjusted, the value in the observed percent column is repeated in the adjusted percent column.
• Comparison Group State Average. This column shows the average statewide percentage for the QM for comparison with the facility. It represents the average of the observed percentages (or the adjusted percentages, for risk-adjusted measures) across all facilities in the state in which the facility is located.
• Comparison Group National Average/National Average. This column shows the average national percentage for the QM for comparison with the facility. It represents the average of the observed percentages (or the adjusted percentages, for risk-adjusted measures) across all facilities in the nation.

12/2019 v1.04 Certification And Survey Provider Enhanced Reports MDS 3.0 QM 11-13 CASPER Reporting MDS Provider User’s Guide
• Comparison Group National Percentile. The national percentile column ranks facilities relative to other facilities in the nation on each measure. The higher the ranking, the more likely the measure should be reviewed as part of the facility quality improvement process or emphasized on the survey. The values in this column represent the percent of facilities in the nation that are at or below the observed (or adjusted) percentage for the facility. For example, if the facility is at the 85th percentile for a measure, it means that 85% of the facilities in the nation have an observed (or adjusted) percentage that is at or below the facility’s percentage. Some of the values in the Comparison Group National Percentile column may be followed by an asterisk. The asterisk identifies those measures that crossed an investigative threshold (were “flagged”). QMs at or above the 75th percentile in this column are designated with an asterisk (*). This identifies those measures where the facility’s ranking is high enough that it should be investigated or emphasized on the survey or in any internal quality improvement initiative and may indicate a possible concern regarding quality of care. It is an area to highlight for investigation or emphasis during offsite survey preparation or to choose for review in the facility quality assurance or quality improvement processes. Note that just because a QM was flagged (exceeds a threshold) does not mean that there is an automatic assumption of a problem. It means that the information suggests that there is a concern that should be reviewed to see whether a problem exists and, if so, how it is being addressed. Note also that just because a facility is not flagged does not mean that there is not a problem with the quality of care in that area. You must consider all the information available and use your best clinical judgment. The QM information is only a tool for surveyors and facility staff to use. It is not the only information on which to base quality assurance and improvement activities or to make assumptions about care.
• Footnote (SNF Only): 1 The Percent of Residents With Pressure Ulcers That Are New or Worsened (S002.02) measure is calculated using the SNF QRP measure specifications v3.0 and is based on 12 months of data (mm/dd/yyyy – mm/dd/yyyy). The appropriate dates, based upon the Report Run Date and the user-selected End Date, are displayed.
NOTE: The MDS 3.0 Facility Level Quality Measure Report may contain protected privacy information that should not be released to the public. Any alteration to this report is strictly prohibited.

12/2019 v1.04 Certification And Survey Provider Enhanced Reports MDS 3.0 QM 11-14 CASPER Reporting MDS Provider User’s Guide
Figure 11-5. MDS 3.0 Facility Level Quality Measure Report*
* Fictitious, sample data are depicted.

12/2019 v1.04 Certification And Survey Provider Enhanced Reports MDS 3.0 QM 11-15 CASPER Reporting MDS Provider User’s Guide
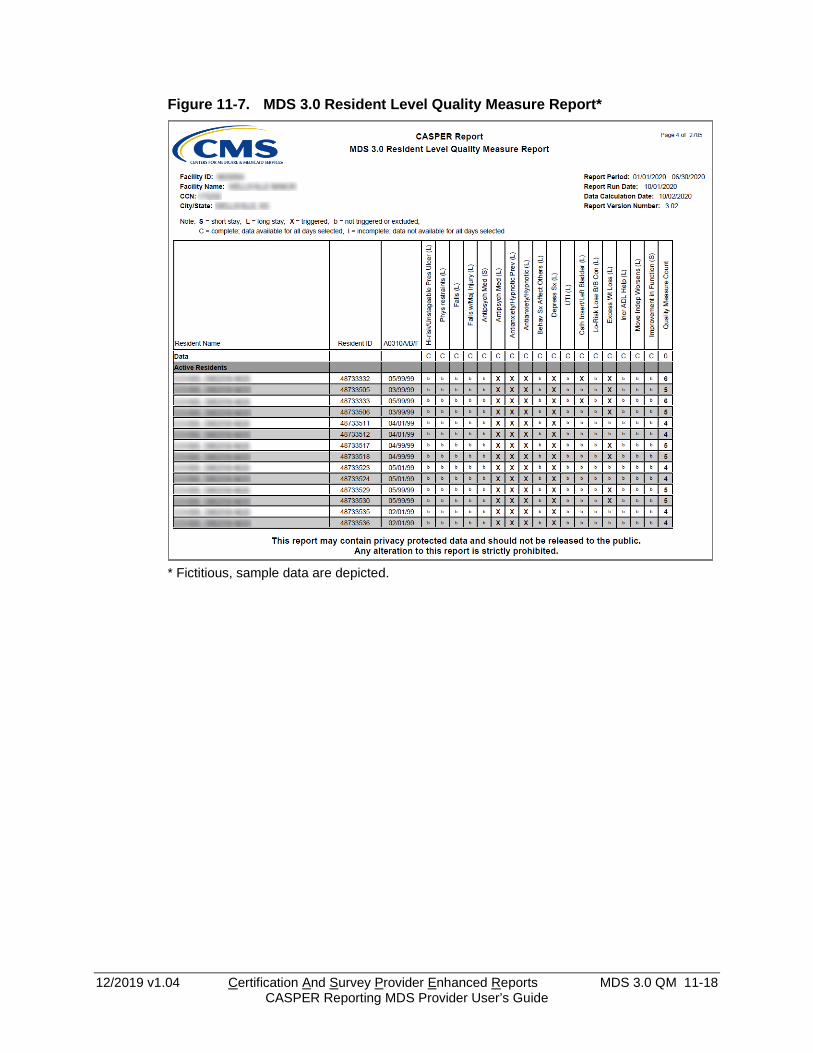
MDS 3.0 RESIDENT LEVEL QUALITY MEASURE REPORT The MDS 3.0 Resident Level Quality Measure Report identifies the residents (active and discharged) that were included in the calculations for the facility and period that were used to produce the MDS 3.0 Facility Level Quality Measure Report. The report lists the residents by name and indicates the measures, if any, triggered by each. The criteria selection page (Figure 11-6) for the MDS 3.0 Resident Level Quality Measure Report presents Begin Date (mm/dd/yyyy) and End Date (mm/dd/yyyy) options. The date the most recent quality measure data were calculated is indicated.
Figure 11-6. CASPER Reports Submit Page - MDS 3.0 Resident Level Quality Measure Report
Begin Date (mm/dd/yyyy) and End Date (mm/dd/yyyy) dates are pre-filled for the most recent completed six-month period prior to the month the data were last calculated. You may enter alternate dates in mm/dd/yyyy format. An error message is presented if the date criteria are invalid. Examples include an incorrect date format, the Begin Date being after the End Date, the Begin Date being prior to 10/01/2010, the End Date being after the date on which the data were calculated, and the use of future dates or alpha characters.
NOTE: MDS 3.0 quality measure data are only available for assessments with target dates 10/01/2010 and later.
The Data Calculation Date displays at the bottom of the criteria selection page.
NOTE: Quality Measure data are calculated weekly for the assessments submitted since the previous week’s data calculation.

12/2019 v1.04 Certification And Survey Provider Enhanced Reports MDS 3.0 QM 11-16 CASPER Reporting MDS Provider User’s Guide
The MDS 3.0 Resident Level Quality Measure Report (Figures 11-7 and 11-8) is divided into two sections: the header and the body. The information contained in these sections is as follows:
Header • Facility ID. The facility’s identifier. • Facility Name. The name of the facility. • CCN. The facility’s CMS Certification Number. • City/State. The location of the facility. • Report Period. The dates in this field reflect the reporting period that was
selected by the user when the report was requested. • Report Run Date. This is the date that the report was run. • Data Calculation Date. The QM statistics are automatically recalculated
periodically to account for newly submitted data. The date in this field shows the last date this system calculation occurred.
• Report Version Number. As the reporting system software is updated, this version number will change. This field shows the version that was used to produce the report.
• Legend. The header contains notes that explain symbols and abbreviations that are used in the body of the report, as well as other pertinent information. o S = short stay o L = long stay o X = triggered o b = not triggered or excluded o C = complete; data available for all days selected o I = incomplete; data not available for all days selected
Body • Data. For each measure, the Data row indicates with an “I” if the measure
is not active during the entire report period or a “C” if measure data are complete for the selected dates.
Residents are listed in two groups: active residents and discharged residents (residents whose last MDS record during the target period was a discharge). Residents are listed in alphabetical order within each of these two groups. For each resident, the following data elements are presented: • Resident name. The first column shows the resident’s full name. • Resident ID. The unique internal ID that is used by the QIES system to
identify the resident. • Admission Date. Resident’s date of admission. SNF New/worse Pressure
Ulcer measure only.
12/2019 v1.04 Certification And Survey Provider Enhanced Reports MDS 3.0 QM 11-17 CASPER Reporting MDS Provider User’s Guide
• Discharge Date. Resident’s date of discharge. SNF New/worse Pressure Ulcer measure only.
• A0310A/B/F. This column identifies the reasons for assessment for the resident’s target record. A value of 99/99/01 represents a new resident who does not have a target assessment as of the end of the reporting period. The reason for assessment items are: o A0310A: Federal OBRA reason for assessment o A0310B: PPS assessment o A0310F: Entry/discharge reporting
• QM columns. Following the identifying information, the report contains columns for each QM. An “X” appears in the QM column when the resident triggers a measure (i.e., is included in the numerator for that measure), and a “b” (“blank”) appears for residents who did not trigger or who were excluded from the measure. The last column in each row displays a count of the number of measures that were triggered for the resident.
• Footnote (SNF Only): 1 The Percent of Residents With Pressure Ulcers That Are New or Worsened (S002.02) measure is calculated using the SNF QRP measure specifications v3.0 and is based on 12 months of data (mm/dd/yyyy – mm/dd/yyyy). The appropriate dates, based upon the Report Run Date and the user-selected End Date, are displayed.
NOTE: For the SNF Pressure Ulcer Measure, active and discharged residents are not listed separately.
The Resident Level Quality Measure Report can be used in two ways. First, it can be used to identify the residents that trigger a QM (by scanning a column of interest and looking for the residents with an “X”). Second, it can be used to identify residents who trigger multiple QM measures. Such residents may merit special consideration or more intensive review.
NOTE: The MDS 3.0 Resident Level Quality Measure Report may contain protected privacy information that should not be released to the public. Any alteration to this report is strictly prohibited.
12/2019 v1.04 Certification And Survey Provider Enhanced Reports MDS 3.0 QM 11-18 CASPER Reporting MDS Provider User’s Guide
Figure 11-7. MDS 3.0 Resident Level Quality Measure Report*
* Fictitious, sample data are depicted.

12/2019 v1.04 Certification And Survey Provider Enhanced Reports MDS 3.0 QM 11-19 CASPER Reporting MDS Provider User’s Guide
Figure 11-8. MDS 3.0 Resident Level Quality Measure Report – SNF Pressure Ulcer Measure*
* Fictitious, sample data are depicted.

12/2019 v1.04 Certification And Survey Provider Enhanced Reports MDS 3.0 QM 11-20 CASPER Reporting MDS Provider User’s Guide
MDS 3.0 MONTHLY COMPARISON REPORT The MDS 3.0 Quality Measure Monthly Comparison Report presents observed or adjusted percentages for each QM for the facility, the state, and the nation. It allows easy comparison of these percentages for each measure for a specified six-month period. Since the report is intended for public use, data for measures with small denominators (less than 30 for long-stay measures and less than 20 for short-stay measures) or high-triggered percentages are suppressed. Data for this report are calculated on the first day of each month using accepted assessment records with target dates two months prior to the month of calculation. The criteria selection page (Figure 11-9) for the MDS 3.0 Monthly Comparison Report presents Begin Month (mm/yyyy) and End Month (mm/yyyy) options.
Figure 11-9. CASPER Reports Submit Page - MDS 3.0 Monthly Comparison Report
Begin Month (mm/yyyy) and End Month (mm/yyyy) dates are pre-filled for the previous full six-month period. You may select an alternate End Month from the drop-down list. Based upon the End Month selection, the system calculates and displays the Begin Month 6 months prior.
NOTE: MDS 3.0 quality measure data are only available for assessments with target dates 10/01/2010 and later.
The MDS 3.0 Quality Measure Monthly Comparison Report (Figure 11-10) is divided into two sections: the header and the body. The information contained in these sections is as follows: Header • Facility ID • CMS Certification Number (CCN) • Facility Name
12/2019 v1.04 Certification And Survey Provider Enhanced Reports MDS 3.0 QM 11-21 CASPER Reporting MDS Provider User’s Guide
• City/State • Report Period. The dates in this field reflect the reporting period that was
selected by the user when the report was requested. • Report Run Date. This is the date that the report was run. • Data Calculation Date. The QM statistics are automatically recalculated
periodically to account for newly submitted data. The date in this field shows the last date this system calculation occurred.
• Report Version Number. As the reporting system software is updated, this version number will change. This field shows the version that was used to produce the report.
• Legend. The following notes that explain the symbols and abbreviations used in the body of the report: o S = short stay, L = long stay o C = complete – data available for all days selected; I = incomplete -
data not available for all days selected o N/A represents a value that could not be computed
• Long Stay Measure Sample Size • Short Stay Measure Sample Size • Footnote (SNF Only): 1 The Percent of Residents With Pressure Ulcers
That Are New or Worsened (S002.02) measure is calculated using the SNF QRP measure specifications v3.0 and is based on 12 months of data (mm/dd/yyyy – mm/dd/yyyy). The appropriate dates, based upon the Report Run Date and the user-selected End Date, are displayed.
Body • CMS ID. This column contains the unique identification number assigned
by CMS to each measure. • Data. The letter “I” displays in this column if the measure was not active
during the entire selected report period. • Measure Description. This column of the report contains a brief
description of the measure. • Facility Percent. The Facility Percent is either the adjusted percent, for
measures that are risk adjusted, or observed percents for other measures. The adjusted percent is computed using a mathematical model that takes various resident characteristics and the national percent for the measure into account and adjusts the observed percent accordingly. For measures that are not adjusted, the value in the facility percent column is simply computed by dividing the facility’s numerator by the denominator for the measure. “N/A” displays in this column when the measure value is suppressed.
• State Percent. The state percent is the average of the facility percentages for all facilities in the state. It represents an average of the adjusted

12/2019 v1.04 Certification And Survey Provider Enhanced Reports MDS 3.0 QM 11-22 CASPER Reporting MDS Provider User’s Guide
percentages for measures that are risk adjusted or the average of the observed percentages for measures that are not risk adjusted.
• National Percent. The national percent is the average of the facility percentages for all facilities in the nation. It represents an average of the adjusted percentages for measures that are risk adjusted or the average of the observed percentages for measures that are not risk adjusted.
NOTE: The MDS 3.0 Quality Measure Monthly Comparison Report may contain protected privacy information that should not be released to the public. Any alteration to this report is strictly prohibited.
Figure 11-10. MDS 3.0 Quality Measure Monthly Comparison Report*
* Fictitious, sample data are depicted.
12/2019 v1.04 Certification And Survey Provider Enhanced Reports MDS 3.0 QM 11-23 CASPER Reporting MDS Provider User’s Guide
CASPER MDS 3.0 QM REPORTS VS. NURSING HOME COMPARE Even though CASPER MDS 3.0 QM reports and Nursing Home Compare (NHC) use identical sample selection and measure calculation logic, there may be differences between the results that are reported by the two systems. The reasons for these differences are: • Measures Included. The CASPER MDS 3.0 QM reports and the reports
on NHC contain many of the same measures. However, NHC contains some QMs that are not included in the CASPER MDS 3.0 QM reports.
• Timing. NHC data are run once a quarter, whereas the CASPER MDS 3.0 QM data are updated more frequently. It is, therefore, likely that the assessment database changed between the time the NHC statistics were computed and the time the CASPER MDS 3.0 QM statistics were computed. The CASPER MDS 3.0 QM statistics reflect all assessments and assessment modifications that were submitted since the NHC statistics were computed.
• Reporting Periods. Every QM is based upon the selection of a target assessment. For NHC, the target assessment must have a reference date within the most recent 3 months for long-stay measures and the most recent 6 months for short-stay measures. On the CASPER MDS 3.0 QM Reports, you are allowed to customize the length of the selection period (by adjusting the beginning and ending date of the report). If the selection periods you select are different from those used for NHC, the results may differ.
• Averaging Across Quarters. The results that are presented on NHC are averaged across several calendar quarters while the results on the CASPER MDS 3.0 QM reports are for only a single reporting period.
• Risk Adjustment. These adjusted percentages may not match the percentages reported on NHC because of the way the risk adjustment calculations are performed. One of the factors used in the risk adjustment calculations is the national average for the QM at the time of calculation. Since the calculations are usually performed at different times for the two systems (see “Timing” above), the national means may differ and the percentages may be different on the two sets of reports.