me mory jen
TRANSCRIPT
LETTERdoi:10.1038/nature12743
The activity-dependent transcription factor NPAS4regulates domain-specific inhibitionBrenda L. Bloodgood1,2*, Nikhil Sharma1,3*, Heidi Adlman Browne1{, Alissa Z. Trepman1{ & Michael E. Greenberg1
A heterogeneous population of inhibitory neurons controls theflow of information through a neural circuit1–3. Inhibitory synapsesthat form on pyramidal neuron dendrites modulate the summationof excitatory synaptic potentials4–6 and prevent the generation ofdendritic calcium spikes7,8. Precisely timed somatic inhibition lim-its both the number of action potentials and the time window dur-ing which firing can occur8,9. The activity-dependent transcriptionfactor NPAS4 regulates inhibitory synapse number and function incell culture10, but how this transcription factor affects the inhibitoryinputs that form on distinct domains of a neuron in vivo was unclear.Here we show that in the mouse hippocampus behaviourally drivenexpression of NPAS4 coordinates the redistribution of inhibitorysynapses made onto a CA1 pyramidal neuron, simultaneously increas-ing inhibitory synapse number on the cell body while decreasing thenumber of inhibitory synapses on the apical dendrites. This rearran-gement of inhibition is mediated in part by the NPAS4 target genebrain derived neurotrophic factor (Bdnf), which specifically regu-lates somatic, and not dendritic, inhibition. These findings indicatethat sensory stimuli, by inducing NPAS4 and its target genes, dif-ferentially control spatial features of neuronal inhibition in a waythat restricts the output of the neuron while creating a dendriticenvironment that is permissive for plasticity.
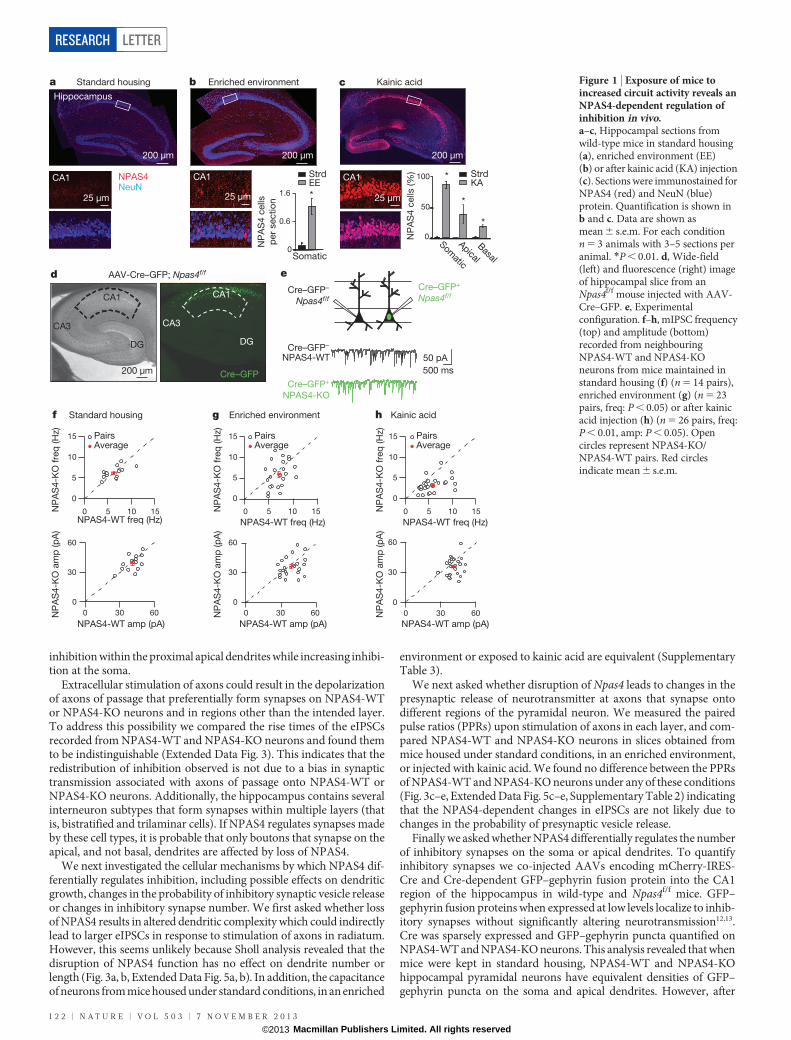
We assessed NPAS4 expression in the hippocampus by immuno-fluorescence microscopy. We found that in hippocampi from micemaintained in standard housing, NPAS4 protein is undetectable byimmunostaining (Fig. 1a). By contrast, exposure of mice to an enrichedenvironment induces NPAS4 protein expression in neurons in thepyramidal layer, whereas no NPAS4-positive nuclei are observed inthe neuropil (Fig. 1b). To obtain more widespread induction of NPAS4,mice were injected intraperitoneally with kainic acid to trigger seizureactivity. This treatment led to NPAS4 expression in nearly all excitatoryneurons in the pyramidal layer and a minority of inhibitory neurons inthe neuropil (Fig. 1c).
We next asked whether the loss of NPAS4 affects inhibitory synapsefunction in vivo. Adeno-associated virus encoding a Cre–GFP fusionprotein (AAV-Cre–GFP)11 was injected into the CA1 region of thehippocampus in Npas4 conditional mice (Npas4f/f) (Fig. 1d, ExtendedData Fig. 1). Post-operative animals were transferred to an enrichedenvironment or maintained in standard housing for 7 to 12 days.Subsequently acute hippocampal slices were prepared, whole-cell volt-age clamp recordings were made from neighbouring NPAS4 knockoutand wild-type neurons (referred to as NPAS4-KO and NPAS4-WT,respectively) and pharmacologically isolated miniature inhibitorypostsynaptic currents (mIPSCs) were recorded (Fig. 1e).
We found that when mice were exposed to an enriched environmentsignificantly less frequent and slightly smaller amplitude mIPSCs wererecorded from NPAS4-KO neurons compared to the neighbouringNPAS4-WT neurons (Fig. 1g, Supplementary Table 1). Similar resultswere obtained from mice injected with kainic acid to induce NPAS4
(Fig. 1h). By contrast, no significant difference in mIPSC frequencyor amplitude was observed between neighbouring NPAS4-WT andNPAS4-KO neurons in slices acquired from mice maintained in stand-ard housing (Fig. 1f). Next we measured mIPSCs in wild-type mice anddetected no differences between AAV-Cre–GFP infected and uninfec-ted neurons (Extended Data Fig. 2a, b) indicating that the observedchanges in mIPSCs in Npas4f/f neurons are due to Npas4 excision.Finally, we crossed EMX-Cre and Npas4f/f mice to generate animalsthat lack NPAS4 postnatally and specifically in excitatory neurons(Extended Data Fig. 2c, d). Both mIPSC frequency and amplitude weresignificantly reduced in NPAS4-KO neurons from animals injectedwith kainic acid compared to mice maintained in standard housing(Extended Data Fig. 2e). From these analyses we conclude that disrup-tion of behaviourally induced NPAS4 expression leads to a decrease inmIPSC frequency recorded from CA1 pyramidal neurons.
This decrease in mIPSC frequency could be a consequence of homeo-static regulation of all inhibitory synapses or the modification of inhib-itory synapses that form on discrete regions of the pyramidal neuron.Local inhibitory neuron subtypes have axons that elaborate preferen-tially in one or more layers of the hippocampus2,3. Thus, stimulation ofaxons in the different laminar domains of the hippocampus and ana-lysis of the resulting inhibitory currents has the potential to revealwhether the NPAS4-dependent effects on inhibition are due to cell-wide or domain-specific regulation of inhibitory synapses.
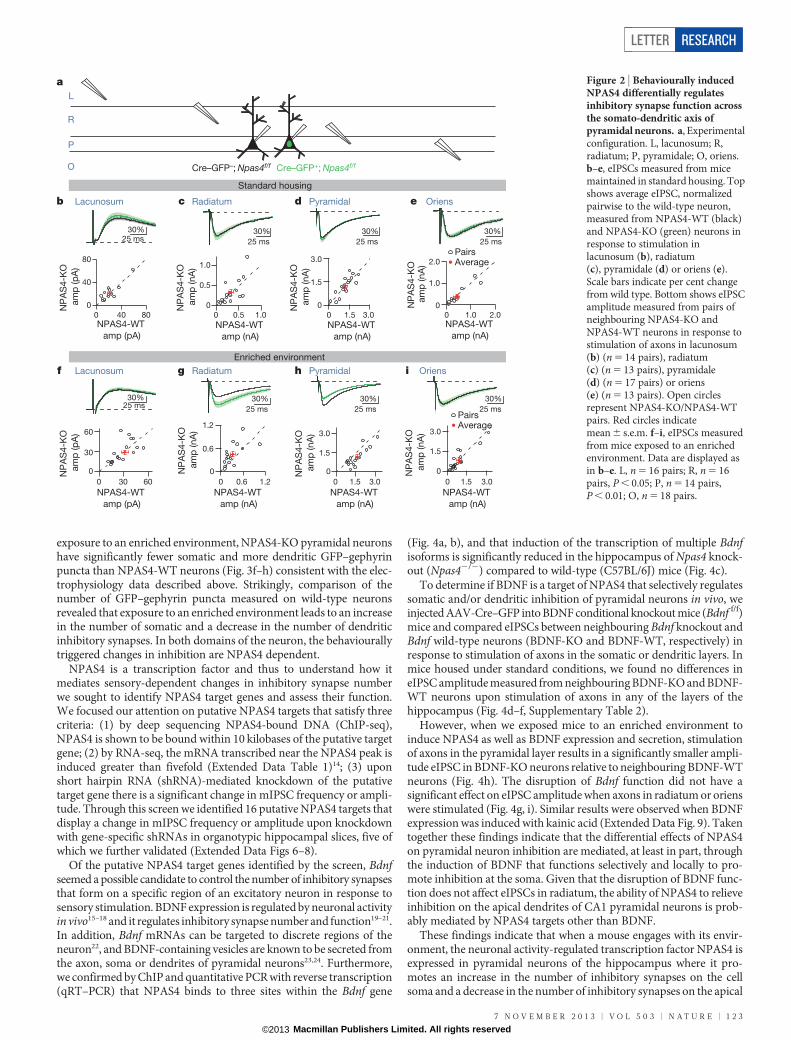
We sparsely excised Npas4 and made direct comparisons of layer-specific, pharmacologically isolated, monosynaptic evoked inhibitorypostsynaptic currents (eIPSCs) recorded simultaneously from neigh-bouring NPAS4-KO and NPAS4-WT CA1 neurons (Fig. 2a). As pre-dicted by cable properties, eIPSC rise times correlated with distanceof the stimulating electrode from the recording electrode (ExtendedData Fig. 3, Supplementary Table 2) indicating that stimulation ofaxons within a given layer is predominately activating synapses withinthat layer.
We found that in slices obtained from mice housed in a standardenvironment, equivalent eIPSCs were recorded from NPAS4-WT andNPAS4-KO neurons in response to stimulation of axons in any of thehippocampal layers (Fig. 2b–e, Supplementary Table 2). However, inslices obtained from mice exposed to an enriched environment, stimu-lation of axons in the pyramidal layer generated smaller eIPSCs inNPAS4-KO neurons than in the neighbouring NPAS4-WT neurons(Fig. 2h). By contrast, stimulation of axons in stratum radiatum generatedsignificantly larger eIPSCs in NPAS4-KO neurons than in neighbour-ing NPAS4-WT neurons (Fig. 2g), whereas no difference was detectedbetween NPAS4-WT and NPAS4-KO neurons upon stimulation ofaxons in oriens or lacunosum (Fig. 2f, i). Similar results were obtainedfrom mice injected with kainic acid to induce NPAS4 (Extended DataFig. 4). These findings indicate that NPAS4 expression does not resultin uniform, homeostatic regulation of inhibitory synapses. Rather, NPAS4functions in an unprecedented manner, simultaneously decreasing
*These authors contributed equally to this work.
1Departmentof Neurobiology, Harvard Medical School, Boston, Massachusetts02115, USA. 2Division of Biological Sciences, University of California San Diego, La Jolla, California 92093, USA. 3Departmentof Molecular and Cellular Biology, Harvard University, Cambridge, Massachusetts 02138, USA. {Present addresses: Icahn School of Medicine at Mount Sinai, New York, New York 10029, USA (H.A.B.);Department of Neuroscience, Brown University, National Institutes of Health Graduate Partnership Program, Providence, Rhode Island 02912, USA (A.T.).
7 N O V E M B E R 2 0 1 3 | V O L 5 0 3 | N A T U R E | 1 2 1
Macmillan Publishers Limited. All rights reserved©2013
inhibition within the proximal apical dendrites while increasing inhibi-tion at the soma.
Extracellular stimulation of axons could result in the depolarizationof axons of passage that preferentially form synapses on NPAS4-WTor NPAS4-KO neurons and in regions other than the intended layer.To address this possibility we compared the rise times of the eIPSCsrecorded from NPAS4-WT and NPAS4-KO neurons and found themto be indistinguishable (Extended Data Fig. 3). This indicates that theredistribution of inhibition observed is not due to a bias in synaptictransmission associated with axons of passage onto NPAS4-WT orNPAS4-KO neurons. Additionally, the hippocampus contains severalinterneuron subtypes that form synapses within multiple layers (thatis, bistratified and trilaminar cells). If NPAS4 regulates synapses madeby these cell types, it is probable that only boutons that synapse on theapical, and not basal, dendrites are affected by loss of NPAS4.
We next investigated the cellular mechanisms by which NPAS4 dif-ferentially regulates inhibition, including possible effects on dendriticgrowth, changes in the probability of inhibitory synaptic vesicle releaseor changes in inhibitory synapse number. We first asked whether lossof NPAS4 results in altered dendritic complexity which could indirectlylead to larger eIPSCs in response to stimulation of axons in radiatum.However, this seems unlikely because Sholl analysis revealed that thedisruption of NPAS4 function has no effect on dendrite number orlength (Fig. 3a, b, Extended Data Fig. 5a, b). In addition, the capacitanceof neurons from mice housed under standard conditions, in an enriched
environment or exposed to kainic acid are equivalent (SupplementaryTable 3).
We next asked whether disruption of Npas4 leads to changes in thepresynaptic release of neurotransmitter at axons that synapse ontodifferent regions of the pyramidal neuron. We measured the pairedpulse ratios (PPRs) upon stimulation of axons in each layer, and com-pared NPAS4-WT and NPAS4-KO neurons in slices obtained frommice housed under standard conditions, in an enriched environment,or injected with kainic acid. We found no difference between the PPRsof NPAS4-WT and NPAS4-KO neurons under any of these conditions(Fig. 3c–e, Extended Data Fig. 5c–e, Supplementary Table 2) indicatingthat the NPAS4-dependent changes in eIPSCs are not likely due tochanges in the probability of presynaptic vesicle release.
Finally we asked whether NPAS4 differentially regulates the numberof inhibitory synapses on the soma or apical dendrites. To quantifyinhibitory synapses we co-injected AAVs encoding mCherry-IRES-Cre and Cre-dependent GFP–gephyrin fusion protein into the CA1region of the hippocampus in wild-type and Npas4f/f mice. GFP–gephyrin fusion proteins when expressed at low levels localize to inhib-itory synapses without significantly altering neurotransmission12,13.Cre was sparsely expressed and GFP–gephyrin puncta quantified onNPAS4-WT and NPAS4-KO neurons. This analysis revealed that whenmice were kept in standard housing, NPAS4-WT and NPAS4-KOhippocampal pyramidal neurons have equivalent densities of GFP–gephyrin puncta on the soma and apical dendrites. However, after
Standard housing
Hippocampus
NP
AS
4 c
ells
per
sectio
n
0
0.6
1.6
Kainic acid
Standard housing Kainic acid
CA1
AAV-Cre–GFP; Npas4f/f
Cre–GFP
CA1
CA3
DG
NPAS4-WT
Cre–GFP+
NPAS4-KO
Cre–GFP–
Npas4f/f
Cre–GFP+
Npas4f/f
50 pA
500 ms
CA1
CA3
DG
NP
AS
4 c
ells
(%
) StrdKA
StrdEE
Enriched environment
0
100
50
15
10
5
0
151050
60
30
0
60300
15
10
5
0
151050
60
30
0
60300
15
10
5
0
151050
60
30
0
60300NP
AS
4-K
O a
mp
(p
A)
NPAS4-WT amp (pA)
NP
AS
4-K
O f
req
(H
z)
NPAS4-WT freq (Hz)
NP
AS
4-K
O a
mp
(p
A)
NPAS4-WT amp (pA)
NP
AS
4-K
O f
req
(H
z)
NPAS4-WT freq (Hz)
NP
AS
4-K
O a
mp
(p
A)
NPAS4-WT amp (pA)
NP
AS
4-K
O f
req
(H
z)
NPAS4-WT freq (Hz)
Enriched environment
a b c
d e
f g h
200 µm
25 µm 25 µm 25 µm
200 µm 200 µm
NPAS4NeuN
PairsAverage
PairsAverage
PairsAverage
200 µm
Cre–GFP–
CA1CA1
*
*
Somatic
Apical
BasalSomatic
*
*
Figure 1 | Exposure of mice toincreased circuit activity reveals anNPAS4-dependent regulation ofinhibition in vivo.a–c, Hippocampal sections fromwild-type mice in standard housing(a), enriched environment (EE)(b) or after kainic acid (KA) injection(c). Sections were immunostained forNPAS4 (red) and NeuN (blue)protein. Quantification is shown inb and c. Data are shown asmean 6 s.e.m. For each conditionn 5 3 animals with 3–5 sections peranimal. *P , 0.01. d, Wide-field(left) and fluorescence (right) imageof hippocampal slice from anNpas4f/f mouse injected with AAV-Cre–GFP. e, Experimentalconfiguration. f–h, mIPSC frequency(top) and amplitude (bottom)recorded from neighbouringNPAS4-WT and NPAS4-KOneurons from mice maintained instandard housing (f) (n 5 14 pairs),enriched environment (g) (n 5 23pairs, freq: P , 0.05) or after kainicacid injection (h) (n 5 26 pairs, freq:P , 0.01, amp: P , 0.05). Opencircles represent NPAS4-KO/NPAS4-WT pairs. Red circlesindicate mean 6 s.e.m.
RESEARCH LETTER
1 2 2 | N A T U R E | V O L 5 0 3 | 7 N O V E M B E R 2 0 1 3
Macmillan Publishers Limited. All rights reserved©2013
exposure to an enriched environment, NPAS4-KO pyramidal neuronshave significantly fewer somatic and more dendritic GFP–gephyrinpuncta than NPAS4-WT neurons (Fig. 3f–h) consistent with the elec-trophysiology data described above. Strikingly, comparison of thenumber of GFP–gephyrin puncta measured on wild-type neuronsrevealed that exposure to an enriched environment leads to an increasein the number of somatic and a decrease in the number of dendriticinhibitory synapses. In both domains of the neuron, the behaviourallytriggered changes in inhibition are NPAS4 dependent.
NPAS4 is a transcription factor and thus to understand how itmediates sensory-dependent changes in inhibitory synapse numberwe sought to identify NPAS4 target genes and assess their function.We focused our attention on putative NPAS4 targets that satisfy threecriteria: (1) by deep sequencing NPAS4-bound DNA (ChIP-seq),NPAS4 is shown to be bound within 10 kilobases of the putative targetgene; (2) by RNA-seq, the mRNA transcribed near the NPAS4 peak isinduced greater than fivefold (Extended Data Table 1)14; (3) uponshort hairpin RNA (shRNA)-mediated knockdown of the putativetarget gene there is a significant change in mIPSC frequency or ampli-tude. Through this screen we identified 16 putative NPAS4 targets thatdisplay a change in mIPSC frequency or amplitude upon knockdownwith gene-specific shRNAs in organotypic hippocampal slices, five ofwhich we further validated (Extended Data Figs 6–8).
Of the putative NPAS4 target genes identified by the screen, Bdnfseemed a possible candidate to control the number of inhibitory synapsesthat form on a specific region of an excitatory neuron in response tosensory stimulation. BDNF expression is regulated by neuronal activityin vivo15–18 and it regulates inhibitory synapse number and function19–21.In addition, Bdnf mRNAs can be targeted to discrete regions of theneuron22, and BDNF-containing vesicles are known to be secreted fromthe axon, soma or dendrites of pyramidal neurons23,24. Furthermore,we confirmed by ChIP and quantitative PCR with reverse transcription(qRT–PCR) that NPAS4 binds to three sites within the Bdnf gene
(Fig. 4a, b), and that induction of the transcription of multiple Bdnfisoforms is significantly reduced in the hippocampus of Npas4 knock-out (Npas42/2) compared to wild-type (C57BL/6J) mice (Fig. 4c).
To determine if BDNF is a target of NPAS4 that selectively regulatessomatic and/or dendritic inhibition of pyramidal neurons in vivo, weinjected AAV-Cre–GFP into BDNF conditional knockout mice (Bdnf f/f)mice and compared eIPSCs between neighbouring Bdnf knockout andBdnf wild-type neurons (BDNF-KO and BDNF-WT, respectively) inresponse to stimulation of axons in the somatic or dendritic layers. Inmice housed under standard conditions, we found no differences ineIPSC amplitude measured from neighbouring BDNF-KO and BDNF-WT neurons upon stimulation of axons in any of the layers of thehippocampus (Fig. 4d–f, Supplementary Table 2).
However, when we exposed mice to an enriched environment toinduce NPAS4 as well as BDNF expression and secretion, stimulationof axons in the pyramidal layer results in a significantly smaller ampli-tude eIPSC in BDNF-KO neurons relative to neighbouring BDNF-WTneurons (Fig. 4h). The disruption of Bdnf function did not have asignificant effect on eIPSC amplitude when axons in radiatum or orienswere stimulated (Fig. 4g, i). Similar results were observed when BDNFexpression was induced with kainic acid (Extended Data Fig. 9). Takentogether these findings indicate that the differential effects of NPAS4on pyramidal neuron inhibition are mediated, at least in part, throughthe induction of BDNF that functions selectively and locally to pro-mote inhibition at the soma. Given that the disruption of BDNF func-tion does not affect eIPSCs in radiatum, the ability of NPAS4 to relieveinhibition on the apical dendrites of CA1 pyramidal neurons is prob-ably mediated by NPAS4 targets other than BDNF.
These findings indicate that when a mouse engages with its envir-onment, the neuronal activity-regulated transcription factor NPAS4 isexpressed in pyramidal neurons of the hippocampus where it pro-motes an increase in the number of inhibitory synapses on the cellsoma and a decrease in the number of inhibitory synapses on the apical
L
R
P
O
Standard housing
a
ecb
80
40
0
80400
3.0
1.5
0
3.01.50
1.0
0.5
0
1.00.50
NP
AS
4-K
O
am
p (p
A)
NPAS4-WT
amp (pA)
PairsAverage
PairsAverage
2.0
1.0
02.01.00
Enriched environment
3.0
1.5
0
3.01.50
0
60
30
0
60300
1.2
0.6
0
1.20.60
3.0
1.5
3.01.50
Lacunosum Radiatum Pyramidal Oriens
Lacunosum Radiatum Pyramidal Oriens
d
ihgf
30%
25 ms
30%
25 ms
30%
25 ms
30%25 ms
30%
25 ms
30%
25 ms
30%
25 ms
30%25 ms
NP
AS
4-K
O
am
p (n
A)
NPAS4-WT
amp (nA)
NP
AS
4-K
O
am
p (n
A)
NPAS4-WT
amp (nA)
NP
AS
4-K
O
am
p (n
A)
NPAS4-WT
amp (nA)
NP
AS
4-K
O
am
p (p
A)
NPAS4-WT
amp (pA)
NP
AS
4-K
O
am
p (nA
)
NPAS4-WT
amp (nA)
NP
AS
4-K
O
am
p (nA
)
NPAS4-WT
amp (nA)
NP
AS
4-K
O
am
p (nA
)
NPAS4-WT
amp (nA)
Cre–GFP–; Npas4f/f Cre–GFP+; Npas4f/f
Figure 2 | Behaviourally inducedNPAS4 differentially regulatesinhibitory synapse function acrossthe somato-dendritic axis ofpyramidal neurons. a, Experimentalconfiguration. L, lacunosum; R,radiatum; P, pyramidale; O, oriens.b–e, eIPSCs measured from micemaintained in standard housing. Topshows average eIPSC, normalizedpairwise to the wild-type neuron,measured from NPAS4-WT (black)and NPAS4-KO (green) neurons inresponse to stimulation inlacunosum (b), radiatum(c), pyramidale (d) or oriens (e).Scale bars indicate per cent changefrom wild type. Bottom shows eIPSCamplitude measured from pairs ofneighbouring NPAS4-KO andNPAS4-WT neurons in response tostimulation of axons in lacunosum(b) (n 5 14 pairs), radiatum(c) (n 5 13 pairs), pyramidale(d) (n 5 17 pairs) or oriens(e) (n 5 13 pairs). Open circlesrepresent NPAS4-KO/NPAS4-WTpairs. Red circles indicatemean 6 s.e.m. f–i, eIPSCs measuredfrom mice exposed to an enrichedenvironment. Data are displayed asin b–e. L, n 5 16 pairs; R, n 5 16pairs, P , 0.05; P, n 5 14 pairs,P , 0.01; O, n 5 18 pairs.
LETTER RESEARCH
7 N O V E M B E R 2 0 1 3 | V O L 5 0 3 | N A T U R E | 1 2 3
Macmillan Publishers Limited. All rights reserved©2013

dendrites. In light of recent reports indicating that inhibition withinthese cellular domains can have distinct functions25–28, we speculatethat this redistribution of inhibition will have significant effects oninformation processing in the postsynaptic neuron. For example, theopposing regulation of somatic and apical dendritic inhibition may allowintegration or plasticity of excitatory events in the apical dendrites whilestill limiting the generation of somatic action potentials and thus thepropagation of information to downstream neurons. This is in contrastto homeostatic scaling of inhibitory synapses—a process whereby the
a Standard housing
25 µm
PP
R N
PA
S4
-WT
PP
R N
PA
S4
-KO Strd housing EE2
1
0
25 50 100
Merge
Merge
200
2
1
0
25 50 100 200
2
1
0
25 50 100 200
25 µm 151050
Intersections
ISI (ms) ISI (ms) ISI (ms)
Intersections
NPAS4-WT NPAS4-KO NPAS4-WT NPAS4-KO
151050
400
200
0
–200
Sh
oll
rad
ius (µ
m)
400
200
0
–200
Sh
oll
rad
ius (µ
m)
50 ms40%
50 ms40%
50 ms40%
PP
R N
PA
S4
-WT
PP
R N
PA
S4
-KO
PP
R N
PA
S4
-WT
PP
R N
PA
S4
-KO
6
4
2
0Pu
ncta
per
so
ma
Standard EE
0.6
0.4
0.2
0.0Pu
ncta
per
10
µm
Standard EE
25 µm 25 µm
Enriched environmentb
c ed
NPAS4-WTNPAS4-KO
f
h
Pyra
mid
al
mCherry GFP–Geph
Rad
iatu
m
*
*
mCherry GFP–Geph
g
i
20 µm
NPAS4-WT NPAS4-KO
NPAS4-WTNPAS4-KO
Radiatium Pyramidal Oriens
20 µm
Figure 3 | Behaviourally induced NPAS4 regulates inhibitory synapsenumber. a, Standard housing example NPAS4-WT and NPAS4-KO CA1pyramidal neurons (left) and quantification of NPAS4-WT (black, n 5 10 neurons)and NPAS4-KO (red, n 5 10 neurons) dendrites (right). b, Enriched environmentSholl analysis, as in a. NPAS4-WT, n 5 7 neurons; NPAS4-KO, n 5 10 neurons.c–e, PPRs measured from NPAS4-WT and NPAS4-KO neurons in response tostimulation in radiatum (c), pyramidale (d) or oriens (e). Standard housing (black,R, n 5 9 neurons; P, n 5 10 neurons; O, n 5 8 neurons) or enriched environment(green, R, n 5 16 neurons; P, n 5 11 neurons; O, n 5 16 neurons). Examples arefrom standard housing (top) and are shown normalized to peak current recordedfrom the NPAS4-WT neuron. Scale bars indicate per cent change from wild type.
ISI, interstimulus interval. f, Example image of dendrites in radiatum.g, Quantification of dendritic GFP–gephyrin puncta from NPAS4-WT (black,standard housing, n 5 15 sections/63 dendritic segments; enriched environment,n 5 14 sections/40 dendritic segments) and NPAS4-KO (red, standard housing,n 5 18 sections/172 dendritic segments; enriched environment n 5 18 sections/167 dendritic segments) neurons. Enriched environment P , 0.01. h, Exampleimage of somata in pyramidale. i, Quantification of somatic GFP–gephyrin punctafrom NPAS4-WT (black, standard housing, n 5 14 sections/32 soma; enrichedenvironment, n 5 11 sections/20 soma) and NPAS4-KO (red, standard housing,n 5 17sections/94 soma, enriched environment: n 5 21sections/75 soma)neurons. Enriched environment P , 0.05. All data are shown as mean 6 s.e.m.
a
Standard Housing
0.6
0.4
0.2
00.60.40.20
BD
NF
-KO
am
p (n
A)
Enriched environment
Pyramidal Oriens
2.0
1.0
0
2.01.00
2.0
1.0
0
0 1.0 2.0
3.0
2.0
1.0
0
3.01.0 2.00
2.0
1.0
0
2.00 1.0
g
PairsAverage
fe
h i
30%
25 ms
30%
25 ms
30%
25 ms
30%
25 ms
30%
25 ms
30%
25 ms
d
b
Radiatum
Pyramidal OriensRadiatum
0.6
0.4
0.2
0
0.60.40.20
us P1 I3 neg 1 P4 neg 2
1.5
1.0
0.5
0.0En
rich
men
t (×
10
–3)
**
*
c
BDNF-WT amp (nA)
200
150
100
50
0coding
E9E1 E2 E3 E4 E5 E6 E7 E8
Wild type Npas–/–
Fo
ld in
du
ctio
n (K
A/s
trd
)
*
*
*
***
BD
NF
-KO
am
p (n
A)
BDNF-WT amp (nA)
BD
NF
-KO
am
p (n
A)
BDNF-WT amp (nA)
BD
NF
-KO
am
p (n
A)
BDNF-WT amp (nA) BD
NF
-KO
am
p (n
A)
BDNF-WT amp (nA)
BD
NF
-KO
am
p (nA
)
BDNF-WT amp (nA)
Strd
KA
1 2 3 4 5 6 8 97
Figure 4 | Behaviourally induced BDNF regulates somatic but not dendriticinhibition. a, Schematic of Bdnf gene. Exons 1–9 are indicated. b, qPCR ofNPAS4 bound DNA. ChIP samples are from wild-type mice in standardconditions (black) or after kainic acid injection (red). us, upstream region; P1,promoter 1; I3, intron 3; neg 1, control region; P4, promoter 4; neg 2, controlregion. Enrichment relative to input DNA. n 5 3. *P , 0.05. c, Induction ofBdnf exons in wild-type (black, standard housing, n 5 5 animals; kainic acid,n 5 6 animals) or Npas42/2animals (red, standard housing, n 5 5 animals;kainic acid, n 5 6 animals) mice as measured by qRT–PCR with exon specificprimers, E1–9.*P , 0.05. Data in b and c are shown as mean 6 s.e.m.d–f, eIPSCs measured from mice maintained in standard housing. Top showsaverage eIPSC, normalized pairwise to the wild-type neuron, measured fromBDNF-WT (black) and BDNF-KO (green) neurons in response to stimulationin radiatum (d), pyramidale (e) or oriens (f). Scale bars indicate per cent changefrom wild type. Bottom shows eIPSC amplitude measured from pairs ofneighbouring BDNF-KO and BDNF-WT neurons in response to stimulation ofaxons in radiatum (d) (n 5 14 pairs), pyramidale (e) (n 5 15 pairs) or oriens(f) (n 5 11 pairs). Open circles represent BDNF-KO/BDNF-WT pairs. Redcircles indicate mean 6 s.e.m. g–i, eIPSC measured from mice housed in anenriched environment. Data are shown as in d–f. R, n 5 10 pairs; P, n 5 14pairs; P , 0.05; O, n 5 14 pairs.
RESEARCH LETTER
1 2 4 | N A T U R E | V O L 5 0 3 | 7 N O V E M B E R 2 0 1 3
Macmillan Publishers Limited. All rights reserved©2013
action potential output of a neuron is regulated by cell-wide scaling ofsynaptic strengths that preserves the relative strengths among synapses.The NPAS4-dependent redistribution of inhibitory circuitry may under-lie recent findings that associate NPAS4 function with contextual orstimulus dependent fear conditioning29,30.
METHODS SUMMARYAnimals were handled according to protocols approved by the Harvard UniversityStanding Committee on Animal Care and the University of California San DiegoInstitutional Animal Care and Use Committee, and were in accordance withfederal guidelines. Full details of experimental procedures for animal handling,virus injections, acute and organotypic slice preparation, electrophysiology,immunostaining, Sholl analysis, synapse labelling and quantification, ChIP,qRT–PCR and western blots are provided in the Methods.
Online Content Any additional Methods, Extended Data display items and SourceData are available in the online version of the paper; references unique to thesesections appear only in the online paper.
Received 13 August; accepted 9 October 2013.
1. Somogyi, P. & Klausberger, T. Defined types of cortical interneurone structurespace and spike timing in the hippocampus. J. Physiol. (Lond.) 562, 9–26 (2005).
2. Danglot, L., Triller, A. & Marty, S. The development of hippocampal interneurons inrodents. Hippocampus 16, 1032–1060 (2006).
3. Freund, T. F. & Buzsaki G.. Interneurons of the hippocampus. Hippocampus 6,347–470 (1996).
4. Turner, D. A. Feed-forward inhibitory potentials and excitatory interactions inguinea-pig hippocampal pyramidal cells. J. Physiol. (Lond.) 422, 333–350 (1990).
5. Liu, G. Local structural balance and functional interaction of excitatory andinhibitory synapses in hippocampal dendrites. Nature Neurosci. 7, 373–379(2004).
6. Chiu, C.Q.et al.Compartmentalization ofGABAergic inhibitionbydendritic spines.Science 340, 759–762 (2013).
7. Larkum, M. E., Zhu, J. J. & Sakmann, B. A new cellular mechanism for couplinginputs arriving at different cortical layers. Nature 398, 338–341 (1999).
8. Miles, R., Toth, K., Gulyas, A. I., Hajos,N.& Freund, T. F.Differencesbetween somaticand dendritic inhibition in the hippocampus. Neuron 16, 815–823 (1996).
9. Pouille, F. & Scanziani, M. Enforcement of temporal fidelity in pyramidal cells bysomatic feed-forward inhibition. Science 293, 1159–1163 (2001).
10. Lin, Y. et al. Activity-dependent regulation of inhibitory synapse development byNpas4. Nature 455, 1198–1204 (2008).
11. Adesnik, H., Li, G., During, M. J., Pleasure, S. J. & Nicoll, R. A. NMDA receptors inhibitsynapse unsilencing during brain development. Proc. Natl Acad. Sci. USA 105,5597–5602 (2008).
12. Chen, J. L. et al. Clustered dynamics of inhibitory synapses and dendritic spines inthe adult neocortex. Neuron 74, 361–373 (2012).
13. van Versendaal, D.et al. Elimination of inhibitory synapses is a major componentofadult ocular dominance plasticity. Neuron 74, 374–383 (2012).
14. Kim, T. K. et al. Widespread transcription at neuronal activity-regulated enhancers.Nature 465, 182–187 (2010).
15. Rocamora, N., Welker, E., Pascual, M. & Soriano, E. Upregulation of BDNF mRNAexpression in the barrel cortex of adult mice after sensory stimulation. J. Neurosci.16, 4411–4419 (1996).
16. Castren, E., Zafra, F., Thoenen, H. & Lindholm, D. Light regulates expression ofbrain-derived neurotrophic factor mRNA in rat visual cortex. Proc. Natl Acad. Sci.USA 89, 9444–9448 (1992).
17. Lein, E. S. & Shatz, C. J. Rapid regulation of brain-derived neurotrophic factormRNA within eye-specific circuits during ocular dominance column formation.J. Neurosci. 20, 1470–1483 (2000).
18. Falkenberg, T. et al. Increased expression of brain-derived neurotrophic factormRNA in rat hippocampus is associated with improved spatial memory andenriched environment. Neurosci. Lett. 138, 153–156 (1992).
19. Marty, S., Wehrle, R. & Sotelo, C. Neuronal activity and brain-derived neurotrophicfactor regulate the density of inhibitory synapses in organotypic slice cultures ofpostnatal hippocampus. J. Neurosci. 20, 8087–8095 (2000).
20. Kohara, K. et al. A local reduction in cortical GABAergic synapses after a loss ofendogenous brain-derived neurotrophic factor, as revealed by single-cell geneknock-out method. J. Neurosci. 27, 7234–7244 (2007).
21. Baldelli, P., Hernandez-Guijo, J.-M., Carabelli, V. & Carbone, E. Brain-derivedneurotrophic factor enhances GABA release probability and nonuniformdistribution of N- and P/Q-type channels on release sites of hippocampalinhibitory Synapses. J. Neurosci. 25, 3358–3368 (2005).
22. Pattabiraman,P. P. et al.Neuronal activity regulates the developmental expressionand subcellular localization of cortical BDNF mRNA isoforms in vivo. Mol. Cell.Neurosci. 28, 556–570 (2005).
23. Brigadski, T., Hartmann, M. & Lessmann, V. Differential vesicular targeting andtime course of synaptic secretion of the mammalian neurotrophins. J. Neurosci.25, 7601–7614 (2005).
24. Dean, C. et al. Distinct subsets of Syt-IV/BDNF vesicles are sorted to axons versusdendrites and recruited to synapses by activity. J. Neurosci. 32, 5398–5413(2012).
25. Atallah, B. V., Bruns, W., Carandini, M. & Scanziani, M. Parvalbumin-expressinginterneurons linearly transform cortical responses to visual stimuli. Neuron 73,159–170 (2012).
26. Lovett-Barron, M. et al. Regulation of neuronal input transformations by tunabledendritic inhibition. Nature Neurosci. 15, 423–430 (2012).
27. Royer, S. et al. Control of timing, rate and bursts of hippocampal place cells bydendritic and somatic inhibition. Nature Neurosci. 15, 769–775 (2012).
28. Lee, S. H. et al. Activation of specific interneurons improves V1 feature selectivityand visual perception. Nature 488, 379–383 (2012).
29. Ploski, J. E., Monsey, M. S., Nguyen, T., DiLeone, R. J. & Schafe, G. E. The neuronalPAS domain protein 4 (Npas4) is required for new and reactivated fear memories.PLoS ONE 6, e23760 (2011).
30. Ramamoorthi, K. et al. Npas4 regulates a transcriptional program in CA3 requiredfor contextual memory formation. Science 334, 1669–1675 (2011).
Supplementary Information is available in the online version of the paper.
Acknowledgements We thank members of the Greenberg laboratory for comments,suggestions and critical reading of the manuscript. We thank A. Mardinly forobservations and comments on NPAS4 protein induction, P. Greer and S. Flavell forobservations and comments on Npas4 mRNA induction in response to enrichedenvironment and B. Cruz Moreno for help with sectioning. We thank M. During for thegift of the AAV-Cre–GFP plasmid. GFP–gephyrin images were collected at the UCSDNeuroscience Microscopy Shared Facility sponsored by grant P30 NS047101. Thiswork was funded by Helen Hay Whitney Foundation, L’Oreal USA Fellowship forWomen in Science and The Medical Foundation/Charles A. King Trust PostdoctoralFellowship (B.L.B.), NSF graduate student research fellowship (N.S.) and NationalInstitutes of Health grant NS028829 (M.E.G.).
Author Contributions Experiments were designed by B.L.B., N.S. and M.E.G.Experiments were conducted and analysed by B.L.B., N.S., H.A.B. and A.Z.T. Themanuscript was written by B.L.B., N.S. and M.E.G.
Author Information Reprints and permissions information is available atwww.nature.com/reprints. The authors declare no competing financial interests.Readers are welcome to comment on the online version of the paper. Correspondenceand requests for materials should be addressed to M.E.G.([email protected]).
LETTER RESEARCH
7 N O V E M B E R 2 0 1 3 | V O L 5 0 3 | N A T U R E | 1 2 5
Macmillan Publishers Limited. All rights reserved©2013
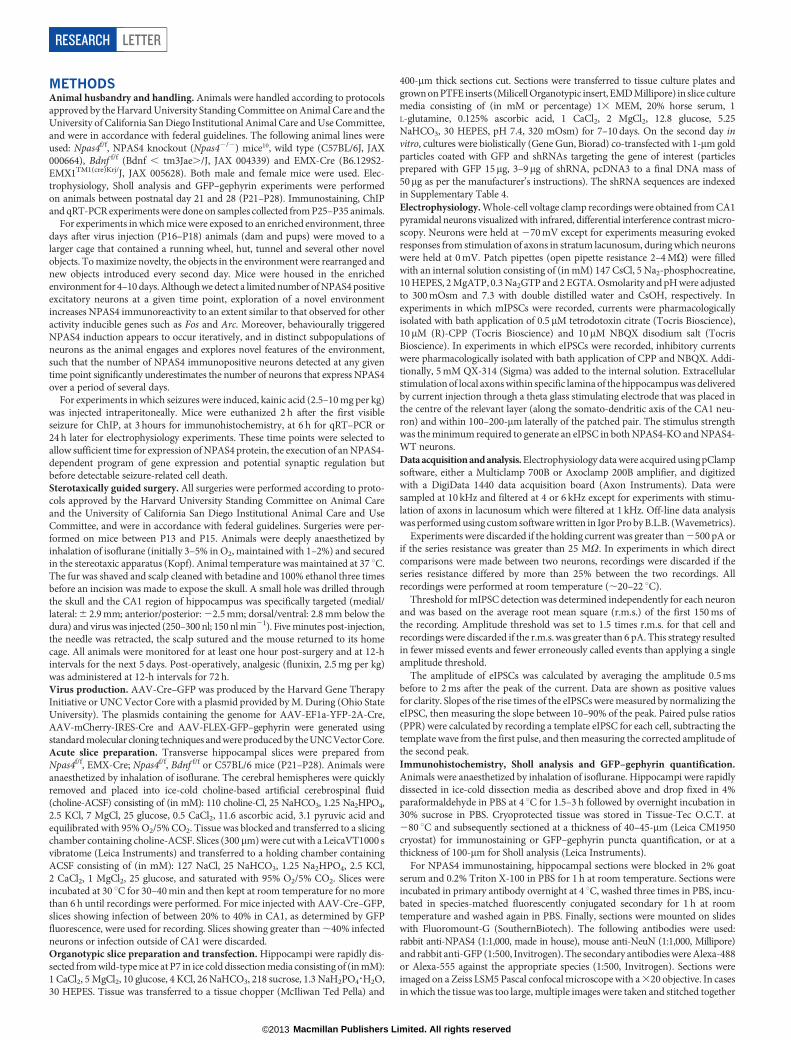
METHODSAnimal husbandry and handling. Animals were handled according to protocolsapproved by the Harvard University Standing Committee on Animal Care and theUniversity of California San Diego Institutional Animal Care and Use Committee,and were in accordance with federal guidelines. The following animal lines wereused: Npas4f/f, NPAS4 knockout (Npas42/2) mice10, wild type (C57BL/6J, JAX000664), Bdnf f/f (Bdnf , tm3Jae./J, JAX 004339) and EMX-Cre (B6.129S2-EMX1TM1(cre)Krj/J, JAX 005628). Both male and female mice were used. Elec-trophysiology, Sholl analysis and GFP–gephyrin experiments were performedon animals between postnatal day 21 and 28 (P21–P28). Immunostaining, ChIPand qRT-PCR experiments were done on samples collected from P25–P35 animals.
For experiments in which mice were exposed to an enriched environment, threedays after virus injection (P16–P18) animals (dam and pups) were moved to alarger cage that contained a running wheel, hut, tunnel and several other novelobjects. To maximize novelty, the objects in the environment were rearranged andnew objects introduced every second day. Mice were housed in the enrichedenvironment for 4–10 days. Although we detect a limited number of NPAS4 positiveexcitatory neurons at a given time point, exploration of a novel environmentincreases NPAS4 immunoreactivity to an extent similar to that observed for otheractivity inducible genes such as Fos and Arc. Moreover, behaviourally triggeredNPAS4 induction appears to occur iteratively, and in distinct subpopulations ofneurons as the animal engages and explores novel features of the environment,such that the number of NPAS4 immunopositive neurons detected at any giventime point significantly underestimates the number of neurons that express NPAS4over a period of several days.
For experiments in which seizures were induced, kainic acid (2.5–10 mg per kg)was injected intraperitoneally. Mice were euthanized 2 h after the first visibleseizure for ChIP, at 3 hours for immunohistochemistry, at 6 h for qRT–PCR or24 h later for electrophysiology experiments. These time points were selected toallow sufficient time for expression of NPAS4 protein, the execution of an NPAS4-dependent program of gene expression and potential synaptic regulation butbefore detectable seizure-related cell death.Sterotaxically guided surgery. All surgeries were performed according to proto-cols approved by the Harvard University Standing Committee on Animal Careand the University of California San Diego Institutional Animal Care and UseCommittee, and were in accordance with federal guidelines. Surgeries were per-formed on mice between P13 and P15. Animals were deeply anaesthetized byinhalation of isoflurane (initially 3–5% in O2, maintained with 1–2%) and securedin the stereotaxic apparatus (Kopf). Animal temperature was maintained at 37 uC.The fur was shaved and scalp cleaned with betadine and 100% ethanol three timesbefore an incision was made to expose the skull. A small hole was drilled throughthe skull and the CA1 region of hippocampus was specifically targeted (medial/lateral: 6 2.9 mm; anterior/posterior: 22.5 mm; dorsal/ventral: 2.8 mm below thedura) and virus was injected (250–300 nl; 150 nl min21). Five minutes post-injection,the needle was retracted, the scalp sutured and the mouse returned to its homecage. All animals were monitored for at least one hour post-surgery and at 12-hintervals for the next 5 days. Post-operatively, analgesic (flunixin, 2.5 mg per kg)was administered at 12-h intervals for 72 h.Virus production. AAV-Cre–GFP was produced by the Harvard Gene TherapyInitiative or UNC Vector Core with a plasmid provided by M. During (Ohio StateUniversity). The plasmids containing the genome for AAV-EF1a-YFP-2A-Cre,AAV-mCherry-IRES-Cre and AAV-FLEX-GFP–gephyrin were generated usingstandard molecular cloning techniques and were produced by the UNC Vector Core.Acute slice preparation. Transverse hippocampal slices were prepared fromNpas4f/f, EMX-Cre; Npas4f/f, Bdnf f/f or C57BL/6 mice (P21–P28). Animals wereanaesthetized by inhalation of isoflurane. The cerebral hemispheres were quicklyremoved and placed into ice-cold choline-based artificial cerebrospinal fluid(choline-ACSF) consisting of (in mM): 110 choline-Cl, 25 NaHCO3, 1.25 Na2HPO4,2.5 KCl, 7 MgCl, 25 glucose, 0.5 CaCl2, 11.6 ascorbic acid, 3.1 pyruvic acid andequilibrated with 95% O2/5% CO2. Tissue was blocked and transferred to a slicingchamber containing choline-ACSF. Slices (300mm) were cut with a LeicaVT1000 svibratome (Leica Instruments) and transferred to a holding chamber containingACSF consisting of (in mM): 127 NaCl, 25 NaHCO3, 1.25 Na2HPO4, 2.5 KCl,2 CaCl2, 1 MgCl2, 25 glucose, and saturated with 95% O2/5% CO2. Slices wereincubated at 30 uC for 30–40 min and then kept at room temperature for no morethan 6 h until recordings were performed. For mice injected with AAV-Cre–GFP,slices showing infection of between 20% to 40% in CA1, as determined by GFPfluorescence, were used for recording. Slices showing greater than ,40% infectedneurons or infection outside of CA1 were discarded.Organotypic slice preparation and transfection. Hippocampi were rapidly dis-sected from wild-type mice at P7 in ice cold dissection media consisting of (in mM):1 CaCl2, 5 MgCl2, 10 glucose, 4 KCl, 26 NaHCO3, 218 sucrose, 1.3 NaH2PO4?H2O,30 HEPES. Tissue was transferred to a tissue chopper (McIliwan Ted Pella) and
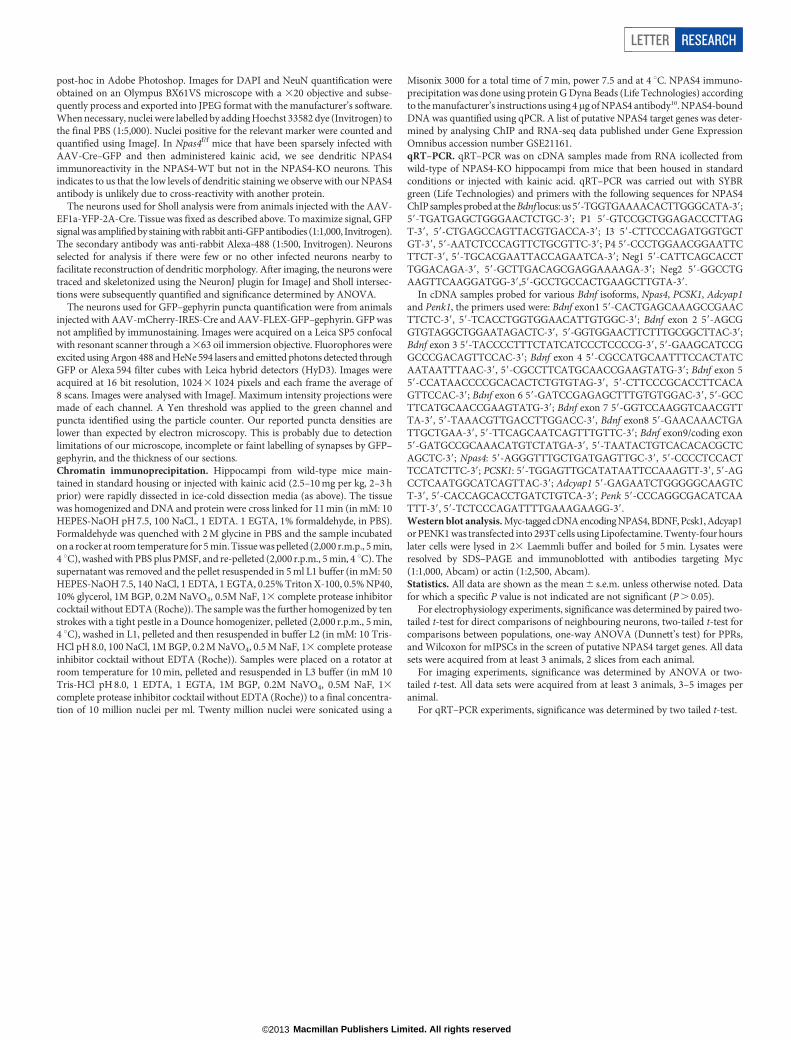
400-mm thick sections cut. Sections were transferred to tissue culture plates andgrown on PTFE inserts (Milicell Organotypic insert, EMD Millipore) in slice culturemedia consisting of (in mM or percentage) 13 MEM, 20% horse serum, 1L-glutamine, 0.125% ascorbic acid, 1 CaCl2, 2 MgCl2, 12.8 glucose, 5.25NaHCO3, 30 HEPES, pH 7.4, 320 mOsm) for 7–10 days. On the second day invitro, cultures were biolistically (Gene Gun, Biorad) co-transfected with 1-mm goldparticles coated with GFP and shRNAs targeting the gene of interest (particlesprepared with GFP 15mg, 3–9mg of shRNA, pcDNA3 to a final DNA mass of50mg as per the manufacturer’s instructions). The shRNA sequences are indexedin Supplementary Table 4.Electrophysiology. Whole-cell voltage clamp recordings were obtained from CA1pyramidal neurons visualized with infrared, differential interference contrast micro-scopy. Neurons were held at 270 mV except for experiments measuring evokedresponses from stimulation of axons in stratum lacunosum, during which neuronswere held at 0 mV. Patch pipettes (open pipette resistance 2–4 MV) were filledwith an internal solution consisting of (in mM) 147 CsCl, 5 Na2-phosphocreatine,10 HEPES, 2 MgATP, 0.3 Na2GTP and 2 EGTA. Osmolarity and pH were adjustedto 300 mOsm and 7.3 with double distilled water and CsOH, respectively. Inexperiments in which mIPSCs were recorded, currents were pharmacologicallyisolated with bath application of 0.5mM tetrodotoxin citrate (Tocris Bioscience),10mM (R)-CPP (Tocris Bioscience) and 10mM NBQX disodium salt (TocrisBioscience). In experiments in which eIPSCs were recorded, inhibitory currentswere pharmacologically isolated with bath application of CPP and NBQX. Addi-tionally, 5 mM QX-314 (Sigma) was added to the internal solution. Extracellularstimulation of local axons within specific lamina of the hippocampus was deliveredby current injection through a theta glass stimulating electrode that was placed inthe centre of the relevant layer (along the somato-dendritic axis of the CA1 neu-ron) and within 100–200-mm laterally of the patched pair. The stimulus strengthwas the minimum required to generate an eIPSC in both NPAS4-KO and NPAS4-WT neurons.Data acquisition and analysis. Electrophysiology data were acquired using pClampsoftware, either a Multiclamp 700B or Axoclamp 200B amplifier, and digitizedwith a DigiData 1440 data acquisition board (Axon Instruments). Data weresampled at 10 kHz and filtered at 4 or 6 kHz except for experiments with stimu-lation of axons in lacunosum which were filtered at 1 kHz. Off-line data analysiswas performed using custom software written in Igor Pro by B.L.B. (Wavemetrics).
Experiments were discarded if the holding current was greater than 2500 pA orif the series resistance was greater than 25 MV. In experiments in which directcomparisons were made between two neurons, recordings were discarded if theseries resistance differed by more than 25% between the two recordings. Allrecordings were performed at room temperature (,20–22 uC).
Threshold for mIPSC detection was determined independently for each neuronand was based on the average root mean square (r.m.s.) of the first 150 ms ofthe recording. Amplitude threshold was set to 1.5 times r.m.s. for that cell andrecordings were discarded if the r.m.s. was greater than 6 pA. This strategy resultedin fewer missed events and fewer erroneously called events than applying a singleamplitude threshold.
The amplitude of eIPSCs was calculated by averaging the amplitude 0.5 msbefore to 2 ms after the peak of the current. Data are shown as positive valuesfor clarity. Slopes of the rise times of the eIPSCs were measured by normalizing theeIPSC, then measuring the slope between 10–90% of the peak. Paired pulse ratios(PPR) were calculated by recording a template eIPSC for each cell, subtracting thetemplate wave from the first pulse, and then measuring the corrected amplitude ofthe second peak.Immunohistochemistry, Sholl analysis and GFP–gephyrin quantification.Animals were anaesthetized by inhalation of isoflurane. Hippocampi were rapidlydissected in ice-cold dissection media as described above and drop fixed in 4%paraformaldehyde in PBS at 4 uC for 1.5–3 h followed by overnight incubation in30% sucrose in PBS. Cryoprotected tissue was stored in Tissue-Tec O.C.T. at280 uC and subsequently sectioned at a thickness of 40–45-mm (Leica CM1950cryostat) for immunostaining or GFP–gephyrin puncta quantification, or at athickness of 100-mm for Sholl analysis (Leica Instruments).
For NPAS4 immunostaining, hippocampal sections were blocked in 2% goatserum and 0.2% Triton X-100 in PBS for 1 h at room temperature. Sections wereincubated in primary antibody overnight at 4 uC, washed three times in PBS, incu-bated in species-matched fluorescently conjugated secondary for 1 h at roomtemperature and washed again in PBS. Finally, sections were mounted on slideswith Fluoromount-G (SouthernBiotech). The following antibodies were used:rabbit anti-NPAS4 (1:1,000, made in house), mouse anti-NeuN (1:1,000, Millipore)and rabbit anti-GFP (1:500, Invitrogen). The secondary antibodies were Alexa-488or Alexa-555 against the appropriate species (1:500, Invitrogen). Sections wereimaged on a Zeiss LSM5 Pascal confocal microscope with a 320 objective. In casesin which the tissue was too large, multiple images were taken and stitched together
RESEARCH LETTER
Macmillan Publishers Limited. All rights reserved©2013
post-hoc in Adobe Photoshop. Images for DAPI and NeuN quantification wereobtained on an Olympus BX61VS microscope with a 320 objective and subse-quently process and exported into JPEG format with the manufacturer’s software.When necessary, nuclei were labelled by adding Hoechst 33582 dye (Invitrogen) tothe final PBS (1:5,000). Nuclei positive for the relevant marker were counted andquantified using ImageJ. In Npas4f/f mice that have been sparsely infected withAAV-Cre–GFP and then administered kainic acid, we see dendritic NPAS4immunoreactivity in the NPAS4-WT but not in the NPAS4-KO neurons. Thisindicates to us that the low levels of dendritic staining we observe with our NPAS4antibody is unlikely due to cross-reactivity with another protein.
The neurons used for Sholl analysis were from animals injected with the AAV-EF1a-YFP-2A-Cre. Tissue was fixed as described above. To maximize signal, GFPsignal was amplified by staining with rabbit anti-GFP antibodies (1:1,000, Invitrogen).The secondary antibody was anti-rabbit Alexa-488 (1:500, Invitrogen). Neuronsselected for analysis if there were few or no other infected neurons nearby tofacilitate reconstruction of dendritic morphology. After imaging, the neurons weretraced and skeletonized using the NeuronJ plugin for ImageJ and Sholl intersec-tions were subsequently quantified and significance determined by ANOVA.
The neurons used for GFP–gephyrin puncta quantification were from animalsinjected with AAV-mCherry-IRES-Cre and AAV-FLEX-GFP–gephyrin. GFP wasnot amplified by immunostaining. Images were acquired on a Leica SP5 confocalwith resonant scanner through a 363 oil immersion objective. Fluorophores wereexcited using Argon 488 and HeNe 594 lasers and emitted photons detected throughGFP or Alexa 594 filter cubes with Leica hybrid detectors (HyD3). Images wereacquired at 16 bit resolution, 1024 3 1024 pixels and each frame the average of8 scans. Images were analysed with ImageJ. Maximum intensity projections weremade of each channel. A Yen threshold was applied to the green channel andpuncta identified using the particle counter. Our reported puncta densities arelower than expected by electron microscopy. This is probably due to detectionlimitations of our microscope, incomplete or faint labelling of synapses by GFP–gephyrin, and the thickness of our sections.Chromatin immunoprecipitation. Hippocampi from wild-type mice main-tained in standard housing or injected with kainic acid (2.5–10 mg per kg, 2–3 hprior) were rapidly dissected in ice-cold dissection media (as above). The tissuewas homogenized and DNA and protein were cross linked for 11 min (in mM: 10HEPES-NaOH pH 7.5, 100 NaCl., 1 EDTA. 1 EGTA, 1% formaldehyde, in PBS).Formaldehyde was quenched with 2 M glycine in PBS and the sample incubatedon a rocker at room temperature for 5 min. Tissue was pelleted (2,000 r.m.p., 5 min,4 uC), washed with PBS plus PMSF, and re-pelleted (2,000 r.p.m., 5 min, 4 uC). Thesupernatant was removed and the pellet resuspended in 5 ml L1 buffer (in mM: 50HEPES-NaOH 7.5, 140 NaCl, 1 EDTA, 1 EGTA, 0.25% Triton X-100, 0.5% NP40,10% glycerol, 1M BGP, 0.2M NaVO4, 0.5M NaF, 13 complete protease inhibitorcocktail without EDTA (Roche)). The sample was the further homogenized by tenstrokes with a tight pestle in a Dounce homogenizer, pelleted (2,000 r.p.m., 5 min,4 uC), washed in L1, pelleted and then resuspended in buffer L2 (in mM: 10 Tris-HCl pH 8.0, 100 NaCl, 1M BGP, 0.2 M NaVO4, 0.5 M NaF, 13 complete proteaseinhibitor cocktail without EDTA (Roche)). Samples were placed on a rotator atroom temperature for 10 min, pelleted and resuspended in L3 buffer (in mM 10Tris-HCl pH 8.0, 1 EDTA, 1 EGTA, 1M BGP, 0.2M NaVO4, 0.5M NaF, 13
complete protease inhibitor cocktail without EDTA (Roche)) to a final concentra-tion of 10 million nuclei per ml. Twenty million nuclei were sonicated using a
Misonix 3000 for a total time of 7 min, power 7.5 and at 4 uC. NPAS4 immuno-precipitation was done using protein G Dyna Beads (Life Technologies) accordingto the manufacturer’s instructions using 4mg of NPAS4 antibody10. NPAS4-boundDNA was quantified using qPCR. A list of putative NPAS4 target genes was deter-mined by analysing ChIP and RNA-seq data published under Gene ExpressionOmnibus accession number GSE21161.qRT–PCR. qRT–PCR was on cDNA samples made from RNA icollected fromwild-type of NPAS4-KO hippocampi from mice that been housed in standardconditions or injected with kainic acid. qRT–PCR was carried out with SYBRgreen (Life Technologies) and primers with the following sequences for NPAS4ChIP samples probed at the Bdnf locus: us 59-TGGTGAAAACACTTGGGCATA-39;59-TGATGAGCTGGGAACTCTGC-39; P1 59-GTCCGCTGGAGACCCTTAGT-39, 59-CTGAGCCAGTTACGTGACCA-39; I3 59-CTTCCCAGATGGTGCTGT-39, 59-AATCTCCCAGTTCTGCGTTC-39; P4 59-CCCTGGAACGGAATTCTTCT-39, 59-TGCACGAATTACCAGAATCA-39; Neg1 59-CATTCAGCACCTTGGACAGA-39, 59-GCTTGACAGCGAGGAAAAGA-39; Neg2 59-GGCCTGAAGTTCAAGGATGG-39,59-GCCTGCCACTGAAGCTTGTA-39.
In cDNA samples probed for various Bdnf isoforms, Npas4, PCSK1, Adcyap1and Penk1, the primers used were: Bdnf exon1 59-CACTGAGCAAAGCCGAACTTCTC-39, 59-TCACCTGGTGGAACATTGTGGC-39; Bdnf exon 2 59-AGCGGTGTAGGCTGGAATAGACTC-39, 59-GGTGGAACTTCTTTGCGGCTTAC-39;Bdnf exon 3 59-TACCCCTTTCTATCATCCCTCCCCG-39, 59-GAAGCATCCGGCCCGACAGTTCCAC-39; Bdnf exon 4 59-CGCCATGCAATTTCCACTATCAATAATTTAAC-39, 59-CGCCTTCATGCAACCGAAGTATG-39; Bdnf exon 559-CCATAACCCCGCACACTCTGTGTAG-39, 59-CTTCCCGCACCTTCACAGTTCCAC-39; Bdnf exon 6 59-GATCCGAGAGCTTTGTGTGGAC-39, 59-GCCTTCATGCAACCGAAGTATG-39; Bdnf exon 7 59-GGTCCAAGGTCAACGTTTA-39, 59-TAAACGTTGACCTTGGACC-39, Bdnf exon8 59-GAACAAACTGATTGCTGAA-39, 59-TTCAGCAATCAGTTTGTTC-39; Bdnf exon9/coding exon59-GATGCCGCAAACATGTCTATGA-39, 59-TAATACTGTCACACACGCTCAGCTC-39; Npas4: 59-AGGGTTTGCTGATGAGTTGC-39, 59-CCCCTCCACTTCCATCTTC-39; PCSK1: 59-TGGAGTTGCATATAATTCCAAAGTT-39, 59-AGCCTCAATGGCATCAGTTAC-39; Adcyap1 59-GAGAATCTGGGGGCAAGTCT-39, 59-CACCAGCACCTGATCTGTCA-39; Penk 59-CCCAGGCGACATCAATTT-39, 59-TCTCCCAGATTTTGAAAGAAGG-39.Western blot analysis. Myc-tagged cDNA encoding NPAS4, BDNF, Pcsk1, Adcyap1or PENK1 was transfected into 293T cells using Lipofectamine. Twenty-four hourslater cells were lysed in 23 Laemmli buffer and boiled for 5 min. Lysates wereresolved by SDS–PAGE and immunoblotted with antibodies targeting Myc(1:1,000, Abcam) or actin (1:2,500, Abcam).Statistics. All data are shown as the mean 6 s.e.m. unless otherwise noted. Datafor which a specific P value is not indicated are not significant (P . 0.05).
For electrophysiology experiments, significance was determined by paired two-tailed t-test for direct comparisons of neighbouring neurons, two-tailed t-test forcomparisons between populations, one-way ANOVA (Dunnett’s test) for PPRs,and Wilcoxon for mIPSCs in the screen of putative NPAS4 target genes. All datasets were acquired from at least 3 animals, 2 slices from each animal.
For imaging experiments, significance was determined by ANOVA or two-tailed t-test. All data sets were acquired from at least 3 animals, 3–5 images peranimal.
For qRT–PCR experiments, significance was determined by two tailed t-test.
LETTER RESEARCH
Macmillan Publishers Limited. All rights reserved©2013
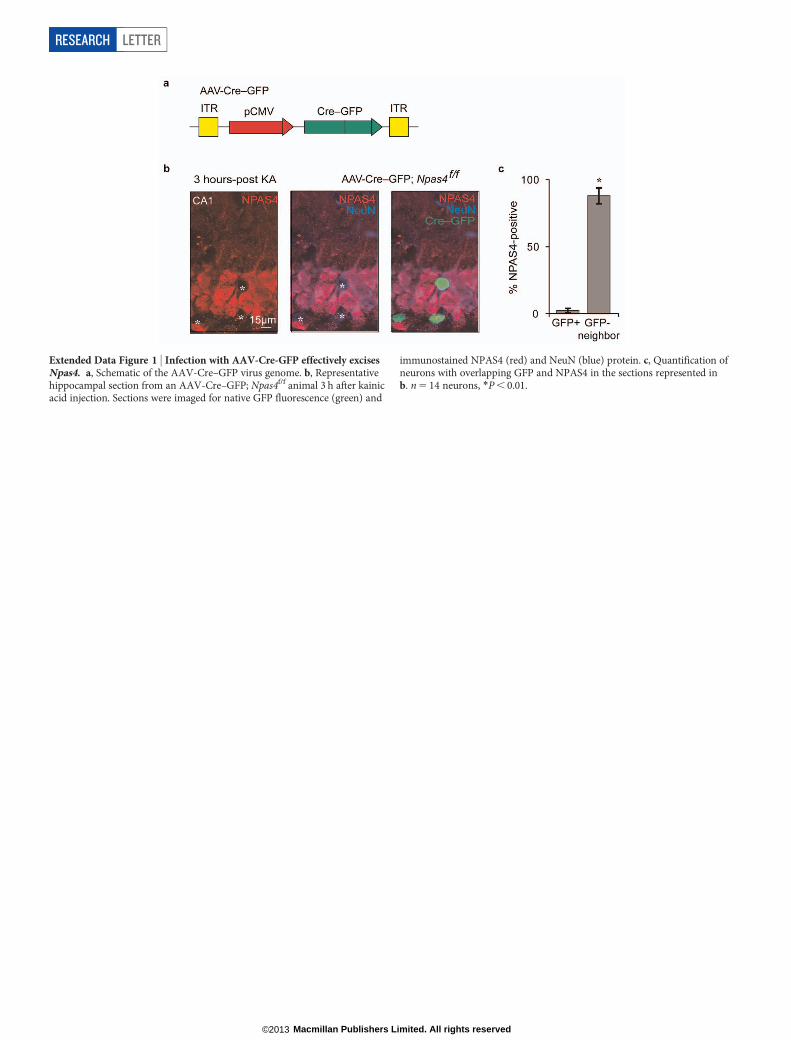
Extended Data Figure 1 | Infection with AAV-Cre-GFP effectively excisesNpas4. a, Schematic of the AAV-Cre–GFP virus genome. b, Representativehippocampal section from an AAV-Cre–GFP; Npas4f/f animal 3 h after kainicacid injection. Sections were imaged for native GFP fluorescence (green) and
immunostained NPAS4 (red) and NeuN (blue) protein. c, Quantification ofneurons with overlapping GFP and NPAS4 in the sections represented inb. n 5 14 neurons, *P , 0.01.
RESEARCH LETTER
Macmillan Publishers Limited. All rights reserved©2013
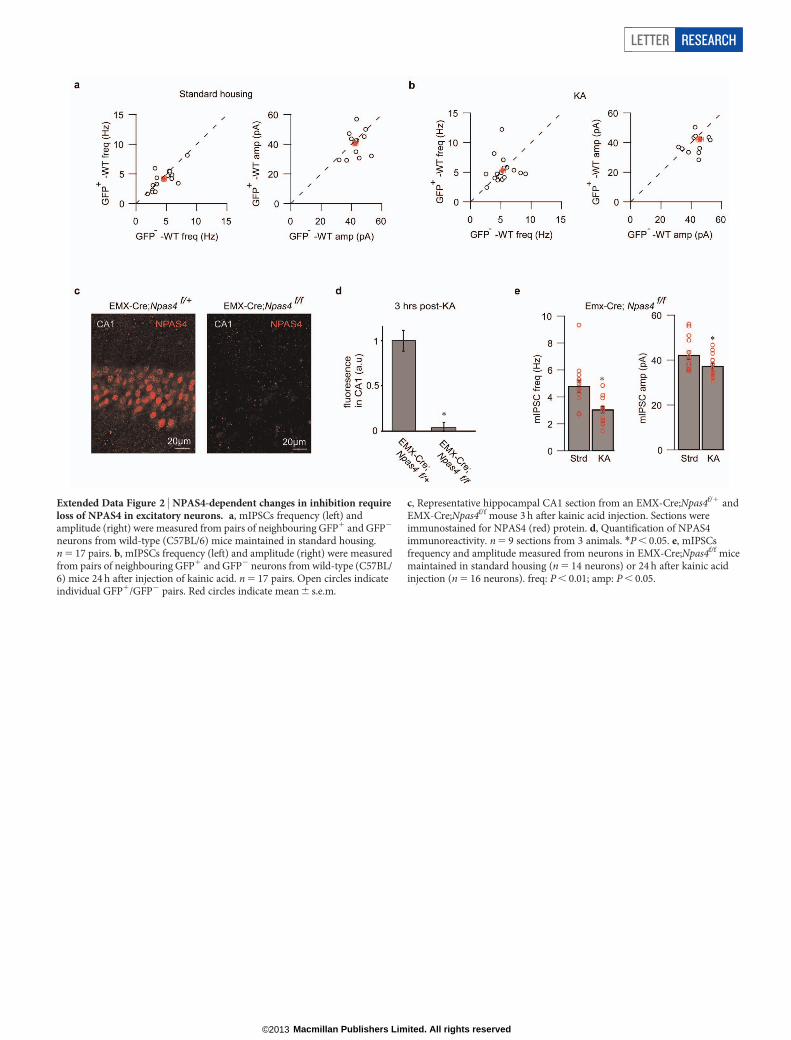
Extended Data Figure 2 | NPAS4-dependent changes in inhibition requireloss of NPAS4 in excitatory neurons. a, mIPSCs frequency (left) andamplitude (right) were measured from pairs of neighbouring GFP1 and GFP2
neurons from wild-type (C57BL/6) mice maintained in standard housing.n 5 17 pairs. b, mIPSCs frequency (left) and amplitude (right) were measuredfrom pairs of neighbouring GFP1 and GFP2 neurons from wild-type (C57BL/6) mice 24 h after injection of kainic acid. n 5 17 pairs. Open circles indicateindividual GFP1/GFP2 pairs. Red circles indicate mean 6 s.e.m.
c, Representative hippocampal CA1 section from an EMX-Cre;Npas4f/1 andEMX-Cre;Npas4f/f mouse 3 h after kainic acid injection. Sections wereimmunostained for NPAS4 (red) protein. d, Quantification of NPAS4immunoreactivity. n 5 9 sections from 3 animals. *P , 0.05. e, mIPSCsfrequency and amplitude measured from neurons in EMX-Cre;Npas4f/f micemaintained in standard housing (n 5 14 neurons) or 24 h after kainic acidinjection (n 5 16 neurons). freq: P , 0.01; amp: P , 0.05.
LETTER RESEARCH
Macmillan Publishers Limited. All rights reserved©2013
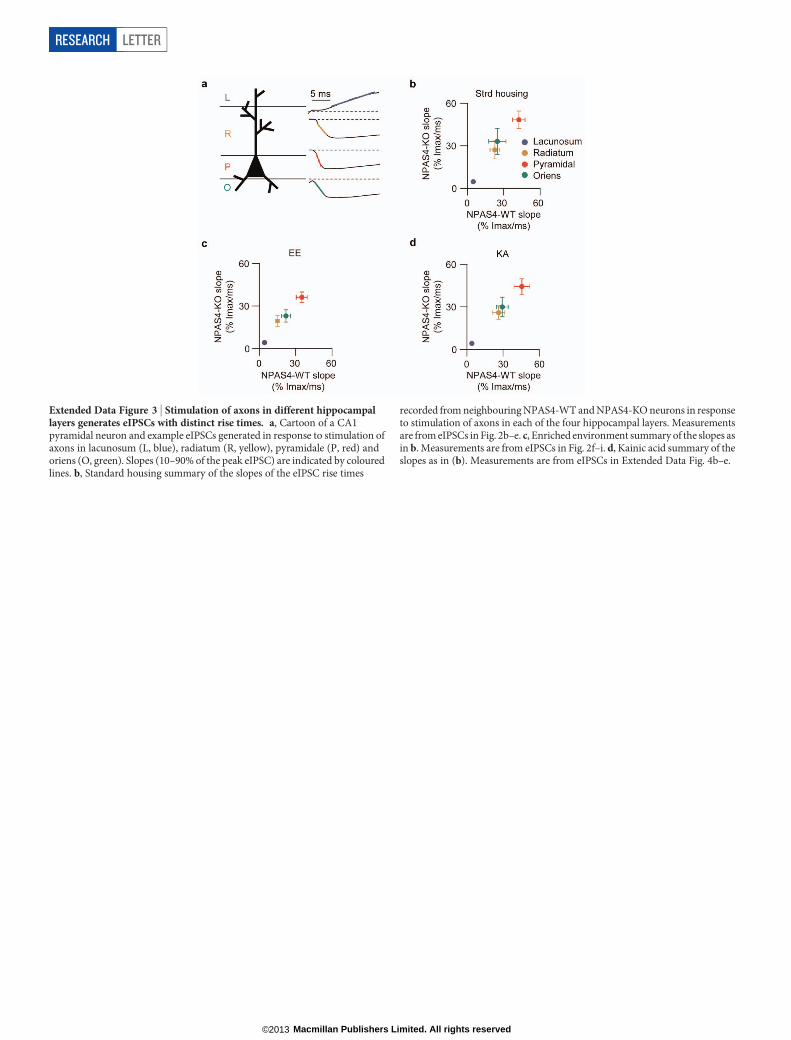
Extended Data Figure 3 | Stimulation of axons in different hippocampallayers generates eIPSCs with distinct rise times. a, Cartoon of a CA1pyramidal neuron and example eIPSCs generated in response to stimulation ofaxons in lacunosum (L, blue), radiatum (R, yellow), pyramidale (P, red) andoriens (O, green). Slopes (10–90% of the peak eIPSC) are indicated by colouredlines. b, Standard housing summary of the slopes of the eIPSC rise times
recorded from neighbouring NPAS4-WT and NPAS4-KO neurons in responseto stimulation of axons in each of the four hippocampal layers. Measurementsare from eIPSCs in Fig. 2b–e. c, Enriched environment summary of the slopes asin b. Measurements are from eIPSCs in Fig. 2f–i. d, Kainic acid summary of theslopes as in (b). Measurements are from eIPSCs in Extended Data Fig. 4b–e.
RESEARCH LETTER
Macmillan Publishers Limited. All rights reserved©2013
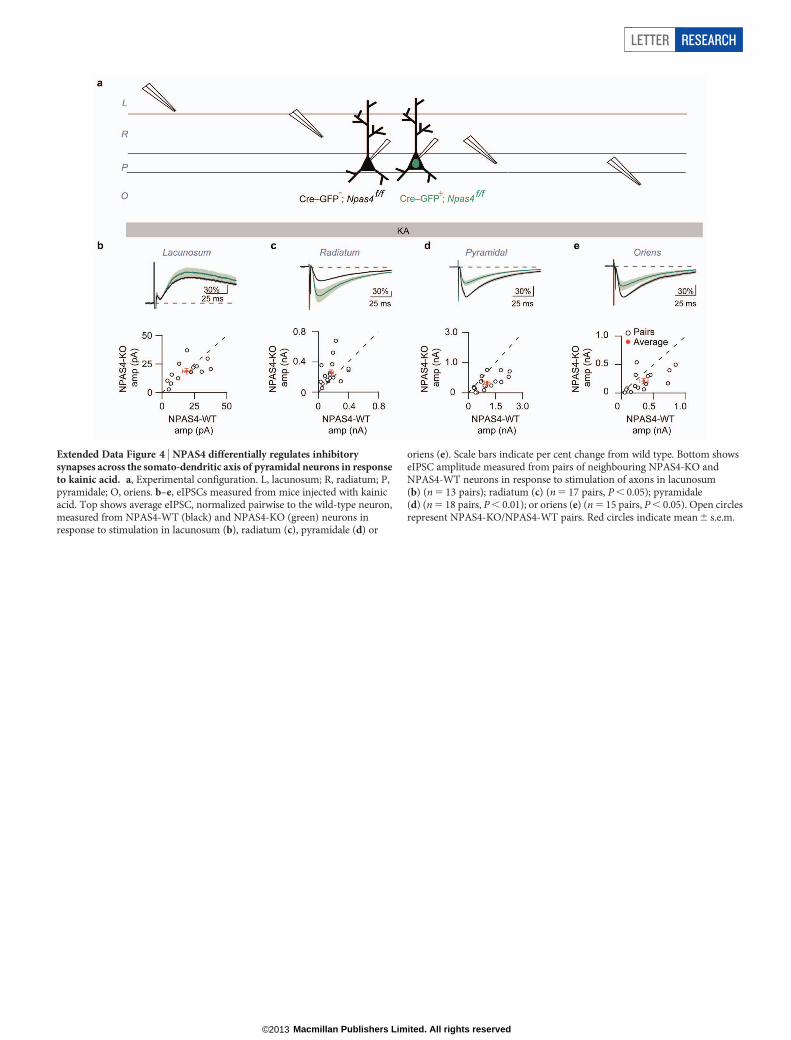
Extended Data Figure 4 | NPAS4 differentially regulates inhibitorysynapses across the somato-dendritic axis of pyramidal neurons in responseto kainic acid. a, Experimental configuration. L, lacunosum; R, radiatum; P,pyramidale; O, oriens. b–e, eIPSCs measured from mice injected with kainicacid. Top shows average eIPSC, normalized pairwise to the wild-type neuron,measured from NPAS4-WT (black) and NPAS4-KO (green) neurons inresponse to stimulation in lacunosum (b), radiatum (c), pyramidale (d) or
oriens (e). Scale bars indicate per cent change from wild type. Bottom showseIPSC amplitude measured from pairs of neighbouring NPAS4-KO andNPAS4-WT neurons in response to stimulation of axons in lacunosum(b) (n 5 13 pairs); radiatum (c) (n 5 17 pairs, P , 0.05); pyramidale(d) (n 5 18 pairs, P , 0.01); or oriens (e) (n 5 15 pairs, P , 0.05). Open circlesrepresent NPAS4-KO/NPAS4-WT pairs. Red circles indicate mean 6 s.e.m.
LETTER RESEARCH
Macmillan Publishers Limited. All rights reserved©2013
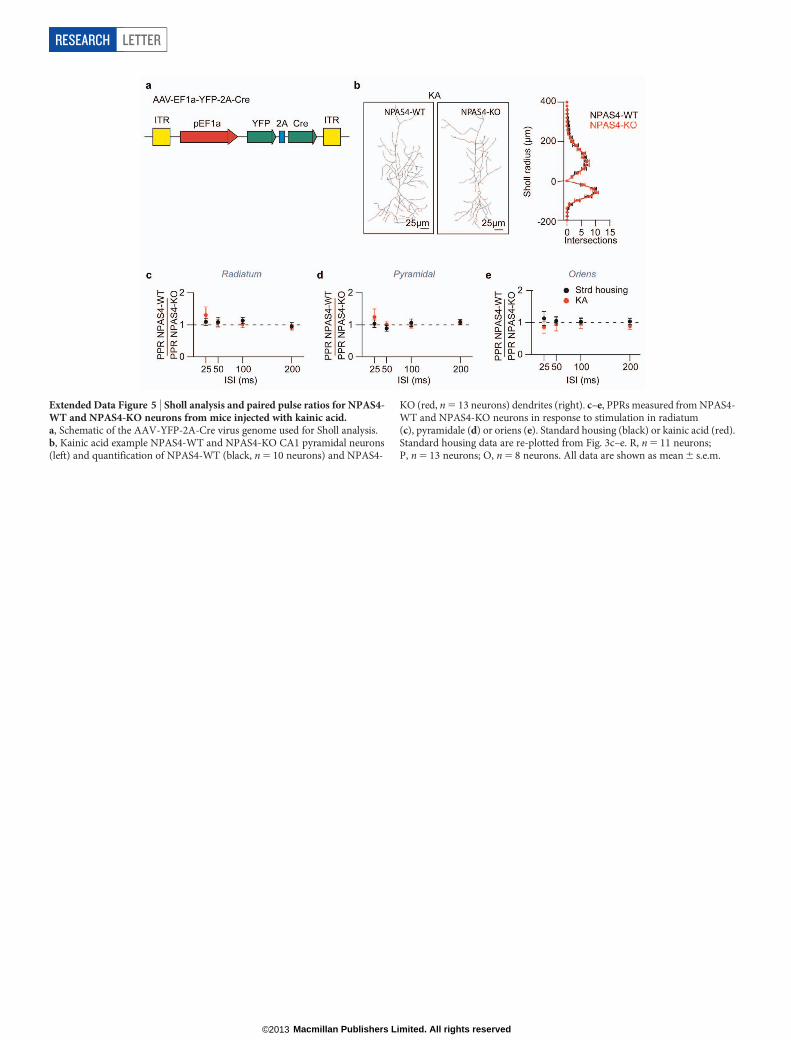
Extended Data Figure 5 | Sholl analysis and paired pulse ratios for NPAS4-WT and NPAS4-KO neurons from mice injected with kainic acid.a, Schematic of the AAV-YFP-2A-Cre virus genome used for Sholl analysis.b, Kainic acid example NPAS4-WT and NPAS4-KO CA1 pyramidal neurons(left) and quantification of NPAS4-WT (black, n 5 10 neurons) and NPAS4-
KO (red, n 5 13 neurons) dendrites (right). c–e, PPRs measured from NPAS4-WT and NPAS4-KO neurons in response to stimulation in radiatum(c), pyramidale (d) or oriens (e). Standard housing (black) or kainic acid (red).Standard housing data are re-plotted from Fig. 3c–e. R, n 5 11 neurons;P, n 5 13 neurons; O, n 5 8 neurons. All data are shown as mean 6 s.e.m.
RESEARCH LETTER
Macmillan Publishers Limited. All rights reserved©2013
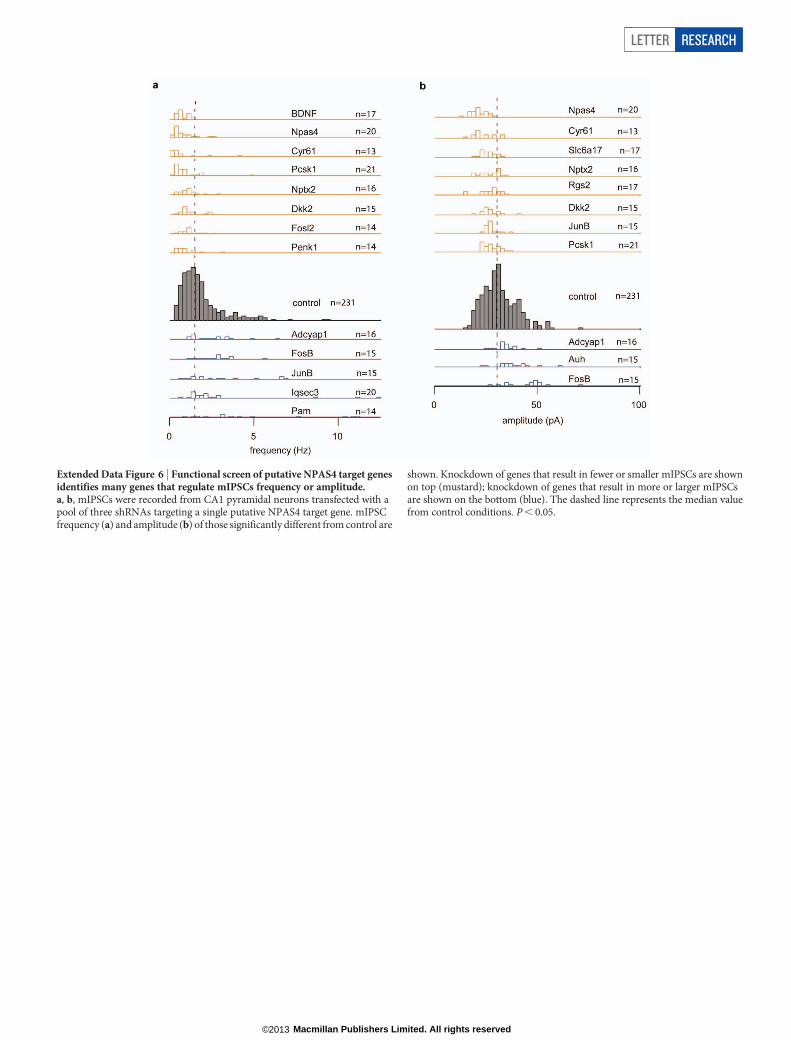
Extended Data Figure 6 | Functional screen of putative NPAS4 target genesidentifies many genes that regulate mIPSCs frequency or amplitude.a, b, mIPSCs were recorded from CA1 pyramidal neurons transfected with apool of three shRNAs targeting a single putative NPAS4 target gene. mIPSCfrequency (a) and amplitude (b) of those significantly different from control are
shown. Knockdown of genes that result in fewer or smaller mIPSCs are shownon top (mustard); knockdown of genes that result in more or larger mIPSCsare shown on the bottom (blue). The dashed line represents the median valuefrom control conditions. P , 0.05.
LETTER RESEARCH
Macmillan Publishers Limited. All rights reserved©2013
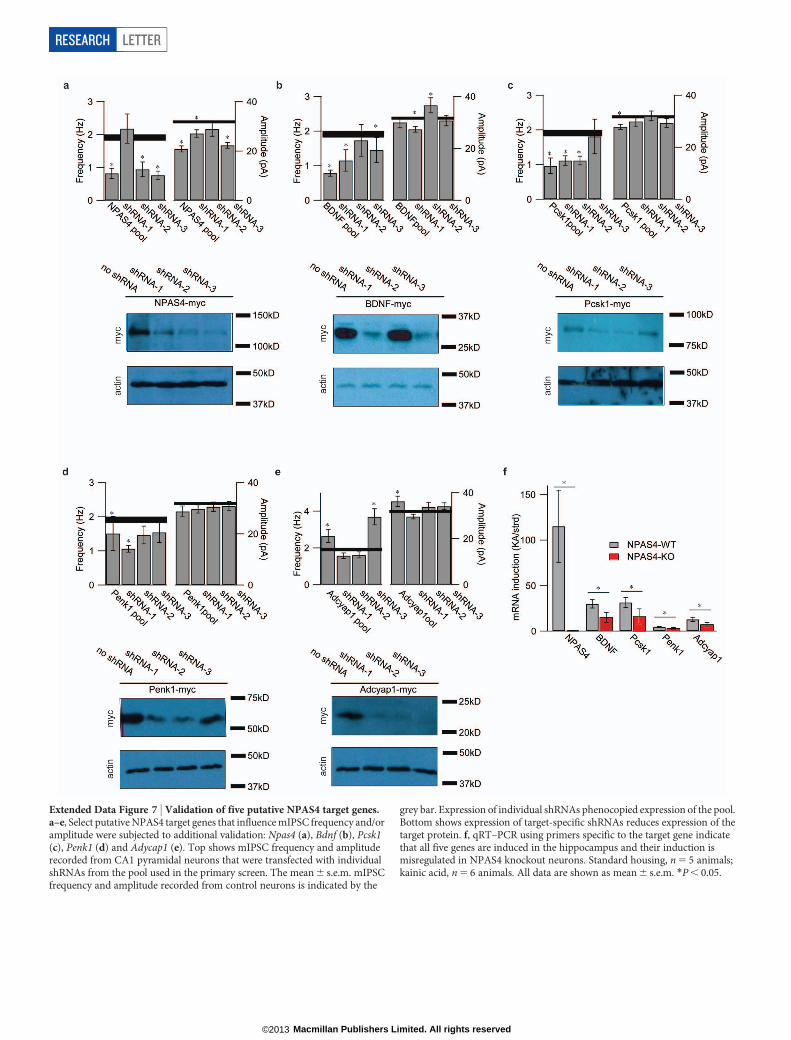
Extended Data Figure 7 | Validation of five putative NPAS4 target genes.a–e, Select putative NPAS4 target genes that influence mIPSC frequency and/oramplitude were subjected to additional validation: Npas4 (a), Bdnf (b), Pcsk1(c), Penk1 (d) and Adycap1 (e). Top shows mIPSC frequency and amplituderecorded from CA1 pyramidal neurons that were transfected with individualshRNAs from the pool used in the primary screen. The mean 6 s.e.m. mIPSCfrequency and amplitude recorded from control neurons is indicated by the
grey bar. Expression of individual shRNAs phenocopied expression of the pool.Bottom shows expression of target-specific shRNAs reduces expression of thetarget protein. f, qRT–PCR using primers specific to the target gene indicatethat all five genes are induced in the hippocampus and their induction ismisregulated in NPAS4 knockout neurons. Standard housing, n 5 5 animals;kainic acid, n 5 6 animals. All data are shown as mean 6 s.e.m. *P , 0.05.
RESEARCH LETTER
Macmillan Publishers Limited. All rights reserved©2013
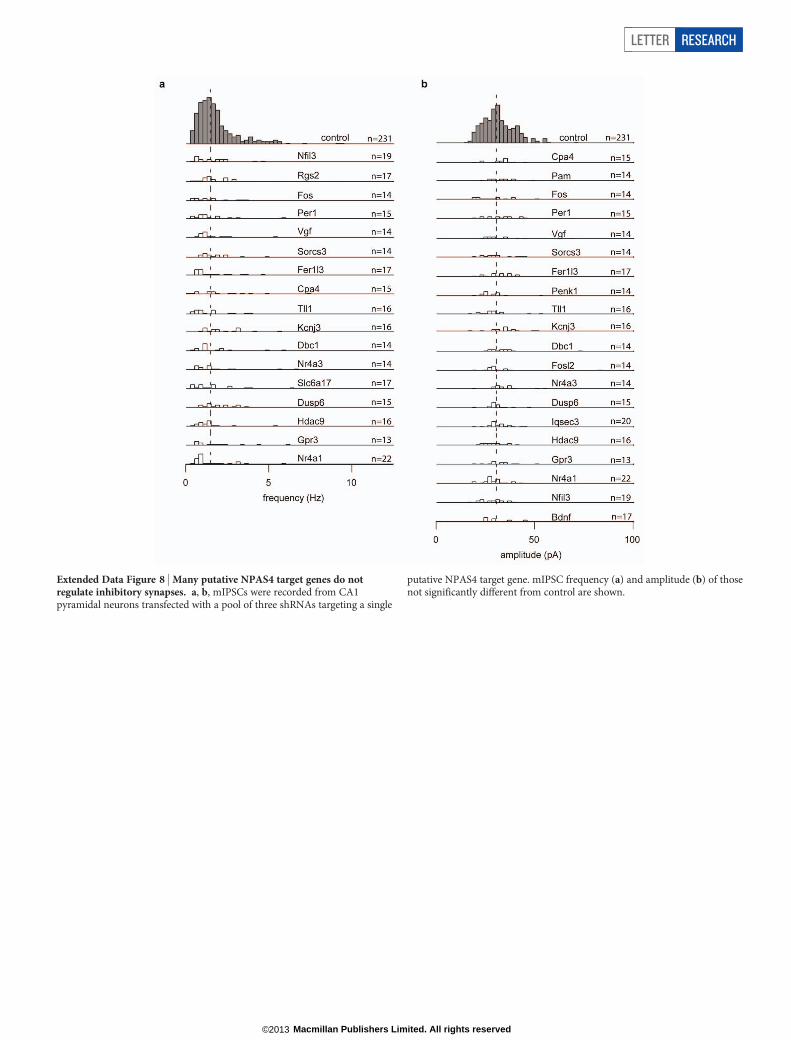
Extended Data Figure 8 | Many putative NPAS4 target genes do notregulate inhibitory synapses. a, b, mIPSCs were recorded from CA1pyramidal neurons transfected with a pool of three shRNAs targeting a single
putative NPAS4 target gene. mIPSC frequency (a) and amplitude (b) of thosenot significantly different from control are shown.
LETTER RESEARCH
Macmillan Publishers Limited. All rights reserved©2013
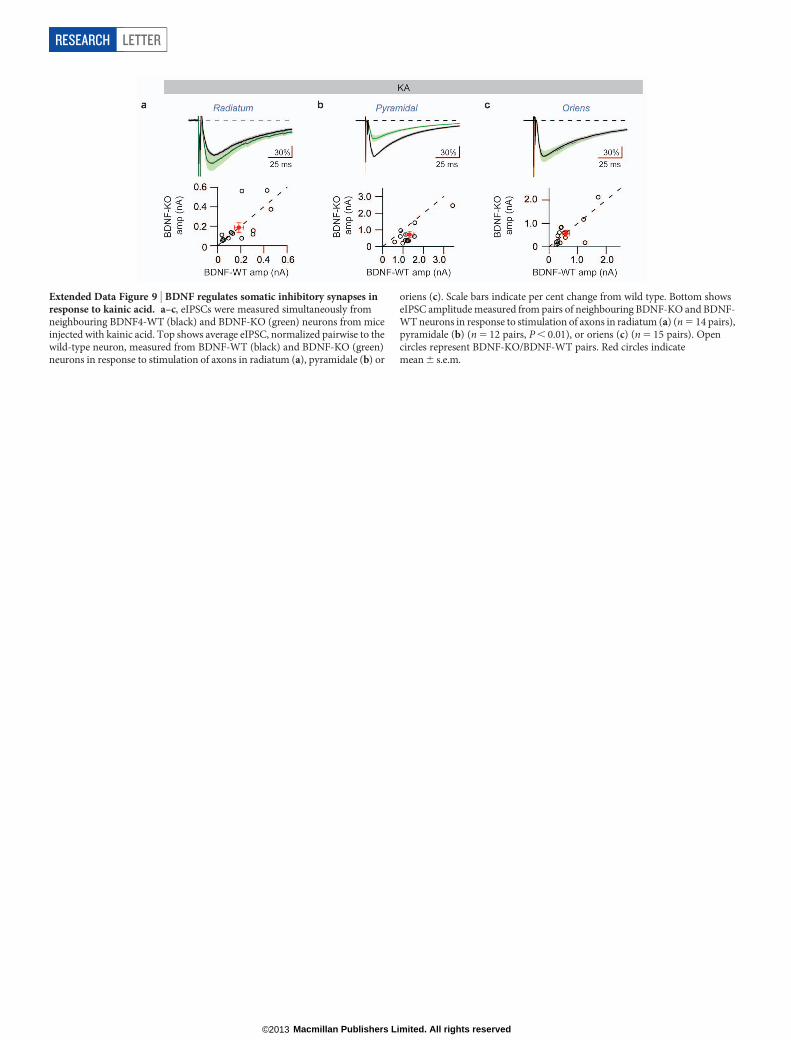
Extended Data Figure 9 | BDNF regulates somatic inhibitory synapses inresponse to kainic acid. a–c, eIPSCs were measured simultaneously fromneighbouring BDNF4-WT (black) and BDNF-KO (green) neurons from miceinjected with kainic acid. Top shows average eIPSC, normalized pairwise to thewild-type neuron, measured from BDNF-WT (black) and BDNF-KO (green)neurons in response to stimulation of axons in radiatum (a), pyramidale (b) or
oriens (c). Scale bars indicate per cent change from wild type. Bottom showseIPSC amplitude measured from pairs of neighbouring BDNF-KO and BDNF-WT neurons in response to stimulation of axons in radiatum (a) (n 5 14 pairs),pyramidale (b) (n 5 12 pairs, P , 0.01), or oriens (c) (n 5 15 pairs). Opencircles represent BDNF-KO/BDNF-WT pairs. Red circles indicatemean 6 s.e.m.
RESEARCH LETTER
Macmillan Publishers Limited. All rights reserved©2013
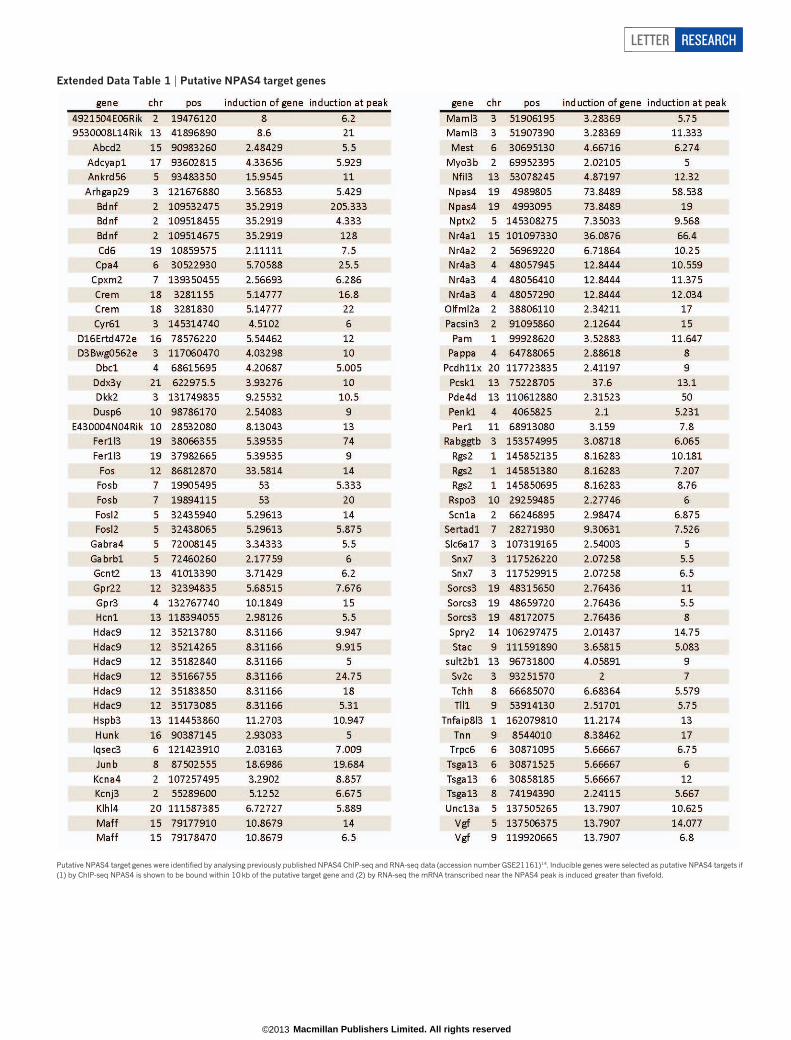
Extended Data Table 1 | Putative NPAS4 target genes
Putative NPAS4 target genes were identified by analysing previously published NPAS4 ChIP-seq and RNA-seq data (accession number GSE21161)14. Inducible genes were selected as putative NPAS4 targets if(1) by ChIP-seq NPAS4 is shown to be bound within 10 kb of the putative target gene and (2) by RNA-seq the mRNA transcribed near the NPAS4 peak is induced greater than fivefold.
LETTER RESEARCH
Macmillan Publishers Limited. All rights reserved©2013