mean value first order second moment analysis of buckling of
TRANSCRIPT

MultiCraft
International Journal of Engineering, Science and Technology
Vol. 2, No. 4, 2010, pp. 150-162
INTERNATIONAL JOURNAL OF
ENGINEERING, SCIENCE AND TECHNOLOGY
www.ijest-ng.com
© 2010 MultiCraft Limited. All rights reserved
Mean value first order second moment analysis of buckling of axially loaded thin plates with random geometrical imperfections
A.V. Raviprakash 1*, B. Prabu 2 and N. Alagumurthi 3
1,2 Associate Professor, Dept. of Mechanical Engineering, Pondicherry Engineering College, Puducherry – 605014, INDIA
3 Professor, Dept. of Mechanical Engineering, Pondicherry Engineering College, Puducherry – 605014, INDIA *Corresponding Author: e-mail:[email protected] / [email protected]
Abstract Buckling strength of thin plate structures under axial compression is more dominantly affected by the initial geometric imperfections than the other types of imperfections present in them. Since these initial geometric imperfections are random in nature, the collapse strength distribution will also be random. Hence a probabilistic approach is required for reliable design of these thin plate structures. In this paper, by keeping the variance of imperfections of all the models at assumed manufacturing tolerance of 1.71 mm and maintaining the maximum amplitude of imperfections within ±8 mm, 1024 random geometrical imperfect plate models are generated by the linear combination of first 10 eigen affine mode shapes using 2k factorial design. These imperfect models are analysed using ANSYS non-linear FE buckling analysis including both geometrical and material non-linearities. From these FE analysis results, the strength distribution of the plate is obtained and reliability analysis is carried out using Mean Value First Order Second Moment (MVFOSM) method. Keywords: Buckling strength, Thin plates, Geometrical imperfections, Random modeling, Reliability based design, MVFOSM. 1. Introduction Thin plate structures are widely used in many fields like mechanical, marine, aerospace and in civil engineering structures. The manufacturing process involved in making perfect thin plate is difficult, because there will be some geometrical imperfections like local indentations, swelling, non-uniform thickness etc., and material imperfections like inhomogeneties, cracks, vacancies, impurities etc., and also other imperfections like residual stresses and strains induced during manufacturing. These imperfections generally affect the buckling behavior of plates and to study this, complete information about the imperfections are required. Out of all these imperfections, geometrical imperfections are more dominant in determining the load carrying capacity of thin shell structures. Reliable prediction of buckling strength of these structures are important, because buckling failure is catastrophic in nature and also geometrical imperfections present in these structures are highly random in nature which require probabilistic approach to determine the safe load for the structure. The structural reliability analysis is classified into 3 groups (Ranganathan, 2000) namely level1, level2 and level3 methods. Since the buckling strength of thin plates are widely scattered and has large deviation from the theoretical value, it will be appropriate to use level2 method. In this paper the level2 First Order Second Moment (FOSM) method is adopted to determine the safe critical load of the structure. 2. Literature Review The modeling of imperfections can be classified into deterministic and random geometrical imperfection modeling. In case of the deterministic approach, imperfections are either obtained from actual measurement (for example Arbocz and Hol, 1991; Scheneider, 1996; Singer, 1999; Athiannan and Palaninathan, 2004 and Sadovsky et al, 2005 & 2006) or from assumed

Raviprakash et al./ International Journal of Engineering, Science and Technology, Vol. 2, No. 4, 2010, pp. 150-162
151
imperfection pattern. The assumed imperfection pattern may be sinusoidal pattern (Pircher et al, 2001 & Khamlichi et al, 2004; Ikeda et al, 2007) or first eigen mode shape pattern (Teng and Song, 2001; Kim and Kim, 2002; Khelil, 2002; Featherston, 2003; and Visweswaran et al, 2006). There are two ways by which random modeling of imperfections can be achieved. The first method is by varying the nodal locations of the structural model randomly and the second method is the stochastic FE approach. Each manufacturing process has its own characteristic imperfection shapes that can be represented by double Fourier series. In the earlier studies, these Fourier coefficients were made as random variables to get different random geometrical imperfection models (for example Athiannan and Palaninathan, 2004; Chrysanthopoulos, 1998). Elishakoff (1979) gave a reliability method based on Monte Carlo simulation technique and applied to the problem of buckling of finite column with initial geometrical imperfections, which is assumed as Gaussian random fields. Elishaoff et al (1987) explained about the MVFOSM to predict the reliability of cylindrical shell possessing axisymmetric and asymmetric random geometrical imperfections using the second order statistical properties obtained from measured initial geometric imperfections. Results of reliability calculations were verified with results from Monte Carlo simulation. Chryssanthopoulos et al (1991) presented Response Surface Methodology (RSM) to determine the reliability of stiffened cylindrical and plate shells subjected to axial compression, considering the manufacturing variabilities such as initial geometrical imperfections and welding residual stresses. The paper by Guedes Soares and Kmiecik (1993) addresses the collapse strength of rectangular steel plates under uniaxial compressive stress. A set of typical patterns of initial distortions were simulated so as to represent a random sample of typical distortions in ship plating. The strength of the set of initially distorted plates was calculated using a non-linear finite element code. The variability of the resulting ultimate plate strength was observed to depend on plate slenderness and simulation results obtained were compared with previous results.
Náprstek (1991) explained about stochastic finite element methodology taking large displacement as source of nonlinearities and studied about the response of the structures with random imperfection of Gaussian type. Sadovsky and Bulaz (1996) discussed about FORM – based inverse reliability method. One of the conclusions was that realistic treatment of effects of imperfections on strength of the structure will lead to marginally conservative design which in turn relaxes the fabrication tolerances when adopting such a probabilistic approach. This idea was adopted to determine the reliability for unstiffened thin plates and girders of double symmetric I- cross section in compression and bending. Warren (1997) generated random geometrical imperfections by linear combinations of eigen buckling affine mode shapes using 2k factorial design of Design of Experiments (DoE) and the variance of the models were maintained within the tolerance of manufacturing and adopted RSM to determine reliability of framed structures. Featherston (2001) discussed about the imperfection sensitivity of flat plates under combined compression and shear loading. It was concluded that an increase in the amplitude of imperfections reduce both the pre buckling stiffness and the collapse load of the plate. Further, it was stated that modification of shape of imperfections also changes the pre buckling stiffness and the collapse load. Bielewicz and Gorski (2002) developed a simulation method to generate random geometrical imperfections using non-homogeneous two dimensional random fields on regular nets. Schenk and Schueller (2003) in their work, using imperfection databank at Delft University of Technology, generated geometrical imperfection models utilizing Karhunen-Loéve expansion method. From the deterministic analysis of random models, buckling strength distribution was obtained and from which the reliability of the structure was determined using Monte Carlo Technique. Papadopoulos and Papadrakakis (2004) developed a nonlinear triangular composites element to carry out structural stability analysis of thin shell structures with random geometrical initial imperfections, which can be described as a two-dimensional uni-variate (2D-1V) homogeneous stochastic field. In the work of Sadovsky et al (2005 & 2006), the strength of rectangular/square simply supported plates of different aspect ratios and slenderness ratios subjected to longitudinal in-plane compression was obtained by finite element code assuming elasto-plastic material properties and large deflection capabilities. Initial deflections were taken from the database given in the reference Kmiecik et al (1995). Also effect of the shapes of buckling modes, compound and localized modes, on collapse load was studied. One of the important conclusions was that single buckling mode shape does not yield the lowest capacity on the studied interval of imperfections. Visweswaran et al (2006) studied about the effect of imperfection sensitivity on the collapse load of thin plates under axial compression taking eigen mode shapes as imperfection pattern. One of the major conclusions was that the collapse load of the imperfect plate is more than two times the buckling load of the perfect plate. Ikeda et al (2007) studied about the imperfection sensitivity of the ultimate buckling strength of elastic-plastic square plates under compression. Finite displacement elastic-plastic analysis was conducted on the simply supported square plates under compression by varying the plate thickness and initial deflection as sinusoidal form. From the numerical results, extended power law was proposed to describe the ultimate buckling strength of the elasic-plastic square plates. Craig and Roux (2007) also used the Karhunen–Lo`eve expansion as a method to incorporate random geometrical imperfections into the FE buckling analysis and verified the numerical results with other numerical results and experimental results. In the work of Sadovsky et al (2007), reliability calculations were calculated based on the lower strength and strength values calculated for measured initial imperfections. The resistance to failure was identified as a function of two random variables, one is integral energy measure and the other one is shape factor that describes the effects of uncertainty of imperfection shapes on the plate surface. This approach was explained on a rectangular plate under longitudinal compression considering the influence of random field of imperfections on plate strength, and this approach may lead to significantly less conservative design. In the work of Papadopoulos et al (2009), the effect of material and thickness spatial variation on the buckling load of isotropic shells with random initial geometric imperfections was investigated. The main novelty of this work is that a non-Gaussian assumption is

Raviprakash et al./ International Journal of Engineering, Science and Technology, Vol. 2, No. 4, 2010, pp. 150-162
152
made for the distribution of the modulus of elasticity and the shell thickness which were described by 2D-1V homogeneous non-Gaussian stochastic fields. The initial geometric imperfections were described as a 2D-1V Gaussian non-homogeneous stochastic field with properties derived from corresponding experimental measurements. From this study, it was shown that the choice of the probability distribution for the description of the material and thickness variability is crucial since it affects significantly the buckling load of imperfection sensitive shell-type structures. In the present work, random geometrical imperfections are generated using first 10 eigen affine mode shapes of perfect plate taken for study as suggested by Arbocz and Hol (1991), Chryssanthopoulos and Poggi (1995) and combine linearly according to linear multimode combinations following 2k factorial design of Design of Experiments (DoE) and the variance of the models were maintained within the tolerance of manufacturing as suggested by Warren (1997). From the deterministic FE analysis, strength distribution is obtained and using which the reliability of structure is determined using MVFOSM method
3. FE Modeling An eight noded quadrilateral shell element, SHELL93 of ANSYS is used for modeling the thin plates. This element can handle membrane, bending and transverse shear effect besides forming curvilinear surface satisfactorily. This element also has plasticity, stress stiffening, large deflection and large strain capabilities. 3.1. Thin Plate Shell Model Harada and Fujikubo (2002) considered rectangular plates with cutout having the shorter side length b of 800 mm and aspect ratio a/b of 1, 2, 3 and 4 for elastic buckling eigen value analysis. For elastoplastic large deflection analysis, they considered rectangular plates with circular cutout with a = 2000 mm, b = 1000 mm and thickness ranging from 8 to 30 mm. But in the present work, a square plate (without any cutout) is taken for the study, the dimension and material properties of the plate are as given below. Length (L) = 1m Young’s modulus (E) = 205.8 GPa Width (W) = 1m Yield stress (σy) = 313.6 Mpa Thickness (t) = 8 mm Mass density (ρ) = 7800 kg/m3 Poisson’s ratio (γ) = 0.3 Zero strain hardening effect is assumed. 3.2 Boundary Conditions Simply supported boundary conditions as shown in Figure 1, are applied on all the edges of the thin plate and uniform displacement loading is applied on one side of the plate model and corresponding opposite side is restrained from moving along load direction (Harada and Fujikubo 2002).
Figure 1. Geometry, boundary conditions, and loading conditions used in buckling analysis of a thin plate (not to scale)
3.3 Model validation and determination of eigen affine mode shapes The mesh convergence study is done to choose the optimum number of elements for the analysis and it is found that 40 elements along both directions gives accurate solution and hence same number of elements are used for all analysis. The analytical solution (Timoshenko and Gere, 1965) of the perfect thin plates is compared with the FE eigen buckling analysis result at different modes as shown in Table 1 and thus FE model validation is ensured.
3.4 Modeling of imperfect plates To achieve the aim of randomness, i.e., amplitude of imperfections at any nodal point of FE model (except the nodes at boundary edges of thin plate model should be random) and the first ten eigen affine mode shapes of linear buckling mode shapes of thin plate should be combined linearly using 2k factorial design of Design of Experiments (DoE).

Raviprakash et al./ International Journal of Engineering, Science and Technology, Vol. 2, No. 4, 2010, pp. 150-162
153
Table 1. Comparison of analytical solution with FE eigen buckling analysis result.
The modeling of the initial random geometrical imperfections is accomplished using the following assumptions/conditions.
Δ - imperfection amplitudes at all nodes except the nodes at the boundary edges should follow independent normal distribution
Mean value of imperfection amplitude of a node from all random models should be made equal to zero. Equal importance should be given for the all eigen affine mode shapes considered for random modeling. The random imperfection shapes generated should be linear combinations of the eigen affine mode shapes considered.
Based on the above assumptions, the nodal amplitude of imperfection vector for the entire structure (except the edge nodes, where the displacements are constrained) is given by
Δix1 = Φixj x Mjx1 (1)
where, ∆ - Nodal imperfection amplitude vector Φ - The matrix of eigen vectors containing the modal imperfection amplitudes at all nodal points of selected eigen affine mode shapes with equal maximum amplitude of imperfections M - Modal imperfection magnitude vector i - number of nodes j - number of eigen affine mode shapes If the nodal amplitudes of imperfections are known, the modal imperfection magnitudes can be obtained using the relation
Mjx1 = Φ*jxix Δix1 (2)
where, the matrix Φ* is the pseudo-inverse of the matrix Φ. The pseudo-inverse is calculated using the following equation based on method of least squares
Φ* = (ΦTΦ)-1 x ΦT (3)
If the nodal imperfections Δi are independent normally distributed random variables then the mean value and variance of each modal magnitude is given by
j μM j = ΣΦ*jiμΔi (4) 1
j σ2
m j = Σ(Φ*ji)2 σ2 Δi (5) 1 where, μΔi and σ2
∆ - mean and variance of the nodal imperfection amplitude respectively μM and σ2
M - mean and variance of the modal imperfection magnitude respectively. Similarly, mean and variance of each nodal amplitude is given by
Buckling Strength (N) Mode No
Number of transverse half lobes (m)
Number of longitudinal half
lobes (n) Analytical Solution FE Solution
% Error
1 1 1 380936 378115.3 0.7404 2 2 1 595213 591989.6 0.5415 3 3 1 1058160 1053573.8 0.4334 4 2 2 1523750 1510774.2 0.8515 5 4 1 1720170 1712254.2 0.4601 6 3 2 1788280 1773286.6 0.8384 7 4 2 2385590 2361591.1 1.0059 8 1 2 2385590 2367998.9 0.7373 9 5 1 2580260 2560567.4 0.7632
10 5 2 3210060 3176441.5 1.0472

Raviprakash et al./ International Journal of Engineering, Science and Technology, Vol. 2, No. 4, 2010, pp. 150-162
154
j μΔi = ΣΦji μM j (6) 1
j σ2
Δi = Σ(Φji)2 σ2m j (7)
1 Since it is required to have nodal amplitude ∆i of any node i of the structure to follow normal distribution with μΔ = 0 and as per Eqn. 4, μM also becomes zero. Hence, to get amplitude of imperfections of all nodes for each model, the modal magnitude of each model has to be obtained by using Eqn. 5. Using the modal magnitudes obtained from previous step the nodal amplitudes of imperfections can be obtained by using the Eqn. 1. Thus by varying the modal magnitudes of imperfections randomly using 2k factorial design matrix of Design of Experiments, random geometrical imperfection models can be generated. 3.5 Steps Followed in Random Geometrical Imperfections Modeling Step –I : Initially, substitute variance of modal imperfection magnitude vector as
⎥⎥⎥⎥⎥⎥⎥⎥
⎦
⎤
⎢⎢⎢⎢⎢⎢⎢⎢
⎣
⎡
=σ
111111
M
2 (8)
Step-II : Using Eqn.(7) the variance of nodal imperfection amplitude vector σ2Δ is determined.
Step –III : Each element of the resulting σ2Δ vector from Step-I is normalized with the maximum value of element in that vector
and multiplied σ2tol with value so as to limit the maximum amplitude of imperfections.
Step –IV : Using the σ2Δ vector obtained from the Step-III, new σ2
M vector is found using Eqn.5.
Step –V : Since, μΔ = 0, μM = 0, using σ2M new vector determine the modal imperfection magnitude vector M such that M= ±σM.
Step –VI : Using 2k factorial design, design matrix is generated and each column of design matrix is selected and is multiplied with corresponding element in the M vector obtained from previous step. This new design matrix is used to generate 2k (for k=10, 210 = 1024) random geometrical imperfection models.
i.e., Δ = Φ x new design matrix (9)
With the value of modal imperfection magnitude vector M, ∆ nodal imperfection vector is determined using the Eqn.1. But the ± value of the modal imperfection magnitude is decided by +1 or -1of design matrix obtained from DoE. The Δ matrix, thus formed has 1024 rows, and each row corresponds to nodal displacements of all nodes of one random imperfect plate model. By adopting the procedure explained above, 512 pairs of mirror image random imperfect plate models can be generated. Here, in the present work, 1024 random geometrical imperfect plate models are generated keeping RMS value of imperfections = 1.711 mm and the maximum amplitude of imperfection is maintained within ±8mm (Featherston, 2003). The maximum amplitude of imperfections in all 1024 models are shown in Figure.2
Figure 2. Scatter of maximum amplitude of imperfections from 1024 models

Raviprakash et al./ International Journal of Engineering, Science and Technology, Vol. 2, No. 4, 2010, pp. 150-162
155
From the Figure 2, it can be noted that maximum amplitude of imperfections from model number 1 to 512 are exactly mirrored between model numbers 1024 to 513. A sample of a pair of thin plate models with mirror image random imperfections are shown in Figure 3.
(a) Model No.1
(b)Model No.1024
Figure 3. A pair of mirror image random imperfections plate models (amplitude enlarged by 50 times) To verify the assumptions made that imperfection amplitude of a node except boundary nodes are randomly distributed, the distribution of out of plane displacements of a particular node from all 1024 random plate models is plotted as shown in Figure.4(a) & (b).
(a)Node No.1000
(b)Node No. 3000
Figure 4. Normal distribution of out of plane displacements of a particular node from all 1024 random plate models From the Figure.4, it can be seen that the out of plane displacement of nodal point distribution follows normal distribution with mean (μΔ) = 0. 4. Reliability Analysis For any structure, the strength and load are highly probabilistic and their distribution are non-Gaussian in nature (Papadopoulos et al 2009) and the normal distribution is a good approximation. Hence, assuming that the strength (S) and load (L) are normally distributed as shown in Figure 5, the failure function is defined as,
G = S – L (10)
Then, the distribution of failure function fG (g) is shown in Figure 6.
The probability of failure of the structure is,
Pf = P(G<0) (11)
The reliability of the structure is given as, R = 1 - Pf (12)

Figure 5. Load and Strength distribution
Figure 6. Normal distribution of failure function
In the First Order Second Moment (FOSM) method of determining the reliability of the structure, the mean and variance of the random variables (in this case, the strength and load) are considered. The first order approximation of failure function fG (g) is used for finding the mean and variance of the failure function. Thus, the mean and variance of the strength and load variables are required in order to carry out the reliability analysis. 5. Results and Discussion Using non-linear FE analysis, buckling strength of first 512 models is determined including both material and geometrical non-linearities. Determining the buckling strength of the next 512 models is nothing but inverting the first 512 models and obtaining the buckling strength. For reliability calculation buckling strength of 1024 models or first 512 models can be considered because it will not affect the reliability calculations. By considering 1024 models, only the frequency of buckling strength values occurrence will be doubled. But here for reliability calculation, buckling strength ratio (BSR) of first 512 models is considered. For calculation purpose, first eigen mode buckling strength of perfect plate (to be called as eigen strength of the perfect plate here onwards) is taken as reference. Buckling strength ratio (BSR) can be defined as ratio between ultimate collapse strength of imperfect plate to the eigen strength of perfect plate. Since thin plates are having positive post buckling behavior, its BSR values are greater than 1(Featherston, 2003). Figure 7 shows the stiffness curve obtained for model No.1. From this figure it can be seen that at limit load condition at which the plate structure fails, as the slope of the stiffness curve becomes zero. Figure 8 shows the von Mises stress contour obtained for model No.1 at limit load condition.
Figure 7. Stiffness curves of pair of mirror image random
imperfection of model No. 1
Figure 8. The von Mises stress contour of random imperfection of model No.1 at its limit load condition
Table 2 shows the BSR values obtained for few of the first 512 models and is shown as frequency graph in Figure 9. Usually the ultimate collapse strength of the imperfect plate will be more than 2 times the buckling strength of perfect plates as mentioned by Featherston (2001, 2003) and Visweswaran et al (2006). From the BSR values given in Table 2, here also it can be noted that the ultimate collapse strength of the imperfect plate is more than 2 times the eigen strength of the perfect plate. From the Figure 9, it can be seen that the distribution does not follow normal distribution exactly, but it is a skewed distribution.

Raviprakash et al./ International Journal of Engineering, Science and Technology, Vol. 2, No. 4, 2010, pp. 150-162
157
Table 2. BSR values obtained from select few of the first 512 FE thin plate models with random geometrical imperfections
Model No. BSR Model
No. BSR Model No. BSR Model
No. BSR Model No. BSR Model
No. BSR
1 2.2988 86 2.2792 171 2.4609 256 2.4421 341 2.3857 493 2.4782 2 2.3786 87 2.4527 172 2.5912 257 2.301 342 2.2807 494 2.4836 3 2.334 88 2.324 173 2.5613 258 2.3759 343 2.4619 495 2.4902 4 2.4262 89 2.3621 174 2.6014 259 2.3438 344 2.3279 496 2.5234 5 2.3581 90 2.358 175 2.5372 260 2.4356 345 2.374 497 2.5666 6 2.3621 91 2.4039 176 2.5982 261 2.3593 346 2.359 498 2.5045 7 2.3895 92 2.3896 177 2.4951 262 2.3741 347 2.4311 499 2.5774 8 2.4038 93 2.3786 178 2.4787 263 2.3935 348 2.3935 500 2.5104 9 2.2793 94 2.2987 179 2.5495 264 2.4311 349 2.3758 501 2.4992
10 2.3822 95 2.4262 180 2.4935 265 2.2808 350 2.301 502 2.4073 11 2.3241 96 2.334 181 2.4919 266 2.386 351 2.4356 503 2.5657 12 2.4525 97 2.2808 182 2.4193 267 2.3281 352 2.3437 504 2.433 13 2.346 98 2.386 183 2.5435 268 2.462 353 2.2793 505 2.4825 14 2.4305 99 2.3281 184 2.4436 269 2.349 354 2.3822 506 2.4527 15 2.3858 100 2.462 185 2.5683 270 2.443 355 2.3241 507 2.5442 16 2.4481 101 2.349 186 2.4848 271 2.3892 356 2.4525 508 2.4723 17 2.3689 102 2.4439 187 2.6058 272 2.4767 357 2.346 509 2.4629 18 2.3291 103 2.3892 188 2.5027 273 2.3876 358 2.432 510 2.3898 19 2.4352 104 2.4748 189 2.5099 274 2.3493 359 2.3858 511 2.5125 20 2.367 105 2.301 190 2.4012 275 2.4401 360 2.4429 512 2.4264
Table 3. Mean BSR values obtained for 100 samples with sample size of 200 each
Sample No.
Mean BSR
Sample No.
Mean BSR
Sample No.
Mean BSR
Sample No.
Mean BSR
Sample No.
Mean BSR
Sample No.
Mean BSR
1 2.5594 18 2.4825 35 2.4617 52 2.4289 69 2.4992 86 2.5126 2 2.4848 19 2.4359 36 2.4356 53 2.3848 70 2.4724 87 2.5442 3 2.4356 20 2.3692 37 2.4742 54 2.5073 71 2.4084 88 2.4932 4 2.4522 21 2.4117 38 2.3888 55 2.5983 72 2.4357 89 2.5234 5 2.3787 22 2.373 39 2.4084 56 2.4749 73 2.4357 90 2.2887 6 2.2988 23 2.5049 40 2.5737 57 2.4908 74 2.4311 91 2.3671 7 2.4056 24 2.3821 41 2.4995 58 2.4522 75 2.2887 92 2.444 8 2.5392 25 2.3473 42 2.347 59 2.4507 76 2.3281 93 2.5373 9 2.3935 26 2.5442 43 2.4752 60 2.2987 77 2.4763 94 2.4908
10 2.4788 27 2.4357 44 2.3265 61 2.3264 78 2.463 95 2.5683 11 2.349 28 2.4522 45 2.5373 62 2.3264 79 2.4303 96 2.4522 12 2.3698 29 2.3594 46 2.2887 63 2.349 80 2.4193 97 2.5373 13 2.2792 30 2.5104 47 2.3692 64 2.4191 81 2.373 98 2.3622 14 2.4012 31 2.4357 48 2.4919 65 2.3341 82 2.4992 99 2.5844 15 2.4943 32 2.3936 49 2.5373 66 2.4359 83 2.514 100 2.4359 16 2.4823 33 2.4056 50 2.4352 67 2.3877 84 2.5594 17 2.5772 34 2.3499 51 2.3291 68 2.5073 85 2.3858
Since the normal distribution shape is the simplest, best developed, most known and expedient (Verderaime, 1994), the skewed strength distribution is converted into an equivalent normal distribution using the method suggested by Verderaime (1994). According to this method, the mode of the strength distribution is taken as the mean of the equivalent normal distribution. The left side of the skewed distribution is alone considered for the equivalent normal distribution. To obtain the right side of the distribution, the left side distribution is mirrored about the mode. Thus, the equivalent normal distribution of strength is obtained and it is shown in Figure 10.
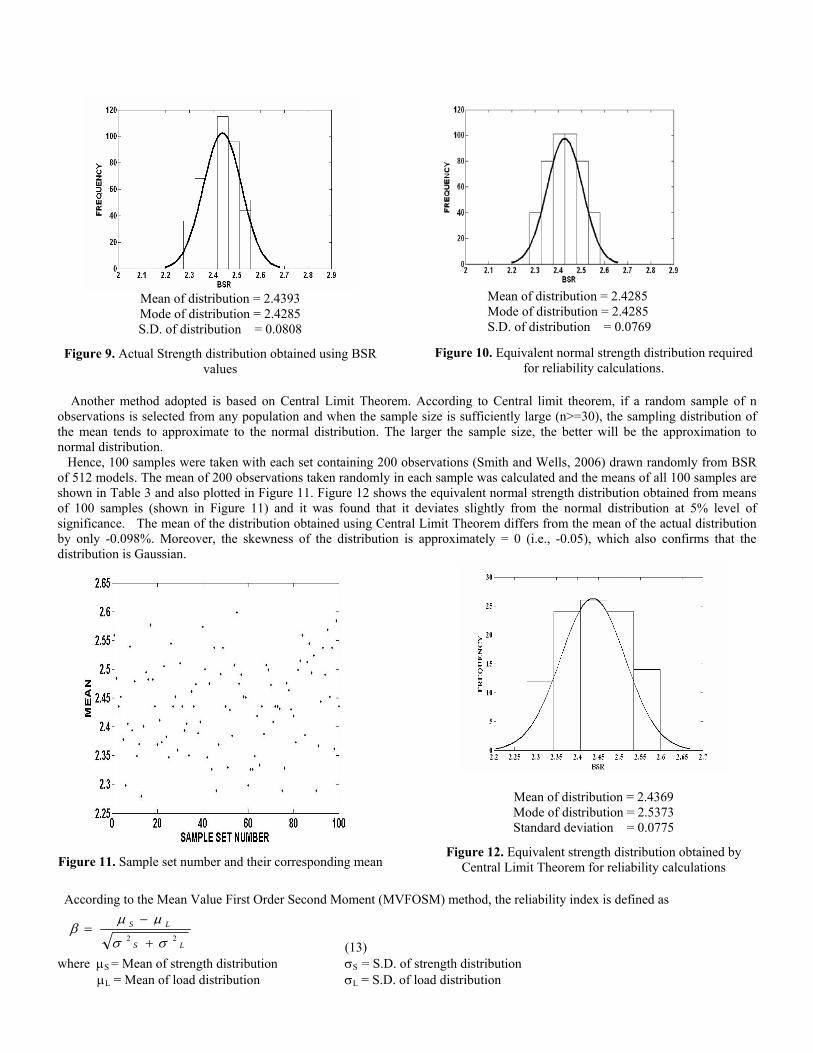
Mean of distribution = 2.4393 Mode of distribution = 2.4285 S.D. of distribution = 0.0808
Figure 9. Actual Strength distribution obtained using BSR values
Mean of distribution = 2.4285 Mode of distribution = 2.4285 S.D. of distribution = 0.0769 Figure 10. Equivalent normal strength distribution required
for reliability calculations. Another method adopted is based on Central Limit Theorem. According to Central limit theorem, if a random sample of n observations is selected from any population and when the sample size is sufficiently large (n>=30), the sampling distribution of the mean tends to approximate to the normal distribution. The larger the sample size, the better will be the approximation to normal distribution. Hence, 100 samples were taken with each set containing 200 observations (Smith and Wells, 2006) drawn randomly from BSR of 512 models. The mean of 200 observations taken randomly in each sample was calculated and the means of all 100 samples are shown in Table 3 and also plotted in Figure 11. Figure 12 shows the equivalent normal strength distribution obtained from means of 100 samples (shown in Figure 11) and it was found that it deviates slightly from the normal distribution at 5% level of significance. The mean of the distribution obtained using Central Limit Theorem differs from the mean of the actual distribution by only -0.098%. Moreover, the skewness of the distribution is approximately = 0 (i.e., -0.05), which also confirms that the distribution is Gaussian.
Figure 11. Sample set number and their corresponding mean
Mean of distribution = 2.4369 Mode of distribution = 2.5373 Standard deviation = 0.0775
Figure 12. Equivalent strength distribution obtained by Central Limit Theorem for reliability calculations
According to the Mean Value First Order Second Moment (MVFOSM) method, the reliability index is defined as
LS
LS
22 σσ
μμβ
+
−=
(13) where μS = Mean of strength distribution σS = S.D. of strength distribution μL = Mean of load distribution σL = S.D. of load distribution

Raviprakash et al./ International Journal of Engineering, Science and Technology, Vol. 2, No. 4, 2010, pp. 150-162
159
The probability of failure is given by,
Pf = ϕ (-β) (14)
where, ϕ = cumulative normal distribution function.
Then, reliability of the structure is given as,
R= 1 - Pf (15)
In this case, the load applied is assumed as a deterministic single value. Hence, σL = 0 and now β is defined as,
β = (μS – Load applied in terms of BSR) / σS (16)
By varying the load applied, the reliability of the structure at each load is obtained. The failure probabilities at different loads are shown in Figure 13.
(a) Load applied is 2.592 times the eigen strength of the perfect plate
(b) Load applied is 2.532 times the eigen strength of the perfect plate
(c) Load applied is 2.412 times the eigen strength of the perfect plate
(d) Load applied is 2.25 times the eigen strength of the perfect plate
Figure 13. Failure probability at different loads
The variation of reliability found using MVFOSM method with respect to the applied load (BSR) is shown in Figure 14 & 15. From the reliability curves, it can be noted that for the plate taken for study, upto 2.1 times of eigen strength of the perfect plate, the reliability is 100%, when the load applied is more than 2.65 times the eigen strength of the perfect plate, the reliability is zero.

Figure 14. Reliability Vs BSR (Verederaime, 1994)
Figure 15. Reliability Vs BSR (Smith and Wells, 2006) Table 4 shows the comparison of the reliability values obtained from the method adopted by Verderaime (method-I) and Smith and Wells (method-II). From the table, it was found that both the methods gave approximately same values.
Table 4. Comparison of reliability obtained using two methods
5. Conclusions The following conclusions are derived from the analysis carried out for the thin plate structure taken for study.
1. The slope of stiffness curve decreases gradually as the load applied increases and becomes zero at limit load condition and thereby imperfect thin plate shell structures collapse.
2. To increase reliable prediction of safe load of the structure further, more number of eigen affine mode shapes can be considered.
3. Ultimate crushing strength of the imperfect thin plate is more than two times the eigen strength of the perfect plate. 4. Using the adopted MVFOSM method of reliability, it is found that the reliability of thin plate taken for study under
axial compression is 100% upto 2.1 times the eigen strength of the perfect plate and the reliability becomes zero when the load applied is more than 2.65 times the eigen strength of the perfect plate.
5. The methods adopted by Verderaime and Smith and Wells for relaibilty calculations are in good agreement with each other and hence recommended for determining reliability of imperfect plate structures.
Nomenclature E Young’s modulus fG(g) Distribution of failure function G Failure function i Number of nodes j Number of eigen affine mode shapes l Length of the plate L Load distribution m Number of transverse half lobes M Modal imperfection magnitude vector n Number of longitudinal half lobes
Pf Probability of failure R Reliability of structure ROTZ Rotation about z-direction S Strength distribution t Thickness of the plate Ux Displacement along x-direction Uy Displacement along y-direction Uz Displacement along z-direction w Width of the plate
BSR Reliability by Method-I (Verderaime, 1994)
Reliability by Method-II (Smith and Wells, 2006) Difference
2 1 1 0 2.1 0.999993 0.999990 0.000003 2.2 0.998880 0.998511 0.000369 2.3 0.961303 0.952611 0.008692 2.4 0.682826 0.644836 0.037990 2.5 0.207600 0.176733 0.030867 2.6 0.017638 0.012967 0.004671 2.7 0.000342 0.000211 0.000131

Raviprakash et al./ International Journal of Engineering, Science and Technology, Vol. 2, No. 4, 2010, pp. 150-162
161
Greek Letters γ Poisson’s ratio σy Yield strength ρ Mass density Δ Nodal imperfection amplitude vectors σ2
Δ Variance of Nodal imperfection amplitude vector σ2
M Variance of Modal imperfection amplitude vector σ2
tol Variance of tolerance μΔ Mean of Nodal imperfection amplitude vector μM Mean of Modal imperfection amplitude vector
Φ Eigen vector matrix Φ* Pseudo inverse of Φ matrix ΦT Transpose of Φ matrix μS Mean of strength distribution μL Mean of load distribution σS Standard deviation of strength distribution σL Standard deviation of load distribution � Cumulative normal distribution function β Safety index
Abbreviations 2D-1V BSR
Two-dimensional Uni-variate Buckling Strength Ratio
MVFOSM Mean Value First Order Second Moment RSM Response Surface Methodology
References ANSYS User Manual (Version 12) Arbocz J. and Hol J.M.A.M., 1991. Collapse of axially compressed cylindrical shells with random imperfections. AIAA J.,
Vol. 29 (12), pp. 2247-2256. Athiannan K. and Palaninathan R., 2004. Experimental investigations of buckling of cylindrical shells under axial
compression and transverse shear. Sadhana, Vol.29, pp. 93-115. Bielewicz E. and Gorski J., 2002. Shells with random geometric imperfections simulation - based approach. International
Journal of Non-Linear Mechanics, Vol.37, pp. 777-784. Chrysanthopoulos M.K., 1998. Probabilistic buckling analysis of plates and shells. Thin-Walled Structures, Vol. 30, No.
1-4, pp. 135-157. Chryssanthopoulos M.K., Baker M.J. and Dowling P.J., 1991. Imperfection modeling for buckling analysis of stiffened
cylinders. Journal of Structural Engineering Division, Vol.117, No.7, pp. 1998-2017. Chryssanthopoulos M.K. and Poggi C., 1995. Probabilistic imperfection sensitivity analysis of axially compressed
composite cylinders. Engineering Structures, Vol.17, No. 6, pp. 398-406. Craig K.J and Roux W.J., 2007. On the investigation of shell buckling due to random geometrical imperfections
implemented using Karhunen-Loève expansions. International Journal for Numerical Methods in Engineering, Vol.73, No. 12, pp.1715-1726
Elishakoff I., 1979. Buckling of a stochastically imperfect finite column on a nonlinear elastic foundation: A reliability study. Journal of Applied Mechanics-Transactions of ASME, Vol.46, pp. 411-416.
Elishakoff I., van Manen S., Vermeulen P.G. and Arbocz J., 1987. First-order second-moment analysis of the buckling of shells with random imperfections. AIAA J., Vol.25, No.8, pp. 1113-1117.
Featherston C.A., 2001. Imperfection sensitivity of the flat plates under combined compression and shear. International Journal of Non-Linear Mechanics, Vol. 36, pp. 249-259.
Featherston C.A., 2003. Imperfection sensitivity of curved panels under combined compression and shear. International Journal of Non-Linear Mechanics, Vol.38, pp. 225-238.
Guedes Soares C. and Kmiecik M., 1993. Simulation of ultimate compressive strength of unstiffened rectangular plates. Marine Structures, Vol 6, pp. 553-569.
Harada M. and Fujikubo M., 2002. Estimation of buckling and ultimate strength of rectangular plate with cutout. Proceedings of the Twelfth International Offshore and Polar Engineering Conference, Kitakyushu, Japan, pp. 630-635.
Ikeda K., Kitada T., Matsumura M. and Yamakawa Y., 2007. Imperfection sensitivity and ultimate buckling strength of elastic-plastic square plates under compression. International Journal of Non-Linear Mechanics, Vol. 42, pp. 529-541.
Khamlichi, Bezzazi M. and Limam A., 2004. Buckling of elastic cylindrical shells considering the effect of localized axisymmetric imperfections. Thin-Walled Structures, Vol.42, pp. 1035-1047.
Khelil., 2002. Buckling of steel shells subjected to non-uniform axial and pressure loadings. Thin-Walled Structures, Vol.40, pp. 955-970.
Kim Seung-Eock and Kim Chang-Sung., 2002. Buckling strength of the cylindrical shell and tank subjected to axially compressive loads. Thin-Walled Structures, Vol.40, pp. 329-353.
Kmiecik M., Jastrzebski T. and Kuzniar J., 1995. Statistics of ship building distortions, Marine Structures, Vol. 8, No. 2, pp. 119-132.
Náprstek J., 1999. Strongly non-linear stochastic response of a system with random initial imperfections. Probabilistic Engineering Mechanics, Vol.14, No.1-2, pp. 141-148.

Raviprakash et al./ International Journal of Engineering, Science and Technology, Vol. 2, No. 4, 2010, pp. 150-162
162
Papadopoulos V. and Papadrakakis M., 2004. Finite-element analysis of cylindrical panels with random initial imperfections. Journal of Engineering Mechanics, ASCE, Vol.130, No. 8, pp. 867-876.
Papadopoulos V., Stefanou G. and Papadrakakis M., 2009. Buckling analysis of imperfect shells with stochastic non-Gaussian material and thickness properties, International Journal of Solids and Structures, Vol. 46, pp. 2800-2808.
Pircher M., Berry P.A., Ding X. and Bridge R.Q., 2001. The shape of circumferential weld-induced imperfections in thin-walled steel silos and tanks. Thin-Walled Structures, Vol.39, No.12, pp. 999-1014.
Ranganathan R., 2000. Structural reliability – Analysis & design. Jaico Publishing House, New Delhi, India. Sadovsky Z. and Bulaz I., 1996. Tolerance of initial deflections of welded steel plates and strength of I- cross section in
compression and bending. Journal of Constructional Steel Research, Vol. 38, No. 3, pp. 219-238. Sadovsky Z., Guedes Soares C. and Teixeira A.P., 2007. Random field of initial deflections and strength of thin rectangular
plates. Reliability Engineering & System Safety, Vol. 92, pp. 1659-1670. Sadovsky Z., Teixeira A.P. and Guedes Soares C., 2005. Degradation of the compressive strength of rectangular plates due
to initial deflections. Thin-Walled Structures, Vol. 43, pp. 65-82. Sadovsky Z., Teixeira A.P. and Guedes Soares C., 2006. Degradation of the compressive strength of square plates due to
initial deflections. Journal of Constructional Steel Research, Vol. 62, pp. 369-377. Schenk C.A. and Schueller G.I., 2003. Buckling analysis of cylindrical shells with random geometric imperfections.
International Journal of Non-Linear Mechanics. Vol.38, pp. 1119-1132. Schneider M.H. Jr., 1996. Investigation of stability of imperfect cylinders using structural models. Engineering Structures,
Vol. 18, No. 10, pp. 792-800. Singer J., 1999. On the importance of shell buckling experiments. Journal of Applied Mechanics Review, Vol.52, No. 6, pp.
17-25. Smith Z.R. and Wells C.S., 2006. Central limit theorem and sample size. Paper presented at the Annual Meeting of the
North Eastern Educational Research Association, Kerhonkson, New York. Teng J.G. and Song C.Y., 2001. Numerical models for nonlinear analysis of elastic shells with eigen mode-affine
imperfections. International Journal of Solids and Structures, Vol.38, pp. 3263-3280. Timoshenko S.P. and Gere J.M., 1965. Theory of elastic stability. McGraw-Hill Publications, Second Edition. Verderaime V., 1994. Illustrated structural application of universal first order reliability method. NASA technical paper
3501. Visweswaran P., Mansoor M., Prabu B. and Venkatraman A., 2006. Static buckling analysis on imperfect thin plates
subjected to axial compression. Proceedings of the International Conference on Resource Utilization and Intelligent Systems, Kongu Engineering College, Perundurai, Erode, Tamilnadu, India, pp. 707-712.
Warren J.E. Jr., 1997. Nonlinear stability analysis of frame-type structures with random geometric imperfections using a total-lagrangian finite element formulation Ph.D. Thesis, Virginia Polytechnic Institute and State University, USA.
Biographical notes Alwardoss Velayutham Raviprakash received the Master of Engineering Degree in Production Engineering from Annamalai University, Chidambaram, India in 1983 and currently pursuing PhD Degree in Buckling Behaviour of Thin Shell Structures at Pondicherry (Central) University, Puducherry, India. At present, he is working as an Associate Professor in the Department of Mechanical Engineering, Pondicherry Engineering College, Puducherry, India. Balakrishnan Prabu received the Master of Engineering Degree in Engineering Design from Anna University, Chennai, India in 1993 and PhD Degree in Thin Shell Buckling from Pondicherry (Central) University, Puducherry, India in 2007. At present, he is working as an Associate Professor in the Department of Mechanical Engineering, Pondicherry Engineering College, Puducherry, India. His main research interest is in buckling behavior of thin shell structures. Natarajan Alagumurthi received both the Master of Technology Degree in Energy Technology and PhD Degree in Heat Generation and Transfer in Cylindrical Grinding from Pondicherry (Central) University, Puducherry, India in 1996 and 2006 respectively. At present, he is working as a Professor in the Department of Mechanical Engineering, Pondicherry Engineering College, Puducherry, India. His main research interest is in modeling and simulation of manufacturing and thermal systems. Received January 2010 Accepted March 2010 Final acceptance in revised form May 2010