means-testing and tax rates on earnings: a contribution to the mirrlees review mike brewer (ifs)...
TRANSCRIPT
Means-testing and tax rates on earnings: a contribution to the Mirrlees ReviewMike Brewer (IFS)
Emmanuel Saez (UC, Berkeley)
Andrew Shephard (IFS & UCL)
© Institute for Fiscal Studies

“The Mirrlees review: Reforming the Tax System for the 21st Century”
• Independent review, run by Mirrlees, with Besley, Blundell, Gammie and Poterba– Commissioned 13 studies, plus discussants. All available
on-line.– Editorial volume will distil, and make own
recommendations. Published late 2009 (?)
• Objectives– To bring together international experts in public economics,
tax law, political science and tax practice– To identify the characteristics of a good tax system for any
open developed economy in the 21st century– To assess how well UK tax system conforms to these ideals– To recommend how it might realistically be reformed in that
direction
• Inspired by the 30th anniversary of the ‘Meade Report’, The Structure and Reform of Direct Taxation (1978)© Institute for Fiscal Studies
Means-testing and tax rates on earnings
• Aim– to review developments in optimal income tax, and make
recommendations for UK personal tax, tax credits and benefits
• Outline– Optimal tax theory
• Top rates of tax & all rates of tax• Extensive and intensive responses
– Other issues• Family vs individual• Administering transfers for low-income families
– Lessons for the UK– Reform proposals for the UK
Reflections
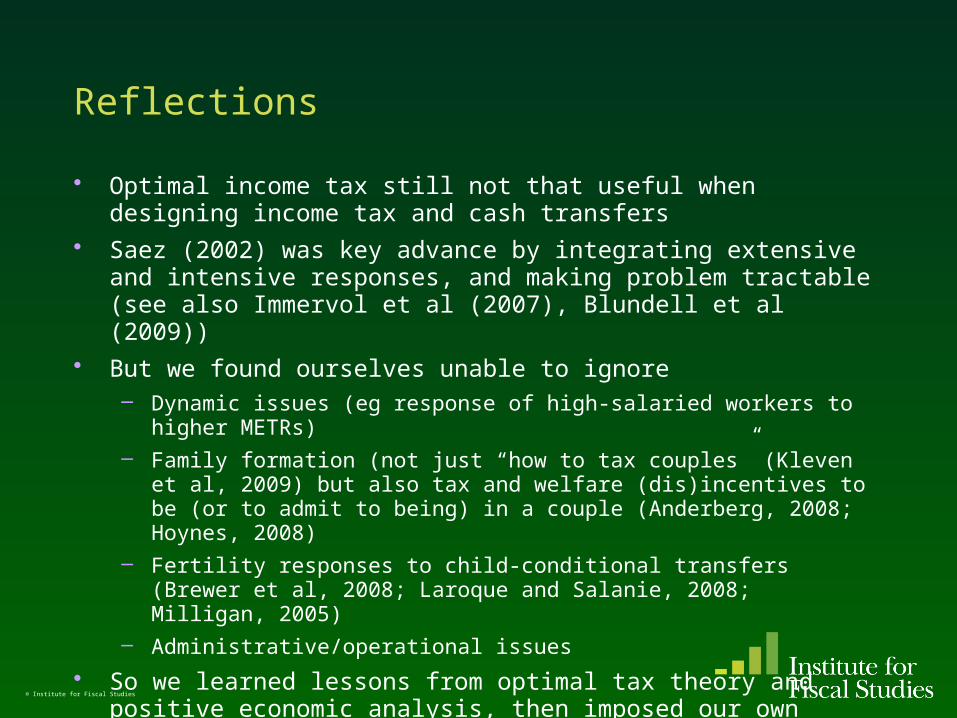
• Optimal income tax still not that useful when designing income tax and cash transfers
• Saez (2002) was key advance by integrating extensive and intensive responses, and making problem tractable (see also Immervol et al (2007), Blundell et al (2009))
• But we found ourselves unable to ignore– Dynamic issues (eg response of high-salaried workers to higher
METRs)– Family formation (not just “how to tax couples” (Kleven et al, 2009)
but also tax and welfare (dis)incentives to be (or to admit to being) in a couple (Anderberg, 2008; Hoynes, 2008)
– Fertility responses to child-conditional transfers (Brewer et al, 2008; Laroque and Salanie, 2008; Milligan, 2005)
– Administrative/operational issues
• So we learned lessons from optimal tax theory and positive economic analysis, then imposed our own value judgements to suggest reforms. We mostly ignored the UK political context.
© Institute for Fiscal Studies
Optimal income tax:intensive responses
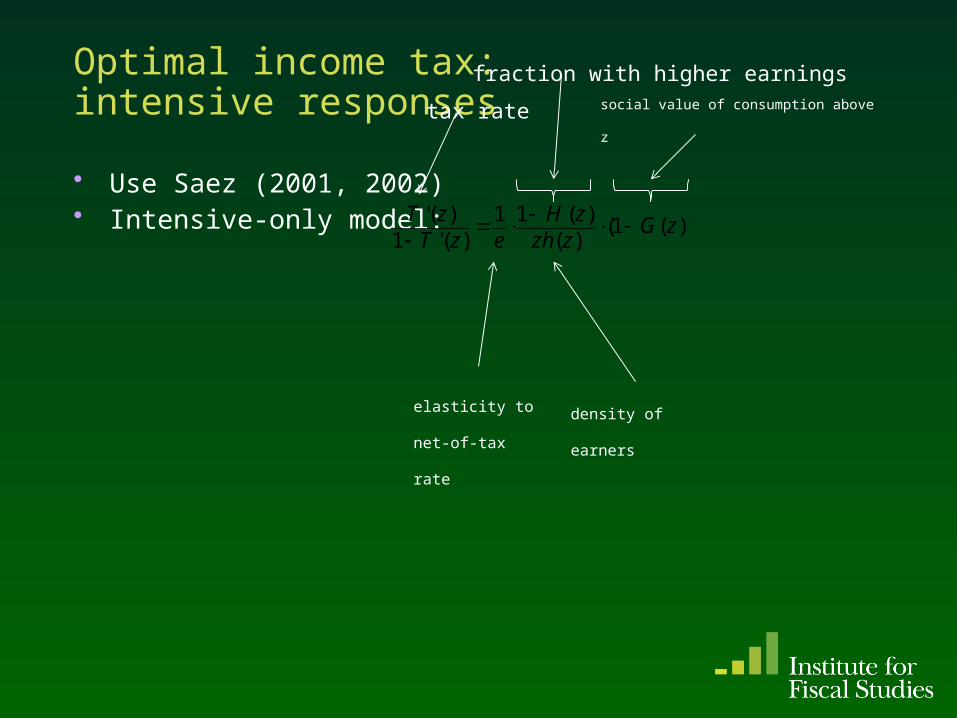
• Use Saez (2001, 2002)• Intensive-only model: ))(1(
)()(11
)('1)(' zG
zzhzH
ezTzT
tax rate
elasticity to net-of-
tax rate
density of earners
fraction with higher earningssocial value of consumption above z
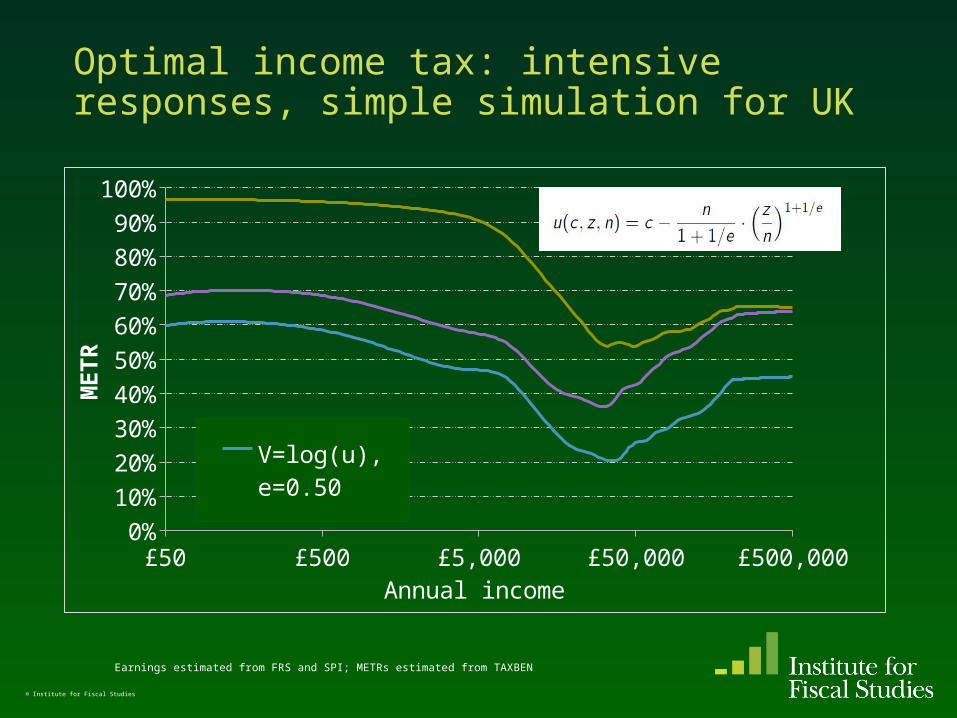
Optimal income tax: intensive responses, simple simulation for UK
£50 £500 £5,000 £50,000 £500,0000%
10%20%30%40%50%60%70%80%90%
100%
V=log(u), e=0.50
Annual income
METR
© Institute for Fiscal Studies
Earnings estimated from FRS and SPI; METRs estimated from TAXBEN

Optimal income tax :intensive responses
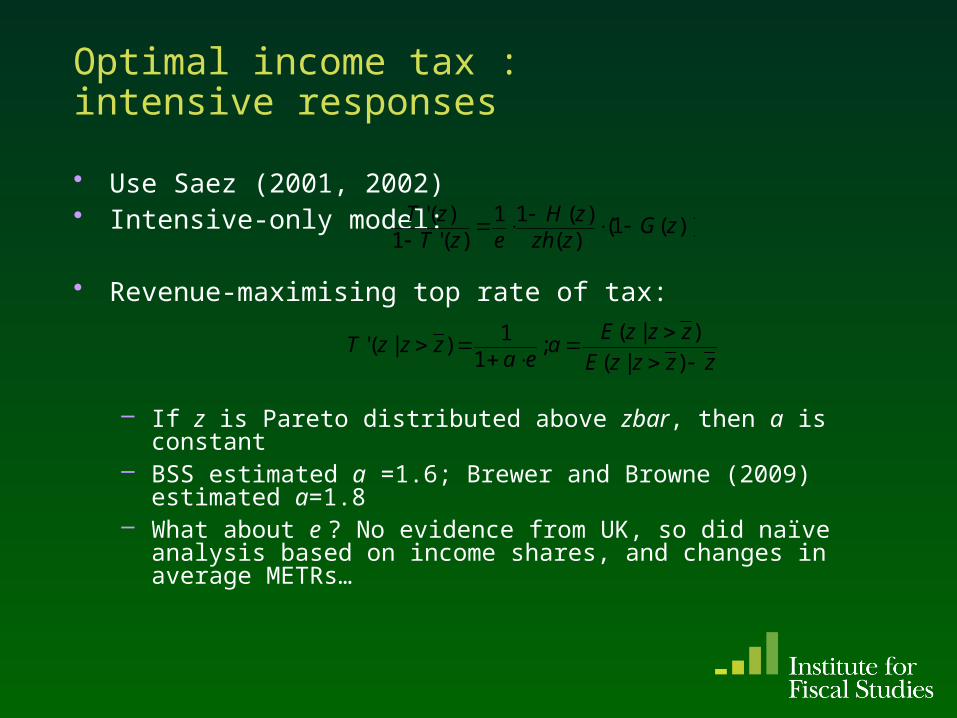
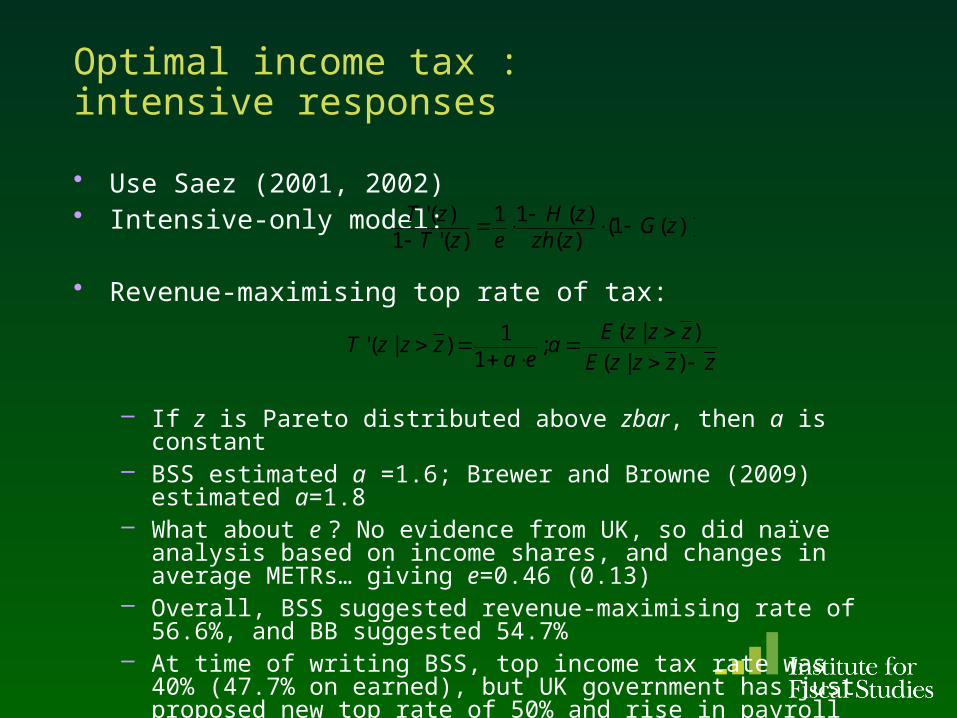
• Use Saez (2001, 2002)• Intensive-only model:
• Revenue-maximising top rate of tax:
– If z is Pareto distributed above zbar, then a is constant– BSS estimated a =1.6; Brewer and Browne (2009)
estimated a=1.8
))(1()()(11
)('1)(' zG
zzhzH
ezTzT
zzzzE
zzzEa
eazzzT
)|(
)|(;
11)|('
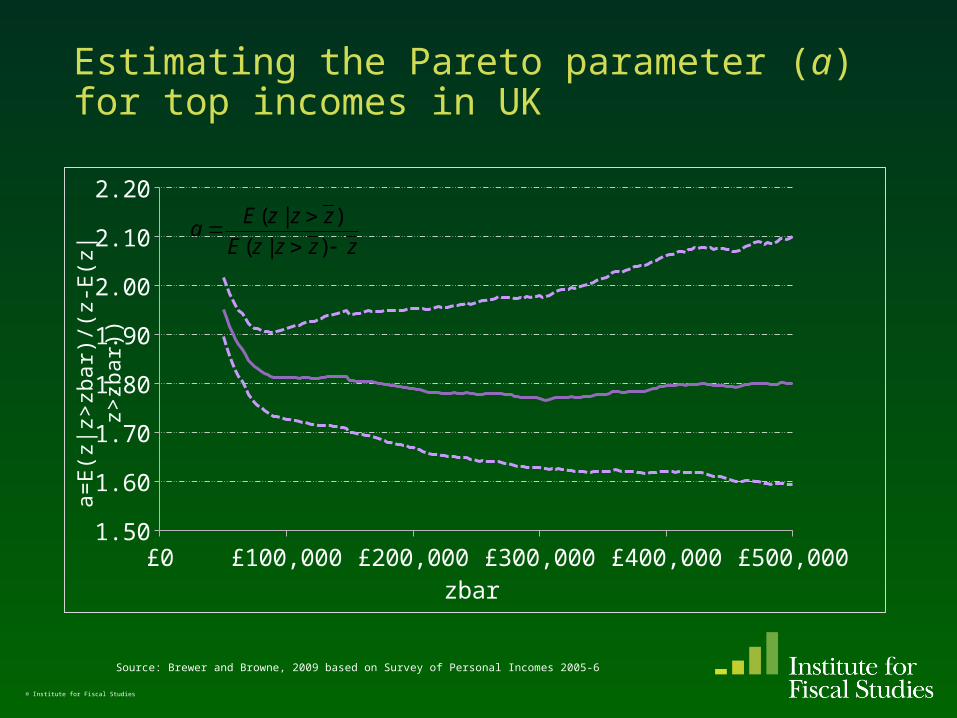
Estimating the Pareto parameter (a) for top incomes in UK
£0 £100,000 £200,000 £300,000 £400,000 £500,0001.50
1.60
1.70
1.80
1.90
2.00
2.10
2.20
zbar
a=
E(z
|z>
zbar)
/(z-
E(z
|z>
zbar)
)
© Institute for Fiscal Studies
Source: Brewer and Browne, 2009 based on Survey of Personal Incomes 2005-6
zzzzE
zzzEa
)|(
)|(
Optimal income tax :intensive responses
• Use Saez (2001, 2002)• Intensive-only model:
• Revenue-maximising top rate of tax:
– If z is Pareto distributed above zbar, then a is constant– BSS estimated a =1.6; Brewer and Browne (2009)
estimated a=1.8– What about e ? No evidence from UK, so did naïve analysis
based on income shares, and changes in average METRs…
))(1()()(11
)('1)(' zG
zzhzH
ezTzT
zzzzE
zzzEa
eazzzT
)|(
)|(;
11)|('

Income shares and top rates in UK, 1962-2003
1962 1967 1972 1977 1982 1987 1992 1997 20020%
10%
20%
30%
40%
50%
60%
70%
80%
90%
100%
0%
2%
4%
6%
8%
10%
12%
14%
16%
METR, top 1%METR, top 5-1%Share, top 1%
METR
Incom
e s
hare
© Institute for Fiscal Studies
Source: BSS (2008) based on income shares from Atkinson (2008).
METRs estimated from TAXBEN
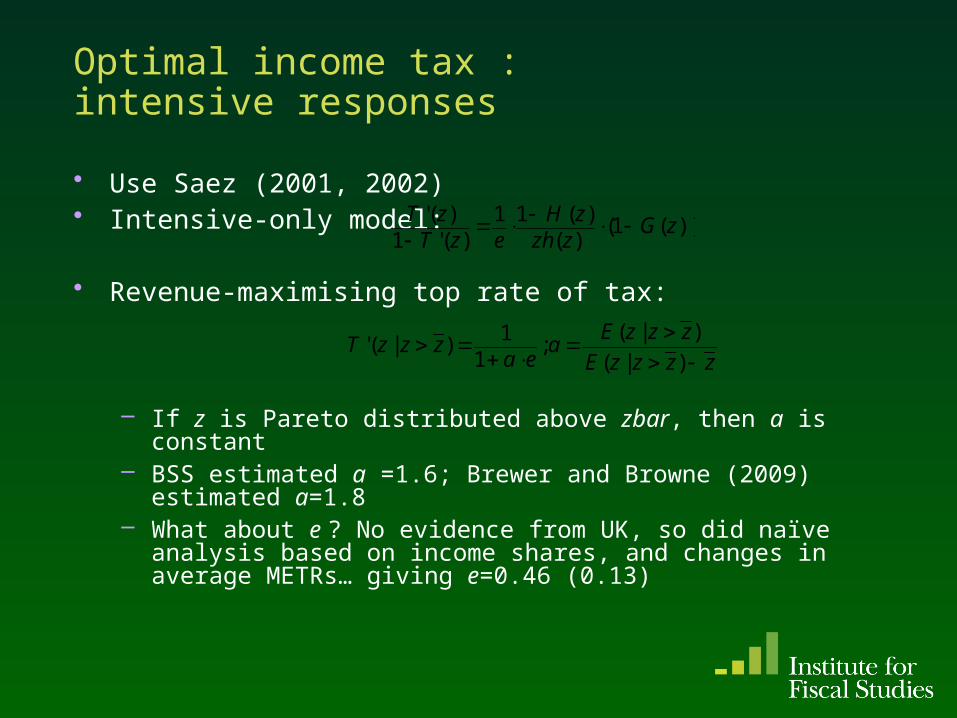
Optimal income tax :intensive responses
• Use Saez (2001, 2002)• Intensive-only model:
• Revenue-maximising top rate of tax:
– If z is Pareto distributed above zbar, then a is constant– BSS estimated a =1.6; Brewer and Browne (2009)
estimated a=1.8– What about e ? No evidence from UK, so did naïve analysis
based on income shares, and changes in average METRs… giving e=0.46 (0.13)
))(1()()(11
)('1)(' zG
zzhzH
ezTzT
zzzzE
zzzEa
eazzzT
)|(
)|(;
11)|('
Optimal income tax :intensive responses
• Use Saez (2001, 2002)• Intensive-only model:
• Revenue-maximising top rate of tax:
– If z is Pareto distributed above zbar, then a is constant– BSS estimated a =1.6; Brewer and Browne (2009)
estimated a=1.8– What about e ? No evidence from UK, so did naïve analysis
based on income shares, and changes in average METRs… giving e=0.46 (0.13)
– Overall, BSS suggested revenue-maximising rate of 56.6%, and BB suggested 54.7%
– At time of writing BSS, top income tax rate was 40% (47.7% on earned), but UK government has just proposed new top rate of 50% and rise in payroll tax!
– All depends on e; Government argues has closed large loophole
))(1()()(11
)('1)(' zG
zzhzH
ezTzT
zzzzE
zzzEa
eazzzT
)|(
)|(;
11)|('
© Institute for Fiscal Studies
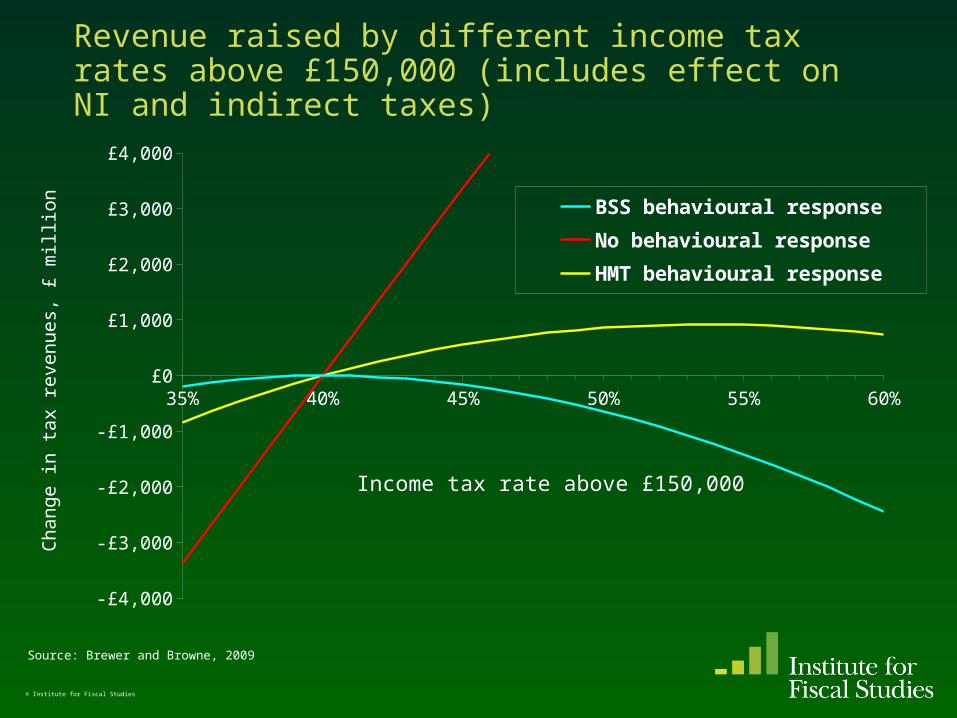
Revenue raised by different income tax rates above £150,000 (includes effect on NI and indirect taxes)
35% 40% 45% 50% 55% 60%
-£4,000
-£3,000
-£2,000
-£1,000
£0
£1,000
£2,000
£3,000
£4,000
BSS behavioural response
No behavioural response
HMT behavioural response
Income tax rate above £150,000
Ch
an
ge
in
ta
x r
eve
nu
es,
£ m
illio
n
Source: Brewer and Browne, 2009
Optimal income tax: extensive responses
• But we can’t ignore extensive responses, especially for lone parents and mothers in couples
• Evidence – Reviewed in Meghir and Phillips, (2008)– Saez (2002): The more important are extensive
elasticities, the lower should marginal rates be for low earners
– Adam (2005): METRs for low-earning lone parents in UK above Laffer bound
– IKKS (2008): earned income tax credits (negative marginal rates for low earners) more likely to be optimal for countries with dispersed wage distribution, like UK
• Participation responses can include migration, participation in (in)formal economy

The family and the tax system
• Individual or joint?– Efficiency: individual-level tax (or, even, lower METRs for
second earners/women)– Equity: family-level tax if partners share resources– Couple penalties? (Anderberg, 2008)– Hard to say much in optimal income tax model
• Kleven et al (2008): optimal to have higher tax rates on second earners with poor partners than those with rich partners, like UK. Leads to “Couple penalties”
• But assumes everyone lives in a couple forever
• Many transfers conditional on children (“tagging”)– Equity: higher transfers for families with children– Efficiency: lower MTRs for (some?) parents – Fertility response ??
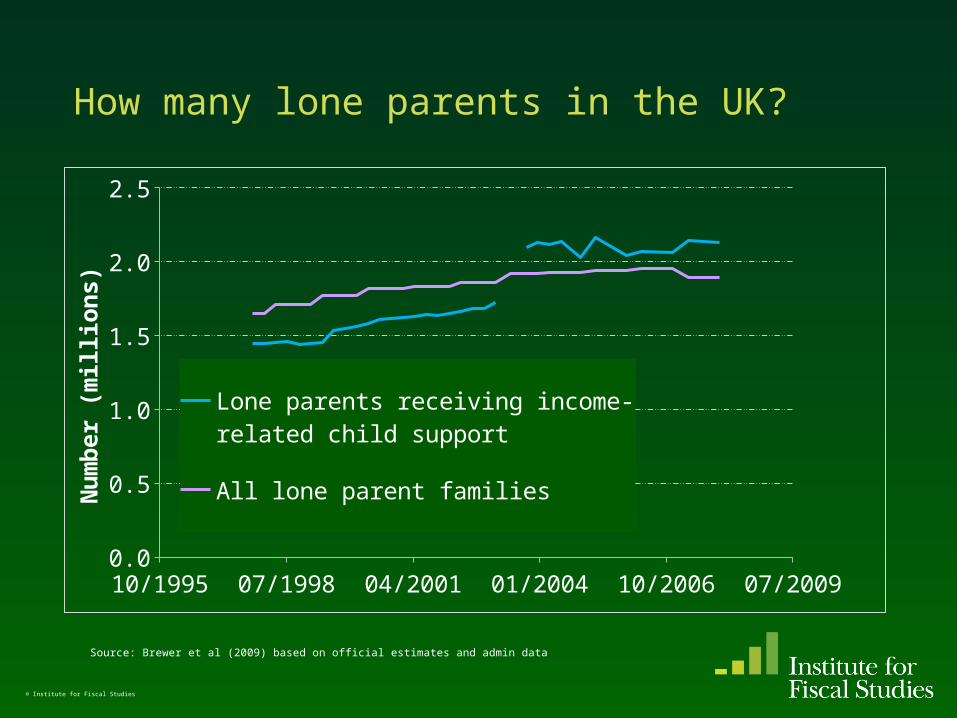
How many lone parents in the UK?
10/1995 07/1998 04/2001 01/2004 10/2006 07/20090.0
0.5
1.0
1.5
2.0
2.5
Lone parents receiving income-re-lated child support
All lone parent familiesNu
mb
er
(million
s)
© Institute for Fiscal Studies
Source: Brewer et al (2009) based on official estimates and admin data

Administering transfers for low-income households
• BSS argued that– Transfers should be predictable, impose low
compliance costs on recipients and have high take-up
– Little point designing transfer system for poor that does not reflect current circumstances
• UK system fails here (tax credits, Housing Benefit), but recent UK experience and international examples suggest no easy solutions

The tax and transfer system and work incentives in the UK
• Rest of the paper assesses the UK tax and transfer system and its impact on incentives
• Will show some pictures, then outline our proposals
• Will not discuss “conditionality” (ie what people have to do in order to receive welfare benefits)
© Institute for Fiscal Studies
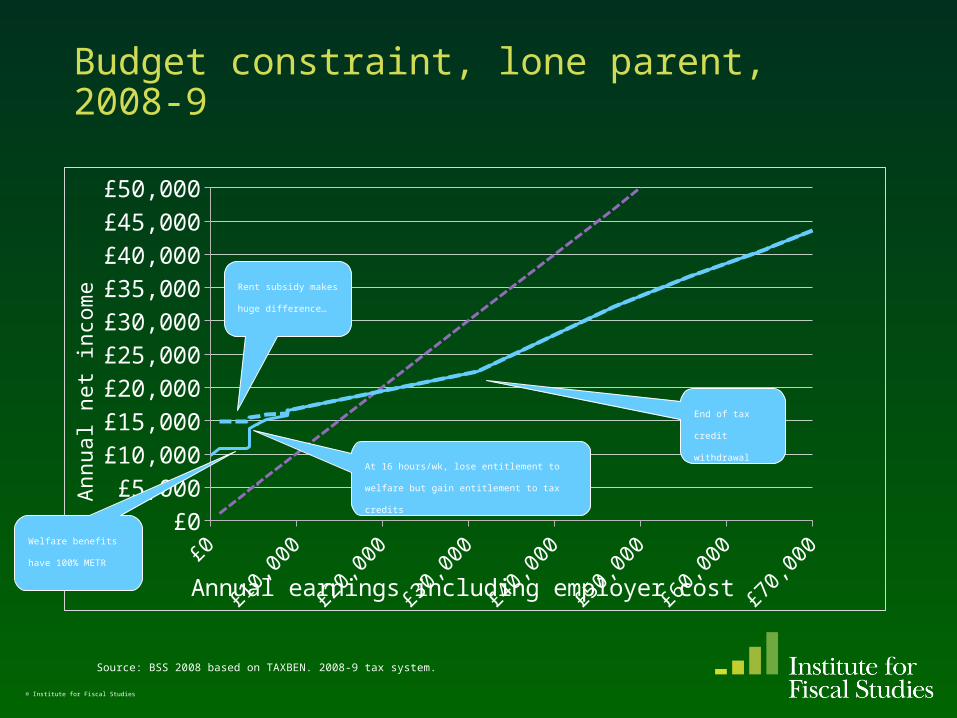
Budget constraint, lone parent, 2008-9
£0 £10,000£20,000£30,000£40,000£50,000£60,000£70,000£0
£5,000£10,000£15,000£20,000£25,000£30,000£35,000£40,000£45,000£50,000
Annual earnings including employer cost
Annual net
inco
me
© Institute for Fiscal Studies
Source: BSS 2008 based on TAXBEN. 2008-9 tax system.
Welfare benefits have
100% METR
Rent subsidy makes
huge difference…
At 16 hours/wk, lose entitlement to welfare
but gain entitlement to tax credits
End of tax credit
withdrawal
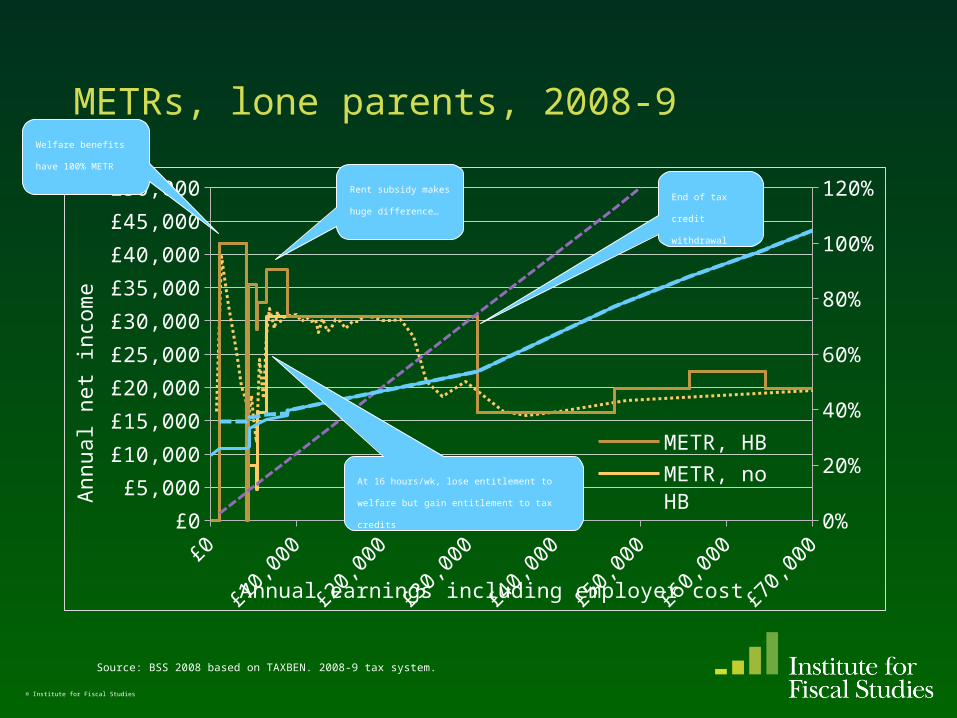
METRs, lone parents, 2008-9
£0 £10,000£20,000£30,000£40,000£50,000£60,000£70,000£0
£5,000
£10,000
£15,000
£20,000
£25,000
£30,000
£35,000
£40,000
£45,000
£50,000
0%
20%
40%
60%
80%
100%
120%
METR, HB
METR, no HB
Annual earnings including employer cost
Annual net
inco
me
© Institute for Fiscal Studies
Source: BSS 2008 based on TAXBEN. 2008-9 tax system.
Welfare benefits have
100% METR
Rent subsidy makes
huge difference…
End of tax credit
withdrawal
At 16 hours/wk, lose entitlement to welfare
but gain entitlement to tax credits
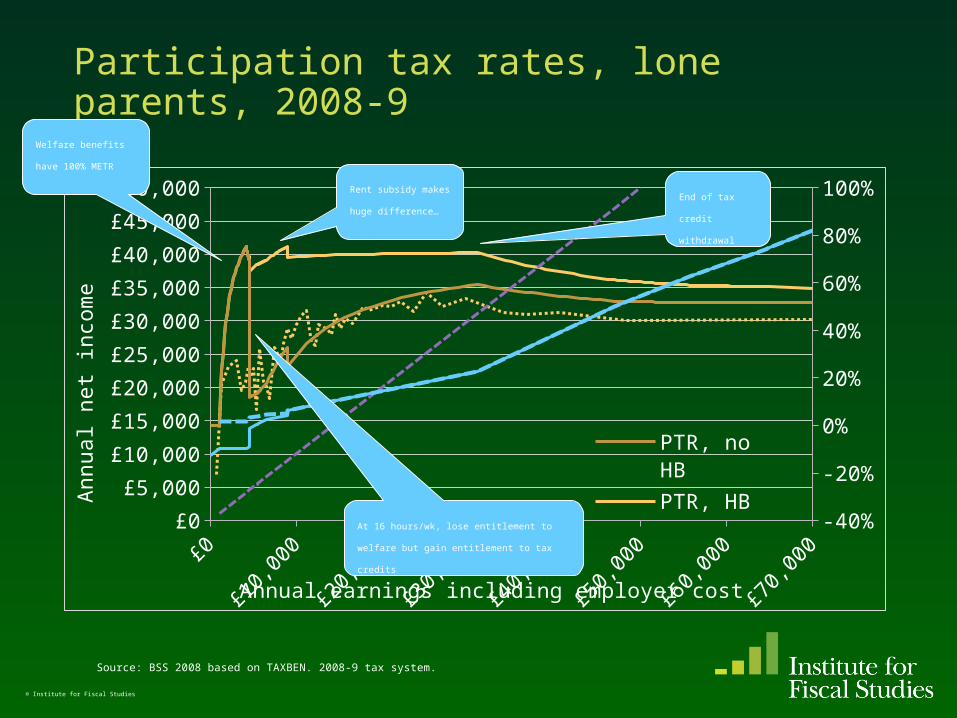
Participation tax rates, lone parents, 2008-9
£0 £10,000£20,000£30,000£40,000£50,000£60,000£70,000£0
£5,000
£10,000
£15,000
£20,000
£25,000
£30,000
£35,000
£40,000
£45,000
£50,000
-40%
-20%
0%
20%
40%
60%
80%
100%
PTR, no HB
PTR, HB
Annual earnings including employer cost
Annual net
inco
me
© Institute for Fiscal Studies
Source: BSS 2008 based on TAXBEN. 2008-9 tax system.
Welfare benefits have
100% METR
Rent subsidy makes
huge difference…
At 16 hours/wk, lose entitlement to welfare
but gain entitlement to tax credits
End of tax credit
withdrawal
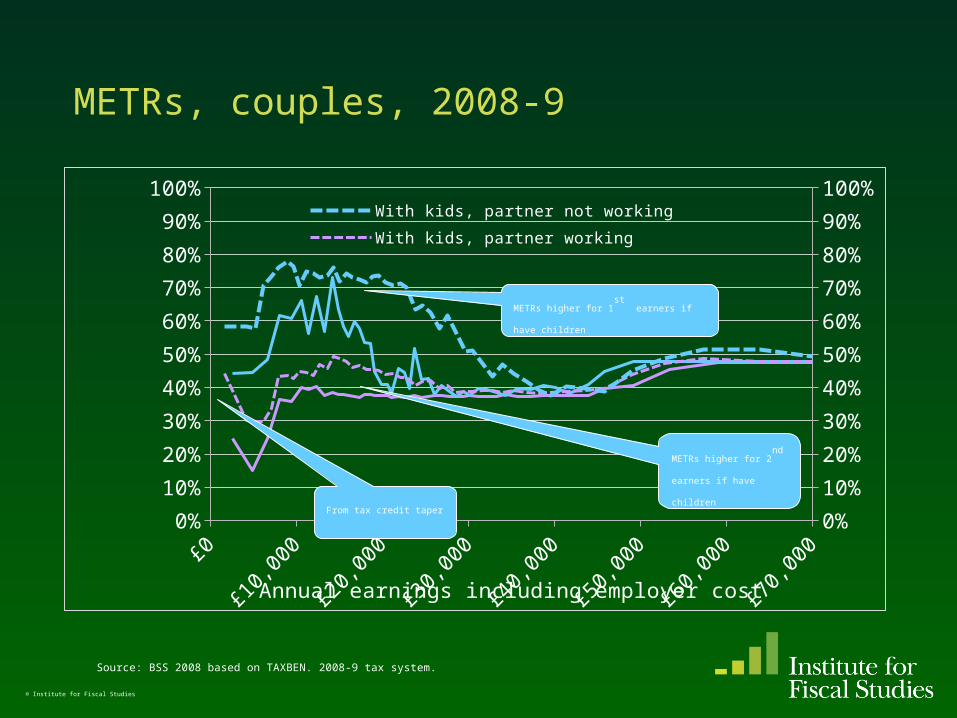
METRs, couples, 2008-9
£0 £10,000£20,000£30,000£40,000£50,000£60,000£70,0000%
10%
20%
30%
40%
50%
60%
70%
80%
90%
100%
0%
10%
20%
30%
40%
50%
60%
70%
80%
90%
100%With kids, partner not workingWith kids, partner workingWithout kids, partner not working
Annual earnings including employer cost
© Institute for Fiscal Studies
Source: BSS 2008 based on TAXBEN. 2008-9 tax system.
METRs higher for 1st
earners if have children
METRs higher for 2nd
earners if have children
From tax credit taper
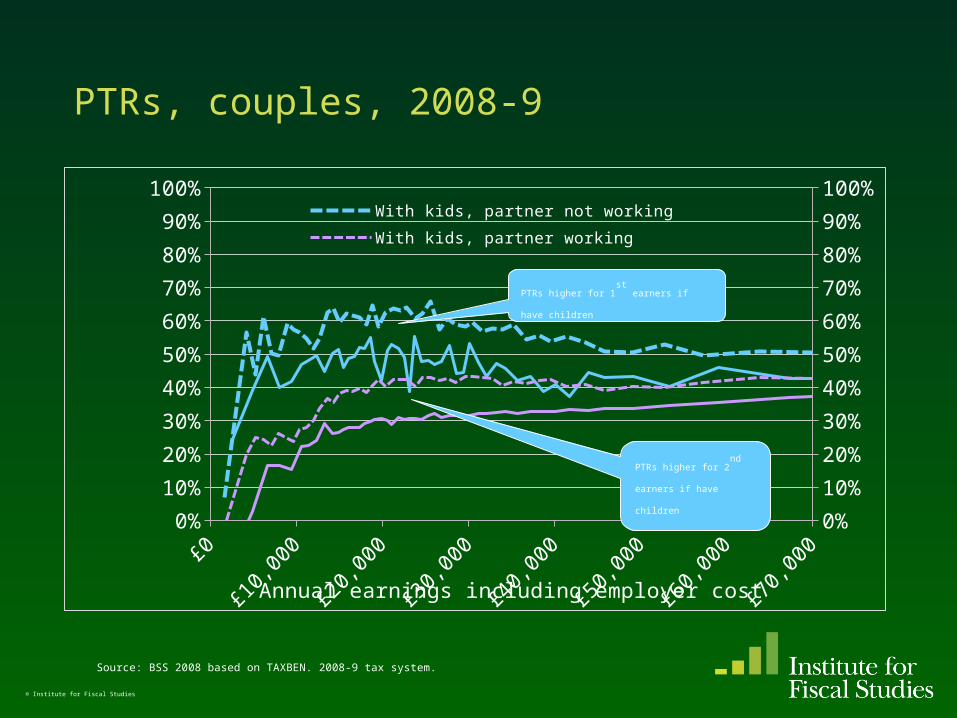
PTRs, couples, 2008-9
£0 £10,000£20,000£30,000£40,000£50,000£60,000£70,0000%
10%
20%
30%
40%
50%
60%
70%
80%
90%
100%
0%
10%
20%
30%
40%
50%
60%
70%
80%
90%
100%With kids, partner not workingWith kids, partner workingWithout kids, partner not working
Annual earnings including employer cost
© Institute for Fiscal Studies
Source: BSS 2008 based on TAXBEN. 2008-9 tax system.
PTRs higher for 1st
earners if have children
PTRs higher for 2nd
earners
if have children
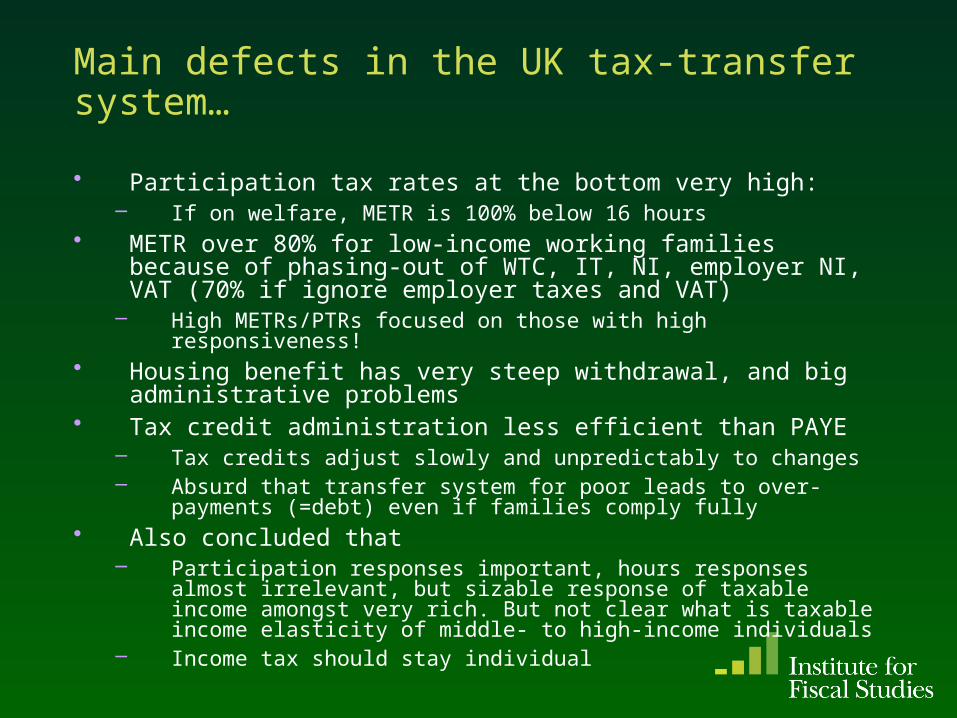
Main defects in the UK tax-transfer system…
• Participation tax rates at the bottom very high:– If on welfare, METR is 100% below 16 hours
• METR over 80% for low-income working families because of phasing-out of WTC, IT, NI, employer NI, VAT (70% if ignore employer taxes and VAT)
– High METRs/PTRs focused on those with high responsiveness!• Housing benefit has very steep withdrawal, and big
administrative problems• Tax credit administration less efficient than PAYE
– Tax credits adjust slowly and unpredictably to changes– Absurd that transfer system for poor leads to over-payments
(=debt) even if families comply fully• Also concluded that
– Participation responses important, hours responses almost irrelevant, but sizable response of taxable income amongst very rich. But not clear what is taxable income elasticity of middle- to high-income individuals
– Income tax should stay individual
…lead to fairly obvious short-run proposals
• Higher disregards in all welfare benefits• New disregard in tax credits for second earners• Higher working tax credit • Lower taper in tax credits
• All would cost money, and extend the number on tax credit withdrawal. None directly benefit those on lowest incomes who are not working
© Institute for Fiscal Studies
Longer-term, more dramatic changes
• Propose a new Integrated Family Support programme – Hint: look at the initials…
• Key features– Unifies welfare benefits and tax credits for low-income families– IFS disregard aligned with income tax personal allowance– Maximum IFS entitlement paid direct to families, and IFS
withdrawal operated by employers (ensures IFS is responsive)• Problems
– Hugely more generous to low-income families, hugely extends number on some sort of taper (on top of income tax)
– HB still problematic: probably requires a change in housing policy– No elegant system for couples– Considerable amount of “churn”
• Attempt simple behavioural analysis by assuming families respond to changes in METRs and PTRs: a revenue-neutral reform is strongly redistributive, but slightly reduces total earnings (see BSS for details)
© Institute for Fiscal Studies

End

References
Adam, S., (2005), “Measuring the marginal efficiency cost of redistribution in the UK", IFS WP 05/14
Anderberg, D. (forthcoming), “Tax Credits, Income Support and Partnership Decisions”, International Tax and Public Finance
Blundell, R., Brewer, M., Haan, P. & Shephard, A., (2009), "Optimal Income Taxation of Lone Mothers: An Empirical Comparison of the UK and Germany", Economic Journal, 119, pp F101-F121.
Brewer, M., Saez, E. & Shephard, A. (2008), “Means-testing and tax rates on earnings”, forthcoming in Dimensions of Tax Design, OUP. Draft available at http://www.ifs.org.uk/mirrleesreview/press_docs/rates.pdf
Brewer, M. & Browne, J. (2009), “Can more revenue be raised by increasing income tax rates for the very rich?”, IFS Briefing Notes 84, http://www.ifs.org.uk/bns/bn84.pdf
Brewer, M., Muriel, Al. Phillips, D. & Sibieta, L. (2009), Poverty and Inequality in the UK: 2009, IFS Commentary 109, http://www.ifs.org.uk/comms/c109.pdf
Brewer, M., Ratcliffe, A. & Smith, S., (2008), “Does welfare reform affect fertility? Evidence from the UK”, IFS WP 08/09
Hoynes, H. (2008), “Means-testing and tax rates on earnings: a commentary”, forthcoming in Dimensions of Tax Design, OUP. Draft available at http://www.ifs.org.uk/mirrleesreview/press_docs/hoynes.pdf
Immervoll, H., Kleven, H., Kreiner, C. & Saez, E., (2007), “Welfare Reform in European Countries: Microsimulation Analysis”, Economic Journal, 117, pp 1-44
Laroque, G. & Salanie, B., (2008), “Does Fertility Respond to Financial Incentives?” CESifo WP 2339
Kleven, H., Kreiner, C. & Saez, E., (2009), "The Optimal Income Taxation of Couples”, Econometrica 77, 2009, pp. 537-560
Meghir, C. and Phillips, D. (2008), “Labour supply and taxes”, forthcoming in Dimensions of Tax Design, OUP. Draft available at http://www.ifs.org.uk/mirrleesreview/reports/labour_supply.pdf
Milligan, K., (2005). “Subsidizing the Stork: New Evidence on Tax Incentives and Fertility.” Review of Economics and Statistics, 87(3), pp 539-555
Saez, E., (2001), “Using Elasticities to Derive Optimal Income Tax Rates." Review of Economic Studies, 68, pp 205-229
Saez, E., (2002), “Optimal Income Transfer programmes: Intensive Versus Extensive Labour Supply Responses." Quarterly Journal of Economics, 117(3), pp1039-1073
Saez, E., Slemrod, J. and Giertz, S. (2009), "The Elasticity of Taxable Income with Respect to Marginal Tax Rates: A Critical Review“ NBER WP 15012 and forthcoming Journal of Economic Literature
© Institute for Fiscal Studies