means-testing or universalism: what strategies · pdf filemeans-testing or universalism: what...
TRANSCRIPT

MEANS-TESTING OR UNIVERSALISM: WHAT STRATEGIES BEST ADDRESS POVERTY?
A review contributing to Joseph
Rowntree Foundation’s development
of an anti-poverty strategy
Dimitri Gugushvili and Donald Hirsch
Centre for Research in Social Policy
August 2014
© Loughborough University

© Loughborough University Published by the Centre for Research in Social Policy Loughborough University Leicestershire LE11 3TU ISBN 978 0946831 40 1 All rights reserved. Reproduction of this report by photocopying or electronic means for non-commercial purposes is permitted. Otherwise, no part of this report may be reproduced, adapted, stored in a retrieval system or transmitted by any means, electronic, mechanical, photocopying, or otherwise without the prior written permission of Loughborough University.

CONTENTS Acknowledgements
List of Figures and Tables
PART I GENERAL ISSUES AND INTERNATIONAL EVIDENCE 1
Chapter 1 Introduction 1
Chapter 2 Have Universal or Selective Systems Been More Effective at Tackling Poverty, and How Does the UK Compare to Other Countries? 5
PART II FIVE CHALLENGES FOR THE UK 15
Chapter 3 The Respective Contributions of the State Pension and Pension Credit in Addressing Pensioner Poverty 15
Chapter 4 The Roles of Universal and Means-Tested Transfers to Families with Children 26
Chapter 5 Measures to Improve Children’s Life Chances – Universal Opportunity or Selective Help? 35
Chapter 6 Providing for Disability, Health and Care Needs 47
Chapter 7 Take-Up Rates and Public Perceptions 54
Chapter 8 Conclusion 63
References 75
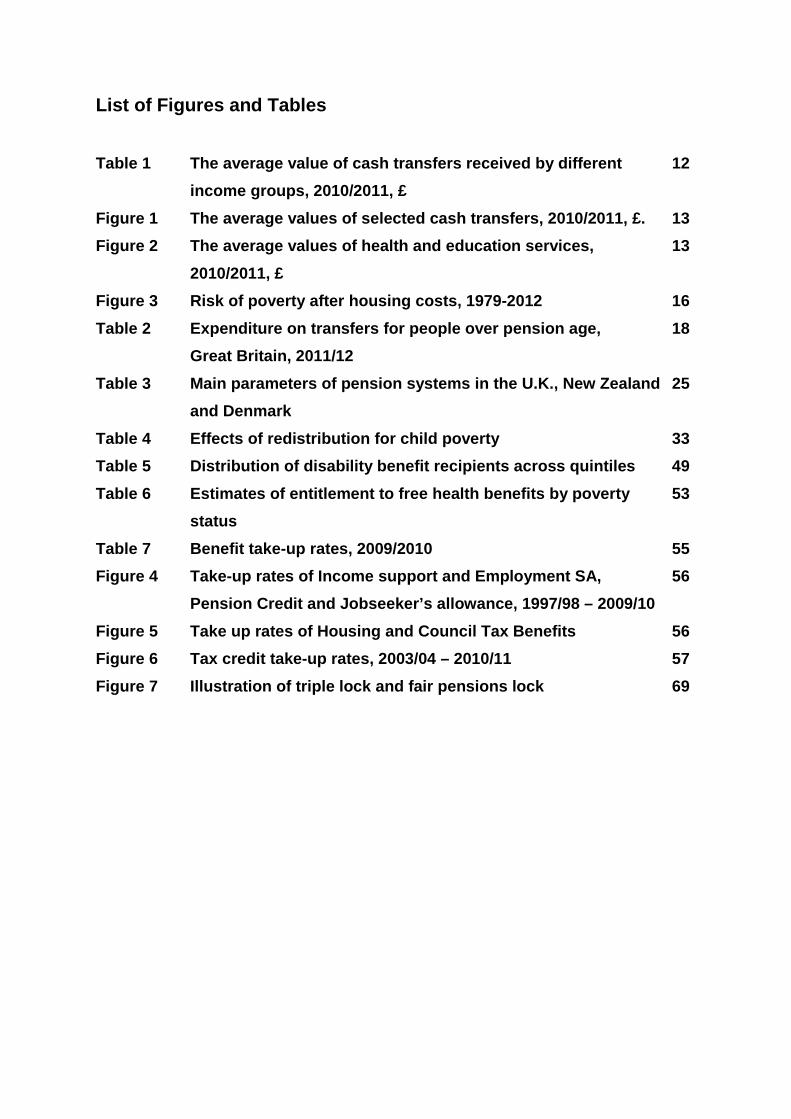
List of Figures and Tables Table 1 The average value of cash transfers received by different 12 income groups, 2010/2011, £ Figure 1 The average values of selected cash transfers, 2010/2011, £. 13 Figure 2 The average values of health and education services, 13 2010/2011, £ Figure 3 Risk of poverty after housing costs, 1979-2012 16 Table 2 Expenditure on transfers for people over pension age, 18 Great Britain, 2011/12 Table 3 Main parameters of pension systems in the U.K., New Zealand 25 and Denmark Table 4 Effects of redistribution for child poverty 33 Table 5 Distribution of disability benefit recipients across quintiles 49 Table 6 Estimates of entitlement to free health benefits by poverty 53 status Table 7 Benefit take-up rates, 2009/2010 55 Figure 4 Take-up rates of Income support and Employment SA, 56 Pension Credit and Jobseeker’s allowance, 1997/98 – 2009/10 Figure 5 Take up rates of Housing and Council Tax Benefits 56 Figure 6 Tax credit take-up rates, 2003/04 – 2010/11 57 Figure 7 Illustration of triple lock and fair pensions lock 69

Acknowledgements
We would like to thank Chris Goulden for guidance and comments on the draft of this
review. We are grateful to Andrew Harrop, Emran Mian, Matthew Oakley, Paul
Spicker and Sanne Velthius for their comments and contributions in a discussion on
an interim draft, which helped us greatly to improve the focus and presentation of the
review. Thanks also to Fran Bennett for comments on an early draft.


1
Centre for Research in Social Policy
PART I GENERAL ISSUES AND INTERNATIONAL EVIDENCE
Chapter 1 Introduction The state plays a central part in strategies to tackle poverty, both through the direct
transfer of income and by offering services that help low income households improve
their lives. Public resources can help households escape poverty, either through the
direct transfer of income or by offering services that help low income households.
But how closely should income transfers and state services be targeted on the
poorest groups? This creates a big dilemma.
Restricting support to those suffering poverty carries several risks. It can stigmatise
recipients, making them feel shame over coming to the state for help, or
discouraging them from doing so. It can create perverse disincentives to earn
additional income, and a ‘poverty trap’ for those who do so and lose benefits. It can
create ‘ghetto services’ that become poorly funded because most taxpayers and
voters have no stake in them as recipients.
On the other hand, transfers and services that are available to people regardless of
income may be spread too thinly to provide sufficient help for those most in need.
This consideration is particularly important at a time when public resources are so
highly constrained, and there is a desire to ensure that each pound is well spent.
Fully ‘universal’ provision such as free health care is especially expensive, but in
many cases retains solid public support. Cash benefits are all targeted to some
degree, if only to certain demographic groups (e.g. Child Benefit). However, where
only a small minority of the target group are in poverty, the anti-poverty potential may
be weak.
There is no simple solution to this dilemma. Social spending remains a compromise
between the targeting of the most needy, the avoidance of low take-up, stigma and
disincentives, and the inclusion in some respects of middle-class taxpayers in state
provision. This produces a ‘mixed economy’, in which some things that the state
provides (such as compulsory education) are available regardless of income, while

2
Means testing or Universalism
others (such as safety-net benefits, available for people not supported by other
means) are by definition means-tested.
This review compares the effectiveness of more means-tested or selective measures
to more universal measures in tackling poverty. This is not a clear-cut dichotomy.
Some measures not explicitly directed to low income groups are nevertheless
targeted in a way that benefit such groups disproportionately, including for example
benefits for disabled people, whose risk of financial hardship without help from the
state is high. While the core distinction made here is whether policies are selectively
directed to people on low incomes, this is set in a continuum of policies according to
the extent to which their benefits are concentrated on such groups.
The review starts in Chapter 2 by looking at international evidence on the extent to
which universal or selective social security systems have been more effective at
improving the incomes of the most needy groups, and at where the UK fits into this
picture. Part II then looks at five particular issues in the UK where this debate poses
particular challenges. Chapters 3 and 4 look at how the UK distributes money to
pensioners and children respectively, compares the effectiveness of universal and
means-tested mechanisms for doing so and compares the UK approach with those
adopted by selected other countries. The next two chapters look at different types of
measures to improve life chances (Chapter 5) and to compensate people for
disability and provide for care needs (Chapter 6), widening the discussion to include
the provision of services not just income transfers, and again comparing means-
tested/targeted and universal approaches. Chapter 7 looks specifically at the issue
of take-up of means-tested benefits and the potential scope for improving it in
different cases. Chapter 8 draws conclusions, suggesting ways in which difficult
choices over how far to means-test might be approached in a strategy against
poverty.

3
Centre for Research in Social Policy
In interpreting this review, it is important to note two main aspects of its scope and
limitations, and the implications of these for its conclusions:
(i) The review comments on a broad range of policies through the prism of their
effect on poverty, even though many of these policies have much broader aims.
For example, money spent on education aims in part to give opportunities to all
children and in part to help overcome disadvantages of those growing up in
poverty. A policy that gave, say, twice the level of funding to these children
might make a significant contribution to tackling poverty, but could also
potentially undermine the quality of education for non-poor children. In this
sense, the development of an anti-poverty strategy is likely to be constrained by
other government objectives.
Similarly, in the case of income transfer policies, the pure ‘anti-poverty’ effects
on which this paper concentrates need to be considered in the context of a
wider objective of helping people on low to middle incomes. For example, in
the setting of in-work benefits and income tax threshold, the government seeks
not just to transfer money to people in poverty but to provide incentives and
rewards to working people on low to middle incomes who are above the poverty
line. This support has become especially important at a time when people with
incomes between the median and the poverty line have found it increasingly
difficult to make ends meet as a result of falling real household incomes.
(ii) The review makes some calculations of specific effects of policies on poverty
levels which are ‘static’ rather than ‘dynamic’. They look at the direct effect of
income transfers, not taking account of how they may change opportunities and
behaviours. Full dynamic modelling of policy impacts is beyond the scope of
the review. However, it does not seek to minimise the importance of policies
that improve people’s ability to find routes out of poverty. Chapter 5 for
example addresses life chances, and Chapter 6 suggests that universal
benefits available to a group with generally low incomes i.e. disabled people,
can help provide a stable baseline which enhances their ability to improve their
lives over the long term. Nevertheless, evidence in Chapter 2 suggests that in
practice, systems that target help to people on low incomes are associated with
lower poverty rates relative to the overall distribution of market income, and it

4
Means testing or Universalism
would be risky to assume that changes in the welfare system will shift the
market distribution decisively. Hence, the direct effect of policies on poverty
rates must be considered important as part of an anti-poverty strategy, even
though they do not give the whole picture.

5
Centre for Research in Social Policy
Chapter 2 Have Universal or Selective Systems Been More Effective at Tackling Poverty, and How Does the UK Compare to Other Countries?
Universalism vs. selectivism: the international evidence All advanced welfare states use a mix of ‘universal’, means-tested and other
targeted programmes to meet particular needs of their citizens, but the balance
between these approaches varies considerably. Scholars and policy practitioners
have long debated which approach is more effective in reducing poverty. The
debate has produced no single clear-cut conclusion, but has helped to identify
strengths and weaknesses of each approach.
Classifications of programmes according to whether they are ‘universal’, ‘targeted’,
‘selective’ or ‘means-tested’ are varied and sometimes distracting. For simplicity, the
central terminological division used in this paper, as in much of the comparative
international literature, is between programmes that are ‘selective’ by explicitly
directing resources to households on low incomes and ‘universal’ in the sense that
they are available regardless of household resource. However, it is also important to
distinguish between programmes that effectively target resources on the basis of
features other than household means (including all the so-called ‘universal’ income
transfer programmes). This includes benefits going to people with particular
demographic characteristics, either unconditionally or based on insurance
contributions (e.g. winter fuel allowance; state retirement pension); benefits directed
to people with certain needs regardless of means (e.g. Disability Living Allowance);
and insurance benefits triggered by a contingency experienced by individuals who
have made contributions, regardless of household means (e.g. contributions-based
JSA). While none of these are means-tested, the last category is far more likely to
help people at risk of poverty than the first.
A working paper associated with this review (Gugushvili and Hirsch, 2014) sets out
in detail the complex evidence that arises from the debate about means-tested and
universal benefits, and how it has developed over the past two decades. The
following is a summary of what it has found.

6
Means testing or Universalism
Main advantages and disadvantages of means-testing and universalism First of all, the evidence confirms that both means-tested and universal benefits have
potential serious drawbacks. These have been well rehearsed. One of the primary
defects of means-testing is the stigma it can entail (Titmuss, 1968; Sen, 1995;
Rothstein, 2001; Stuber and Schlesinger, 2006). In western societies, where self-
sufficiency and individual responsibility are highly valued personal qualities, coming
forward for public assistance suggests conceding individual failure (van Oorschot,
2002). This stigma, together with complex and invasive procedures that means-
testing often entails, discourages many potential beneficiaries from applying (Sen,
1995; Mkadawire, 2005), which helps explain low take-up (see Chapter 7). Means-
testing can involve high administrative costs. It can also produce serious work
disincentives and create poverty traps (Bradshaw, 2011). Means-tested support in
old age could deter people from saving for pensions, creating a ‘moral hazard’ (i.e.
an external form of protection that creates a perverse disincentive not to protect
oneself). However, such disincentives are less likely to affect behaviour than the
more immediate effect of work disincentives, including those that sharply ‘taper’
support as earnings rise and therefore deter additional hours of work. Furthermore,
it has been argued that means-testing undermines core objectives of a welfare state:
social integration, justice and overcoming dependency (van Oorschot, 2002).
While universal and contributory benefits avoid many of the problems inherent in
means-tested schemes, they naturally cost more and are not specifically targeted on
those most in need. Universalist approaches account for most of the massively
expanded social spending in advanced welfare states, which in turn may have
negative effects on their global competitiveness. Moreover, not only do universal
schemes by definition allocate more to the non-poor majority than the poor minority,
but they sometimes actually pay more on average per person to better-off
households. Sometimes this can occur because delivery or usage is not evenly
distributed, with better-off groups being more adept at accessing them. Regressive
consequences can also arise from earnings-related contributory benefits which might
to some extent be redistributive because of caps on payment levels, but whose main
effect is to pre-empt a large amount of social transfers in ‘horizontal redistribution’:
payments linked to life cycle stages or events rather than distribution from rich to
poor groups. Those with unstable employment records may be excluded. In the UK,

7
Centre for Research in Social Policy
where the main emphasis is on flat-rate benefits, the proportionate value to lower
income groups tends to be greater. However, in the case of pensions, better-off
groups gain more overall because they have longer life expectancy. Services to may
disproportionately benefit higher income groups, especially those with selective
access such as higher education. However, following an early finding by Le Grand
(1982) that public expenditure tends to favour better-off groups, a later study on the
distribution of the ‘social wage’ (Sefton, 2002) concluded that it is pro-poor overall.
Thus from the point of view of policy effectiveness, neither universalism nor means-
testing is always an ideal solution. But alongside these considerations, political considerations are also crucial. Despite a common perception of public spending
as mainly supporting a ‘welfare culture’ among the least well off, the vast majority of
public expenditure pays for ‘universal’ services, in the sense of not targeting people
with low incomes. A central assumption of supporters of welfare states in the post-
war years is that this primarily universal character underpins their legitimacy:
‘benefits meant exclusively for the poor often end up being poor benefits’ (Sen,
1995). In this context, means-testing or selectivity is traditionally seen as attractive
to the political right who wish to limit the overall size of the state and promote
individual responsibility. Yet as the need to keep public spending within defined
bounds has become more widely accepted, it is today sometimes the political left
who support a focus on the most needy groups in the name of fairness.
The context of the debate is also influenced by public opinion. In the UK in recent
years, this has not very clearly pointed to either a more selective or a more universal
approach across the board. On the one hand, the public is critical of some
measures that appear to ‘waste’ public money on transfers to people who do not
need them; on the other, they can be critical of means-tested help that might deter
effort, and protective of some benefits that give a stake in the welfare system to a
wide section of the population. Public attitudes are explored further in Chapter 7.

8
Means testing or Universalism
Evidence of relationships between selectivity and impact on low income groups It is in this context that a range of international studies since the 1990s have
considered the extent to which welfare regimes with different degrees of selectivity
and universalism have had a redistributive impact, especially towards low income
groups. The seminal study was carried out by Korpi and Palme (1998) and
appeared to show that universal approaches were associated, not only with more
public spending but a greater redistributive effect. Similarly, assessing the effects of
different social policies on single-mother poverty, Brady and Burroway (2012) found
that universal policies were considerably more effective than the targeted ones.
However, studies using more recent data (notably Kenworthy, 2011; Whiteford,
2008; Marx et al., 2013) have come to different conclusions: partly because they
considered a wider range of countries, partly because the relationship may have
changed as targeting becomes more important within constrained budgets, and
partly because more recent studies have distinguished in greater detail the extent to
which redistribution benefits households in poverty, rather than just summing the
overall redistributive effect.
The relationship identified by Korpi and Palme provides a good explanation about
how more redistribution can be achieved through less emphasis on targeting. They
found that the political support engendered by universal regimes resulted not just in
greater social spending, but in greater redistribution as a spin-off effect. Across 11
countries, they found a very strong positive correlation between the amount spent on
social transfers and the effect this spending had on income distribution, showing that
it does not simply recycle money within income groups. Sweden and the
Netherlands were much less targeted in these policies than Australia, the U.S.A. and
Switzerland, but achieved more redistribution because the budgets were so much
higher. One factor in this is that the middle classes in the second set of countries not
only were less willing to pay taxes for schemes mainly benefitting poorer groups, but
where possible they opted out of them and set up their own private arrangements.
This does not, however, mean that simply increasing spending overall will bring big
redistributive gains, since many existing programmes in less redistributive countries
are not structured progressively (Cantillon et al., 2003). Perhaps more importantly to

9
Centre for Research in Social Policy
the contemporary context of fiscal austerity, the resilience of programmes to cuts can
depend on the particular circumstances and traditions in each country. Nelson
(2007) found that overall, universal benefits such as social insurance were more
resistant to cuts than the main safety-net benefits (such as Income Support) from the
mid 1990s. However, he acknowledged that this does not take account of changes
in other means-tested benefits such as housing benefits and tax credits, which in
some countries like the UK have expanded greatly, partly to fill the breach left by
cuts in the level and coverage of other forms of support. Kenworthy (2011) looked
over a longer period than Nelson and found no systematic link between universalism
and changes in generosity. He also found, importantly, that a significant shift
towards universalism does not necessarily lead to more redistribution (as, for
example, through earnings-related pensions and tax credits becoming more
important for middle class families in the United States). On the other hand,
increasing targeting has made the Danish welfare system more redistributive. He
suggested that whereas a well-entrenched universal system can have valuable spin-
off effects for poorer groups by making state income transfers more acceptable, the
same could not readily be achieved by introducing new, more universal programmes
in countries that were previously relatively selective. This partly reflects the fact that
each country’s institutions and policy design reflect and also reinforce that country’s
values, so a country without a strong existing sense of shared participation in a
welfare state will not necessarily create it simply by introducing some programmes
from which the non-poor benefit. It also reflects the fact that budget constraints may
in practice prevent new universal policies from being associated with an overall
expansion of resources.
Moreover, the overall conclusion of Korpi and Palme that universal systems are
better at alleviating poverty because they bring greater redistribution overall, is
looking hard to sustain in light of more recent evidence looking at a wider range of
countries over a longer period, including the 15 years since the original study was
published. Two aspects of this are (1) that smaller but more targeted programmes
can have at least as much redistributive effect and (2) that greater selectivity based
on income can ensure that more of this redistribution is in favour of the poorest
groups. Specifically, two important recent studies looking at 28 (Whiteford, 2008)
and 25 (Marx et al., 2013) OECD countries respectively, show that:

10
Means testing or Universalism
• Widening the range of countries studied shows systems like the UK and
Australia, which adopt a relatively targeted approach, to be relatively effective
at redistribution. While some north European and especially Nordic countries
manage to have universal systems that are also highly redistributive, a number
of southern European countries have high social spending that is poorly
targeted and thus has weak distributional impact. This demonstrates the
riskiness of assuming that adopting greater universalism would create similar
outcomes to those achieved in Nordic cultures where it has worked best in
reducing poverty.
• In general, the evidence suggests that the more that is spent on social
programmes, the less progressively it is redistributed.
• In general, cash benefits for working age people are distributed more
progressively than those for pensioners.
• The countries distributing most to the poorest households (rather than across
other parts of the income distribution) are Australia, Denmark, New Zealand
and the UK, all of which rely heavily on means testing. One contributor to this
result is the inclusion of taxation in the picture: Scandinavian countries transfer
substantial amounts to low income groups, but also tax them more than other
countries.
• Means-tested programmes have been playing a growing role in OECD
countries, in particular by being offered to working and not just out of work
families in order to reduce work disincentives. This has made them more
important as a redistributive mechanism.
How does the UK compare with other welfare states? In the light of these findings it is interesting to explore how the UK compares with the
rest of advanced welfare states in three important aspects: the size of redistributive
budget, the level of targeting and the achieved reduction in poverty.
On the first dimension the UK scores below the average. According to Whiteford
(2008), cash benefits accounted for 14.5 per cent of an average British household’s
disposable income, while the OECD average was 21.9 per cent. Also, in Marx and

11
Centre for Research in Social Policy
colleagues’ analysis, Britain scored one of the lowest in social transfers as a
percentage of gross income.
While total spending on transfers is thus relatively low, Britain is quite successful in
targeting it on poor households. Whiteford identified the British system as one of the
most progressive in both transfer provision and taxation. As a result of this the UK
achieved the same level of redistribution (measured as the effect on income
inequality) as Germany, where social transfers constitute almost twice as high a
share of households’ disposable income (28.2 per cent). In his analysis the U.K.
was also among the leaders in targeting resources at poor households as 31 per
cent of all transfers went to the bottom quintile. Marx and colleagues pointed out
that British social assistance transfers accounted for more than half of this high
distributional effect.
The relative effectiveness of redistribution in Britain can also be seen in terms of its
effect on the poverty rate. Before government intervention, it is very close to the
OECD average (OECD, 2013). According to Smeeding’s (2005) analysis, the British
welfare system reduced relative poverty (measured against 50 per cent of median
income) from 31.8 to 12.3 per cent (p. 974). This was much higher than the average
of the eight OECD countries included in the sample. Maitre and colleagues (2005)
showed that social transfers lifted 43 per cent of poor households from poverty. This
was higher than in southern European countries and Germany, but considerably
lower than in Scandinavian and several continental European countries. According
to the latest OECD (2011a) data, in 2010 taxes and transfers halved the relative
poverty rate (measured against 60 per cent of median income) from 35.4 to 17.2 per
cent.
Table 1 considers the poverty-reduction effect of the British tax and benefits system,
using the bottom quintile group by household income to represent the group at risk of
poverty. It shows that the system is progressive by reducing the ratio of other
groups to the bottom quintile from seven-to-one to below three-to-one. But it also
shows that this differs between contributory benefits, which pay a close-to-average
amount to poor households, and non-contributory ones, from which poorer groups
gain more. Even the contributory benefits help reduce the gap in relative terms. The

12
Means testing or Universalism
inequality is further reduced by direct taxes, as non-poor families pay seven times as
much, and twice as much as a proportion of their income.
Table 1 The average value of cash transfers received by different income groups, 2010/2011, £
Bottom quintile Other quintiles Average
Absolute
% of gross
income Absolute
% of gross
income Absolute
% of gross
income Market income1 5065 41.1% 38853 87.8% 32096 84.8% Contributory transfers2 2882 23.4% 2884 6.5% 2882 7.6% Non-contributory transfers3 4387 35.6% 2498 5.6% 2877 7.6% Gross income 12334 100.0% 44235 100.0% 37855 100.0% Direct taxes 1269 10.3% 8978 20.3% 7436 19.6% Disposable income 11065 89.7% 35257 79.7% 30419 80.4%
Source: ONS (2013)
The ONS data also allows us to compare the average value of different transfers and
to what extent they are weighted toward poor households (Figure 1). All four means-
tested programmes - Income Support/Pension Credit, Housing benefit, income-
based Job Seeker’s Allowance and tax credits - are clearly pro-poor. Particularly
important are housing benefits and tax credits, each accounting for nearly ten per
cent of poor households’ disposable incomes. The three main transfers in Figure 1
that are not income-tested show different patterns. Child Benefit and the state
pension pay similar average amounts, in absolute terms, to poor and non-poor
households. But Incapacity Benefit paid on average twice as much to the former
1 This also includes private pensions. 2 These include: state pensions; contribution-based job seeker’s allowance; incapacity benefit; widow’s benefits; and statutory maternity pay/allowance. 3 These include: income support and pension credit; child benefit; housing benefit; income-based job seeker’s allowance; carer’s allowance; attendance allowance; disability living allowance; war pensions; severe disablement allowance; industrial injury disablement benefit; student support; government training schemes; tax credits; and other non-contributory benefits.

13
Centre for Research in Social Policy
than to the latter, reflecting the fact that it goes to individuals who are not working -
although some may have high household income from other sources.
Figure 1 The average values of selected cash transfers, 2010/2011, £. Note: This shows the average value of each benefit to every household in the relevant income quintile, not just those receiving the benefit.
Source: ONS (2013)
Furthermore, the data also confirms Sefton’s findings noted above: both the NHS
and education services are progressive. However, in case of NHS, the second and
the third quintiles benefit more than the bottom one (Figure 2).
Figure 2 The average values of health and education services, 2010/2011, £
Source: ONS (2013)
0
500
1000
1500
2000
2500
3000
Statepension
Incapacitybenefit
Incomesupport
andpensioncredit
Childbenefit
Housingbenefit
Jobseeker's
allowance
Disabilityallowance
Tax credits
Bottom quintile
Other quintiles
3089 3011 3017 2643 2048
2762
4114 4382 4385 3984 3461
4065
0500
100015002000250030003500400045005000
Bottom quintile 2nd quintile 3rd quintile 4th quintile Top quintile Average
Education National health service

14
Means testing or Universalism
Summary of main findings The international evidence produces several overall conclusions. First, despite the
considerable volume of up-to-date research, the universal vs. means-tested debate
is far from resolved. Recent studies appear to suggest that any positive correlation
between the universal systems, larger spending and higher redistribution may not
hold true, if it ever did. Later studies have included more countries and the effect of
taxation. Over time, stricter conditionalities and expanding coverage to incorporate
low-earners has improved the reputation and more importantly the funding of means-
tested programmes. Thus, simply lobbying for more universal measures may not
yield the anticipated progress in reducing poverty.
Just as important is the variation in how the relationship works out in different
countries, in ways that do not follow simple patterns by welfare regime types. While
Nordic countries are clearly more effective than other countries with a similar level of
social spending, in almost every study two countries stand out as particularly
successful in redistribution - Australia and Denmark - which are complete opposites
according to major taxonomies of welfare regimes. Denmark is one of the most and
Australia one of the least generous regimes. Yet both make extensive use of
means-testing, suggesting that the level of targeting is no less important than the
size of redistributive budget. This also explains why the UK achieves almost the
same level of redistribution and is more effective in reducing poverty than Germany,
which has considerably larger spending.
Within countries, any attempt to lower poverty by increasing spending depends to a
large extent on the redistributional profile of the programme chosen. Selective
transfers such as safety-net benefits are unsurprisingly the most effective in this
regard, despite their limitations, and the high use of these by the UK helps explain
why it is a medium performer in reducing poverty despite having a smaller than
average redistributive budget. Another contributing factor is the UK’s extensive use
of housing benefits and tax credits, each of which accounts for almost ten per cent of
the bottom quintile’s disposable income. So despite all the disadvantages
associated with the heavy use of means-testing in the United Kingdom, its significant
contribution to poverty reduction cannot be neglected.

15
Centre for Research in Social Policy
PART II FIVE CHALLENGES FOR THE UK
The perspective of how targeted the welfare state should be, according to people’s
means, could be applied to almost every corner of social policy. The following
chapters select five important areas where the debate is played out: income
payments to pensioners, income payments to families with children, promotion of life
chance, payments to compensate for disability or care needs and benefits take-up.
Chapter 3 The Respective Contributions of the State Pension and Pension Credit in Addressing Pensioner Poverty
A key policy choice in the UK is whether the state should provide a basic pension
high enough to lift all its recipients out of poverty, or conversely focus resources
more on means-tested poverty relief, with recipients of occupational or private
pensions getting less from the state. The following discussion is centred on this
choice. It assumes that eligibility for the state pension remains contingent on
contributions, so that some non-eligible groups would still need additional means-
tested help even with a higher pension level. A switch to a fully universal entitlement
based on citizenship or residence would raise similar issues of whether it is
affordable to pay a non-means-tested pension that is high enough on its own to get
people out of poverty.
Historically, British pensioners have been more vulnerable to poverty than working-
age adults or children. As discussed in Chapter 4, child poverty overtook pensioner
poverty in the 1980s, but as recently as 1998/99, 29 per cent of pensioners lived on
less than 60 per cent of equivalised median income, compared to 19 per cent of
working age adults (Table 1). This difference started to reverse at the beginning of
the 2000s as pensioner poverty started to decrease steadily, while working-age adult
poverty stagnated, and then increased by three percentage points. Hence since
2004/05 pensioners have faced a lower risk of relative poverty than the working-age
people. Moreover, pensioner poverty reached the lowest rate on record at 14 per
cent AHC in 2010/11 (DWP, 2013). Because pensioner incomes depend on social
transfers more than the incomes of any other age group, the changes in the

16
Means testing or Universalism
coverage and level of cash benefits have played a big role in reducing pensioner
poverty.
Figure 3 Risk of poverty after housing costs, 1979-2012
Source: DWP (2013a)
Similar to other advanced welfare states, the U.K. provides retired people with
various different cash transfers in order to smooth their consumption across lifetime,
but more importantly to protect them from falling into poverty when they are no
longer able to work. The primary mechanism is the Basic State Pension (BSP), a
flat-rate benefit payable to retired individuals. To qualify for the full amount of BSP
(£110.15 a week in 2012/13) individuals need to have 30 years record of paying
National Insurance Contributions (NICs). Alternatively, some people can build up
their contribution record through nominal ‘credits’, which are awarded to those
unable to work because of illness, maternity, caring responsibilities and the
unemployed who are actively looking for work (ONS, 2011). Individuals with fewer
qualifying years receive a smaller amount of BSP in proportion to the number of
qualifying years they have accrued. In addition to BSP, until 2012/13 employees had
an option of making voluntary contributions to the earnings-related State Second
Pension (S2P) scheme or opting out for occupational or private schemes.
As shown in Chapter 8, the take-up of BSP is almost universal at 97 per cent, and
over 90 per cent of both men and women above pension age have at least some
0%5%
10%15%20%25%30%35%40%45%
Children
Working-age adults
Pensioners

17
Centre for Research in Social Policy
entitlement. However, because of the contribution requirements not all beneficiaries
get the full amount of the transfer. This is particularly the case with women: in 2010
only 48 per cent of female pensioners received the full amount of BSP compared to
87 per cent of male pensioners (ONS, 2011, p. 5-5). To ensure a minimum floor
beyond which no pensioner should fall, in 2003 the government replaced the
Minimum Income Guarantee (a means-tested transfer for all age groups with an
income below a certain threshold) for those aged 60 or above with a new benefit -
Pension Credit. This means-tested transfer has two components. The Guarantee
Credit tops up pensioners’ incomes to a pre-specified minimum weekly level
(£137.35 for a single person and £209.70 for a couple in 2011/12). Pensioners with
only the state pension have income capped at that level. Those with additional
pension effectively face a ‘taper’ of 40 per cent: the Guarantee Credit is withdrawn
pound for pound against the additional income, but a Savings Credit worth 60 per
cent of additional income is paid up to the point where the Guarantee Credit runs
out, after which the Savings Credit is withdrawn at 40 per cent. It is estimated that
45 per cent of all pensioners are eligible for at least one of the components of the
Pension Credit (Thurley, 2013). As a result of their lower pension age, but also due
to their lower chance of receiving the full amount of BSP and longer life expectancy,
in 2011/12 there were three times as many single women pensioners receiving one
or both components of Pension Credit (1.5 million) than single males (0.6 million)
(ONS, 2011).
The overall spending on transfers for pensioners was £85 billion in 2011/12,
corresponding to 42 per cent of total expenditure on cash benefits and tax credits in
Great Britain (Table 2). Compared to other OECD countries the U.K. spends a
smaller proportion of its GDP on public pensions (6.2 per cent vs. 7.8 per cent), but
has a larger proportion paid out in private pensions (3.3 per cent vs. 2.1 per cent).

18
Means testing or Universalism
Table 2 Expenditure on transfers for people over pension age, Great Britain, 2011/12
Transfer type Expenditure (million £)
% of total expenditure on cash benefits
% of spending on pensioners
Basic state pension 58,095 28.91% 68.3% Second state pension 16,124 8.02% 19.0% Pension credit 8,068 4.01% 9.5% Winter fuel payment 2,146 1.07% 2.5% TV licences for people over 75 578 0.29% 0.7% Total 85,011 42.30% 100.0%
Source: Browne and Hood (2012, p. 5).
Similar to other cash transfers, indexation plays a big role in determining both
absolute and relative values of transfers for pensioners. Historically, BSP has
usually been uprated in line with either inflation (CPI or RPI) or earnings. The choice
of indexation basis is particularly important as over the past decades earnings in
general have risen at a faster pace than inflation. For the long period between 1981
to 2011 BSP has been indexed in line with inflation, therefore its value relative to
earnings has declined, driving many pensioners into relative poverty (PPI, 2011). In
contrast, the income level guaranteed by the means test has since 1997 (with the
introduction of the Minimum Income Guarantee, later the guarantee element of
Pension Credit) been raised at least in line with earnings, and faster at the start of
this period, causing a widening gap between this guarantee level and the basic
pension. During this period, therefore, the basic pension rose more slowly than
median income, but the guaranteed pensioner income level rose faster, contributing
to the fall in relative pensioner poverty.
The most important question for our analysis is how effective the Pension Credit has
been in reducing poverty and what the effect would be if the additional spending
allocated for it were simply used for increasing the BSP. The answer is not
unequivocal. On the one hand, as set out in Chapter 8, one-third of eligible people
are not claiming Pension Credit for a number of reasons. These people would
clearly be better-off if the Pension Credit budget was simply added to the BSP
budget. However, a simple calculation illustrates that the net effect on poverty would
be negative. In November 2012 there were 12.83 million pensioners, 2.49 million of

19
Centre for Research in Social Policy
whom received Pension Credits in the average amount of £56.73 (DWP, 2013b). If
Pension Credit spending was added to the BSP budget, an average pensioner would
receive an additional £11 a week. Hence approximately 1.25 million pensioners,
entitled to, but not claiming Pension Credit, would be £11 a week better-off, but 2.49
million current recipients of Pension Credit would see a net average loss of £45.73 a
week, deriving both from the lower level of the state pension than the pension credit
guarantee level and from the substantial numbers not entitled to a full state pension.
Estimating the possible effect of this scenario would require modelling using
representative microdata, but given that twice as big a group would experience four
times as great a loss than the gain experienced by the smaller group, it seems
reasonable to expect that overall pensioner poverty and poverty gap would increase.
Moreover, commentators agree that this transfer is a crucial factor contributing to the
decrease in pensioner poverty (PPI, 2011).
It is anticipated that the coalition government’s pension reforms will radically
transform the existing system in the medium to longer term (DWP, 2013c). These
will also render the Pension Credit somewhat less important in terms of reducing
pensioner poverty. The main change is the replacement of BSP and S2P with a
single flat-rate pension in April 2016. This single-tier pension will be set above the
basic level of means-tested support and indexed by the ‘triple-lock’ rule: each year
its value will be increased by the highest of earnings growth, price inflation, or 2.5
per cent. Higher value of the pension will automatically reduce the number of people
who will require top-up through Pension Credits. The DWP estimates that once the
single-tier pension system is implemented, the share of pensioners eligible for
Pension Credit will drop to below 10 per cent. Also, the Savings Credit component is
planned to be abolished. Nevertheless, the future importance of Pension Credits
should not be underestimated: it will continue to be an important safeguard for many
pensioners during the transition period to full implementation of the single-tier
pension. The DWP estimates (2013c) that over 10 per cent of pensioners will still be
eligible until around 2040, before stabilising somewhat below that level.
Finally, we should note that the enhanced generosity of old-age pensions will come
at the cost of raising the state pension age; therefore many older low-income
individuals, whose eligibility for state pension will be postponed as a result of the

20
Means testing or Universalism
reform, will have to rely on less generous Income Support and other working-age
benefits. An examination of the Family Resources Survey shows that poverty rates
for men aged 60-64 are significantly higher aged 60-64 than aged 65-69: 17 per cent
rather than 11 per cent in 2011/12. For women, whose pension age is still lower, it
was 15 per cent aged 55-59 and 11 per cent aged 60-64. From this it may be
estimated that delaying a pension for 65 year olds would cause at least six per cent
of them to be in poverty for an additional year, unless older people’s employment
patterns change significantly (this is a conservative estimate given that employment
rates by that age could be expected, even with a raised pension age, to be lower
than on average for men aged 60-64). This works out at 40,000 or more extra
people in poverty for each year that the pension age is increased. This is a small
number relative to pensioner poverty overall (just under two million) and compared to
the number whose pensions are being increased through the reforms. However, it is
important for policy not to neglect these effects, and to consider both the support
given to help people stay in the workforce longer (particularly those with lower skills
who are most at risk) and whether those unable to do so should be given more
adequate safety-net benefits than are presently available to working-age claimants,
at less than half the level of the safety net for pensioners.
Comparison with New Zealand and Denmark The experience of other advanced welfare states in addressing poverty in old age
through different cash benefits can provide some useful insights into the relative
merits of universal and means-tested old-age transfers. While even a general
overview of OECD countries’ pension systems and their effect on poverty is clearly
beyond the scope of this paper, we explore the Danish and New Zealand systems,
as these are particularly relevant for the purpose of our analysis. The existing British
pension system shares some important similarities with the Danish system, while the
coalition government reforms will gradually render it quite similar to that of New
Zealand.
The Danish pension system comprises multiple pillars (Guardiancich, 2010). The
public pension (folkepension) is made up of two components: a flat-rate basic
pension, based on residency but subject to an affluence test, and a means-tested
pension supplement. Eligibility for the full amount of basic pension (DKK 5,254 in

21
Centre for Research in Social Policy
2009, equal to 17 per cent of average earnings) requires 40 years of residence;
those with fewer years of residence get proportionately smaller amounts. In contrast
to British BSP, the Danish basic pension is reduced for people of pension age who
are still working with earnings (above DKK 259,700, (approximately three quarters of
average earnings), at a rate of 30 per cent of the excess income. The maximum
amount of pension supplement is slightly larger than the basic pension (DKK 5,289
for singles and 2,470 for couples); it is also withdrawn at a rate of 30 per cent of
excess income once income is above DKK 57,300. Both components of the public
pension are indexed in line with wages, but when the increase is more than two per
cent, 0.3 per cent is transferred to a fund used for increasing other cash transfers. In
addition to the public pension, employees are required to participate in a mandatory
defined-contribution scheme, co-funded by employers and agreed between social
partners. Furthermore, there are quasi-mandatory occupational fully funded
schemes, also agreed by social partners which cover the vast majority of Danish
employed. All old-age transfers are taxed, hence the public spending figure for
pensions may overestimate the state efforts in old-age provision.
The New Zealand pension system is the most ‘pure’ model among the OECD
countries in the sense that public provision consists only of a universal, flat-rate,
single tier (New Zealand Superannuation, NZS) (OECD, 2011b). The eligibility
criterion is very liberal: to qualify for the benefit individuals require ten years’
residency since the age of 20. The benefit is uprated based on increase in prices,
but the actual amount has to be between 65 and 72 per cent of average net-of tax
earnings. Therefore, if the increase in prices consistently lags behind the increase of
average earnings, the pension is indexed in line with the latter.
Each of these pension systems has certain merits and disadvantages which can be
assessed according to various criteria, but in this case we are mainly interested in to
what extent they protect the retired from poverty. Comparing the anti-poverty effects
of different pension systems requires complex modelling, because the actual
pensioner poverty rates depend on multiple macroeconomic and demographic
variables including the pre-transfer poverty rate and gap, the existing level of
inequality, the share of pensioners in population, the coverage and average level of
private pensions, the prevalence of multi-generation households, the average life

22
Means testing or Universalism
expectancy, and the access to social services, etc. But the large difference in
pensioner poverty rates indicates that the New Zealand system manages to address
serious pensioner poverty more thoroughly than its Danish and British counterparts,
ensuring that almost no pensioners are left below half median income (Table 3),
although a large proportion are clustered close to the poverty line (Koopman-Boyden
and Waldegrave, eds, 2009, p101). Moreover, it does so in a simple way, without
means-testing, and spending one per cent of GDP less than the other two countries.
The difference is even more pronounced in case of private expenditure on pensions,
confirming that adequate public provision crowds out the need for private provision.
It does need to be acknowledged that New Zealand has a considerable advantage
compared to Denmark and the U.K. as its proportion of pensioners in population is
several percentage points lower. However, this is almost exactly matched by the
difference in spending as a percentage of GDP: the proportion of pensioners in the
population is 29 per cent higher in the UK than in New Zealand, and the proportion of
national income spent on pensions is 30 per cent higher. A large part of the
explanation is that by spending less on other aspects of pensions, New Zealand can
afford to set a flat rate at an adequate level without having to spend more overall.
First, it has no second tier of pensions, in the form of earnings-related or
supplementary flat-rate pension such like the UK’s Second State pension, on which it
spends £16 billion, about 20 per cent of total spending on pensioners. Secondly, it
economises on administration because of its simplicity. Thirdly, there are no tax
subsidies for private pensions in New Zealand (although such subsidies in the UK
are not counted in the GDP comparison above). Fourthly, the fact that private
pensions sit on top of a more adequate public pension means that a greater share of
them than in the UK are subject to tax, and this brings in extra revenue. A final way
in which New Zealand economises (already reflected in the lower pensioner
population) is by having a pension age of 65 for both men and women – a measure
in the process of being implemented in the UK. The Danish system fails to achieve the same results because of the low level of
pension, which may be further reduced by the residency requirement and taxes.
Incomplete eligibility is also an issue in the British pension system, but as we earlier
saw a further important drawback here is the low take-up rates for the means-tested
23
Centre for Research in Social Policy
pension supplement. In addition, the value of basic state pensions as a proportion of
average earnings in both Denmark and the UK is much lower compared to New
Zealand. This demonstrates limitations in the extent to which means testing can
make up for a weak pension baseline.
Another important aspect is the sustainability of pension systems in the face of
declining fertility rates and rapidly ageing population, the trends which are universal
across developed nations. In this regard New Zealand is also projected to perform
well - New Zealand Superannuation Fund (2009) estimates that without any changes
the existing system will consume 5.6 per cent of GDP in 2030 and 6.6 per cent by
2050. The New Zealand government has taken an important precautionary measure
by setting up a Superannuation fund which invests money on the government’s
behalf in order to help pay part of the future increased expenditure. To achieve a
similar level of sustainability both Denmark and the U.K. are considerably increasing
the pension age.
To sum up, while pension systems involve difficult choices and there is no one
perfect system, the New Zealand example is helpful in showing that that truly
universal, flat-rate pensions set at a reasonable level have the potential to eliminate
pensioner poverty in a non-stigmatising manner and they can be sustainable. This is
good news, as in the long run the British system will become quite similar to it, with a
single tier pension worth above 60 per cent median income after housing costs.
However, we have argued earlier, the Pension Credit will continue to play an
important role in protecting pensioners from poverty. The fact that a higher universal
pension in New Zealand can be afforded with less spent as a proportion of GDP,
may rely partly on a lower pensioner caseload, but this variable is adjustable within
any one country through changes in the pension age.
The overall conclusion for the UK pension system is that even though, at present
levels of spending and pension age, it would not be possible to have the same
impact on poverty if means-testing were eliminated. The plan to reduce means-
testing greatly is feasible without either creating higher poverty or an unrealistically
high level of spending. This is not without its costs: perhaps the main one will be a
likely increase among those who will be below the pension age as a result of its

24
Means testing or Universalism
increase, which is needed to make the system affordable. However, in the context of
the demographic change that is causing pension ages to rise under all systems, this
‘older workers’ poverty’ issue is really a problem more appropriately solved through
employment and working-age benefits policy rather than through pensions.

25
Table 3 Main parameters of pension systems in the U.K., New Zealand and Denmark.
Country Public expenditure on pensions, % of
GDP (2009)
Private expenditure on
pensions spending, % of
GDP (2010)
Share of population over age 65
Pension age Basic/minimum/targeted
pension as a % of average earnings
Poverty among pensioners
(below 50% of median income)
U.K. 6.2% 3.3% 27.3% 61 for women, 66 for men, both to
be raised to 68 by 2046
14% 10.3%
New Zealand 4.7% 1.3% 21.2% 65 39% 1.5% Denmark 6.1% 4.5% 26.8% 65, to be raised
to 67 in 2024-27 17%
10.0%
Belgium 10.0% 2.9% 28.8% 65 27% 12.8% France 13.7% 0.4% 28.2% 60 23% 8.8% Germany 11.3% 0.2% 32.8% 65, to be
increased to 67 20% 8.4%
Italy 15.4% 0.2% 33.0% 60 for women, 65 for men
20% 12.8%
Netherlands 5.1% 4.0% 24.1% 65 29% 2.1% Sweden 8.2% 1.4% 30.2% 61 16% 6.2% USA 6.8% 2.9% 21.1% 66, to be
increased to 67 in 2022
19% 22.4%
OECD average 7.8% 2.1% 23.6% 62.9 for men, 61.8 for women
13.5%
Source: OECD (2011b)

26
Means testing or Universalism
Chapter 4 The Roles of Universal and Means-Tested Transfers to Families with Children
In the past, children tended to face a higher risk of poverty than working-age adults,
but their probability of being poor was much lower than that of pensioners. As
shown in Figure 3, this started to change in the 1980s, as child poverty dramatically
increased, influenced by a growth of single parenthood and of earnings inequalities
linked both to wage inequalities and to differences in the amount of work in each
family. As a result, since the early 1990s, children have become considerably more
vulnerable to poverty than the other two age groups. The difference in relation to
working-age adults has started to narrow since 1998/99 as child poverty (AHC)
decreased by seven percentage points, while working-age poverty stagnated before
increasing by three percentage points by 2011/12. Nevertheless, children are still
five percentage points more likely to live in poverty than working-age adults.
As with pensioner income provision, the U.K. uses a mix of universal and means-
tested transfers to provide financial support to families with children. The universal
component is Child Benefit paid at a rate of £20.30 a week for the first child and
£13.40 for each additional one. This rate has been frozen for three years between
2011/12 and 2013/14 (HMRC, n.d.a). In 2011/12 the total budget of the programme
was £12.20 billion (HMRC, 2012a). Until January 2013 Child Benefit was truly
universal as any family with a child was entitled to it regardless of income level.
However, the coalition government decided to reduce the level of benefit for
households where at least one member earns more than £50,000, and fully withdraw
it for those which contain a person earning over £60,000. This was justified by the
high costs of universal provision. The Treasury estimates that this restriction will
disqualify 1.20 million better-off families, thus saving the government around £1.50
billion in 2013/14 and £1.70 billion in 2014/15 (RevenueBenefits, n.d.).
The second component is tax credits introduced by the Labour government in
1998/99 with a twin objective of encouraging take-up of paid work and reducing
poverty by channelling more resources to low-income families (Brewer, 2007). In
their current form, Child Tax Credit (CTC) acts both as a children’s component of

27
Centre for Research in Social Policy
out-of-work benefits and, together with Working Tax Credit (WTC), as an in-work
income-based top-up. In 2011/12 the budget of CTC was £22.90 billion and £7
billion for WTC (HMRC, 2013). Despite the names and being administered by
HMRC, both programmes are in essence cash transfers for low-income families and
both are to be replaced by the Universal Credit in 2015. The CTC is made up of two
main elements and can be claimed by families with children, whether or not they
have an employed member, as long as their annual income is below a certain
threshold. The actual amount of benefit depends on the number of children and
family income: those with income below the threshold can get the full amount of each
element; above this threshold a taper rate of 41 per cent applies (HMRC, n.d.b).
WTC can be claimed by low-income individuals, whether or not they have children,
who meet minimum working hours requirements, but is tilted towards families with
children through higher disregards, a higher rate for lone parents than for single
people, lower hours requirements and the inclusion of a childcare element of up to
70 per cent of childcare costs up to certain limits.
Both pillars of the present income support for families with children face considerable
problems. Child Benefit has long been a popular and almost universally taken up
boost to family income, but as the government commitment to end child poverty
comes up against severe fiscal restraint, pressures to tax or means-test the benefit
have grown. The decision to do so, however modestly, from 2013 has shown up
some difficulties in producing a hybrid universal/means-tested benefit. The tax
system was considered to be the easiest and most transparent option for doing so.
However, what seemed like the simplest mechanism initially, disqualifying families
with at least one higher rate taxpayer from eligibility, was abandoned because it
would have created a ‘cliff edge’ and the incentive for people just within this category
to lower their earnings artificially (Brewer and Joyce, 2012). The decision instead to
taper away the benefit between earnings of £50,000 and £60,000 avoided the cliff-
edge but not a separate issue arising from the collision of a family entitlement with
individual tax assessment. This means that families with two people earning
£49,000 each will not be affected by the cut, while a family with a single earner with
£60,000 will lose its entitlement fully. (At this level of income, there are unlikely to be
implications for poverty reduction, but this highlights an issue that would be relevant
if tax-based means-testing were to be applied lower down the distribution.) The

28
Means testing or Universalism
conflict between individual and family assessment helps explain why ‘tax credits’
were never really linked into the tax system: they have been administered and
assessed like benefits. The new child benefit rules may also discourage lone
parents from moving in with or formalising their relationships with high earners, and
in some cases women may become financially less independent if their partners
encourage them to stop claiming the benefit in order to avoid the tax charge. There
are also administrative issues related to linking weekly benefits with annual earnings,
determining what constitutes a couple, dealing with the change of circumstances
throughout the year and so on. Finally, the government concedes that it will not be
able to completely monitor the compliance with the new rules, which will lead to an
estimated loss of £150 million a year (Brewer and Joyce, 2012).
One main problem with tax credits is incomplete take-up, especially in the case of
WTC, (see Chapter 7). Just as fundamental is the high effective marginal tax rates
experienced by people whose incomes are subject to the tax credit taper. In addition,
overpayments and fraud appear to be substantial, due to complex assessment and
HMRC’s lack of experience in administering cash transfers based on family
circumstances. The HMRC has estimated that from 2003/04 to 2006/07 it overpaid
£7 billion, of which £2.8 billion was not recoverable (Godwin and Lawson, 2009).
While the overall volume of overpayment has considerably decreased over time,
Godwin and Lawson consider that the HMRC’s target of limiting it to five per cent of
the programme budget is too optimistic. Indeed, HMRC’s latest figures show that in
2011/12 it again overpaid between £2.08 billion and £2.46 billion, corresponding to
7.5 per cent to 8.8 per cent of the final award by value (HMRC, 2012a).
Despite these considerable limitations of both components, we should emphasize
that compared to other welfare states the U.K. is much more generous in providing
direct financial support to families with children (although this may partly help
compensate lower subsidy to services, such as childcare, which in other countries
may therefore be cheaper than in the UK. With 2.43 per cent of GDP allocated for
child transfers, it scores the second only after Luxembourg among all OECD
countries (Adema, 2012). It is also among the few countries where the child benefits
package for minimum wage earners with two children exceeds 25 per cent of the
poverty line (60 per cent of median income) (van Mechelen and Bradshaw, 2013).

29
Centre for Research in Social Policy
Consequently, child benefits and tax credits have a substantial effect on poverty.
Analysing the causes of the decrease in child poverty since 1998/99, Mike Brewer
and colleagues (2010) have concluded that the Labour government’s tax and benefit
reforms, particularly the generous indexation of Child Tax Credit, have raised one
million children out of poverty; conversely, there would be 900,000 more children in
poverty if the transfers had simply been uprated in line with prices.
However, when comparing the two pillars, CTC appears to have a larger effect on
poverty than the child benefit. Jonathan Bradshaw (2011) estimates that child
poverty (AHC) would have been seven percentage points higher without Child
Benefit and ten percentage points higher without CTC. Comparing different options
for reducing child poverty by increasing transfers, Donald Hirsch (2006) showed that
channelling more resources through CTC was easily the most cost-effective fiscal
measure to reduce child poverty. He projected the possible outcomes of three
hypothetical scenarios: first, to increase the child element of CTC by almost half;
second, to raise Child Benefit for all children by £20 a week; third, to increase WTC
by £46 a week and an extra £62 a week for couples. The projections showed that
the increase in child benefit, while large enough to raise 1.1 million children out of
poverty, would cost three times as much (£12.50 billion) as the increase of CTC
(£4.20 billion), which would reduce child poverty by a similar amount (one million).
The third option was least cost-effective, as it would raise 0.70 million children from
poverty at a cost of £9.20 billion.
We can add to this analysis by modelling the potential effects of two scenarios: first,
if money that had been used in recent years to increase tax credits for children had
instead been used for increasing Child Benefit; and secondly, vice-versa, if the
money spent on Child Benefit was added to the amount of tax credits received by
families with children. We have examined the Family Resources Survey and made
the following calculations:
1) Since the introduction of Child Tax Credit in 2003, the child element of the
credit has been uprated at a significantly higher rate than Child Benefit. We
looked at what would have happened if instead, the CTC child element had
been uprated only at the rate that was actually applied to CB, and the savings
distributed through a higher Child Benefit. This would have increased CB by

30
Means testing or Universalism
about half the per-child reduction in CTC. Since many of the net losers would
be close to the poverty line, this would result in a net increase in child poverty
by about 100,000.
2) If on the other hand a wholly means-tested system were adopted and Child
Benefit were redistributed into Child Tax Credit, many families just below the
poverty line would have a significant boost in their incomes. This would result
in a cut in child poverty by about a quarter, or around 600,000.
Similar choices will be available under Universal Credit (UC), with respect to the
child element of its calculation, although for the present, both UC and CB are being
uprated at the same rate of one per cent a year.
These calculations do not provide an argument for abolishing Child Benefit, which
plays an important role in redistributing money to families to recognise the additional
cost of children, regardless of their means. The knowledge that the system is taking
account of people’s needs in this respect, whether or not they are in poverty,
contributes to wide public support for the system. Scenario 2 above would only be
an option if overall resources for children’s benefits remained the same, even though
most taxpayers were cut out of the system. This cannot be taken for granted.
However, the calculations do underline the importance of means-tested help in
tackling child poverty. Initiatives in the past 15 years to improve benefits for families
on low incomes have understandably focused on this mechanism rather than on
Child Benefit.
International comparison As in the case of pensions, cross-country comparative analysis can provide valuable
insights into the effectiveness of universal and means-tested transfers for families
with children. In this case we compare the UK with Denmark and the Czech
Republic, which occupy the opposite ends of the universal/means-tested continuum
in provision of financial support to families with children. Unlike pensions, Denmark
has a single universal child benefit, the level of which varies with the age (it is higher
for younger children), and relatively small additional transfers for specific vulnerable
categories (Blades, 2012). In contrast, the Czech Republic only provides means-

31
Centre for Research in Social Policy
tested child transfers and tax credits for low-income families (Salanauskaite and
Verbist, 2013). With its mix of semi-universal and means-tested transfers, the U.K.
lies between the two. Again, we are mainly interested in the effects of transfers on
child poverty, but we acknowledge that an accurate comparison must take account
of multiple variables, including the different levels of inequality and pre-transfer
poverty in these countries, the level of unemployment, the proportion of children in
the population, the prevalence of single-parent families, access to social services,
and so on. Moreover, differences in the distribution of pre-benefit income is a more
important variable for families with children than for pensioners, since for people of
working age, social transfers comprise a much smaller share of final income than for
those above pension age.
Judged solely by child poverty and deprivation rates, Denmark is the best performer
of the three, with 6.5 per cent of children living in households below 50 per cent of
median income and only 2.2 per cent experiencing material deprivation (measured
by a lack of at least two of the fourteen items considered essential by UNICEF)
(Table 2). What is more, Denmark achieves this while spending the smallest
proportion of its GDP on child transfers. However, we should note that the pre-
transfer child poverty rate is already quite low in this country, and that taxes and
transfers reduce it only by six per cent. In addition, the child poverty gap (difference
between the poverty line and the median incomes of those below the poverty line) in
Denmark is the fourth largest among 35 OECD and EU countries (UNICEF, 2012).
This implies that while the proportion of Danish children in poverty is small, these
children, whom the benefit cannot lift out of poverty, experience a deeper poverty
than their peers in other European countries. Relying on means-testing, the Czech
Republic achieves an almost similar child poverty rate, though admittedly with
considerably larger spending and a smaller child population. The effect of
government intervention is the most pronounced in the U.K.: the taxes and benefits
reduce child poverty by almost two thirds. This of course also reflects the fact that
pre-transfer child poverty is much higher in Britain than in the other two countries,
and that the U.K. is the second biggest spender on child transfers. Nevertheless,
this again confirms that child transfers protect a large proportion of British children
from falling into poverty.

32
Means testing or Universalism
Table 2 shows the experience of the UK, the Czech Republic and Denmark in the
context of that of other countries. The most important thing it shows is that original
distribution of income is at least as significant as the amount and style of
redistribution in determining the actual child poverty rate. Thus Sweden and
Denmark are able to use universal systems that have relatively low distributional
impact and still end up with low child poverty rates. In the case of children, relatively
little redistribution is necessary to achieve this result. However, they both do end up
with high child poverty gaps, showing that while the outcome works for most
children, those who are left behind have highly unfavourable outcomes.

33
Table 4 Effects of redistribution for child poverty
Country Spending on child
transfers, % of GDP
(2007)
Share of children
aged 0-14 in total
population
Child poverty
(below 50% of median income)
Child deprivation (lack of two
items)
Child poverty gap
(average depth of poverty)
Effects of transfers on per cent of children below 50% median benchmark)
Before transfers
After transfers
Effect on transfers
(%age points_
U.K. 2.43 18 12.1 5.5 18.8 33% 12.1% -20% Czech Republic
1.96 15 7.4 8.8 20.6 17.7% 7.4% -10%
Denmark 1.48 18 6.5 2.6 32.8 12.5% 6.5% - 6% Sweden 1.21 17 7.3 1.3 21.1 13% 7.3% - 6% France 2.01 18 8.8 10.1 15.0 19.4% 8.8% - 10% Ireland 2.22 22 8.4 4.9 12.9 41% 8.4% - 32% Spain 0.75 15 17.1 8.1 33.1 18.8% 17.1% - 2%
Source: UNICEF (2012); OECD (2011c); World Bank (2013).
34
Means testing or Universalism
Unlike the elderly, whose transfer incomes will markedly improve in the coming
years, families with children have had many aspects of their benefits reduced in real
terms by the coalition government’s tax and benefit reforms. It is also highly likely
that not only the 2020 target of ‘abolishing’ relative child poverty will be missed, but
much of the progress achieved since 1998/99 will be reversed (Dickens, 2011;
Brewer et al., 2011). It is hard to imagine this trend being prevented through
improvements in universal benefits, and some further boost to means-tested
payments is bound to play a part in any effective solution. However, the cost and
potential disincentive effects of additional means-testing could also be reduced by a
more equal original distribution of income, as shown by the Nordic experience.
Thus, one answer to the question ‘are universal or means-tested transfers the best
way to tackle child poverty’ is ‘neither can work on their own, and both can be far
more effective if pre-transfer income becomes more equal (particularly at the lower
end), through improvements in low wages and a more equal distribution of work
across households.’
35
Centre for Research in Social Policy
Chapter 5 Measures to Improve Children’s Life Chances – Universal Opportunity or Selective Help?
Introduction The state is heavily involved in helping children develop and in providing them with
opportunities. This lasts throughout the period from birth to adulthood: from the
provision of community midwife services through to planning the number of places in
higher education. To a large degree, this domain of state intervention is dominated
by an ethos of universalism: all children should have access to services that protect
them and help them develop.
However, there has also in the past 20 years been widespread acknowledgement
that a ‘level playing field’ in terms of opportunities may require something more than
just offering equal services to everyone. As shown by a previous JRF review of
education and poverty, children coming from unequal starting points do not interact
equally with educational services, and for those in poverty, disadvantage within
education persists (Hirsch, 2007), as does a strong link between growing up in
poverty and experiencing poverty as an adult (Blanden and Gibbons, 2006).
This raises the issue of under what circumstances educational and early childhood
services should be specifically targeted to low income families in order to give
additional help to children who start out disadvantaged by their backgrounds. Here
we need to distinguish three different ways in which resources may be intentionally
skewed towards lower income groups:
• Through the types of services provided, some of which will naturally be taken
up more by people with certain kinds of need. For example, local authority
children’s services have much greater interaction with families in difficulties,
who are disproportionately likely to be deprived families. One study showed
that some local authorities spent two to three times as much per child on
children’s services than average in the 10 per cent most deprived local areas;
in contrast to secondary education, where most local authorities spent very
similar amounts per child in deprived as in non-deprived areas - at least before
the advent of the ‘pupil premium’ (ODPM 2005, pp48-9 and p82).

36
Means testing or Universalism
• By rationing access to public support for certain services or subsidies to
particular income groups. Some of these services are things that better off
groups also use, but have to pay for. Two obvious examples are early
childhood education and care and free school meals. It is interesting to note
that for the former, the present government has extended a universal
entitlement for one age group (3 and 4 year olds) to a means-tested entitlement
for another (2 year olds), while for the latter it is about to go in the reverse
direction, offering universally free rather than means-tested school meals for 4-
7 year olds.
• By giving additional forms of support to some users of universal services, in
order to help them get more out of these services. This can be approached
from the supply or the demand side. A supply-side approach weights
resources to those providers that serve more families from low-income
backgrounds, hoping that this will give them additional help to overcome
disadvantage. Area-based school subsidies and the pupil premium are
examples. A demand-side approach gives additional help, financial or
otherwise, to encourage low income families to access the resources available
(e.g. educational maintenance allowances, means-tested student grants,
university access policies).
The use of such policies to target support and opportunities to help low income
families is complicated immensely by the multiple objectives created by systems that
seek simultaneously to provide something universal and to ensure that deprived
groups use it effectively. This is most obvious at school level, where any
improvement of the relative progress of deprived groups necessarily diminishes the
relative progress of other groups, and where pro-poor skewing of resources at a time
of zero real-terms growth in public spending necessarily reduces mainstream
resources. In early childhood, multiple objectives have played out in different ways
at different times and in different countries. This depends on the respective
emphasis placed on the role of early years provision as (a) extending universal
schooling, to give young children common experiences of early learning and
socialisation; (b) compensating for the home disadvantages of children with
disadvantaged parents; and/or (c) enabling mothers to work.

37
Centre for Research in Social Policy
Another significant factor in considering the roles of universal, means-tested or
otherwise targeted services for children is the response to evidence that life chances
are highly influenced by what happens in the first few years of life. This may create
a case for targeting interventions by age rather than (or as well as) by income,
helping to explain expansion of universal access to pre-school opportunities in the
UK and in other countries. However, as discussed below, the evidence suggests
that early intervention may not provide much long-term compensation for family
disadvantage if nothing is done to improve opportunities at primary and secondary
school. To the extent that this is true, targeting by age rather than by social
background or income could yield limited benefits. Universal, age-targeted and means-tested provision: four issues to consider Evidence on all these issues is vast and complex. The following considers in brief
how different countries’ approaches and empirical evidence can shed light on four
issues relevant to the balance between universal and targeted approaches:
• The goals of universal early childhood provision
• Gains from early intervention for low income families, and implications for age-
based targeting
• The effectiveness of means-tested demand-side subsidies
• Outcomes of supply-side skewing of resources to provision for low income
families
The multiple goals of early childhood provision make the balance between universalism and targeting difficult In the United Kingdom, a number of initiatives in the past 15 years have involved the
state more than previously in supporting early childhood provision. These include:
• Additional support for childcare. Some of this has been universal (notably the
introduction of a 15 hour free early years entitlement for 3 and 4 year olds and
the offer of childcare vouchers through employers) and some has been means-
tested (notably the extension of the early years entitlement to 2 year olds and
the inclusion of a childcare element in the tax credits system)

38
Means testing or Universalism
• Sure Start, Children’s Centres and other ‘early intervention’ initiatives. These
policies are founded on the principle that disadvantaged children need a better
start in life, but have varied in the extent to which they are more targeted or
universal in approach. In general terms, they started off targeted at deprived
areas, but became much more universal as they were expanded. Since 2010,
reduced funding has aimed to revert to a more targeted approach, although
with closures spread fairly evenly across deprived and non-deprived areas, it is
unclear whether this intention is being fulfilled (Waldegrave, 2013).
The extent to which such schemes target low income families depends to a large
extent on their nature and purposes. In the United Kingdom and in the United
States, there is a large extent to which they are founded on a ‘deficit’ model of early
years provision. This focuses on providing families on low incomes with things that
they have been lacking, including parenting skills, exposure of children to
environments in which they can develop healthily and affordable childcare services
of an acceptable quality that allows parents to work. A starting assumption is that
middle class families already have all these things, creating a focus on
disadvantaged families who do not. However, given the financial and other
pressures on all families bringing up children, there is in reality no reason why non-
poor families should not also take advantage of what is on offer, where it is available
to them. This helps explain the extent to which children’s centres have been widely
used, rather than just being seen as part of ‘welfare’ services. One in seven are
located in the 30 per cent least deprived areas (Waldegrave, 2013).
It is important in this context to note that, across OECD countries, early childhood
education and care has come increasingly in the past 20 years to be seen as part of
a ‘universal’ framework that sets a ‘foundation for lifelong learning for all children’ as
well as providing for the ‘social needs’ of families (OECD. 2001, p7). That is to say,
it (a) helps young children to acquire baseline educational competencies; (b) helps
their educational and emotional development and (c) enables parents to work if they
wish to by providing good quality childcare - and hence helps children indirectly by
boosting family income. The OECD’s series of ‘Starting Strong’ reviews (OECD
2001, OECD 2006, OECD 2012a) are heavily focused on universal access that

39
Centre for Research in Social Policy
integrates these three elements. This draws on traditions in which the social side of
early childhood education has been particularly strong in some countries (notably the
Nordic countries), while in others, such as France and Belgium, universal preschool
access from the age of three has put greater emphasis on early learning. The need
for a balanced universal approach has been widely recognised. It has been reflected
by policy in the UK, for example in the introduction of the early childhood entitlement
of 15 hours a week for three and four year olds and successive schemes to
subsidise childcare tax breaks through employers.
This move towards universalism may on the one hand seem surprising in a period
where many forms of state intervention have become more targeted. However, it
reflects a consensus that early developmental needs of children are so important
that providing universal primary and secondary education without attending to the
needs of younger children is unbalanced - and therefore a partial extension of public
responsibility of education to support this earlier stage. Such an approach is not
inconsistent with putting particular emphasis on meeting needs of children from
disadvantaged families in the early years. However, it potentially puts it in a different
context: that of identifying disadvantaged children’s needs within a universal system,
rather than necessarily targeting provision itself.
Yet in this respect, the UK finds itself in a rather hybrid state. On the one hand, in
comparison to many European countries, full provision of primary education starts
relatively early - generally in the year that children turn five, which is one or two
years early than in many countries. On the other hand, whereas provision for 2-4
year olds (as well as after-school provision for older children) is in many countries
the subject of ‘supply-side’ subsidy, making provision free or very low cost, much of
the subsidy in the UK goes through users - either via entitlement to a certain number
of free hours or through means-tested tax credits. This has created an environment
where universalism and targeting can be mixed as resources allow - for example by
means-testing the extension of the early years entitlement to two year olds and by
aiming to focus children’s centres more in deprived areas. However, another
proposed new subsidy, support for childcare costs through the tax and tax credit
system, will actually benefit better off families more (Barnard, 2013).

40
Means testing or Universalism
In this context, there remain several potential overall approaches to applying
universal or means-tested measures that give children from low income families a
better start in life in the UK. One is to continue expanding universal provision, to
ensure that affordability issues are not an obstacle for those with the least means.
This is likely to remain a long-term objective. A second is to accept, in the short
term, that there are gaps in provision, and prioritise low income families for access
while resources are scarce. A third is to ensure that, just as within primary and
secondary education, particular needs of low income families are properly met,
potentially by directing more funding to those providers serving poorer communities.
In practice, a combination of all three of these elements, sometimes involving messy
compromises, is likely to continue.
There are clear gains from early intervention, but this does not prevent inequalities later on A wide international literature has suggested that ‘early intervention’ to help improve
the life chances of children born into poverty is desirable because:
• Children in poverty are on average behind their peers in basic educational
indicators even before they start school
• Children from disadvantaged families who have experienced high quality
interventions in early childhood, experience long-lasting benefits from these
interventions (see for example Allen, 2011; Ludwick and Miller, 2007; Melhuish
et al., 2008).
However, it is important to note that this does NOT imply that
• Ensuring that children in poverty experience high quality interventions in early
childhood will guarantee that they have equal chances to children who are not
in poverty.
This is partly because the ‘improved outcomes’ associated with early intervention are
large enough only to reduce rather than to eliminate differences in outcome resulting
from social background. And it is partly because the effect of home disadvantage on
educational experience and opportunity does not stop the day a child enters school.

41
Centre for Research in Social Policy
On the contrary, research has shown that multiple aspects of social background
affect how children interact with the education system (Hirsch, 2007).
All this is reflected in the results of the most comprehensive longitudinal study of the
relationship between home background, experience of early childhood provision and
long-term educational outcomes. The Effective Preschool, Primary and Secondary
Education (EPPSE) Project has reported results up to the end of Key Stage 3 (age
14; Sylva et al., 2012). It reported on the net effects of neighbourhood, pre-school,
primary and secondary school after taking account of individual student and
background influences, and found that:
• Differences in academic attainment and social-behavioural development related
to background emerged early (at age 3) and remained fairly stable to age 14.
• Students who experienced multiple disadvantage in the early years had an
increased risk of poorer social-behavioural development and lower attainment
at age 14.
• Pre-school experiences still had an influence on outcomes after 10 years of
intervening experiences from multiple influences – especially for children from a
poor home learning environment.
• Students who ‘succeeded against the odds’ were helped by parents, friends
and their communities as well as by pre-school and school.
• At school, high quality teachers were especially important in encouraging
students, and offered specific school support to tackle difficulties such as
booster lessons.
In other words, both early intervention and later intervention can play a role in
reducing the cost of poverty in terms of educational outcomes.
In light of such findings, approaches to interventions that are targeted by age rather
than necessarily by income group should be considered carefully – particularly in
light of the opportunity cost of spending that might otherwise be targeted by income.
However, this does not mean that they can never be justified as a valid approach to
addressing poverty and educational disadvantage.

42
Means testing or Universalism
Children with low family incomes can miss out on essential formative experiences
because of a lack of home-based resources and an inability to afford high quality
provision outside the home. Means-tested support may potentially help, but take-up
has been problematic, especially with the childcare element of the Working Tax
Credit. Creating universal pre-school provision that brings forward the age at which
people from all income groups have a common experience of early education could
help significantly to level the playing field: in this sense, disadvantaged children are
potentially the greatest beneficiaries. At the same time, universal access to
childcare can help pay for itself through the additional taxes generated by enabling
parents to work. In putting this case, Ben-Galim (2012) points to countries such as
Sweden and Iceland, where affordable high-quality childcare is associated with
maternal employment rates at least as high as for women who are not mothers.
In the case of free school meals, the advantages of an age-targeted but non-means-
tested approach is less obviously apparent, especially when applied, as proposed, to
a selected age group (5 to 7 year olds). Giving every child something free that most
families have had no great difficulty paying for, and only providing it for part of their
time at school, may seem an arbitrary and inefficient way to help low income
families. However, take-up of school meals is also low, and a pilot of universal free
lunch provision in some local authorities produced some interesting results (DFE
2012). The evaluation showed that such a policy could improve both diet and
attainment, with both types of gain concentrated among primary school pupils and
among those on low incomes. The reason for the attainment gains are unclear, but it
is worth noting that this policy has produced benefits for low income families that
means-tested free school meals did not, albeit with a considerable ‘deadweight’ cost
estimated at a third to half of the total amount spent. It would be foolish, therefore, to
write off universal approaches where they can be shown disproportionately to benefit
low income families who may be hard to reach by other means.
Means-testing can potentially play an important role in encouraging participation As has been pointed out throughout this review, means tests can help target
resources to needy groups, but may also cause limited take-up by those eligible.
Measuring take-up rates of benefits that involve using services is in itself

43
Centre for Research in Social Policy
problematic, since non-users may either not want the service, or alternatively may
want it but be put off by its cost and not use it - possibly without taking account of the
potential means-tested help. An example is the childcare element of the Working
Tax Credit. An official estimate puts the number eligible for this support and not
claiming it at 19 per cent of potential claimants, but also points out that 82 per cent of
families with children with incomes at relevant levels do not claim because they do
not use relevant forms of childcare or are couples with only one person working
(HMRC 2011). Many of these families might be encouraged to have a second
earner or to use more childcare if they took the cost of childcare net of tax credits
into account, but the complexity of the system can deter such behaviour. This is an
area where making provision free or subsidised at the point of use needs to be
seriously considered because of the limited extent to which subsidies that follow
users have genuinely removed barriers to accessing the childcare that people need
to allow them to work.
On the other hand, there are some cases where the availability of additional financial
support has been shown to stimulate participation by lower income groups.
Educational Maintenance Allowance for sixteen year olds with low family incomes
who stay on at school appear in the first instance to have increased staying on rates
among boys by an estimated 5.9 percentage points (Middleton et al., 2005), and
eventually to have influenced about a quarter of recipients to participate in or
complete courses (RCU 2007), although this also implies that about three quarters of
the payments were ‘deadweight’. This is a case where it is not the cost of
participation in (universally free) provision that is the issue, but rather the
perspectives of potential participants. Deciding whether the ‘nudge’ given by such
allowances to encourage young people to behave in what would anyway be their
long-term economic interests is worth the considerable deadweight effects is a highly
political judgement - and one that the present coalition government called differently
from its predecessor, by abolishing the allowances in England.
Another means-tested payment whose consequences for behaviour are important is
the student grant. Despite the large variation in the way higher education systems
are funded, almost all OECD countries provide some financial support to low income
students to meet the costs of tuition and/or living expenses (OECD, 2012b). These

44
Means testing or Universalism
usually come in the form of means-tested maintenance grants, scholarships and
bursaries. Financial aid has been shown to have a considerable positive impact on
disadvantaged students’ enrolment on higher education courses. Dearden and
colleagues (2011) estimate that a £1000 increase in means-tested maintenance
grants increase student enrolment at universities by 2.6 percentage points in the UK.
This is also confirmed by evidence from the USA. A study assessing the effect of
abolishing a federal student aid programme, which provided generous education
grants to children of deceased, disabled or retired Social Security beneficiaries,
found that higher education participation dropped sharply among the programme
target group after the withdrawal of the grant (Dynarski, 2003). This study also
estimated that a $1000 grant offer increased the probability of attending university by
3.6 per cent. Moreover, financial aid appears to not only encourage lower income
students to opt for higher education, but also reduces their risk of withdrawing from
college after the first year. A study examining the effect of federal Pell grants and
other means-tested financial support on persistence rates for bachelor level students
from different income groups came to a conclusion that: ‘low- and middle-income
students gain immensely from receiving need-based grants, while upper-class
students do not need aid in order to stay in college’ (Alon, 2009, p.823).
These findings are echoed in an OECD report (2012b) which shows that high rates
of tertiary education participation can be achieved even in the context of high tuition
fees (as in all Anglo-Saxon countries and Netherlands) as long as adequate financial
aid is available for students from disadvantaged backgrounds.
An interesting aspect of means-tested student support is that it can, to a large
degree, be seen as based on the ‘merit’ of students admitted to university, and is
therefore potentially less stigmatising than many other forms of means-testing. This
is more true to the extent that grants are not directed only towards a small minority of
the poorest students. Ivy League universities in the United States give some form of
student support to large fractions of those admitted. In the UK, the maintenance
grant system up until the 1980s gave some money to everyone, but reduced the full
grant depending on a means-based parental contribution. This was perhaps the

45
Centre for Research in Social Policy
least stigmatising of all means-tested payments, and was almost universally taken
up.
Concentrating resources on providers serving deprived communities has not so far been shown to be particularly effective As noted before, governments may use ‘supply-side’ subsidies to skew more
resources in favour of children from disadvantaged backgrounds. This may take two
forms:
• Giving more money to schools in economically deprived areas through a
funding formula that discriminates in favour of these locations. One way in
which the schools may be selected is through a ‘zone’ approach. This method
has been used in France (in the form of the Zones d’Education Prioritaire, or
ZEPs) since the early 1980s and was also introduced in the UK in the first
years of the New Labour government (as Education Action Zones, EAZs).
• Giving more money to schools serving deprived children – notably the ‘pupil
premium’, introduced by the present government, which provides a fixed
additional amount to each school according to the number of children on free
school meals.
The available evidence does not suggest that concentrating resources on providers
which serve deprived communities has been particularly successful so far. An
assessment of the French ZEP initiative (Benabou et al., 2009) found that the
programme failed to improve student performance because of limited budget and
ineffective use of allocated resources, but also because the schools’ participation in
the programme worsened their reputation, prompting many parents to move their
children to other schools. Likewise, an OFSTED (2003) evaluation found that,
despite some minor improvements, the EAZs did not succeed in improving
disadvantaged children’s school performance either in absolute terms, or in relation
to their better-off peers. It is too early to evaluate the effects of the pupil premium
initiative as it has just been introduced. However, an IFS discussion paper (Chowdry
et al., 2010) warns against having high expectations because the better-performing
schools are unlikely to actively recruit disadvantaged students unless the premium is
high enough.

46
Means testing or Universalism
We should note though that the absence of success stories up to date does not
necessarily imply that these approaches cannot be successful: it is possible that in
order to make a transformative difference to education of deprived groups, the
spending needs to increase by a greater amount that has so far been politically
acceptable, or needs to be accompanied by more serious changes in educational
methods than have been attempted. However, it is also worth emphasising that
tackling inequalities in education requires substantial measures for addressing the
fundamental causes of general inequality, of which making the school funding more
progressive can only be one element.

47
Centre for Research in Social Policy
Chapter 6 Providing for Disability, Health and Care Needs
The UK state has a hybrid system of universal and means-tested approaches to
catering for people’s needs related to health, disability and care. The NHS provides
universal free access to primary health care and most treatment costs, but some
items such as prescriptions and dentistry are free only to selected groups. Support
for disability has a strong universal element, including in the case of benefits
intended to contribute to the additional cost of disability (DLA/PIPs and Attendance
Allowance). Support for meeting care needs is largely means-tested, with some
universal elements, more extensive in Scotland than in the rest of the UK.
An important justification for the universalism of the health service is the huge cost
involved in meeting health needs privately, meaning that not just those in poverty,
but people on middle incomes, greatly value the protection provided by a public
system. In theory an efficient private insurance market could provide such protection
against facing the unaffordable costs of illness, but as the United States has shown,
private markets may be neither efficient nor equitable in this respect. Similar
arguments may be applied to protection against high care costs, for which insurance
markets have proven even less capable of providing good-value coverage. The high
level of such costs brings a new dimension to the issue of universalism versus
means-testing and poverty. This is that, in the absence of good insurance coverage
or universal support from the state, having a high health or care cost can actually
bring people into poverty, or significantly lower their standard of living. Thus unlike
some universal perks, such as free television licenses for the over-75s, which one
could argue pensioners leading a comfortable life could do without, having a free
care entitlement can potentially make the difference between being comfortable and
struggling to make ends meet.
Furthermore, in the case of disability, universal benefits are in themselves more pro-
poor than, say, a universal state pension because disabled people have a relatively
high risk of being in poverty. This is partly because of their reduced lifetime earnings
potential and partly because of the additional costs that they face. The latter is not
reflected in crude income figures, which take no account of the fact that a disabled

48
Means testing or Universalism
person facing additional costs has less to spend on everyday living than a non-
disabled person on an equal income.
For these reasons, there seems to be a clear role for non-means-tested support in
helping people with high health or social care needs and with disabilities to reduce
the risk of material hardship. However, while such support may be ‘universal’ in the
sense of not having means-tested gateways to access, it is by its nature targeted on
certain groups, if only categorised by the type of support that is needed. Thus, the
best form of targeting is bound to be an issue, whether or not there is a means test.
The following are examples of issues that arise for the UK welfare system in this
regard:
Disposable incomes of disabled people, especially non-pensioners, tends to be low, giving universal transfers a progressive effect Attendance Allowance for pensioners and Disability Living Allowance (being
replaced by Personal Independence Payments) for non-pensioners provide a large
amount of non-means-tested support aiming to help people meet the cost of certain
levels of disability. To a large extent, the justification of these payments are in terms
of ‘horizontal equity’ - that the state helps people meet the cost of a physical need,
just as it helps them when they are ill, as a form of social insurance that pays out
regardless of people’s income. However, some have questioned whether this is
affordable, especially in the form of Attendance Allowance, which is paid to nearly a
fifth of over-65s and over a third of over-80s at a cost of over £5 billion (author
calculations using DWP tabulation tool) as a compensation for having certain
physical limitations, and is used for a wide variety of purposes including helping to
pay for gardening, cleaning and heating, as well as more directly to support care
needs (Age UK, n.d.).
An interesting perspective on the relationship between disability benefits and poverty
can be seen in Table 5. This shows that when the value of the benefit is taken into
account, working-age claimants are no more likely than anyone else to be in the
bottom income quintile, and pensioner claimants are less likely. However, in both
cases there are relatively few rich people receiving the benefit. More importantly,

49
Centre for Research in Social Policy
when one deducts the benefit itself from income, the income concentration is much
more towards the bottom. For non-pensioners in particular, twice as many as
average are in the bottom quintile. On this basis over seven in ten working-age and
over six in ten pensioner recipients are in the bottom two quintiles. Thus, unless
disability benefits over-compensate people for the additional costs that they face, the
disposable income of the great majority of recipients is comparable with people on
low to modest incomes – in the bottom 40 per cent of the distribution.
Table 5 Distribution of disability benefit recipients across quintiles
Quintile group Bottom 2 3 4 Top
Pensioners With disability transfers 7.6% 30.9% 34.3% 21.4% 5.7% Without disability transfer 28.4% 33.4% 26.0% 8.3% 3.8%
Non-pensioners
With disability transfers 20.5% 29.3% 29.6% 14.2% 6.4% Without disability transfer 39.4% 31.8% 16.2% 8.1% 4.6%
Source: author calculations based on FRS (2012) data. Disability transfers comprise: Disability Living allowance (mobility), Disability Living Allowance (care), Severe Disability Allowance, Attendance Allowance, War Disablement Pension and Industrial Injury Disablement Benefit.
In this light, many households may have gross incomes that rise above the poverty
line with the help of disability benefits, but still have very low disposable incomes
once the additional costs that these benefits are meant to compensate are taken into
account. This is particularly true of families with more than one disabled member,
including those with disabled children, whose costs can be especially high.
Means-testing of income replacement benefits for disabled people make them less stable a foundation on which to build The UK benefits system draws a clear distinction between benefits intended to
contribute to the additional cost of disability and those intended to support disabled
people because they are out of work for a reason related to their disability. The latter
support, previously Incapacity Benefit and now Employment and Support Allowance,
has until recently been available to people with a minimum record of National
Insurance Contributions, regardless of family means. However, since 2012, the
payment of contributions-based ESA has been limited to one year, for people in the
‘work-related activity group’ - that is, the majority of claimants who are expected to
take steps to move towards work. This means that beyond the first year of claiming,

50
Means testing or Universalism
they are subjected to a means-test as a gateway to the income-based version of the
benefit. The most important result of this is that claimants with working partners may
have the benefit withdrawn based on their partners’ income. This puts disabled
people in a similar position to unemployed people, in having reduced access to
income in their own right, based on their out-of-work status.
Other countries have a variety of different systems for paying disability benefits,
some of which combine universal and means-tested elements, and some of which
link income-replacement schemes to type of disability (Waddington, 2010). In
Australia, for example, a flat-rate Disability Support Pension is tapered away at 50
per cent once income passes a certain threshold, but blind people are exempt from
this means test (INDA, 2004). Numerous universal and means-tested special
benefits related to specific needs sit on top of this basic disability pension. Sweden’s
disability pensions, in contrast, are fully universal, based only on the percentage
reduction in people’s work capacity. It is supplemented by non-means-tested
payments to help compensate the cost of disability. France and the United States
have both insurance and means-tested income replacement schemes, set at
different levels (OECD, 2003).
These variables show that there are some clear policy choices to be taken that allow
disability benefits to be more or less focused on three different objectives: direct
relief of poverty for disabled people; more generalised support that helps disabled
people cope with the extra costs and other disadvantages that they face; and
encouragement or pressure to use work to improve their own lives. In the UK, there
has been a combination of the first and second of these, but increasing emphasis on
the third. The risk is that too narrow targeting of ongoing support to the those with
the lowest incomes or least able to work may be counterproductive, by denying other
disabled people a level of income security that offers a platform from which they can
improve their lives.

51
Centre for Research in Social Policy
Where means tests for care benefits are lifted, there is a risk that they will be restricted by other means The present systems for supporting long-term care needs in the United Kingdom
combine a wide variety of approaches and no single guiding principle. For example:
• People who qualify for personal care in their own homes and who do not have
more than £23,250 in savings get offered a package or personal care budget,
to which they have to contribute charges dependent on their income. In
Scotland, however, the package is provided for free. A complicating issue is
that budget constraints can potentially create a trade-off between less income-
testing and tighter eligibility criteria in terms of severity of condition, and in
Scotland the advent of free personal care was associated with such a
tightening. Thus, less means-testing may change the nature of targeting rather
than truly widening support.
• People in care homes also get packages for personal care, as well as
accommodation, based on means-testing against income and assets, but this
includes their family home if they do not have a partner still living in it. A
contribution towards nursing care, on the other hand, is not means-tested.
• People providing unpaid care for more than 35 hours a week and earning below
£100 a week are eligible for a carers’ allowance. This is tested against
individual earnings, but not family means, and hence can be seen as a form of
earnings-replacement benefit.
In some other countries such as Germany and Japan, such complex and
multifaceted systems have been replaced by more coherent ones based on simple
principles, largely based on condition rather than means. In Germany, this is part of
social insurance. A difficulty in moving towards such a system in the UK is the lack
of a strong existing social insurance mechanism, and as a corollary a lack of a strong
funding stream to support a universal system. As Scotland’s experience with ‘free’
personal care has shown, the biggest risk in moving towards universalism would be
a tightening of entitlements that could make poorer people worse off, because they
would be left to fend for themselves until their condition became very serious.
Ironically, one of the main ways in which this could occur would be if the universal
Attendance Allowance were merged with personal care in order to help fund a

52
Means testing or Universalism
universal care entitlement. This could potentially be concentrated on providing free
care for everyone with substantial or critical needs. People on the lowest incomes,
who lost the Attendance Allowance because their care needs were not high enough,
would find it hard to afford to make up the cost of some of the things that Attendance
Allowance is currently used for, such as cleaning and help around the home.
Another area where selectivity is not working is free health services such as
prescriptions. Targeting is very inefficient at addressing poverty. The most practical
alternative is full universalism (e.g. free prescriptions in Wales etc.) because means-
testing is too fiddly and targeting by proxies isn’t getting to those with greatest need.
Targeted free health benefits are not well targeted on low income households A number of health benefits, including free prescriptions and free dental treatment,
are targeted not by income but by client group. Broadly speaking, pensioners,
children and people on out-of-work benefits get free access. This is a highly
inefficient method of reaching people on low incomes, as shown by the estimates in
Table 6. Most pensioners and children who receive the benefits are not in poverty,
while most working age adults in poverty do not receive the benefits, because they
work. Overall, around 40 per cent of people in poverty miss out on the benefits,
while over 40 per cent of people not in poverty receive them. An additional difficulty
is that access to free health benefits by working age people with high health care
needs can create a significant work disincentive. Means-testing health benefits
directly by income is unwieldy. Scotland, Wales and Northern Ireland have all
concluded that the best solution is to make prescriptions free to everybody.

53
Centre for Research in Social Policy
Table 6 Estimates of entitlement to free health benefits by poverty status
Entitled to free health
benefits (million)
Not entitled to free health
benefits
Chance of getting free entitlement
Population (millions)
% in poverty
Poor Not poor
Poor Not poor
Poor Not poor
Children 13.1 17% 2.3 10.8 0 0 100% 100% Working age adults
36.9 15% 1.6 2.0 4.0 29.3 29% 6%
Pensioners 11.7 16% 1.9 9.8 0 0 100% 100% Whole population
61.7 16% 5.8 22.6 4 29.3 59% 44%
Source: author estimates based on poverty data (DWP 2013a). This table assumes that all children and pensioners receive free health benefits, and that working age adults do so if they are receiving out-of-work benefits.
Conclusion – it’s not whether but how you target The principle of the National Health Service is that nobody, rich or poor, will have to
pay for health care. In an ideal world, this principle would be extended to universal
support covering the cost of disability, lost earnings resulting from being disabled,
the cost of social care and some currently chargeable health costs. Sweden’s
universal disability pensions and Germany’s insurance-based care support are
examples of such universalism. However, considering the real choices facing the
UK today, the risk is that lifting means-based targeting could simply produce the
pressure to target in other ways - in particular by supporting needs more selectively.
This could produce particularly great risks for people on low incomes if it reduces
access to certain types of service - most notably care - which previously they
obtained for free.

54
Means testing or Universalism
Chapter 7 Take-Up Rates and Public Perceptions
The stigma and complex assessment procedures associated with means-tested
benefits generally mean that they have substantially lower take-up rates than
universal ones. Where this means that a high proportion of intended beneficiaries
fail to get the intended benefit, the value of ‘targeting’ benefits according to means
must be drawn into question. In terms of the consequences for poverty, a policy that
tries to get to people who need it most and ends by giving nothing to a substantial
proportion of this group is failing in its own terms.
In this section we investigate this issue in more detail by examining evidence on
take-up rates produced by the DWP and HMRC, and considering whether in various
circumstances it may be realistic to aim for significantly improved take-up.
The official data confirms that non-take-up of means-tested benefits is a serious
issue in the U.K. (Table 7). None of the means-tested benefits are claimed by more
than 90 per cent of the eligible individuals and for most benefits the rates are much
lower. Particularly alarming is the low take-up of Pension Credits, Council Tax
benefits, income-based Job Seeker’s allowance and Working Tax Credit, which are
not claimed by a third of the target group. In contrast, the two main universal
programmes, Basic State Pensions and Child Benefits, reach their target groups
almost fully. There are some important differences in take-up rates across different
types of households. For example, Income Support take-up rate is between 83 and
92 per cent for families with children compared to 72 to 87 per cent for families
without children. Similarly, between 54 and 61 per cent of eligible pensioners claim
the Council Tax Benefit compared to 72 to 81 per cent of non-pensioners.

55
Centre for Research in Social Policy
Table 7 Benefit take-up rates, 2009/2010
Coverage (million)
Weekly amount, £
Caseload take-up
Expenditure take-
up Means-tested Income support and ESA 1.2 + 2.5 56-106 77-89% 83-92% Pension credit 2.5 56.9 62-68% 73-80% Housing benefit 5 89.3 78-84% 84-90% Council tax benefit 5.9 15.7 62-69% 64-71% Job seeker's allowance (income based)
1.44 56.8-71.7 60-67% 61-70%
Child tax credit 5.76 N/A 83% 92% Working tax credit 2.5 N/A 64% 84% Free school meals (England) 1.2 N/A 86% N/A Carer's allowance 0.5 59.75 65% N/A Universal Basic state pension 12.84 110.15 97% Child benefit 13.77 (7.92
families 20.3 for first
child + 13.4 for each
additional child
96% N/A
Source: DWP (2012a; 2012b); HMRC (2012b); DOE (2011)
Against this background it is interesting to see how the take-up of benefits has
changed over time. The trends appear to be mainly negative. For most means-
tested benefits the take-up rates have considerably decreased and this trend has
been rather steady (Figure 4). Particularly sharp have been the drops in the take-up
of Jobseeker’s Allowance, Housing Benefit, and Council Tax Benefit: the average
take-up of these benefits has decreased by more than ten percentage points.
Overall, the DWP (2012) estimates that in 2009/10 £7.5 to £12.3 billion were not
claimed by individuals eligible for means-tested cash transfers. On a positive note,
the take-up of tax credits has considerably increased and so did Pension Credit,
though to a smaller extent. This might be due to growing awareness of their
existence as they have become entrenched in the system. We should also note that
between 1997/98 and 2000/01 Income Support and Employment & Support
Allowance and Housing Benefit had very high take-up rates, almost comparable to
universal Basic State Pensions and Child Benefit. This suggests that means-tested
benefits, that for many families represent the primary source of income, can
potentially reach almost all of the eligible beneficiaries.

56
Means testing or Universalism
Figure 4 Take-up rates of Income support and Employment SA, Pension Credit and Jobseeker’s allowance, 1997/98 – 2009/10
Source: DWP (2013b)
Figure 5 Take up rates of Housing and Council Tax Benefits
Source: DWP (2013b)
40%
50%
60%
70%
80%
90%
100%IS and ESA (upper ceiling)
IS and ESA (lower ceiling)
Pension credit upper
Pension credit lower
JSA upper
JSA lower
50%55%60%65%70%75%80%85%90%95%
100%Housing benefit upper
Housing benefit lower
Council tax benefit upper
Council tax benefit lower

57
Centre for Research in Social Policy
Figure 6 Tax credit take-up rates, 2003/04 – 2010/11
Source: HRMC (2012b)
A number of government-sponsored and independent studies (see for example
DWP, 2012; Breese et al., 2011; Shelter, 2009; Harper and Wood, 2009; Harper and
Wood, 2009; Finn et al., 2008) have explored the reasons for the low take-up of
means-tested benefits. They have identified multiple causes including:
• lack of awareness about existing schemes;
• scepticism about possible eligibility;
• complexity of the application and assessment processes;
• need to provide information about intimate aspects of personal life;
• fear of stigma;
• feeling no need for public assistance;
• amount of benefit deemed too small to be worth making extra efforts for
claiming;
• previous negative experience with relevant social administrators;
• concerns about overpayments and subsequent need to pay back;
• concerns that receiving a particular benefit may disqualify them from claiming
another benefit; and
• many private sector landlords not willing to rent to families receiving housing
benefits.
79% 82% 82% 81% 81% 80% 81%
83%
56% 61% 61%
57% 57% 58% 61%
64%
50%
55%
60%
65%
70%
75%
80%
85%
90%
2003/04 2004/05 2005/06 2006/07 2007/08 2008/09 2009/10 2010/11
Child tax creditWorking tax credit

58
Means testing or Universalism
These barriers may have been further strengthened by recent developments. In the
past decade the benefit system has undergone frequent changes as new benefits
have been introduced, some existing ones have been abolished/renamed and the
eligibility criteria for different programmes have changed and tightened. These most
likely have made it more difficult for the potential beneficiaries to navigate their way
through the already complex system. At the same time, the ‘welfare scrounger’
discourse has become ever more present in the media, reinforcing the stereotypes of
idle welfare cheats living a comfortable life on dole (Taylor-Gooby, 2013; Allen and
Savigny, 2012; Garthwaite, 2011). The coalition government’s hostile rhetoric
coupled with a well-publicised campaign aimed at cracking down on welfare
fraudsters has not been encouraging for undecided potential claimants either
(Garthwaite, 2011; Tunley, 2011).
Public perceptions of welfare claimants Perhaps it is no coincidence that public attitudes towards welfare claimants are
becoming more unsympathetic, even though the public usually tended to be more
supportive of poor and unemployed during recessions (Taylor-Gooby, 2013).
According to the latest round of the British Attitudes Survey (NatCen, 2013), 37 per
cent of respondents consider that welfare recipients are ‘fiddling’. In addition,
markedly higher proportions of respondents believe that many welfare recipients ‘do
not deserve help’ (35 per cent compared to 32 per cent in 2001), that unemployment
benefits are ‘too high and discourage work’ (62 per cent compared to 37 per cent in
2001) and that if benefits were less generous people would ‘stand on their own feet’
(54 per cent compared to 39 per cent in 2001). Similarly, 40 per cent of respondents
of a BBC-commissioned opinion poll thought that more than half of welfare claimants
were ‘scrounging’, that is, lying about their circumstances to get benefits by
pretending to be unemployed, disabled or sick or refusing to take up reasonable
work (ComRes, 2012).
Nevertheless, we should note that the general support for the welfare state continues
to be strong. Less than 10 per cent of the social attitudes survey respondents
expressed support for reducing taxes and spending and 60 per cent or more
considered it to be the government’s responsibility to reduce inequalities, provide a
59
Centre for Research in Social Policy
decent standard of living for old and unemployed, health care for sick and housing
for those who cannot afford it (NatCen, 2013). Likewise, 70 per cent of the BBC poll
respondents thought that the welfare state ‘is one of Britain’s proudest
achievements’, 62 per cent believed that decent standards for unemployed should
be provided by government and 72 per cent agreed that ‘everyone has the right to a
minimum standard of living which should be paid for if necessary by the welfare
state’ (ComRes, 2012).
What seems to have changed though is the attitudes towards disadvantaged welfare
claimants, as noted before. The proportion of respondents considering that the
government should ensure decent living standards for unemployed has dropped
sharply in the past three decades, and less markedly in relation to housing provision
(NatCen, 2013). Support for core universal welfare arrangements continues to be
nearly unanimous: provision of pensions and health care were identified as the
government’s responsibilities by 96 and 97 per cent of social attitudes survey
respondents respectively. On the other hand, the public appears less supportive of
other universal measures: only 41 per cent of BBC poll respondents thought that
child benefit should be available for everyone despite their financial means, and
nearly three quarters believed that the Winter Fuel Allowance should be means-
tested (ComRes, 2012). Interestingly, the public appears almost evenly divided over
contributory benefits: 47 per cent agreed that the amount of benefits should be
determined by the amount of tax paid, while 41 per cent disagreed. Lastly, we
should note that increase of social security benefits appears at the bottom of the
public’s spending priorities list, having decreased from 13 to five per cent between
1990 and 2012 (NatCen, 2013).
Under such an unfavourable environment reversing the declining take-up rates will
certainly be no easy task. The introduction of the Universal Credit, it is hoped, will
help simplify the system to improve take-up. Better integration of information about
claimants in computer systems could also help in the long term. However, it remains
to be seen whether these improvements will come about.
Previous attempts to improve take-up have yielded disappointing results. The
Pension Credit is a case in point. High profile publicity campaigns to raise

60
Means testing or Universalism
awareness and improve take-up may have had some effect, yet around a third of
potential beneficiaries, entitled to a fifth to a quarter of potential payments, still do not
claim. The severe barrier to getting anywhere close to universal take-up was
demonstrated by a recent study. The DWP has sought to explore whether eligible
recipients could effectively be identified using the official administrative data that
DWP and HMRC hold (Radford, 2012). Hence in 2010/11 it conducted an
experiment in which a randomly selected 2000 pensioners, estimated to be entitled
to Pension Credit, automatically received the transfer through their bank accounts for
12 weeks (Payment Group). After 12 weeks these pensioners would need to submit
an official claim in order to continue receiving the Credit. Another 2000 randomly
selected pensioners were visited by DWP teams to help them with the application
process (Visits Group). Neither of the two methods turned out to be very successful:
only 13.4 per cent of the Payments Group made some efforts to contact the DWP
and overall only 8.6 per cent made a successful claim. The results were a bit higher
for the Visits Group, where 13.1 per cent made a successful claim. While the
findings of this experiment cannot be generalised to the whole population or even
specific age groups, it seems to suggest that the deeply-entrenched barriers to take-
up of means-tested benefits cannot be solved by take-up campaigns and publicity
alone. The design and presentation of different benefits, together with changes in
public attitudes and public rhetoric towards social assistance (‘free handouts’ or ‘help
for those who need it most’?) are likely to have a crucial impact. In the case of the
pension credit, for example, the fact that for most potential recipients it would be a
top-up of a pension rather than (as in the case of Income Support) a baseline safety-
net income creates a context in which it can be regarded as supplementary rather
than essential by users who believe that their pension ought to be sufficient to meet
their needs.
An important aspect of the experience of means-testing is that not all contexts are
the same, so it would be a mistake to regard take-up as of equal importance in each
case. There may also be ways in which a benefit is presented that can influence
take-up rates. The following factors are likely to be of importance:
• What part does the benefit play in the overall support of the intended
beneficiaries? A non-working lone parent depending on Income Support and
Child Tax Credit for their main family income, with no other source of support, is

61
Centre for Research in Social Policy
highly likely to take it up. A single person on the minimum wage who might
supplement their income by a few pounds if they claimed Working Tax Credit is
less likely to do so. One underlying reason why Pension Credit take-up is low
is because there is an expectation that pensions themselves should be enough
for pensioners to live on.
• How are different elements of support packaged? At present, an out of work
parent claiming Income Support will normally be encouraged to claim Child Tax
Credit and Housing Benefit (if a tenant) at the same time. But for someone in
work, there may be nothing to trigger awareness of entitlement to Working Tax
Credit, and even if tax credits are claimed, there may be no awareness of
entitlement to Housing Benefit, for which in-work take-up is very low. The
Universal Credit will make a single assessment, eliminate the need to fill in
different forms to take up what may be a relatively small separate entitlement to
Housing Benefit and is likely to raise awareness that even working people on
low incomes may well be entitled.
• How does the means test fit in to other administrative procedures? Perhaps
the most ‘benign’ form of means test is one that automatically involves
everyone who uses a service. An example is fees charged for home care by
local authorities. After applying for help, an eligible user would normally have
an income and capital assessment to determine whether they are liable for all
or part of the cost of the service. A relatively lower fee to reflect low income is
not, in this situation, stigmatising since many better-off as well as worse-off
people with care needs use local authorities to arrange their home care.
Another example is the old system of student maintenance grants where every
family got some minimum amount from the state, but the size of the ‘top-up’
they were expected to pay the student to make up the full grant varied with
income. This was an early form of ‘progressive universalism’, where everybody
got something, but low income families got more.
Means-testing is likely to be a more feasible mechanism for alleviating poverty to the
extent that programmes can be designed to improve take-up according to the criteria
mentioned above. This does not however mean that it is always possible to do so. It
appears that means-tested income for pensioners is intrinsically hard to deliver, and

62
Means testing or Universalism
that pensions work better as a basic entitlement than when they can be seen as a
form of poor relief. However, for working age benefits and credits, poverty cannot be
avoided purely through universal entitlements (short of citizen’s income proposals
that defy political reality), or in the near future entirely through earned incomes, so
income-contingent transfers for people in and out of work will continue to be a
necessary part of the landscape. The challenge will be to design them in simple and
socially acceptable forms that ensure that those who require them take them up.

63
Centre for Research in Social Policy
Chapter 8 Conclusion This review has not produced any simple answer to the question ‘are universal or
means-tested policies more effective in reducing poverty?’ It has shown advantages
and disadvantages of each approach, which work out differently in various
circumstances. The challenge must be to identify which type of policy works best
according to the constraints and possibilities of different circumstances.
However, the starting point in approaching this task is considerably different from
how it appeared as recently as 15 years ago. At that time, the postwar consensus
that the priority for welfare states should be to be inclusive, and as universal as
possible, was largely intact. In many European countries, income transfer systems
remained dominated by social insurance in which people across the income
spectrum had a strong stake, with means-tested social assistance still on the
margins. The seminal study by Korpi and Palme (1998) appeared to show that even
the poorest groups gained more from such systems than from ones that were more
targeted, but were as a result able to muster fewer resources, because it was
politically harder to tax middle and higher earners who did not have a stake in such
systems.
In the intervening period, several fundamentals have changed. Most importantly,
with fiscal pressures on governments greater than ever before, there are severe
constraints on what governments can spend overall. In this situation, there is less
plausibility to the premise that inclusivity will help increase the size of the pie so
much that poorer groups will get more than if the relative size of their piece were
bigger. Recent studies seem to challenge that assumption, and raise doubts as to
whether it was ever as true as earlier comparisons, using a narrower sample of data,
had suggested.
As shown by Marx and Nelson (2013), means-testing has become more important
de facto, as social assistance plays a wider role in changing times, particularly
because more gaps have emerged in the coverage of social insurance schemes.
Even though cuts in levels of entitlements of means-tested schemes have

64
Means testing or Universalism
sometimes been more severe than universal ones, their coverage and client groups
have, in many cases, expanded. This results not from a rethinking of the principles
of welfare but from long-term changes in western economies. Since welfare states
were founded, the distribution of earnings has become more unequal, the
vulnerability to unemployment and unstable employment greater and family
structures less homogeneous and more fragile. All these changes make the world a
riskier place. Traditional forms of protection based on social insurance and universal
benefits work much less well than when they protected a more stable society from
more limited risks.
In these circumstances, it is no longer realistic to treat means-testing simply as a
regrettable necessity at the margins of the welfare state, and to regard social
transfers as principally aiming to create social solidarity through shared access to
universal benefits and services. This is not to deny a continuing crucial role for
universal approaches, especially to the provision of services. The essential role that
state-funded provision plays in the lives of most British people should not be
forgotten or undervalued.
Moreover, there are many specific cases where means-testing should be avoided if
at all possible, particularly where disincentive, stigma, complexity and incomplete
take-up are most severe. Rather, there needs to be open-mindedness to where
these effects can be minimised and avoided, and where on the other hand they are
the least tractable, so means-testing itself should be avoided if possible. At the
same time, where the effects can be contained, the huge social advantage of
focusing finite resources on the most needy should be acknowledged.
In short, an anti-poverty strategy needs to balance on the one hand inclusive
provision that helps sustain a broad welfare state with wide taxpayer support and on
the other, the focusing of scarce resources on the most needy in order to have an
impact on poverty. To a large extent, judgements about which strategy to use have
to be made on a case-by-case basis, not least because social and political attitudes
towards universalism and means-testing can be arbitrary and inconsistent. There is
no obvious reason why opposition to the removal of Child Benefit from relatively well-
off households from early 2013 should have been supported across the political

65
Centre for Research in Social Policy
spectrum, including by some who are generally critical of benefit ‘handouts’. Public
views about entitlement are largely emotive. This is further illustrated by the fact that
while nearly 70 per cent of British public consider that the government should reduce
the existing levels of inequality, the actual measures targeting disadvantaged groups
get a markedly lower level of support (NatCen, 2013).
However, there are some general considerations that can help to identify the best
approach. In particular:
• The rationale for non-means-tested income transfers is most obvious as part of
redistribution between earning and non-earning periods of life. Everybody
needs to think about how to make ends meet in retirement, and the state has
an obvious role in providing security in this regard. The same is less true of
childbearing years – particularly now that the majority of mothers work, so
prolonged absence from the workforce is not taken as a given. No country has
ever tried to provide a universal payment for children large enough on its own
to relieve family poverty. There is no strong argument for doing so (outside the
citizen’s income idea, which would comprehensively reorder responsibilities for
household income generation between the individual and the state, at all
stages of life). In contrast, countries such as New Zealand demonstrate the
potential for guaranteeing a non-means-tested pension above the poverty line.
• Beyond this context of lifetime income transfers, there is potentially greater
support for certain new universal services than income transfers. In particular,
the expectation of universal free healthcare and education could be extended
to free entitlements to some forms of social care and childcare – to match
needs that have emerged since the founding of the welfare state, as a result of
longer lives and more working mothers. In various other countries, universal
entitlements to both these forms of care have grown. As with education and
health, free access at point of use can be more transformative to the
opportunities of people unable to afford such services than income-contingent
access that is unevenly taken up.
• Where universalism either fails to command public support, or is supported by
the public but not to the extent that this unlocks sufficient resources to provide
adequately for the least well off, means-testing or targeting will need to be

66
Means testing or Universalism
designed in ways that best avoid or reduce its pitfalls. This can involve, for
example:
a) targeted policies that do not require a means-test at all, such as
- targeting resources to institutions serving areas where deprivation is
high (e.g. pupil premium).
- targeting individuals without separate means-tests for each benefit
(e.g. ‘passported’ entitlements)
- targeting by group (e.g. disabled people) where there is a high risk of
hardship or poverty across the group.
Of these policies, the third is in many cases preferable to the first (in
which institutions do not necessarily use resources to target the least
well off) and the second (where there is the risk of a ‘cliff edge’ when
the entitlement disappears).
b) Designing means-tests in ways that are as simple and non-stigmatising as
possible. One way is to provide a service to everyone, with a variable
charge structure following a financial assessment (e.g. local authority
domiciliary care). A particularly successful example in the past was
student grants, for which every applicant’s family was means-tested and
received some contribution to maintenance costs. Such an approach
contrasts to situations where only families in poverty apply (as with free
school meals, for example).
c) Avoid excessively sharp withdrawal of income that traps people close to
the poverty line. This is partly a matter of the sharpness of the taper. The
Pension Credit, for example, replaced a 100 per cent taper on the
previous Minimum Income Guarantee with a 40 per cent withdrawal rate,
making it more worthwhile for people on low incomes to build modest
pension savings. However, where relatively sharp withdrawal rates are
considered necessary, another important factor is at what income level
they are applied. To top up income to just above the poverty line and
withdraw support pound for pound against any additional earnings would
be an over-literal and counter-productive interpretation of an anti-poverty
strategy. This is particularly true for working-age households, where it
has been shown that 60 per cent median income is not enough to reach
the Minimum Income Standard (MIS) representing a minimum acceptable

67
Centre for Research in Social Policy
living standard as defined by members of the public (Hirsch, 2013a). For
families with children, the ‘plateau effect’ of sharp withdrawal occurs
below MIS (Hirsch and Hartfree, 2013). Were it to be at about that level,
some families would still experience a cap on their ability to improve living
standards with additional income, but these would be less likely to occur
at a level at which they were excluded from basic needs or the chance to
participate in society. The same considerations support a case for
passported benefits, such as free prescriptions, being paid to people on
in-work benefits rather than being removed as soon as they move into
work.
Policy directions for a long-term strategy against poverty: recommendations It would be vastly ambitious for this review to suggest a specific set of policies arising
from its conclusions, which range over the whole territory of the welfare state.
However, the following recommendations suggest implications for certain key areas
of policy, in terms of the design of a long-term anti-poverty strategy.
1) Orient pensions policy to the establishment of a non-means-tested pension above the poverty line. The existing long-term plan to create a
single-tier pension at approximately the level of the present pension credit
suggests that the UK could achieve this. Not only will it allow pensioners to
escape poverty (which for pensioners also means getting above the MIS); it will
also allow them to reach a significantly better living standard even with modest
pension savings. However several crucial issues need to be resolved:
- Is the aim a truly universal (e.g. residence-based) pension or should the
UK stick to contribution conditions? While the former would more
thoroughly address pensioner poverty, it would be more expensive, and
there is a risk that this would make a truly adequate pension level
unaffordable, at a time when the prioritising of pensioner spending is
already causing intergenerational resentment. Contribution conditions
also help preserve the ethos of an ‘earned’ and therefore ‘deserved’
pension, which helps long-term support for funding. We recommend as an
alternative that credits for caring and other non-work activities continue to
be extended to reduce the extent of under-entitlement, while a means-

68
Means testing or Universalism
tested safety net continues to be kept, at least at the level of the full
pension entitlement.
- The long-term effect of the ‘triple lock’ has been to over-protect pensions
against any sensible benchmark. This is problematic in a period when
public resources for addressing any kind of poverty will be scarce. Before
2008, ‘the highest of prices, earnings and 2.5 per cent’ would have created
the same result as earnings indexation in most years, since earnings
persistently rose faster than prices and faster than 2.5 per cent. That has
now changed, which creates a ‘ratchet’ effect which in the long term will
ensure that pensions grow faster than both earnings and prices. For
example, after a five-year period in which earnings fall in real terms,
followed by one in which they rise by a similar amount in real terms,
earnings will be worth the same as at the start, but pensions will be worth
more having benefited from the real growth in the second period despite
having been protected from the decline in the first period. This could be
avoided by a simple adjustment of the formula to a ‘fair pensions lock’,
defined as follows:
Pensions will each year be increased at least in line with the past year’s increase in the Consumer Prices Index, and at least in line with the past ten years’ increase in average earnings.
Under this formula, the earnings index would not apply for some time after
a period of real earnings falls, because over the long term inflation
indexation would be adequate to prevent pensioners becoming relatively
worse off. This is illustrated in Figure 7, showing a simplified imaginary
example of a recessionary period where nominal earnings are flat and real
earnings falling, followed by a recovery in which earnings grow faster than
prices.

69
Centre for Research in Social Policy
Figure 7 Illustration of triple lock and fair pensions lock
Years 1-5: Earnings flat, prices rising Pension keeps real value under both systems Years 6-12: Earnings rise faster than prices Triple lock. Pension rises in proportion to earnings each year. Fair pensions lock. Pension tracks prices as long as it remains ahead of long-term growth in earnings, but in years 11-12 has to rise faster in prices to keep up with this growth.
Moreover, the third element of the triple lock, an artificial minimum
percentage rise, became less meaningful once the earnings link was
introduced: it was invented in response to a very small (75p a week)
increase in the 1990s when prices were rising slowly but earnings growing
healthily. In that context, such a small cash-terms increase seemed unfair,
but in future it could only occur during a period when both prices and
earnings were stagnating, when a stable income for pensioners would feel
normal.
- The long-term plan for better pensions is partly financed by a raising of the
pension age. As noted in this review, this could increase poverty among
those presently just above pension age who fail to get work, and therefore
have to rely on working-age benefits, which are much lower. Ideally, this
problem should be solved by improving employment rates for older
workers. However, in practice this improvement is likely to be, at best,
gradual for people in less privileged occupations who find it hard to sustain
work into later life. We propose therefore that as an interim measure, for
95100105110115120125130135140 Earnings
Prices
Pension triplelockFair pensionslock

70
Means testing or Universalism
the first ten years after people of a particular age become ineligible for
state pension, they are entitled to higher Income Support rates, at least
midway between the value of Income Support and Pension Credit. It
would also be possible to make the ending of that provision contingent on
an increase in the employment rate of the age group in question.
2) Strengthen means-tested support for families with children to provide all with the potential to reach a minimum income standard. Approaches to eradicating child poverty need to involve a combination of
improving the opportunities for children and families and ensuring that financial
hardship does not blight children’s lives. The latter task is particularly
challenging at time when many families’ earnings are far too low on their own to
support adequate living standards. Much can and should be done to enhance
market earnings, but at the same time, the issue of how to support those whose
earnings remain low, and those who are not working, cannot be avoided.
The starting point is a situation today where the tax credit system, like its
planned replacement, Universal Credit, pays enough to give many families an
incentive to work, but not generally enough to allow them to reach a decent
income level if their wages are low. For those on modest wages, as hours
increase, income plateaus, often at close to the poverty line and generally at
below the level defined by a Minimum Income Standard (Hirsch and Hartfree,
2013).
There are several practical ways of addressing this, and a strategy would do
well to use them all, rather than rely on just one to do the whole job:
- Raise the value of the tax credit/Universal Credit for families with children
- Raise the amount of income disregarded before the credit starts being
withdrawn
- Reduce costs for those on Universal Credit by extending some
‘passported’ benefits to anyone receiving it – a starting point would be free
prescriptions. An advantage of applying this only to selected benefits is
that it would reduce the concentration of ‘cliff-edge’ losses, so some

71
Centre for Research in Social Policy
passported benefits should continue to be conditional on people being out
of work.
- Reduce certain children’s costs universally, where it has proven hard to
reduce stigma. The starting point should be universal free school meals,
which have been shown to have beneficial outcomes for children, and
would also reduce families’ costs.
3) Over the long term, make free or low-cost childcare an integrated part of public provision. Means-tested access to childcare has had poor take-up. Reasons for this
include complexity of the system, limitations to the types of care that are eligible
and a lack of understanding of entitlements. More fundamentally, the
opportunities provided to families by accessible and affordable childcare are
greater where they are visible, direct and stable than where they are contingent
on application for reimbursement under terms that change with the applicant’s
income. In a number of other countries, free or affordable subsidised childcare
or preschool provision are seen as key services like education, available to
those requiring them. A long term ambition for the UK should be to make
childcare affordable at point of use to all families in a way that removes barriers
to work. Since higher rates of family employment are a key ingredient in
reducing family poverty, and since childcare remains a key barrier to maternal
employment, this would be a crucial element of an anti-poverty strategy.
4) In supporting disability and care needs, prioritise benefits that help cover the everyday cost of disability
The failure of the welfare state to pay systematically for the cost of long-term
care has created strong pressures for better universal provision to replace a
highly means-tested system for paying for high-cost personal care. On the
other hand, the UK has one of the most wide-ranging systems for supporting
people with disabilities through non-means-tested benefits intended to help
cover the additional cost of disability, including low levels of care and support.
There are strong arguments to provide both kinds of support on a non-means-
tested basis. As argued above, disability benefits help a group with a high
overall risk of deprivation by giving them a solid basis of income on which to
build. Universal access to care is a logical extension of NHS provision and

72
Means testing or Universalism
helps people from all income groups avoid the risk of facing very high costs
against which it is difficult to insure.
However, the first priority in an anti-poverty strategy should be to ensure that
disability benefits are continued and strengthened, rather than that all means-
testing should be taken out of the care system. The overlap and potential
conflict between these issues has already been seen, first in the tightening of
eligibility criteria in Scotland after personal care was made free, and more
recently in the exclusion of some lower-level conditions in the switch from
Disability Living Allowance to Personal Independence Payments. For the many
disabled people on low incomes, reduced means-testing matched by less
support for everyday living would not be a gain. A primary objective should be
better alignment of the levels of disability benefits with the actual costs of
disability.
5) Selectively extend ‘affluence testing’ where universal provision cannot be legitimised
Where support to a particular group on low to modest incomes can help
address poverty, but means-testing undermines this aim, one solution is to
create semi-universal benefits with richer groups ineligible and required to not
to claim it or declare their income to trigger a deduction. This has been the
case with the ‘affluence-testing’ of child benefit.
The best candidate for similar treatment is the pensioners’ winter fuel
allowance. Affluence-testing is appropriate for this benefit because of the
coincidence of the following conditions:
- Paying the benefit universally is widely criticised, with three quarters of the
public opposed (ComRes 2012). It is not seen as part of the normal
redistribution of income over the lifespan, but as providing for a particular
social need, which does not apply to rich pensioners.
- Means-testing such a benefit would certainly cause hardship. For
example, linking entitlement to Pension Credit would pass on the impact
of low take-up of that benefit.

73
Centre for Research in Social Policy
- It is not easy to measure accurately who would need such a benefit:
basing entitlement purely on income would not take into account highly
variable fuel costs.
- Most pensioners are on low to modest incomes, so a cut-off point around
average income would only exclude a limited number.
In this context, affluence testing could prevent the winter fuel allowance from being
abolished or severely means-tested. Without the allowance, pensioners spend less
on heating their homes (Institute for Fiscal Studies, 2010) and this can potentially
cost lives – given that ‘excess winter deaths’ in the UK are higher than in some
colder countries with better heated homes (Energy Bill Revolution, 2013).
A simple version of an affluence test would be to withdraw the allowance from
pensioners with incomes above say £25,000 a year. Those with slightly higher
income who wished still to claim could inform the tax authorities who would set a tax
code to deduct tax worth one per cent of the allowance value for each £50 of taxable
income. This would add 4-8 percentage points to the effective tax rate over the
relevant band.
Clearly, it would be undesirable to have too many ‘affluence tested’ benefits which
could complicate people’s tax affairs to an unacceptable level. It is also important
not to regard them as a significant revenue-raiser or they would soon turn into
ordinary means tests by being applied at more modest levels of income. However,
the adoption of such measures can be seen as an extra tool in meeting particular
social needs without extending universal entitlement beyond the areas that make
sense to the general public.
6) Raise Income Support for working age adults
While this review has focused on issues where there are choices between
universal and means-tested approaches to helping individuals and households,
it cannot conclude without noting that the most basic form of means-tested
protection is falling ever further short of its task. Working age adults without
children who have no other source of income are now supported by the state at
a level that is arguably too low even to merit the title ‘safety net’. It would be

74
Means testing or Universalism
hard to say in what sense the £71.70 level of the single person’s Income
Support level is protecting people from destitution, given that:
- It is now only just over half the poverty line of 60 per cent median income
(i.e. just above 30 per cent median), and below 40 per cent of the
Minimum Income Standard;
- It continues to decline in real terms, currently being uprated by just one
per cent a year until at least 2015;
- It is under half the safety net for a single pensioner, so when a non-
working single adult reaches pension age their support from the state
more than doubles;
- It is less even than a non-working family gets to support their first child
(£83.02), even though the minimum budget needed for a single adult is
around twice the minimum cost of a first child on average (£187.40 for a
single adult compared with £90.52/£103.77 for the first child of a
couple/lone parent respectively: Hirsch, 2013b, page 14). Interestingly, in
1997, a child under 11 attracted additional benefit income of only just over
half of the adult rate of Income Support (£28 compared to £49), so this
huge discrepancy between adult and child rates of support, compared to
need, is relatively new.
It is not currently fashionable to state that the way to reduce poverty is simply to
give money to people experiencing it. Overall, solutions need to involve better
opportunities that allow people to play an active role in improving their own lives,
rather than just ‘passive’ support that does not address underlying causes of
poverty. However, a long-term strategy also needs to restore some degree of
proportionality in the last-resort income given to different groups. An important
reason not to over-index pensioner benefits as discussed above is that,
particularly at a time when the government seeks to cap the overall welfare
budget, this potentially pre-empts resources that could be used for more
reasonable levels of support for working age adults without children. The
alternative is a strange reversal of a former world where the least privileged
members of society feared getting old, and risking destitution. Must they, in the
future, fear instead the vulnerability that comes as a working-age adult, where
social protection is now much weaker?

75
Centre for Research in Social Policy
References Adema, W. (2012). Setting the scene: the mix of family policy objectives and packages across the OECD. Children and Youth Services Review (34), 487-498. Age UK, n.d. Attendance allowance an care reform, briegin http://www.ageuk.org.uk/documents/en-gb/for-professionals/money-and-benefits/attendance_allowance_and_care_reform.pdf?dtrk=true Accessed 12/12/2013 Allen, G. (2011) Early Intervention: The Next Steps An Independent Report to Her Majesty’s Government. Alon, S. (2009) Who benefits most from financial aid? The heterogeneous effect of need-based grants on students’ college persistence. Social Science Quarterly, 92(3), 807-829. Barnard, H. (2013) Poorest families lose the 2013 budget childcare war (JRF blog). Barry, B. (1990). The welfare state versus the relief of poverty. In: Needs and Welfare. Sage Modern Politics Series. Sage Publications, pp. 73-103. Benabou, R., Kramarz, F. and Prost, C. (2009). The French zones d’éducation prioritaire: much ado about nothing?. Economics of Education Review (28), 345-356. Ben-Galim, D (2011) Making the case for universal childcare London: IPPR. Blades, R. (2012). Denmark case study. National Children's Bureau. Blanden, J and Gibbons, S (2006) The persistence of poverty across generations York: JRF. Bradshaw, J. (2012). The case for family benefits. Children and Youth Services Review (34), 590-596. Brady, D. and Burroway, R. (2012) Targeting, universalism, and single-mother poverty: a multi-level analysis across 18 affluent democracies. Demography (49), 710-746. Brewer, M. (2007). Welfare reform in the UK: 1997 - 2007. London: IFS. Brewer, M., Browne, J. and Joyce, R. (2011). Child and working-age poverty from 2010 to 2020. IFS. Brewer, M., et al. (2010). Child poverty in the UK since 1998-99: lessons from the past decade. IFS. Brewer, M. and Joyce, R. (2012). Withdrawing Child Benefit from better-off families: are there better options?. IFS.

76
Means testing or Universalism
Browne, J. and Hood, A. (2012). A survey of the UK benefit system. IFS. Cantillon, B., Marx, I. and Van Den Bosch, K. (2003). The Puzzle of Egalitarianism: About the Relationships between Employment, Wage Inequality, Social Expenditures and Poverty [Online]. Available from: http://www.sfi.dk/graphics/ESPAnet/papers/Cantillonmarx.pdf [Accessed 06/09/2013]. Chowdry, H., Greaves, E. and Sibieta, L. (2010). The pupil premium: assessing the options. London: IFS. ComRes (2012) Welfare poll. [Online]. Available from: http://www.comres.co.uk/polls/BBC_Welfare_Poll_November2012.pdf. [Accessed 13/11/14]. Dearden, L, Fitzsimons, E and Wyness, G. (2011) The impact of tuition fees and support on university participation in the UK. London: IFS. Department for Education (2012), Evaluation of the Free School Meals Pilot -Impact Report. Dickens, R. (2011). Child Poverty in Britain: Past Lessons and Future Prospects. National Institute Economic Review, 218(1), R7-R19. DWP (2013a). Households below average income: an analysis of the income distribution 1994/1995 - 2011/12 (United Kingdom). London: DWP. DWP (2013b). Quarterly Statistical Summary: August 2013 [Online]. Available from: https://www.gov.uk/government/publications/dwp-statistical-summaries-2013 [Accessed 21/09/2013]. DWP (2013c). The single-tier pension: a simple foundation for saving. London: DWP. Dynarski, S.M. (2003) Does aid matter? Measuring the effect of student aid on college attendance and completion. The American Economy Review, 93, 279-288. Energy Bill revolution (2013) “Cold kills more in temperate Britain than freezing Sweden” Available from: http://www.energybillrevolution.org/news/cold-kills-more-in-temperate-britain-than-freezing-sweden/ [Accessed 27 January 2013] Esping-Andersen, G. and Myles, J. (n.d.). The Welfare State and Redistribution [Online]. Available from: http://dcpis.upf.edu/~gosta-esping-andersen/articles.htm [Accessed 03/09/2013]. Garthwaite, K. ‘The language of shirkers and scroungers?’ Talking about illness, disability and coalition welfare reform. Disability and Society. 2011;26:369-372. Godwin, M. and Lawson, C. (2009). The working tax credit and child tax credit 2003-08: a critical analysis. Benefits, 17(1), 3-14.

77
Centre for Research in Social Policy
Guardiancich, I. (2010). Denmark: current pension system: first assessment of reform outcomes and output. European Social Observatory. Gugushvili, D and Hirsch, D (2014), Means-tested and universal approaches to poverty: international evidence and how the UK compares, Working paper, Loughborough: Centre for Research in Social Policy Hirsch, D. (2006). What will it take to end child poverty? York: JRF. Hirsch, D (2007) Experiences of poverty and educational disadvantage York: JRF. Hirsch, D. (2013a). A minimum income standard for the UK in 2013. Joseph Rowntree Foundation. Hirsch, D (2013b). The cost of a child in 2013. London: Child Poverty Action Group. Hirsch, D and Hartfree, Y (2013) Does universal credit enable households to reach a minimum income standard?. York: Joseph Rowntree Foundation. HMRC (n.d.b). A Guide to Child Tax Credit and Working Tax Credit [Online]. Available from: www.hmrc.gov.uk/leaflets/wtc2.pdf [Accessed 20/10/2013]. HMRC (n.d.). Child Benefit Rates [Online]. Available from: http://www.hmrc.gov.uk/childbenefit/payments-entitlements/payments/rates.htm HMRC (2011) Working Tax Credit: Take-up of Childcare Element 2008-09. HMRC (2012a). HM Revenue & Customs annual report and accounts 2011-12. London: Stationery office. HMRC (2012b). Child Benefit, Child Tax Credit and Working Tax Credit Take-Up Rates 2010-11. [Online]. Available from: http://www.hmrc.gov.uk/statistics/fin-takeup-stats/cwtc-take-up.pdf [Accessed 03/09/2013]. Institute of Fiscal Studies (2011), Cash by any other name? Evidence on labelling from the UK Winter Fuel Payment, IFS working paper 10/11 Irish National Disability Authority (2004) Disability and the cost of living. [Online]. Available from: http://www.nda.ie/cntmgmtnew.nsf/0/EF734FD9D0C04B3880256E690055CFFB?OpenDocument#indeconcontents. [Accessed 12/11/2013]. Kenworthy, L. (2011). Progress for the Poor. Oxford: Oxford University Press. Koopman-Boyden, P and Waldgrave, C (eds, 2009), Enhancing Wellbeing in an Ageing Society: 65 - 84 year old New Zealanders in 2007, Wellington: Family Centre Korpi, W. and Palme, J. (1998). The paradox of redistribution and strategies of equality: welfare state institutions, inequality, and poverty in the Western countries. American Sociological Review, 63(5), 661-687.

78
Means testing or Universalism
Le Grand, J. (1982). The strategy of equality: redistribution and the social services. London: G. Allen & Unwin. Ludwig, J and Miller, D. (2007), “Does Head Start Improve Children’s Life Chances?” Quarterly Journal of Economics, February. Maître, B., Nolan, B. and Whelan, C. T. (2005). Research note: welfare regimes and household income packaging in the European Union. Journal of European Social Policy, 15(2), 157-171. Marx, I., Salanauskaite, L. and Verbist, G. (2013). The paradox of redistribution revisited: and that it may rest in peace?. Bonn: IZA. Marx, I. and Nelson, K. (2013), Minimum income protection in flux Hampshire: Palgrave Macmillan. Melhuish, E., Belsky, J., Leyland, H, Barnes, J and the National Evaluation of Sure Start Research Team (2008), Effects of fully-established Sure Start Local Programmes on 3-year-old children and their families living in England: a quasi-experimental observational study”, The Lancet, Vol 372, November 8th. Middleton et al., 2005, Evaluation of Education Maintenance Allowance Pilots: Young People Aged 16 to 19 Years Final Report of the Quantitative Evaluation DFES Research Report 678. Mkandawire, T. (2005). Targeting and universalism in poverty reduction. UNRISD Social Policy and Development Programme Paper #23. NatCen (2013) British Social Attitudes Survey. [Online]. Available from: http://www.bsa-30.natcen.ac.uk/. [Accessed 15/10/2013]. Nelson, K. Universalism versus targeting: the vulnerability of social insurance and means-tested minimum income protection in 18 countries, 1990-2002. International Social Security Review, 60(1), 33-58. Obben, J. and Waayer, M. (2011). New Zealand's old-age pension scheme and household saving. International Journal of Social Economics, 38(9), 767-788. OECD (2001) Starting Strong – Early Childhood Education and Care OECD (2003) Transforming disability into ability: policies to promote work and income security for disabled people. Paris: OECD. OECD (2006) Starting Strong II: Early Childhood Education and Care OECD (2008). Growing unequal? Income distribution and poverty in OECD countries. Paris: OECD. OECD (2011a) Divided we stand: why inequality keeps rising. Paris: OECD.

79
Centre for Research in Social Policy
OECD (2011b). Pensions at a glance 2011: retirement-income systems in OECD and G20 countries. Paris: OECD. OECD (2011c). Doing better for families. Paris: OECD. OECD (2012a) Starting Strong III - A Quality Toolbox for Early Childhood Education and Care OECD (2012b) Education at a glance: OECD indicators. Paris: OECD. Office of the Deputy Prime Minister (2005), Mainstream public services and their impact on neighbourhood deprivation. OFSTED (2003). Excellence in Cities and Education Action Zones: Management and Impact [Online]. Available from: http://dera.ioe.ac.uk/4739/1/Excellence_in_Cities_and_Education_Action_Zones_management_and_impact_(PDF_format)%5B1%5D.pdf [Accessed 01/11/2013]. ONS (2013). The Effects of Taxes and Benefits on Household Income 2011/12 [Online]. Available from: http://www.ons.gov.uk/ons/rel/household-income/the-effects-of-taxes-and-benefits-on-household-income/2011-2012/etb-stats-bulletin-2011-12.html [Accessed 20/09/2013]. ONS (2011). Pension Trends [Online]. Available from: http://www.ons.gov.uk/ons/rel/pensions/pension-trends/index.html [Accessed 17/09/2013]. PPI (2011). The implications of government policy for future levels of pensioner poverty. Pensions Policy Institute. RCU (2007), Evaluation of the EMA National Roll-out, Preston: RCU RevenueBenefits (n.d.). Child Benefit and Guardian's Allowance: Policy Changes [Online]. Available from: http://www.revenuebenefits.org.uk/child-benefit/policy/policy-changes/#Withdrawal of child benefit for higher rate taxpayers [Accessed 18/10/2013]. Rothstein, B. (2001). The universal welfare state as a social dilemma. Rationality and Society, 13(2), 213-234. Salanauskaite, L. and Verbist, G. (2013). Is the neighbour's grass greener? Comparing family support in Lithuania and four other new member states. Journal of European Social Policy, 23(3), 315-331. Sefton, T. (2002). Recent Changes in the Distribution of the Social Wage [Online]. Available from: http://eprints.lse.ac.uk/6377/1/Recent_Changes_in_the_Distribution_of_the_Social_Wage.pdf [Accessed 03/09/2013].

80
Means testing or Universalism
Sen, A. (1995). The political economy of targeting. In: Van de Walle, D. and Nead, K. eds. Public Spending and the Poor: theory and Evidence. Baltimore: Johns Hopkins University Press. Smeeding, T. M. (2005). Public policy, economic inequality, and poverty: the United States in comparative perspective. Social Science Quarterly, 86(Supp), 955-983. Stuber, J. and Schlesinger, M. (2006). Sources of stigma for means-tested government programs. Social Science and Medicine, 63(4), 933-945. Sylva, K et al (2012). Effective pre-school, primary and secondary education project (DPPSE 3-14) Final Report from the Key Stage 3 Phase: Influences on Students’ Development from age 11-14 DFE Research Brief 202. Thurley, D. (2013). Single-Tier State Pension [Online]. Available from: www.parliament.uk/briefing-papers/sn06525.pdf [Accessed 15/12/2013]. Titmuss, R. M. (1968). Commitment to welfare. Allen & Unwin. UNICEF (2012). Measuring child poverty: new league tables of child poverty in the world's richest countries. Florence: Innocenti Research Centre. van Mechelen, N. and Bradshaw, J. (2013). Child benefit packages for working families. In: Marx, I. and Nelson, K. eds. Minimum Income Protection in Flux. Basingstoke: Palgrave Macmillan. van Oorschot, W. (2002). Targeting welfare: on the functions and dysfunctions of means-testing in social policy. In: Townsend, P., and Gordon, D., eds. World Poverty: New Policies to Defeat an Old Enemy. Bristol: Policy Press. Waldegrave, H (2013) Centres of Excellence? The role of Children’s Centresin early intervention. London: Policy Exchange Waddington, L. (2010) Disability benefits and entitlements in European countries: mutual recognition and exportability of benefits. [Online]. Available from: http://www.disability-europe.net/theme/disability-benefits [Accessed 10/11/2013]. Whiteford, P. (2008). How much redistribution do governments achieve? The role of cash transfers and household taxes. In: OECD ed. Growing Unequal? Paris: OECD. World Bank Population Ages 0-14. World Development Indicators [Online]. Available from: http://data.worldbank.org/indicator/SP.POP.0014.TO.ZS [Accessed 25/10/2013].