measure design effect and sample size
DESCRIPTION
This presentation is a brief introduction to the design effect, which is an adjustment that should be used to determine survey sample size.TRANSCRIPT
7/16/2019 Measure Design Effect and Sample Size
http://slidepdf.com/reader/full/measure-design-effect-and-sample-size 1/7
Prepared by Gene Shackman, NYS DOH, Presented at Albany Chapter of American Statistical Association, March 24, 2001
Sample size and design effect
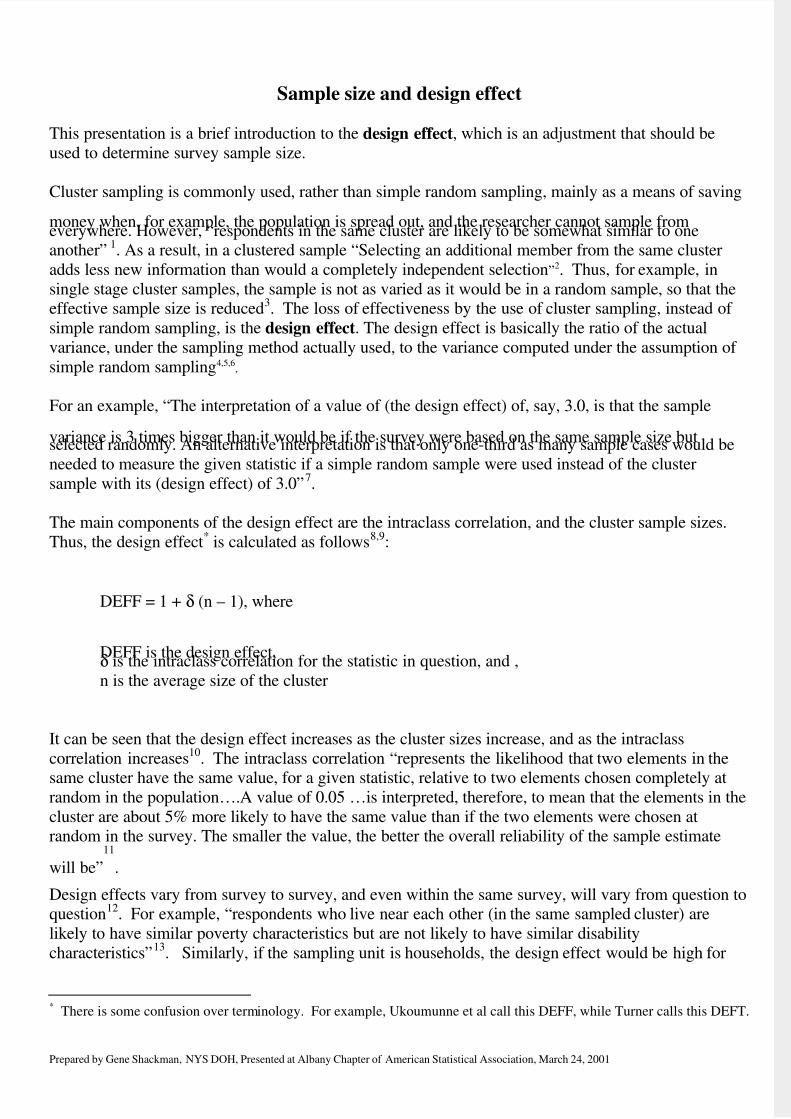
This presentation is a brief introduction to the design effect, which is an adjustment that should be
used to determine survey sample size.
Cluster sampling is commonly used, rather than simple random sampling, mainly as a means of saving
money when, for example, the population is spread out, and the researcher cannot sample fromeverywhere. However, “respondents in the same cluster are likely to be somewhat similar to oneanother” 1. As a result, in a clustered sample “Selecting an additional member from the same cluster
adds less new information than would a completely independent selection”2. Thus, for example, in
single stage cluster samples, the sample is not as varied as it would be in a random sample, so that theeffective sample size is reduced3. The loss of effectiveness by the use of cluster sampling, instead of
simple random sampling, is the design effect. The design effect is basically the ratio of the actual
variance, under the sampling method actually used, to the variance computed under the assumption of
simple random sampling4,5,6.
For an example, “The interpretation of a value of (the design effect) of, say, 3.0, is that the sample
variance is 3 times bigger than it would be if the survey were based on the same sample size butselected randomly. An alternative interpretation is that only one-third as many sample cases would be
needed to measure the given statistic if a simple random sample were used instead of the cluster
sample with its (design effect) of 3.0”7.
The main components of the design effect are the intraclass correlation, and the cluster sample sizes.
Thus, the design effect* is calculated as follows8,9:
DEFF = 1 + δ (n – 1), where
DEFF is the design effect,δ is the intraclass correlation for the statistic in question, and ,
n is the average size of the cluster
It can be seen that the design effect increases as the cluster sizes increase, and as the intraclass
correlation increases10
. The intraclass correlation “represents the likelihood that two elements in thesame cluster have the same value, for a given statistic, relative to two elements chosen completely at
random in the population….A value of 0.05 …is interpreted, therefore, to mean that the elements in the
cluster are about 5% more likely to have the same value than if the two elements were chosen atrandom in the survey. The smaller the value, the better the overall reliability of the sample estimate
will be”
11
.
Design effects vary from survey to survey, and even within the same survey, will vary from question toquestion12. For example, “respondents who live near each other (in the same sampled cluster) are
likely to have similar poverty characteristics but are not likely to have similar disability
characteristics”13
. Similarly, if the sampling unit is households, the design effect would be high for
*
There is some confusion over terminology. For example, Ukoumunne et al call this DEFF, while Turner calls this DEFT.

7/16/2019 Measure Design Effect and Sample Size
http://slidepdf.com/reader/full/measure-design-effect-and-sample-size 2/7
Prepared by Gene Shackman, NYS DOH, Presented at Albany Chapter of American Statistical Association, March 24, 2001
characteristics that are the same for all members of the household (e.g., ethnicity) and would be low for
characteristics that are different for different members of the household (e.g., education, age)14
.
Researchers also use the DEFT, which is the square root of the DEFF. The DEFT may be used to
reduce variability, since the DEFT is less variable than the DEFF15. The DEFT can also be useddirectly to estimate confidence intervals16,17.
The DEFT (Square root of DEFF) shows how much the sample standard error, and consequently the
confidence intervals, increases. Thus for example if the DEFT is 3, the confidence intervals have to be3 times as large as they would for a simple random sample18.
In sum, using a cluster sample generally requires either a larger sample size than a SRS, or using awider confidence interval. The design effect is used to determine how much larger the sample size or
confidence interval needs to be. The second handout lists a number of studies, and some information
about the studies, including the sampling design (if the information is available), the design effects andintraclass correlations found in these studies. The handout also lists some reports that describe
information about design effects. In general, for a well designed study, the design effect usually
ranges from 1 to 3. It is not uncommon, however, for the design effect to be much larger, up to 7 or 8,or even up to 30.
1
Alecxih, L, Corea J and Marker D. Deriving state-level estimates from three national surveys: A statistical assessment and
state tabulations. Department of Health & Human Services/ASPE. May 4, 1998.
<http://aspe.hhs.gov/health/reports/st_est/> Accessed 11 January 11, 2001. Section II B, Precision of estimates.
2Health Survey for England: The Health of Young People '95 – 97.
<http://www.official-documents.co.uk/document/doh/survey97/hse95.htm> see chapter 13, Survey Methodology and
Response, section 13.10 Estimating errors in complex sample designs: design factors, at
<http://www.official-documents.co.uk/document/doh/survey97/hs13.htm#13.10>
3 Levy PS and Lemeshow S. Sampling Populations: methods and applications. Third edition. John Wiley and Sons, Inc.
New York. 1999. Chapter 9, section 9.6.
4US Census Bureau. Technical Paper 63: Current Population Survey - Design and Methodology,
<http://www.bls.census.gov/cps/tp/tp63.htm> accessed 12 January, 2001. Page 14-8.
5Frongillo, EA. StatNews #12: Analysis of Complex Surveys. October 22, 1996. Cornell University, Office of Statistical
Consulting. College of Human Ecology and Agricultural and Life Sciences, Division of Nutritional Sciences.
<http://www.human.cornell.edu/Admin/StatCons/StatNews/stnews12.htm>
6Henry, GT. Practical Sampling. Sage Publications, 1990. Applied social research methods series, volume 21.
7
Turner, AG. Sampling Topics for Disability Surveys. United Nations Statistics Division, Technical Notes, December1996. Available at <http://www.undp.org/popin/demotss/tcndec96/tony.htm>
8Turner, op cit
9Ukoumunne OC, Gulliford MC, Chinn S, Sterne JAC, Burney PGJ. Methods for evaluating area-wide and organisation-
based interventions in health and health care: a systematic review. Health Technol Assessment 1999; 3(5). Available in
pdf format, at <http://www.hta.nhsweb.nhs.uk/HTAPUBS.HTM> The formula is on page 22.
10Anderson, J. Web page for AM306 Market Research Methods <http://www.alcd.soton.ac.uk/am306/> see section 4,
<http://lispstat.alcd.soton.ac.uk/am306/quant4.txt>
7/16/2019 Measure Design Effect and Sample Size
http://slidepdf.com/reader/full/measure-design-effect-and-sample-size 3/7
Prepared by Gene Shackman, NYS DOH, Presented at Albany Chapter of American Statistical Association, March 24, 2001
11Turner, op cit.
12Alecxih, L, Corea J and Marker D. op cit.
13Alecxih, L, Corea J and Marker D. op cit. Section II B, Effective Sample Sizes.
14 US Census Bureau. Technical Paper 63, op cit. Page 14-4.
15Flores-Cervantes, I., Brick, J.M., and DiGaetano, R. Report No. 4: 1997 NSAF Variance Estimation, March 1999. One
of the National Survey of America's Families Methodology Series, at
<http://newfederalism.urban.org/nsaf/methodology1997.html>
16Flores-Cervantes, et al, op cit.
17Carolina Population Center. Russia Longitudinal Monitoring Surey.
<http://www.cpc.unc.edu/projects/rlms/home.html>. See the Evaluation of Samples page, at
<http://www.cpc.unc.edu/projects/rlms/project/eval_sample.html>.
18Carolina Population Center, op cit.
Appendix
Annotated list of web sites or references that discuss design effect or intraclass
correlation, or that show design effects for studies.
Adelman, Clifford. Answers in the Tool Box: Academic Intensity, Attendance Patterns, and Bachelor's Degree Attainment.
Office of Educational Research and Improvement. U.S. Department of Education. June 1999.
<http://www.ed.gov/pubs/Toolbox/index.html> See: IV. Does It Make Any Difference? Common Sense and
Multivariate Analysis <http://www.ed.gov/pubs/Toolbox/Part4.html> The tables include showing some design
effects, starting with table 29. The design effects seem to be about 1.5. Also see Appendix A: Technical Notes and
Guidance <http://www.ed.gov/pubs/Toolbox/AppendixA.html> for a two sentence statement of how they got the
design effect. Part of this study was surveys of a national cohort from the time they were in the 10th grade in 1980 until
roughly age 30 in 1993. The web site doesn’t seem to include description of sample design.
Alecxih, Lisa, John Corea and David Marker. 1998. Deriving state-level estimates from three national surveys: A statistical
assessment and state tabulations. Department of Health & Human Services/ASPE.
<http://aspe.hhs.gov/health/reports/st_est/> Retrieved 11 January 11, 2001. Section II B, Precision of estimates says in
part: “The effective sample size is the actual sample size divided by the design effect. The design effect is a factor that
reflects the effect on the precision of a survey estimate due to the difference between the sample design actually used to
collect the data and a simple random sample of respondents. National in-person household surveys, such as the three
considered here, are conducted as stratified, multi-stage, clustered, area-probability surveys. By clustering the sampled
households in a limited number of geographic areas, the cost of data collection is significantly reduced. However,
respondents in the same cluster are likely to be somewhat similar to one another. As a result, a clustered sample will
generally not reflect the entire population as "effectively." Before selecting the sample of clusters, the country is stratified
based on characteristics believed to be correlated with the survey variables of greatest interest. This stratification produces
more precise survey estimates for targeted domains than an unstratified design. The design effect reflects all aspects of thecomplex sample design. While the design effect is different for each variable, experience with these surveys indicates that
the variables under study will have reasonably similar design effects. “
Also see III B. Effective Sample Size, Table 3. Estimated state-level design effects for the CPS and SIPP ,
where they show effect sizes, which vary from 1 to 1.3.
Amazigo Uche, Nancy Silva, Joan Kaufman and Daniel S. Obikeze. 1997. Sexual Activity and Contraceptive Knowledge
and Use Among In-School Adolescents in Nigeria. International Family Planning Perspectives,23:2833. Retrieved from
<http://www.undp.org/popin/journals/ifpp/ifpp231/2302897.htm>This was a survey of levels of knowledge and behavior with regard to sexuality, conception and contraception among
teenagers attending school in the southeastern Nigeria states of Anambra and Enugu. Amazigo et al write that for a cluster
7/16/2019 Measure Design Effect and Sample Size
http://slidepdf.com/reader/full/measure-design-effect-and-sample-size 4/7
Prepared by Gene Shackman, NYS DOH, Presented at Albany Chapter of American Statistical Association, March 24, 2001
sampling technique, the design effect is estimated at 2, referring to S.K. Lwanga and S. Lemeshow, Sample Size
Determination in Health Studies: A Practical Manual,World Health Organization, Geneva, 1991. The Amazigo et al web
site doesn’t say what sample design they use, beyond cluster sample.
Anderson, J. Web page for AM306 Market Research Methods <http://www.alcd.soton.ac.uk/am306/> see
section 4, <http://lispstat.alcd.soton.ac.uk/am306/quant4.txt> which says, in part
“The Design EFFect or DEFF increases as the number (or average number) of population units sampled per clusterincreases, as the population units in a cluster become more alike with respect to the variable being measured. “ And goes
on to discuss intraclass correlation, and shows some calculations
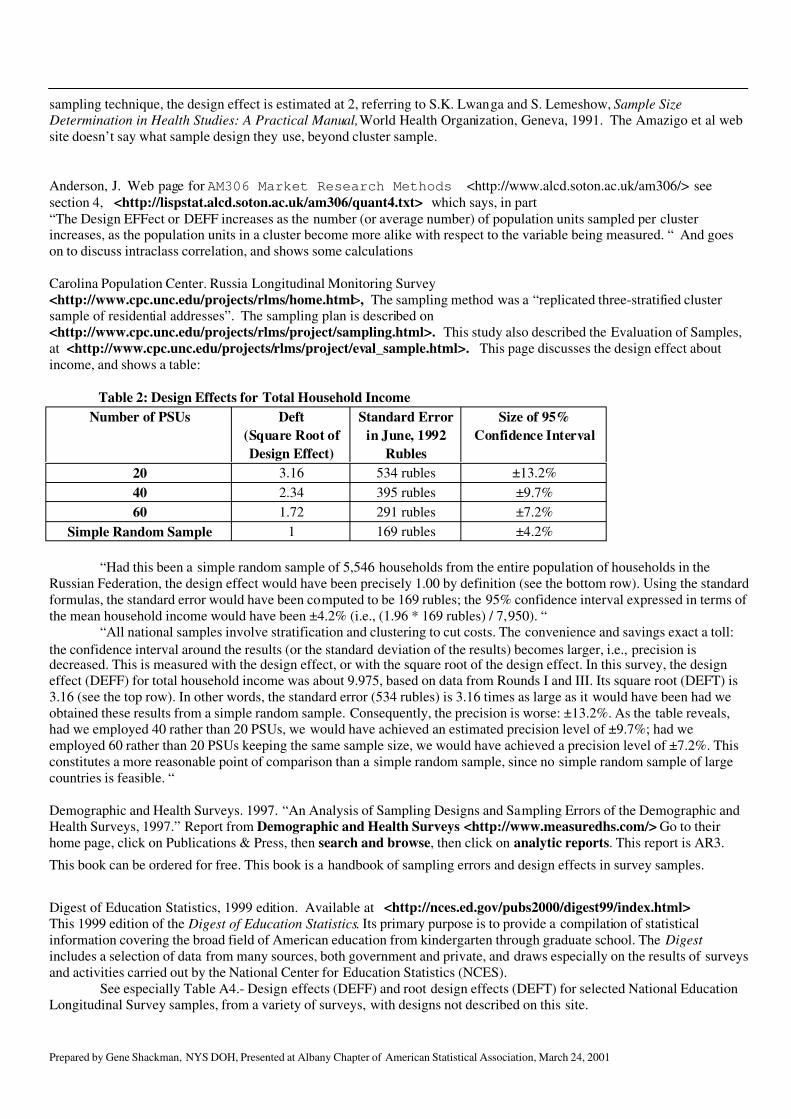
Carolina Population Center. Russia Longitudinal Monitoring Survey
<http://www.cpc.unc.edu/projects/rlms/home.html>, The sampling method was a “replicated three-stratified cluster
sample of residential addresses”. The sampling plan is described on
<http://www.cpc.unc.edu/projects/rlms/project/sampling.html>. This study also described the Evaluation of Samples,
at <http://www.cpc.unc.edu/projects/rlms/project/eval_sample.html>. This page discusses the design effect about
income, and shows a table:
Table 2: Design Effects for Total Household Income
Number of PSUs Deft Standard Error Size of 95%
(Square Root of in June, 1992 Confidence Interval
Design Effect) Rubles
20 3.16 534 rubles ±13.2%
40 2.34 395 rubles ±9.7%
60 1.72 291 rubles ±7.2%
Simple Random Sample 1 169 rubles ±4.2%
“Had this been a simple random sample of 5,546 households from the entire population of households in the
Russian Federation, the design effect would have been precisely 1.00 by definition (see the bottom row). Using the standard
formulas, the standard error would have been computed to be 169 rubles; the 95% confidence interval expressed in terms of
the mean household income would have been ±4.2% (i.e., (1.96 * 169 rubles) / 7,950). “
“All national samples involve stratification and clustering to cut costs. The convenience and savings exact a toll:
the confidence interval around the results (or the standard deviation of the results) becomes larger, i.e., precision isdecreased. This is measured with the design effect, or with the square root of the design effect. In this survey, the design
effect (DEFF) for total household income was about 9.975, based on data from Rounds I and III. Its square root (DEFT) is
3.16 (see the top row). In other words, the standard error (534 rubles) is 3.16 times as large as it would have been had we
obtained these results from a simple random sample. Consequently, the precision is worse: ±13.2%. As the table reveals,
had we employed 40 rather than 20 PSUs, we would have achieved an estimated precision level of ±9.7%; had we
employed 60 rather than 20 PSUs keeping the same sample size, we would have achieved a precision level of ±7.2%. This
constitutes a more reasonable point of comparison than a simple random sample, since no simple random sample of large
countries is feasible. “
Demographic and Health Surveys. 1997. “An Analysis of Sampling Designs and Sampling Errors of the Demographic and
Health Surveys, 1997.” Report from Demographic and Health Surveys <http://www.measuredhs.com/> Go to their
home page, click on Publications & Press, then search and browse, then click on analytic reports. This report is AR3.
This book can be ordered for free. This book is a handbook of sampling errors and design effects in survey samples.
Digest of Education Statistics, 1999 edition. Available at <http://nces.ed.gov/pubs2000/digest99/index.html>
This 1999 edition of the Digest of Education Statistics. Its primary purpose is to provide a compilation of statistical
information covering the broad field of American education from kindergarten through graduate school. The Digest
includes a selection of data from many sources, both government and private, and draws especially on the results of surveys
and activities carried out by the National Center for Education Statistics (NCES).
See especially Table A4.- Design effects (DEFF) and root design effects (DEFT) for selected National Education
Longitudinal Survey samples, from a variety of surveys, with designs not described on this site.

7/16/2019 Measure Design Effect and Sample Size
http://slidepdf.com/reader/full/measure-design-effect-and-sample-size 5/7
Prepared by Gene Shackman, NYS DOH, Presented at Albany Chapter of American Statistical Association, March 24, 2001
<http://nces.ed.gov/pubs2000/digest99/appendix-table04.html> showing deff and deft for surveys, varying from 1.5 to a
few cases of 6-8
Flores-Cervantes, I., Brick, J.M., and DiGaetano, R. Report No. 4: 1997 NSAF Variance Estimation, March 1999. One of
the National Survey of America's Families Methodology Series, at
<http://newfederalism.urban.org/nsaf/methodology1997.html> Section 1.2 is about design effects, and tables 1-1 to 1-9
show average, minimum and maximum design effects found in their studies. The averages range from 1 to 3, but the max
and min show considerable variation, from 0.3 to 14, although most are closer to the 1-4 range. Flores-Cervantes et al alsodiscuss the DEFT, the square root of the DEFF. Another report (Judkins, D., Shapiro, G., Brick, J.M., Flores-Cervantes, I.,
Ferraro, D., Strickler, T., and Waksberg, J., No. 2: 1997 NSAF Sample Design Report, March 1999.) shows the survey used
random digit dialing for the phone part of the survey, and a complex design for the remainder.
Frongillo, Edward A. 1996. StatNews #12: Analysis of Complex Surveys. Cornell University, Office of Statistical
Consulting. College of Human Ecology and Agricultural and Life Sciences, Division of Nutritional Sciences.
<http://www.human.cornell.edu/Admin/StatCons/StatNews/stnews12.htm>
“The consequence of multi-stage cluster sampling is that variances of estimates will typically be larger than in a simple
survey. We usually assume that the cluster sampling does not affect estimates themselves, only their variances. The effect
on variances of complex sampling is quantified as the design effect, which is the ratio of the variance under complex
sampling divided by the variance that would have been obtained if a simple survey of the same size could have been done.
Design effects can differ within the same survey markedly, depending upon the variable of interest, the sub-group of the
population, and, in regression analyses, the variables in the regression model. For example, across the means of fouranthropometric variables and six population subgroups in the second National Health and Nutrition Examination Survey,
estimated design effects ranged from 1.0 to 5.7.”
Gulliford Martin C, Obioha C. Ukoumunne, and Susan Chinn. 1999. Components of Variance and Intraclass Correlations
for the Design of Community-based Surveys and Intervention Studies. Data from the Health Survey for England 1994. Am
J Epidemiol;149:876-83. See abstract at <http://www.jhsph.edu/Publications/JEPI/may199/guillifo.htm>
Study of data from the Health Survey for England 1994. The sampling plan was, “households were sampled in 720 postal
code sectors nested within 177 district health authorities and 14 regional health authorities.” In these data, intraclass
correlations (ICCs) were inversely related to cluster size, but design effects could be substantial when the cluster size was
large. Most ICCs were below 0.01 at the district health authority level, and they were mostly below 0.05 at the postal code
sector level. At the household level, many ICCs were in the range of 0.0--0.3.
Hancock GR and Stapleton L. An Investigation of the Application of Structural Equation Models to
Multilevel Higher Education Data. <http://www.airweb.org/hancock.htm> Retrieved 11 January, 2001
This site includes a very brief description of intraclass correlation and design effect. “Previous research indicates that with
geographically-determined clusters, the intraclass correlation is relatively low on demographic variables (such as age and
gender) and higher for socioeconomic variables and attitudes (Kalton, 1977). In educational studies, the intraclass
correlations have been found to be rather high: between .3 and .4 due to classroom components when examining
mathematics achievement for U.S. eighth graders (Muthen, 1996).” (Link broken as of 28 February, 2001)
Kapil U, KS Sohal, TD Sharma, M Tandon and P Pathak. 2000 Assessment of iodine deficiency disorders using the 30
cluster approach in district Kangra, Himachal Pradesh, India. Journal of Tropical Pediatrics, Volume 46, Issue 5, pp. 264-
266: Abstract and full text (pdf) available at
<http://www3.oup.co.uk/tropej/hdb/Volume_46/Issue_05/460264.sgm.abs.html> They report using a design effect of
3.
Myatt, Mark. No date given. SampleXS. Located on “Some Free Public Health Software”
<http://www.myatt.demon.co.uk/>. This program is a sample size calculator, and has an extensive help document, which
has a section about design effect. Survey researchers might keep in mind that the “maximum error” has a default value of
0.5%. A more usual default value for behavioral surveys is 5%.
Nutrition planning, assessment and evaluation service, Food policy and nutrition division. 1990. Rome: Food and
Agriculture Organization of the United Nations <http://www.odc.com/anthro/docs/survey/toc.html> Section
“Calculating Sample Size”, <http://www.odc.com/anthro/docs/survey/ch4.html#CSS> includes a discussion on the need
to adjust sample size “When you use cluster sampling or think that the prevalence of disadvantaged households varies

7/16/2019 Measure Design Effect and Sample Size
http://slidepdf.com/reader/full/measure-design-effect-and-sample-size 6/7
Prepared by Gene Shackman, NYS DOH, Presented at Albany Chapter of American Statistical Association, March 24, 2001
considerably within different areas or groups of the project area, sample size should be increased by 50-100 percent if the
number of clusters selected is large and much more if the number is small. “
Office of Applied Studies. 1997. “National household survey on drug abuse: main findings.” Substance Abuse and Mental
Health Services Administration, Department of Health and Human Services. Appendix C. Sampling and Statistical
Inference, Sample Design Effects and Generalized Standard Errors. Retrieved from
<http://www.samhsa.gov/oas/NHSDA/1997Main/nhsda1997mfWeb-128.htm>
This section describes the methods used to approximate sampling variability by computing generalized Ses. This sectionalso lists tables of median design effects. Design effects vary by demographic characteristic, region, other factors, and
vary from about 1.4 to 6. Sampling procedure was multistage area probability sampling design.
Petronis, Kenneth R, and Eric D Wish. 1996. “Substance abuse and need for treatment in Maryland.” Conducted by Center
for Substance Abuse Research (CESAR) University of Maryland at College Park for Maryland Alcohol and Drug Abuse
Administration. <http://www.cesar.umd.edu/www2root/prod/docs/SUBNEED.TXT>
From appendix B, Methods.
STANDARD ERRORS The Waksberg-Mitofsky two-stage cluster design gives all residential telephone numbers an equal
probability of selection. However, the Waksberg-Mitofsky sampling design is not a simple random sampling procedure and
therefore standard errors, which assume a simple random sample, are not accurate. In order to estimate standard errors, the
design effect on this two-stage cluster design was estimated. This design effect also estimates the effect of the oversampling
described earlier. The square root of the design effect multiplied by the standard error yields the correctly estimated
standard error. Table B3 shows the estimated standard errors for statewide analysis. The square root of the average designeffect for statewide analysis is 1.423. (This is deft – the square root of the design effect.)
Prescott-Clarke, Patricia and Paola Primatesta. 1999. Chapter 13, “Survey methodology and response” Section 10.
“Estimating errors in complex sample designs: design factor”. in Health Survey for England: The Health of Young People
'95 – 97. Retrieved 22 February 26, 2001 from
<http://www.official-documents.co.uk/document/doh/survey97/hse95.htm>See section 13.10 Estimating errors in complex sample designs: design factors, at <http://www.official-
documents.co.uk/document/doh/survey97/hs13.htm#13.10>
“The net effect of clustering, stratification and other factors is that the standard errors of these 'complex' sample
designs tend to be greater than those of a simple random sample (which is rarely encountered in practice). The ratio of the
standard error of the complex sample to that of the simple random sample is known as the design factor. This design factor,
usually abbreviated to 'deft', is the factor by which the standard error of an estimate from a simple random sample has to be
multiplied to give the true standard error of the complex design.”“Defts vary from one estimate to another within the same survey. They are affected by the average number of
interviews per sampling point with the sub-group being analysed: the smaller this is, the lower the deft will tend to be
(provided the interviews are evenly spread across sampling points). But an uneven spread of interviews between sampling
points will tend to increase defts, as can be the case with, for example, a social class group.”
Their design is: The Health Survey uses a multi-stage design involving the stratified selection of a sample of postal
sectors. The addresses selected for the survey are confined to these sectors and are thus clustered. In addition, since more
than one interview may be made at one address, there is clustering of interviews within addresses as well as within postal
sectors.
Siddiqui Ohidul, Donald Hedeker, Brian R Flay, and Frank B Hu. 1996. Intraclass Correlation Estimates in a School-based
Smoking Prevention Study.Outcome and Mediating Variables, by Sex and Ethnicity. American Journal of Epidemiology.
August 15, 1996 - Volume 144 Number 4. Abstract is available at
<http://www.jhsph.edu/Publications/JEPI/aug2abs/siddiqui.htm>This abstract just mentions that they present intraclass correlations for educational studies.
SDA: Survey Documentation and Analysis. SDA is a set of programs for the documentation and Web-based analysis of
survey data. <http://csa.berkeley.edu:7502/> See ONLINE HELP FOR SDA 1.2 ANALYSIS PROGRAMS at
<http://csa.berkeley.edu:7502/HELPDOCS12/helpan.htm>Section Additional statistics to display (for complex probability samples) says: “The Design Effect (DEFT) is
the ratio of the complex standard error divided by the SRS standard error. It indicates how much the standard error has been
inflated by the complex sample design. For example, a DEFT of 1.25 means that the calculated standard error is 25 percent
larger than the standard error of a simple random sample of the same size.”
7/16/2019 Measure Design Effect and Sample Size
http://slidepdf.com/reader/full/measure-design-effect-and-sample-size 7/7
Prepared by Gene Shackman, NYS DOH, Presented at Albany Chapter of American Statistical Association, March 24, 2001
Section Diagnostic output for standard errors (for complex probability samples) , says “The effect of clustering
on the size of standard errors depends on two factors: b (average cluster size, combined across strata), which is reported in
the diagnostic table, and rho (the intra-cluster correlation) which is reported (optionally) in the main table. The relationship
between these factors and DEFF, the design effect in terms of sampling variances (the square of the DEFT reported in the
main table), is given by Kish (Survey Sampling, pp. 161-164) as: DEFF = 1 + (rho)(b-1) “
Survey Research Methods Section of ASA. Summary of Survey Analysis Software.<http://www.fas.harvard.edu/%7Estats/survey-soft/sas.html>Not directly about design effect, but about sas survey sampling, which can account for complex survey designs.
Suwal Bhim Raj, Bal Kumar KC and Keshab Presad Adhikari. 2000. “Child Labour Situation in Nepal.” Central
Department of Populatoin Studies at Trbhuvan University.
<http://www.ilo.org/public/english/standards/ipec/publ/field/asia/nepal/sit/index.htm> A report from the International
Programme on the Elimination of Child Labour. See
<http://www.ilo.org/public/english/standards/ipec/publ/field/asia/nepal/sit/s_ch22.htm>
This page describes some technical details about a Migration and Employment Survey. They include a table showing
design effects, varying from less than 1 to over 3, and intraclass correlations, varying from 0.002 to 0.08. The table is
Table 2.4: Sample Statistics for Some Selected Variables by Rural-Urban Residence, M/E Survey, 1995/96. Also,
according to the methods page,
<http://www.ilo.org/public/english/standards/ipec/publ/field/asia/nepal/sit/s_ch21.htm> this was a multistage stratifiedsampling strategy.
Turner, Anthony G. 1996. Sampling Topics for Disability Surveys. United Nations Statistics Division, Technical Notes.
Available at <http://www.undp.org/popin/demotss/tcndec96/tony.htm>
Includes a discussion on design effect and how to calculate it. This paper refers to design effect as DEFT, while most
others use DEFF.
Ukoumunne OC, Gulliford MC, Chinn S, Sterne JAC, Burney PGJ. Methods for evaluating area-wide and organisation-
based interventions in health and health care: a systematic review. Health Technol Assessment 1999; 3(5).
Executive summary is at <http://www.hta.nhsweb.nhs.uk/execsumm/summ305.htm>
The paper is available in pdf format, at <http://www.hta.nhsweb.nhs.uk/HTAPUBS.HTM> From health technology
assessment publications. Chapter 4 includes a discussion of intraclass correlations and design effect, and shows how to
calculate design effect for different research designs. Tables in Chapter 9 show intraclass correlations and design effectsfor various medical outcomes from several data sets.
US Census Bureau. Technical Paper 63: Current Population Survey - Design and Methodology,
<http://www.census.gov/prod/www/abs/popula.html#techpap> and <http://www.bls.census.gov/cps/tp/tp63.htm>
Chapter 14, Estimation of Variance, includes a table: 14-5. Design effects for total monthly variances. Design effects vary
from .4 - .8 for total labor force, to 1.2 to 4 for Employed – Agriculture. The variation within each employ group is for
different race/ethnic groups.
Waksberg, Josheph, Daniel Levine, David Marker. 2000. Assessment of Major Federal Data Sets for Analyses of Hispanic
and Asian or Pacific Islander Subgroups and Native Americans, Extending the Utility of Federal Data Bases. Washignton
DC. Office of the Assistant Secretary for Planning and Evaluation, U.S. Department of Health and Human Services.
Available at <http://aspe.hhs.gov/hsp/minority-db00/task3/index.htm> Section 2.3 discusses design effects.