measured insights from soil - water - plant - atmosphere dynamics · 2017-09-22 · measured...
TRANSCRIPT

Measured Insights from Soil - Water - Plant - Atmosphere Dynamics
How soil water and weather data are now used for management and research in plant production and hydrology
By Peter BussAgronomist & Manager of R&D

The Soil-Water-Plant-Atmosphere-Continuum
(Hillel, D. 1998)
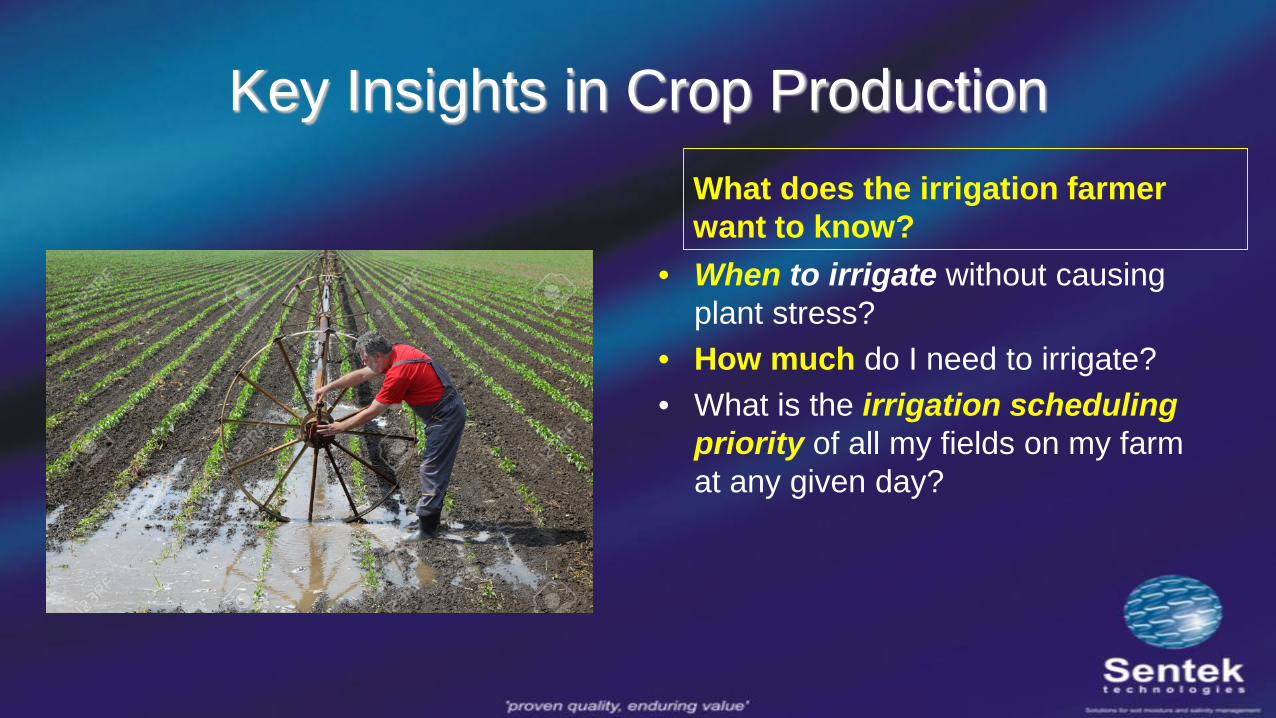
Key Insights in Crop ProductionWhat does the irrigation farmer want to know?
• When to irrigate without causing plant stress?
• How much do I need to irrigate?• What is the irrigation scheduling
priority of all my fields on my farm at any given day?

Key Insights in Crop Research & Hydrology
What does the Researcher want to know?
• How can I identify plant stress days and relate them to yield?
• Can I select more drought tolerant varieties by comparing depth and activity of root zones?
• What is the speed of water infiltration into a given soil type?
• Can I measure water drainage losses or water recharge rates?
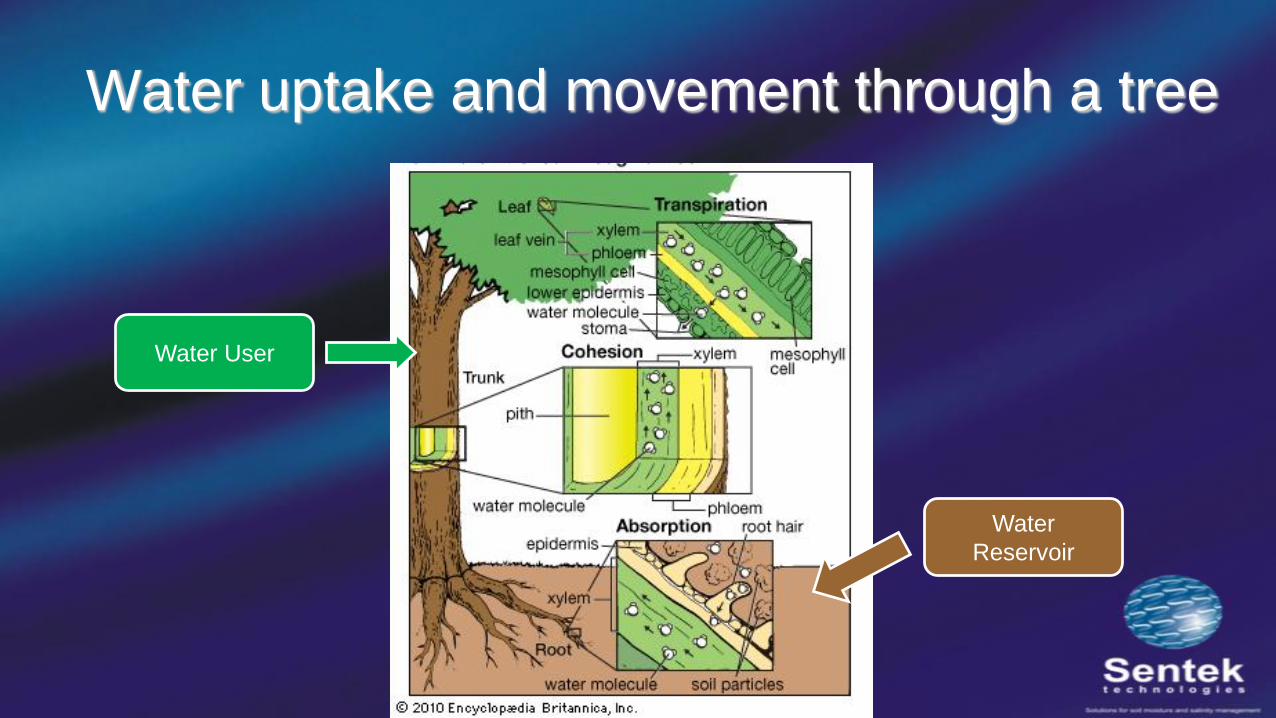
Water uptake and movement through a tree
Water User
Water Reservoir
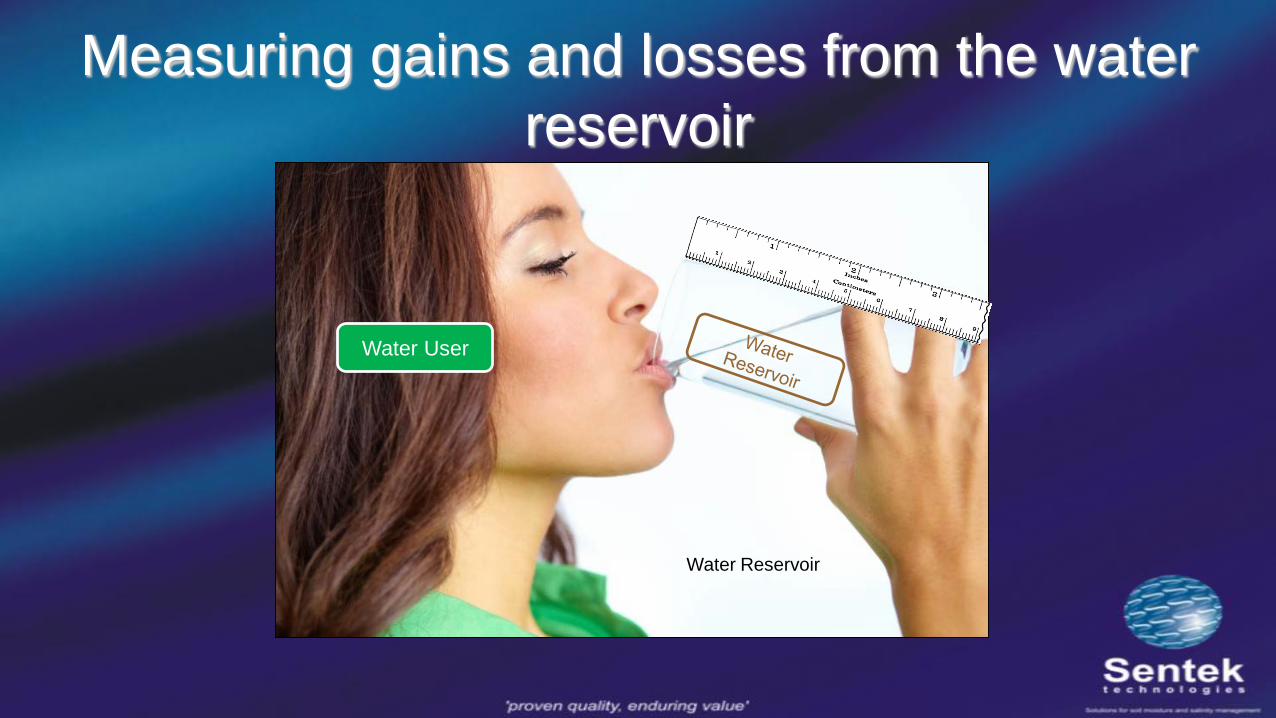
Measuring gains and losses from the water reservoir
Water Reservoir
Water User
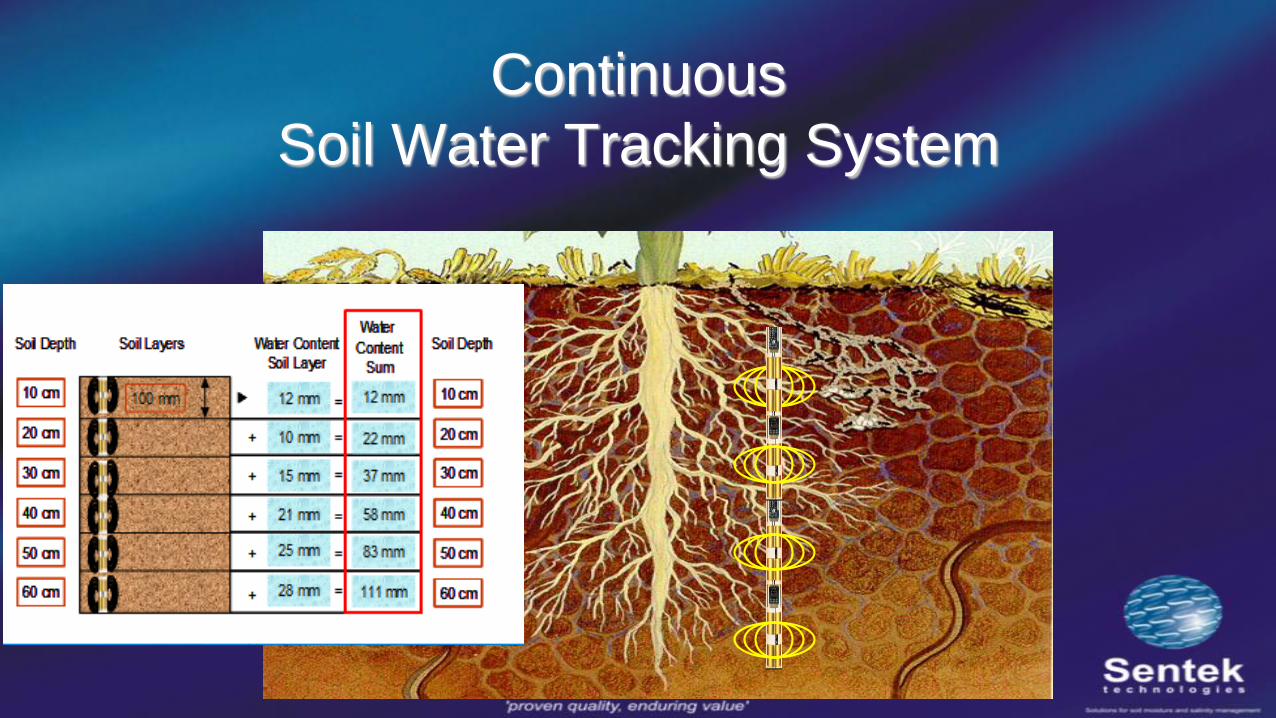
Continuous Soil Water Tracking System
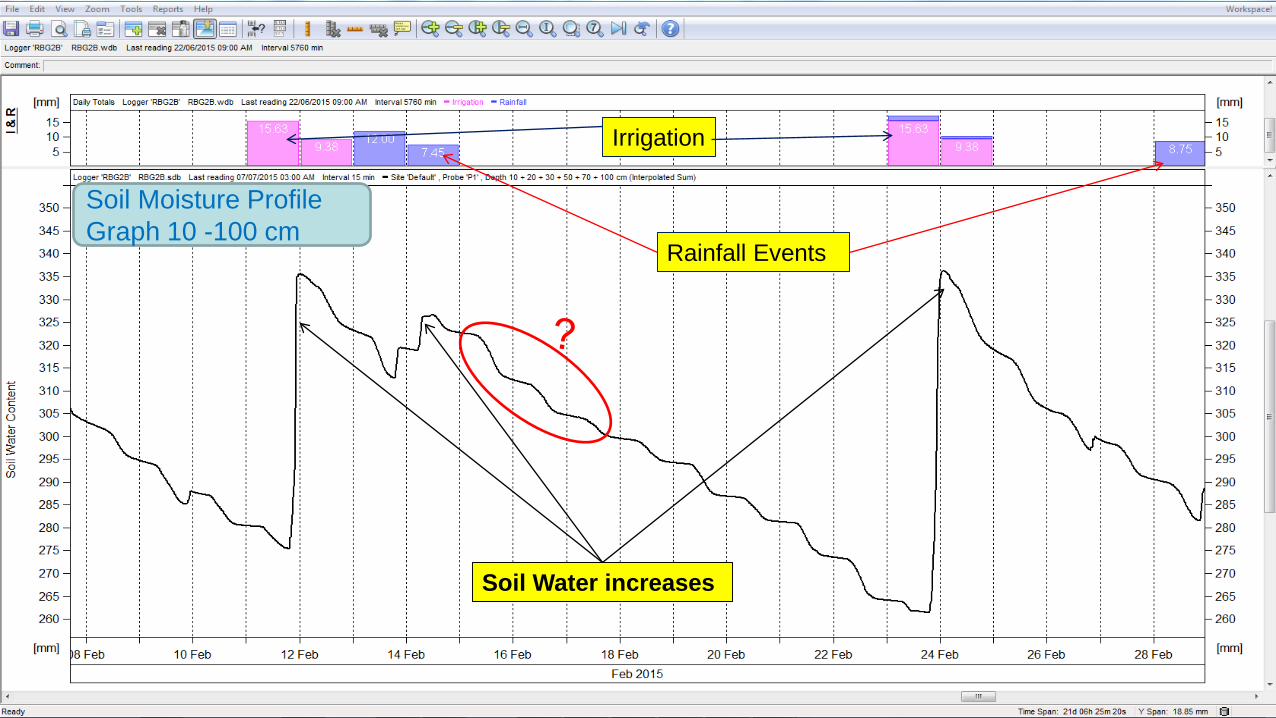
Irrigation
Rainfall Events
Soil Water increases
Soil Moisture Profile Graph 10 -100 cm

Start of plant water uptake
Daily “Drink”
End of plant water uptake

Daily Evapotranspiration ET in mm
Small Daily “Drink”
Larger Daily “Drink”
Relationship between ET and Tree Water Use
Small Daily “Drink”
Larger Daily “Drink”
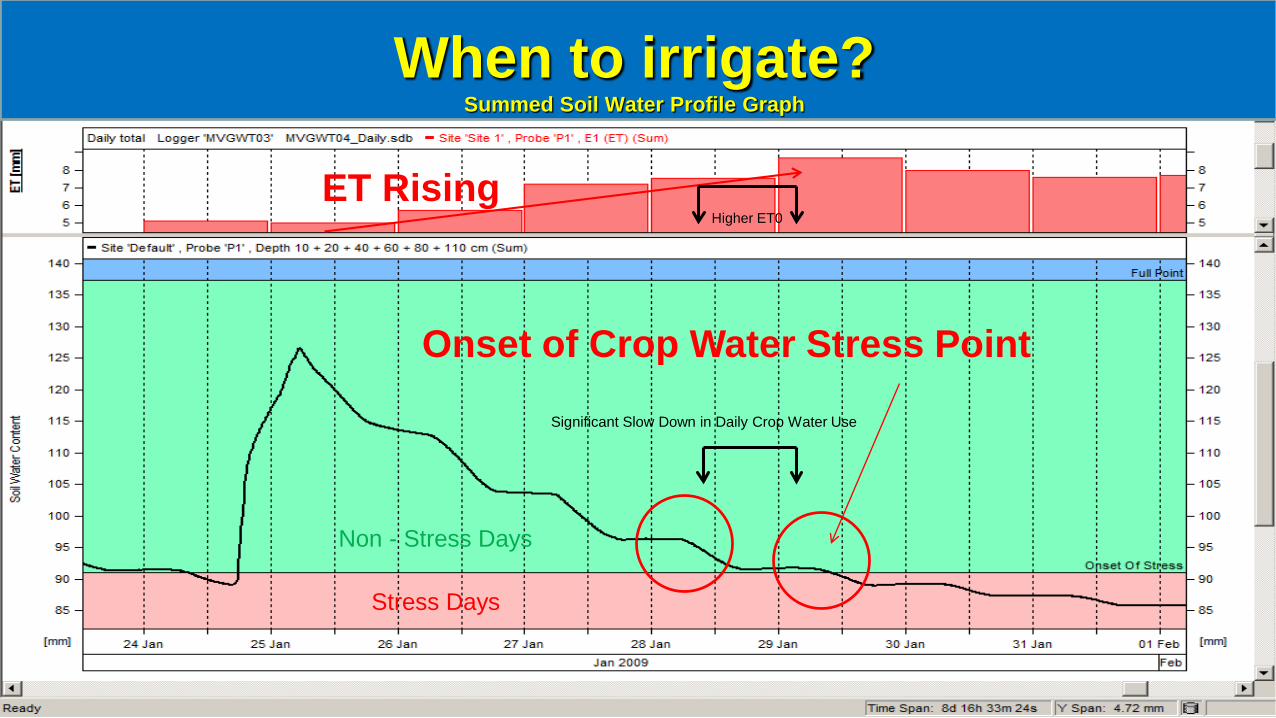
ET Rising
Onset of Crop Water Stress Point
When to irrigate? Summed Soil Water Profile Graph
Higher ET0
Significant Slow Down in Daily Crop Water Use
Stress Days
Non - Stress Days

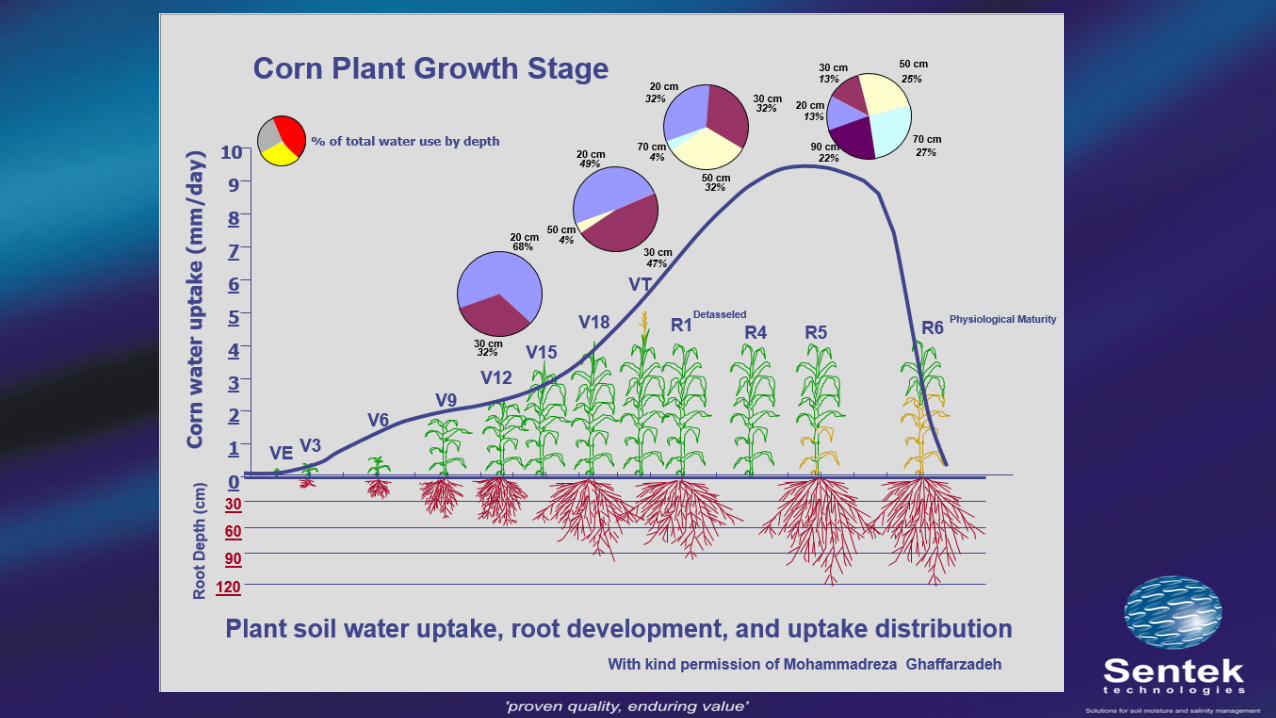
Identify the Depth of a developing Rootzone

Setting the Full Pointconsidering the active root zone
The Full Point Indicator Irrigation
Bottom of active Root Zone
Waste of Water & Fertilizer
Irrigation 8 Feb.

Setting the Full Point
Irrigation 8 Feb.

Infiltration Rate
10cm
20cm30cm
40cm
80cm
Time of Day
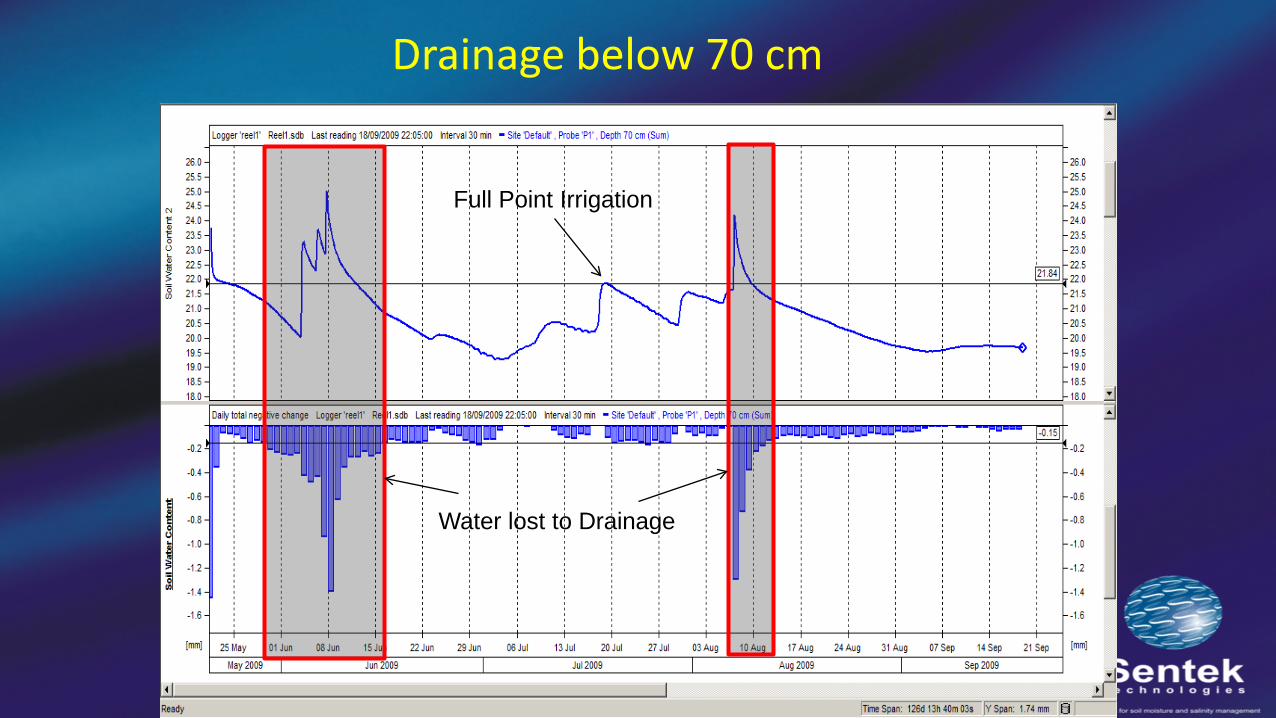
Drainage below 70 cm
Water lost to Drainage
Full Point Irrigation

Duration of Water Logging – 48
hours
“Field Capacity”
Saturation

Temporary slow down of daily crop water use and growth caused by water logging after an
irrigation.
Water Logging

Water Logging Stress Days 15.52 days = 37.5 % of time
Drought Stress Days 5.99 days = 14.5 % of time

0
20
40
60
80
100
120
140
160
180
0 10 20 30 40 50
Number of Stress Days
Cor
n G
rain
Yie
ld (B
u a-1
)Wet YearMild DroughSever Drought
50% yield loss
~15 days
Sources: USDA- ARS Hydrology and Remote sensing Laboratory
Corn Grain Yield and Number of Stress Days
Wet Year
Mild Drought
Severe Drought
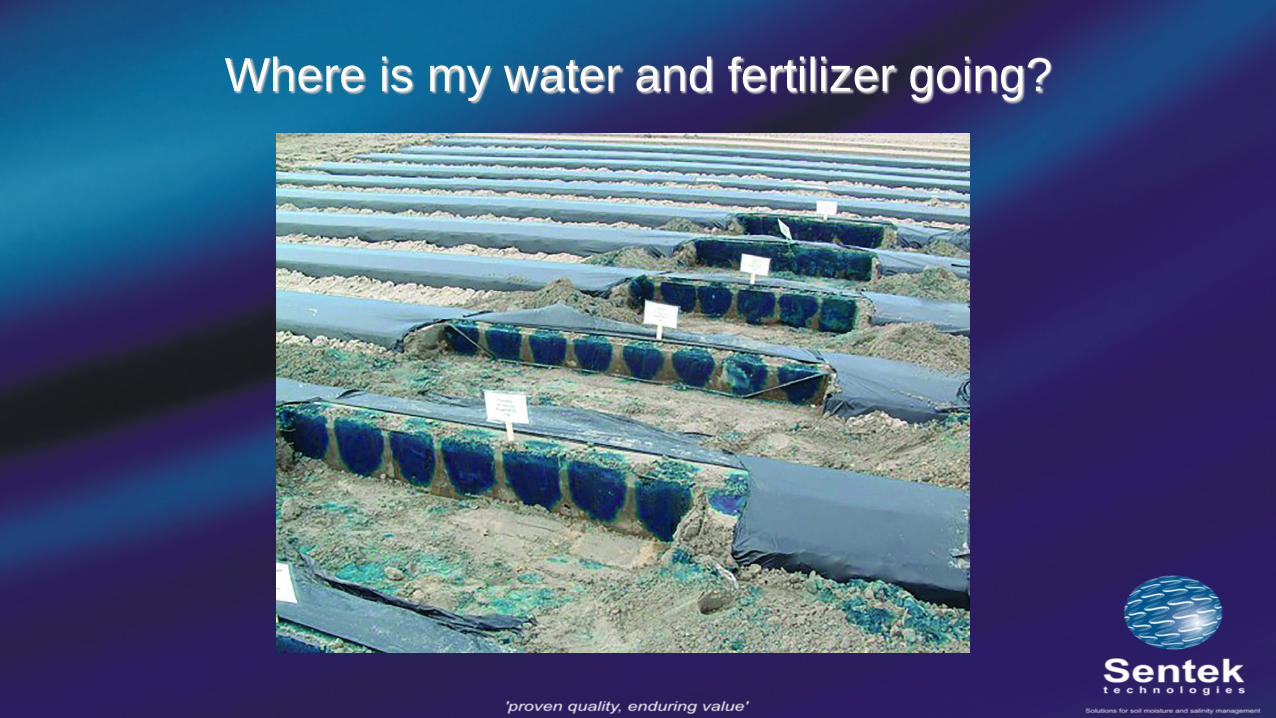
Where is my water and fertilizer going?
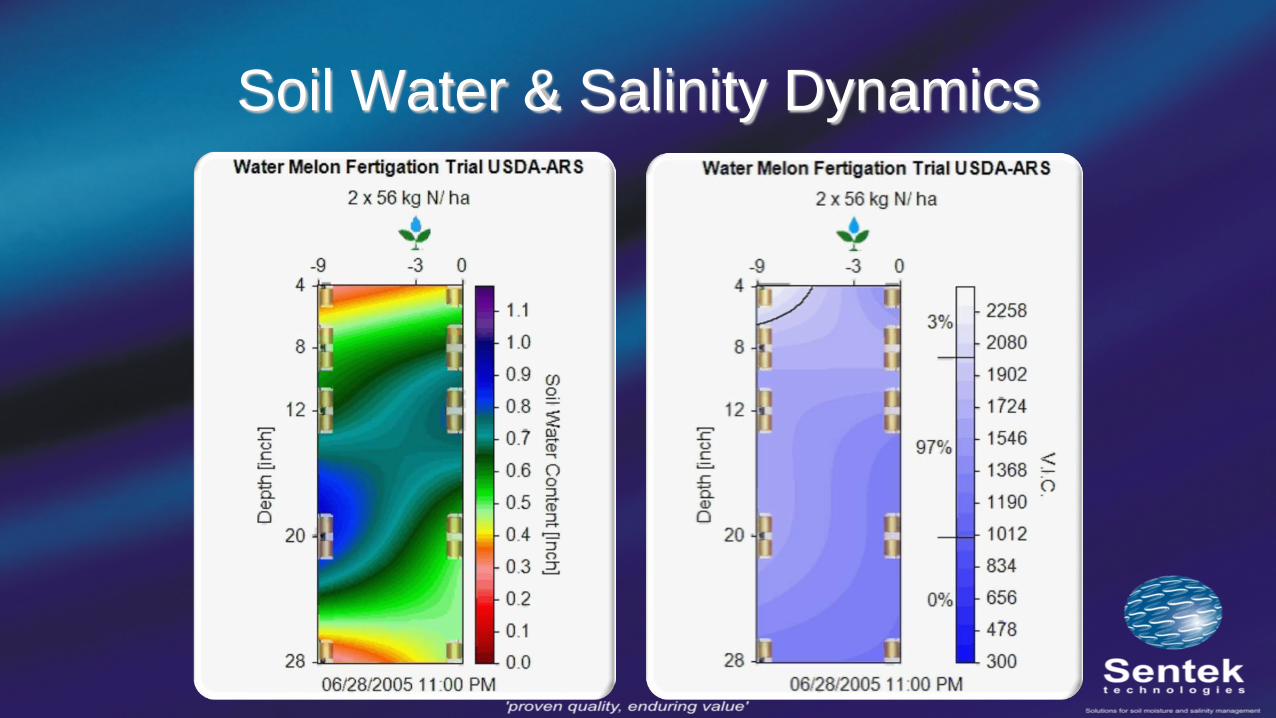
Soil Water & Salinity Dynamics

How? The Technology
Peter Enterprise
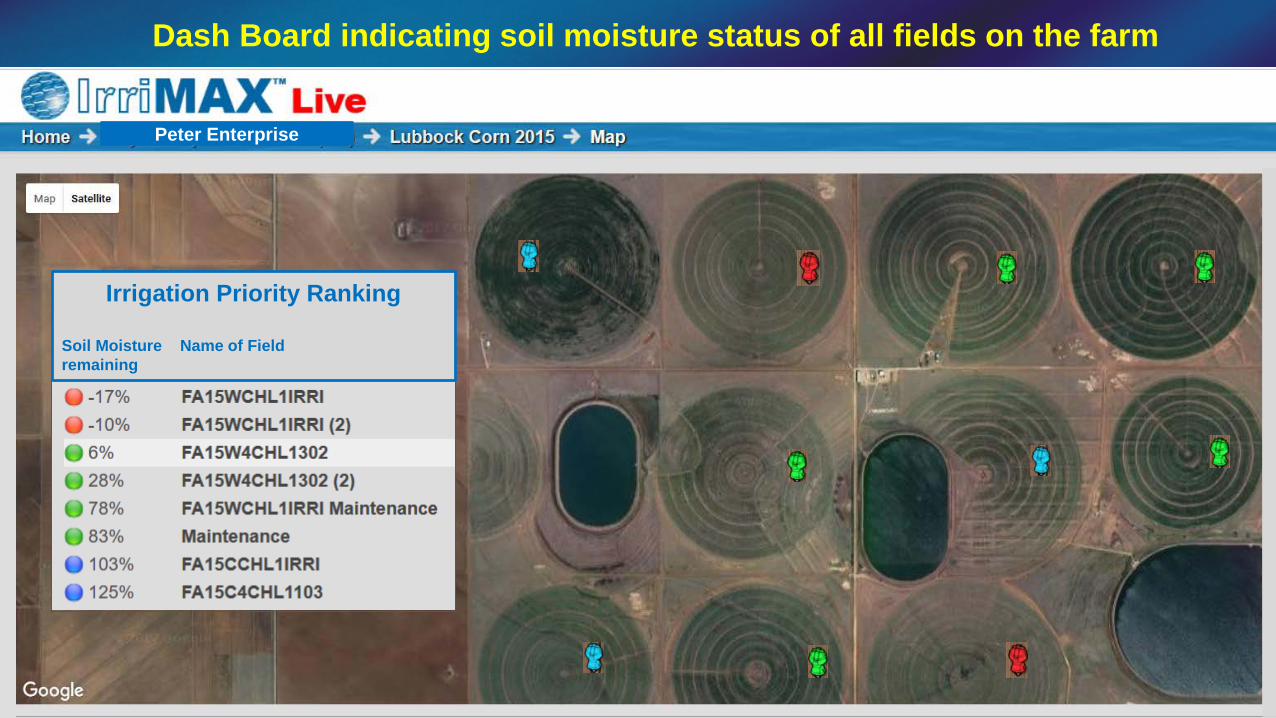
Dash Board indicating soil moisture status of all fields on the farm
Irrigation Priority Ranking
Soil Moisture Name of Fieldremaining

Distribution of Water Management Information to Irrigators
Internet
Internet
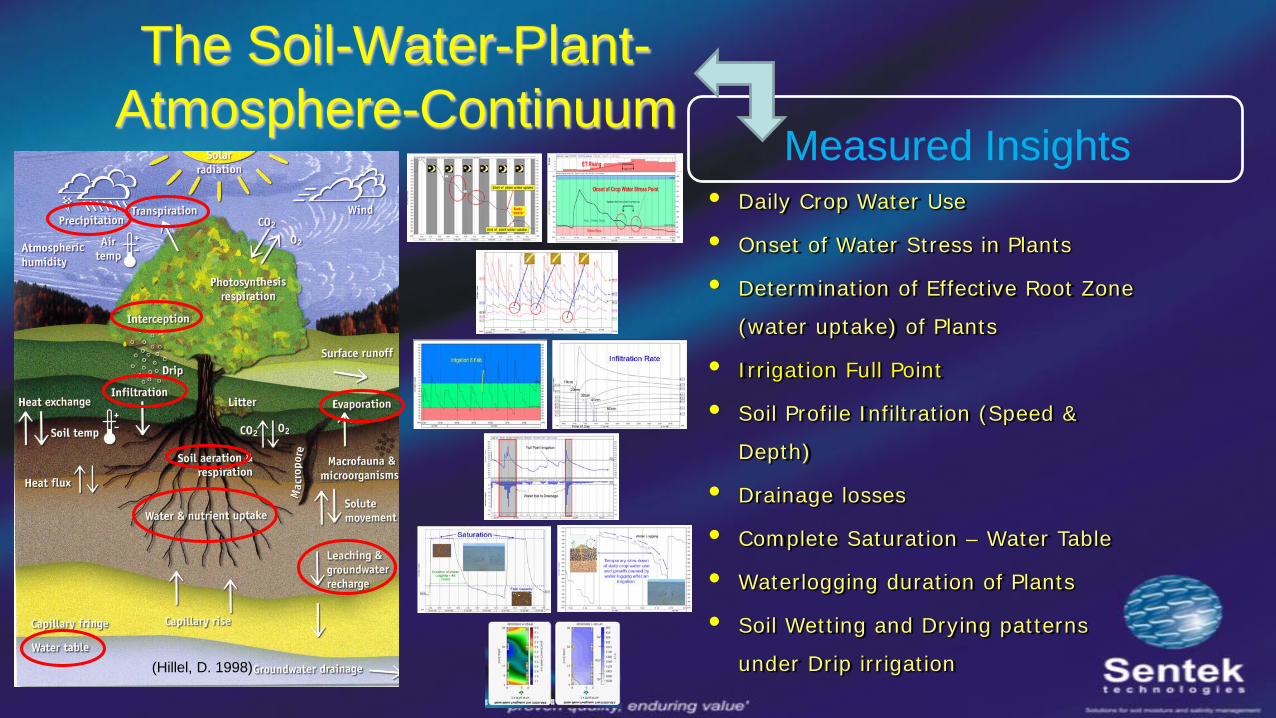
The Soil-Water-Plant-Atmosphere-Continuum
(Hillel, D. 1998)
• Daily Crop Water Use
• Onset of Water Stress in Plants
• Determination of Effective Root Zone
(water uptake) of Plants
• Irrigation Full Point
• Soil Profile Infiltration (Speed &
Depth)
• Drainage losses
• Complete Saturation – Water Table
• Waterlogging duration of Plants
• Soil Wetting and Drying patterns
under Drip irrigation
Measured Insights