measurement and formulation of the thermodynamic
TRANSCRIPT

3282 (RP-588)
Measurement and Formulation of the
Thermodynamic Properties of Refrigerants
134a (1,1,1,2-Tetrafluoroethane) and
123 (1, 1-Dichloro-2, 2, 2-Trif luoroethane)
M.O. Mclinden, Ph.D. J.S. GallagherAssociate Member ASHRAE
D. Ward A.R.H. Goodwin, Ph.D.
H.B. Chae, Ph.D. T.J. Bruno, Ph.D.
ABSTRACT
The thermodynamic properties of R134a and R123 are formulated using a modified Benedict..JNebb-_Flubin (MBWR) equation of state fit to experimental measurements of the critical point, vapor pressure, saturated liquid and vapor volumes, superheated pressure-volumetemperature (p-V-T) behavior, and second vif1a/ coefficients derived from p-V-T and sound speed measurements. The heat capacity of the ideal gas reference state is determined from sound speed measurements on the low density vapor. Surface tensions are also presented. The experimental methods and results are summarized, compared to the property formulation and, where 'possible, compared to other sources in the literature. Tables and diagrams of the thermodynamic properties of R134a a.nd R123, prepared using the MBWR equation of state, are presented. While the various measurements cover different ranges of temperature and pressure, the MBWR formulation is applicable in both the liquid and vapor phases at pressures up to 10,000 kPa (1500 psla); the applicable temperature range Is 233 to 450 K (-400 to 350°F) for R134a and 255 to 450 K (0° to 350°F) for R123.
INTRODUCTION
The advent of the Montreal Protocol restricting the future production of certain fully halogenated chlorofluorocarbon (CFC) refrigerants and more recent calls from many quarters to completely or nearly completely ban their pro-
L.A. Weber, Ph.D. G. Morrison, Ph.D.
M.R. Moldover, Ph.D. J.W. Schmidt, Ph.D.
J.F. Ely, Ph.D. M.L. Huber, Ph.D.
duction present a major challenge to the refrigeration industry. There are a number of very promising fluids that may serve as substitutes, either as pure fluids. as constituents of mixtures, or both. In particular R134a (CF3CFH2} and R123 (CCl2HCF3) have emerged as leading candidates to replace R12 and R11, respectively; They are under active worldwide development by a number of chemical manufacturers working with the refrigeration and airconditioning industry.
In order to evaluate the performance (energy efficiency, capacity, etc.) of these or any other replacement working fluids in heat pumping, air-conditioning, or refrigerating applications, a complete set of thermodynamic properties is required. Development efforts by equipment manufacturers have been hampered by property data that are sparse, conflicting, proprietary or , in some cases, simply unavailable (Hickman 1988). The situation with R134a has been considerably improved by the recent publication of measurements by Wilson and Basu (1988) and Kabata eta!. (1988). The data for·R123, however, remain very sparse. at least in the open literature. Even for R134a, values listed on property summary sheets prepared by various chemical manufacturers are often inconsistent.
The objectives of the present project are to measure for R134a and R123 the basic data necessary to define the thermodynamic surface, to fit these data, along with other data available in the literature, to an equation of state, and
M.O. Mclinden, T.J. Bruno, and M.L. Huber are chemical engineers and J.F. Ely is a group leader in the Thermophysics Division, National Institute of Standards and Technology, Boulder, CO; J.S. Gallagher, L.A. Weber, and J.W. Schmidt are physicists,G. Morrison is a research chemist , A.R.H. Goodwin and H.B. Chae are guest workers, and M.A. Moldover is a group leader inthe Thermophysics Division and D. Ward is an engineering technician in the Building Environment Division, NIST, Gaithersburg, MD.
263

to use this equation of state to generate tables anddiagrams of the thermodynamic properties. This paper willfocus on the last two aspects-fitting the data and presenting them in a convenient and usable form. The measurement techniques themselves and the rationale behindthem will be outlined, but the full details, including the actual experimental data, will be presented elsewhere (e.g., Chae et al. 1989; Goodwin and Mo/dover 1989; Weber1989; Morrison and Ward 1989; Weber and Levelt-Sengers1989). Any property formulation is merely a correlation ofthe actual thermodynamic behavior of a fluid and istherefore subject to change as additional experimental ortheoretical information becomes available. The propertyformulations to be presented here are felt to represent theactual thermodynamic properties of these fluids as well aspossible given the present data; while fully adequate forengineering calculations, they must. however, be considered provisional. A final formulation of properties mustawait more extensive measurements, which should beunder way by the time this report is published.
REQUIREMENTS FOR THE DEFINITION
OF THE THERMODYNAMIC SURFACE
For calculations involving thermodynamic properties, one rarely has a collection of experimental data that is sufficiently large to permit interpolation at all points of interest .Instead one employs an equation of state. An equation ofstate is a function that can correlate all the thermodynamicproperties of a fluid in a consistent way. Furthermore, it isa fundamental relationship from which all the thermodynamic properties of a material can be derived by applying the appropriate thermodynamic operations. Anequation of state thus allo'NS the calculation of quantities,such as entropy, that may not have been, or cannot be,directly measured.
An equation of state typically expresses the pressure, p, as a function of absolute temperature, T, molar volume, 1/, and a set of adjustable parameters, a;:
p = f(T, V, a1) (1)
Other thermodynamic quantities are obtained bymanipulation of Equation 1. Integration of Equation 1 overvolume yields the Helmholtz free energy:
A= - f p dV (2)
Care must be taken in choosing the limits of this integration;the most convenient choice for the upper limit is V = oo,where all gases follow the ideal gas law:
p = RT/V (3)
In the limit of V = oo, however, the integral of pdV diverges;this problem is avoided by integrating over the differencebetween the actual pressure as given by Equation 1 andthe pressure of the ideal gas reference state (Equation 3)to obtain the difference between the actual Helmholtz freeenergy, A. and that of the reference state, A0
:
A(V,T)-A'(V,T) = im(p-RT/V)dv (4)
V
264
Once the Helmholtz free energy is evaluated. the otherthermodynamic functions follow Entropy 1s given by
S
= - [!i] (5)
V
· so that the difference between S and the reference stateentropy is given by the derivative of Equation 4:
s-S' = -[:r(A-A')J,
(6)
The results of the integration in Equation 4 and the differentiation in Equation 6 represent only the volume dependence of A and S. The temperature dependence of thesequantities is contained in the ideal gas reference state; forentropy:
T
So = Srer + f. q,/ T dT (7) T ref
where T,et is an arbitrary reference temperature at whichentropy is set to an arbitrary reference value, S,e1; a common choice for refrigerants is S,et = 0 at T,e1 = 233.15 K (-40° F). Thus, in addition to an equation of state (e.g., Equation 1) a second fundamental requirement to define the thermodynamic behavior of a fluid is knowledge of cg,the heat capacity of the vapor in the limit of zero pressure. (Other reference states, which, in turn, would require calorimetric information other than cg, can be defined. Thechoice of the ideal gas reference state and the resultingneed for � information is the most convenient from bothnumerical ;nd experimental viewpoints.)
_ The other thermodynamic quantities arise by similaroperations. As examples:
H = -A+ TS+ pV (8)
H...:.1f0 = (A-AO)+ T(S-So)+(pV.:..RT) (9)
Cv = T [:� (10) V
Cv-� = .T [}_. (S-5°)]-·
. _ ar . V
-� = Gg-R
Cp = C.,·� T_-[!2.1 2 /[!2.l· · arJ. avJ
t
(11)
(12)
(13)
The saturation pressure (vapor pressure) is obtainedfrom an equation of state by_ the equality of pressures andby use of t.he criteria for phase equilibria:
(14)
where G, the Gibbs free energy, is evaluated for the specific volumes of the liquid and vapor phases. Vr and Vv. G is given by ·
G- (JO = (A-A0) + (pV-RT) (15)

An equation of state, along with information on the ideal gas heat capacity, thus ties together all the thermodvnamic properties of a fluid. Which properties to measure in. order to define a fluid is dictated more by the form of the· equation of state and the accuracy and ease with which one can measure various quantities than by which quantities are required for a particular application, such as the calculation of cycle efficiency. The measurements carried out in this work consist of pressure-volume-temperature (p-V-T) measurements along lines of constant volume in the vapor phase, saturated liquid density and vapor pressure over a range of temperature, and a determination of the critical point parameters. These data represent the minimum information necessary to define an equation of state covering the range of temperature and pressure of interest for refrigeration applications. Other approaches. built around other data sets, are possible; the approach taken here and its associated data set are the most common. The ideal gas heat capacity, cg. is derived from measurements of the speed of sound in the low pressure vapo[ In addition, the surface tension of R134a and R123 was deter-mined by the capillary rise method.
SYNOPSIS OF EXPERIMENTS
p-V-T Measurements
The most important data for characterizing the thermodynamic properties of a fluid in the single-phase region are measurements of the pressure2volume-temperature behaviO[ In this work, measurements were carried out on an apparatus operating in.distinct Burnett and isochoric modes as described by Linsky et al. (1987) . The fluid �ample is contained in a heaviwalled metal vessel having tW9 chambers of volumes. V, and )'2; separated by a valve. The sample vessel is submerg�d in a circulating oil bath whose temperature is maintained within 1 mK (0.002°F) of the desired value. Thermal variations within the bath are less than 2 ·mK (0.00.4°F). Pressures are_.measured witheither a quartz Bourdon gauge (a�urate to Q .. 2kPa [0.03 psia]) with digital readout or a mar1ually operated gas dead-weight gauge accurate to ±0.002 kPa [±0.03 psia]). The argon used in the pre�ure lines is separated from the fluid sample by a nickel diaphragm transducer; located in the oil bath, which is sensitive to 0.01 kPa (0.0015 psia).
The specific '-'Olume ·c or density) of t�e sample is determined indirectly by the Burnett (1936) method. This method avoids the difficult determination of the cell '-'Olume and sample mass, In the Burnett mode of operation, data are measured at a constant temperature by filling the first chamber; V1 • to the maximum desired pressure and density and evacuating \'2. After measuring the initial pressure, p0, the" valve connecting V, and � is opened and the sample fills both chambers at a lower pressure, P 1 . The valve is closed. )'2 is again evacuated, and the process is repeated, measuring p2, p3, etc.� until the minimum pressure that can be accurately measured is reached. The ratio between the total volume and that of V, defines the volume ratio:
Ni = filpj) + �Pi)YitPi-tl
(16)
Usually U1e volume ratio is chosen to have a value between 1.5 and 2 (1.78 in our case); it is a very weak function of pressure as indicated by the p's in Equation 16. The volume ratio, including its pressure dependence. was determined in a separate experiment by a calibration vvith helium.
The specific volume of the sample in successive expansions follows from the definition of the volume ratio:
(17)
The volume for any given expansion can then be expressed as:
(18) jo:t
where V0 is the initial molar volume of the sample and IT N1
is the product of the N's. Th.e molar volume can be related to the pressure through the use of the compressibility factor; Z = pVIRT:
lTZ1 Pi = --1 -=---
Vo IT Njjct
(19)
The above equations lead to an- undetermined problem-there are more unknowns (V;, Z) than equations . The situation can be resolved by defining the compressibility factor in terms of a finite virial expansion:
Z =· 1 + Bf V + Cf V2 + Df V3· (20)
where 8, 9, and Oare the second, third, and fourth vi rial coefficients and. are functions only of temperature. This yields one equation for each measured pressure:
Pi= RT '[1 +-: _B_+ ·c + D ](21)i i
[ i )2 ( i ]l
V0 Il Hj V0.II Nj V0.Il Hj Vo.II Nj j • .1 . . J • 1 J • l . J • 1
265
If the number of experimental pressures, P;, exceeds the number of adjustable parameters (i .e. , 8, C, 0, Vo), Equation 21 represents an overdetermined system and requires a nonlinec:1r least.squares optimization (see Waxman and Hastings 1971) 'to obtain 8, C, 0, V0•
Thus: by rr,eans .of the Burnett method, one can obtain the molar volume of the sample without having to measure it directly. The accuracy of volumes determined in this way is better than 0.1 %. The tradeoffs are the need for highly accurate pressure measurements requiring the use of a dead-weight gauge and a complex data analysis procedure. If'! thi_s work, a series of Burnett expansions were carried out at a single reference temperature for each fluid (368.15 K [203.00°F] for R134a; 433.15 K [320.00°F] for R123). This allowed a determination of the virial coefficients at the reference temperature.
The bulk of the measurements were taken in the isochoric mode of operation. In this mode, sample is loaded into the volume V, only and the pressure is measured over a range of temperatures at a constant density (or volume). This mode of operation has been automated (Linsky et al. 1987), making use of the digital quartz Bourdon pressure

gauge. The molar volume 1s determined from the pressure measured at the reference isotherm and Equation 20; a previously determined correction for the effect of pressure and temperature on cell volume has also been applied. Once measurement along an isochore is completed. the sample is returned to the reference temperature, expanded into volume V2 , and the process repeated. Measurements were made for a common set of temperatures for each isochore. Thus virial coefficients at these other temperatures could be determined by fitting the data with Equation 20.
A dew point temperature was also obtained for each of the isochores by cooling the sample into the two-phase region. A plot of pressure vs. temperature displays a sharp change of slope at the dew point. The intersection of simple functions fit to the single- and two-phase data gives an accurate determination of the temperature and pressure corresponding to a given (saturated vapor) volume.
Five isochores were measured for each of the fluids in question, resulting in a total of 56 p-V-f points for R134a and 64 points for R123. The minimum volume (maximum density) was approximately twice the critical volume; temperatures ranged from saturation to a maximum of 423 K (302° F) for R134a and 453 K (356° F) for R123.
Liquid Density
Saturated Ii.quid densities were measured in a variable-volume cell originally designed for critical point determinations (Dav.is 19_83; Morrison and Kincaid 1984). The cell consists of a drawn sapphire tube having a volume of approximately 7.0 cm3 (0.43 in3); the tube is closed off at each end with stainless steel plugs sealed with 0-rings. The sample volume was changed by faising .<?r lowering a column of mercvry introduced through an opening in the bottom plug .. The total volume accessible to the sample and .the volumes of the individual phases ·within the cell were determined by measuring with a cathetometer the position of the liquid-vaP.6r and liquid-mercury ri:leniscis relative to the top and bottom of the cell. The cell was immersed in a water or ethylene glycol-water bath whose temperature was measured with a platinum resistance thermometer calibrated to 1 mK (0.002°F). .: .....
Samples were distilled from a gas buret at room temperature into an intermediate stainless steel cell at liquid nitrogen temperature. The mass of sample transferred was determined in t'NO ways: first, by direct weighing of the cell before and after filling and, second, by using temperature-pressure-volume measurements from the gas buret in conjunction with the viriaJ equation of state. The two determinations typically agreed with one another to 0.1%. The sample was transferred from the stainless steel cell into the sapphire cell by displacement with mercury. The amountof sample was selected to fill the cell roughly one-half full of liquid. N. a given temperature, a series of measurements was made with increasing heights of mercury (i.e., with decreasing volumes occupied by the vapor). The volume for the entire sample charge to be at saturated liquid conditions was obtained by extrapolation to zero vapor volume.
The variable-volume apparatus was used to measure the saturated liquid density of R134a from 268 K (23°F) to the critical temperature and A123 from 303 K (86°F) to 373 K (212°F). The accuracy of these densities is ±0.5%. A
266
problem encountered in these measurements was leakage through the 0-ring seals. Since the determination of density depends on knowing the amount of sample in the cell. any leakage will result in a decrease in accuracy. R123 presented a particular problem with leakage. While no completely satisfactory material was found, a viton 0-ring did contain the R123 sample for several days. This permitted the measurements to proceed, although necessitating frequent changes of sample and replacement of the 0-rings. This apparatus was also used to measure vaporpressure and critical point parameters, as describedbelow.
For R123, the liquid density was determined in two additional ways. At temperatures below the normal boiling point, the density was determined by a simple buoyancy technique. A fused silica sphere of known density was suspended from an analytical balance and weighed both in air and immersed in the fluid. At higher temperatures, the constant-volume cell (described below in the section on critical point determination) was also used.
Vapor Pressure
The vapor pressures of A134a and R123 were measured in three different ways on two apparatus. These different methods allow a wider range of temperature to be covered and also serve as a consistency check.
The saturation pressure corresponding to each of the isochores measured on the Burnett p-V-T apparatus was determined by cooling slightly into the too-phase region as described above for the determination of saturated vapor volume. In the second method on this apparatus, the sample chamber was filled approximately one-half full of liquid. The temperature of the oil bath was changed in steps of 5 K (9°F) acid the pressure was measured after temperature equilibrium had been reached. Vapor pressures from 313-373 K (104°-212°F) for R134a and from 338-453 K (149°-356°F) for R123 were measured with anaccuracy of 0.2 kPa (0.03 psia). There was excellent agreement between the pressures measured with only a smallamount of liquid present and those with the samplechamber haJf full of liquid.
The variable-volume apparatus was also used for vapor pressure measurements.. A diaphragm-type pressure transducer was connected to the sapphire sample cell via a mercury-filled capillary coming off the bottom of the cell. Pressures were measured simultaneously and at the same temperatures as the volume measurements. For pure fluids, the pressure should not change with the volume accessible to the sample as long as two phases are present; such a lack of volume dependence on pressure was. in f act, observed to the accuracy level of the pressure transducer. This apparatus was used to measure R134a vapor pressures from 268 K (23°F) to the critical temperature and R123 values from 303 K (86°F) to 373 K (212°F) at an accuracy of 1%.
Critical Point
The critical point of A134a was measured in the variable-volume apparatus described above. At the critical density, the volumes of the liquid and vapor phases formed as the sample is cooled from above the critical point will be identical; that is, the meniscus will appear at the middle of

;:1e cell. In principle, the critical point could be determined ov either raising or lowering the temperature. The presence of even minor impurities, which inevitably segregate into one phase or the other in the two-phase region. can cause a specious critical point determination if based on the disappearance of the meniscus upon heating the sample. The formation of the two phases from a carefully prepared �omogeneous fluid leads to a more accurate critical point determination.
The sample was heated above the critical temperawre, vigorously stirred. and then slowly cooled (approximately 0.05 K/h, 0.09° F/h). The approach to the critical point is accompanied by the strong scattering of the blue part of the visible spectrum. giving the sample a characteristic reddish-brown color when viewed by transmitted light �nd a pearly blue color by scattered light. The f ormation of two phases is marked by a sudden loss of the color. After phase separation. the sample was allowed to stand and settle at a constant temperature; the location of the meniscus Vvas then measured. This procedure Vvas repeated at least three times with the volumes varied by about 1% so that the meniscus appeared above.· near, and below the center of the cell. These measurements were interpolated to find the conditions at which ·the meniscus would have appeared exactly in the center (i.e . . the critical point).
By these measurements, the critical parameters of R134a were determined as
Tc = 374.205 ± 0.010 K (213.900 ± 0.018°F) Pc= 4056± 10 kPa (588.3 ·± 1.5 psia)' Pc = 515.3 ± 1 kg/m3 (32.2 ± 0.1 lb/ft3)
Thes.e values are in good agreement ""'.ith other measured values. Kabata et al. (1988) report . ,.
Tc= 374.30 ± 0.01 K (214.07 ± 0.02°F) Pc = 508 ± 3 kg/m3 (31.7 ± 0.2 lb/ft3), '.. · 1; ·: .
The slightly hig�ercritical temperature reported by Kabata et al. would be consistent with their-technique of observing the di�ppearance of the liquid-vapor r:neniscus. The critical temperature measured by Wilson and _Basu (1988) i_s
Tc = 374.25 ± 0.15 K (213.98, i: 0.27 ° F)Wilson anq Basu did not directly me:asure the critical pressure and. de_nsity; but their values determined by. extrapolation are also in good agr�fTleht with the valuespresented here.· ' _
The critical point for R123 was measured using a constant-volume cell consisting of two sapphire disks approximately 25 mm (1 .0 in) in diameter with a spacing of 12.7 mm (0.50 in) supported within a stainless steel housing (Hocken et al. 1975). The cell was sealed with gold foil compression seals. avoi<;fing the problems associated with elastomeric 0-rings. The cell was loaded to slightly above
the critical density and immersed in a silicon oil bath with the temperature controlled to 0.01 K (0.02°F). The sample was heated until there was a single phase. stirred vigorously, and then cooled until a meniscus appeared. On successive runs, small amounts of the sample were bled from the cell until. as discussed above; a set of measurements spanning the critical point had been made. The cell with its contents was weighed after each run. thus allowing the density at the point of phase separation to be evaluated. The critical parameters determined in this way were
257
Tc == 456.94 ± O.QJ K (362.82 ± 0.05 ° F) Pc = 550 ± 5 kg/m3 (34.3 ± 0.3 lb/ft3)
The critical pressure was not directly measured but was determined by extrapolation of the vapor pressure data to the-critical temperature; the value thus obtained was
Pc = 3676 ± 10 kPa (533.2 ± 1.5 psia) There are. to our knowledge, no other documented determinations of the critical parameters of R123 with which to compare these values.
Speed o f Sound The heat capacity of the ideal gas state. as well as vi rial
coefficients. were evaluated from speed of sound data. In the limit of zero frequency, the speed of sound, u, is a thermodynamic quantity which is related to other quantities by the expression
u2 (p, T)
where
�(RT+ f3a ( T) P + "'fa ( T) P2 + ... ) (22) M
(23) 1-R/Gg
R is the gas constant, Mis the relative mole9ular mass, anc;( f3a and 'Ya are the acoustic virial coefficients. The second acoustic virial coefficient. {3
8, is related to the "ordinary"
second vi rial coefficient. B (such as that determined by the Burnett measurements described above); by· · · ·
Lil 2
2
f3a (T) = 2B+2(k°-l) T dB +�T2 d B (24)dT . J;JJ dT2
By measuring the speed of sound along an isotherm over·a range of pressures,-�. f3a , -Ya , etc.;cari be evalu?,ted at_that temperature by a least squ?res optimization. Theevaluation of B from f3a involves temperature derivatives of8. Thus it is convenient to"assunie a functional form for thetemperature dependence of B; the form used here is thatderived for hypothetical molecules interacting via thesquare well potential (Ewing et al. 1988):·· · ·· ·
(25)
This f urictional form allows the evaluation of the derivatives in Equation 24 and. hence, the evaluation of the coefficients e 1• e2 • and e3 in Equation 25 by a nonlinear least squaresoptimization. · ·
The method used here for measuring the speed of sound was first proposed by Moldover et al. (1979) and first demonstrated by Mehl and Moldover (1981). The gas of interest is contained within a thick-walled spherical cavity, which itself is contained within an isothermal enclosure. The resonant frequencies of the radially symmetric oscillations of the gas are measured by means of a sonic transmitter and a detector mounted flush with the inside of the cavity. The speed of sound is related to these frequencies. fon by
Vl
U = /o,n Vr / llo,n (26)
where V, is the volume of the spherical cavity and v0_n are

e:genvalues that are known exactly. In practice, V, is deter::-uned from sound speed measurements with argon, a gas ior which the speed of sound is very accurately known. Several small(< 0.016%) corrections were made to the --neasured frequencies to account for heat conduction from :�1e gas into and out of the shell during the course of each acoustic cycle and to account for the elastic response of ihe spherical-shell.
Measurements were made on 13 isotherms for R134a spanning the temperature range 233.15 to 340 K (-40.0°
:o 152.3 °F); for R123, six isotherms over the temperature range 260 to 335 K (8.3° to 143.3 ° F) were measured. The pressure was varied from 5% to 50% of the saturation pressure at each of the temperatures. The instrumental 8rrors in the measurements of the frequencies, temperaiures, and pressures were insignificant. Small (0.01%) inconsistencies in the sound speed data for the refrigerants were observed. These probably resulted from the slow dissolution of the sample into several fluoro-elastomer components of the apparatus. The resulting accuracy for the heat capacities is ±0.1 %. Although not presented in detail here, the second vi rial coefficients derived from the sound speed measurements using Equations 24 and 25 were in 2xcellent agreement with those measured in the Burnett apparatus.
Surface Tension
Surface tension is a fluid property required in many two-phase heat transfer correlations. Surface tension influences the growth of bubbles in nucleate boiling and the drainage of condensate from certain enhanced condenser surfaces. The surface tensions of R134a and R123 were measured using a differential capillary rise technique similar to that described by Rathjen and Straub (1973) in . combination with density data. The temperature range was �63 to 368 K (14° to 203° F) for R134a and 248 to 413 K (-13° to 284° F) for R123. The capillary height, h;, was measured in at least two different capillaries to a resolution l � ±0.02 mm (±0.0008 in) with a cathetometer. The difficult measurement of the bulk meniscus height, h
0, was
avoided by the two-capillary method. The· experimental neasurements determined the capillary length parameter, ,.r:2, through the relation derived by Rayleigh (1916):
o2 = r1 [hi - ho + !i _ 0.1288 -2:i..:_ + 0.1312 ___!1:_l (27)3 . (hi-ho) (hi/Lo)2J
where r, is the capillary radius. In this work four different r.apillaries. with radii ranging from 0. 148 to 0.574 mm (0.0058 to 0.0226 in), were used in order to increase the dynamic range of the measurements. The surface tension is related to a2 through
" = 02 t::,. p g/2 (28)
where ap is the difference between the liquid and vapor densities and g is the acceleration due to gravity. Density values calculated from the equation of state were used to compute surface tension values. The parameter a2 is represented by the form (Chaar et al. 1986):
o2 = ai To. DH (29)
268
where, 1 - T/Tc: a5 = 6.35 mm2 for R134a and 5.75
mm2 for R123. Experimental and calculated values of surface tension are shown in Figure 1. The estimated accuracy of the values is ±0.0001 N/m (±0.1 dyn/cm). The surface tensions.were also correlated directly as
(30)
where a0
= 0.0608 Nim (60.8 dyn/cm) for R134a and a0
= 0.0575 Nim (57.5 dyn/cm) for R123. Although more convenient than Equations 28 and 29, Equation 30 is not as accurate, leading to errors of as much as 0.00025 Nim (0.25 dyn/cm).
Temperalure (f)
N flO IZO 160 Z40 300 360
0 0
0
·2 0 0
E E
"' � "- 0 � C e 0 >..
C � C
.; 0 � 0
� 0 .; C
(-V
&I ,., &I 0
C) (J 0
:, 0 �
(/) ::l (/]
0 0 0
0 0 0
Z-4() Z80 �o 340 400 HO
Temperalure (K)
Figure 1 Surface tension as a function of temperature for R134a and R123; symbols are experimental points, lines are correlation.
Fluid Samples
The sample of R 134a was stated by the manufacturer to have a purity of approximately 99.94 wt%. The major impurities were related fluorocarbons. which should have an insignificant effect on the measured properties at the levels present, and water. The sample of A123 was assayed by the manufacturer as 99.99 wt% pure with a water content of less than 20 parts per million (ppm). An analysis conducted in this laboratory using gas chromatography and mass spectroscopy techniques confirmed this result. A trace quantity of the isomer R123a (1,2-dichloro-1,2,2-trifluoroethane) was detected. The amount of A123a was barely above noise levels and thus could not be quantified, but should be no more than a few parts per million.
Both samples were found to contain significant quantities of air. (The purity values stated above are on an air-free basis.) The air, along with·any other highly volatile impurities. was removed by repeatedly freezing the sample at liquid nitrogen temperatures, evacuating, and thawing.
The sound speed measurements are sensitive to any water present as an impurity and thus significant effort was devoted to analyzing for water content. The R134a was analyzed by gas chromatography using a 2 m packed column and a thermal conductivity detector. Calibration was done using four gravimetrically prepared standards of water in nitrogen. The water content of the R134a as received was 215 ± 8 ppm. The sample used in the sound

speed measurements was dried by passing over a molecular sieve to a level of 105 ± 5 ppm water. A similar technique was used for R123 except that the sample was injected as a liquid into the GC column using a cooled syringe, and gravimetrically prepared acetonitrile/water calibration standards were used. This analysis yielded a R123 water content of 23 ± 2 ppm as received and 8 ±2 ppm for the dried sample used in the sound speed measurements. An analysis of R123 by a second method, a Karl Fischer titration, yielded a water content of between 12 and 35 ppm.
The water content of the dried samples was sufficiently low to not affect the sound speed measurements. There was no detectable difference in critical point betv.,een dried and undried samples of R134a.
FORMULATION OF THERMODYNAMIC SURFACE
The previous discussion outlined how an equation of state could encompass all of the thermodynamic properties of a fluid. Not all equations of state. however. are applicable to the entire thermodynamic surface. For example. the Martin-Hou equation, which is often applied to refrigerants (ASHRAE 1986), is not accurate in the liquid region. With this and many other equations of state, separate correlations for saturated liquid density and vapor pressure are required. A single equation, applicable to both the liquid and vapor .phases, from which all the thermodynamic properties can be computed in a thermodynamically consistent way, is desired; two such equations were investigated for use with R134a and R123.
CSD Equation of State
The Carnahan-Starling-Desantis (CSD) equation of state has been applied to refrigerants and, particularly, refrigerant mixtures (Morrison and Mclinden 1985. 1986). It is of the form
.!X = 1+ v±JC::1t - 4
RT ( l+r)1 RT( V+b) (31)
where y = b/4 V. The first term on the right side of Equation 31 is the Carnahan-Starling (1969) representation of the behavior of a system of rigid, noninteracting spherical molecules; the parameter "b" is related to this "hardsphere" volume. The second term, proposed by Desantis et al. (1976), accounts for the long-range attractive forces between molecules; the parameter "a" characterizes this interaction. The parameters "a" and "b" are temperaturedependent and are represented as:
a = 4o exp(a1 T + a, 7'2)
b = 60 + b,T+ 627'2
(32)
(33)
The attributes of a strong theoretical basis and relative simplicity allow the CSD equation to represent a fluid with a minimum of data. The CSD equation was fitted to the present experimental data. The accuracy with which the CSD equation represented the properties of R123 was good; however, the fit to the R134a data. while usable, was not of a level commensurate with the accuracy of the experimental data. This failure may be due to the highly polar nature of these nevv fluids and necessitated fitting a more complex
269
equation of state. Given the high accuracy data now available for these fluids. it is appropriate to employ a more sophisticated equation of state. For consistency, the MBWR equation of state will be used for both R134a and R123.
Modified BWR Equation of State
A modification of the Benedict-Webb-Rubin equation of state (MBWR) proposed by Jacobsen and Stewart (1973) is adopted here. It is versatile, applicable over wide ranges of temperature and pressure, and has found wide acceptance for the representation of hydrocarbons and cryogenic fluids (e.g., Younglove 1982; Younglove and Ely 1987); it has also seen limited application to the halocarbon refrigerants (ASHRAE 1986). It is of the form
g 15
p = I,au1vn+exp(-�/V2) I 11n1 V2n-11 , (34)
u=l n� 10
where the temperature dependence of the coefficients is given by
a 1 = RT
a 1 = b 1 T + b2 ']1).5 + b3 + b4/T + bsf T1
a3 b6 T + b1 + b8/T + bg/T2
a. b 10 T + b11 + b 1 -i/T
as = b 1 3
a6 b14/T + b15/T2
a1 b16/T
as b11/T + b 18/T2
ag = b 1g/T2
a10 = b20/T2 + b21/T3
au = b22/T2 + b23/�
a12 = b2,/T2 + b2s/T3
au = b-u./1'2 + b21/�
a14 = b2a/T2 + b2g/T3
a1s = b30/T2 + b3111T3 + bn/� (35)
The greater complexity of the MBWR equation of state compared to the CSD equation, along with the flexibility allowed by its 32 adjustable parameters. allows a much more accurate representation of the experimental data but simultaneously entails a more involved fitting procedure.
Auxiliary Functions
In order to fit the saturation boundary (which is given heavy weight) in a straightforward way, information on the saturated liquid and vapor densities and vapor pressure as well as their temperature derivatives, all at common temperatures, is required. Since such data are seldom available. the saturation data are first fit to separate tune· tions, which are then used to compute the required points. These auxiliary functions are used only in the fitting pro-

cess: the final computation of all tt1ermodynamic quantities is based directly on the MBWR equation of state.
The measured vapor pressure values were fit to the form
(36)
The coefficients. 1r,, are given in Table 1. (Critical region theory predicts a value of 1.9 for the exponent in the last term of Equation 36: a value of 1.5, however, was empirically found to yield a better fit over a wide temperature range.) For R134a, there are data from three apparatus and two independent sources. For the temperature range where they overlap (above 310.0 K or 98.3° F), the data of Wilson and Basu and those measured here on the Burnett apparatus are in excellent agreement with RMS deviations from Equation 36 of 0.11 % and 0.07%, respective ly. At lower temperatures, the data from the variable-volume apparatus are consistently lower than those of Wilson and Basu. The difference is greatest (approximately 3%) at 268 K (23° F). In fitting Equation 36, a higher weight was given to the data
TABLE 1
Coefficients for the Auxiliary Functions and cg
R134a R123
Constants for use with Equations 22. 36-40: SI Units
Tc (K) Pc (kg/m3) B M
1-P Units Tc (
oR) Pc (lb/ft3) fJ ·m
374.205 515.3
0.34 102.030
673.57 32.17
0.34 102.030
Vapor pressure. Equation 36 SI Units (pin kPa; Tin K)
456.94 549.9
0.333 152.930
822.49 34.33
0.333 152.930
r1 -3.353 46 E + 3 -3.991 71 E +3 r2 1.836 06 E+ 1 1.803 35 E + 1 r3 -2.90804 E-3 -2.377 67 E-3r4 2.783 66 E+O 2.812 72 E +O
1-P Units (pin psia; T in °R) r1 -6.03623 E+3 -7. 185 08 E + 3 r2 1.642 99 E + 1 1.610 28E+1 r3 -1.61558E-3 -1.32093 E-3 r4 2.783 66 E +O 2.812 72E+O
Saturated liquid density, Equation 37 (dimensionless) · · d, 1.723 89 1.882 64 d2 1.717 61 0.257 94 d3 -2.269 04 0.680 74 d4 1.707 44 -0.101 91
Saturated vapor density, Equation 40 (dimensionless) 91 -3.479 66 -4.915 7192 9.349 04 18.877 5193 -0.401 86 -17.601 4794 28.090 01 41.639. 63 9s 31.910 04 33.899 77
Ideal gas heat capacity, Equation 41 SI Units (Cg in J/(mol • K); Tin K)
; .l .
C 1 1.940 06 E+ 1 . C2 2.585 31 E -1 C3 -1.296 65 E-4
2.926 04E+1 3.029 94 E-1
-1.929 07 E -4 l·P Units (Cg in BTU/(lb mol • 0 R)
c 1 4.636 94 E + oCz
3.432 86E-2 C3 -9.565 19 E-6
6.993 53 E +O 4.023 26 E -2
- 1.423 05 E -5
270
from the Burnett apparatus. reflecting their higher accuracy compared to the variable-volume apparatus. The data of Wilson and Basu were also included because of U-1eir high stated accuracy and greater temperature range (down to.211.0 Kor -79.9° F). The overall weighted RMS deviation for R134a was 0.20%. For R123, the RMS deviations from the fit were 0.07 and 0.39% for the Burnett and variable-volume apparatuses. respectively, with an overall weighted RMS deviation of 0.15%. Again, the data from the Burnett apparatus were given a higher weight.
The saturated liquid densities were fit to the form:
(37)
where 7 = (1 - TITJ and Pc
is the critical density. The coefficients for the fit to R134a and R123 are given in Table 1. The value of the critical exponent, {3, is taken as 0.34 for R134a based on the work of Kabata et al. (1988); it is assumed to be 113 for R123. A comparison of experimental values with those calculated by Equation 37 is given in Figure 2 for 134a. There are si�nificant differences, as large as 1.5%, especially near the critical temperature, between the different sources. At this time, there is little justification for selecting one source over another and thus all were given equal weight in the fit. The RMS deviations between the experimental values and the auxiliary function are 0.44% for the variable-volume apparatus, 0.38% for the data of Wilson and.Basu. and 0.24% for the data of Kaba ta et al:A similar comparison for R123 is given in Figure 3: For this fluid, all of the data are from this work but by three different methods, as described above. There is goo.d.agree-, ment betvVeen the various techniques with RMS. deviations from Equation 37d 0.06% for the low·temperature buoyancy technique, 0.34% for the variable·volume apparatus,. and 0.16% for the constant.volume apparatus.
The fitting of an auxiliary function for saturated vapor density presents a special problem; the e�perimental . values from the Burnett appar_atus exlend over a limitea. temperature range (320 to 366 Kor 117° to 19'9° F for R134a and 340 to 425 Kor 152°- to 305°F for R123). Densities at lower temperatures were generated by the truncated virial equation of-state: ·
V � RT/p+ B ·:·
. . • r
p = M/V
(38).
(39)
where Mis relative molecular mass; the pressure. p, is computed at saturation conditions by Equation 36: and the second virial coefficient, 8, is based on sound speed data and is given by Equation 25. These calculated points were combined with values from the Burnett apparatus and fitted to the following form:
. -'3. 2/3 4/3
ln(p/pc) = g1 T + 92 r + 93 T + 94 T + 95 In( T/Tc) (40)
Again the coefficients are given in Table 1. The vi rial equation of state truncated ·at the second vi rial coefficient is accurate only for low to moderate pressures; this translated into an upper temperature limit of 273 K (32° F) for R134a and 323 K (122° F) for R123. There is thus a significant temperature span where no information on saturated

vapor volumes 1s available. Equation 36 should. however, adequately interpolate between the high-temperature Burnett measurements and the lower temperature calculated values. The RMS deviations were 0.09% for both R134a and R123.
., 0
Temperalure (F)
-<0 <0 80 120
.
• dala of Wilson & Basu • dala of Kabala et al. • this work
160 200
,+---,---.-----.-----.......-----.---.-----1 2:20 2�0 260 3-00 320 360 360
0 0
Temperature (K)
Figure 2 Comparison of experimental saturated liquid densities with correlation, R134a
..
0
60
. .
Temperature (F')
120 180 ZOO :uo 280 320 360
..
.
• bouyancy technique • variable volume apparatus , constant volume cell
I -t----,-----,-----,------,.--------4
260 300 �o :,ao .czo .c80
Temperature (K)
Figure 3 Comparison of experimental saturated liquid densities wnh correlation, R123
P-V-T Surface
The isochoric p-V.:r measurements made with theBurnett apparatus along with the second virial coefficients derived from the sound speed and Burnett measurements were used, along with the auxiliary functions for the saturation boundary, to fit the MBWR equation of state For R134a the isochoric measurements of Wilson and Basu were also included.
One advantage of the MBWR equation of state is its ability to represent the entire thermodynamic surface. including the compressed liquid region. There are, however, no experimental compressed liquid data available at the present time with which to fit this region. To resolve this situation. p-V-T values along several isotherms in the com-
271
pressed liquid regron. extending from near saturation to a pressure of approximately 10,000 kPa (1500 ps1a), were calculated using a property estimation program based on the theory of extended corresponding states (Ely 1984) -This method starts with a very accurate thermodynamicsurface for a well-characterized reference fluid (in this case, propane), scales this surface by the use of reduced properties (i.e., a property such as temperature divided by that property at the critical point), and then fits a number of"shape factors" to slightly distort the reference surface to reproduce the available experimental vapor pressure andsaturated liquid density for the fluid in question. The "data"generated using the extended corresponding statesmodel were given a very low statistical weight compared to the experimental values in fitting the coefficients of the MBWR equation.
The routines developed by Ely (1984) were used withminor modification to fit the MBWR equation of state to the experimental data. These fitting routines employ a multiproperty linear least-squares analysis and incorporate aweighting scheme proposed by McCarty (1980). The resulting coefficients are given in Table 2. The MBWR equationof state is constrained to pass through the critical point.
TABLE2 Coefficients for the MBWR Equation of State
· R134a
5.432 351 078 E+01
-2.817 179 422 E+03
4.180 438 062 E+04
-3.256 922 234 E+06
3.083105 280 E+07
-2.306 068 261 E-01
-1.802 987 614 E+03
1.895 347 500 E+06
1.266 051 930 E+09
1.741 323 933 E-01
-4.772 988 829 E+01
-3.432 544 166 E+04
1.686 496 003 E+Ol
-6.286 672 309 E+03
-7.041 712468 E+OS
5. 735 386 537 E+02
-1.356 666 658 E+Ol
3.072 670 709 E+03
-8.493 229 270 E+01
-1.849 376 298 E+09
5.825 639 389 E+ 10
-6.512 433 009 E+07
6.341 579 266 E+ 11
-6.885 139 519 E+05
-3.691 540 flJ7 E+07
-9.494 108 810 E+03
-3.083 412 869 E+07
-1.514 309 042 E+01
-4.323 050 466 E+03
-2.023 379 823 E-01
-5.752 269 805 E+01
-7.535 403 081 E+03
R123
-3.565 346 146 E+02
2.460 182 902 E+04
-4.886 306 960 E+OS
6.975 297 669 E+07
-5.898 504 668 E+09
2.020 863 609 E+01
-4.091 285 105 E+04
2.267 025 665 E+07
3.494 004 970 E+09
-3.856 016 874 E+OO
7.137 009 696 E+03
-2.373 613 586 E+06
-2.291 124 604 E+01
-7.786 150 982 E+04
3.187 411 790 E+-06
8.700 369 537 E+03
-2.108 108 891 E+02
-8.707 384 556 E+04
4.686 693 868 E+03
-7 .380 524 n3 E+09
5.193095367 E+10
-6.105 495 540 E+08
1.634 552 631 E+ 13
-1.513 595 925 E+07
9.576 741 434 E+08
-3.322 908 616 E+OS
-1.324 816 394 E+10
-4.461 246944 E+03
1.591 820 977 E+06
-5.971 857 323 E+OO
-3.155 068 205 E+04
-8.095 134 997 E+05
Note: These coefficients are for pressure in kPa. temperature in K. and volume in Umol; the gas constant. A .. 8.314 471 J/(mol • K).

Tcrnpcr.:ilur·e (I-')
120 !60 200 '.lcO JuO ,(; 0 �---'---------.i.--------------,
n
0
0 I ,() 0 +---,----.--�---.---.,.----,----,-----1
300 320 340 360 380 400
Temperature (K)
Figure 4 Comparison of experimental p-V-T data with MBWR equation of state, R134a; solid symbols are data of this work, open symbols are data of Wilson and Basu (1988), lines connect measurements along an isochor.
The fit of the equation of state in the single-phase region can be assessed by comparing either pressures computed given temperature and volume. or volumes computed given temperature and pressure. A comparison of experimental and calculated pressures is given in Figure 4 for R134a. The isochoric p-V-T values reported by Wilson and Basu and those measured with the Burnett apparatus generally show good agreement. The RMS deviations for the two data sets are very similar (0.09% tor the Burnett data vs.' 0.15% for Wilson and Basu's data). The lowest density isochore of Wilson and Basu (indicated by open, inverted triangles.in Figure 4) appeared to be inconsistentwith the other data and was given zero weight in1he fit. The RMS deviations for volume are somewhat larger (0.1,7% for this work, 0.76% for the values of Wilson and Basu). A large share of the total error (especially for the data bf Wilson and Basu) is due to a few measurements near the critical point where the pressure-volume isotherms are very "flat," so small differences in pressure or temperature re·s�lt in large errors in volume. . .,
The average absolute difference between experimental and calculated second vi rial coefficients was 0.55 cm3/mol; the maximum difference was· 1 .04 cm3/mol corresponding to 0.28%. For temperatures from 233 K (-40 °F) to the critical temperature, the M BWR equation of state reproduced the saturated liquid and vapor densities and vapor pressures given by the auxiliary functions with RMS deviations of 0.70%, 0.18%, and 0.03%, respectively. Again, "much of the total error is due to the near-critical region; over the more limited temperature range of 233 to 353 K (-40° to 176 ° F), the RMS errors reduce to 0.03%. 0.10%, and 0.003%. These deviations must be combined with the RMS deviations for the auxiliary functions (presented above) to obtain the differences between the M BWR equation of state and the actual experimental values.
The residuals for the R123 p-V-T data are presented in Figure 5. A small (approximately 0.1%) systematic deviation with temperature is observed. The RMS deviation for the 64 p-V-T points is 0. 10% in pressure and 0.15% in
272
Te111p<.:r,1lt1n: (I:)
.r: 160 241) ;� HI J
"'
-0
r
() CJ
�o () '
s (")
., '7+----.-----.-----.------.---�--l
360 380 400 420
Temperature (K)
Figure 5 Comparison of experimental p-V-T data with MBWR equation of state, R123
volume. The average absolute deviation in the experimental and calculated second virial coefficients is 1 .32 cm3/mol. Along the saturation boundary, the M BWR reproduces the liquid density with an RMS error of 0.71%. the vapor density to 0.29%, and the vapor pressure to 0.03%. As with R134a, most ofthe total RMS error is due to the near-critical region. Over the temperature range of 279.9 to 430.0 K (26.3 to 314.3° F), the RMS errors reduce to 0.07% for liquid density, 0.12% for vapor density, and 0.010% for vapor pressure, respectively.
Because of the necessity to estimate compressed liquid p-V.r values. the accuracy of the M BWR equation of state in this region cannot be stated. However, because it� behavior in this region is based on a real reference fluid (rather than being an extrapolation of vapor and saturated liquid behavior). the modest amounts of subcooling usually encountered in refrigeration systems should be represented with good accuracy.
Ideal Gas Heat Capacity
The ideal gas heat capacities derived from the sound speed measurements were fitted to a simple polynomial in temperature:
· (41)
where the coefficients are given in Table 1. The RMS deviations between Equation 41 and the experimental values i.vere 0.04% for R134a and 0.17% for R123 over the temperature range of the data. The values for R134a measured here are 1.2% to 1.7% lower than those reported by Chen et al. (1975) and 1.4% to 2.7% lower than the values reported by Wilson and Basu with the greater differences at the higher temperatures. For R123, the value measured here at 305 K (89°F) is 0.6% higher than the value reported by Luft (1954). The values of Chen et al., Wilson and Basu. and Luft are calculated using statistical mechanics and the assignment of molecular vibrational modes based on spectroscopic data. Although this method of calculating cg is, in principle. highly accurate, the assignment of the various spectral lines to specific vibrational modes of the
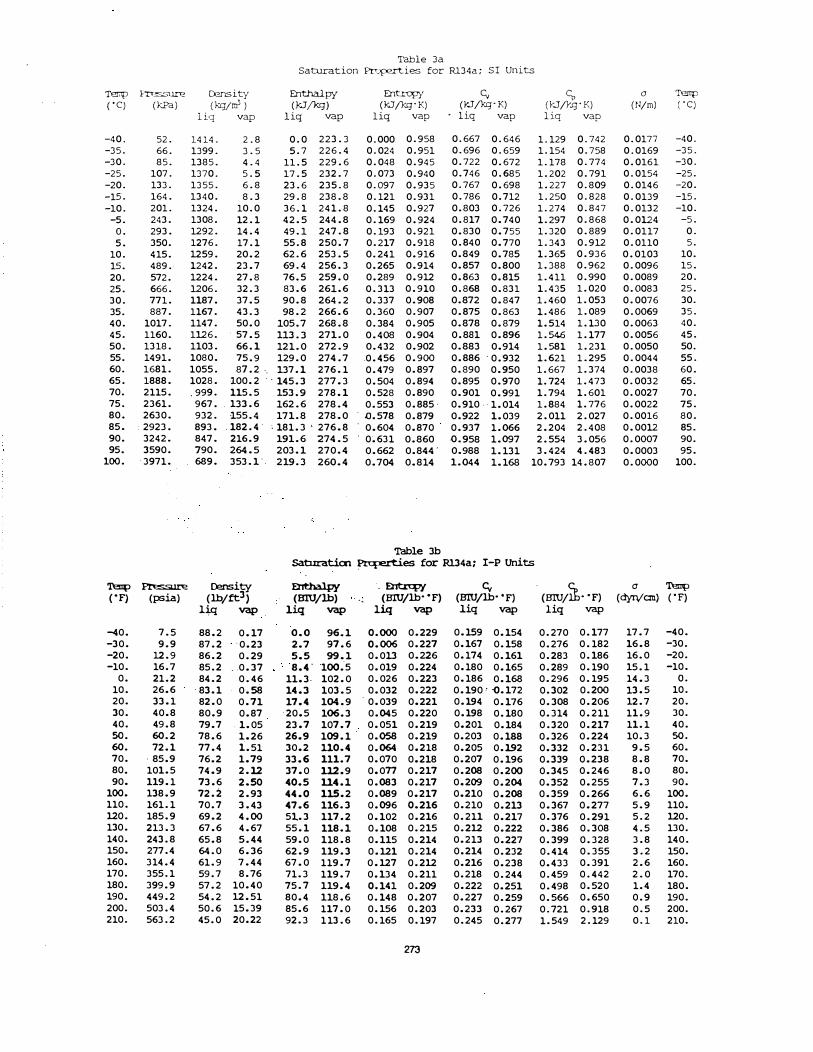
Table Ja Saturation Properties for Rl34a; SI Units
TeRp Pressure Censity Enthalpy Ent:rcpy c., c., 0 Terrp c·q (kPa) (kg/Jtr) (kJjkg) (kJjkg·K) (JrJ/kg·K) (Y"J/)r.g· K) (N/m) ( ·q
liq vap liq vap liq vap . liq vap liq vap
-40. 52. 1414. 2.8 0.0 223.3 0.000 0.958 0.667 0.646 1.129 0.742 0.0177 -40. -35. 66. 1399. 3.5 5.7 226.4 0.024 0.951 0.696 0.659 1.154 0.758 0.0169 -35.-30. 85. 1385. 4.4 11.5 229.6 0.048 0.945 0.722 0.672 1.178 0.774 0.0161 -30. -25. 107. 1370. 5.5 17.5 232.7 0.073 0.940 0.746 0.685 1.202 0.791 0.0154 -25. -20. 133. 1355. 6.8 23.6 235.8 0.097 0.935 0.767 0.698 1.227 0.809 0.0146 -20. -15. 164. 1340. 8.3 29.8 238.8 0.121 0.931 0.786 0.712 1.250 0.828 0.0139 -15. -10. 201. 1324. 10.0 36.1 241.8 0.145 0.927 0.803 0.726 1.274 0.847 0.0132 -10.
-5. 243. 1308. 12.1 42.5 244.8 0.169 0.924 0.817 0.740 1.297 0.868 0.0124 -5.o. 293. 1292. 14.4 49.l 247.8 0.193 0.921 0.830 0.755 1.320 0.889 0.0117 0.5. 350. 1276. 17.1 55.8 250.7 0.217 0.918 0.840 0.770 1.343 0.912 0.0110 5.
10. 415. 1259. 20.2 62.6 253.5 0.241 0.916 0.849 0.785 1.365 0.936 0.0103 10. 15. 489.· 1242. 23.7 69.4 256.3 0.265 0.914 0.857 0.800 1.388 0.962 0.0096 15.20. 572. 1224. 27.8 76.5 259.0 0.289 0.912 0.863 0.815 1.411 0.990 0.0089 20.25. 666. 1206. 32.3 83.6 261.6 0.313 0.910 0.868 0.831 1.435 1.020 0.0083 25.30. 771. 1187. 37.5 90.8 264.2 0.337 0.908 0.872 0.847 1.460 1.053 0.0076 30. 35. 887. 1167. 43.3 98.2 266.6 0.360 0.907 0.875 0.863 1.486 1.089 0.0069 35.40. 1017. 1147. 50.0 105.7 268.8 0.384 0.905 0.878 0.879 1.514 1.130 0.0063 40. 45. 1160. 1126. · 57.5 113.J 271.0 0.408 0.904 0.881 0.896 1.546 1.177 0.0056 45.50. 1318. 1103. 66.1 121.0 272.9 0.432 0.902 0.883 0.914 1.581 1.231 0.0050 50. 55. 1491. 1080. 75.9 129.0 274.7 .0.456 0.900 0.886 · 0.932 1.621 1.295 0.0044 55.60. 1681. 1055. 87.2 ·. 137.1 276.1 0.479 0.897 0.890 0.950 1.667 1.374 0.0038 60.65. 1888. 1028. 100.2 · · 145.3 277.3 0.504 0.894 0.895 0.970 1. 724 1.473 0.0032 65. 70. 2115. 999. 115.5 153.9 278.1 0.528 0.890 0.901 0.991 1.794 1.601 0.0027 70.75. 2361. 967. . 133.6 162.6 278.4 0.553 0.885 · 0.910 · · 1.014 1.884 1. 776 0.0022 75.80. 2630. 932. 1.55.4 171.8 278.0 . .0.578 0.879 0.922 1.039 2.011 2.027 0.0016 80.85. • 2923. 893. . 182.4. , 181.3 ' 276.8 . 0.604 0.870 0.937 1.066 2.204 2.408 0.0012 85. 90. 3242. 847. 216.9 191.6 274.5 ' 0�631 0.860 -0.958 1.097 2.554 3.056 0.0007 90. 95. 3590. 790. 264.5 203.1 270.4 0.662 0.844' 0.988 1.131 3.424 4.483 0.0003 95.
100. · 3971. 689. 353.1· 219.3 260.4 0.704 0.814 1.044 1.168 10.793 14.807 0.0000 100.
Table 3b Saturaticn Prcperties for Rl34a; I-P Units
'fenl) Pressure De.nsig, Enthalpy ·. Entrcpy c., . (BIU/it· "F)
(1 Teitp ("F) (psia) (lb/ft3 ) (BIU/lb) ·- (BIU/lb· ·F) (BIU/lb• "F) (dyn/an) ("F)
1� vap liq vap liq vap liq vap liq vap
-40. 7.5 88.2 0.17 o.o 96.l 0.000 0.229 0.159 0.154 0.270 0.177 17.7 -40.-30. 9.9 87.2 ·0.23 2.7 97.6 0.006 0.227 0.167 0.158 0.276 0.182 16.8 -JO.-20. 12.9 86.2 0.29 5.5 99.l 0.013 0.226 0.174 0.161 0.283 0.186 16.0 -20. -10. 16.7 85.2 .. 0.37 8.4· 100.·5 0.019 0.224 0.180 0.165 0.289 0.190 15.1 -10.
0. 21.2 84.2 0.46 11.3. 102.0 0.026 0.223 0.186 0.168 0.296 0.195 14.3 o.
10. 26.6 83.1 0.58 14.3 103.5 0.032 0.222 0.190' -0.172 0.302 0.200 13.5 10. 20. 33.1 82.0 0.71 17.4 104.9 0.039 0.221 0.194 0.176 0.308 0.206 12.7 20. 30. 40.8 80.9 0.87 20.5 106.3 0.045 0.220 0.198 0.180 0.314 0.211 11.9 30. 40. 49.8 79.7 . 1.05 23.7 107.7 0.051 0.219 0.201 0.184 0.320 0.217 11.1 40. 50. 60.2 78.6 1.26 26.9 109.1 0.058 0.219 0.203 0.188 0.326 0.224 10.3 50. 60. 72.1 77.4 i.51 30.2 ll0.4 0.064 0.218 0.205 0.192 0.332 0.231 9.5 60. 70. · 85.9 76.2 1.79 33.6 111.7 0.070 0.218 0.207 0.196 0.339 0.238 8.8 70. 80. 101.5 74.9 2.12 37.0 112.9 0.077 0.217 0.208 0.200 0.345 0.246 8.0 80. 90. 119.1 73.6 2.50 40.5 114.1 0.083 0.217 0.209 0.204 0.352 0.255 7.3 90.
100. 138.9 72.2 2.93 44.0 115.2 0.089 0.217 0.210 0.208 0.359 0.266 6.6 100.110. 161.1 70.7 3.43 47.6 116.3 0.096 0.216 0.210 0.213 0.367 0.277 5.9 110. 120. 185.9 69.2 4.00 5l.3 117.2 0.102 0.216 0.211 0.217 0.376 0.291 5.2 120. 130. 213.3 67.6 4.67 55.1 118.l 0.108 0.215 0.212 0.222 0.386 0.308 4.5 130. 140. 243.8 65.8 5.44 59.0 118.8 0.115 0.214 0.213 0.227 0.399 0.328 3.8 140.150. 277.4 64.0 6.36 62.9 119.3 0.121 0.214 0.214 0.232 0.414 0.355 3.2 150. 160. 314.4 61.9 7.44 67.0 119.7 0.127 0.212 0.216 0.238 0.433 0.391 2.6 160. 170. 355.1 59.7 8.76 71.3 119.7 0.134 0.211 0.218 0.244 0.459 0.442 2.0 170. 180. 399.9 57.2 10.40 75.7 119.4 0.141 0.209 0.222 0.251 0.498 0.520 1.4 180. 190. 449.2 54.2 12.51 80.4 118.6 0.148 0.207 0.227 0.259 0.566 0.650 0.9 190. 200. 503.4 50.6 15.39 85.6 117.0 0.156 0.203 0.233 0.267 0.721 0.918 0.5 200. 210. 563.2 45.0 20.22 92.3 113.6 0.165 0.197 0.245 0.277 1.549 2.129 0.1 210.
273

Tab�·� �s'l
Satu..ration PD:::>p"�rties for Rl2J; SI Units
Te..rq:i Pressure [)2J1S1ty Enthalpy £nt:rol:)Y C. c;, a Terrp
c·c) (k.Pa) (kg/r.i3) (kJjkg) (l<Jjkg·K) (kJ/kg· K) (kJjkg·K) (N/m) ( ·q
liq vap liq vap liq vap liq vap liq vap
-20. 12. 1571. 0.9 17.2 202.2 0.067 0.798 0.665 0.573 0.8]8 0.6]] 0.0209 -20.
-15. 16. 1560. 1.1 21.4 205.2 0.083 0.795 0.670 0.581 0.852 0.642 0.0203 -15.
-10. 20. 1549. 1.4 25.7 208.l 0.100 0.793 0.674 0.590 0.866 0.652 0.0197 -10.
-5. 26. 1537. 1.8 30.1 211.l 0.116 0.792 0.678 0.599 0.881 0.661 0.0191 -5.
o. JJ. 1525. 2.2 34.5 214 .1 0.133 0.790 0.681 0.607 0.896 0.671 0.0184 o.
5. 41. 1514. 2.8 39.0 217.2 0.149 0.790 0.684 0.616 0.912 0.680 0.0178 5.
10. 51. 1501. 3.4 43.6 220.2 0.166 0.789 0.687 0.624 0.928 0.689 0.0:12 10.
1c· :..i. 62. 1489. 4.1 48.3 223.2 0.182 0.789 0.691 0.632 0.945 0.699 0.0166 15.
20. 75. 1477. 4.9 53.1 226.3 0.198 0.789 0.694 0.640 0.962 0.708 0.0160 20.
25. 91. 1464. 5.9 57.9 229.4 0.215 0.790 0.698 0.648 0.979 0.717 0.0154 25.
JO. 109. 1452. 6.9 62.9 232.5 0.231 ·0.790 0.701 0.655 0.995 0.725 0.0148 JO.
35. 130. 1439. 8.2 67.9 235.5 0.247 0.791 0.705 0.662 1.012 0.734 0.0142 35.
40. 154. 1425. 9.6 73.0 238.6 0.264 0.793 0.708 0.669 1.028 0.743 0.0136 40.
45. 181. 1412. 11.2 78.2 241. 7 0.280 0.794 o. 711 0.675 1.043 0.751 0.0131 45.
so. 212. 1399. 13.0 83.5 244.7 0.297 0.796 0.714 0.681 1.058 0.759 ·0.0125 50.
55. ·247. 1385. 15.0 88.8 247.8 0.313 0.797 0.717 o.-686 1.072 0.768 0.0119 55.
60. 286. 1371. 17.3 94.2 250.8 .0.329 0.799 0.720 0.692 1.085 0.776 0.0113 60.
65. 330. 1356. 19.8 99.7 253.8 0.345 0.801 0.722 0.697 1.09?- 0.785 0.0108 65.
70. 378. 1342. 22.6 105.2 256.7 0.361 0.803 0.725 0.701 1.108 0.793 0.0102 70.
75. 431. 1327. 25.8 110.8 259.6 0.377 0.805 0.727 0.706 1.119 0.802 0.0097 75.
80. 490. 1312. 29.2 116.4 262.5 0.393 0.807 0.729 0.710 1.128 0.812 0.0091 • '80.
as. 555. 1296. 33.1 122.1 265.3 0.409 0.809 0.731 o. 714 1.137 0.822 0.0086 85.
90. 626. 1280. 37.3 127.8 268.0 0.425 0.811 0.733 0.718 1.145 0.833 0.0080 90.
95. 704. 1264. 42.0 133.5 270.7 0.440 0.813 0.735 0.722 1.152 0.845 0.0075 95.
100. 788. 1247. 47.2 139.3 273.3 0.456 0.815 . o. 737 0.726 1.160 0.859- 0.0070 100.
105. 880., 1230. 52.9 145.1 275.8 0.471 0.817 0.739 . 0.730 1�167 0.874 0.0065 '°
.· 105.
110. 979. 1212. 59.2 150.9· 278.2 0.486 0.818 0.740 0.734 1.174 0.891 0.0060 110. 115. 1087. 1193. 66.1 156.8 280.5 0.501 0.820 0.742 0.738 1.182 0.911 0.0054 115.
120. 1203. 1173. 73.8 162.7 282.7 0.516 0.821 0.744 0.743 1.191 . 0.933 0.0050' 120 •
125. 1327. 1153. 82.3 168.6 284.8 0.531 0.822 0.746 0.749 1.202 0.960 0.0045 125.
130. 1461. 1131. 91.8 174.6 286.7 0.545 0.823 0.748 0.755 1.215 0.992 0.0040 130.
135. 1605. 1109. 102.3 180.6 288.5 0.560 0.824 0.750 0.763 1.232 1.030 0.0035 135.
140. 1760. 1085. 114.1 186.7 290.2 0.574 0.825 0.753 0.771 1.253 1.076 0.0031 140.
145. 1925. 1060. 127.3 192.8 291.7 0.589 0.825 0.757 0.781 1.281 1.132 0.0026 145.
150 . 2102. 1033. 142.4 199.0 292.9 0.603 0.825 0.763 0.793 1.317 1.202 0.0022 150.
... �
molecule is often ambiguous (as demonstrated by the dif- ·. spheric pre�sure (101.325 kPa [14.696 psia]} are given asfering values obtained by Chen et al. and Wilson and Tables 5 and 6 .. Basu). Given the high precision and accuracy of the sound Diagrams of the thermodynamic properties on pres-speed measurements, ideal gas heat capacities based sure-enthalpy and temperature-entropy coordinates were solely on those data are adopted here (except that Luft's prepared as described by Gallagher et al. (1988). They are data for R123 at 400 K [260.3°F] and 500 K (440.3°F] were presented here as Figures 6-:-11. included in the fit of Equation 41 in order to extend its tern·
SUMMARY AND DISCUSSION perature range).
THERMODYNAMIC TABLES AND DIAGRAMS Experimental measu'rements of the thermodynamic
properties of t'NO leading alternative refrigerants, R134a The preparation of tables of thermodynamic proper- and R123, are·described here. These measurements are
ties is a straightforward matter given a set of routines imple- particularly valuable in that a single group, mrking with menting an equat.ion of state. A full set of FORTRAN common fluid samples, has carried out a diversified set of property routines were developed for the MBWR equation measurements. Where practical, the same property was of state based on the routines developed by Ely (1984}. measured on different apparatuses (e.g., vapor pressures These routines computed reduced properties relative to on both the Burnett and variable-volume apparatus) as a the ideal gas reference state (e.g., S(T. V)IR - So(T. V)/R}} consistency check. Addit\6nal ch�ks were provided by and thus required modification to provide absolute quanti- complementary data (e.g., vi rial coefficients derived from ties. The input and output format was aloo changed to yield both speed of sound and Burnett measurements). a set of routines identical in form to those previously These measurements, along with other data available developed for the CSD equation of state (Morrison and in the literature, were used to fit a modified Benedict-Webb-Mclinden 1985, 1986). Saturation properties, in both SI Rubin equation of state, which, in turn. was used to gener· and inch-pound units. are presented as Tables 3 and 4. ate tables and diagrams of the thermodynamic properties. Space does not permit the presentation of a full set of This equation of state provides a consistent formulation of superheated vapor properties; sample tab!es at atmo- all the thermodynamic properties in the compressed liquid
274

Table 4b Saturation Properties for R.123; I-P Units
Tcrrp Pressure Cen.sity Enthalpy Entrcpy C.(ITTU/�· °F)
a Te.mp (·f) (psia) (lb/ft3 ) (BIU/lb) (B1U/l:b·. F) (BTU/lb· °F) (dyn/on) ("F)
liq vap liq vap liq vap liq vap liq vap
o. 2.0 97.8 0.06 8.2 87.6 0.018 0.190 0.160 0.138 0.202 0.152 20.7 o.
10. 2.6 97.0 0.08 10.2 89.J 0.022 0.190 0.161 0.140 0.205 0.155 20.0 10. 20. 3.5 96.2 0.11 12.3 90.4 0.026 0.189 0.162 0.142 0.209 0.157 19.3 20. JO. 4.5 95.4 0.13 14.4 91.8 0.031 0.189 0.163 0.145 0.213 0.160 18.6 JO.
40. 5.8 94.6 0.17 16.6 93.3 0.035 0.189 0.163 0.147 0.218 0.162 17.9 40.
50. 7.3 93.7 0.21 18.8 94.7 0.040 0.189 0.164 0.149 0.222 0.165 17.2 50. 60. 9.2 92.9 0.26 21.0 96.2 0.044 0.189 0.165 0.151 0.226 0.167 16.5 60. 70. 11.4 92.0 0.32 23.3 97.7 0.048 0.189 0.166 0.153 0.231 0.170 15.9 70. 80. 14.1 91.1 0.39 25.6 99.1 0.053 0.189 0.167 0.155 0.235 0.172 15.2 80. 90. 17.2 90.3 0.47 28.0 100.6 0.057 0.189 0.168 0.157 0.240 0.174 14.5 90.
100. 20.8 89.4 0.56 30.4 102.1 0.061 0.189 0.169 0.159 0.244 0.177 13.9 100.110. · 25.0 88.4 0.66 32.'9 103.5 0.066 0.190 0.170 0.161 0.248 0.179 13.2 110.120. 29.8 87.5 0.79 35.4 105.0 0.070 0.190 0.171 0.162 0.252 0.181 12.6 120. 130. '35. 3 86.5 0.92 37.9 106.5 0.074 0.191 0.171 0.164 0.256 0.183 12.0 130. 140. '41.5 85.6 1.08 40.5 107.9 0.079 0.191 0.172 0.165 0.259 0.185 11.3 140.
150. 48.5 84.6 1.26 43.l 109.3 ., 0.083 0.192 ·0.113 0.167 0.263 0.188 10.7 150. 160. 56.5 83.6 1.46 45.8 110.7 0.087 0.192 0.173 0.168 0.265 . ci.190 10�1 160. 170. 65.J 82.5 1�68 48.5 112.1 0.091 0.193 0.174 0.169 0.268 0.193 9.5 170. 180. 75.2 81.5 1.93 51.2 113.S 0.096 0.193 0.175 0.170 0.211· 0.195 8.9 180. 190. 86.1 · 80.4 2·.21 53.9 114.8 · 0.100 0.194 0.175 0.171. 0.273 0.198 8.3 190. 200. :98.2 79.2 2�52 56.6 116.l 0.104 0.194 0.176 0.172 0.275 0.201 7.7 200. 210. tu.5 78.1 2.87 59_4: 117.3 0.108 0.195 0.176 0.173 0.277 0.205 7.1 210. 220. 126.1 76.9 3·:26 62.1 118.5 0.112 _: ·0.195 0.177. 0.174 0.279 0.208 6.5 220. 230. 142.1 75.6 3';.69 64.9' 119.7 0.116 ·-· 0.196 0.177 0.175 0.281 0.213 6.0 230. 240. '159.4 74.3 4.18 67.7 120�8 0.120 ·0.196 .0.177 0.177 0.283 0.218 5.4 240. 250. '178.3 73.0 4·. 72 ·. 70.6' 12L8 0.124 ·o.196 0.178 0.178 0.285 0.224 '4 .8 250. 260. 198.8 71.5 5.33 73.4 122.8 0.128 270. 221.1 70.0 6.01 76.3 123.7 0.132-280. 245.1 68.4 6.78 79.1 124.5 0.136 290. 271.0 66.7 7.66 82.1 125.3 0.140 300. 299.0 64.9 8.67 85.0 125.9 0.143 310. 329.2 62.9 9.83 88.1 126.4 0.147 320. 361.8 60.9 11.19 91.2 126.8 0.151 330. 397.0 58.6 12.19 94.4 121.0 0.155 340. 435.0 56.1 14.73 97.8 127.1 0.159 350. 476.0 53.0 17.19 101.6 126.8 0.164
,.
and superheated vapor regions, as'well as-for-saturated conditions. The maximum ·pressure for this formulation is 10,000 kPa {1500 psia); the applicaqle temperatu.re range is 233 to 450 K (-40° to 350�F} for R134a and 255 to 450 K (0° to 350°F) for R123.
The R123 results prese·nte'd here· are fodsomerically pure_ 1,1-dichloro-2,2,2-triflubroetha,:te (CHCl2CF3). The· eventual commercial product is likely to contain a signifi· cant (app·roximately 5%-10%) quantity of the isomer R123a (1,2-dichlorb-1,2,2-trifluoroethane; CHCIFCCIF2). The limite_d data on R123a suggest that it is unll!<ely that the properties·of R123 and R123a differ-significantly. (For example. the boiling points of the tVvO isomers differ by less than 2.1 K (3.9°F).) Thus, the_ formulation presented here for isomerically pure R123 should also apply to R123/ R123a mixtures. The impact of R123a on the properties of "R123" remains an area for future VvOrk. Apart from the lack of data for R123a. it i_s not feasible to prepare a lasting set of tables and diagrams for the R123/R123a mixture atthis time because the R123a content of commercial grade R123 is highly dependent on process conditions employed in its production. conditions that are currently in a state of· flux as the processes are refined.
0.197 0.178 0.179 0.288 0.232 4.3 260. 0.197 0.179 0.181 0.292 0.241 3.8 270. 0.197 0.180 0.183 0.297 0.252 3.3 280. 0.197 0.181 0.186 0.304 0.266 2.8 290. 0.197 0.182 0.189 0.313 0.283 2.3 300. 0.197 0.184 0.193 0.325 0.306 1.9 310. 0.197 0.187 0.197 0.343 0.337 1.4 320. 0.196 0.190 0.203 0.371 0.380 1.0 330.0.196 0.195 0.210 0.421 0.446 0.7 340. 0.195 0.200 0.218 0.527 0.575 0.3 350.
While the formulations presented here cover the full · range of conditions of interest for refrigeration applicationsand are bpsed on a modern, well-proven equation of state.and while they are jelt to represent the best posS1ble f ormulation with the available data, they cannot be consideredas final. As'discussed above, the compressed liquid regionis based on estimation methods. But perhaps the mostpressing need is f9r calorimetric (e.g., heat capacity) information for the liquid phase and for the vapor phase atpressures higher than those covered by the sound speedmeasurements. The calculation of heat capacity requiresthe evaluation of first and second derivatives of the equation of state. so that any errors in p-V-f or other data aregreatly magnified. Heat capacity data are thus an excellentcheck on.the entire thermodynamic surface. Work continues on such measurements, both on the fluids consideredhere and on additional promising alternative working fluids.
Apart from the thermodynamic properties. knowledgeof the transport properties (e.g., viscosity, thermal conductivity) is needed, particularly for equipment design. Again.additonal work is under way to collect these vital data.
275

Table Sa Superheated Vapor Properties for Rl34a; SI Units
Pressure - 101.325 kPa
Ter.,p Density Enthalpy Entropy Cv cp
u ("C) (kg/m3) ( k.J /kg) ( k.J /kg K) (rn/s)
-26.1* 1373.16 16.2 0.067 0. 741 1.197-26.1+ 5.26 232.0 0.941 0.682 0.787 145.7
-25 .0 5.23 232.9 0.944 0.684 o. 788 146.1 -20.0 5 .11 236.8 0. 960 0.691 0. 794 147.8 -15.0 5.00 240.8 0.976 0.699 0.799 149.4 -10.0 4.89 244.8 0.991 0.706 0.805 151.0
-5.0 4.79 248.9 1.006 0. 714 0.811 152.6 0.0 4.69 252.9 1.021 0. 722 0.818 154.2 5.0 4.59 257.0 1. 036 0.730 0.825 155.7
10.0 4.50 261. 2 1.051 0.738 0.831 157.215.0 4.42 265.3 1. 066 0.746 0.838 158.7 2(1. 0 4.34 269.6 1.080 0.754 0.846 160.1 2·, .0 4.26 273. 8 1.095 0.762 0.853 161. 530.0 4.18 278.1 1.109 0. 770 0.860 162.915.0 4.11 282.4 1.123 0. 778 0.867 164.3 40.0 4.04 286.8 1.137 0.786 0.875 165.7 45.0 3.97 291.1 1.151 0.793 0.882 167.0 so.a 3.91 295.6 1.165 0.801 0.890 168.4 55.0 3.84 300.0 1.178 0.809 0.897 169.7 60.0 3.78 304.6 1.192 0.817 0.905 171.0 65.0 3. 73 309.1 1.206 0.825 0.912 172.3 70.0 3.67 313. 7 1. 219 0.833 0.920 173.675.0 3.61 318.3 1.232 0.841 0.927 174.8 80.0 3.56 322.9 1. 246 0.84'l 0.935 176.1
�-�rated liquid + saturated vapor
?,1
Table 6a Superheated Vapor Properties for Rl23; SI Units
Pressure - 101.325 kPa
Temp Density Enthalpy Entropy Cv cp
u C-C) (kg/m3
) (kJ/kg) (kJ/kg ·K) (m/s)
27.9* 1456.95 60.8 0.224 o. 700 0.988
27.9+ 6.47 231.2 0.790 0.652 0.722 128.8
30.0 6.41 232.7 0.795 0.652 0.721 129.3 35.0 6.29 236.3 0.807 0.654 0.721 130.6 40.0 6.18 239.9 0.819 0.655 0.721 131.8
45.0 6.06 243.5 0.830 0.658 0.723 133.0
50.0 5.96 247.1 0.841 0.660 0.724 134.2
55.0 5.86 250.8 0.852 0.664 0.727 135.4
60.0 5.76 254.4 0.863 0.667 0.729 136.6
65.0 5.67 258.0 0.874 0.671 0.732 137.7 70.0 5.58 261.7 0.885 0.674 0.736 138.9
75.0 5.49 265.4 0.896 0.678 0.739 140.0
80.0 5.41 269.l 0.906 0.683 0.743 141.l
85.0 5.32 272.8 0.917 0.687 0.747 142.2
90.0 5.25 276.6 0.927 0.691 0.751 143.3
95.0 5.17 280.3 0.937 0.696 0.756 144.3 100.0 5.10 284.l 0.948 0.700 0.760 145.4 105.0 5.02 287.9 0.958 0.705 0.764 146.4 110.0 4.95 291.8 0.968 0.710 0.769 147.5 115 .0 4.89 295.6 0.978 0.714 o. 774 148.5120.0 4.82 299.5 0.988 0.719 0. 778 149.5
�rated liquid + saturated vapor
276
Table Sb Superheated Vapor Properties for Rl34a; I-P Units
Pressure - 14.70 psia
Temp DeRSity Enthalpy Entropy Cv cp
u ("F) (lb/ft 3 ) (BTU/lb) (BTU/lb·• F) (ft/s)
-15.o* 85. 723 7 .0 -15.o+ 0.329 99.8
-10.0 0.324 100.7 0.0 0.316 102.6
10.0 0.308 104.6 20.0 o. 301 106.530.0 0.294 108.4 40.0 0.287 110.4 50.0 0.281 112.4 60.0 0.275 114.4 70.0 0.270 116.4 80.0 0.264 118.4 90.0 0.259 120.5
100.0 0.254 122.S110.0 0.249 124.6 120.0 0.245 126.7 130.0 0.240 128.9 140.0 0.236 131.0 150.0 0.232 133.2 160.0 0.228 135.4 170.0 0.224 137 .6 180.0 0.221 139.8 190.0 0.217 142.1 200.0 0.214 144.4
* saturated liquid+ saturated vapor
0.016 0.225
0. 2270.2310.2350.2390.2430.2470.2510.2550.2590.2630.2670.2700.274 0. 27.80.281 0.2850.288 0.2920.2960.299 0.3030.306
Table 6b Superheated Vapor Properties for
Pressure - 14.70 psia
Temp Entropy
0.177 0.286 0.163 0.188 478.0
0.164 0.189 481. l 0.166 0.190 487.2 0.168 0.192 493.2 0.170 0.193 499.0 0.172 0.195 504.7 0.174 0.197 510.3 0.176 0.199 515.7 0.178 0.201 521.1 0.181 0.202, 526.3 0.183 0.204 531. 50.185 0.206 536.6 0.187 0. 208 541.6 0.189 0.210 546.5 0.191 0.212 551.4 0.193 0. 214 556.20.195 0.216 561. 0 0.197 0.218 565.7 0.200 0.220 570.4 0.202 0.222 575.0 0.204 0.224 579.5 0.206 0.226 584.0 0.208 0.228 588.5
Rl23; I-P Units
Cv cp
u
C-F)
OensitJ Enthalpy(lb/ft) (BTU/lb) (BTU/lb· •F) (ft/s)
82 .2'* 90.954 26.1 82.2+ 0.404 99.4
90.0 0.397 100.8 100.0 0.389 102.5 110.0 0.381 104.2 120.0 0,374 106.0
130.0 0.366 107.7 140.0 0.360 109.4
150.0 0.353 111.2 160.0 · 0.347 112.9
170.0 0.341 114.7
180.0 0.335 116.5
190.0 0.330 118.3
200.0 0.324 120.l
210.0 0.319 121.9
220.0 0.314 123.7 230.0 0.309 125.5
240.0 0.305 127.4 250.0 0.300 129.2 260.0 0.296 131. l270.0 0.291 133.0
* saturated liquid+ saturated vapor
0.054 0.189
0.191 0.194 0.197 0.200 0.203 0.206 0.209 0.212 0.215
0.218
0. 221
0.22l 0.226
0.229 0.231 0.234 0.237 0.239 0.242
0.167 0.236 0.156 0.173 422.4
0.156 0.172 426.1 0.156 0.172 430.7 0.157 0.173 435.2 0.158 0.173 439.6 0.159 0.174 443.9 0.159 0.174 448.1 0.160 0.175 452.3 0.161 0.176 456.4 0.162 0.177 460.5 0.164 0.178 464.5 0.165 0.179 468.4 0.166 0.180 472.4 0.167 0.181 476.2 0.168 0.183 480.1 0.170 0.184 483.9 0.171 0.185 487.6 0.172 0.186 491.4 0.173 0.187 495.1 0.175 0.189 498.7

�......
_J__._�,-'-��-rr��....,.��._,...-'T;;;�:+i�-::i��:r:��1:s:-:1:�73�'.l�- l0,
00-0 I I
10.�
I . / I ., i ,
0 50 100 150 200 250 300 350
1,000
.,,-.._ ro
�......._,
(l) f....t
� (/)
�.ooJ
j
u 0
�I,•
II E-
;f ,i I sf 1· «,/ /E,/ '8i' 8'
I i: I ·: 1· ·1 • 1
I I
t: i i I i I i I !
I. y: ,�,.. ·f.. ...-· I ./ .. 1· /_.. .. - .. /.:.. ·1······ .... ··. ....... ;:.... .....
. . ;..... .. .... . ,/: .: / f../ .· :� :' 0 I . · .
0 50 100 150 200
Enthalpy (kJ/kg)
Figure 6 Thermodynamic properties of A134a, SI units
;-.....,
..... ,.
250 300
}_/l. - - --; *-'·
f--
350
1,000
100

I\) --.J CX>
:j
50 100 150 200 250 300 350 lO,OOO:rr-rrrnTiTTTSr-�n������ j I I I w I /. . t'
, ' . . , - 10,000
I 1 . .f I G:' I �: I ,:
-i' ,I
1,000�:
� -3 1
� _: � � .,_, -
Q)
� � Cf) Cf)
Q)
�
100
__,.
�i Ii -1:
�! l:
li �I
� / 1 ! I cf I / I�1 . "!I '11 : ./ : ci1· � I C>· Q I
!li·! I I / , ����
I : I .
�: . , l I �! loj � �:_: ,· "I . ti .. I. :· 1 · � ··.· -· . l
I ' I . . - .·, .
i �k-A-LJ .............. I ....... t .....
....
. . . . / j .... ..· r __
- - -1- - -
I ---
---
-- -,-;_J---------I
Q.?,_
_ Q..�
1.0
' ,:
- - - ' -t '-1- - - -
fl 'v,Y
;";r' �'...I-
1,000
100
10 11 / I i. I I t ' ( I I • (' I I I I I I I ', I JC,- I: 7 - -. - I I I I / I
3 � 0
I I y I 10 50 100 150 . 200 250 300
Enthalpy (kJ/kg)
Figure 7 Thermodynamic properties of R123, SI unirs

�
1000
�-
-i
1 I,...-._, I < ...... 1 ..
U)
& -j I t!� 1 : 1ii � 1 f-1 rJ -I I I (/) J '
E � � J
10�
-, �
I -,
0 25 50 75 100 125 150
'/ Ii ,j I I
• I
I
I
I
(; I f1· I I It I .... , . . I I.
. I:� I I I . .· .... . I rl . I I I . I I . . :.=.:. •·· / .·· ... .·' 1'60: I : 1 . I I , . .·· .· ... ., .· '! . . r. i , � .
I j i . I I. . . .' .. · ::.::q-·:·.:.7�j11� ·, / / : · I -�J···::>J . ....-·· .. · .......... ··)_.../ �J�o ..-/j_ , , i , i , r...-�, ··��--·r�--7J./y1_..f. �?i .. f�t. I. ,i: . ·-.. /.�·r·· .l�f··....-�1��--J _/ ___ ... {o!i ...... "c::: --. . . I . r . . r. ; .
1000
100
:,��.�·r �l.,.l;F..:�-1f .. �1 :tF J· /)�/://., .1 (;- - .
;�. '1
_·_ � - ·i�t:�i1l/i /l;,./
e· .. ..f. �- c/ .,.;·· /0
! f1. q {! i /ff : \ �1 -Y __ iJ---:lJ\- L�-f�----11-·' -t-µ_/·1· ... ··-1-.H-+rfooFjf-l-1_!. --\l?r) V ! /
f l��14l / / ./ / f f ·; . ,f ! I · I _yceci.O'..°rJ:/lb--;.�----;_;; __ ,
l���·�·�·�:·-�·� .. ��:�:�· �l
���-���l0 · 25 50 75 100 125 150
Enthalpy (BTU/lb)
Figure 8 Thermodynamic properties of R134a, English units

r11 '-./ .....
(l) �.1 H _, ;::; -r
� �1 f
l
OJ =§ 3
�_J
I
1
I
I I ! ·N ""/ IQ Q
IQ Q.
i ! II l ·
i I I : i !j .. i�.I I
25
I �I I I I
50
I I
-c,, �I �/ ��:,' �1· Q
,._,, Q QI .,
I. ",' . !
I 11 I I I I
I f I i
.1
?'5 iOO
l I' 1 I · • 1 · , r -, - 1 1 , , ir , , , , , , , , -v: , " , , , I , , , 1 , , 1 , , , 1 , • , , r .. · , , , , 1 , , 1 r I ,
25 50 75 100
Enthalpy (BTU/lb) 125
Figure 9 Thermodynamic properties of R123, English units
150
100
10

....-..
Q)
Q)
�
I\) ro � �
Q)
�
8 Q)
-0.1 0 0.1
200
160
120
80 �
40 -i
o-,
0.2 0.3 0.4 0.5 0.6 0.7 0.8 0.9 1 1.1 1.2
�/-�·· ... · \··· /\.: :·\: :\ · .. \\ �YV / / _ //'-;'-/-Li_/
1.3
200
160
// 320/1-80
�;�_...�.r: '\J .. ', t\,. -:-.:��+··-V--�\---!-� /;'-/.... ,/;/ ... �/ I // //_. /l-40
$'/ I./ i \ / ; \ :'. \ :' \ \ \� \� \.. \ ? t/ // ,/ .// // fvl .1-0
-40
-80 14=7;� .-�;-,: ,·T-.�·.·,T, I,\·, I,') I r', I (,�t;::::;:=r;::·1�;7j=;=;::z, /--80
-0.1 0 0.1 0.2 0.3 0.4 0.5 0.6 0.7 0.8 0.9 1
Entropy (kJ/(kg.K))
Figure 10 Thermodynamic properties of R134a on temperature-entropy coordinates
1.1 1.2 1.3

::'"":' '-" or
c; -
-
I''
--
.....;. I\) ..... -
I''
"' -,..,...-(.;, -
j ll.l li . ..:. �- 0..t (). :) 0.(-;
',-: G i 1. t
::on-· ·- .. ... l ... . L L l , .. l I I I I I I I l. I ;..: ::._w-· / . I
I
I�
I
0,7 ��A(��,8 "f'-rO�,
?;
,_l ·;
1roo
180-
160 -
140 -
120 ....
100-
80-
60 -
40-
.J
20-
0-
-20-t
I,�,._ �I
.f . , �-. &., l...... .. (ti .,W· �- . , ,, t?/ ..... �1 · . I� .-(.-:, ,' ; : I ./
I I
180
160 r r>>-:>->-y ! \ �,!.l ... ··�:: . ..-,: .....
...... ,·· .......
. J, ,. i A-r
; ,' \
,' :' :' . ; ' ; ' I
I
"' . . . .. . . . . '-J:.-i ....... 1.. .. /\��\!--:"�,'!
. �-�-!---f--120
�.'1'/�.r\ .... :\ / :' j • II 1-;-'/-tf::;..·,1 I
II
�,W- · : I: : : : · . . : ' ,
I ,
,�?· ,.' .... \
....
.. ..
\ ..
.. : 000
: \
:' / '\
[ ,' 1,, ' / I }- 1 O 0
.$1 . . : . . ··l . ... . '
/' / ...I. .
� ..... • : : .: -: : : ' ' ' . 280
.. t� �s\·\/\ ... :: · ... :\ ...... \...- ./·\/ !\ I , '. --ii-hi ·7 _i'.
140
,., .. � "�". ,;::,. . •. . . . . . , , I.'
�J/ '§': : ">· �.. : : · : : : , · ' · , . A- 8 0
;:, ... : �·: ·�:· . M�
: . I ! / ,' / . / / I
>Cf' , .: : :· : • 6'1'! :._ -·� -·-, , ;, P I, / , c
", .' : : • ;_ • - ,·-- • : : : : , ,, I' , , . . , l
,S),: . - -:-1·:· �frJ.: \
: .: °9: \ : H ' , I I I
LJ_'' / / 2� �
�I • : : :-\ �;• ,' •
\'"" ; ,
J , , , , ../..._ p_ 1 0
Ill'' / : · : · : · 400 : -· ' · '· -i-L-. · , · 6
.. ·. / , . _....- ·\·/ / · .. / .. l_L ·/· ;_ T -f \·· ' / / , / )' l l i i
Qc / /-·l·· .. ,:' ... \:· .:\ �: � .. : ·�· °l; /.' /, ! , .''<::,/
·.'
All! , . ,'\ _. : • : • �- : : c, . . , j,' • ,
; '�/ , , , ; O
.,,, , .· . : .- . : : _. : : : . '· , ' , , , I · 1 4
s v;:I .... · i ..... ..l .... '\ .... \: /\ 2{& _ _j_.__ll;, ,' /,, /,' I ">, 2,w_/ -r-t
l,r 1 1 • , · .. · . - - - .. \ \/.'. , ,'......./..!... f-!.. -r-;
r
' .' • /: ... /.. ...;.-· � -· -.... • i : ; / , I > /( i / ' • , a
. , L-A- :' � ... ·\: : . : \ :A·: . ! , / , . , . 1 ", i 1 2 o
J/1 . •
• • 1 · . . . / / ' / ....
f-
,.f,y, ,'
\
,'
\
' • . . . . .
I I I . ,. . ,_
- ·, : _. . _. : : : 100 · -'--- ' ' ' · : ., f
,· 1· • • . • • • ••
• • ·- • 1, , • ,
• �. /
.-' : : : : : .. _.. . - . � : , , , ,
/ ! \
, / \.: ... ::._· � - .: .. -\ ·-:··- .. .\. :\� :· \o: \�,. '·; ' I 1'2· 20 ,kJ/k'o , - -- �
, , •, •. •' • • ·: � .' .;... .' .... : ;,,,o, .' \ ;
I I • -,-:.:b - (b-
l_ 0
1 , . "'' . \ . ,.. ... · as . - · . , . , . �- .. , , , � ,
. · .,,;;-- .... :X: ...
\· .1.·
,tj : a .: i::; .: ·\: __ �Q_ 7"--· · : , ·;:--,--: .... / / 1 1 */
�'
.I--'/ 1 • 11 • -� • a · . ., . -··- · . .
\ ·�
1 , 1 .
....
. ' -• : • • .•• ,. • •
. ., , ,
' '1
, ' , ..,._ •
\' -� "
\ • • • , I , , .,
• : i C . . • .. • .. ·- i .. : • •
, , I ' I;
I . I... _ ... ,,, - ,.. . ·:: ... : : : . : . , . , I I .' �
f 20
.:... -- . ,.
. . : \'"" .: : : : . : : . , ., . . , , I -
,· .. , : . � : \ : \ : : \ : \?L ·:s\, I ( I � ' ,, ' I ' '
� .· "'' _. 'Jo : : ': '\ : �.: -· : , , / ( ' I ' '
, . .-' IC .: '. : . : :\ ... ' . . ; : . :
I, ' ' ' ' 11. 1
• I • • \ • . . ' '
0 9
i ;�.
/ \ / • ......
, .:', ,
\, ; J '·, 'ci.; ' 0.8 .
- • • .\ • • \ ' ' I O 6
)
/ , ,..-i: ' I -;· I, ' ,: I ' ' ' • �-4 0.5 (kJ/(kg.K)
n ci.� o.2 o.3
Entropy
Figure 11 Thermodynamic properties of R123 on temperaturo-entrow coordinates

ACKNOWLEDGMENTS
This work was supported by the National Institute of Standares and Technology, the Office of Building and Community Sys:ems of tt1e US Department of Er:iergy. the Global Changf, 01v,s:on of the US Environmental Protection Agency. and the American Society of Heating, Refrigerating, and Air-Conditioning Engineers (RP-58-8 under the sponsorship of TC 3.1. Refrigerants and Brines) We also gratefully acknowledge the donation of fluid samples from E I du Pont de Nemours and Company, Inc .. and Allied-Signal
REFERENCES
ASH RAE . 1986. "ASHRAE thermodynamic properties of refrigerants." Atlanta: American Society of Heating, Refrigerating, and Air-Conditioning Engineers, Inc.
Burnett , E.J. 1936. Journal of applied mechanics, Vol. 3, p. 136. Carnahan, N.F., and Starling, K.E. 1969. "Equation of state for
nonattracting rigid spheres." Journal of Chemical Physics. Vol 51, No. 2, pp. 635-636.
Chaar, H.; Moldover, M.R.; and Schmidt, J.W. 1986. "Universal amplitude ratios and the interfacial tension near consulate points of binary liquid mixtures." Journal of Chemical Physics, Vol. 85. pp. 418-247.
Chae. H.B.; Schmidt, J.W.; and Mofdover, M.R. 1989. "Surface tension of refrigerants R123 and R134a." Manuscript submitted · to Jou.-nal of Chemical and Engineering Data.
Chen, S.S.; Rodgers, A.S.; Chao, J.; Wilhoit. R.S.; and Zwolinski, B.J. 1975. "Ideal gas thermodynamic properties of six fluoroethanes." Journal of Physical and Chemical Reference Data Vol. 4, pp. 441-456.
Davis, H.A. 1983. "Low-cost tubular sapphire optical cells for study of phase separation in fluid mixtures." Review of Scientific Instruments Vol. 54, p. 1412.
OeSantis. R.; Gironi, F.; and Marrelli, L. 1976. "Vapor-liquid equilibrium from a hard-sphere equation of state." Industrial and Engineering Chemistry. Fundamentals Vol. 15, No. 3. pp. 183-189.
Ely, J. F. 1984. "Application of the extended corresponding states model to hydrocarbon mixtures." Proceedings: 63rd Gas Processors Association Annual Convention, New Orleans. pp. 9-22.
. .Ewing, M.B.; Goodwin, A.R.H.; McGlashari,'M.L .; and Trusler.
J.PM. 1988. "Thermophysical properties of alkanes fromspeeds of sound determined using a spherical resonator 2.n-butane." Journal of Chemical Thermodynamics Vol. 20,pp. 243-256.
Gallagher, J.S.; Mclinden, M .O.; and Morrison. G. 1988. "Thermodynamic diagrams for refrigerant mixtures." ASH RAE Transactions, Vol. 94, Part 2. pp. 2119-2136.
Goodwin, A.R.H., and Moldover, M.A. 1989. Manuscript in preparation.
Hickman. K. 1988. York International Corporation, York, PA, personal communication.
Hacken. R.: Moldover, M.A.: Muth, E.: and Gerner, S. 1975. "Versatile cells for optical studies in fluids." Review of Scientific Instruments, Vol. 46, p. 1699.
Jacobsen. R.T., and Stewart, R.B. 1973. "Thermodynamic properties of nitrogen including liquid and vapor phases from 63 K to 2000 K with pressures to 10,000 bar." Journal of Physical and Chemical Reference Data, Vol. 2. pp. 757-922.
283
Kabala. Y, Tanikawa. S .. Uematsu. M; and Watanabe. K 1988 "Measurements of the vapor-liquid coexistence curve and the critical parameters for 1,1,1.2-tetrafluoroethane" International Journal of Thermophysics. Vol. 10. No. 3. pp. 605-615
Linsky. D. Levelt-Sengers. J.M.H : and Davis. H.A 1987 . "Semiautomated PVT facility for fluids and fluid mixtures."
Review of Scientific Instruments, Vol. 58, pp. 817-821. Luft. NW. 1954. "Assignment of torsional frequencies in some
halogenated ethanes." Journal of Chemical Physics, Vol. 22. pp. 155-156.
McCarty, R.D. 1980. "Interactive FORT RAN IV computer programs for the thermodynamic and transport properties of selected cryogens (fluids pack)." NBS Technical Note 1025 National Bureau of Standards. Gaithersburg, MO.
Mehl. J.B .. and Moldover, M.R. 1981. "Precision acoustic measurements with a spherical resonator: Ar, C2H/' Journal of Chemical Physics Vol. 74. p. 4062.
Moldover, M.R.: Waxman, M.; and Greenspan. M. 1979. "Spherical acoustic resonators for temperature and thermophysical property measurements." High Temperature and High Pressure, Vol. 11, pp. 75-86.
Morrison, G., and Kincaid, J.M. 1984. "Critical point measurements on nearly polyjisperse fluids." AIChE Journal, Vol. 30. p. 257.
Morrison, G., and Mclinden. M.0. 1985. "Application of a hard sphere equation of state to refrigerants and refrigerant mixtures." NBS Technical Note 1226. National Bureau of Stan-dards, Gaithersburg, MD.
Morrison, G., and Mclinden, M.O. 1986. "Application of the Carnahan-Starling;QeSantis equation of state to mixtures of refrigerants." ASME Winter Annual Meeting, Anaheim, CA. paper 86-WA/HT-59.
Morrison, G., and Ward, D.A. 1989. "Saturation properties of two alternative refrigerants." Manuscript in preparation.
· Rathjen, W., and Straub, H. 1973. Proceedings, InternationalInstitute of Refrigeration, Commission 81 Meeting . .Zurich.
Rayleigh. O.M. 1916. Proceedings of the Royal Society of London, Series A 92, p. 184. . ·; .
Waxman, M., and Hastings, J.R. 1971. Journal of Research of the National Bureau of Standards. Vol. 75C, nos. 3 and 4.
Weber, L .A. 1989. "Vapor pressures and gas phase P.VT data for 1, 1 , 1,2-tetra-fluoroethane." International Journal of T hermophysics. Vol. 10, No. 3, pp. 617-627.
Weber, L.A., and Levelt-Sengers, ·J.'M.H. 1989. ''Critical parameters and saturation de·nsitiesof 1,1-dichloro-2,2,2-trifluoroethane." Accepted for publication in Fluid Phase Equilibria.
Wilson, D.P., and Basu, R.S. 1988. "Thermodynamic properties of a new stratospherically safe working fluid-refrigerant 134a." ASHRAE Transactions, Vol. 94, Part 2.
Younglove, 8.A. 1982. "Thermophysical properties of fluids. I. Argon, ethylene, parahydrogen, nitrogen, nitrogen trifluoride, and oxygen." Journal of Physical and Chemical Reference Data, Vol. 11, supplement no. 1.
Younglove, B.A.. and Ely, J.F. 1987. "Thermophysical properties of fluids. II. Methane. ethane, propane, isobutane and normal butane." Journal of Physical and Chemical Reference Data. Vol. 16, pp. 577-798.