measurement and numerical studies of optical properties of yag:ce phosphor for white light-emitting...
TRANSCRIPT

Measurement and numerical studies of opticalproperties of YAG:Ce phosphor for white
light-emitting diode packaging
Zongyuan Liu,1,2 Sheng Liu,1,2,* Kai Wang,2,3 and Xiaobing Luo2,4
1School of Mechanical Science and Engineering, Huazhong University of Science and Technology,Wuhan 430074, China
2MOEMS Division, Wuhan National Laboratory for Optoelectronics, Wuhan 430074, China3School of Optoelectronics Science and Engineering, Huazhong University of Science and Technology,
Wuhan 430074, China4School of Energy and Powering Engineering, Huazhong University of Science and Technology,
Wuhan 430074, China
*Corresponding author: [email protected]
Received 13 July 2009; accepted 15 November 2009;posted 3 December 2009 (Doc. ID 113394); published 8 January 2010
The optical properties of YAG:Ce phosphor were measured by a double-integrating-sphere system andcalculated by Mie theory and Monte Carlo ray tracing to provide precise optical characterizations ofYAG:Ce phosphor for white light-emitting diode (LED) packaging design. Measurement results showedthat the phosphor presents strong absorption for blue light, high reflection for yellow light, and an iso-tropic emission pattern of converted light. The conversion efficiency and quantum efficiency for thesaturated phosphor are around 70% and 87%, respectively. Based on the measurement results, the ab-sorption coefficient, scattering coefficient, and anisotropy factor of the phosphor calculated by Mietheory were compared with those calculated by ray-tracing simulation to modify Mie theory to finda reasonable method that can easily obtain the optical constants of YAG:Ce phosphor. Comparisonsrevealed that Mie theory can predict the variation of the optical constants of phosphor, but the absorp-tion and scattering cross sections should be multiplied with two fitting parameters. The fitting pa-rameters have been given in this study and can be obtained by testing packaged LEDs with differentphosphor concentrations. © 2010 Optical Society of America
OCIS codes: 120.4530, 160.2540, 290.5820, 290.4020, 290.5850, 230.3670.
1. Introduction
White light-emitting diodes (LEDs) have been char-acterized as the future illumination styles to replacetraditional light sources due to their superior fea-tures, such as small size, low power consumption,high efficiency, long life, and variable color [1–4].Phosphor-converted LED (pcLED) is one of the mostpromising technologies to obtain high-quality whiteLEDs [5–7]. This promotes the rapid development of
phosphor materials, including Ce3þ-doped garnetmaterials [8] and Eu2þ-activated nitride and silicatecompounds [9–11]. Among these materials, YAG:Cephosphor currently presents the highest quantum ef-ficiency, the best optical-thermal stability [12], andthe widest waveband [9], and is, therefore, chosenfor the generation of natural and cool white LEDs.The multiphosphor converted warmwhite LEDs alsoprefer YAG:Ce phosphor to be the yellow–green spec-tra converter to increase the luminous efficiency.
However, the packaging issues caused by phosphormaterials and the further penetration of whiteLEDs into general illumination demand a profound
0003-6935/10/020247-11$15.00/0© 2010 Optical Society of America
10 January 2010 / Vol. 49, No. 2 / APPLIED OPTICS 247

understanding of the optical properties of phosphor[13]. Previous studies have revealed that phosphoroptical properties have remarkable impacts on LEDpackaging performance, such as light extraction [14–20], spatial color distribution [21,22], and color qual-ity [7,9]. These studies normally apply the MonteCarlo method for the optical simulation of LEDpackaging, in which the phosphor layers were consid-ered to be Mie scattering materials. The issue is thatthe optical definitions of the phosphor in these simu-lations suffered from lack of precise phosphor opticalconstants verified by experiments. Most of studiesabout YAG:Ce phosphor focused on the photolumi-nescence and the excitation and emission spectra,and lacked a substantial consideration of the lightscattering, which is essential for white LED packa-ging. Narendran et al. [18], Zhu et al. [23], and Kanget al. [24] tested the optical properties of YAG:Cephosphor and presented improved packaging meth-ods based on their studies. The issues are that thephosphor layer in [23] was not a uniform film, in[24] it was coated on the chip for test, and the inci-dent light in [18] was divergent and can result inhigh reflection. These issues affected the true perfor-mance of the phosphor. In addition, the optical con-stants of the phosphor were not clearly given in[18,23,24]. This causes the further research of LEDpackaging design to be difficult. Therefore, it is im-portant to develop an improved measurement plat-form and determine the optical constants of YAG:Ce phosphor by numerical analysis.A double-integrating-sphere system has been used
extensively for the measurement of bulk scatteringmaterials [25,26]. This system collects the trans-mitted light and reflected light for the tested materi-als and then obtains the optical constants bynumerical calculations. Mie theory is one of the mostadopted theories. Considering that YAG:Ce phosphoris a fluorescent material and will present some fea-tures unlike those of traditional scattering materials,this paper applied a Monte Carlo ray tracer to exam-ine the Mie theoretical results and determined theoptical constants by ray-tracing simulation. Section 2introduces the measurement platform and the ex-perimental method for YAG:Ce phosphor based onits photoluminescence properties. Section 3 presentsthe measurement results and a short discussionabout the effects of the phosphor properties on LEDpackaging. In Section 4, a detailed Mie theoreticalcalculation is given and then modified by Monte Car-lo ray-tracing simulation. In Section 5, by modifyingthe absorption and scattering cross sections of thephosphor, a revised Mie calculation method of theoptical constant of YAG:Ce phosphor is proposed tofacilitate the optical design of white LEDs.
2. Description of Measurement Platform
As shown in Fig. 1, the measurement platform is adouble-integrating-sphere system with a parallel in-cident light source to excite YAG:Ce phosphor. Beforethe measurement, the fluorescence of the phosphor
has been tested by a spectrofluorimeter, FP-6500from Jasco, as shown in Fig. 2. In white LED packa-ging, the main concerns are the absorption and scat-tering properties of YAG:Ce phosphor for blue lightemitted from the chip and converted light emittedfrom itself. Therefore, the measurement platformused two color LEDs with peak wavelengths of 455and 595nm as the light sources. Diameters of thetwo integrating spheres are 150mm. Diameters ofthe apertures are 30mm. The phosphor slide wascomposed of a 2 in: (5 cm) diameter glass and a thinphosphor film. The thickness of the glass is 0:9mm.To fabricate the phosphor film, the first step was dis-pensing the mixture of YAG:Ce phosphor powder andsilicone on one glass slide with two spacers. Then, an-other glass slide precoated with Teflon was pressedon the mixture, the thickness of which was limited bythe two spacers. This glass was removed after thecuring of the phosphor silicone. The thickness of thephosphor films was changed from 0.06 to 0:3mm, andthe concentration was changed from 0.2 to 0:5 g=cm3.A spectrophotometer, PMS-50 from Everfine, wasused to test the transmitted light spectra and re-flected light spectra with the light power convertedby a photomultiplier tube. The benefits of this mea-surement platform are that the influences of chipabsorption and phosphor shape on the phosphorproperties have been reduced to the minimum andthe parallel incident light can avoid the potential testerrors by divergent incident light [18].
For blue light (455nm) excitation, the spectra oftransmitted light and reflected light are divided into
Fig. 1. (Color online) Measurement platform of YAG:Cephosphor.
Fig. 2. (Color online) Excitation and emission spectra of YAG:Cephosphor, and the spectra of blue LED and yellow LED used in thisstudy.
248 APPLIED OPTICS / Vol. 49, No. 2 / 10 January 2010
two parts at 490nm. Light with spectra from 380 to490nm is defined as unconverted blue light, andlight with spectra from 490 to 780nm is defined asconverted light. For yellow light (595nm) excitation,since no converted light is emitted from the phosphorfilm, both the transmitted light and reflected lightare sorted as the yellow light. The total optical powerof the blue light and the yellow light was tested be-fore the adding of the phosphor slide in the aperture,and are denoted as Ptotal. The optical power of trans-mitted light and reflected light are denoted as PTand PR. This study sets the transmittance and reflec-tance as the ratios of PT to Ptotal and PR to Ptotal,respectively.
3. Results and Discussions
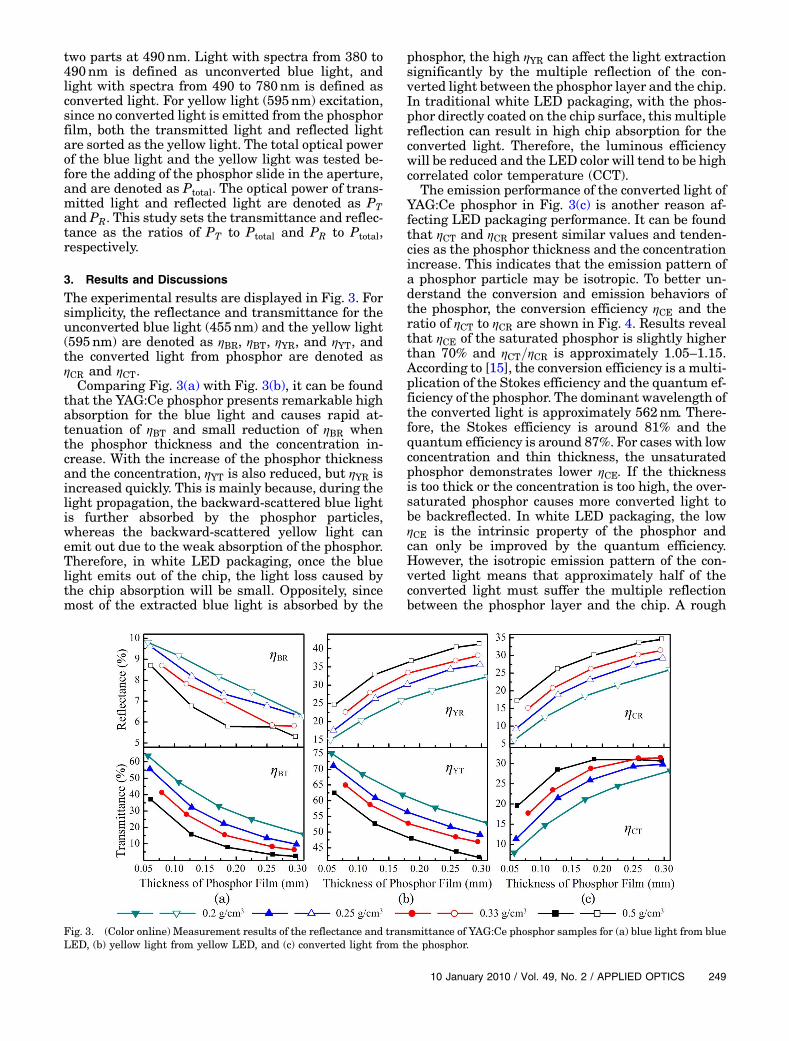
The experimental results are displayed in Fig. 3. Forsimplicity, the reflectance and transmittance for theunconverted blue light (455nm) and the yellow light(595nm) are denoted as ηBR, ηBT, ηYR, and ηYT, andthe converted light from phosphor are denoted asηCR and ηCT.Comparing Fig. 3(a) with Fig. 3(b), it can be found
that the YAG:Ce phosphor presents remarkable highabsorption for the blue light and causes rapid at-tenuation of ηBT and small reduction of ηBR whenthe phosphor thickness and the concentration in-crease. With the increase of the phosphor thicknessand the concentration, ηYT is also reduced, but ηYR isincreased quickly. This is mainly because, during thelight propagation, the backward-scattered blue lightis further absorbed by the phosphor particles,whereas the backward-scattered yellow light canemit out due to the weak absorption of the phosphor.Therefore, in white LED packaging, once the bluelight emits out of the chip, the light loss caused bythe chip absorption will be small. Oppositely, sincemost of the extracted blue light is absorbed by the
phosphor, the high ηYR can affect the light extractionsignificantly by the multiple reflection of the con-verted light between the phosphor layer and the chip.In traditional white LED packaging, with the phos-phor directly coated on the chip surface, this multiplereflection can result in high chip absorption for theconverted light. Therefore, the luminous efficiencywill be reduced and the LED color will tend to be highcorrelated color temperature (CCT).
The emission performance of the converted light ofYAG:Ce phosphor in Fig. 3(c) is another reason af-fecting LED packaging performance. It can be foundthat ηCT and ηCR present similar values and tenden-cies as the phosphor thickness and the concentrationincrease. This indicates that the emission pattern ofa phosphor particle may be isotropic. To better un-derstand the conversion and emission behaviors ofthe phosphor, the conversion efficiency ηCE and theratio of ηCT to ηCR are shown in Fig. 4. Results revealthat ηCE of the saturated phosphor is slightly higherthan 70% and ηCT=ηCR is approximately 1.05–1.15.According to [15], the conversion efficiency is a multi-plication of the Stokes efficiency and the quantum ef-ficiency of the phosphor. The dominant wavelength ofthe converted light is approximately 562nm. There-fore, the Stokes efficiency is around 81% and thequantum efficiency is around 87%. For cases with lowconcentration and thin thickness, the unsaturatedphosphor demonstrates lower ηCE. If the thicknessis too thick or the concentration is too high, the over-saturated phosphor causes more converted light tobe backreflected. In white LED packaging, the lowηCE is the intrinsic property of the phosphor andcan only be improved by the quantum efficiency.However, the isotropic emission pattern of the con-verted light means that approximately half of theconverted light must suffer the multiple reflectionbetween the phosphor layer and the chip. A rough
Fig. 3. (Color online) Measurement results of the reflectance and transmittance of YAG:Ce phosphor samples for (a) blue light from blueLED, (b) yellow light from yellow LED, and (c) converted light from the phosphor.
10 January 2010 / Vol. 49, No. 2 / APPLIED OPTICS 249
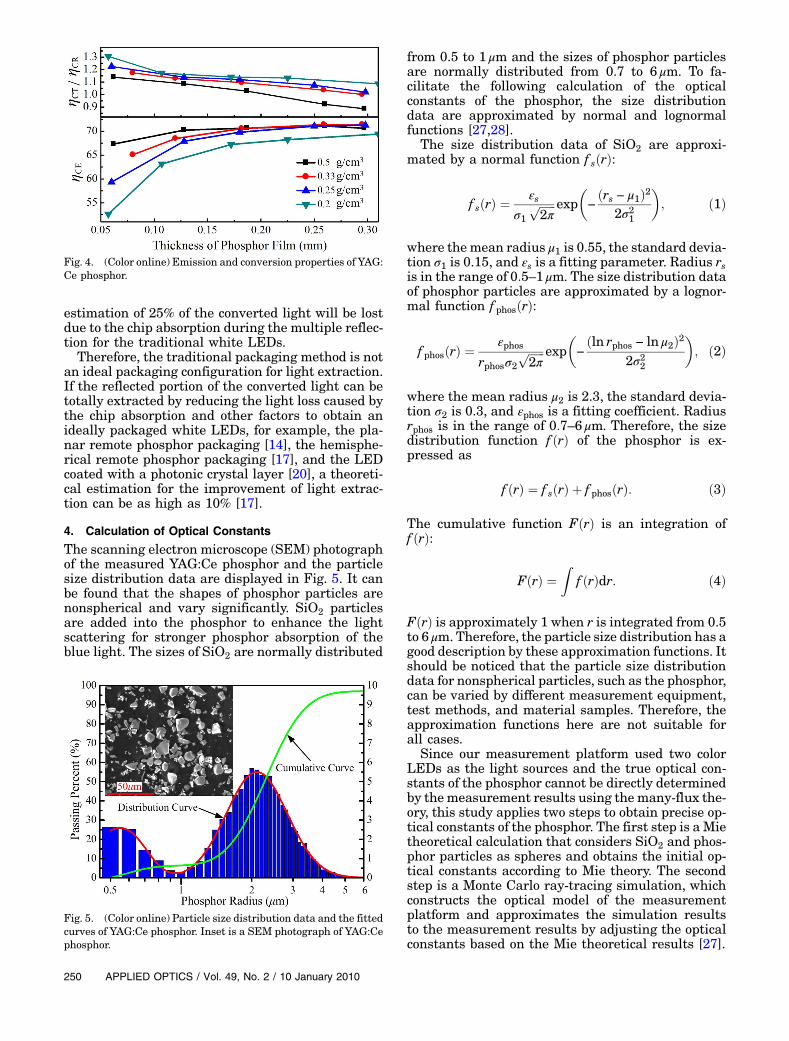
estimation of 25% of the converted light will be lostdue to the chip absorption during the multiple reflec-tion for the traditional white LEDs.Therefore, the traditional packaging method is not
an ideal packaging configuration for light extraction.If the reflected portion of the converted light can betotally extracted by reducing the light loss caused bythe chip absorption and other factors to obtain anideally packaged white LEDs, for example, the pla-nar remote phosphor packaging [14], the hemisphe-rical remote phosphor packaging [17], and the LEDcoated with a photonic crystal layer [20], a theoreti-cal estimation for the improvement of light extrac-tion can be as high as 10% [17].
4. Calculation of Optical Constants
The scanning electron microscope (SEM) photographof the measured YAG:Ce phosphor and the particlesize distribution data are displayed in Fig. 5. It canbe found that the shapes of phosphor particles arenonspherical and vary significantly. SiO2 particlesare added into the phosphor to enhance the lightscattering for stronger phosphor absorption of theblue light. The sizes of SiO2 are normally distributed
from 0.5 to 1 μm and the sizes of phosphor particlesare normally distributed from 0.7 to 6 μm. To fa-cilitate the following calculation of the opticalconstants of the phosphor, the size distributiondata are approximated by normal and lognormalfunctions [27,28].
The size distribution data of SiO2 are approxi-mated by a normal function f sðrÞ:
f sðrÞ ¼εs
σ1ffiffiffiffiffiffi2π
p exp�−
ðrs − μ1Þ22σ21
�; ð1Þ
where the mean radius μ1 is 0.55, the standard devia-tion σ1 is 0.15, and εs is a fitting parameter. Radius rsis in the range of 0:5–1 μm. The size distribution dataof phosphor particles are approximated by a lognor-mal function f phosðrÞ:
f phosðrÞ ¼εphos
rphosσ2ffiffiffiffiffiffi2π
p exp�−
ðln rphos − ln μ2Þ22σ22
�; ð2Þ
where the mean radius μ2 is 2.3, the standard devia-tion σ2 is 0.3, and εphos is a fitting coefficient. Radiusrphos is in the range of 0:7–6 μm. Therefore, the sizedistribution function f ðrÞ of the phosphor is ex-pressed as
f ðrÞ ¼ f sðrÞ þ f phosðrÞ: ð3Þ
The cumulative function FðrÞ is an integration off ðrÞ:
FðrÞ ¼Z
f ðrÞdr: ð4Þ
FðrÞ is approximately 1 when r is integrated from 0.5to 6 μm. Therefore, the particle size distribution has agood description by these approximation functions. Itshould be noticed that the particle size distributiondata for nonspherical particles, such as the phosphor,can be varied by different measurement equipment,test methods, and material samples. Therefore, theapproximation functions here are not suitable forall cases.
Since our measurement platform used two colorLEDs as the light sources and the true optical con-stants of the phosphor cannot be directly determinedby themeasurement results using the many-flux the-ory, this study applies two steps to obtain precise op-tical constants of the phosphor. The first step is a Mietheoretical calculation that considers SiO2 and phos-phor particles as spheres and obtains the initial op-tical constants according to Mie theory. The secondstep is a Monte Carlo ray-tracing simulation, whichconstructs the optical model of the measurementplatform and approximates the simulation resultsto the measurement results by adjusting the opticalconstants based on the Mie theoretical results [27].
Fig. 4. (Color online) Emission and conversion properties of YAG:Ce phosphor.
Fig. 5. (Color online) Particle size distribution data and the fittedcurves of YAG:Ce phosphor. Inset is a SEM photograph of YAG:Cephosphor.
250 APPLIED OPTICS / Vol. 49, No. 2 / 10 January 2010

A. Mie Theoretical Calculation
According to Mie theory [27,29–35], the optical con-stants of the phosphor, which are the absorption coef-ficient μabsðλÞ, scattering coefficient μscaðλÞ, andanisotropy factor gðλÞ, can be calculated by
μabsðλÞ ¼Z
NðrÞCabsðλ; rÞdr; ð5Þ
μscaðλÞ ¼Z
NðrÞCscaðλ; rÞdr; ð6Þ
gðλÞ ¼ 2πZZ
1
−1pðθ; λ; rÞf ðrÞ cos θd cos θdr; ð7Þ
whereNðrÞ is the number density distribution of par-ticles (per cubic millimeter), Cabsðλ; rÞ and Cscaðλ; rÞare the absorption and scattering cross sections(per square millimeter), pðθ; λ; rÞ is the phase func-tion, λ is the wavelength of the incident light (nano-meters), and θ is the scattering angle.NðrÞ is composed of the SiO2 number densityNsðrÞ
and the phosphor particle number density NphosðrÞ.Theoretically, NðrÞ has the same curve as f ðrÞ, whichdescribes the number density distribution of the unitphosphor. Therefore, for one specific phosphor con-centration, NðrÞ can be calculated by multiplyingf ðrÞ with the number density coefficient KN :
NðrÞ ¼ NsðrÞ þNphosðrÞ ¼ KNf ðrÞ: ð8Þ
KN denotes the number of the unit phosphor for onephosphor concentration. To obtain KN , we shouldfirst know the mass distribution MðrÞ (milligrams)of the unit phosphor. MðrÞ can be expressed by
MðrÞ ¼ ρVðrÞf ðrÞ ¼ 43πr3½ρsf sðrÞ þ ρphosf phosðrÞ�; ð9Þ
where V is the volume of single particle, ρs is the den-sity of SiO2, and ρphos is the density of the YAG:Cecrystal. In this calculation, ρs and ρphos are 2.2 and4:6mg=mm3, respectively.Figure 6 is the calculated curve of MðrÞ. Integrat-
ing MðrÞ can obtain the total mass of the unit phos-phor. If the phosphor concentration c (milligrams percubic millimeter) of the mixture is known, KN can beobtained by
KN ¼ cRMðrÞdr : ð10Þ
According to Eq. (10), we find that KN has a linearrelationship with c. This means that NðrÞ is linearlyincreased with the increase of c. In Eqs. (5) and (6),theoretically, Cabsðλ; rÞ and Cscaðλ; rÞ are independent
of c. Therefore, as the expected behavior according tothe general Kubelka–Munk theory [28,36,37], μabsðλÞand μscaðλÞ should also have a linear relation-ship with c. This will be verified in the followingcalculations.
In Mie theory, Cabsðλ; rÞ and Cscaðλ; rÞ are normallycalculated by the following relations:
Csca ¼ 2πk2
X∞0
ð2nþ 1Þðjanj2 þ jbnj2Þ; ð11Þ
Cext ¼2πk2
X∞1
ð2nþ 1ÞReðan þ bnÞ; ð12Þ
Cabs ¼ Cext − Csca; ð13Þ
where Cext is the extinction cross section, k is thewavenumber (¼2π=λ), and an and bn are the expan-sion coefficients with even symmetry and odd sym-metry, respectively. an and bn are calculated by
an ¼ mψnðmxÞψn0ðxÞ − ψn
0ðmxÞψnðxÞmψnðmxÞξn0ðxÞ − ψn
0ðmxÞξnðxÞ; ð14Þ
bn ¼ ψnðmxÞψn0ðxÞ −mψn
0ðmxÞψnðxÞψnðmxÞξn0ðxÞ −mψn
0ðmxÞξnðxÞ; ð15Þ
where x is the size parameter (¼kr), m is the relativerefractive index of particles, and ψnðxÞ and ξnðxÞ arethe Riccati–Bessel functions.
In the mixture of phosphor and silicone, the refrac-tive index of embedded silicone (nsil) is 1.53, and therefractive index of SiO2 (ns) is 1.44. Silicone and SiO2both are considered to be transparent for the bluelight and the yellow light. The refractive index ofthe phosphor particle nphos has a complex form:
nphos ¼ n0phos − in00
phos; ð16Þ
Fig. 6. Mass distribution curve of unit YAG:Ce phosphor.
10 January 2010 / Vol. 49, No. 2 / APPLIED OPTICS 251
where n0phos and n00
phos are the real and imaginaryrefractive indices of the phosphor particle, respec-tively. Therefore, the relative refractive indices ofSiO2 (ms) and phosphor (mphos) in the silicone are
ms ¼ ns=nsil; mphos ¼ nphos=nsil: ð17Þ
The cross sections of SiO2 and phosphor particlesare separately calculated. Since there is no absorp-tion for the incident light by SiO2, Cext of SiO2 willbe equal to Csca, and Cabs will be zero. For phosphorparticles, n0
phos is obtained by the following equation:
n0 ¼ffiffiffiffiffiffiffiffiffiffiffiffiffiffiffiffiffiffiffiffiffiffiffiffiffiffiffiffiffiffiffiffiffiffiffiffiffiffiffiffiffiffiffiffiffiffiffiffiffiffiffiffiffiffiffiffiffiffiffiffiffiffiffiffiffiffiffiffiffiffiffiffiffiffiffiffiffiffiffiffiffiffiffiffiffiffiffiffiffiffiffiffiffiffiffiffiffiffiffiffiffiffiffiffiffiffiffiffiffiffiffiffiffiffiffiffiffiffiffiffiffiffiffiffiffiffiffiffiffiffiffiffiffiffiffi2:08745þ 1:2081λ2=ðλ2 − 0:02119Þ þ 17:2049λ2=ðλ2 − 1404:45Þ
q: ð18Þ
n00phos is obtained by
n00 ¼ α=2k; ð19Þ
where α is the absorption coefficient of the phosphorcrystal.Although the optical properties of YAG:Ce crystal
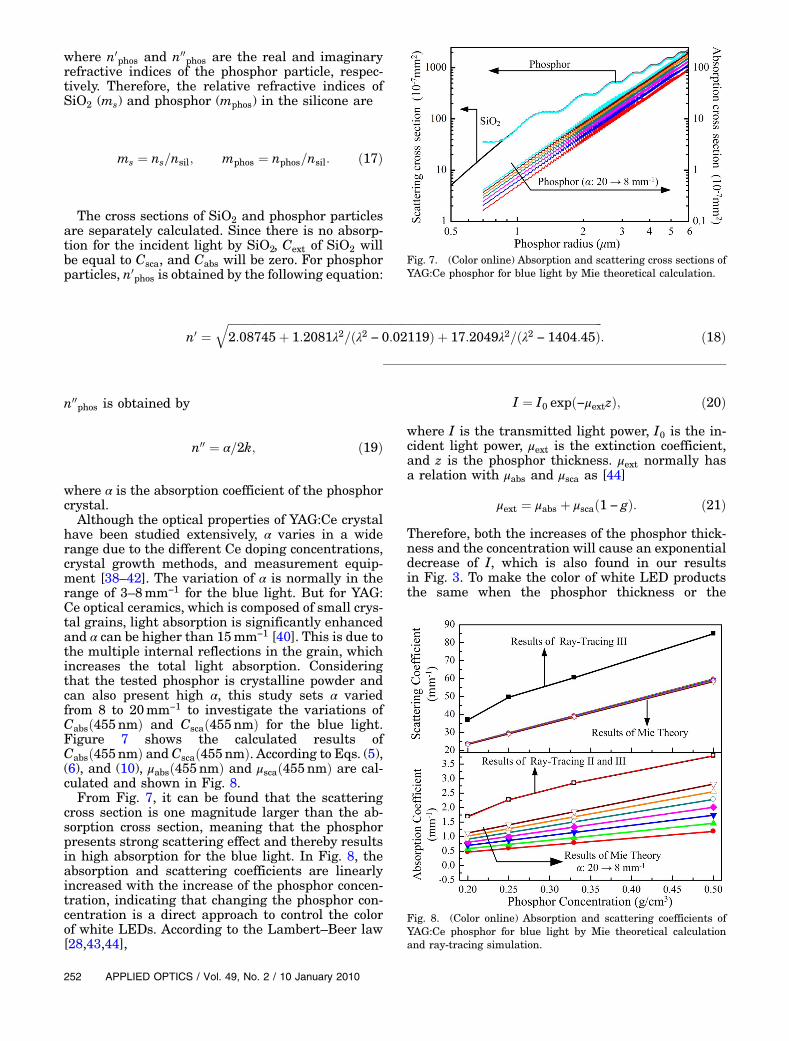
have been studied extensively, α varies in a widerange due to the different Ce doping concentrations,crystal growth methods, and measurement equip-ment [38–42]. The variation of α is normally in therange of 3–8mm−1 for the blue light. But for YAG:Ce optical ceramics, which is composed of small crys-tal grains, light absorption is significantly enhancedand α can be higher than 15mm−1 [40]. This is due tothe multiple internal reflections in the grain, whichincreases the total light absorption. Consideringthat the tested phosphor is crystalline powder andcan also present high α, this study sets α variedfrom 8 to 20mm−1 to investigate the variations ofCabsð455nmÞ and Cscað455nmÞ for the blue light.Figure 7 shows the calculated results ofCabsð455nmÞ and Cscað455nmÞ. According to Eqs. (5),(6), and (10), μabsð455nmÞ and μscað455nmÞ are cal-culated and shown in Fig. 8.From Fig. 7, it can be found that the scattering
cross section is one magnitude larger than the ab-sorption cross section, meaning that the phosphorpresents strong scattering effect and thereby resultsin high absorption for the blue light. In Fig. 8, theabsorption and scattering coefficients are linearlyincreased with the increase of the phosphor concen-tration, indicating that changing the phosphor con-centration is a direct approach to control the colorof white LEDs. According to the Lambert–Beer law[28,43,44],
I ¼ I0 expð−μextzÞ; ð20Þwhere I is the transmitted light power, I0 is the in-cident light power, μext is the extinction coefficient,and z is the phosphor thickness. μext normally hasa relation with μabs and μsca as [44]
μext ¼ μabs þ μscað1 − gÞ: ð21ÞTherefore, both the increases of the phosphor thick-ness and the concentration will cause an exponentialdecrease of I, which is also found in our resultsin Fig. 3. To make the color of white LED productsthe same when the phosphor thickness or the
Fig. 7. (Color online) Absorption and scattering cross sections ofYAG:Ce phosphor for blue light by Mie theoretical calculation.
Fig. 8. (Color online) Absorption and scattering coefficients ofYAG:Ce phosphor for blue light by Mie theoretical calculationand ray-tracing simulation.
252 APPLIED OPTICS / Vol. 49, No. 2 / 10 January 2010

concentration varies, the phosphor concentration orthe thickness should be oppositely changed to gener-ate the same I. This will be difficult for white LEDswith very high phosphor concentration, since thephosphor layer may be too thin and may be damagedduring the handling.For the yellow light, α is normally lower than
0:5mm−1 [38–42]. Like the calculations for the bluelight, Cabsð595nmÞ, Cscað595nmÞ, μabsð595nmÞ, andμscað595nmÞ are obtained by changing α from0:1–0:5mm−1. The theoretical results are shown inFigs. 9 and 10.In Figs. 9 and 10, Cabsð595nmÞ and μabsð595nmÞ
are almost 3 magnitudes smaller than Cscað595nmÞand μscað595nmÞ, meaning that the phosphor absorp-tion for the yellow light is very low and the strongscattering effect is the dominant factor affectingthe light output. Comparing Figs. 7 and 8 with Figs. 9and 10, it can be found that variations of CscaðλÞ andμscaðλÞ are very small when the incident light is chan-ged from the blue light to the yellow light. This indi-cates that the scattering properties of phosphor inthe whole visible light are similar and it is the var-iation of the absorption properties for different lightgenerating the differences of Figs. 3(a) and 3(b).The final optical constant that should be deter-
mined is gðλÞ, for which the phase function shouldbe first obtained. For small spheres, the phase func-tion pðθ; λ; rÞ can be calculated according to [30,32]
pðθ; λ; rÞ ¼ 4πβðθ; λ; rÞk2Cscaðλ; rÞ
; ð22Þ
where βðθ; λ; rÞ is the dimensionless scattering func-tion, which is obtained by the scattering amplitudefunctions S1ðθÞ and S2ðθÞ:
βðθÞ ¼ ð1=2Þ½jS1ðθÞj2 þ jS2ðθÞj2�; ð23Þ
S1ðθÞ ¼X∞n¼1
2nþ 1nðnþ 1Þ
�an
P1nðcos θÞsin θ þ bn
dP1nðcos θÞdθ
�;
ð24Þ
S2ðθÞ ¼X∞n¼1
2nþ 1nðnþ 1Þ
�bn
P1nðcos θÞsin θ þ an
dP1nðcos θÞdθ
�;
ð25Þ
where P1nðcos θÞ is the associated Legendre
polynomial.According to Eq. (7), the theoretical results of gðλÞ
are calculated and shown in Fig. 11. Results showthat the variation of α has slight impact on g, andthe increase of gðλÞ by α is so small that the increasecan be neglected. Therefore, the theoretically reason-able values of gð455nmÞ and gð595nmÞ are around0.90 and 0.89, respectively. A point that should benoticed is that gð595nmÞ is a little lower thangð455nmÞ. Generally, the anisotropy factor of parti-cles for a long wavelength should be larger than thatfor a short wavelength. It means that the particlesshould present stronger a scattering effect for a shortwavelength. This theoretical result will be modifiedin the following ray-tracing simulation.
B. Ray-Tracing Simulation
In the optical model of the measurement platform,the blue light or the yellow light is emitted fromthe top surface of the chip with a Lambertian radia-tion pattern. The material of the lenses is BK7 fromSchott. The inner surfaces of the two integratingspheres are coated with a diffuse white material hav-ing optical properties of 11.1% absorption and 89.9%scattering. The support glass of the phosphor slide isalso BK7 glass. The inner surfaces of the integratingspheres are used as the receivers to collect the trans-mitted and reflected light.
The Monte Carlo method is applied for the ray tra-cing of the optical model. Phosphor is considered to
Fig. 9. (Color online) Absorption and scattering cross sections ofYAG:Ce phosphor for yellow light by Mie theoretical calculation.
Fig. 10. (Color online) Absorption and scattering coefficients ofYAG:Ce phosphor for yellow light by Mie theoretical calculationand ray-tracing simulation.
10 January 2010 / Vol. 49, No. 2 / APPLIED OPTICS 253

be a Mie scattering material. Since the ray tracingcannot directly compute the scattering directionsof the light in the phosphor, the Henyey–Greensteinfunction is used as an approximation of the genera-tion of the angular scattering. This function is [29,30]
pðθÞ ¼ 1 − g2
4πð1 − 2g cos θ þ g2Þ3=2 ; ð26Þ
where g is obtained from the results of Fig. 11.We first applied the Mie theoretical results with no
change in the optical model. However, the ray-tracing results showed that the transmittance wassignificantly higher than that of the measurementresults and the absorption for the blue light was low-er than that of the measurement results. Three rea-sons result in these differences. They are the lowerμabsðλÞ, lower μscaðλÞ, and higher gðλÞ, when compar-ing with the true values. Therefore, three methodol-ogies were adopted in the following simulations toobtain more precise optical constants. The methodol-ogies were keeping one of three constants unchangedin sequence and at the same time adjusting the othertwo constants to approximate the measurementresults. We denoted the three methodologies asray-tracing I, II, and III.In ray-tracing I, μabsðλÞ was unchanged. According
to Eqs. (20) and (21), changing μscaðλÞ and gðλÞ canmake the transmitted light approximate the mea-surement results. We found that increasing μscaðλÞor lowering gðλÞ can realize similar transmittanceas the measurement results, but the reflectance is al-ways larger than that of the measurement results. Ifthe reflectance has a good match with that of mea-surement results, the transmittance will be larger.The errors between the ray-tracing results and the
measurement results can be larger than 10% in somethicknesses and concentrations of the phosphor. Thismeans that μabsðλÞ of Mie results is smaller than theactual value and cannot generate enough phosphorabsorption for the incident light.
In ray-tracing II, μabsðλÞ and gðλÞ were changed.Since the variations of μscaðλÞ of Mie results by αare small, the ray-tracing simulation chose the aver-age value as the initial μscaðλÞ. By adjusting μabsðλÞand gðλÞ, the optical approximation can reduce theerrors between the ray-tracing results and the mea-surement results to be smaller than 5% for all phos-phor thicknesses and concentrations. The modifiedμabsðλÞ and gðλÞ are shown in Figs. 8, 10, and 12. FromFig. 8, it can be seen that the change of μabsð455nmÞof the ray-tracing results shows a similar tendency asthat of the Mie theoretical results with α ¼ 20mm−1.For the yellow light, the tendency of μabsð595nmÞ ofthe ray-tracing results cannot present a good matchwith that of the Mie results. This may be because thephosphor absorption for the yellow light is verylow and the strong scattering effect weakens the dif-ferences of the phosphor absorption in different phos-phor concentrations. This causes the slight changesof μabsð595nmÞ of the ray-tracing results, as shown inFig. 10. Comparing with Fig. 8, we believed thata reasonable value of α for the yellow light is inthe range of 0:2–0:4mm−1. Figure 12 gives gðλÞ ofthe ray-tracing results, which is lower than that ofthe Mie theoretical results. Unlike the Mie results,it can be found that gð595nmÞ is higher thangð455nmÞ in the ray-tracing results. This is morereasonable for the actual light scattering.
In Fig. 12, there is a sudden decrease of gðλÞ at theconcentration of 0:25 g=cm3. μabsðλÞ also shows asmall decrease at the concentration of 0:20 g=cm3
in Figs. 8 and 10. This may be caused by the test er-rors and local inhomogeneity of the phosphor powderin the samples. When the phosphor concentration de-creases, the local inhomogeneity hasmore significanteffects on the light scattering and causes variationsof gðλÞ and μabsðλÞ similar to the ray-tracing results.
In ray-tracing III, gðλÞ was unchanged. The ray-tracing simulation set gð455nmÞ and gð595nmÞ to be0.9 and 0.89, respectively. By controlling the errorsbetween the ray-tracing results and the measure-ment results to be smaller than 5%, the modifiedμabsðλÞ and μscaðλÞ are shown in Figs. 8 and 10. Itcan be found that μscaðλÞ of the ray-tracing results
Fig. 11. (Color online) Anisotropy factors of YAG:Ce phosphor for(a) single particle scattering and (b) volume scattering by Mietheoretical calculation. Solid curves in (a) are the results for bluelight and dashed curves are the results for yellow light.
Fig. 12. Ray-tracing results of anisotropy factor of YAG:Ce phos-phor by ray-tracing simulation.
254 APPLIED OPTICS / Vol. 49, No. 2 / 10 January 2010
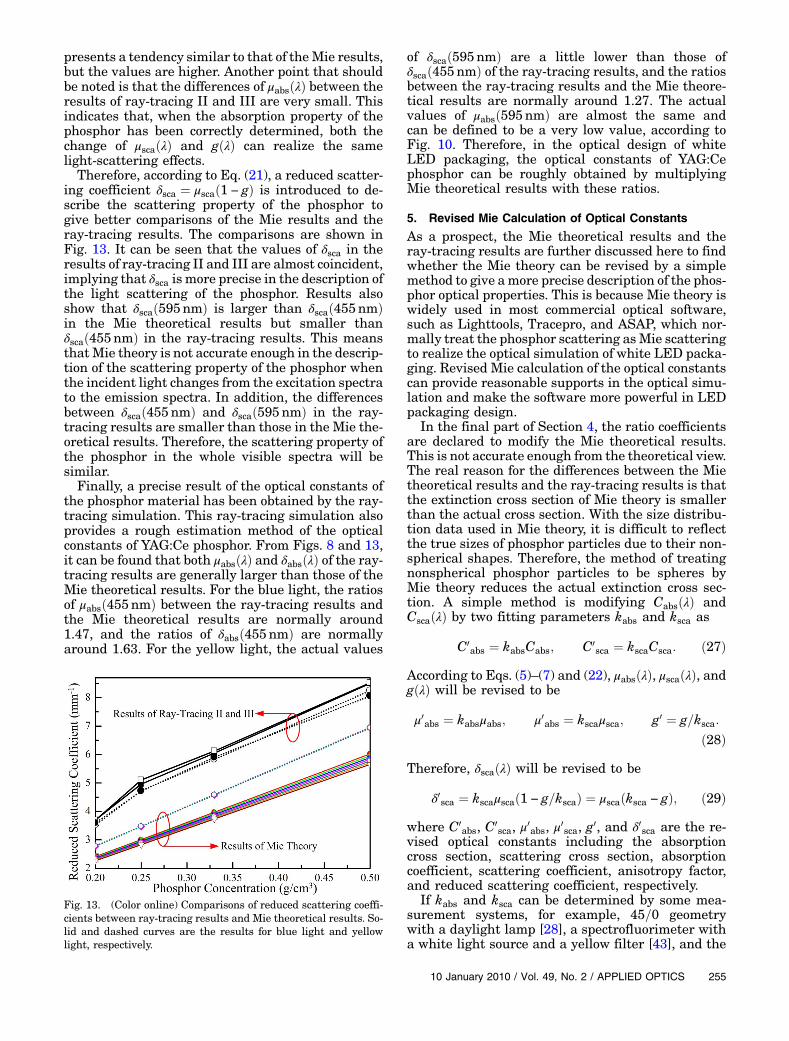
presents a tendency similar to that of theMie results,but the values are higher. Another point that shouldbe noted is that the differences of μabsðλÞ between theresults of ray-tracing II and III are very small. Thisindicates that, when the absorption property of thephosphor has been correctly determined, both thechange of μscaðλÞ and gðλÞ can realize the samelight-scattering effects.Therefore, according to Eq. (21), a reduced scatter-
ing coefficient δsca ¼ μscað1 − gÞ is introduced to de-scribe the scattering property of the phosphor togive better comparisons of the Mie results and theray-tracing results. The comparisons are shown inFig. 13. It can be seen that the values of δsca in theresults of ray-tracing II and III are almost coincident,implying that δsca is more precise in the description ofthe light scattering of the phosphor. Results alsoshow that δscað595nmÞ is larger than δscað455nmÞin the Mie theoretical results but smaller thanδscað455nmÞ in the ray-tracing results. This meansthatMie theory is not accurate enough in the descrip-tion of the scattering property of the phosphor whenthe incident light changes from the excitation spectrato the emission spectra. In addition, the differencesbetween δscað455nmÞ and δscað595nmÞ in the ray-tracing results are smaller than those in the Mie the-oretical results. Therefore, the scattering property ofthe phosphor in the whole visible spectra will besimilar.Finally, a precise result of the optical constants of
the phosphor material has been obtained by the ray-tracing simulation. This ray-tracing simulation alsoprovides a rough estimation method of the opticalconstants of YAG:Ce phosphor. From Figs. 8 and 13,it can be found that both μabsðλÞ and δabsðλÞ of the ray-tracing results are generally larger than those of theMie theoretical results. For the blue light, the ratiosof μabsð455nmÞ between the ray-tracing results andthe Mie theoretical results are normally around1.47, and the ratios of δabsð455nmÞ are normallyaround 1.63. For the yellow light, the actual values
of δscað595nmÞ are a little lower than those ofδscað455nmÞ of the ray-tracing results, and the ratiosbetween the ray-tracing results and the Mie theore-tical results are normally around 1.27. The actualvalues of μabsð595nmÞ are almost the same andcan be defined to be a very low value, according toFig. 10. Therefore, in the optical design of whiteLED packaging, the optical constants of YAG:Cephosphor can be roughly obtained by multiplyingMie theoretical results with these ratios.
5. Revised Mie Calculation of Optical Constants
As a prospect, the Mie theoretical results and theray-tracing results are further discussed here to findwhether the Mie theory can be revised by a simplemethod to give amore precise description of the phos-phor optical properties. This is because Mie theory iswidely used in most commercial optical software,such as Lighttools, Tracepro, and ASAP, which nor-mally treat the phosphor scattering asMie scatteringto realize the optical simulation of white LED packa-ging. Revised Mie calculation of the optical constantscan provide reasonable supports in the optical simu-lation and make the software more powerful in LEDpackaging design.
In the final part of Section 4, the ratio coefficientsare declared to modify the Mie theoretical results.This is not accurate enough from the theoretical view.The real reason for the differences between the Mietheoretical results and the ray-tracing results is thatthe extinction cross section of Mie theory is smallerthan the actual cross section. With the size distribu-tion data used in Mie theory, it is difficult to reflectthe true sizes of phosphor particles due to their non-spherical shapes. Therefore, the method of treatingnonspherical phosphor particles to be spheres byMie theory reduces the actual extinction cross sec-tion. A simple method is modifying CabsðλÞ andCscaðλÞ by two fitting parameters kabs and ksca as
C0abs ¼ kabsCabs; C0
sca ¼ kscaCsca: ð27ÞAccording to Eqs. (5)–(7) and (22), μabsðλÞ, μscaðλÞ, andgðλÞ will be revised to be
μ0abs ¼ kabsμabs; μ0abs ¼ kscaμsca; g0 ¼ g=ksca:
ð28ÞTherefore, δscaðλÞ will be revised to be
δ0sca ¼ kscaμscað1 − g=kscaÞ ¼ μscaðksca − gÞ; ð29Þwhere C0
abs, C0sca, μ0abs, μ0sca, g0, and δ0sca are the re-
vised optical constants including the absorptioncross section, scattering cross section, absorptioncoefficient, scattering coefficient, anisotropy factor,and reduced scattering coefficient, respectively.
If kabs and ksca can be determined by some mea-surement systems, for example, 45=0 geometrywith a daylight lamp [28], a spectrofluorimeter witha white light source and a yellow filter [43], and the
Fig. 13. (Color online) Comparisons of reduced scattering coeffi-cients between ray-tracing results and Mie theoretical results. So-lid and dashed curves are the results for blue light and yellowlight, respectively.
10 January 2010 / Vol. 49, No. 2 / APPLIED OPTICS 255

double-integrating-sphere system here, the revisedMie calculation will give a precise prediction of thephosphor optical properties. In our experiments, kabsfor the blue light is around 1.47. ksca for the blue lightand yellow light are around 1.06 and 1.03, respec-tively. Therefore, Mie theory has a good descriptionof the phosphor scattering but has difficulty in thedescription of the phosphor absorption.This revised Mie calculation method also makes
the optical constants of YAG:Ce phosphor more sim-ply obtained by studying white LEDs with differentphosphor concentrations. Kang et al. [24] first theo-retically studied the optical model of white LEDs byLambert-Beer law and gave the optical constants ofthe phosphor by their white LED samples. Thetheoretical method developed by Kang et al. [24] iseffective but not precise enough, since the multiplereflection discussed in Section 2 was not seriouslyconsidered in their studies. This causes the opticalconstants to be larger than the actual values. Com-bining the revised Mie calculation with their methodcan reduce the calculation errors. Finally, the ray-tracing simulation should also be applied to examinethe optical model of white LED to determine thecorrection of kabs and ksca.
6. Conclusion
A measurement of the optical properties of YAG:Cephosphor was conducted by the double-integrating-sphere system. The measurement results revealedthe factors affecting the optical performance of whiteLEDs by the phosphor. Generally, the strong scatter-ing for the yellow light and the isotropic emissionpattern are the main factors and have promptedgreat efforts to eliminate their adverse effects. Be-cause the light sources in our measurement platformwere two color LEDs, rather than monochromaticlight, both Mie theoretical calculation and MonteCarlo ray-tracing simulation were used to obtain pre-cise optical constants of the phosphor, including theabsorption coefficient, scattering coefficient, and an-isotropy factor. Numerical results showed that Mietheory is effective in the prediction of the tendenciesof the optical constants as the phosphor concen-tration changes. However, the method of treatingnonspherical phosphor particles to be spheres causesthe absorption and scattering cross sections to besmaller than the actual cross sections. Revisions ofthe absorption and scattering cross sections withtwo fitting parameters can improve the accuracy ofMie theoretical results and make the Mie theory sui-table for the optical design of LED packaging. Thefitting parameters can be obtained by a measure-ment of the optical properties of phosphor films ora numerical analysis of white LEDs with variousphosphor concentrations. This study only obtainsthe fitting parameters for the two color LEDs. Fromthe view of a complete and correct measurement, thelight source should use a daylight source that issampled by a monochromator to generate monochro-
matic light covering the visible spectra range [28,43],and this will be our future work.
This work was supported by the Nature ScienceFoundation of China (NSFC) Key Project undergrant 50835005, NSFC Project under grant50876038, and High Technology Project of the Min-istry of Science and Technology under grant2008AA03A184. The authors would also like tothank the Science and Technology Department ofGuangdong Province and Guangdong Real FaithEnterprises Group Co. Ltd. for their support.
References1. E. F. Schubert and J. K. Kim, “Solid-state light source getting
smart,” Science 308, 1274–1278 (2005).2. J. K. Kim and E. F. Schubert, “Transcending the replacement
paradigm of solid-state lighting,” Opt. Express 16, 21835–21842 (2008).
3. D. A. Steigerwald, J. C. Bhat, D. Collins, R. M. Fletcher,M. O. Holcomb, M. J. Ludowise, P. S. Martin, and S. L. Rudaz,“Illumination with solid state lighting technology,” IEEE J.Sel. Top. Quantum Electron. 8, 310–320 (2002).
4. M. R. Krames, O. B. Shchekin, R. Mueller-Mach, G. O.Mueller,L. Zhou, G. Harbers, and M. G. Craford, “Status and futureof high-power light-emitting diodes for solid-state lighting,”J. Display Technol. 3, 160–175 (2007).
5. P. Schlotter, R. Schmidt, and J. Schneider, “Luminescenceconversion of blue light emitting diodes,” Appl. Phys. A 64,417–418 (1997).
6. K. Sakuma, K. Omichi, N. Kimura, M. Ohashi, D. Tanaka,N. Hirosaki, Y. Yamamoto, R.-J. Xie, and T. Suehiro,“Warm-white light-emitting diode with yellowish orangeSiAlON ceramic phosphor,” Opt. Lett. 29, 2001–2003 (2004).
7. H.Wu, X. Zhang, C. Guo, J. Xu, M.Wu, andQ. Su, “Three-bandwhite light from InGaN-based blue LED chip precoated withgreen/red phosphors,” IEEE Photonics Technol. Lett. 17,1160–1162 (2005).
8. S. Nakamura, S. Pearton, and G. Fasol, The Blue Laser Diode:GaN Based Light Emitters and Lasers, 2nd ed. (Springer,1997), pp. 215–230.
9. R. Mueller-Mach, G. O. Mueller, M. R. Krames, and T. Trottier,“High-power phosphor-converted light-emitting diodes basedon III-nitrides,” IEEE J. Sel. Top. Quantum Electron. 8, 339–345 (2002).
10. R. Mueller-Mach, G. Mueller, M. R. Krames, H. A. Hoppe, F.Stadler, W. Schnick, T. Juestel, and P. Schmidt, “Highly effi-cient all-nitride phosphor-converted white light emittingdiode,” Phys. Status Solidi 202, 1727–1732 (2005).
11. R. J. Xie, N. Hirosaki, K. Sakuma, and N. Kimura, “Whitelight-emitting diodes (LEDs) using (oxy)nitride phosphors,”J. Phys. D 41, 144013 (2008).
12. M. Zachau, D. Becker, D. Berben, T. Fiedler, F. Jermann, and F.Zwaschka, “Phosphors for solid state lighting,” Proc. SPIE6910, 691010 (2008).
13. Z. Liu, S. Liu, K. Wang, and X. Luo, “Status and prospect forphosphor-based white light-emitting diodes packaging,”Front. Optoelectron. China 2, 119–140 (2009).
14. H. Luo, J. K. Kim, E. F. Schubert, J. Cho, C. Sone, and Y. Park,“Analysis of high-power packages for phosphor-based white-light-emitting diodes,” Appl. Phys. Lett. 86, 243505 (2005).
15. S. C. Allen and A. J. Steckl, “ELiXIR-solid-state luminairewith enhanced light extraction by internal reflection,”J. Display Technol. 3, 155–159 (2007).
16. S. C. Allen and A. J. Steckl, “A nearly ideal phosphor-converted white light-emitting diode,” Appl. Phys. Lett. 92,143309 (2008).
256 APPLIED OPTICS / Vol. 49, No. 2 / 10 January 2010
17. Z. Y. Liu, S. Liu, K. Wang, and X. B. Luo, “Optical analysis ofphosphor’s location for high-power light-emitting diodes,”IEEE Trans. Device Mater. Reliab. 9, 65–73 (2009).
18. N. Narendran, F. Gu, J. P. Freyssinier-Nova, and Y. Zhu, “Ex-tracting phosphor-scattered photons to improve white LED ef-ficiency,” Phys. Status Solidi 202, R60–R62 (2005).
19. N. T. Tran and F. G. Shi, “Studies of phosphor concentrationand thickness for phosphor-based white light-emitting-diodes,” J. Lightwave Technol. 26, 3556–3559 (2008).
20. L. Wang, P. F. Gu, and S. Z. Jin, “Enhancement of flip-chipwhite light-emitting diodes with a one-dimensional photoniccrystal,” Opt. Lett. 34, 301–303 (2009).
21. C. Sommer, F. P. Wenzl, P. Hartmann, P. Pachler, M. Schweigh-art, and G. Leising, “Tailoring of the color conversion elementsin phosphor-converted high-power LEDs by optical simula-tions,” IEEE Photon. Technol. Lett. 20, 739–741 (2008).
22. Z. Y. Liu, S. Liu, K. Wang, and X. B. Luo, “Optical analysis ofcolor distribution in white LEDs with various packagingmethods,” IEEE Photon. Technol. Lett. 20, 2027–2029(2008).
23. Y. Zhu, N. Narendran, and Y. Gu, “Investigation of the opticalproperties of YAG:Ce phosphor,” Proc. SPIE 6337, 63370S(2006).
24. D.-Y. Kang, E. Wu, and D.-M. Wang, “Modeling white light-emitting diodes with phosphor layers,” Appl. Phys. Lett. 89,231102 (2006).
25. J. W. Pickering, S. A. Prahl, N. v. Wieringen, J. F. Beek, H. J. C.M. Sterenborg, and M. J. C. van Gemert, “Double-integrating-sphere system for measuring the optical properties of tissue,”Appl. Opt. 32, 399–410 (1993).
26. A. N. Yaroslavsky, I. V. Yaroslavsky, T. Goldbach, and H. J.Schwarzmaier, “Influence of the scattering phase function ap-proximation on the optical properties of blood determinedfrom the integrating sphere measurements,” J Biomed. Opt.4, 47–53 (1999).
27. M. I. Mishchenko, J. W. Hovenier, and L. D. Travis, Light Scat-tering by Nonspherical Particles: Theory, Measurements, andApplications (Academic, 2000).
28. H. G. Volz, Industrial Color Testing: Fundamentals and Tech-niques (Wiley-VCH, 2001).
29. C. F. Bohren and D. R. Huffman, Absorption and Scattering ofLight by Small Particles (Wiley, 1983), pp. 57–129.
30. M. Jonasz and G. R. Fournier, Light Scattering by Particles inWater (Elsevier, 2007), pp. 87–130.
31. A. R. Jones, “Light scattering for particle characterization,”Prog. Energy Combust. Sci. 25, 1–53 (1999).
32. M. I. Mishchenko, L. D. Travis, and A. A. Lacis, Scattering,Absorption, and Emission of Light by Small Particles(Cambridge U. Press, 2004).
33. M. I. Mishchenko, L. D. Travis, R. A. Kahn, and R. A. West,“Modeling phase functions for dustlike tropospheric aerosolsusing a shape mixture of randomly oriented polydispersespheroids,” J. Geophys. Res. 102, 16831–16847 (1997).
34. M. I. Mishchenko, J. W. Hovenier, and D. W. Mackowski,“Singe scattering by a small volume element,” J. Opt. Soc.Am. A 21, 71–87 (2004).
35. M. I. Mishchenko, L. D. Travis, and A. Macke, “Scattering oflight by polydisperse, randomly oriented, finite circular cylin-ders,” Appl. Opt. 35, 4927–4940 (1996).
36. D. M. Hembree and H. R. Smyrl, “Anomalous dispersion ef-fects in diffuse reflectance infrared Fourier transform spec-troscopy: a study of optical geometries,” Appl. Spectrosc. 43,267–274 (1989).
37. M. K. Gunde and Z. C. Orel, “Absorption and scattering of lightby pigment particles in solar-absorbing paints,” Appl. Opt. 39,622–628 (2000).
38. S. M. Kaczmarek, G. Domianiak-Dzik, W. Ryba-Romanowski,J. Kisielewski, and J. Wojtkowska, “Changes in optical proper-ties of Ce:YAG crystals under annealing and irradiation pro-cessing,” Cryst. Res. Technol. 34, 1031–1036 (1999).
39. M. Kucera, P. Hasa, and J. Hakenov, “Optical and magneto-optical properties of Ce: YAG,” J. Alloys Compd. 451, 146–148 (2008).
40. E. Mihokova, M. Nikl, J. A. Mares, A. Beitlerov, A. Vedda,K. Nejezchleb, K. Blazek, and C. D'Ambrosio, “Luminescenceand scintillation properties of YAG:Ce single crystal and op-tical ceramics,” J. Lumin. 126, 77–80 (2007).
41. G. J. Zhao, X. H. Zeng, J. Xu, S. M. Zhou, and Y. Z. Zhou, “Tem-perature gradient technique (TGT) growth and characteriza-tions of large-sized Ce-doped YAG scintillation crystal,” Phys.Status Solidi A 199, 355–359 (2003).
42. J. A. Mares, A. Beitlerova, M. Nikl, N. Solovieva, K. Nitsch, M.Kucera, M. Kubova, V. Gorbenko, and Y. Zorenko, “Scintilla-tion and optical properties of YAG:Ce films grown by liquidphase epitaxy,” Radiat. Meas. 42, 533–536 (2007).
43. G. Sharma, Digital Color Imaging Handbook (CRC, 2003).44. A. Ishimaru, Wave Propagation and Scattering in Random
Media (Academic, 1999).
10 January 2010 / Vol. 49, No. 2 / APPLIED OPTICS 257