measurement for implementation and sustaining improvement · measurement for . implementation and...
TRANSCRIPT

Measurement for implementation and sustaining
improvement
Prem Kumar Quality Improvement Advisor
Health Quality & Safety Commission
Type of variation • Common causes/Random variation
Causes that are inherent in the process (or system) over time, affect everyone working in the process, and affect all outcomes of the process. Also known as random or unassignable variation.
• Special causes/Non-random variation Causes that are not part of the process (or system) all the time, or do not affect everyone, but arise because of specific circumstances. Also known as non-random or assignable variation.
What is a run chart?
A run chart is a graphical display of data plotted in some type of order. Run charts: • contain at least 10 data points • must have a median • tell the story through careful use of annotation.
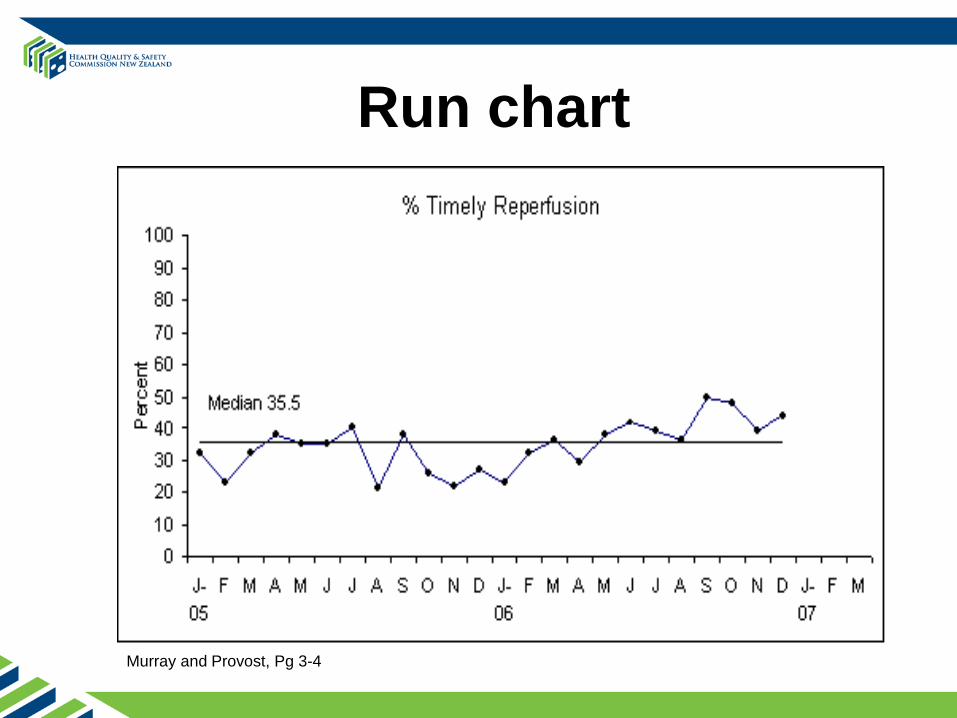
Run chart
Murray and Provost, Pg 3-4
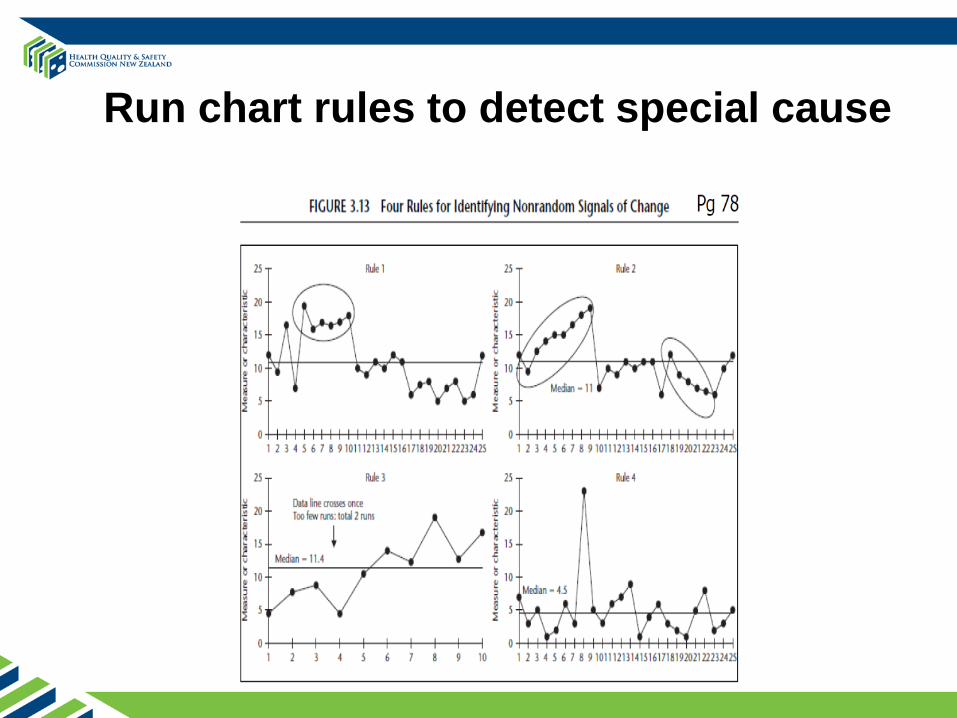
Run chart rules to detect special cause
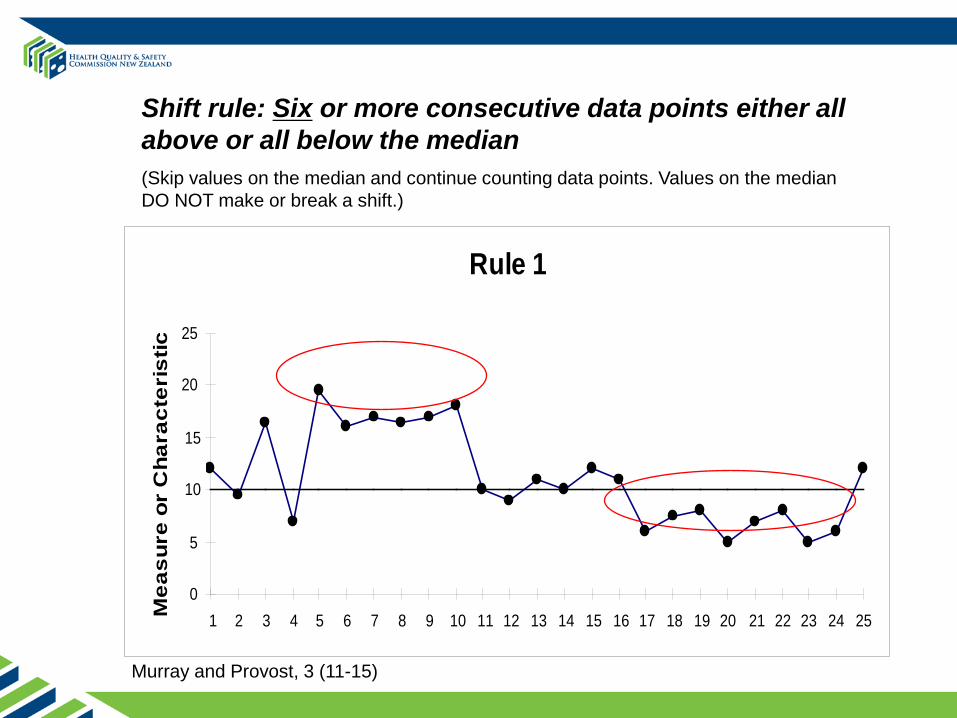
Shift rule: Six or more consecutive data points either all above or all below the median (Skip values on the median and continue counting data points. Values on the median DO NOT make or break a shift.)
Rule 1
0
5
10
15
20
25
1 2 3 4 5 6 7 8 9 10 11 12 13 14 15 16 17 18 19 20 21 22 23 24 25Mea
sure
or
Cha
ract
eris
tic
Murray and Provost, 3 (11-15)
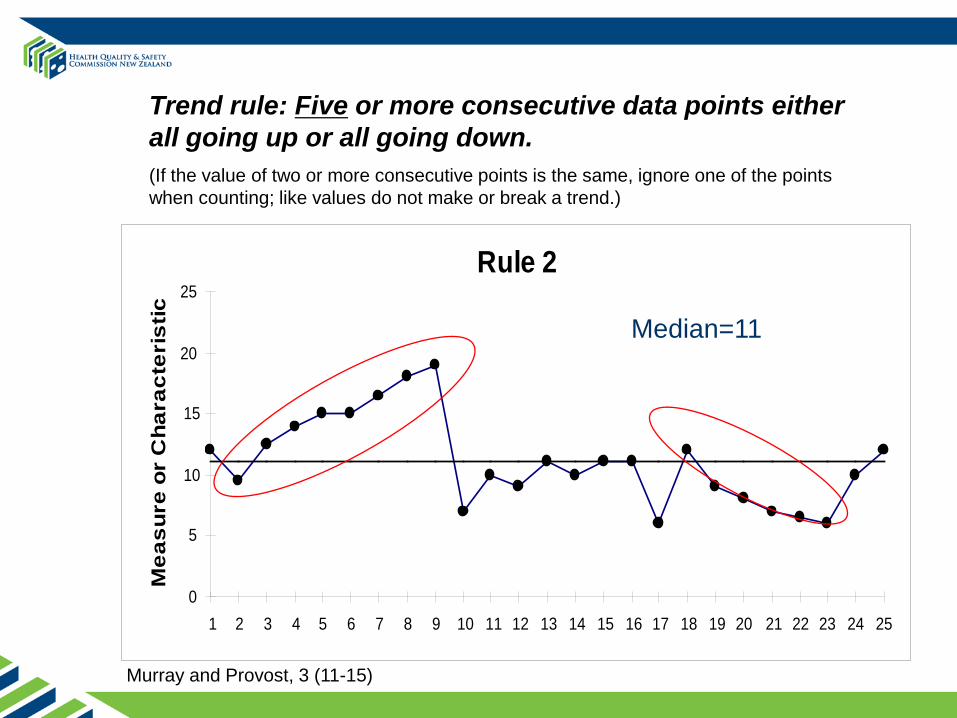
Trend rule: Five or more consecutive data points either all going up or all going down. (If the value of two or more consecutive points is the same, ignore one of the points when counting; like values do not make or break a trend.)
Murray and Provost, 3 (11-15)
Rule 2
0
5
10
15
20
25
1 2 3 4 5 6 7 8 9 10 11 12 13 14 15 16 17 18 19 20 21 22 23 24 25
Mea
sure
or
Cha
ract
eris
tic Median=11
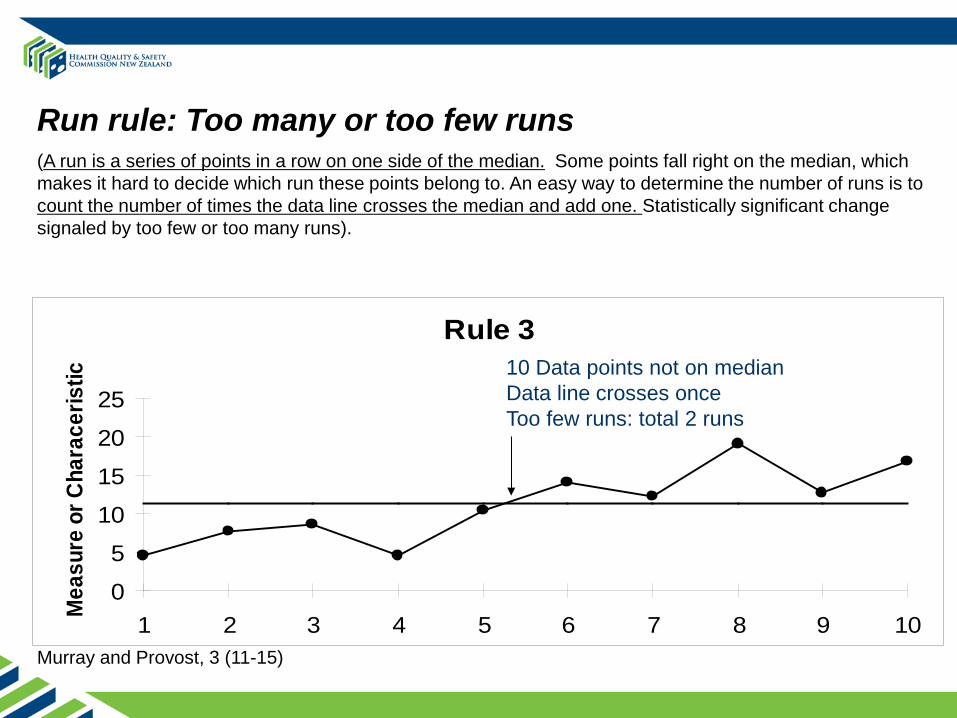
Run rule: Too many or too few runs (A run is a series of points in a row on one side of the median. Some points fall right on the median, which makes it hard to decide which run these points belong to. An easy way to determine the number of runs is to count the number of times the data line crosses the median and add one. Statistically significant change signaled by too few or too many runs).
Murray and Provost, 3 (11-15)
Rule 3
0
5
10
15
20
25
1 2 3 4 5 6 7 8 9 10
Mea
sure
or C
hara
ceris
tic
Median 11.4
10 Data points not on median Data line crosses once Too few runs: total 2 runs
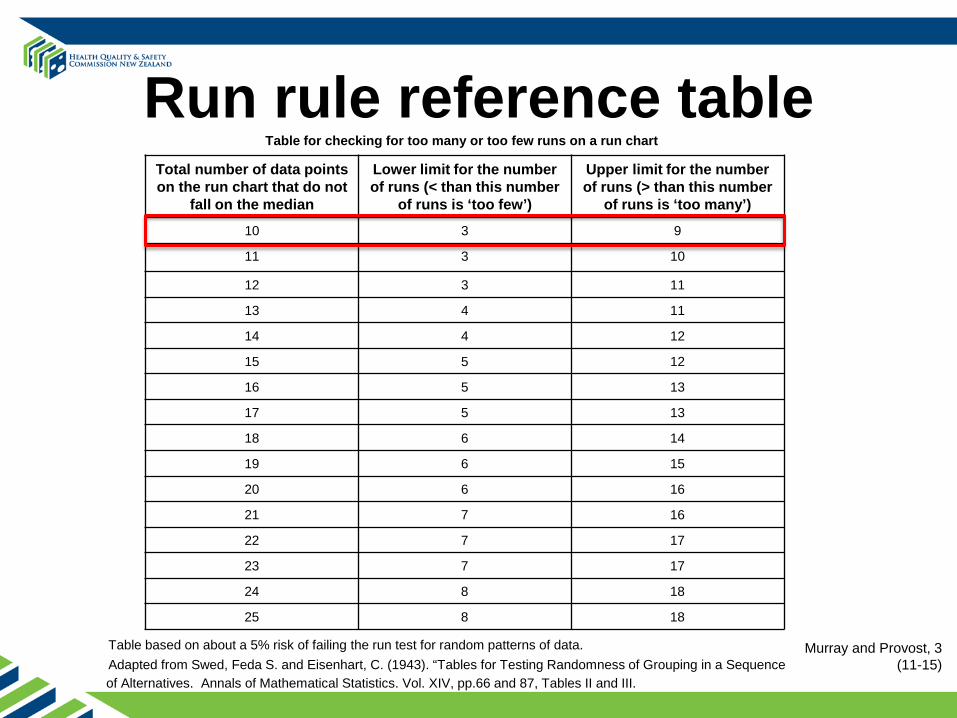
Run rule reference table Total number of data points on the run chart that do not
fall on the median
Lower limit for the number of runs (< than this number
of runs is ‘too few’)
Upper limit for the number of runs (> than this number
of runs is ‘too many’)
10 3 9
11 3 10
12 3 11
13 4 11
14 4 12
15 5 12
16 5 13
17 5 13
18 6 14
19 6 15
20 6 16
21 7 16
22 7 17
23 7 17
24 8 18
25 8 18
Table for checking for too many or too few runs on a run chart
Table based on about a 5% risk of failing the run test for random patterns of data. Adapted from Swed, Feda S. and Eisenhart, C. (1943). “Tables for Testing Randomness of Grouping in a Sequence of Alternatives. Annals of Mathematical Statistics. Vol. XIV, pp.66 and 87, Tables II and III.
Murray and Provost, 3 (11-15)
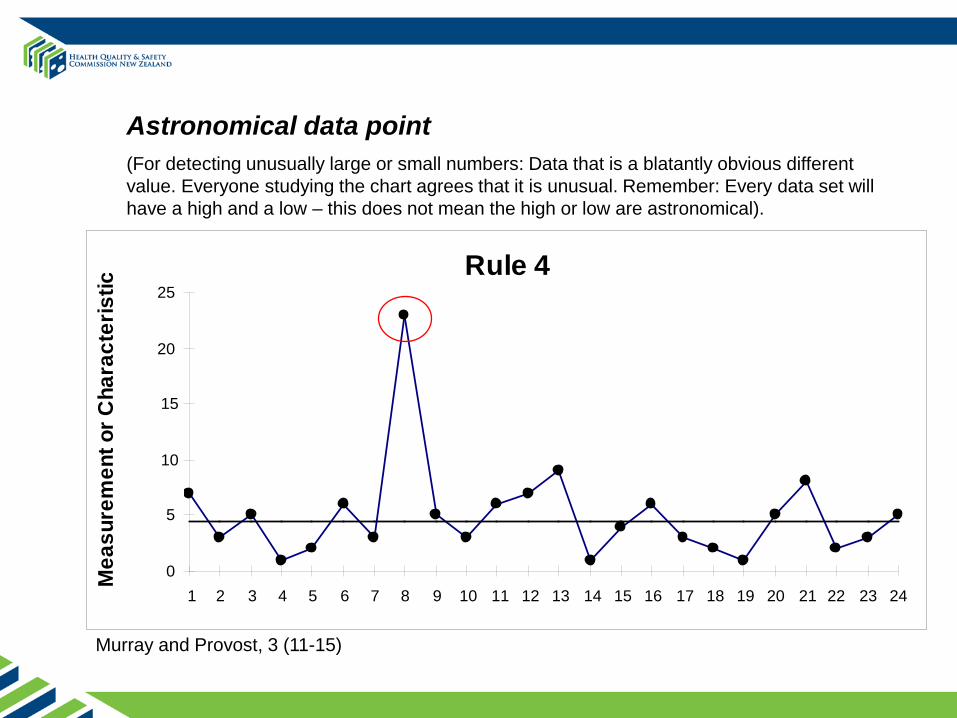
Astronomical data point (For detecting unusually large or small numbers: Data that is a blatantly obvious different value. Everyone studying the chart agrees that it is unusual. Remember: Every data set will have a high and a low – this does not mean the high or low are astronomical).
Murray and Provost, 3 (11-15)
Rule 4
0
5
10
15
20
25
1 2 3 4 5 6 7 8 9 10 11 12 13 14 15 16 17 18 19 20 21 22 23 24
Mea
sure
men
t or C
hara
cter
istic
• The control chart is a graph used to study how a process changes over time.
• A statistical tool used to distinguish between variation in a measure due to common causes and variation due to special causes.
Shewhart chart/Control chart
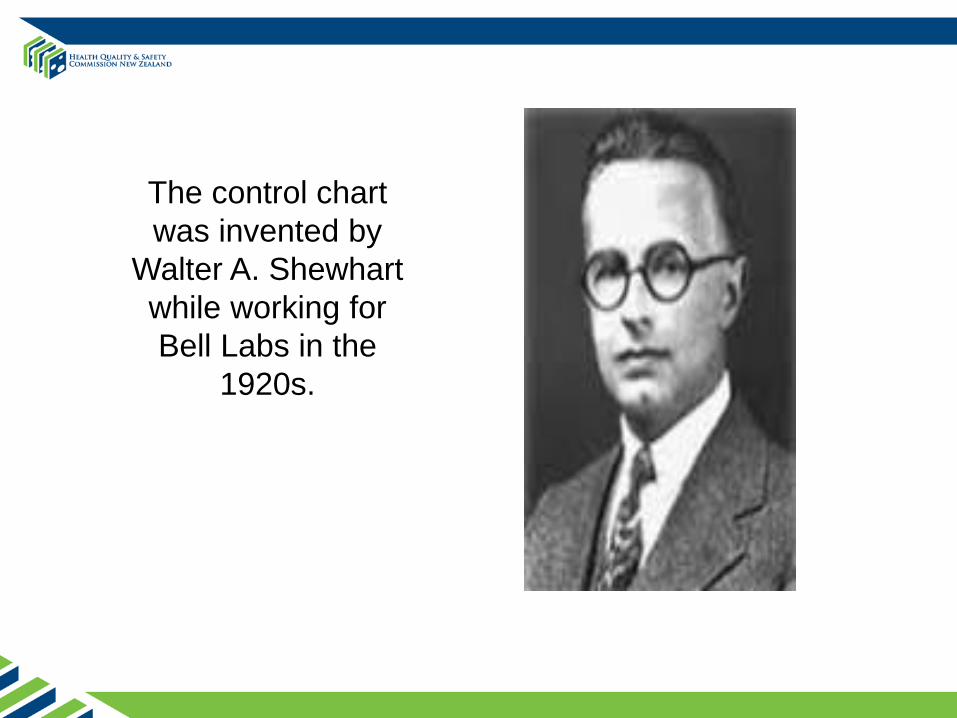
The control chart was invented by
Walter A. Shewhart while working for Bell Labs in the
1920s.
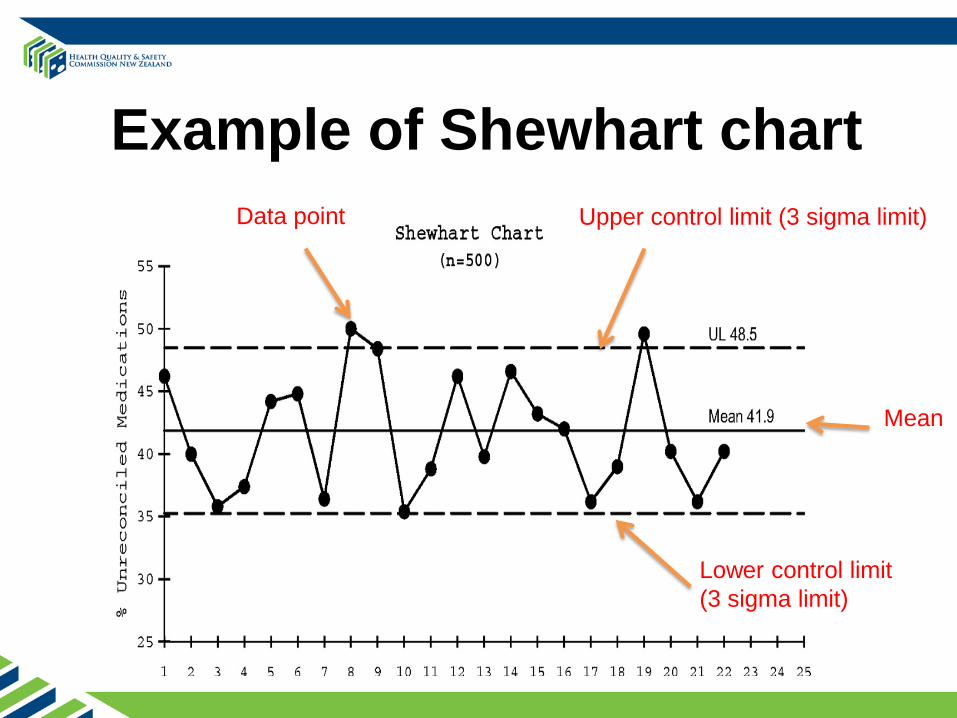
Example of Shewhart chart Upper control limit (3 sigma limit)
Lower control limit (3 sigma limit)
Mean
Data point
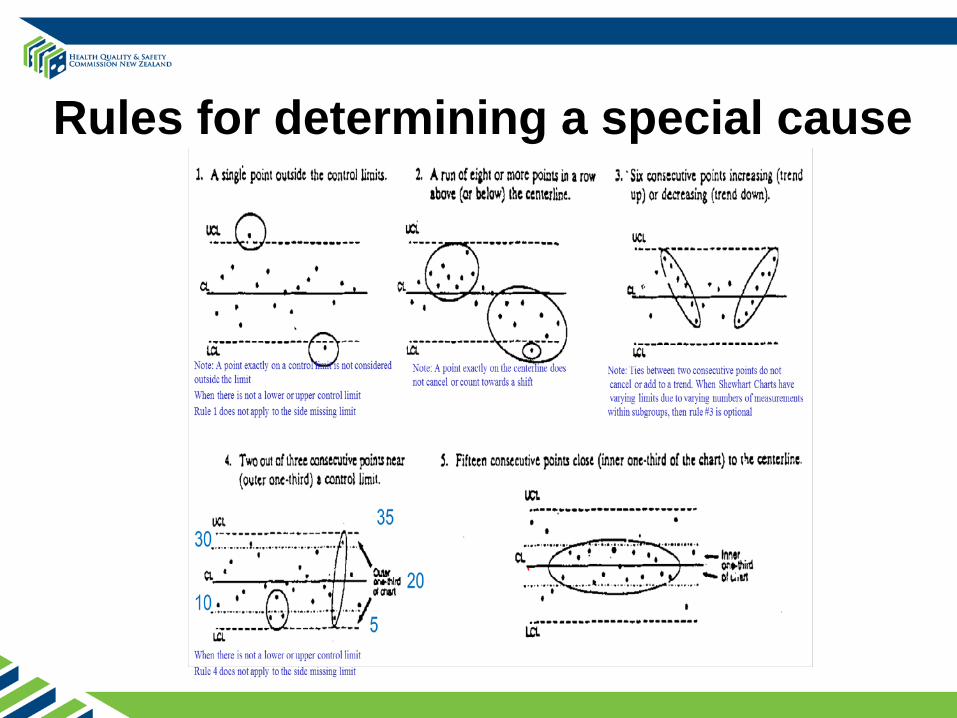
Rules for determining a special cause

Type of control chart
Two mistakes in understanding variation
We can make two mistakes: – thinking an outcome is due to a special cause when it
was really due to common causes – thinking an outcome is due to common causes when
it was really due to a special cause.
Shewhart charts help minimise these two mistakes.
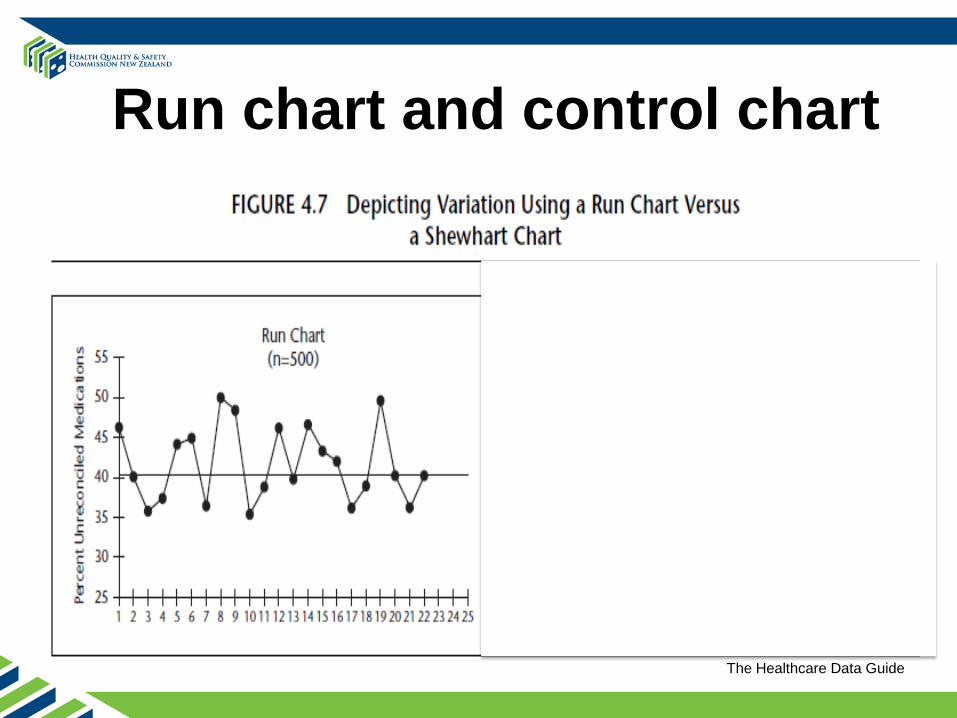
Run chart and control chart
The Healthcare Data Guide
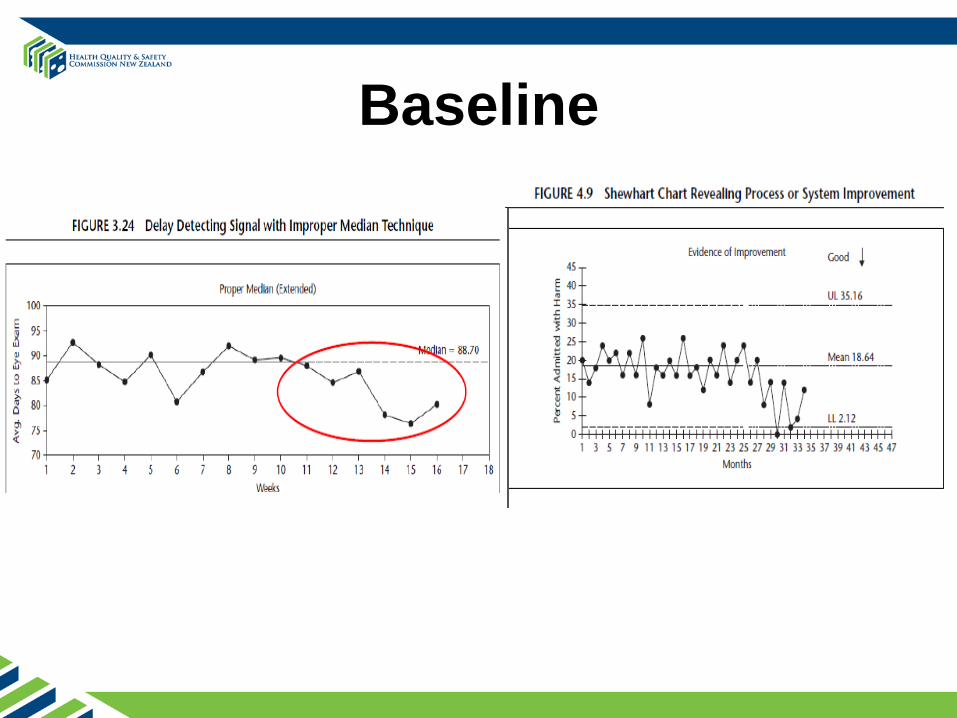
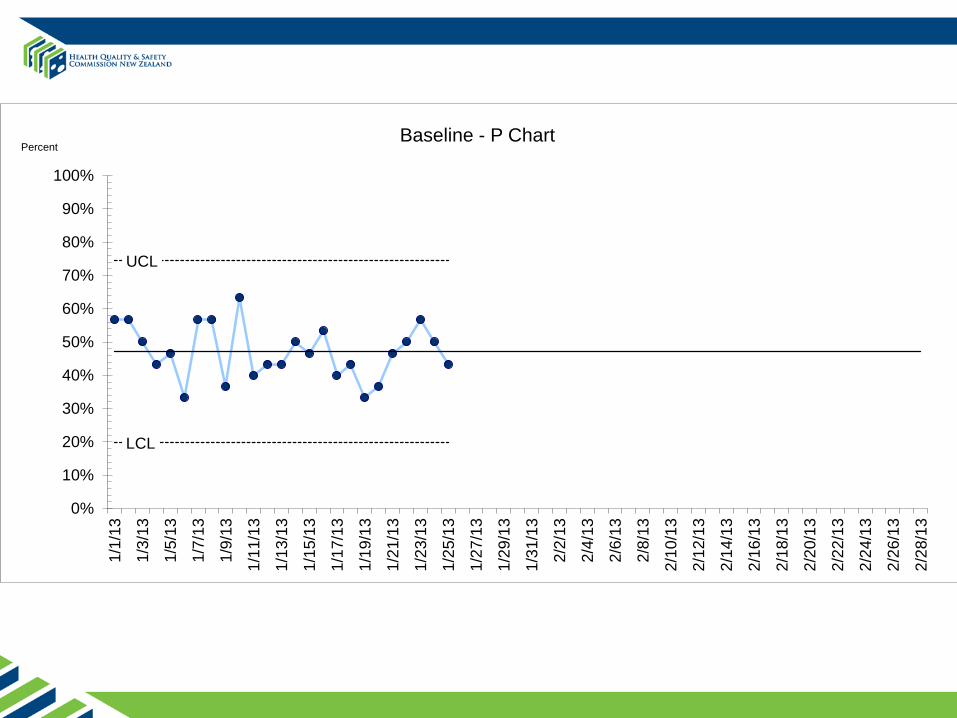
Baseline
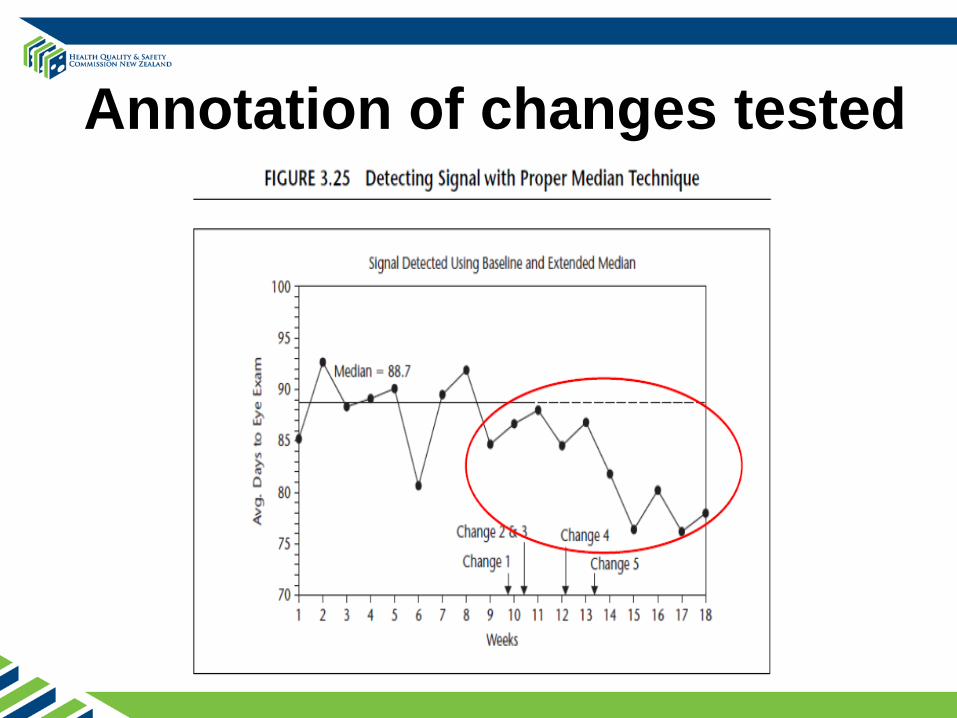
Annotation of changes tested
Breakout exercise
• Review your graphs (outcome, process and balancing) in DHB teams
• Discuss baseline (how many data points?) • Apply run chart rules to detect special cause • Feedback the observations

Measuring for sustainability
Moving toward monitoring
UCL
LCL
0%
10%
20%
30%
40%
50%
60%
70%
80%
90%
100%
1/1/
13
1/3/
13
1/5/
13
1/7/
13
1/9/
13
1/11
/13
1/13
/13
1/15
/13
1/17
/13
1/19
/13
1/21
/13
1/23
/13
1/25
/13
1/27
/13
1/29
/13
1/31
/13
2/2/
13
2/4/
13
2/6/
13
2/8/
13
2/10
/13
2/12
/13
2/14
/13
2/16
/13
2/18
/13
2/20
/13
2/22
/13
2/24
/13
2/26
/13
2/28
/13
Baseline - P Chart Percent
UCL
LCL
0%
10%
20%
30%
40%
50%
60%
70%
80%
90%
100%
1/1/
13
1/3/
13
1/5/
13
1/7/
13
1/9/
13
1/11
/13
1/13
/13
1/15
/13
1/17
/13
1/19
/13
1/21
/13
1/23
/13
1/25
/13
1/27
/13
1/29
/13
1/31
/13
2/2/
13
2/4/
13
2/6/
13
2/8/
13
2/10
/13
2/12
/13
2/14
/13
2/16
/13
2/18
/13
2/20
/13
2/22
/13
2/24
/13
2/26
/13
2/28
/13
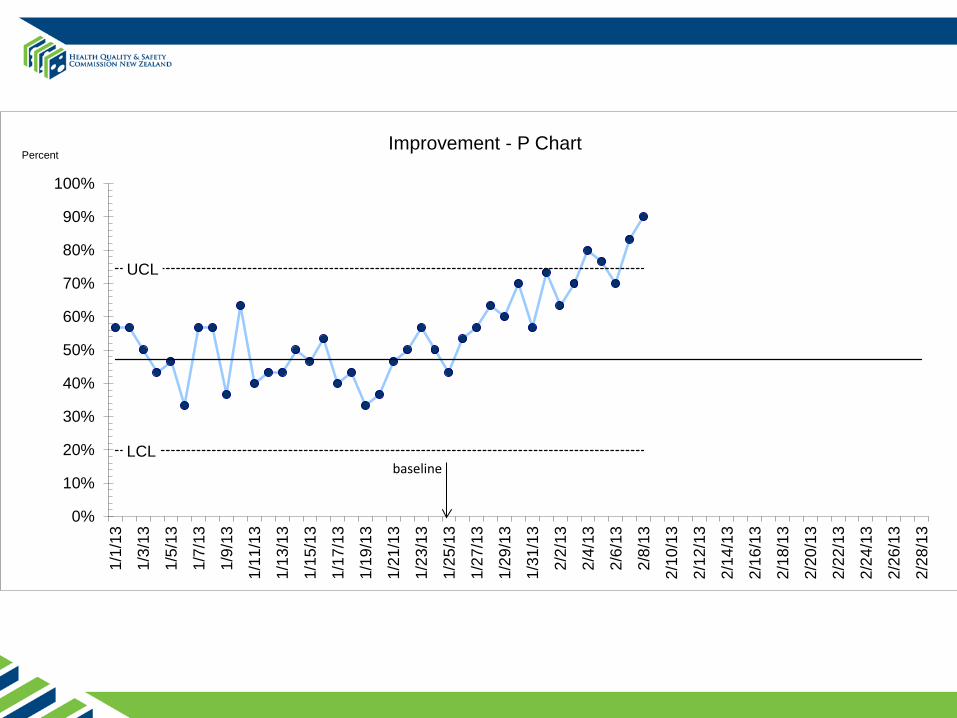
Improvement - P Chart Percent
baseline
UCL
LCL
0%
10%
20%
30%
40%
50%
60%
70%
80%
90%
100%
1/1/
13
1/3/
13
1/5/
13
1/7/
13
1/9/
13
1/11
/13
1/13
/13
1/15
/13
1/17
/13
1/19
/13
1/21
/13
1/23
/13
1/25
/13
1/27
/13
1/29
/13
1/31
/13
2/2/
13
2/4/
13
2/6/
13
2/8/
13
2/10
/13
2/12
/13
2/14
/13
2/16
/13
2/18
/13
2/20
/13
2/22
/13
2/24
/13
2/26
/13
2/28
/13
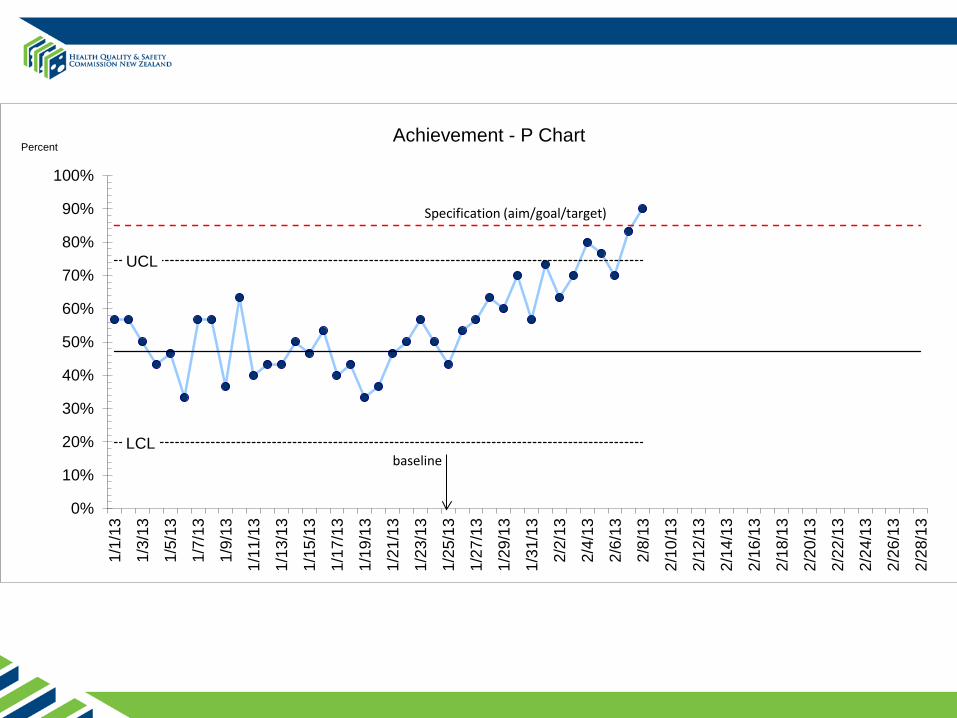
Achievement - P Chart Percent
baseline
Specification (aim/goal/target)
UCL
LCL
0%
10%
20%
30%
40%
50%
60%
70%
80%
90%
100%
1/1/
13
1/3/
13
1/5/
13
1/7/
13
1/9/
13
1/11
/13
1/13
/13
1/15
/13
1/17
/13
1/19
/13
1/21
/13
1/23
/13
1/25
/13
1/27
/13
1/29
/13
1/31
/13
2/2/
13
2/4/
13
2/6/
13
2/8/
13
2/10
/13
2/12
/13
2/14
/13
2/16
/13
2/18
/13
2/20
/13
2/22
/13
2/24
/13
2/26
/13
2/28
/13
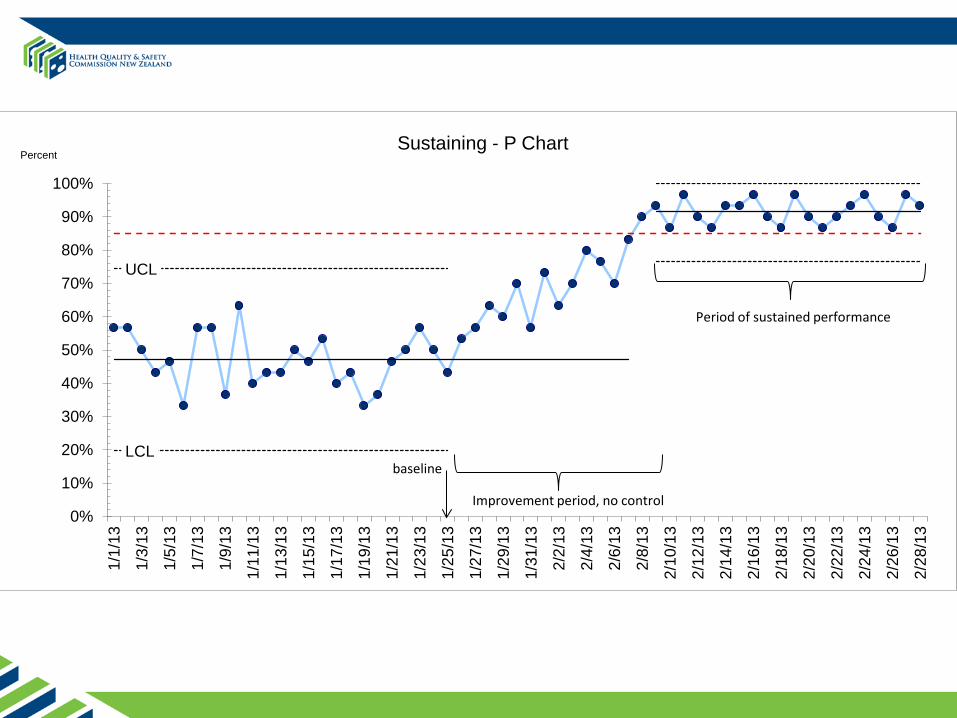
Sustaining - P Chart Percent
baseline
Improvement period, no control
Period of sustained performance
UCL
LCL
0%
10%
20%
30%
40%
50%
60%
70%
80%
90%
100%
1/1/
131/
3/13
1/5/
131/
7/13
1/9/
131/
11/1
31/
13/1
31/
15/1
31/
17/1
31/
19/1
31/
21/1
31/
23/1
31/
25/1
31/
27/1
31/
29/1
31/
31/1
32/
2/13
2/4/
132/
6/13
2/8/
132/
10/1
32/
12/1
32/
14/1
32/
16/1
32/
18/1
32/
20/1
32/
22/1
32/
24/1
32/
26/1
32/
28/1
33/
10/1
33/
24/1
34/
7/13
4/21
/13
5/31
/13
7/31
/13
9/30
/13
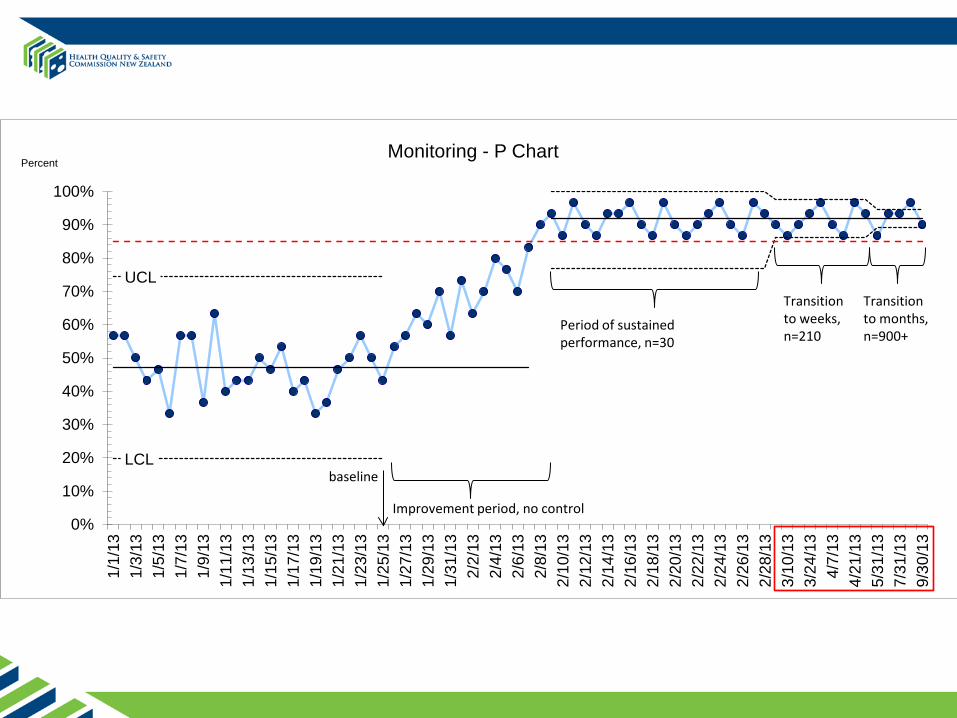
Monitoring - P Chart Percent
baseline
Improvement period, no control
Period of sustained performance, n=30
Transition to weeks, n=210
Transition to months, n=900+
UCL
LCL
0%
10%
20%
30%
40%
50%
60%
70%
80%
90%
100%
1/1/
131/
3/13
1/5/
131/
7/13
1/9/
131/
11/1
31/
13/1
31/
15/1
31/
17/1
31/
19/1
31/
21/1
31/
23/1
31/
25/1
31/
27/1
31/
29/1
31/
31/1
32/
2/13
2/4/
132/
6/13
2/8/
132/
10/1
32/
12/1
32/
14/1
32/
16/1
32/
18/1
32/
20/1
32/
22/1
32/
24/1
32/
26/1
32/
28/1
33/
10/1
33/
24/1
34/
7/13
4/21
/13
5/31
/13
7/31
/13
9/30
/13
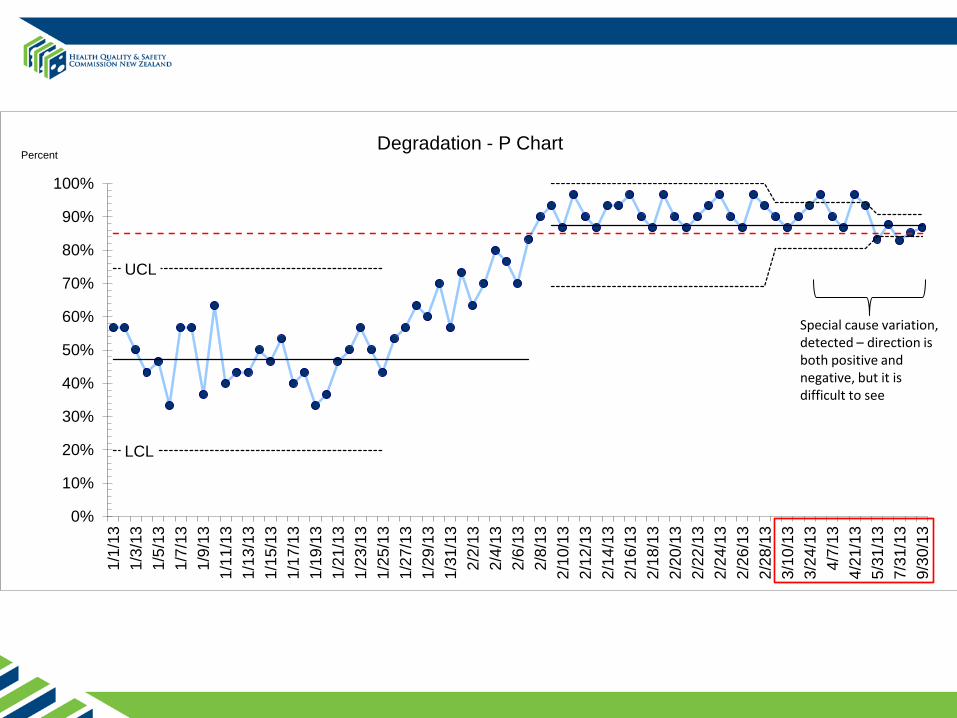
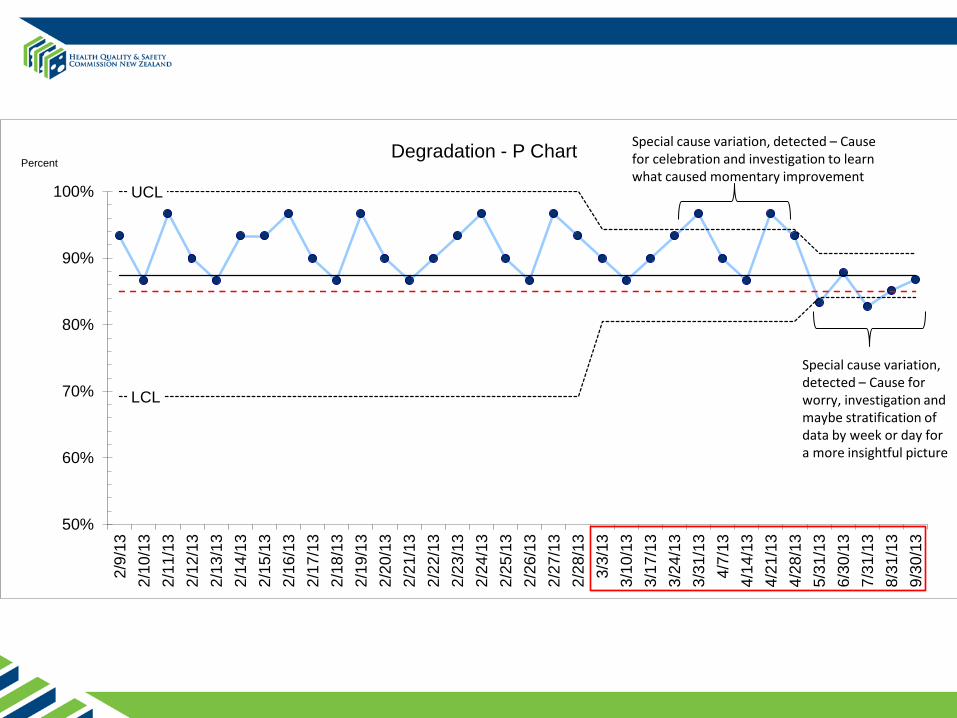
Degradation - P Chart Percent
Special cause variation, detected – direction is both positive and negative, but it is difficult to see
UCL
LCL
50%
60%
70%
80%
90%
100%
2/9/
132/
10/1
32/
11/1
32/
12/1
32/
13/1
32/
14/1
32/
15/1
32/
16/1
32/
17/1
32/
18/1
32/
19/1
32/
20/1
32/
21/1
32/
22/1
32/
23/1
32/
24/1
32/
25/1
32/
26/1
32/
27/1
32/
28/1
33/
3/13
3/10
/13
3/17
/13
3/24
/13
3/31
/13
4/7/
134/
14/1
34/
21/1
34/
28/1
35/
31/1
36/
30/1
37/
31/1
38/
31/1
39/
30/1
3
Degradation - P Chart Percent
Special cause variation, detected – Cause for worry, investigation and maybe stratification of data by week or day for a more insightful picture
Special cause variation, detected – Cause for celebration and investigation to learn what caused momentary improvement
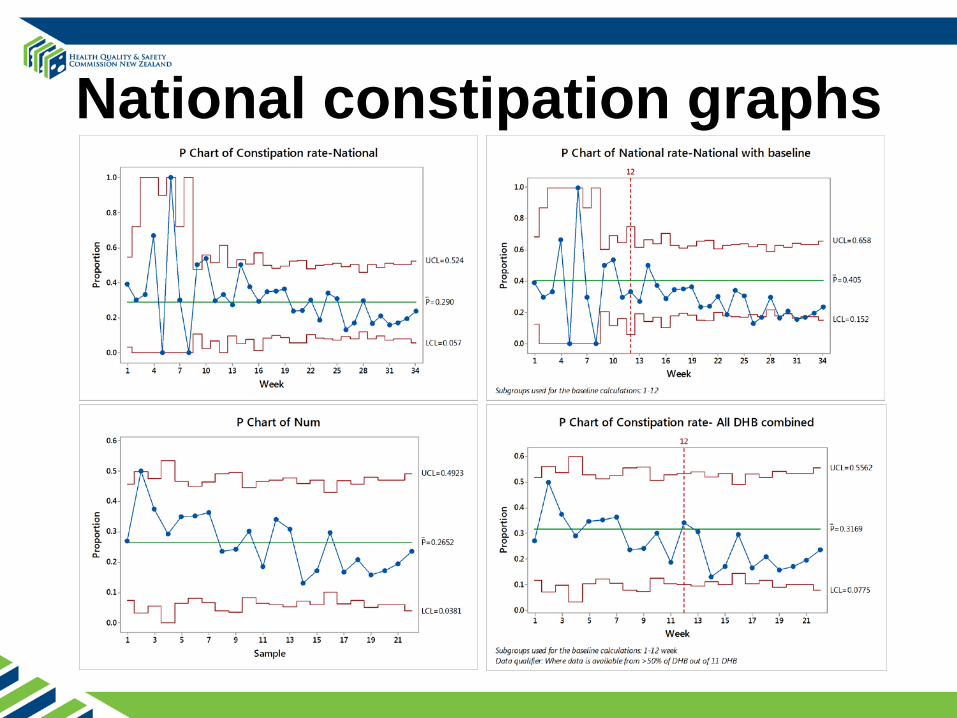
National constipation graphs