measurement of coherent x-ray focused beams by phase retrieval
TRANSCRIPT

Measurement of coherent x-ray focusedbeams by phase retrieval with transverse
translation diversity
Manuel Guizar-Sicairos and James R. FienupThe Institute of Optics, University of Rochester, Rochester, New York, 14627, USA
[email protected], [email protected]
Abstract: We describe a method for characterizing focused x-ray beamsusing phase retrieval, with diversity achieved by transversely translating aphase-shifting or absorbing structure close to the beam focus. The requiredmeasurements can be taken with an experimental setup that is similar tothat already used for fluorescent scan testing. The far-field intensity patternis measured for each position of the translating structure, and the collectedmeasurements are jointly used to estimate the beam profile by using anonlinear optimization gradient search algorithm. The capability to recon-struct 1D and 2D beam foci is demonstrated through numerical simulations.
© 2009 Optical Society of America
OCIS codes: (100.5070) Phase retrieval; (110.3200) Inverse scattering; (140.3295) Laser beamcharacterization; (340.7480) X-rays, soft x-rays, extreme ultraviolet (EUV); (110.7440) X-rayimaging.
References and links1. I. McNulty, J. Kirz, C. Jacobsen, E. H. Anderson, M. R. Howells and D. P. Kern, “High-Resolution Imaging by
Fourier Transform X-ray Holography,” Science 256, 1009–1012 (1992).2. W. Leitenberger, T. Weitkamp, M. Drakopoulos, I. Snigireva and A. Snigirev, “Microscopic imaging and holog-
raphy with hard X-rays using Fresnel zone-plates,” Opt. Commun. 180, 233–238 (2000).3. J. W. Goodman, Introduction to Fourier Optics, 3rd Ed. (Roberts & Company, Englewood, 2005).4. S. Eisebitt, J. Luning, W. F. Schlotter, M. Lorgen, O. Hellwig, W. Eberhardt and J. Stohr, “Lensless imaging of
magnetic nanostructures by x-ray spectro-holography,” Nature 432, 885–888 (2004).5. S. G. Podorov, K. M. Pavlov and D. M. Paganin, “A non-iterative reconstruction method for direct and unam-
biguous coherent diffractive imaging,” Opt. Express 15, 9954–9962 (2007).6. M. Guizar-Sicairos and J. R. Fienup, “Holography with extended reference by autocorrelation linear differential
operation,” Opt. Express 15, 17592–17612 (2007).7. S. Marchesini, S. Boutet, A. E. Sakdinawat, M. J. Bogan, S. Bajt, A. Barty, H. N. Chapman, M. Frank, S. P.
Hau-riege, A. Szoke, C. Cui et al., “Massively parallel x-ray holography,” Nat. Photonics 2, 560–563 (2008).8. M. Guizar-Sicairos and J. R. Fienup, “Direct image reconstruction from a Fourier intensity pattern using
HERALDO,” Opt. Lett. 33, 2668–2670 (2008).9. J. R. Fienup, “Reconstruction of an object from the modulus of its Fourier transform,” Opt. Lett. 3, 27–29 (1978).
10. J. R. Fienup, “Phase retrieval algorithms: a comparison,” Appl. Opt. 21, 2758–2769 (1982).11. J. R. Fienup, “Reconstruction of a complex-valued object from the modulus of its Fourier transform using a
support constraint,” J. Opt. Soc. Am. A 4, 118–123 (1987).12. J. N. Cederquist, J. R. Fienup, J. C. Marron and R. G. Paxman, “Phase retrieval from experimental far-field
speckle data,” Opt. Lett. 13, 619–621 (1988).13. J. Miao, P. Charalambous, J. Kirz and D. Sayre, “Extending the methodology of X-ray crystallography to allow
imaging of micrometre-sized non-crystalline specimens,” Nature 400, 342–344 (1999).14. S. Marchesini, H. He, H. N. Chapman, S. P. Hau-Riege, A. Noy, M. R. Howells, U. Weierstall and J. C. H.
Spence, “X-ray image reconstruction from a diffraction pattern alone,” Phys. Rev. B 68, 140101 (2003).15. D. Shapiro, P. Thibault, T. Beetz, V. Elser, M. Howells, C. Jacobsen, J. Kirz, E. Lima, H. Miao et al., “Biological
imaging by soft x-ray diffraction microscopy,” Proc. Natl. Acad. Sci. U.S.A. 102, 15343–15346 (2005).
#105592 - $15.00 USD Received 19 Dec 2008; revised 29 Jan 2009; accepted 6 Feb 2009; published 10 Feb 2009
(C) 2009 OSA 16 February 2009 / Vol. 17, No. 4 / OPTICS EXPRESS 2670

16. J. R. Fienup, “Lensless coherent imaging by phase retrieval with an illumination pattern constraint,” Opt. Express14, 498–508 (2006).
17. H. N. Chapman, A. Barty, S. Marchesini, A. Noy, S. P. Hau-Riege, C. Cui, M. R. Howells et al., “High-resolutionab initio three-dimensional x-ray diffraction microscopy,” J. Opt. Soc. Am. A 23, 1179–1200 (2006).
18. B. Abbey, K. A. Nugent, G. J. Williams, J. N. Clark, A. G. Peele, M. A. Pfeifer, M. de Jonge and I. McNulty,“Keyhole coherent diffractive imaging,” Nat. Physics 4, 394–398 (2008).
19. M. Guizar-Sicairos and J. R. Fienup, “Phase retrieval with Fourier-weighted projections,” J. Opt. Soc. Am. A25, 701–709 (2008).
20. R. A. Gonsalves and R. Childlaw, “Wavefront sensing by phase retrieval,” Proc. SPIE 207, 32–39 (1979).21. R. A. Gonsalves, “Phase retrieval and diversity in adaptive optics,” Opt. Eng. 21, 829–832 (1982).22. R. G. Paxman, “Diversity imaging,” in Signal Recovery and Synthesis, 2001 OSA Technical Digest Series (Op-
tical Society of America, 2001), paper SWA1.23. G. R. Brady and J. R. Fienup, “Nonlinear optimization algorithm for retrieving the full complex pupil function,”
Opt. Express 14, 474–486 (2006).24. H. M. L. Faulkner and J. M. Rodenburg, “Movable aperture lensless transmission microscopy: a novel phase
retrieval algorithm,” Phys. Rev. Lett. 93, 023903 (2004).25. J. M. Rodenburg and H. M. L. Faulkner, “A phase retrieval algorithm for shifting illumination,” Appl. Phys. Lett.
85, 4795–4797 (2004).26. O. Bunk, M. Dierolf, S. Kynde, I. Johnson, O. Marti, F. Pfeiffer, “Influence of the overlap parameter on the
convergence of the ptychographical iterative engine,” Ultramicroscopy 108, 481–487 (2008).27. M. Guizar-Sicairos and J. R. Fienup, “Phase retrieval with transverse translation diversity: a nonlinear optimiza-
tion approach,” Opt. Express 16, 7264–7278 (2008).28. P. Thibault, M. Dierolf, A. Menzel, O. Bunk, C. David and F. Pfeiffer, “High-resolution scanning x-ray diffraction
microscopy,” Science 321, 379–382 (2008).29. M. Engelhardt, J. Baumann, M. Schuster, C. Kottler, F. Pfeiffer, O. Bunk and C. David, “Inspection of refractive
x-ray lenses using high-resolution differential phase contrast imaging with a microfocus x-ray source,” Rev. Sci.Instrum. 78, 093707 (2007).
30. H. Mimura, H. Yumoto, S. Matsuyama, S. Handa, T. Kimura, Y. Sano, M. Yabashi, Y. Nishino, K. Tamasaku, T.Ishikawa et al., “Direct determination of the wave field of an x-ray nanobeam,” Phys. Rev. A 77, 015812 (2008).
31. H. C. Kang, J. Maser, G. B. Stephenson, C. Liu, R. Conley, A. T. Macrander and S. Vogt, “Nanometer linearfocusing of hard x rays by a multilayer Laue lens,” Phys. Rev. Lett. 96, 127401 (2006).
32. A. Stein, K. Evans-Lutterodt, N. Bozovic and A. Taylor, “Fabrication of silicon kinoform lenses for hard x-rayfocusing by electron beam lithography and deep reactive ion etching,” J. Vac. Sci. Technol. B 26, 122–127 (2008).
33. H. M. Quiney, A. G. Peele, Z. Cai, D. Paterson and K. A. Nugent, “Diffractive imaging of highly focused x-rayfields,” Nat. Physics 2, 101–104 (2006).
34. Y. M. Bruck and L. G. Sodin, “On the ambiguity of the image reconstruction problem,” Opt. Commun. 30,304–308 (l979).
35. J. R. Fienup, “Invariant error metrics for image reconstruction,” Appl. Opt. 36, 8352–8357 (1997).36. M. Guizar-Sicairos, S. T. Thurman and J. R. Fienup, “Efficient subpixel image registration algorithms,” Opt.
Lett. 33, 156–158 (2008).37. G. R. Brady, M. Guizar-Sicairos and J. R. Fienup, “Optical wavefront measurement using phase retrieval with
transverse translation diversity,” Opt. Express 17, 624–639 (2009).38. S. T. Thurman, R. T. DeRosa and J. R. Fienup, “Amplitude metrics for field retrieval with hard-edge and
uniformly-illuminated apertures,” J. Opt. Soc. Am. A , doc. ID 101701 (posted 26 January 2009, in press).39. M. Guizar-Sicairos and J. R. Fienup, “Focused x-ray beam characterization by phase retrieval with a move-
able phase-shifting structure,” in Frontiers in Optics, OSA Technical Digest Series (Optical Society of America,2008), paper FWN3.
1. Introduction
The high penetration depth of x-rays (particularly hard x-rays) makes them attractive for high-resolution imaging of internal structures of thick samples, with important applications in thefields of material science, biology and integrated circuit inspection. Focusing of x-ray beamsinto increasingly smaller spots is of fundamental importance for increasing the resolution ofscanning (or conventional) imaging in this wavelength regime. A tighter focus is also importantfor holographic approaches that use a focused spot as a reference wave [1–3], where the finalimage resolution can be limited by the size of the focused spot and the signal-to-noise ratio(SNR) can be limited by the amount of energy passing through a small pinhole [4]. Ensuringthat the wavefront is flat and the amplitude is uniform is also important when using non-iterative
#105592 - $15.00 USD Received 19 Dec 2008; revised 29 Jan 2009; accepted 6 Feb 2009; published 10 Feb 2009
(C) 2009 OSA 16 February 2009 / Vol. 17, No. 4 / OPTICS EXPRESS 2671

reconstruction methods that require an extended reference [5–8].Characterization of x-ray focused beams is important to evaluating focusing elements needed
to produce small spots and to ensure that small nano-objects are efficiently and uniformly il-luminated for lensless image reconstruction by phase retrieval [9–19] (also known as coherentdiffractive imaging). If the object lacks a sharp support constraint, then the illumination itselfprovides the support region [16, 18], and having this illumination accurately characterized willenable a more accurate estimate for the support constraint. A tight support constraint (accurateknowledge of the illumination pattern) is especially important for imaging of specimens withcomplex-valued transmissivity, where a nonnegativity constraint cannot be used.
Introducing diversity to phase retrieval, by making a set of independent intensity measure-ments after a known modification of the experimental setup, has been shown to make recon-structions more robust to stagnation, ambiguities, and noise [20–23]. Transverse displacementof the sample with respect to a known illumination pattern (transverse-translation-diverse phaseretrieval), is a practical form of diversity for the x-ray image reconstruction problem, and hasshown a substantial success at optical and x-ray wavelengths. For this technique an accurateknowledge of the beam is important in order to obtain artifact-free reconstructions [24–26] andmakes the convergence faster for algorithms that refine the initial estimate of the illuminationpattern [27, 28].
Although there are methods that could be used to assess the quality of the focusing optics(for example by phase contrast imaging [29] or by obtaining a high resolution image of the lensouter structure by an atomic force microscope), alignment issues may also affect the qualityof the focused x-ray beam. Furthermore, the push for tighter focus spots is currently drivenby manufacturing cylindrical focusing optics, either by mirrors [30], multilayer lenses [31] orkinoforms [32]. For this case, alignment between the two cylindrical lenses that are required toobtain a 2D focus (a focusing spherical wavefront) is even more critical. It is then importantto a have reliable method for beam characterization that can be implemented in situ to directlyassess the quality of the focused beam.
By scanning a thin slab of fluorescent material and measuring the intensity of its fluores-cence emission (for each transverse position) one can obtain a measurement of a projection ofthe transverse intensity profile of the beam [31, 32]. Alternatively the intensity profile can beobtained by scanning a phase-shifting microbridge structure [30] that does not need to be thinin the transverse dimension, and measuring the intensity that is diffracted from its edge. Forthese approaches only an integrated intensity over the transverse extent of the fluorescent struc-ture is measured and the resolution of the measurement is limited by the slab thickness (or bythe roughness of the microbridge structure [30]). The required width of the fluorescent struc-ture decreases with the spot diameter (in order to obtain enough resolution), but its thicknessalong the direction of propagation must reduce with the square of the beam spot diameter dueto the reduced depth of focus, which produces a significant decrease in the fluorescence signal,an increase in exposure times and increased stability requirements. Furthermore, the alignmentof the fluorescent structure becomes increasingly difficult because a direct measurement of thebeam focus intensity requires accurate positioning of the fluorescent structure within the depthof focus of the beam. Although a 2D intensity profile could be obtained by scanning a 2D fluo-rescent structure, manufacturing such a structure with a transverse size of a few nanometers isdifficult and its alignment within the beam depth of focus could be very challenging.
Phase retrieval offers an alternative for measuring coherent x-ray beams, with the resolutionfundamentally limited only by the detector angular extent and the wavelength, thus avoidingthe need of fabricating structures with sizes on the order of the desired resolution. Quiney etal. reconstructed a 2D soft x-ray beam focus (obtained by a zone plate), using phase retrieval,from a measurement of its far-field diffraction pattern [33]. Mimura et al. measured the intensity
#105592 - $15.00 USD Received 19 Dec 2008; revised 29 Jan 2009; accepted 6 Feb 2009; published 10 Feb 2009
(C) 2009 OSA 16 February 2009 / Vol. 17, No. 4 / OPTICS EXPRESS 2672
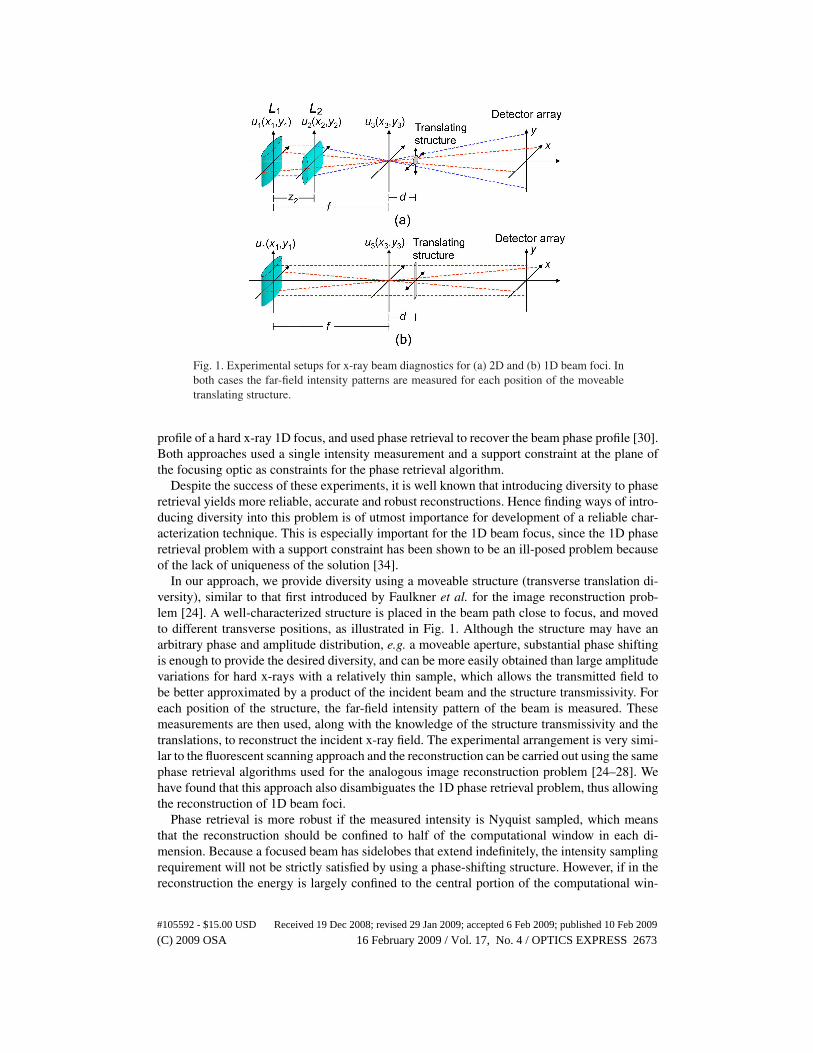
Fig. 1. Experimental setups for x-ray beam diagnostics for (a) 2D and (b) 1D beam foci. Inboth cases the far-field intensity patterns are measured for each position of the moveabletranslating structure.
profile of a hard x-ray 1D focus, and used phase retrieval to recover the beam phase profile [30].Both approaches used a single intensity measurement and a support constraint at the plane ofthe focusing optic as constraints for the phase retrieval algorithm.
Despite the success of these experiments, it is well known that introducing diversity to phaseretrieval yields more reliable, accurate and robust reconstructions. Hence finding ways of intro-ducing diversity into this problem is of utmost importance for development of a reliable char-acterization technique. This is especially important for the 1D beam focus, since the 1D phaseretrieval problem with a support constraint has been shown to be an ill-posed problem becauseof the lack of uniqueness of the solution [34].
In our approach, we provide diversity using a moveable structure (transverse translation di-versity), similar to that first introduced by Faulkner et al. for the image reconstruction prob-lem [24]. A well-characterized structure is placed in the beam path close to focus, and movedto different transverse positions, as illustrated in Fig. 1. Although the structure may have anarbitrary phase and amplitude distribution, e.g. a moveable aperture, substantial phase shiftingis enough to provide the desired diversity, and can be more easily obtained than large amplitudevariations for hard x-rays with a relatively thin sample, which allows the transmitted field tobe better approximated by a product of the incident beam and the structure transmissivity. Foreach position of the structure, the far-field intensity pattern of the beam is measured. Thesemeasurements are then used, along with the knowledge of the structure transmissivity and thetranslations, to reconstruct the incident x-ray field. The experimental arrangement is very simi-lar to the fluorescent scanning approach and the reconstruction can be carried out using the samephase retrieval algorithms used for the analogous image reconstruction problem [24–28]. Wehave found that this approach also disambiguates the 1D phase retrieval problem, thus allowingthe reconstruction of 1D beam foci.
Phase retrieval is more robust if the measured intensity is Nyquist sampled, which meansthat the reconstruction should be confined to half of the computational window in each di-mension. Because a focused beam has sidelobes that extend indefinitely, the intensity samplingrequirement will not be strictly satisfied by using a phase-shifting structure. However, if in thereconstruction the energy is largely confined to the central portion of the computational win-
#105592 - $15.00 USD Received 19 Dec 2008; revised 29 Jan 2009; accepted 6 Feb 2009; published 10 Feb 2009
(C) 2009 OSA 16 February 2009 / Vol. 17, No. 4 / OPTICS EXPRESS 2673

Fig. 2. (a) Amplitude transmissivity of the cylindrical lenses L1 and L2. Phase error (de-viation from cylinder) for (b) L1 and (c) L2. Colorbar for phase in (b) and (c) is given inradians.
dow, the aliased sidelobe energy will be small and can be ignored. This condition is equivalentto that used for coherent diffractive imaging with an illumination pattern constraint [16, 18].
The output of the algorithm is the complex-valued field (i.e. both phase and amplitude) of thebeam incident on the translating structure. Because the reconstructed field can be propagatednumerically to any other plane, the translating structure need not be positioned within the beamdepth-of-focus. This will greatly relax the longitudinal alignment requirements compared withthe scanning approach. Furthermore, we will show that, after the beam is reconstructed, thedistance from the structure to the beam focus can be easily estimated by maximizing a sharpnessmetric, so that this distance does not need to be known.
In this approach neither the width of the translating structure nor its translations need to be onthe scale of the final resolution of the reconstruction, and only a modest number of translationsare needed. For solving this phase retrieval problem, only the relative transverse displacementsand not the absolute position of the structure need to be known [24–28]. This approach shouldbe useful at optical wavelengths as well.
In Sections 2 and 3 we describe numerical simulations where we apply phase retrieval withtransverse translation diversity to a set of far-field intensity measurements to obtain a phase andamplitude profile of the 2D and 1D beam foci, respectively.
2. 2D focused beam diagnostics example
A pair of crossed cylindrical lenses can be used to obtain a 2D focus spot, as shown in Fig. 1(a).The parameters in our simulations are consistent with kinoform focusing optics that are cur-rently under development for focusing of hard x-rays [32]. We considered a pair of kinoformlenses, each with an aperture of 150×150 µm. The first lens (L1) has a focal length of f = 10cm and is oriented to focus in the x-direction, and the second lens (L2) is placed z2 = 1 cmdownstream and has a focal length of f − z2 = 9 cm and focuses in the y-direction. The differ-ent focal lengths were chosen as to provide the best focus position at 10 cm downstream of L1for both the x and y directions.
Figure 2(a) shows the simulated amplitude transmission for L1 and L2. The simulated aberra-tions (deviation from cylinder) of the two lenses are shown in Figs. 2(b) and 2(c). Aberrationsfor the kinoforms were introduced by dividing the lens into 40 sections along the focusing di-rection, each section having the same number of waves (peak to valley) of the quadratic phasethat is responsible for the focusing. Each section was assigned a zero-mean random smoothphase error (independent from one section to the next) with a root-mean-squared (RMS) valueof 0.05 waves (0.314 radians) and a random piston error with 0.1 waves (0.628 radians) RMS.
#105592 - $15.00 USD Received 19 Dec 2008; revised 29 Jan 2009; accepted 6 Feb 2009; published 10 Feb 2009
(C) 2009 OSA 16 February 2009 / Vol. 17, No. 4 / OPTICS EXPRESS 2674

Fig. 3. (a) Amplitude and (b) phase (deviation from sphere) of the field after L2. (c) Square-root of the beam amplitude at the nominal focus. Line plots show cuts through amplitudeof the focused beam through the origin. Colorbar in (b) is in radians.
These aberrations could arise from surface figure error (or material inhomogeneity) and fromnot exactly obtaining an integer number of 2π phase steps upon transition from one kinoformsection to the next.
Assuming the incident field is a plane wave, in the thin-lens approximation, the field trans-mitted by L1, u1(x1,y1), is given by
u1(x1,y1) = t1(x1,y1)exp(− ikx2
12 f
), (1)
where the amplitude and phase (wavefront deviation from a cylinder) of t1(x1,y1) are shown inFigs. 2(a) and 2(b), respectively.
The field incident on L2 was computed, assuming scalar paraxial diffraction theory, by nu-merically propagating u1(x1,y1) by a distance z2. Sampling requirements were minimized byfirst propagating u1(x1,y1) to the lens nominal focus and then propagating back to the plane ofL2 using, for both propagations, the numerical propagation approach for cylindrical wavefrontsdescribed in Appendix A [Eq. (A5)].
We obtain u2(x2,y2), the field immediately after L2, by multiplying by the transmissivityof the second lens. The amplitude and phase (deviation from sphere) of the field after L2 areshown in Figs. 3(a) and 3(b), respectively. Notice that the phase aberrations in L1 have causedamplitude variations on the field after L2.
For our simulations λ = 0.109 nm and the sampling at L1 was (∆x1,∆y1)' (543,488) nm. Adifferent sampling rate at L1, along the x and y directions, was chosen in order to get the samesampling rate for both directions at the plane of L2 (and at the beam focus). The sampling at L1and L2 are related by ∆x2 = ( f − z2)∆x1/ f and ∆y2 = ∆y1. Thus, having ∆y1 = ( f − z2)∆x1/ fwill ensure that ∆x2 = ∆y2. The Fourier transforms (FT) in Eqs. (A5) and (A6) were computedusing the fast FT algorithm (FFT) on a N×N = 1024×1024 computational window.
Because u2(x2,y2) is a spherically converging beam, the beam at focus, u3(x3,y3), was com-puted efficiently through a single 2D FFT Fresnel transform as given by Eq. (A1). The beam atfocus, shown in Fig. 3(c), has a width of about 100 nm (peak to first null). Sampling at focuswas ∆x3 = ∆y3 ' 19.6 nm.
Our goal is to determine the aberrated focused beam by phase retrieval from far-field intensitymeasurements. To provide diversity to the phase retrieval algorithm in a practical way, in orderto make it more robust, in the simulation we introduced a structure that has unity transmissivityeverywhere, and imparts a π radians phase shift to the beam inside a 392 nm (20 pixels) radius.The structure was placed in the path of the beam at ∆z = 1 mm downstream from the nominal
#105592 - $15.00 USD Received 19 Dec 2008; revised 29 Jan 2009; accepted 6 Feb 2009; published 10 Feb 2009
(C) 2009 OSA 16 February 2009 / Vol. 17, No. 4 / OPTICS EXPRESS 2675

Fig. 4. (a) Square-root of x-ray beam amplitude at 1 mm downstream from focus. Line plotsshow vertical and horizontal cuts through the beam amplitude through the origin. (b) The392 nm radius translating structure was moved to 16 positions along the transverse extentof the beam. (c) A second set of measurements with a 981 nm radius translating structurewas used for an independent reconstruction.
focus position. The beam at this longitudinal position was significantly larger than the beam atfocus. This allows for using a relatively large structure, which is easier to make lithographically.Additionally, the distance from focus does not need to be known for the algorithm to work,which relaxes the alignment requirements for the measurement approach. The beam amplitudeat 1 mm downstream of focus, calculated from the beam at focus using angular spectrum [3], isshown in Fig. 4(a).
For this technique, best results are obtained using a structure with a transverse size thatis comparable to the beam extent at that plane. Through numerical simulations we have alsoobserved fast convergence using fewer diffraction patterns if a more complicated structure isused. However, a more complicated structure may be harder to manufacture and accuratelycharacterize.
The structure was translated transversely in steps of 392 nm (20 pixels) to 16 positions alonga 4×4 Cartesian grid, as shown in Fig. 4(b). This arrangement was chosen to have a substantialamount of overlap between the areas of the beam that undergo a phase shift. The algorithm,however, does not require the translations to be in a Cartesian or regular arrangement.
For imaging applications the known illumination pattern typically has a finite transverseextent, and having the illumination overlap for different translations of the object is crucial forreconstruction, otherwise there is no diversity added to the phase retrieval problem [24, 26].In our case, the beam we reconstruct has an approximately finite extent (true sidelobes extendindefinitely) and the known structure is transmissive everywhere. For this case, having overlapof the structure is not absolutely necessary to impart diversity to the measurements. However,we have observed better reconstructions when there is overlap of the translating structure.
The intensity patterns at the detector plane were computed (by a single 2D FFT Fresneltransform) at 7.37 m downstream focus and sampled with a 1024× 1024 detector having apixel pitch of 40 µm. Two of these patterns, for the positions of the translating structure thatare shown in red in Fig. 4(b), are shown in Fig. 5(a) and Fig. 5(b). Poisson-distributed noisewas added after normalizing each intensity pattern to have a total of 2.25×10¹⁰ photons, whichcorresponds to an incident flux of 106 photons/µm2/s on the lens with 1 second exposures.
The 16 measured intensity patterns (along with the translations and the translating struc-ture transmissivity) were fed to a nonlinear optimization algorithm for solving the problem
#105592 - $15.00 USD Received 19 Dec 2008; revised 29 Jan 2009; accepted 6 Feb 2009; published 10 Feb 2009
(C) 2009 OSA 16 February 2009 / Vol. 17, No. 4 / OPTICS EXPRESS 2676
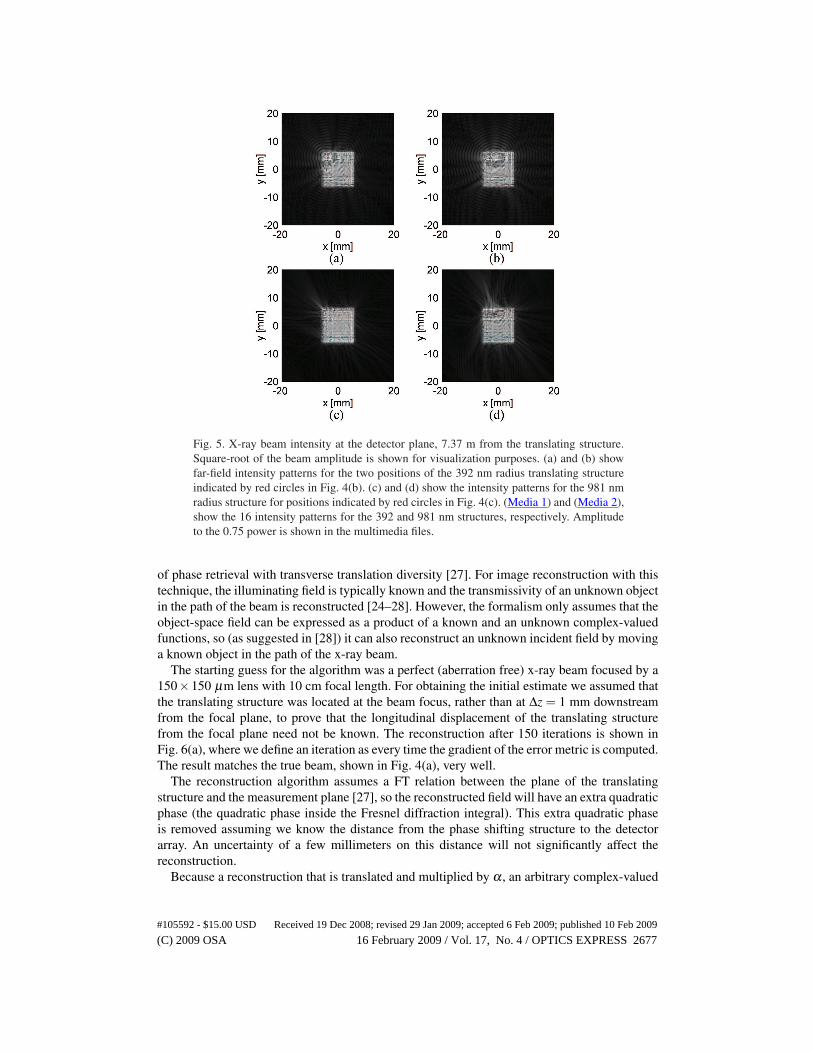
Fig. 5. X-ray beam intensity at the detector plane, 7.37 m from the translating structure.Square-root of the beam amplitude is shown for visualization purposes. (a) and (b) showfar-field intensity patterns for the two positions of the 392 nm radius translating structureindicated by red circles in Fig. 4(b). (c) and (d) show the intensity patterns for the 981 nmradius structure for positions indicated by red circles in Fig. 4(c). (Media 1) and (Media 2),show the 16 intensity patterns for the 392 and 981 nm structures, respectively. Amplitudeto the 0.75 power is shown in the multimedia files.
of phase retrieval with transverse translation diversity [27]. For image reconstruction with thistechnique, the illuminating field is typically known and the transmissivity of an unknown objectin the path of the beam is reconstructed [24–28]. However, the formalism only assumes that theobject-space field can be expressed as a product of a known and an unknown complex-valuedfunctions, so (as suggested in [28]) it can also reconstruct an unknown incident field by movinga known object in the path of the x-ray beam.
The starting guess for the algorithm was a perfect (aberration free) x-ray beam focused by a150×150 µm lens with 10 cm focal length. For obtaining the initial estimate we assumed thatthe translating structure was located at the beam focus, rather than at ∆z = 1 mm downstreamfrom the focal plane, to prove that the longitudinal displacement of the translating structurefrom the focal plane need not be known. The reconstruction after 150 iterations is shown inFig. 6(a), where we define an iteration as every time the gradient of the error metric is computed.The result matches the true beam, shown in Fig. 4(a), very well.
The reconstruction algorithm assumes a FT relation between the plane of the translatingstructure and the measurement plane [27], so the reconstructed field will have an extra quadraticphase (the quadratic phase inside the Fresnel diffraction integral). This extra quadratic phaseis removed assuming we know the distance from the phase shifting structure to the detectorarray. An uncertainty of a few millimeters on this distance will not significantly affect thereconstruction.
Because a reconstruction that is translated and multiplied by α , an arbitrary complex-valued
#105592 - $15.00 USD Received 19 Dec 2008; revised 29 Jan 2009; accepted 6 Feb 2009; published 10 Feb 2009
(C) 2009 OSA 16 February 2009 / Vol. 17, No. 4 / OPTICS EXPRESS 2677

Fig. 6. Square-root of the amplitude of the field reconstructed from detector measurementsusing (a) the 392 nm radius structure and (b) the 981 nm radius structure. (c) and (d) showcuts through the amplitude of the initial estimate (dashed curves), the true x-ray beam (solidcurves) and the reconstructions with the 392 nm (circles) and the 981 nm radius structure(points).
constant, is considered successful, we assess the quality of the reconstruction through E, anormalized translation-invariant RMS error between the true field and its estimate, u(x,y), givenby [35]
E2 = minα,x′,y′
∑x,y |α u(x− x′,y− y′)−u(x,y)|2
∑x,y |u(x,y)|2 . (2)
Equation (2) can be computed by registering the true beam and the reconstruction to withina small fraction of a pixel by maximizing their cross-correlation [35]. For our reconstructedfield E = 0.2484, computed by registering the beam and the reconstruction to within 1/100of a pixel using an efficient subpixel registration algorithm [36]. This rather large error wasfound to mainly arise from areas outside of the composite support of the translating structure,as shown in Fig. 6(d), a cut at y = 3 µm. Within the composite support of the translatingstructure shown in Fig. 4(b), E = 0.0423, which indicates that the field within this support wasaccurately recovered. Most of the error in the reconstruction comes from the inaccuracy of thelow-amplitude sidelobes over a large area (20×20 µm2).
For our simulation parameters, the relation between the x-ray beam at focus and the planeof the measurement is very close to a FT. Placing a translating structure on any portion ofthe beam at focus has an important effect on every point of the measurement plane. However,placing the translating structure exactly at the nominal focus may be a difficult alignment task,and it requires the translating structure to be on the scale of the focused beam. Placing thetranslating structure downstream (or upstream) of the nominal focus, where the beam is larger,as was done for the simulation results above, allows the structure to be significantly larger thanthe focused spot and reduces the alignment requirements. However, as we move the translatingstructure away from the nominal focus, its effect becomes more local on the measured intensitypattern and affects a smaller area on the detector plane. This explains the limited capability of
#105592 - $15.00 USD Received 19 Dec 2008; revised 29 Jan 2009; accepted 6 Feb 2009; published 10 Feb 2009
(C) 2009 OSA 16 February 2009 / Vol. 17, No. 4 / OPTICS EXPRESS 2678

recovering the low amplitude sidelobes that lie beyond the composite support covered by thetranslating structure.
To improve the reconstruction we can increase the area covered by the translating structure.To illustrate this point, we performed an additional numerical simulation where we used a 981nm radius (50 pixels) translating structure. The increased composite support for this largerstructure is shown in Fig. 4(c). Notice that this support is still short of covering the entire20× 20 µm computational window and we have used the same number of diversity images,with same (relative) overlap of the translating structure in an equivalent position grid.
Two of the intensity patterns at the detector plane are shown in Figs. 5(c) and 5(d). The recon-struction after 200 iterations of the nonlinear optimization algorithm is shown in Fig. 6(b). Forthis reconstruction E = 0.0874, computed over the entire computational window. The error issignificantly reduced on account of a better agreement for the outer sidelobes of the reconstruc-tion. Figures 6(c) and 6(d) show horizontal cuts through the amplitudes of the initial estimate(dashed curves), the true x-ray field (solid curves), the reconstructions using the 392 nm radiusstructure (circles) and the 981 nm structure (points). Notice that both reconstructions have anexcellent agreement with the true x-ray beam for the cut through the origin, shown in Fig. 6(c).However, there is a significantly better agreement of the reconstruction using the larger trans-lating structure (points) for the cut through y = 3 µm, shown in Fig. 6(d). This improvementcan also be obtained with the smaller structure by increasing the number of positions of thetranslating structure so as to cover an increased area of the beam.
Having reconstructed the complex-valued field in this plane, we can numerically propagateit back to the focus plane using angular spectrum. The distance to the best focus plane wasestimated by finding the propagation distance that maximized the sharpness of the beam (thesum over the square of the intensity of the beam). Because this is an optimization problem withrespect to only one parameter (the propagation distance) we can easily solve it with a simpleone-parameter search.
The best focus position using this criteria was found to be at 0.717 µm and 1.358 µm up-stream of the nominal focus for the reconstructions using the small and large translating struc-tures, respectively. Recovering a distance different from the nominal focus is not due to anerror in the reconstruction. For this beam, the aberrations introduced by the lenses have slightlyshifted the best focus position. We confirmed this by also finding the best focus (maximumsharpness) of the true x-ray beam. This was found at 1.318 µm upstream of the nominal focus,in very good agreement with the reconstruction from the 981 nm translating structure.
Figure 7 shows the numerically refocused reconstructions. We obtain an excellent agree-ment of the reconstructions with the true x-ray beam at the nominal focus, shown in Fig. 3(c),including the shape and location of the sidelobes.
3. 1D beam focus diagnostics example
A plane wave was assumed to be incident on a 150× 150 µm cylindrical lens with a f = 10cm focal length, as shown in Fig. 1(b). The transmissivity and aberrations of the lens (deviationfrom cylinder) are shown in Figs. 2(a) and 2(b), respectively. The field after the lens was nu-merically propagated to the beam focus using Eqs. (A5) and (A6) with a N×N = 1024×1024computational window. The sampling rate at the plane of the lens was ∆x1 = ∆y1 ' 543 nm.The sampling at the focal plane was (∆x3,∆y3)' (543,19.6) nm.
Figure 8(a) shows the amplitude of the simulated beam at the focal plane. Notice the verydifferent spatial range of the beam for x and y. The focused beam has a width of approximately100 nm (peak to first null). Notice that there is substantial variation of the beam along the ydirection and that the beam extent in that direction is still close to the original 150 µm.
For characterizing the 1D beam focus of a single cylindrical lens, we again introduce a trans-
#105592 - $15.00 USD Received 19 Dec 2008; revised 29 Jan 2009; accepted 6 Feb 2009; published 10 Feb 2009
(C) 2009 OSA 16 February 2009 / Vol. 17, No. 4 / OPTICS EXPRESS 2679

Fig. 7. Square-root of amplitude of the numerically refocused reconstructions obtainedfrom measurements using the (a) 392 nm and (b) 981 nm structures. (c) Horizontal and (d)vertical cuts through the amplitude of the true x-ray beam at best focus (solid curves) andthe numerically refocused reconstructions using the small (circles) and the large (points)structure.
lating structure, as shown in Fig. 1(b), to introduce diversity to the phase retrieval problem,which is even more important than in the 2D case on account of the increased ambiguity of 1Dphase retrieval [34]. The beam at 1 mm downstream of the focal plane, where the structure isplaced, was computed from the beam at focus using angular spectrum and is shown in Fig. 8(b).Figure 8(c) shows the phase of the 196 nm wide (10 pixels) phase structure. This structure wastranslated by 81.8 nm (4.67 pixel) to 25 positions along the x-axis. The intensity was measuredby a 1024× 1024 detector array with 40 µm pixel pitch located at 7.37 m downstream thetranslating structure.
The field at the detector plane was computed, from the field shown in Fig. 8(b), using thenumerical propagation approach for cylindrical wavefronts described in Appendix A. The in-tensity pattern at the detector plane, for one position of the translating structure, is shown inFig. 9(a). Notice the very different range in the x and y directions and that the beam verticalextent is still close to the original 150 µm. The simulated measurement, shown in Fig. 9(b),was obtained after integrating the beam intensity over 40 µm square detector pixels. The fieldintensity along the vertical direction was severely undersampled and only covered about 5 pix-els. Poisson-distributed noise was added to the intensity patterns after normalizing them to atotal of 2.25×10¹⁰ photons. This corresponds to an incident flux on the cylindrical lens of 106
photons/µm2/s with 1 second exposure per intensity pattern.The fact that the intensity pattern is severely undersampled in the y direction will make
difficult the retrieval of the 2D field. Instead we can integrate the measured intensity over they direction and attempt retrieval of a projection of the field, which is a function of x. Theintegrated intensity along the y direction for the pattern shown in Fig. 9(b) is shown in Fig. 9(c).
Since propagation and projection are both integrals, we can show by changing the order of
#105592 - $15.00 USD Received 19 Dec 2008; revised 29 Jan 2009; accepted 6 Feb 2009; published 10 Feb 2009
(C) 2009 OSA 16 February 2009 / Vol. 17, No. 4 / OPTICS EXPRESS 2680

Fig. 8. Square-root of beam amplitude (a) at the nominal focus and (b) 1 mm downstream(plane of the translating structure). Line plots show horizontal and vertical cuts throughthe x-ray beam through the origin. (c) Phase of 1D binary phase-shifting structure, havingunity transmissivity and phase values of 0 and π radians.
integration that∫
uout(x,y)dy =∫
Px,y {uin;z}dy = Px
{∫uin(x′,y′)dy′;z
}, (3)
where Px,y{·} is the 2D Fresnel diffraction propagation integral, given in Eq. (A1), and Px{·}is its 1D counterpart. Equation (3) shows that the projection of an arbitrary beam along a Carte-sian coordinate follows the paraxial propagation rule of a 1D beam.
Although this result seems promising for using phase retrieval to characterize 1D foci, thereis a model mismatch problem. Because the beam projection follows paraxial propagation rules,when solving the 1D phase retrieval problem we implicitly assume we have a measurementof the intensity of the beam projection, i.e. |∫ u(x,y)dy|2, but the quantity we measure is theprojection of the intensity, i.e.
∫ |u(x,y)|2dy. However, if the fluctuations of the field along the ydirection are not large compared to the mean, the projection of the intensity gives a reasonablygood estimate of the intensity of the field projection. This mismatch makes the use of diversemeasurements even more critical for the 1D focus measurement. The implicit assumption ofa 1D field also restricts the translating structure to be a 1D function, hence the choice of aphase-shifting structure that is constant along the y direction.
The initial guess was assumed to be a 1D field focused by a perfect cylindrical lens with 150µm aperture and 10 cm focal length, shown in Fig. 10(a) (dashed curve). No defocusing wasadded to the initial estimate to account for the fact that the distance from the focal plane to theplane of the translating structure may not be known.
For reconstruction we used a 1D version of the nonlinear optimization algorithm used tosolve the phase retrieval problem with transverse translation diversity [27]. The amplitude of theprojection of the true x-ray beam (at the position of the translating structure) and the amplitudeof the reconstruction, after 55 iterations of the nonlinear optimization algorithm, are plottedin Fig. 10(a) (solid curve and points, respectively), showing very good agreement. The errorbetween the reconstruction and the projection of the true x-ray beam is E = 0.117.
Because we reconstructed the phase and amplitude of the beam projection and because pro-jections follow 1D propagation rules, we are able to numerically refocus the 1D reconstruction.After removing the extra quadratic phase factor, we searched for the propagation distance thatmaximized the beam sharpness (sum of the intensity squared) using a single parameter search
#105592 - $15.00 USD Received 19 Dec 2008; revised 29 Jan 2009; accepted 6 Feb 2009; published 10 Feb 2009
(C) 2009 OSA 16 February 2009 / Vol. 17, No. 4 / OPTICS EXPRESS 2681

Fig. 9. (a) Beam intensity at measurement plane. (b) After including the effect of integrationdue to finite pixel size (notice the very pronounced sampling effect along the y direction).(c) Result of integrating the intensity measurement in (b) along the undersampled direction.Multimedia file (Media 3) shows the 25 intensity patterns at the detector plane and theintegrated measurements used for 1D phase retrieval. Amplitude to the 0.5 power is shownin (a) and (b) and to the 0.75 power in (Media 3).
Fig. 10. (a) Initial estimate for reconstruction (dashed line). Projection of the true fieldat the position of the translating structure (solid curve) and 1D reconstruction (points). (b)Amplitude of the true beam projection at 2 µm downstream the nominal focus (solid curve)and the numerically refocused reconstruction (points).
algorithm. The maximum sharpness for the reconstruction was found at 2 µm downstream thenominal focus. Figure 10(b) shows the amplitude of the projection of the true beam (solid line)and the reconstructed beam (points) at this position. The recovered projected beam at focus isin very good agreement with the true beam projection.
4. Conclusions
We developed and demonstrated, through numerical simulations, a technique for accurate andreliable x-ray beam characterization using phase retrieval with transverse translation diversity,
#105592 - $15.00 USD Received 19 Dec 2008; revised 29 Jan 2009; accepted 6 Feb 2009; published 10 Feb 2009
(C) 2009 OSA 16 February 2009 / Vol. 17, No. 4 / OPTICS EXPRESS 2682

with an algorithm originally developed for coherent lensless imaging [27]. Diversity in thiscase is introduced by transversely displacing a known structure in the path of the beam andrecording the intensity of the diffraction pattern in the far field. The structure may be an am-plitude structure (e.g. a pinhole, as suggested in [28]), but a thinner phase structure is likelyto be preferred if the finite beam extent provides a suitable intensity sampling at the plane ofthe detector. This form of diversity allows for robust reconstructions even for the more difficultproblem of 1D phase retrieval. Furthermore, this approach allows us to circumvent the needof a support constraint, which is especially important for x-ray beam characterization where asharp, well-defined support constraint might not be available.
Transverse translation diversity can also be used to increase the range of phase retrievalfor optical wavefront measurement and avoid the need for focus diversity [37]. Introducing amoveable aperture close to the lens increases the effective f-number of the system and allowsadequate sampling of the individual point-spread-functions. Focus diversity in this case is nolonger needed since the diversity is introduced by overlap of the moveable aperture at differentpositions. Because the measurements are taken close to focus, the reconstruction algorithmrequires a more general numerical propagation than the simple FT relation used in this paper.The gradients of an error metric for the more general propagation and under different fieldparameterizations are given in [37].
For x-ray beam characterization, using a phase, rather than an absorbing, structure allows theuse of structures that are thinner along the propagation direction, which will permit the char-acterization of beams with smaller depth of focus. We found that reconstructions are accurateeven beyond the transverse area overlapped by the translating structure.
Because for phase retrieval the resolution only depends on the largest scattering angle thatwe can collect with a moderately good signal-to-noise ratio, we can obtain significantly higherresolution than the transverse size of the translating structure and than the distance of the trans-lations. This technique is advantageous, especially for measuring x-ray beams with spot sizesof a few nanometers, compared with current fluorescent scanning techniques, which are limitedby the scanning precision and the size of the fluorescent structure. Furthermore, this approachpromises to significantly reduce alignment requirements because the translating structure doesnot need to be placed at the beam focus, and we have shown that the longitudinal distance tothe best focus position can be easily estimated. Allowing the structure to be positioned outsideof the focal region allows for using a translating structure that is significantly larger than thebeam focus spot and easier to manufacture.
We have also shown how this approach can be used to characterize 1D focus spots. Becausefor hard x-rays a 2D focus may be achieved with two crossed cylindrical lenses, being able tocharacterize the line focus of a single cylindrical lens is important for assessing the performanceof the individual lenses. In our simulations we successfully retrieved a 1D projection of thebeam at focus. Because for this reconstruction there is an implicit assumption of a 1D beam,best results are obtained for a structure that can be well approximated by a 1D function.
Transverse translation diversity, along with the nonlinear optimization reconstruction algo-rithm, were found to make phase retrieval robust, especially for the typically ill-posed 1D phaseretrieval problem. For the reconstructions shown in this paper we did not use any assumptionabout the support or field distribution at the plane of the lens. Unlike the PIE and difference-mapalgorithms, the error metric for the nonlinear optimization algorithm can only decrease fromone iteration to the next. The likelihood of stagnation of the algorithm is greatly reduced throughthe diverse measurements. Thus a stopping criterion (tolerance) can be straightforwardly im-plemented, and we avoid the need of averaging reconstructions from subsequent iterations [28].
In our simulations we assumed accurate knowledge of the translating structure and its dis-placements. However, any experimental scenario will have uncertainty in the characterization
#105592 - $15.00 USD Received 19 Dec 2008; revised 29 Jan 2009; accepted 6 Feb 2009; published 10 Feb 2009
(C) 2009 OSA 16 February 2009 / Vol. 17, No. 4 / OPTICS EXPRESS 2683

of these parameters. It has been shown that reconstruction artifacts can arise even for errorsin the translation that are on the order of the final resolution of the reconstruction [27]. Weexpect that, as in [27], the nonlinear optimization algorithm can be used to refine the estimateof the structure transmissivity and its translations, while reconstructing the beam, thus furtherreducing the experimental requirements. Furthermore, a nonlinear optimization algorithm canaccount for further experiment details in the forward model. This allows inclusion of (and op-timization over) different additive and multiplicative bias in the measurements, effects of pixelsize, reduced transverse coherence, detector and sample drift, misalignments and jitter, withoutthe need to preprocess the measured data [37, 38].
The techniques described in this paper are directly applicable for characterizing beams atother wavelengths, e.g., extreme ultraviolet or optical.
Portions of this research were presented at [39]. We are thankful to Kenneth Evans-Lutterodt(Brookhaven National Laboratory) for helpful discussions.
Appendix A: Propagation of cylindrical wavefronts
In this section we outline a numerically efficient approach for simulating the paraxial propaga-tion of scalar cylindrical wavefronts, which are important for focusing x-ray beams.
Within the paraxial approximation, a field after propagation by a distance z can be computedby the Fresnel diffraction integral [3],
uout(x,y) = Px,y {uin;z}=1
iλ zexp
[ik2z
(x2 + y2)
]
×∫∫
uin(x′,y′)exp[
ik2z
(x′2 + y′2
)]exp
[− i2π
λ z
(xx′+ yy′
)]dx′ dy′, (A1)
where we have dropped the exp(ikz) factor, λ is the illumination wavelength, k is the wavenum-ber, and uin and uout are the fields before and after propagation, respectively. Notice thatEq. (A1) is in the form of a 2D FT. To efficiently compute Eq. (A1) one must seek a representa-tion that does not require sampling of a large quadratic phase, because this can greatly increasethe number of points required to avoid aliasing. It is also convenient to carry the quadratic phaseoutside of the integral analytically.
If the phase of uin can be sampled by a reasonable number of points (is not a strongly con-verging or diverging field) and we propagate a large distance z, then the propagation can becomputed by a single 2D FFT as expressed in Eq. (A1). When using the FFT, the output sam-pling will be ∆x = λ z/(N∆x′), where N ×N is the size of the computational array, and ∆x′and ∆x are the sample spacings at the input and output planes, respectively. However, if thepropagation distance is small, sampling the quadratic phase kernel in Eq. (A1) may become anissue. In that case computing the propagation in Fourier domain by a two-step transfer functionapproach [3] (paraxial angular spectrum) is preferable,
uout(x,y) = F−1( fx, fy)→(x,y)
{exp
[−iπλ z( f 2x + f 2
y )]F(x′,y′)→( fx, fy)
{uin(x′,y′)
}}, (A2)
where the 2D FT is given by
F(x,y)→( fx, fy) {u(x,y)}=∫∫
u(x,y)exp [−i2π(x fx + y fy)]dx dy . (A3)
This approach preserves the input sampling.If, on the other hand, uin is a focusing field, we can avoid sampling of the large spherical
wavefront component by using a single FT computation if uout needs to be computed close to
#105592 - $15.00 USD Received 19 Dec 2008; revised 29 Jan 2009; accepted 6 Feb 2009; published 10 Feb 2009
(C) 2009 OSA 16 February 2009 / Vol. 17, No. 4 / OPTICS EXPRESS 2684
the beam nominal focus. The quadratic factor on the field will then nearly cancel the quadratickernel of the Fresnel integral, and the output sampling will be given by ∆x = λ z/(N∆x′). Forcases where the focusing field needs to be propagated far from the nominal focus (either closeto the original field or on the opposite side of focus) a two step approach is more convenient,propagating the field to the nominal focus and then to the plane of interest. For this case therelation of output and input sampling is ∆x = |z f − z|∆x′/z f , where z f is the distance from uinto the nominal focus and z is the distance from uin to uout .
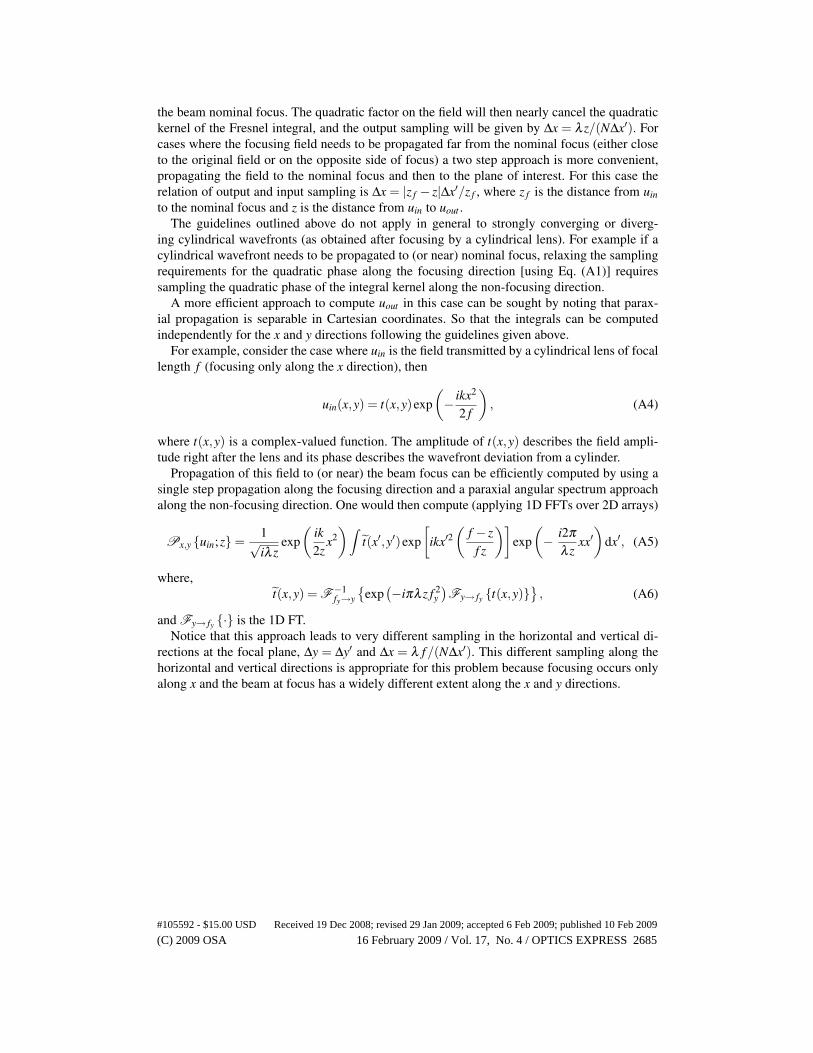
The guidelines outlined above do not apply in general to strongly converging or diverg-ing cylindrical wavefronts (as obtained after focusing by a cylindrical lens). For example if acylindrical wavefront needs to be propagated to (or near) nominal focus, relaxing the samplingrequirements for the quadratic phase along the focusing direction [using Eq. (A1)] requiressampling the quadratic phase of the integral kernel along the non-focusing direction.
A more efficient approach to compute uout in this case can be sought by noting that parax-ial propagation is separable in Cartesian coordinates. So that the integrals can be computedindependently for the x and y directions following the guidelines given above.
For example, consider the case where uin is the field transmitted by a cylindrical lens of focallength f (focusing only along the x direction), then
uin(x,y) = t(x,y)exp(− ikx2
2 f
), (A4)
where t(x,y) is a complex-valued function. The amplitude of t(x,y) describes the field ampli-tude right after the lens and its phase describes the wavefront deviation from a cylinder.
Propagation of this field to (or near) the beam focus can be efficiently computed by using asingle step propagation along the focusing direction and a paraxial angular spectrum approachalong the non-focusing direction. One would then compute (applying 1D FFTs over 2D arrays)
Px,y {uin;z}=1√iλ z
exp(
ik2z
x2)∫
t(x′,y′)exp[
ikx′2(
f − zf z
)]exp
(− i2π
λ zxx′
)dx′, (A5)
where,t(x,y) = F−1
fy→y
{exp
(−iπλ z f 2y)Fy→ fy {t(x,y)}
}, (A6)
and Fy→ fy {·} is the 1D FT.Notice that this approach leads to very different sampling in the horizontal and vertical di-
rections at the focal plane, ∆y = ∆y′ and ∆x = λ f/(N∆x′). This different sampling along thehorizontal and vertical directions is appropriate for this problem because focusing occurs onlyalong x and the beam at focus has a widely different extent along the x and y directions.
#105592 - $15.00 USD Received 19 Dec 2008; revised 29 Jan 2009; accepted 6 Feb 2009; published 10 Feb 2009
(C) 2009 OSA 16 February 2009 / Vol. 17, No. 4 / OPTICS EXPRESS 2685