measurement of customer based brand equity for shampoo...
TRANSCRIPT
MEASUREMENT OF CUSTOMER BASED BRAND EQUITY FOR SHAMPOO PRODUCTS IN JAKARTA
THESIS
RESEARCH PROJECT
by
Chandni
(1201001012)
08THE
BINUS INTERNATIONAL
BINUS UNIVERSITY
JAKARTA
2012
i
MEASUREMENT OF CUSTOMER BASED BRAND EQUITY FOR SHAMPOO PRODUCTS IN JAKARTA
THESIS
Proposed as a requirement for obtaining
Sarjana degree at
Marketing Program
Education Level Strata‐1 (Sarjana/Bachelor)
by
Chandni
(1201001012)
08THE
BINUS INTERNATIONAL
BINUS UNIVERSITY
JAKARTA
2012
ii
MEASUREMENT OF CUSTOMER BASED BRAND EQUITY FOR SHAMPOO PRODUCTS IN JAKARTA
THESIS
Prepared by:
Chandni
1201001012
Approved by:
Supervisor
Anita Michiko Tamala
D4022
BINUS UNIVERSITY
JAKARTA
2012
BINUS INTERNATIONAL
BINUS UNIVERSITY
iii
Statement for readiness in attending Thesis Defense examination
I, Chandni
Hereby state that the thesis entitled:
The measurement of customer based brand equity for fast moving consumer goods
in Jakarta.
is truly my original work and is never brought up as a scientific paper, partly or
entirely, on my name or other parties
Chandni
[1201001012]
Supervisor’s approval
I approve this thesis to be in Defense examination
Anita Michiko Tamala 11 June 2012
Supervisor
iv
ACKNOWLEDGEMENT
This paper was written with guidance of the Lord in which the author wishes the glory
and thanks for the Lord for the completion the study.
The author then would like to thank the following people who have been very
Significant.
1. Kishore Nanwani and Roshni Nanwani, the parents of the author who
have been giving undying support and prays to the author in times of happiness and
in times of trouble. The immense love and support will always be very much loved
until the end of times.
2. Mandeep Nanwani author’s brother. With his support and prayers which have guide
the author in many ways that he may or may not realise, have given the author the
motivation to do good and always trying to be better.
3. Anita Michiko Tamala, MBA the author supervisor, that have given hard work and
efforts to complete the thesis on time. Thank you for devoting so much time, providing
guidance and advice,understanding and patience. Thank you for the lesson of a lifetime
that have given the author knowledge, value, and experience during this past short
semester.
4. The author’s lecturers during the years of study in Binus International, namely
Ms. Evi Rinawati Simanjuntak, MM , Dominique Razafindrambinina, Ms. Rini
Setiowati,SE.,MBA, Ms Lidia M.Iswara ,MBA who has been teaching the author and
awarding the best result that the author could get in thesis; For all the authors lecturers
v
who has been giving insights and advices. Thank you very much for the patience support
and guidance too
5. The SAR management, Miss Roosalina Wulandari, Mr. Ari Margiono, and Ms Yuana
Mardhiana who has always supported the author in the university journey. Thank you
for building myself as how I am today.
6. The author’s best friends Nikita Durgani and Taruna Tarachandani that have given
endless support and guidance with a memorable campus life.
7. The author’s close friends Esha Khiani, Florida Wong, Roshni Bedi, Sanjay
Vasandani, Dinesh Punjabi, Prashant Gindwani Sonya Karaskalau, Aarti Budhrani,
Sharon Tanamas who have always been around regardless in laughs or in tears literally.
7. All Binusians from all batches who have been very supportive, namely Janet Agustin
Gozali, Cherisha Lidia, Raina, Monika Dwi, Audrrey Nur Safira, Toar Gemilang
Manembu, Aldy Destio Sanjaya, Divya Topandasani, Cynthia Wardhani, Wisnu
Wardhana, Vincentia, Eric Lemuel, Brian Chuang, Cassandra Etania, Mohit Khiani,
Ravina Alimchandani, Haykal Kamil, Jessica Durgani and all the 2012 batch which the
author did not manage to put here.
8. Last but not the least to all the respondents who have been very generous to be
Surveyed.
ii
BINUS UNIVERSITY INTERNATIONAL BINUS UNIVERSITY
___________________________________________________________________
Marketing Major
Sarjana Ekonomi Thesis Even Semester year 2012
The measurement of customer based brand equity
for shampoo products in Jakarta
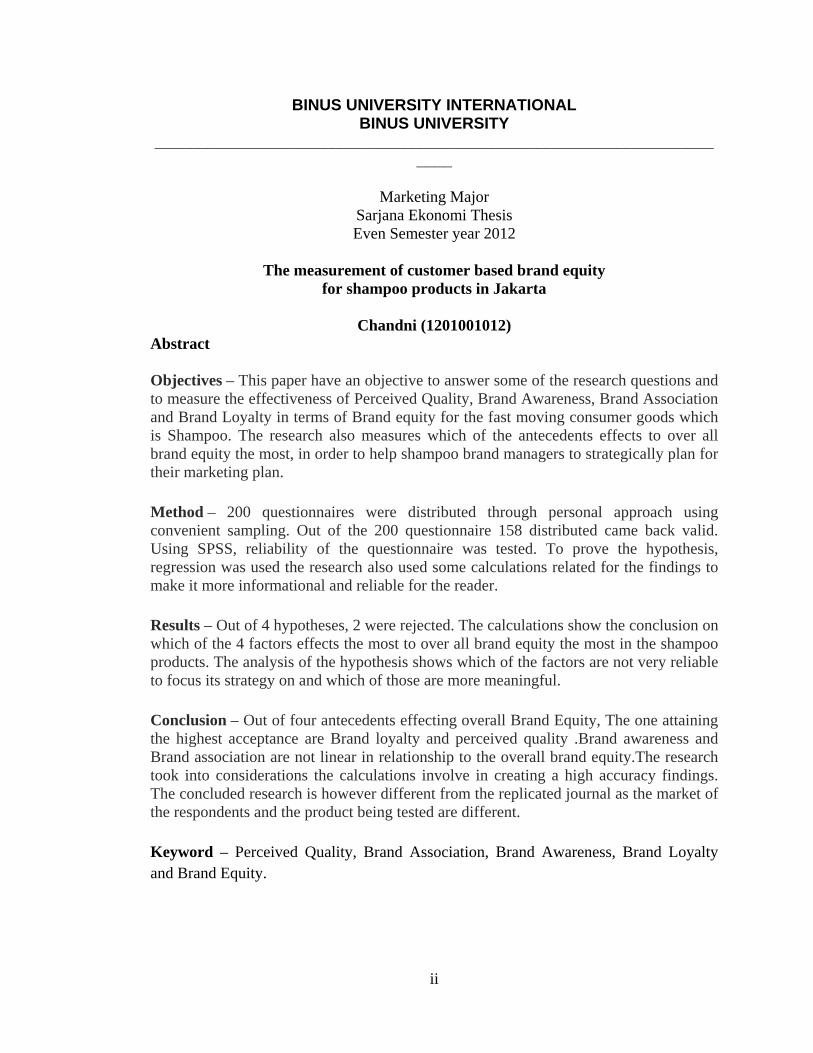
Chandni (1201001012) Abstract Objectives – This paper have an objective to answer some of the research questions and to measure the effectiveness of Perceived Quality, Brand Awareness, Brand Association and Brand Loyalty in terms of Brand equity for the fast moving consumer goods which is Shampoo. The research also measures which of the antecedents effects to over all brand equity the most, in order to help shampoo brand managers to strategically plan for their marketing plan.
Method – 200 questionnaires were distributed through personal approach using convenient sampling. Out of the 200 questionnaire 158 distributed came back valid. Using SPSS, reliability of the questionnaire was tested. To prove the hypothesis, regression was used the research also used some calculations related for the findings to make it more informational and reliable for the reader.
Results – Out of 4 hypotheses, 2 were rejected. The calculations show the conclusion on which of the 4 factors effects the most to over all brand equity the most in the shampoo products. The analysis of the hypothesis shows which of the factors are not very reliable to focus its strategy on and which of those are more meaningful.
Conclusion – Out of four antecedents effecting overall Brand Equity, The one attaining the highest acceptance are Brand loyalty and perceived quality .Brand awareness and Brand association are not linear in relationship to the overall brand equity.The research took into considerations the calculations involve in creating a high accuracy findings. The concluded research is however different from the replicated journal as the market of the respondents and the product being tested are different.
Keyword – Perceived Quality, Brand Association, Brand Awareness, Brand Loyalty and Brand Equity.
iii
Table of Contents Cover
Title Page.............................................................................. Error! Bookmark not defined.
Cerificate of Approval ......................................................... Error! Bookmark not defined.i
Acknowledgement...…………………………………………………………………….iv
Abstract…………...………………………..…………………………………………..vi
Table of contents…………………………..………………………………………..…vii
Table of Tables ................................................................. viiError! Bookmark not defined.
Table of Figures ................................................................. Error! Bookmark not defined.x
CHAPTER I
INTRODUCTION ............................................................................................................ 1
1.1 Background ............................................................................................................. 1
1.1.1 FMCG industry overview ................................................................................ 5
1.3 Scope ..................................................................................................................... 11
1.4 Aims and benefits .................................................................................................. 12
1.5 Research Questions ............................................................................................... 13
1.6 Structure ............................................................................................................... 13
CHAPTER II
LITERATURE REVIEW .............................................................................................. 15
2.1 Importance of Brand equity................................................................................... 15
2. 2 Perceived quality .................................................................................................. 17
2.3 Brand Awareness................................................................................................... 18
2.4 Brand Association ................................................................................................. 19
2.6 Conceptual framework .......................................................................................... 20
2.6.1 Perceived quality has a significant positive direct effect on brand equity ..... 21
2.6.2 Brand awareness has a significant positive direct effect on brand equity ...... 22
2.6.3 Brand association has a significant positive direct effect on brand equity .... 23
2.6.4 Brand loyalty has a significant positive direct effect on brand equity ........... 24
iv
CHAPTER III
RESEARCH METHODOLOGY ................................................................................. 25
3.1 Research Objectives .............................................................................................. 25
3.1.1 Research Questions ........................................................................................ 26
3.1.3 Scope .............................................................................................................. 26
3.2 Research Design .................................................................................................... 27
3.2.1 Data collection Method .................................................................................. 29
3.2.2 Questionnaire development ............................................................................ 31
3.2.3 Scaling technique ........................................................................................... 32
3.2.4 Hypotheses ..................................................................................................... 33
3.3 Data Analysis Method ........................................................................................... 34
3.3.1 Original research statistical analysis .............................................................. 35
3.3.2 Current research analysis ............................................................................... 36
3.3.3 Reliability testing ........................................................................................... 37
3.3.4 Validity testing ............................................................................................... 37
3.3.5 Linear regressions ( Multiple Regression) ..................................................... 37
3.3.7 Sampling Method ........................................................................................... 38
CHAPTER IV
RESULTS AND FINDINGS ......................................................................................... 43
4.1 Exploratory Study ................................................................................................. 44
4.2 Pre test Analysis .................................................................................................... 45
4.2.1 Reliability ....................................................................................................... 45
4.2.1 Validity ........................................................................................................... 47
4.3 Research Analysis ................................................................................................. 58
4.3.1 Correlations .................................................................................................... 58
4.3.2 Regression ...................................................................................................... 64
4.3.3 Multiple Regressions ...................................................................................... 65
Variable interpretation............................................................................................. 67
H2 Brand Association is directly affected to brand equity ..................................... 68
4.4 Demographic Information of Respondents ........................................................... 71
v
4.4.1 Survey results ................................................................................................. 71
4.5 Cross Tabulation ................................................................................................... 78
CHAPTER V
CONCLUSION AND RECOMMENDATION ........................................................... 81
5.1 Conclusion ............................................................................................................. 81
5.2 Managerial Implications:....................................................................................... 85
(A) Perceived Quality.............................................................................................. 85
(B) Brand Awareness .............................................................................................. 86
(C) Brand Association ............................................................................................. 87
(D) Brand Loyalty ................................................................................................... 88
5.3 Limitations of the research .................................................................................... 97
5.4 Recommendations for future research ................................................................... 90
BIBLIOGRAPHY .......................................................................................................... 94
APPENDICES .............................................................................................................. 102
Appendix A: Questionnairre ....................................................................................... 94
vi
List of Tables
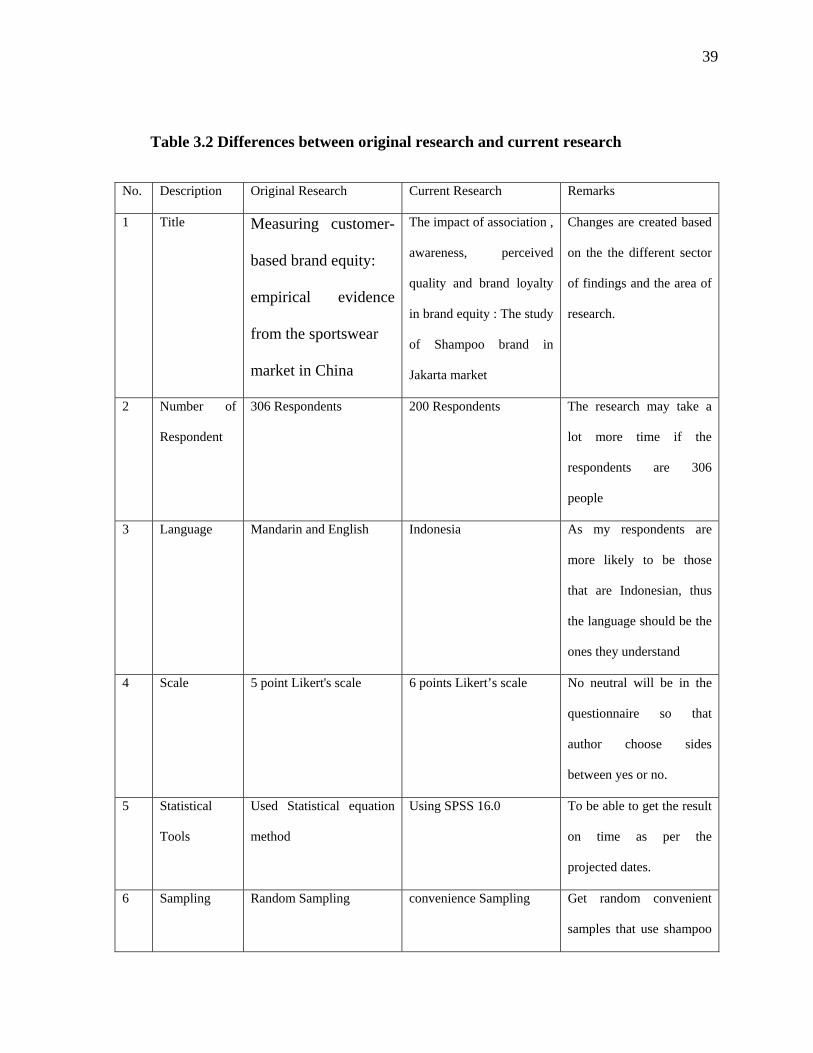
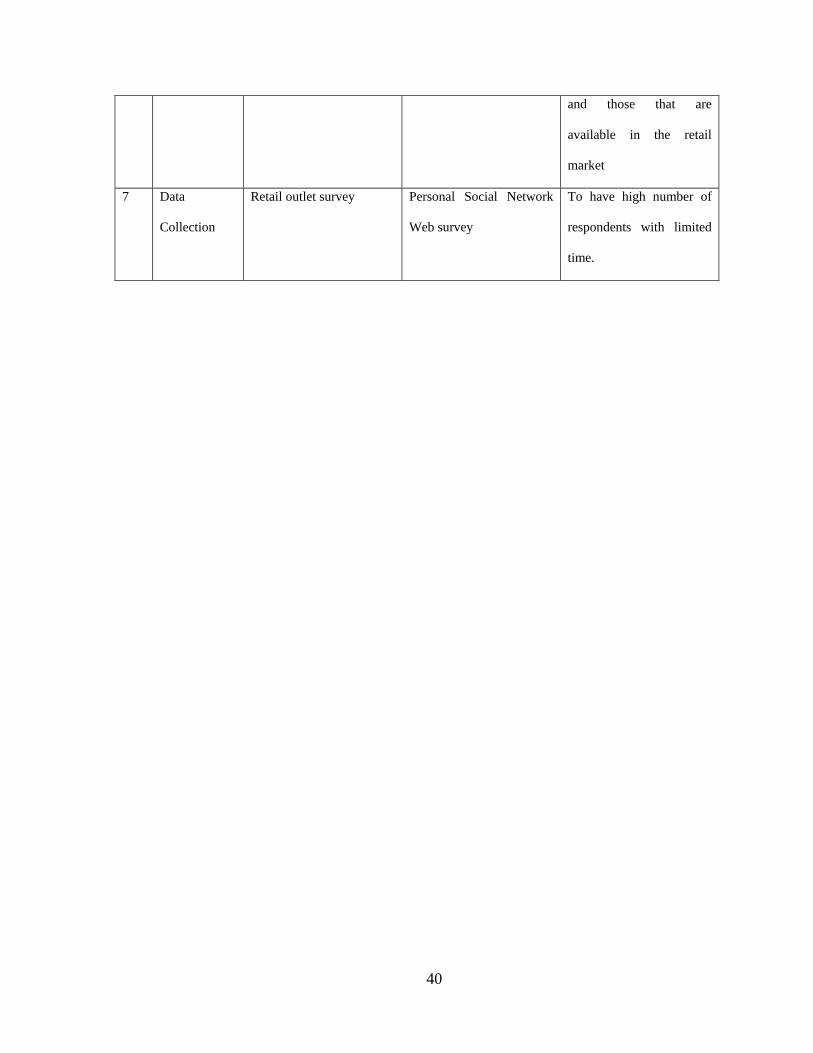
Table 3.2 Differences between original and current research……………………….….39
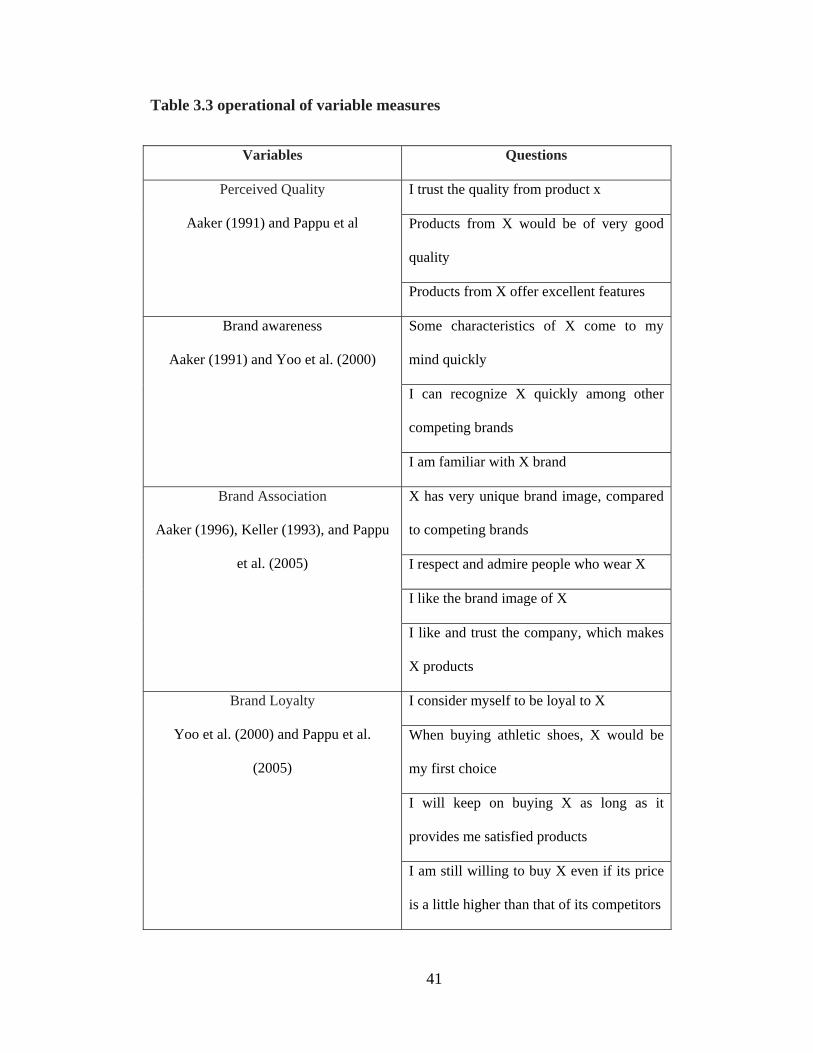
Table 3.3Operational of variable measures……………………………………………..41
Table4.1Reliability test…………………………………………………………………45
Table 4.2 Confirmatory Factor analysis
Table 4.2.1 Perceived Quality…………………………………………………..47
Table 4.2.2 Brand Awareness.. ………………………………………...………49
Table 4.2.3 Brand Association………………………………………………….51
Table 4.2.4 Brand Loyalty………………………………...……………………53
Table 4.2.5 Brand Equity……………………………..…...……………………55
Table 4.3 Pearson Correlations
Table 4.3.1 Perceived Quality…………………………………………………..58
Table 4.3.2 Brand Awareness...……………………………………………...…59
Table 4.3.3 Brand Association………………………………………………….60
Table 4.3.4 Brand Loyalty……………………………………………………...61
Table 4.3.5 Brand Equity………………………………..……………………...62
Table 4.4 Regression Output……………………………………………………………64
Table 4.5 Multiple Regression Output ……………………………...………………….69
Table 4,5 Cross Tabulation……………………………………………………………..72
Table 4.5.1 Gender with Brand Equity…………………………………………77
Table 4.5.2 Education with Brand Equity………………………………………79
vii
List of Figures
Figure 1.1 Increase in people concern for appearance…………………………….……..3
Figure 1.2 Most used Shampoo Brands (30 respondents survey)……...………..………4
Figure 1.3 FMCG in Indonesia…………………………...……………………………...6
Figure 1.4 Number of shampoo use and available in the market………………………...7
Figure 1.5 Dove sales volume………………………………………………………..…..8
Figure 2.1 Power of Brand……………………………………………………………...14
Figure 2.2 Research Model………………………………...…………………………...24
Figure 3.2 Current research model……………………………………………………...29
Figure 4.1 Exploratory Research…………………………………………………….….39
Figure 4.2 Demographic factors………………………………………………………...64
Figure 4.2.1 Gender……………………………………………………………..64
Figure 4.2.1 Age………………………………………………………………...65
Figure 4.2.1 Education……………………………………………………..…...66
Figure 4.2.1 Occupation………………………………………………………...67
Figure 4.2.1 Monthly expense…………………………………………………..68
Figure 4.2.1 Longtime to choose shampoo……………………………………..69
Figure 4.2.1 Most used shampoo brands ……………………………………….70

0
1
CHAPTER I
INTRODUCTION
1.1 Background
This research is a replication of the original journal by Xiao Tong and Jana M. Hawley
titled “Measuring customer-based brand equity: empirical evidence from the sportswear
market in China” (2009). The current research is titled “The measurement of customer
based brand equity for shampoo products in Jakarta”
Brand equity is defined as the added value endowed by the brand name (Farquhar et al.,
1991). Brand equity is the difference between overall brand preference and
multiattributed preference based on objectively measured attribute levels (Park and
Srinivasan, 1994).
Nowadays, the world is becoming a very competitive place to live in. Not only
competition among people themselves, but businesses, products as well as services are
also struggling to survive. With the development of businesses, people all over the world
are exposed to various brands in their daily life. Brand is a set of perceptions and images
that represents a company, product or service. A brand is the essence or promise of what
will be delivered or experienced (www.persuasivebrands.com). Therefore, a brand is a
vital asset to any company. Building brand loyalty and brand equity is essential in order
to endure the competition. There are several factors that may have an impact towards
brand equity. These factors are called antecedents of brand equity that consists of the
brand awareness, brand association, the perceived quality of the brand as well as the
brand loyalty. In order to evaluate the value of the brand equity, it needs to be
2
communicated to the consumers. Advertising is known to be the most common way of
communicating a brand to mass target and hopefully lead to increasing the brand
awareness.
Advertisement such as; Television, Magazines, Radio, Internet, Billboards, etc. People
are bombarded daily with different brands, therefore it is a big challenge for every
company to have their products being recorded in the consumers’ “Top of Mind” or
Brand Salience.
Upon achieving the brand salience, a company can ensure that they have succeeded
among the market competition.
Factors that constitute the brand equity cause a positive brand name in the eye of its
consumers.
In order to know the five most used brands that will be taken in to account in the
questionnaire, the author has conducted an exploratory survey, of 30 respondents to
identify the 5 most purchased shampoo that are mostly used by people in Jakarta. The
research was done through sending a broadcast message from the people in the author’s
blackberry contact. The question was sent through BBM as an informal message that
asked each 30 respondents about the shampoo that they are currently using.
From the survey it is shown that the top five most used brands are highly purchased are :
Sunsilk, Dove, Clear and Head shoulder followed with Pantene attaining the last rank
3
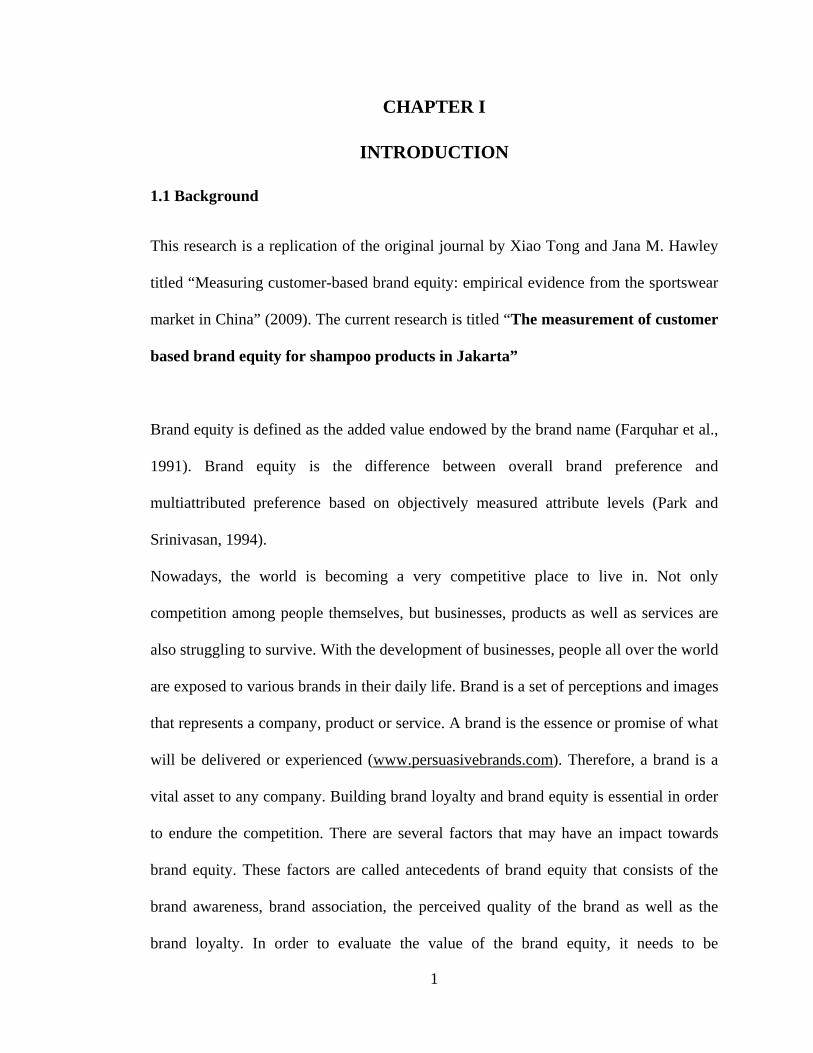
Figure 1.1 – Increase in people concern for appearances
Source - http://flowingdata.com/2012/02/24/changing-face-of-plastic-surgery/
With a high rise of people trying to look good and do many kind of activities, thus this
research will focus on shampoo products that is supposedly of low involvement products
as it is purchased on a routine basis,but at the same time become important for many
people and is regarded as an important decision when it is to be purchased as it has a
high impact for the customer’s appearances.
4
Thus, the research of measuring brand equity for shampoo brands can be used in this
research as brands for the product shampoo are cluttered.With promising tag lines and
assurance to their customer is created to set the best equity to it’s brand. Through this
research the author will show on the focus of the antecedents when building brand
equity for shampoo brand based on the antecedents.
In addition the reason why the author initiated this topic for the findings is because of
the cluttered brands that are now seen everywhere in everyday life. There are already too
many brands promoting the same functions that are why shampoo brands need to
establish a strong overall brand equity in order to survive in the competition. Brands
compete with one another to create high value and thus measurement in creating brand
equity become very important especially in FMCG products.
5
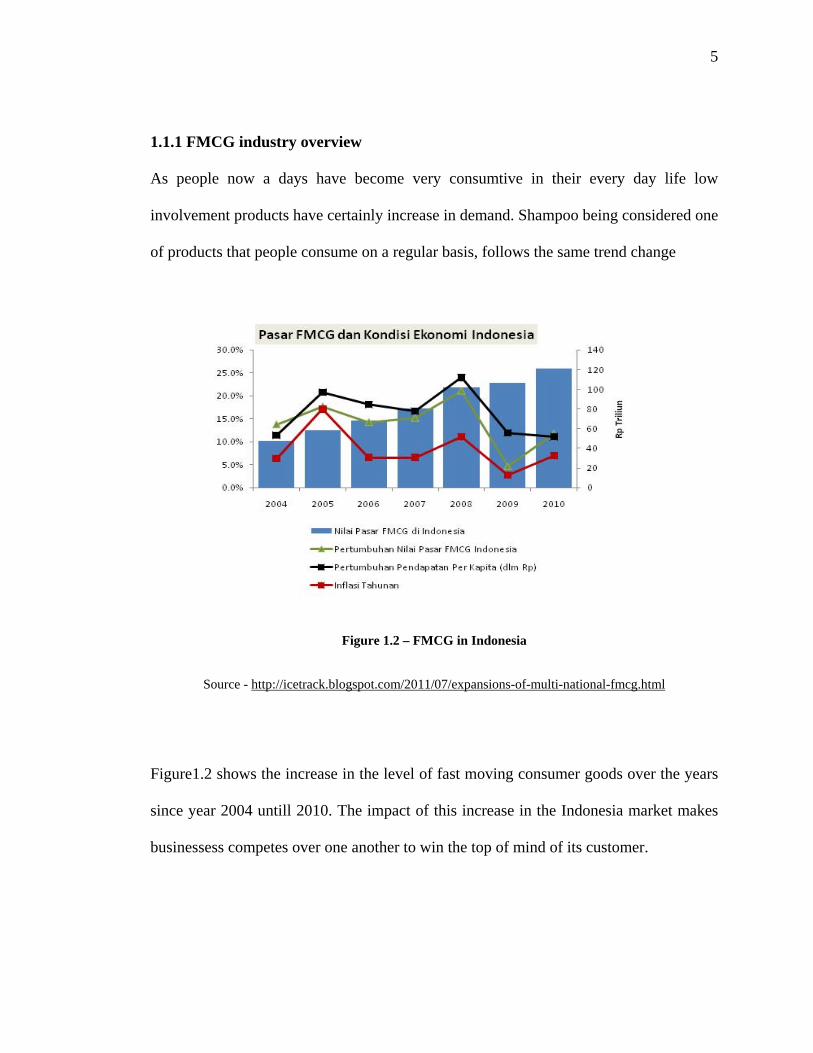
1.1.1 FMCG industry overview
As people now a days have become very consumtive in their every day life low
involvement products have certainly increase in demand. Shampoo being considered one
of products that people consume on a regular basis, follows the same trend change
Figure 1.2 – FMCG in Indonesia
Source - http://icetrack.blogspot.com/2011/07/expansions-of-multi-national-fmcg.html
Figure1.2 shows the increase in the level of fast moving consumer goods over the years
since year 2004 untill 2010. The impact of this increase in the Indonesia market makes
businessess competes over one another to win the top of mind of its customer.
6
As these FMCG products are easily acquired in many places such as the grocery
vendor,minimarket, supermarket and hypermarket people will buy it most of the time
when they are in need especially products like shampoo. Thus, brand equity is important
for this FMCG products to be developed in these competetive market as today and
consumer need to understand the value of the products that they are purchasing.
Shampoo which is in the category of the fast moving consumer goods are very critical in
purchase as different people have different belief over the brand they select. There is a
tendency people switching their brands of shampoo products that they are currentl;y
using ith other competing brands when they are exposed to the different variety of
shampoos having different prominence.
7
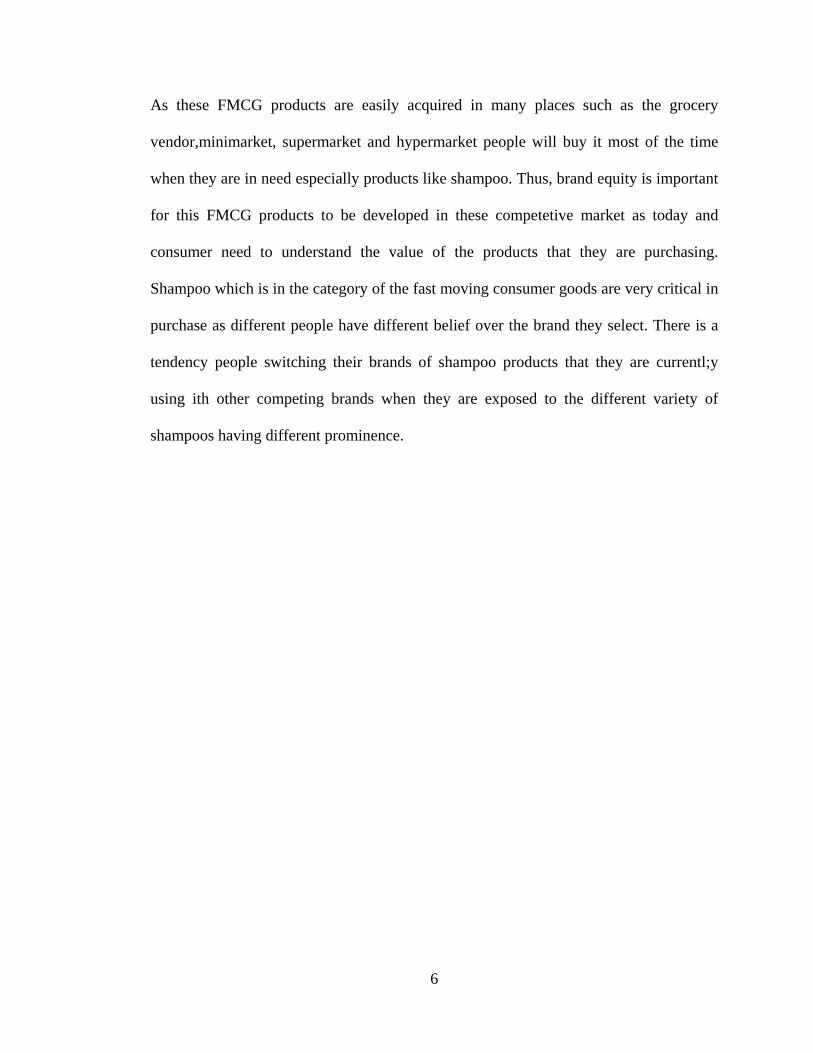
Figure 1.3 - Number of shampoo used frequently and available in the market.
http://www.carouselstrands.com/highlights/category/products/
Figure 1.3 shows the different number of brands that are available in the market and are
frequently bought by the consumers. Purchases of these products are very difficult if
brand equity is not placed in the mind of the consumer. When many products are
exposed to the customers there are chances that people may have forgotten on the
factors that build up these brand equity. Brand manager can therefore focus on every
antecedents effecting brand equity, if one fails the other three can support another.
8
There are many variety of shampoos that have different functions in assisting people
during selection. The variations are through its functions such as , for damaged hair, dry
hair, anti dandruff, etc, or even its essence which are herbal, menthol and so on so forth.
9
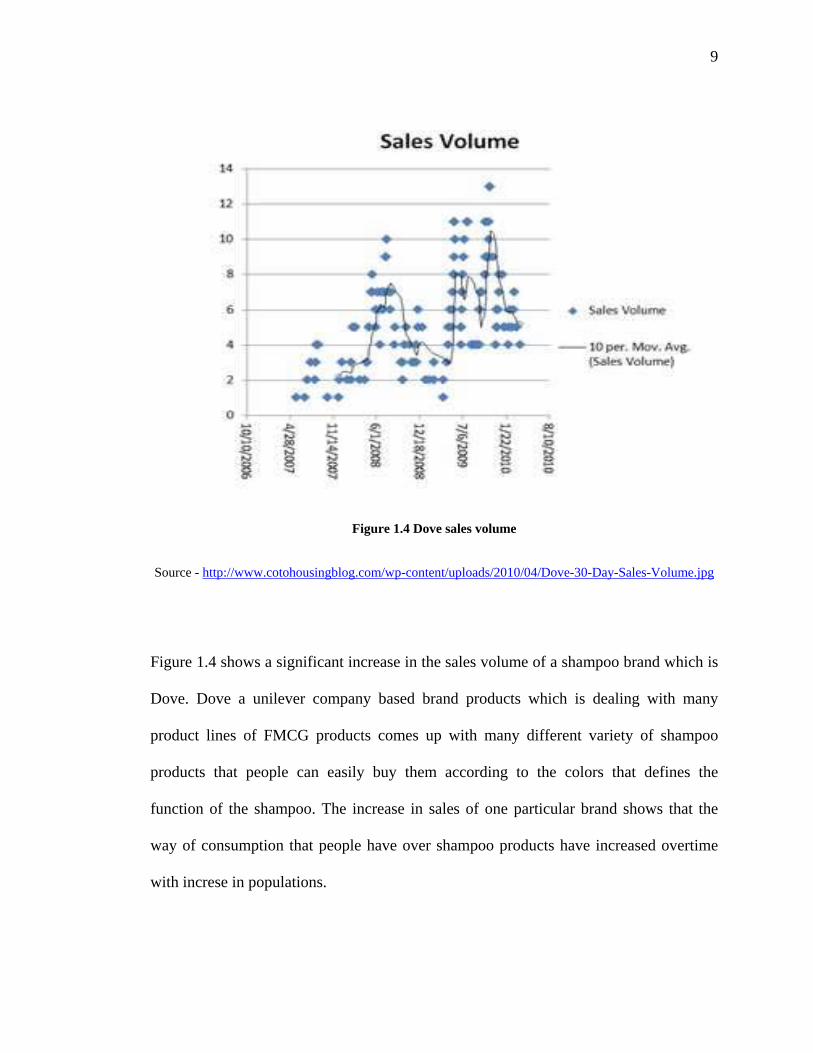
Figure 1.4 Dove sales volume
Source - http://www.cotohousingblog.com/wp-content/uploads/2010/04/Dove-30-Day-Sales-Volume.jpg
Figure 1.4 shows a significant increase in the sales volume of a shampoo brand which is
Dove. Dove a unilever company based brand products which is dealing with many
product lines of FMCG products comes up with many different variety of shampoo
products that people can easily buy them according to the colors that defines the
function of the shampoo. The increase in sales of one particular brand shows that the
way of consumption that people have over shampoo products have increased overtime
with increse in populations.
10
1.2 Problem Statement
Shampoo which is supposedly to be a low involvement product category of the FMCG
however has been given more involvement by some people as it concerns their
appearance. Almost everyone around the globe uses shampoo in their daily life, it is
essential to obtain consumers’ loyalty and assess the brand equity. With the numerous
brands of shampoo available, consumers are more likely to have more choices and this
may lead to a lower brand loyalty as well as the lower brand equity. Consumers tend to
change their shampoo brand frequently especially when they are exposed to active
advertisments.Due to the high competition and wide range of selection for shampoo
brands, it becomes crucial to know which antecedents effects the most towards its brand
equity.The main issue that the author proposes is to be aware of the factors which have a
high impact toward the brand equity of FMCG products especially shampoo. By
conducting this research the author will investigate on the measurement of Customer
based brand equity for shampoo in order to assess on which of the factors that is
perceived quality,brand awareness, brand association and brand loyalty have higher
effects to brand equity
11
1.3 Scope
This research identifies the factors that have an impact towards the brand equity. The
survey is conducted in the capital city of Indonesia that is Jakarta, in which the author
will use the population of Jakarta as representatives of Indonesia as a whole. The data
collection method used is in the form of paper based questionnaires targeted to 200
respondents. The questionnaires were distributed in places where FMCG products are
most familiar and mostly sold. Such as: stores, minimarts supermarkets and hypermarts
as well as retail places. The research did not take any specific age group. All age group
are welcomed as long as they are able to answer the necessary questions. The target
respondents are those who are able to make their own selections and purchased in order
to avoid bias of random selection.The type of questionnaire is considered to be
convenient sampling.
The questionnaire in this research will have a case wise deletion when there are
incomplete responses by the respondents.
12
1.4 Aims and benefits
Aims
- To examine all the factors influencing brand equity
- To have a better knowledge towards consumers purchasing behaviour of
shampoo products
- To have a better view on the product involvement of shampoo brands from the
consumer perspective.
- To assess the most influential antecedents of the over all brand equity.
Benefits
- Assist brand managers in building as well as maintaining of a particular product
or brand.
- To help marketers in FMCG industry plan their communication strategy in order
to have a high over all brand equity.
- From the company point of view it will help in ensuring them to maitain the
prominent results in order to built and maintained brand equity.
- To have a clear understanding towards the product involvement of FMCG
products.
13
1.5 Research Questions
The researcher will try to answer the following question to complete the findings.
RQ 1 : Does perceived quality have a significant positive direct effect on brand equity?
RQ 2 : Does brand awareness have a significant positive direct effect on brand equity?
RQ 3 : Does brand association have a significant positive direct effect on brand equity?
RQ 4 : Does brand loyalty has a significant positive direct effect on brand equity?
The research will show that whether the four antecedents that are brand awareness,
perceived quality, brand association and brand loyalty cause a positive effect to brand
equity.
1.6 Structure
The research will consist of 5 structures that will consist of 5 chapters with each chapter
explaining deeper about the research.
CHAPTER I: INTRODUCTION
This consist of the background of brand its importance and the different power of brand
equity. This also show the growth of FMCG products in Indonesia, the considered
questions in making the findings more reliable with the scope of respondents for this
research. Lastly the aims and benefits of the research is explained
14
CHAPTER II : LITERATURE REVIEW
This chapter will explain the theory of the variable from the model; this includes
definitions of the variable and other research as a reference to make the research more
appropriate and reliable.
CHAPTER III : RESEARCH METHODOLOGY
In this section of the research it shows the methodology in the original paper of the
journal and certain adjustments will be created to adjust the culture and type of
questions to be asked in Indonesia.
CHAPTER IV : FINDINGS AND ANALYSIS
This chapter include the results of the survey with the evaluations and analysing of the
research taken place.
CHAPTER V : CONCLUSION AND RECOMMENDATIONS
This last chapter summarizes the results and findings and also it shows the suggestions
on the researcher and marketer for the next findings.
15
CHAPTER II
LITERATURE REVIEW
This chapter will evaluate on the variables of the model .The definitions and also the
relationships are also proven by other authors that are from journals, articles and also
books to support the research
2.1 Importance of Brand equity
(Kusum L. Ailawadi, , Kevin Lane Keller 2004) There is a growing realization that
brands are one of a firm's most valuable intangible assets, branding has become as a top
management priority. Most commonly brands are unique and different from those of its
competitors. With the help of these brands consumer will evaluate these high and low
involvement products. Brands that are helpful for customer to be an indication of its
reliability, are mostly through the tagline that is promising, the media exposure that is
more likely to be frequent and set a consideration for the customer to purchase when
exposed to the product in reality, the logo that differs the brand from others and also the
positive quality that they have that make people continue to purchase in the long run and
does not change to other substitute brand.
Brand equity can be defined as the power that the name of a product can create in the
mind set of each customer exposed to it. That might be positive or negative according to
the techniques in bringing up the brand.
16
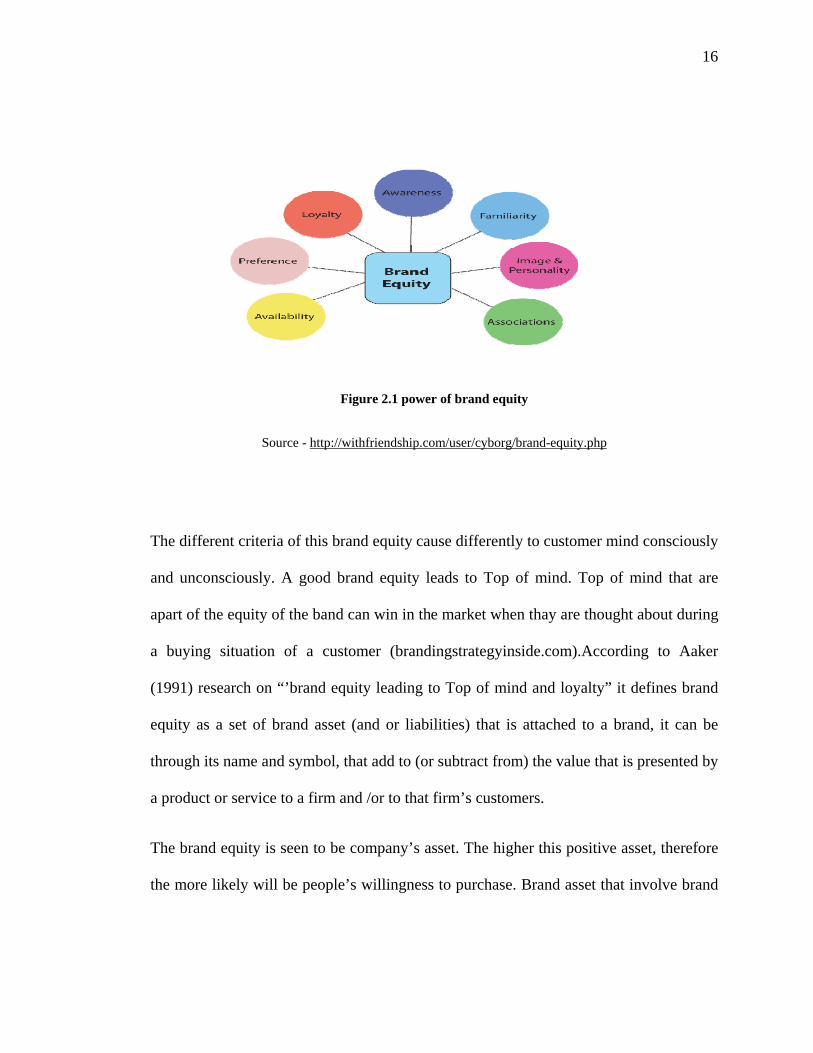
Figure 2.1 power of brand equity
Source - http://withfriendship.com/user/cyborg/brand-equity.php
The different criteria of this brand equity cause differently to customer mind consciously
and unconsciously. A good brand equity leads to Top of mind. Top of mind that are
apart of the equity of the band can win in the market when thay are thought about during
a buying situation of a customer (brandingstrategyinside.com).According to Aaker
(1991) research on “’brand equity leading to Top of mind and loyalty” it defines brand
equity as a set of brand asset (and or liabilities) that is attached to a brand, it can be
through its name and symbol, that add to (or subtract from) the value that is presented by
a product or service to a firm and /or to that firm’s customers.
The brand equity is seen to be company’s asset. The higher this positive asset, therefore
the more likely will be people’s willingness to purchase. Brand asset that involve brand
17
identity and association, perceived quality is a stepping ladder that every brand would
like to achieve.
Keller (2001) Defines brand equity as an added value that an organization attach to its
product based on how the brand and consumer are linked through consumer feelings,
thoughts, images, beliefs, perceptions.
(keller 1993) “Brand equity in terms of the marketing effect uniquely attributable to the
brand”. Therefore each brand equity have a role that increases the value of the brand.
2. 2 Perceived quality
The value that a brand gives to a product is perceived differently by different people
exposed to it. The belief or the perception that customer create are due to the asset of the
brand that they can finally conclude on whether it fits their lifestyle, necessities or
function. The perception that customers have, over a product or brand may vary when
many brands are exposed to them all the time. The quality that a product brings does not
only depend on the brand that raise its name but also the quality of the product itself that
is not deceitful and is of good use for the customers.
Perceived quality is achieved through past experience, education picked out at risk and
conditional variables such as purchase cause pay for state, occasion force, and
community settings of customers Holbrook & Corfman, (1985)
18
2.3 Brand Awareness
The value that a customer has over a brand is due to the existence of the products in the
market. With the help of the technique that they use can bring customer awareness on
the product capabilities, benefits, and uses. Brand awareness is the strength of a
customer’s memory that records for a particular brand Hofmann, states that, the higher
the awareness of brand to the customer, the higher is the value it has in customer’s mind.
This evaluation of brand can be distinguished as positive and negative depending on the
belief they have on the product. The awareness of the brand that is needed by all brands
is to be positive so that they are in the consideration set when customer makes a
purchase.
According to Leo Boghart and Charles Lehman in “what makes a brand name familiar”
the brand that is in the particular product class, will differ accordingly in their familiarity
to consumers but share certain characteristics based on non-products attributes and a
unique marketing environment. The familiarity of a brand due to its awareness is one of
the highest asset that a company can gain especially when it is perceived in a positive
manner that the probability that it will be purchased or consumed is high. These
awareness in brand as explained by Rossiter and Percy , that brand awareness is the
essential first step in building a brand , with many of the supporting authors create the
relationships of these brand awareness and its benefits they have in response to
purchase likelihood and finally purchase.
19
2.4 Brand Association
Consumer’s associations with corporate brands are in general based on three
associations, which are, social expectations, corporate behaviour traits and associations
based on trust. (George S. Low, Charles W. Lamb Jr 2000) understanding of brand
associations is needed to assist in furthur theoretical development and practical
measurement of the construct. These brand association is built in the perception of
customer when looking at a brand. Customer built a certain image and associates it with
their day to day lifestyle and work. Food products that are instant and made easily are
very beneficial for customers that leads a very busy life but it might not be judged as an
advantages for mothers that are not likely to be busy and can cook for the family. The
association of the brand is perceived differently in the mind set of customers. A benefit
of one person may not be the benefit to the next.
Thus, a positive brand image is thereby created through the building of a strong
favourable and unique association to be recalled in a memory Dennis A. Pitta,(1995)
Brand association can be through the logo , icon , packaging , advertisements , tag line
or promotions of the brand that makes customers and viewers associate the brand with
the targeted criteria of the company. For E.g. Mercedes Benz targeted itself for people
that have an income that is high. They have achieved a targeted association in its
customer’s mind set. When defining Mercedes, people will immediately associate it with
the range of price that is highly expensive and the targeted customers that are young
executives or high income people.
20
2.5 Brand loyalty
Discussed by (Pin Luarn and Hsin-Hui Lin 2003) “Loyalty helps to reduce marketing
cost, more new customers and great trade leverage”. Loyalty is the ability of customers
to use the same brand of products or service overtime due to the belief that the product is
superior enough for them, the products meets their lifestyle or even the product have
high quality that loyalty arises. To achieve this state of the ladder it needs a very long
process. Despite of achieving it which is complicated the maintaining of the loyal
customer is also difficult in this case. The positive advantage of brand loyalty of
customer is that the loyal customers will want to pay more for a brand because they
perceive some unique value in the brand that no alternative can provide (Arjun Chaudhuri,
Morris B. Holbrook (2001).
2.6 Conceptual framework
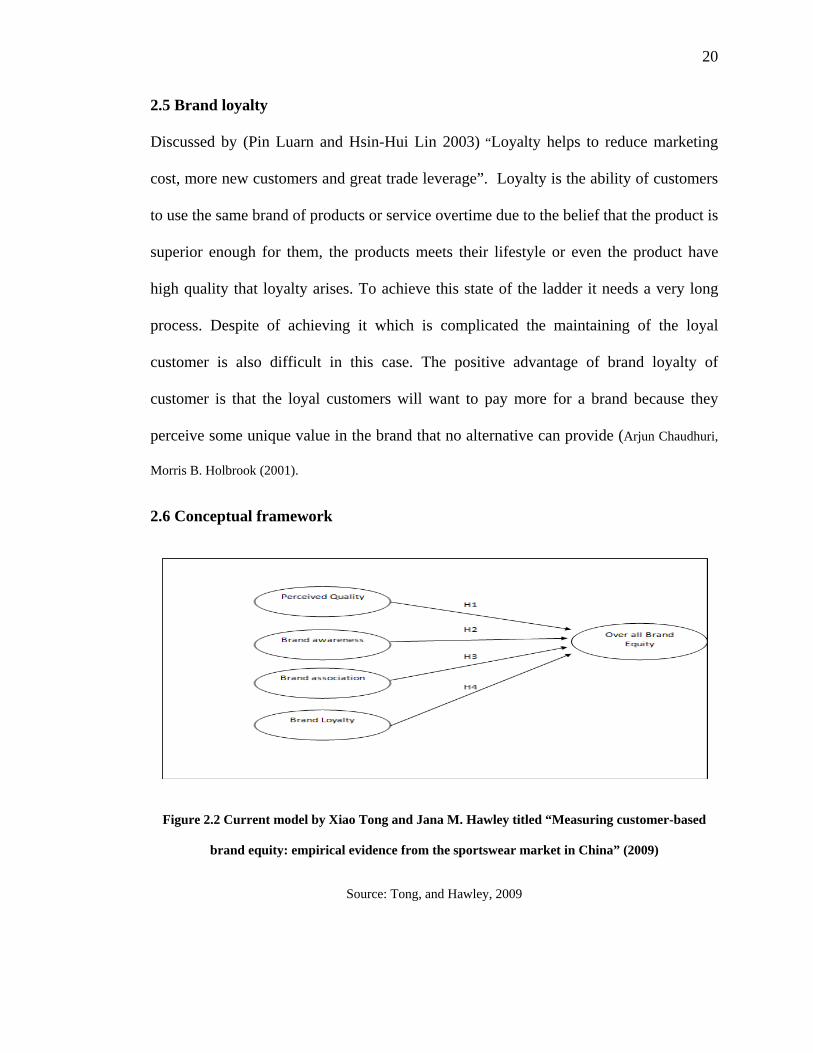
Figure 2.2 Current model by Xiao Tong and Jana M. Hawley titled “Measuring customer-based
brand equity: empirical evidence from the sportswear market in China” (2009)
Source: Tong, and Hawley, 2009
21
2.6.1 Perceived quality has a significant positive direct effect on brand equity
The perceptions of people over the quality of a product have an influence to the value
that the brand wants to bring up to the customers. According to the journal developed by
Xiao Tong titled “Measuring customer-based brand equity: empirical evidence from the
sportswear market in China” shows that there is a Perceived quality create value to a
brand in several ways: high quality gives consumers a reason on why customer should
buy the product in compare to other substitutes also it helps to differentiate, to be able to
charge a premium price, and to have a strong basic for the brand extension Tong, X. and
Hawley, J.M. (2009). Thus the following relationship is constructed. The consumer
based brand equity will increase when the perception of people with the product quality
tends to increase or to maintain them. When the perception of people about the quality is
good there is a high possibility that they will purchase the product.
With this relations the author proposed on the hypothesis as:
H1: Perceived quality has a significant positive direct effect on brand equity
22
2.6.2 Brand awareness has a significant positive direct effect on brand equity
The author from the original researcher shows that there is a relationship between the
awareness of the brand with the equity that customer set and company build. If a product
has brand attention and size, then the retailer and consumers will think of a particular
brand whenever going for buying if product has huge awareness Nazia Yaseen (2001).
Xiao Tong the original researcher support this relationship with the author of “Managing
brand equity- Aaker” that shows Brand awareness can be a sign of quality and
commitment, letting consumers become familiar with a brand and helping them consider
it at the point of purchase The value of this awareness to people has high impact on the
purchase decision. Consumers rely on their memory to some degree, even when all of
the options are there in front of them. The main advantage of having a brand awareness
in customer’s mind is discuss by Percy, larry,Rositer, John R that is brand awareness
will cause brand recognition to occur. When a brand is recognized at the point of
purchase brand awareness doesn’t need brand recall. This is thus, a key point in the
consideration of brand awareness as a communication objective. With this relations the
author proposed on the hypothesis as:
H2: Brand awareness has a significant positive direct effect on brand equity.
23
2.6.3 Brand association has a significant positive direct effect on brand equity
Based on the original researcher Xiao tong it indicates that CBBE occurs when
consumers have a high level of awareness and hold some strong, favourable, and unique
brand associations in their memories. It is general that most customers associate the
product that they see and would buy with the knowledge they have. This involves the
logo, the tag line and also the advertisement that they were exposed to.
From a research by Jenni Romaniuk with the journal titled “Comparing prompted and
unprompted methods for measuring consumer brand associations” it shows the
importance of brand association which is that information that are encapsulated during
the experience, which are consuming, purchasing and viewing or even the engage in
words of mouth if processed can create a name in the buyer’s memory. The association
is thus the result of this processing. This significant relationship will be further research
in the findings of the current author. With this relations the author proposed on the
hypothesis as:
H3 : Brand association has a significant positive direct effect on brand equity.
24
2.6.4 Brand loyalty has a significant positive direct effect on brand equity
With the loyalty of customer to a product or certain brand this cause an increase in the
equity value of the brand.Thus, the original researcher shows that there is a relationship
between the loyalty of customer to a brand with their equity. With the support of
Bowen,J., & Shoemaker, S(1998) .Loyal customers are less likely to switch to other
competitor in general because of their price; they also make more frequent purchases in
compare to non-loyal customers.
With this relations the author proposed on the hypothesis as:
H4: Brand loyalty has a significant positive direct effect on brand equity.
25
CHAPTER III
RESEARCH METHODOLOGY
This chapter will show the research methods in building a reliability and valid research.
This chapter involves the hypothesis that will be the core findings, the Research
questions, the sample questionnaire and statistical technique that will be used.
3.1 Research Objectives
The research is a replication of a journal titled “Measuring customer-based brand equity:
empirical evidence from the sportswear market in China” by Xiao Tong. The finding is
to show the four main antecedents affecting brand equity and also to conclude on
whether there is a correlation between these factors with equity of a brand.as well to
show on the highest antecedents effecting overall brand equity.
The memory of people exposed to a certain product is usually the ones that affect the
purchase. These memory can be recalled through the perception or believe it has on the
product, the awareness, the association people relate its belief to and also the loyalty
people have on a certain product and their reluctance to change to other substitutes.
26
3.1.1 Research Questions
The researcher will try to answer the following question to complete the findings.
RQ 1 : Does perceived quality have a significant positive direct effect on brand
equity?
RQ 2 : Does brand awareness have a significant positive direct effect on brand
equity?
RQ 3 : Does brand association have a significant positive direct effect on brand
equity?
RQ 4 : Does brand loyalty have a significant positive direct effect on brand equity?
The research will show that whether the four antecedents that are awareness,
perceived quality, association and loyalty cause a positive effect to brand equity.
3.1.3 Scope
The study aims to investigate the measurement effecting customer based brand equity in
jakarta area. . The findings were conducted via offline media using a personal approach
way to complete a quota of at least 150 valid respondents to create a better research. The
research will be done in the scope of Jakarta that are convenient sampling with no limit
in any cases. The respondents are set to be able to participate in this research when they
are able to read and answers the questions in the questionnaire, which are mostly those
that are already able to select their own shampoo brand during purchased. A pre-test will
also be conducted to know the reliability of the questionnaire in concluding the research
motives.
27
The sampling method are convenient sampling that aims to reach a wider market and
also no specific age groups is limited in this research just as long as they are able to
read and understand the questions.
The reason there is no specific age groups is because everyone use shampoo in their
daily life. The author did the research in the Jakarta area in places like minimarket,
supermarket and hypermarts. With target respondents of those that are already able to
make its own decision when purchasing to avoid bias respondents.
3.2 Research Design
The data collection method used in the previous research by the original journal were
Cronbach alpha coefficient, confirmative factor analysis and SEM (structural equation
model) in order for the research to be reliable, valid and effective.The previous findings
used 6 points Likert’s scales ranging from those that are strongly dis-agree(1) to strongly
agree(6). The previous author used a descriptive approach in its findings whereby, the
questionnaire that are not difficult to be understood are given to people that are mostly
young and young adults as the main motive of the research are more likely to be
sportswear(xiao tong, 2009). In the current search the author will aim on the same
measurement as used by the previous researcher but a different targeted customer
(Jakarta) ,different sector market(FMCG shampoo) and different technique. Due to the
limitations in time,skill and knowledge the author used SPSS 16.0 in this research.
The current research will focus on the antecedents of brand equity and the effect of it for
fast moving consumer goods in particular shampoo brands .The current research will
have a scope which is of Jakarta respondents with more convenience sampling of paper
28
based survey which is questionnaire. The questionnaire will be those related to the four
antecedents of overall brand equity with its own beneficial to consumers. The research
have a quantitative approach whereby, the aim is to determine the relationship between
one thing (an independent variable) and another (a dependent or outcome variable) in a
population/sample. Quantitative research designs are either descriptive (subjects
usually measured once) or experimental (subjects measured before and after a
treatment)( http://www.sportsci.org/jour/0001/wghdesign.html).
This research will use a quantitative descriptive approach whereby, A descriptive
study establishes only associations between variables
(http://www.sportsci.org/jour/0001/wghdesign.html).
29
3.2.1 Data collection Method
The data collections are based on those that are the most commonly used that is:
Primary data
Questionnaire
This List of a research or survey questions asked to respondents, and designed to extract
specific information. It serves four basic purposes: to collect the appropriate data, make
data comparable to analysis, minimize bias in processing and asking questions, and to
make questions engaging, interesting and variety(Malhotra,2009). The questionnaire is a
primary data source to investigate the measurement of customer based brand equity in
market where fast moving consumer goods are sold, in particular shampoo.
The list of questions that is presented to the respondents are those that directed based on
the presented to the respondents that directs the content to the purpose of this research.
The questionnaires will those that are presented to people individually by the author to
reduce invalid respondents. The question which is the source of first hand data is
essential to know the opinion of the respondents about the research of how they
perceived brand equity. The particular brands of product that will be tested upon in the
questionnaire are brand of shampoo that is categorized as a low involvement product but
with quite high sensitivity to its users.

30
Secondary Data
Printed literature
These are data that is taken from sources that have already done the research on similar
subject. The current survey for secondary data is through books and journals articles that
are taken as reference to support the model, hypothesis and findings. Most of the books
are taken for definitions that are more likely to be accurate while the journals that are
taken in to consideration as most of them are the ones that have been proven that the
antecedents of the current research have a direct response to brand salience and also the
other variables are supported with these journals to make it more reliable.
The books and journals articles help the author to support its findings on the relations
between the hypotheses. As the model is an adoption and not the adaption of the
previous research.
Web Research
The research based on internet is the one that defines this web research. These are
findings that are related to the current research with the help of the internet that involve
articles from other sources, the figures cause an in-depth information and more detailed
facts.
31
3.2.2 Questionnaire development
The author adapted the questionnaire from a journal by Xiao Tong and M.Hawley.. A
pre- survey was conducted, with the questions be delivered in Bahasa Indonesia as it is
the language understood by the author scope of research. The main reason that the
survey was conducted in Bahasa Indonesia to avoid confusion and created ease to the
respondents.The initial questionnaire which was adopted from the original author was
specifically for sportswear in the scope of china market. The questionnaire was in
mandarin and then translated to English when a pre -research in USA was created. The
current author follows the previous findings that are the author also used the same
questionnaire to evaluate on its analyses. Questionnaire will be constructed with 4
factors that are set into consideration; they are, perceived quality, brand association,
brand awareness and brand loyalty. The Current questionnaire will focus on the fast
moving shampoo brands in Jakarta, to evaluate on the objective of this research.
The questionnaire has some of these sections:
Section 1: The questions will focus on the demographic factors of the respondents
Section 2: These are question that focuses on the shampoo brand association with brand
equity
Section 3: Questions focuses on brand awareness and the result it has on brand equity
Section 4: Questions focuses on perceived quality and the outcome it has on brand
equity.
Section 5: Questions focuses on brand loyalty and its effect to brand equity
32
3.2.3 Scaling technique
The previous author used a 5 points Likert's scale as it is scaling technique to do its
findings. The questionnaire that consists of the 4 antecedents was all using this 5 point
Likert’s scale. The current author would like to eliminate the ‘neutral’ using a 6 points
Liker’s scale as to reduce error and invalid answers.
A likert scale allows respondents to convey their opinion on how they strongly agree or
dis- agree with a particular statement (Malhotra,2009). The options in the likert scale is
given to not annoy respondents and risking the quality of data such as random error or
data bias. Likerts scaling is also used to uncover the various facets which are often too
complex such as measuring attitudes and values.(johns,2010)
Thus, this Likert’s scale will range from strongly agree, quite agree, agree, disagree and
strongly disagree of respondents about the questions related to the four antecedents
effecting to brand equity of shampoo brands in response to market in Jakarta. The 5
points Likert’s scale will be used in the findings of the entire antecedent with the same
format. The demographic of the section will use a normal nominal approach to ease the
respondents in answering the questions.
33
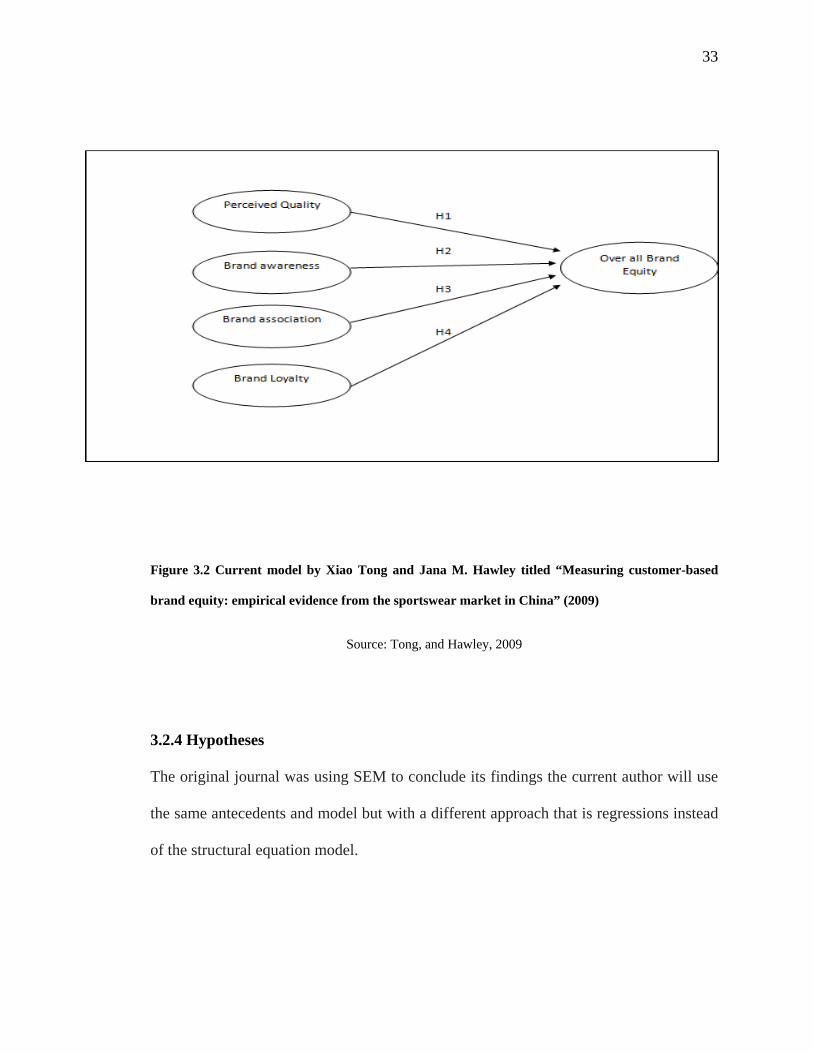
Figure 3.2 Current model by Xiao Tong and Jana M. Hawley titled “Measuring customer-based
brand equity: empirical evidence from the sportswear market in China” (2009)
Source: Tong, and Hawley, 2009
3.2.4 Hypotheses
The original journal was using SEM to conclude its findings the current author will use
the same antecedents and model but with a different approach that is regressions instead
of the structural equation model.
34
3.2.4.1 Perceived quality have a direct effect to brand equity
The different perception that people have and the belief that they create differs among
one another. These perception that people create thus cause a high perception on the
value of the product placed in their mind.
3.2.4.2 Brand Association is directly affected to brand equity
The association that customer have in mind when a product is exposed either in reality
or advertising, depicts the asset a brand have that is attached to the customer.
3.2.4.3 Brand Awareness is related directly to brand equity
The knowledge people have on the product will cause people to be ware on the existence
and also its function. Thus, this awareness of people has an asset on either positive or
negative effect it has on people.
3.2.4.4 Brand loyalty is related directly to brand equity
The result of the purchase is usually the outcome of these brand loyalty. A positive
effect cause people to want to purchase again in the long term thus, loyalty occurs. This
brand loyalty results in high brand equity.
3.3 Data Analysis Method
The current findings that are in the scope of Jakarta market with a slightly different field
of concentrations that is towards the fast moving consumer good that is shampoo. The
present research will have a different technique than the initial ones. This research will
35
use linear and multiple regression in order to know the significance of the relationships
also the validity and reliability test will be conducted from the pre-test data analysis.
3.3.1 Original research statistical analysis
The previous author Xiao tong (2009) used a reliability and validity to make sure on the
effectiveness of the questionnaire. The test that he used for the reliability check was
cronbach’s alpha coefficients this is to indicate the measurement of internal consistency,
that is, how very related items are in a set of group. The validity check was with the
confirmative factor analysis (CFA) that measures the test of a construct is consistent or
not with the understanding of the actual nature of the construct (Xiao Tong, 2009). The
researcher used a Statistical equation model (SEM), the reason is because the previous
researcher would like to prove the relationships between each antecedents with one
another. They did two stages of measurement using SEM, first is through the reliability
and validity and the second stage shows the relationships between the hypothesis. Both
the stages they used the help of this Semantic equation model to satisfied themselves
with an effective research. The initial research used questionnaire and distributed it
among people in the 6 shopping centres within the range of age between 18 years old to
39 years old. For every respondents that answers the questionnaire a gift was presented
the motive of this gift is to motivate a high response rate.
36
3.3.2 Current research analysis
The current author in the research of measuring brand awareness will be supported with
the descriptive analysis, linear regressions and multiple regressions and SPSS 16.0 as its
statistical tool.The current research will not use SEM as the author does not want to
check the relationships between the antecedents and due to limitations of time,
knowledge, resources and scope of the research.
The author used descriptive testing and Inferential. inferential statistics to try to infer
from the sample data what the population might think. Or, we use inferential statistics to
make judgments of the probability that an observed difference between groups is a
dependable one or one that might have happened by chance in this
study(http://www.socialresearchmethods.net/kb/statinf.phpwill). The inferential testing
will be used by the author are reliability which is Cronbach’s alpha,validity
Confirmatory Factor Analysis and Multiple regressions,in addition a cross tabulation
was also calculated to know the relationship between the demographic and the
dependent variables.while descriptive statistics are Descriptive statistics are used to
describe the basic features of the data in a study. They provide simple summaries about
the sample and the measures. Together with simple graphics analysis, they form the
basis of virtually every quantitative analysis of
data(http://www.socialresearchmethods.net/kb/statdesc.php) the author used this testing
to check the frequency distribution. The age groups for this research are a convenient
sampling with no limitations in age to participate in this research.
37
3.3.3 Reliability testing
In this research the author will use a Cronbach’s alpha coefficient research in order to
identify on whether the questionnaire create a consistency, stable and reliable data for
the findings. This Cronbach’s alpha in general should achieve a high degree of greater
than 0.6 to have a satisfactory results.(Malhotra,2009)
3.3.4 Validity testing
This research will use testing on the validity of the construct of the questionnaire
through the use of Pearson correlations method The Pearson correlation method is
normally used in finding the correlations between at least two variables. The relations
are said to have a good construct and criteria when significant level is lesser than 0/05.
The previous researcher used CFA which is confirmatory factor analysis which is no
necessary if the questionnaire by the previous author is already grouped together based
on the antecedents. (Malhotra, 2009)
3.3.5 Linear regressions ( Multiple Regression)
This method will be used by the author to know the relationships on the dependent
variable against its independent variables are linear and multiple regressions.
The most common method use by researcher in knowing the relationships of variables
are through this technique. The linear regression is used to test on the relationship of
each dependent variable with the independent variable, while the multiple regressions
are used to test on the relationships of all the antecedents towards the independent
variable to know the ones with the highest relationships. The result is valid when the
significant level is less than 0.5.(Malhotra,2009)
38
3.3.7 Sampling Method
Based on the research by Xiao Tong on the journal titled “Measuring customer-based
brand equity: empirical evidence from the sportswear market in China” it uses the
market of china in order to do its findingswhile the current researchis different on the
findings in the market of Jakarta. Thus, the current findings which are also concerned in
the Fast moving consumer products which are shampoo will have a non-probability
convenience sampling method .The research was done in near the retail outlet on
shopping for these products also random people that uses shampoo in their daily life.
These involve Carrefour, lotte mart and alfamidi also random places where people use
shampoo.
Considering the limited time, resources and skill this research use a convenient sampling
and have also done some adaptation to suit the purpose of this study in the local
Indonesian background. For e.g.- The questions asked were all in Bahasa Indonesian
since the respondents were
39
Table 3.2 Differences between original research and current research
No. Description Original Research Current Research Remarks
1 Title Measuring customer-
based brand equity:
empirical evidence
from the sportswear
market in China
The impact of association ,
awareness, perceived
quality and brand loyalty
in brand equity : The study
of Shampoo brand in
Jakarta market
Changes are created based
on the the different sector
of findings and the area of
research.
2 Number of
Respondent
306 Respondents 200 Respondents The research may take a
lot more time if the
respondents are 306
people
3 Language Mandarin and English Indonesia As my respondents are
more likely to be those
that are Indonesian, thus
the language should be the
ones they understand
4 Scale 5 point Likert's scale 6 points Likert’s scale No neutral will be in the
questionnaire so that
author choose sides
between yes or no.
5 Statistical
Tools
Used Statistical equation
method
Using SPSS 16.0 To be able to get the result
on time as per the
projected dates.
6 Sampling Random Sampling convenience Sampling Get random convenient
samples that use shampoo
40
and those that are
available in the retail
market
7 Data
Collection
Retail outlet survey Personal Social Network
Web survey
To have high number of
respondents with limited
time.
41
Table 3.3 operational of variable measures
Variables Questions
Perceived Quality
Aaker (1991) and Pappu et al
I trust the quality from product x
Products from X would be of very good
quality
Products from X offer excellent features
Brand awareness
Aaker (1991) and Yoo et al. (2000)
Some characteristics of X come to my
mind quickly
I can recognize X quickly among other
competing brands
I am familiar with X brand
Brand Association
Aaker (1996), Keller (1993), and Pappu
et al. (2005)
X has very unique brand image, compared
to competing brands
I respect and admire people who wear X
I like the brand image of X
I like and trust the company, which makes
X products
Brand Loyalty
Yoo et al. (2000) and Pappu et al.
(2005)
I consider myself to be loyal to X
When buying athletic shoes, X would be
my first choice
I will keep on buying X as long as it
provides me satisfied products
I am still willing to buy X even if its price
is a little higher than that of its competitors
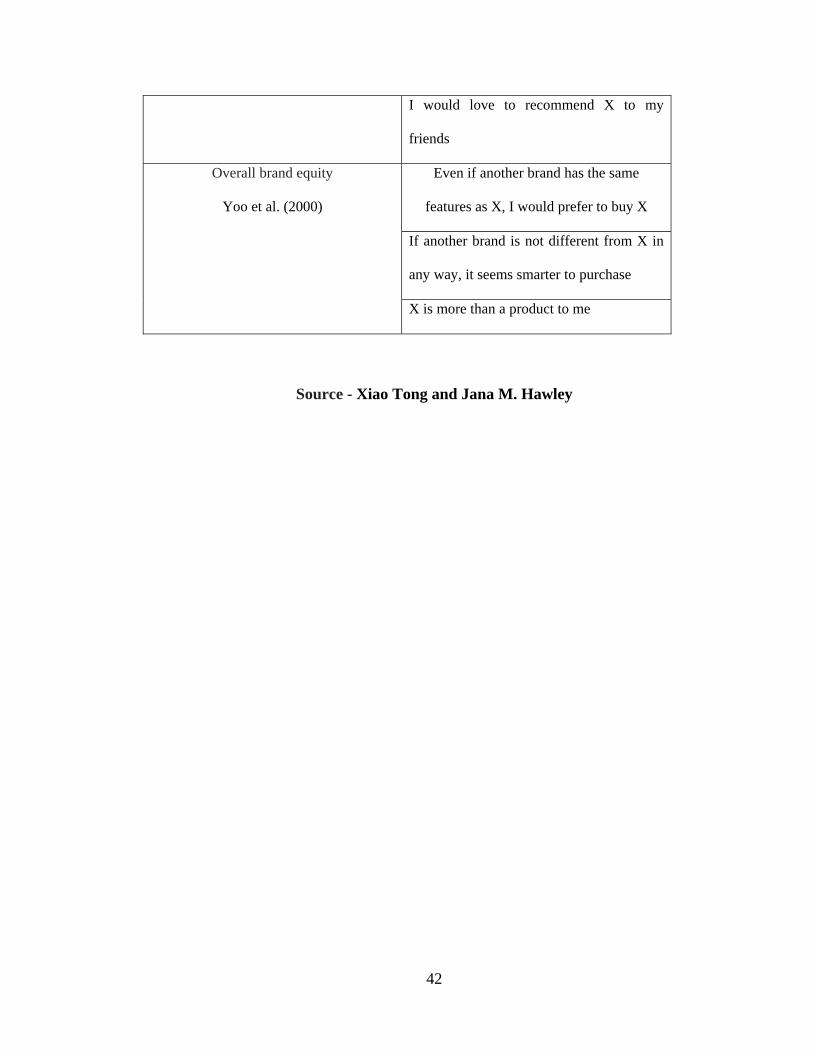
42
I would love to recommend X to my
friends
Overall brand equity
Yoo et al. (2000)
Even if another brand has the same
features as X, I would prefer to buy X
If another brand is not different from X in
any way, it seems smarter to purchase
X is more than a product to me
Source - Xiao Tong and Jana M. Hawley
43
CHAPTER IV
RESULTS AND FINDINGS
In this chapter the author will explain about the research findings of the measurement of
customer based brand equity for fast moving consumer goods in Jakarta .The
measurement was specifically Shampoo, a fast moving consumer goods. The motive of
this research is to test on the antecedents of brand equity that is highly affecting the
value of the brand for these products. The research took 158 respondents to test on the
hypothesis and also to provide information on the variables in the research.
In addition this chapter will also provide results of the pre test consisting of 30
respondents. This test is initially done to give knowledge on the reliability and validity
of the questionnaire and data. The questionnaire was distributed in early May for the
pretest while the actual test was distributed on the 15th of May through offline personal
approach. The respondents of the Questionnaire are random people that are seen in the
scope of universities students, supermarket, hyper marts and many more as everyone use
shampoo in their daily life. The results requirements e.g-The significant level have to be
lesser than 0.05 were taken into consideration(Malhotra,2009).
In this research the author test for validity used confirmatory Factor Analysis and
reliability using Cronbach Alpha. Furthermore the statistical analysis for this research
multiple regression are used to know the relation of each variables of the dependent and
the independent variables. The test use cross tabulation to know the effect of certain
demographic variable with brand equity.
44
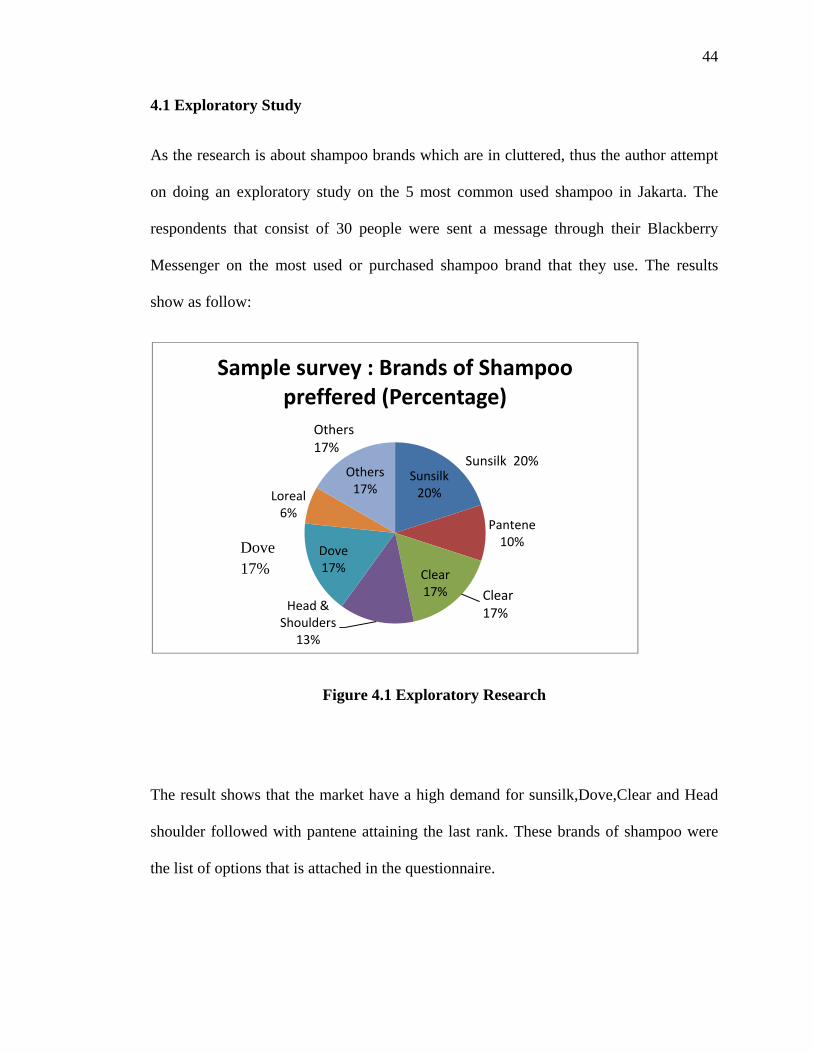
4.1 Exploratory Study
As the research is about shampoo brands which are in cluttered, thus the author attempt
on doing an exploratory study on the 5 most common used shampoo in Jakarta. The
respondents that consist of 30 people were sent a message through their Blackberry
Messenger on the most used or purchased shampoo brand that they use. The results
show as follow:
Figure 4.1 Exploratory Research
The result shows that the market have a high demand for sunsilk,Dove,Clear and Head
shoulder followed with pantene attaining the last rank. These brands of shampoo were
the list of options that is attached in the questionnaire.
Sunsilk20%
Pantene10%
Clear17%
Head & Shoulders
13%
Dove17%
Loreal6%
Others17%
Sample survey : Brands of Shampoo preffered (Percentage)
Clear17%
Sunsilk 20%
Others17%
Dove 17%
45
4.2 Pre test Analysis
The researcher, did a 30 respondents pre survey to analyze on the validity and reliability
of the variables in the questionnaire also the data set. The calculation is also used to test
on the research questions about the antecedents effecting Brand equity. The factors that
are being tested are as follow: Brand Awareness, Brand Association , Brand Loyalty,
Perceived quality and Brand equity.
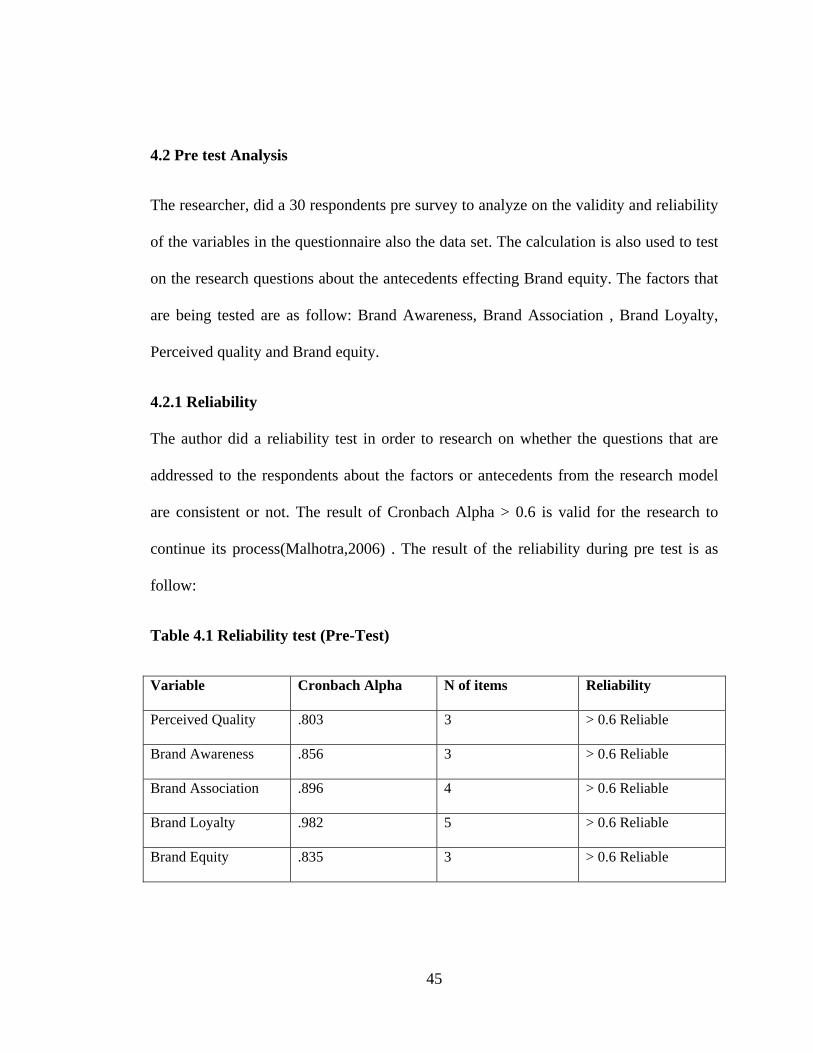
4.2.1 Reliability
The author did a reliability test in order to research on whether the questions that are
addressed to the respondents about the factors or antecedents from the research model
are consistent or not. The result of Cronbach Alpha > 0.6 is valid for the research to
continue its process(Malhotra,2006) . The result of the reliability during pre test is as
follow:
Table 4.1 Reliability test (Pre-Test)
Variable Cronbach Alpha N of items Reliability
Perceived Quality .803 3 > 0.6 Reliable
Brand Awareness .856 3 > 0.6 Reliable
Brand Association .896 4 > 0.6 Reliable
Brand Loyalty .982 5 > 0.6 Reliable
Brand Equity .835 3 > 0.6 Reliable
46
Table 4.1 shows the analysis of data done for reliability testing, all the data shows higher
than 0.6 value which is higher than the minimum level that confirmed that the data is
reliable. This shows that the factors have high internal consistency
47
4.2.1 Validity
The researcher did a validity test with the help Confirmatory Factor Analysis. This
statistical calculation is used to analyze on the questions of the questionnaire to be
proven as valid in each set of variables. The researcher used Confirmatory factor
analysis that analyses the KMO which is a measurement for adequacy, it is an index
used to examine the appropriateness of factor analysis. High values (between 0.5-1)
indicate factor analysis is appropriate. Value below 0.5 imply that the factor analysis
may not be appropriate (Malhotra, 2009)
48
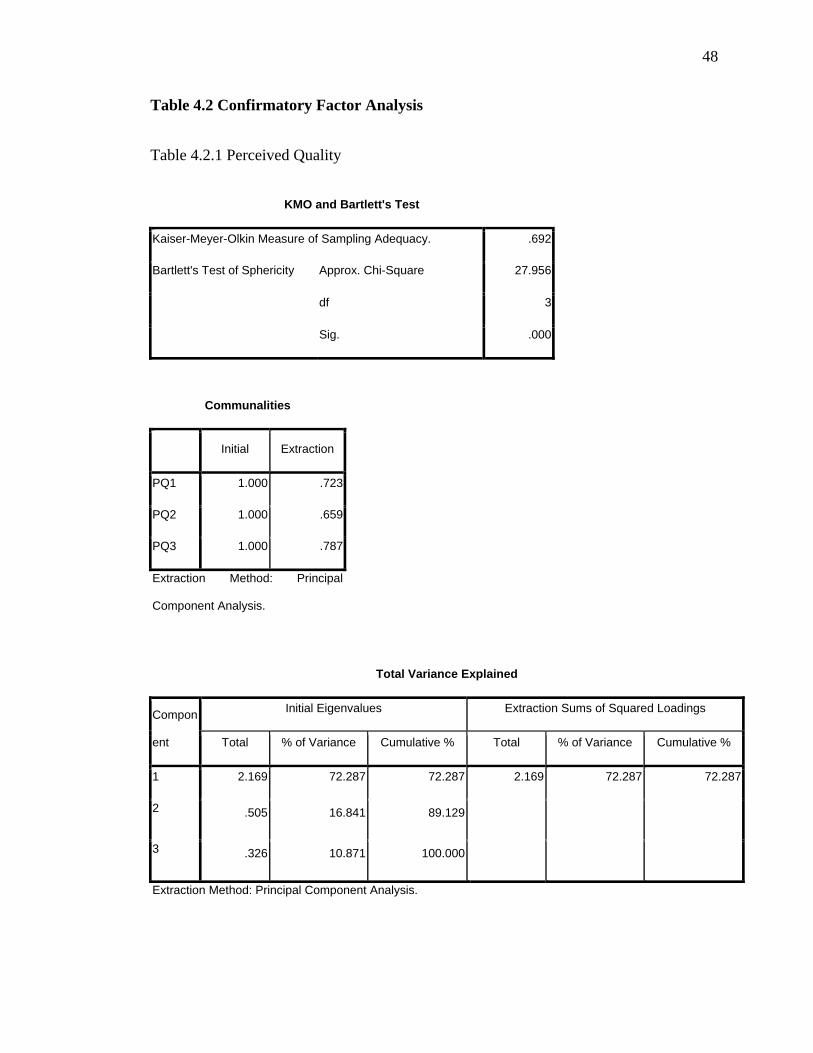
Table 4.2 Confirmatory Factor Analysis
Table 4.2.1 Perceived Quality
KMO and Bartlett's Test
Kaiser-Meyer-Olkin Measure of Sampling Adequacy. .692
Bartlett's Test of Sphericity Approx. Chi-Square 27.956
df 3
Sig. .000
Communalities
Initial Extraction
PQ1 1.000 .723
PQ2 1.000 .659
PQ3 1.000 .787
Extraction Method: Principal
Component Analysis.
Total Variance Explained
Compon
ent
Initial Eigenvalues Extraction Sums of Squared Loadings
Total % of Variance Cumulative % Total % of Variance Cumulative %
1 2.169 72.287 72.287 2.169 72.287 72.287
2 .505 16.841 89.129
3 .326 10.871 100.000
Extraction Method: Principal Component Analysis.
49
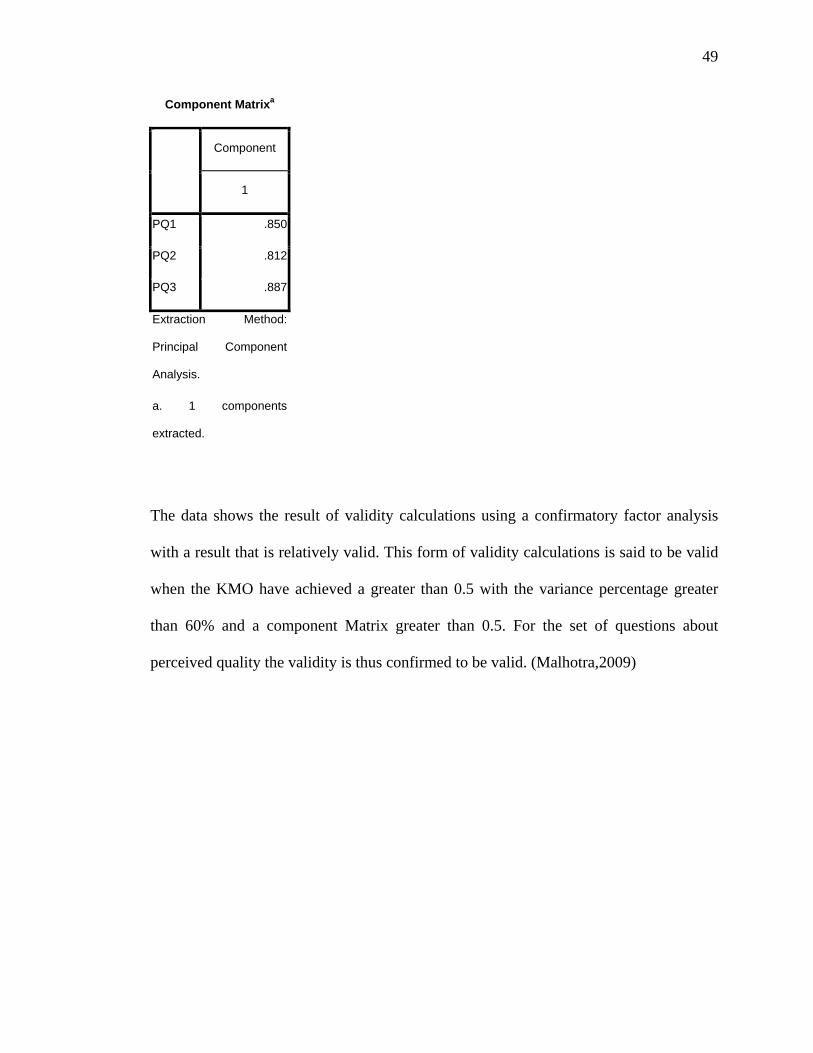
Component Matrixa
Component
1
PQ1 .850
PQ2 .812
PQ3 .887
Extraction Method:
Principal Component
Analysis.
a. 1 components
extracted.
The data shows the result of validity calculations using a confirmatory factor analysis
with a result that is relatively valid. This form of validity calculations is said to be valid
when the KMO have achieved a greater than 0.5 with the variance percentage greater
than 60% and a component Matrix greater than 0.5. For the set of questions about
perceived quality the validity is thus confirmed to be valid. (Malhotra,2009)
50
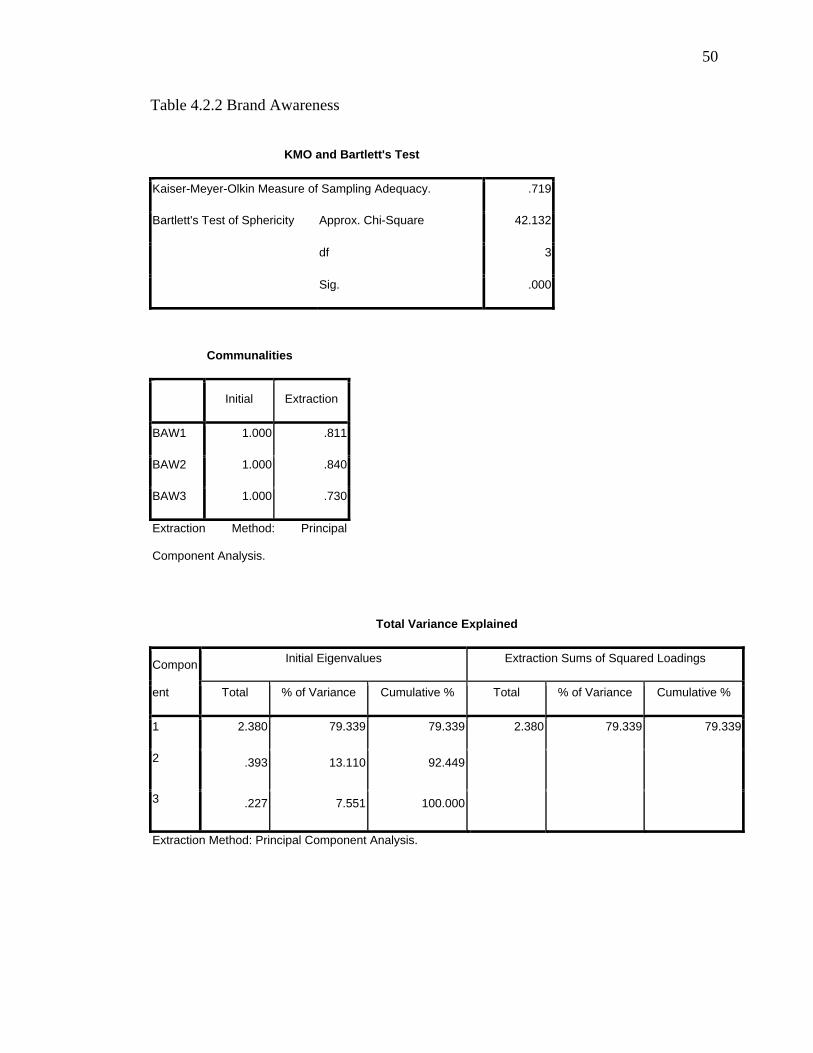
Table 4.2.2 Brand Awareness
KMO and Bartlett's Test
Kaiser-Meyer-Olkin Measure of Sampling Adequacy. .719
Bartlett's Test of Sphericity Approx. Chi-Square 42.132
df 3
Sig. .000
Communalities
Initial Extraction
BAW1 1.000 .811
BAW2 1.000 .840
BAW3 1.000 .730
Extraction Method: Principal
Component Analysis.
Total Variance Explained
Compon
ent
Initial Eigenvalues Extraction Sums of Squared Loadings
Total % of Variance Cumulative % Total % of Variance Cumulative %
1 2.380 79.339 79.339 2.380 79.339 79.339
2 .393 13.110 92.449
3 .227 7.551 100.000
Extraction Method: Principal Component Analysis.
51
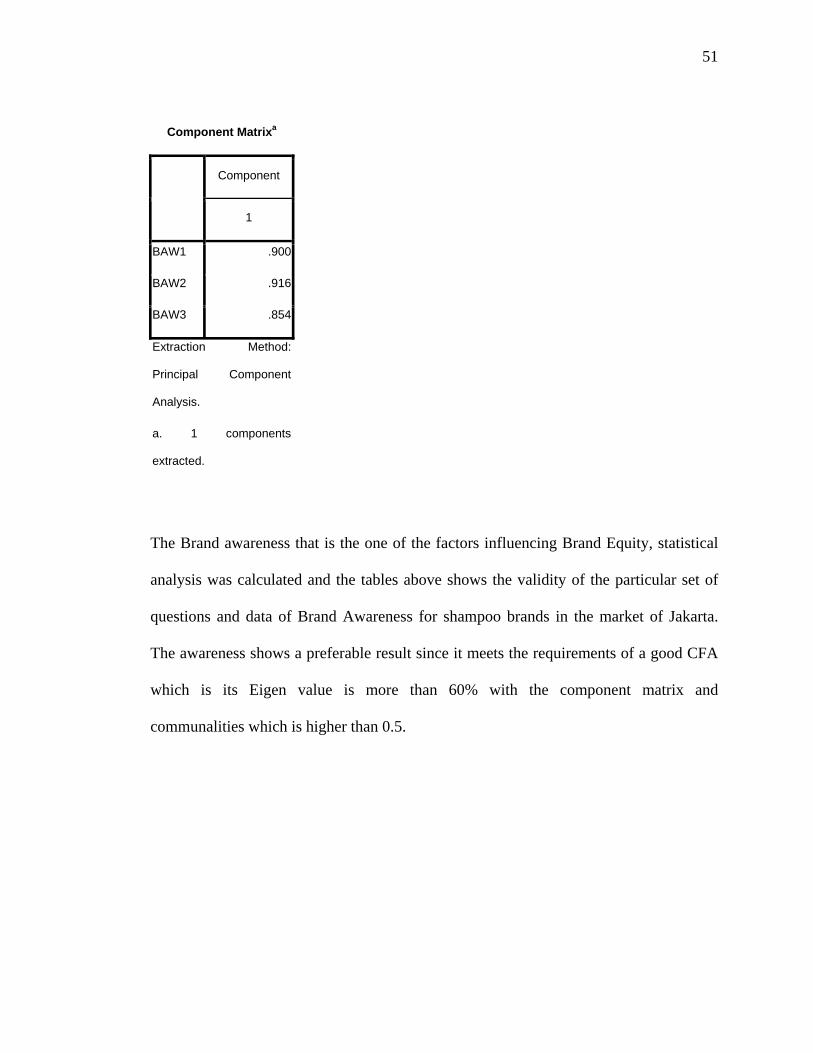
Component Matrixa
Component
1
BAW1 .900
BAW2 .916
BAW3 .854
Extraction Method:
Principal Component
Analysis.
a. 1 components
extracted.
The Brand awareness that is the one of the factors influencing Brand Equity, statistical
analysis was calculated and the tables above shows the validity of the particular set of
questions and data of Brand Awareness for shampoo brands in the market of Jakarta.
The awareness shows a preferable result since it meets the requirements of a good CFA
which is its Eigen value is more than 60% with the component matrix and
communalities which is higher than 0.5.
52
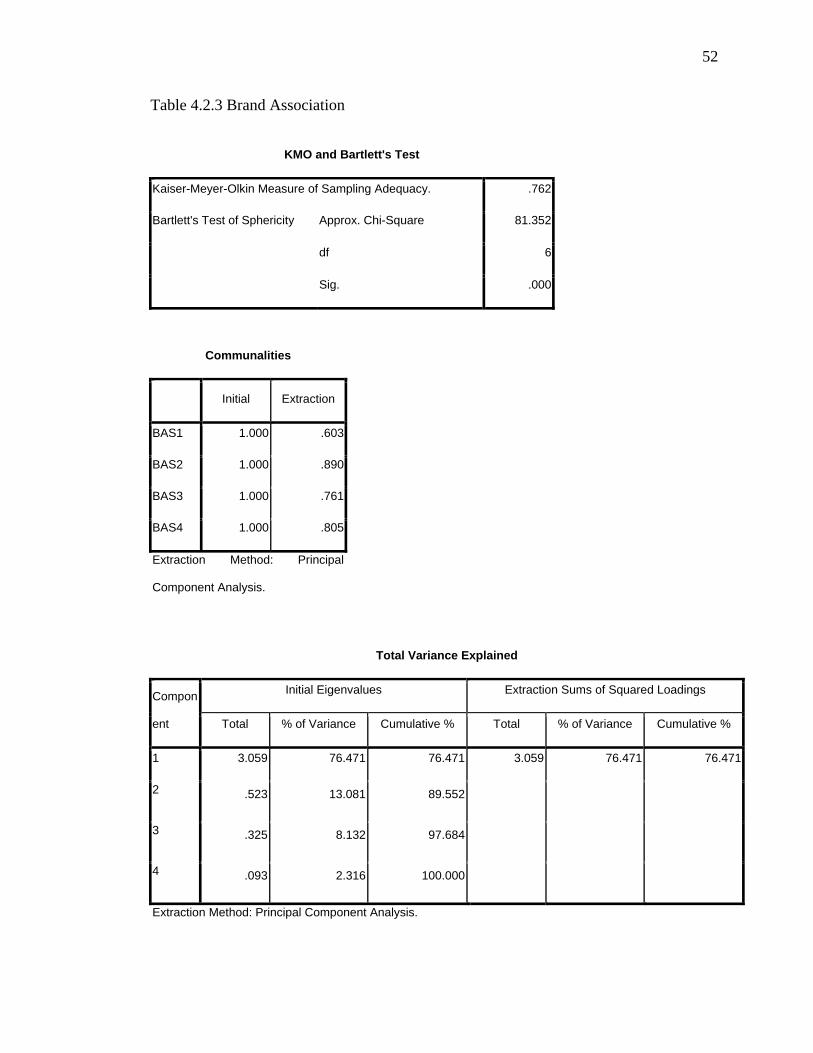
Table 4.2.3 Brand Association
KMO and Bartlett's Test
Kaiser-Meyer-Olkin Measure of Sampling Adequacy. .762
Bartlett's Test of Sphericity Approx. Chi-Square 81.352
df 6
Sig. .000
Communalities
Initial Extraction
BAS1 1.000 .603
BAS2 1.000 .890
BAS3 1.000 .761
BAS4 1.000 .805
Extraction Method: Principal
Component Analysis.
Total Variance Explained
Compon
ent
Initial Eigenvalues Extraction Sums of Squared Loadings
Total % of Variance Cumulative % Total % of Variance Cumulative %
1 3.059 76.471 76.471 3.059 76.471 76.471
2 .523 13.081 89.552
3 .325 8.132 97.684
4 .093 2.316 100.000
Extraction Method: Principal Component Analysis.
53
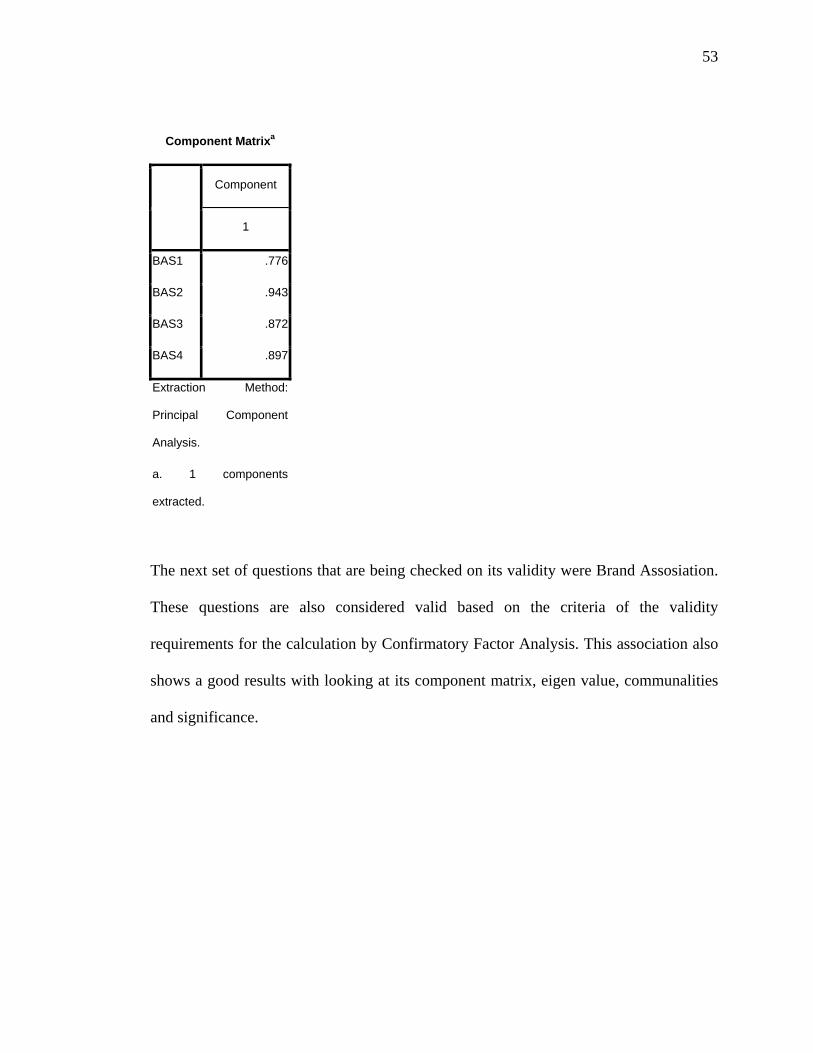
Component Matrixa
Component
1
BAS1 .776
BAS2 .943
BAS3 .872
BAS4 .897
Extraction Method:
Principal Component
Analysis.
a. 1 components
extracted.
The next set of questions that are being checked on its validity were Brand Assosiation.
These questions are also considered valid based on the criteria of the validity
requirements for the calculation by Confirmatory Factor Analysis. This association also
shows a good results with looking at its component matrix, eigen value, communalities
and significance.
54
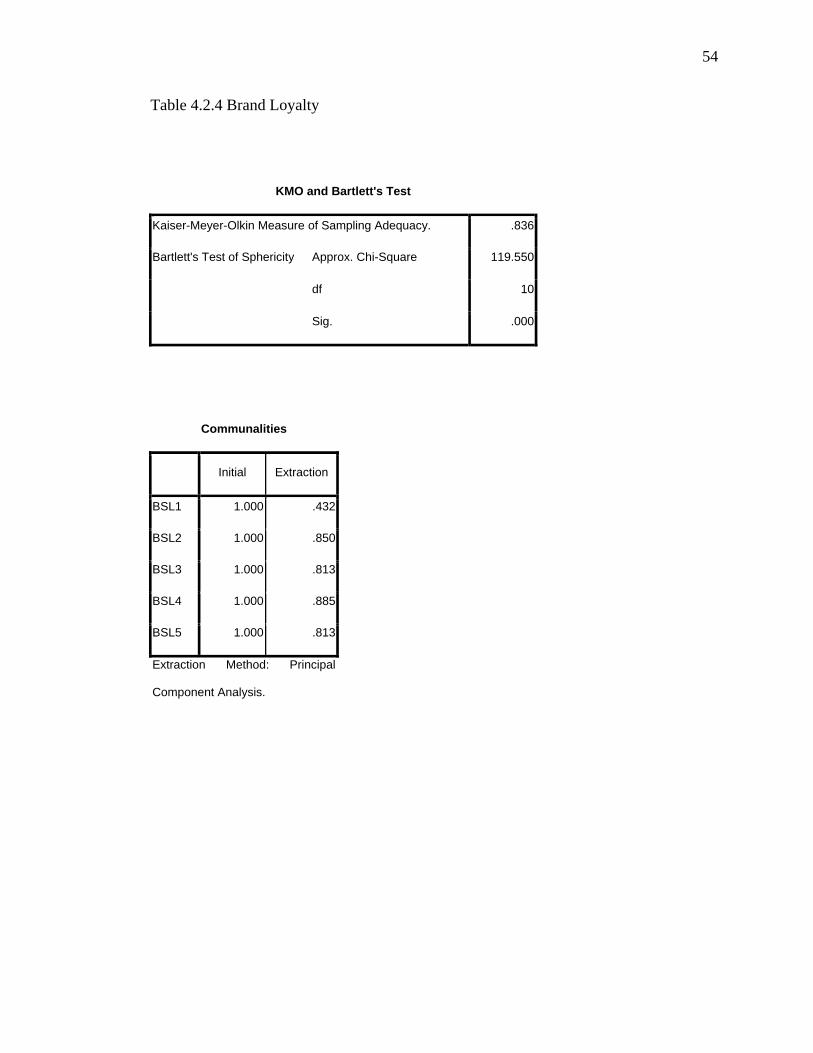
Table 4.2.4 Brand Loyalty
KMO and Bartlett's Test
Kaiser-Meyer-Olkin Measure of Sampling Adequacy. .836
Bartlett's Test of Sphericity Approx. Chi-Square 119.550
df 10
Sig. .000
Communalities
Initial Extraction
BSL1 1.000 .432
BSL2 1.000 .850
BSL3 1.000 .813
BSL4 1.000 .885
BSL5 1.000 .813
Extraction Method: Principal
Component Analysis.
55
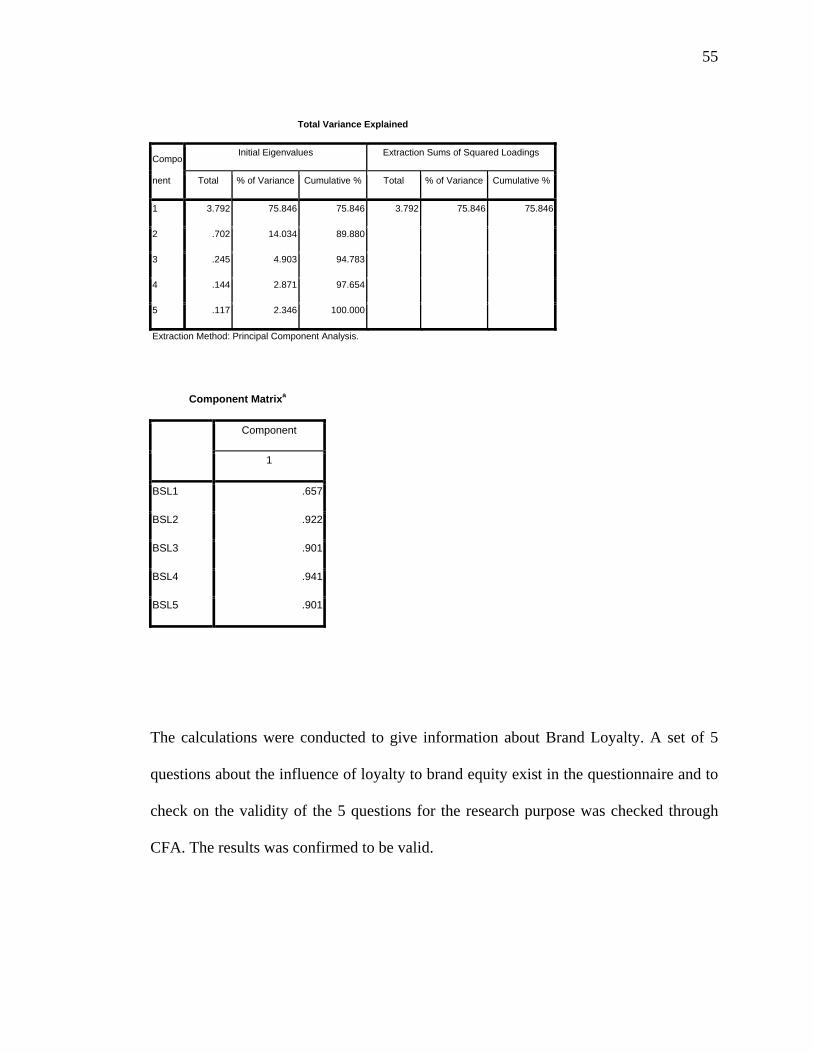
Total Variance Explained
Compo
nent
Initial Eigenvalues Extraction Sums of Squared Loadings
Total % of Variance Cumulative % Total % of Variance Cumulative %
1 3.792 75.846 75.846 3.792 75.846 75.846
2 .702 14.034 89.880
3 .245 4.903 94.783
4 .144 2.871 97.654
5 .117 2.346 100.000
Extraction Method: Principal Component Analysis.
Component Matrixa
Component
1
BSL1 .657
BSL2 .922
BSL3 .901
BSL4 .941
BSL5 .901
The calculations were conducted to give information about Brand Loyalty. A set of 5
questions about the influence of loyalty to brand equity exist in the questionnaire and to
check on the validity of the 5 questions for the research purpose was checked through
CFA. The results was confirmed to be valid.
56
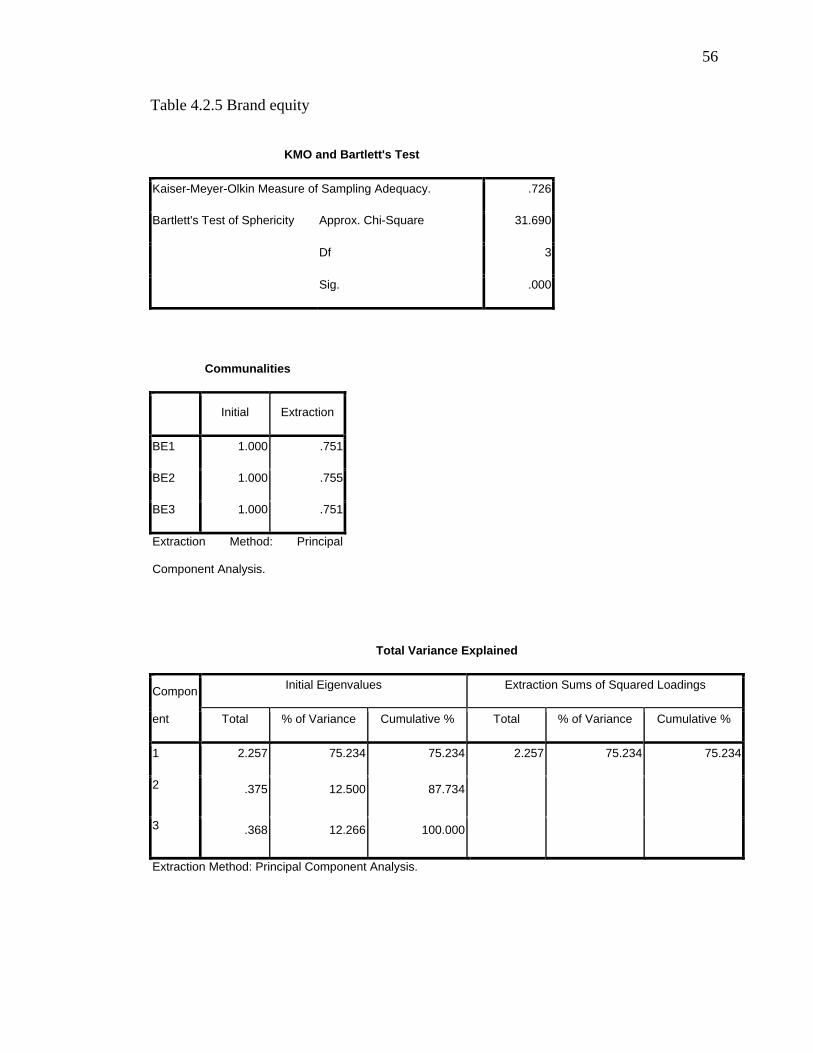
Table 4.2.5 Brand equity
KMO and Bartlett's Test
Kaiser-Meyer-Olkin Measure of Sampling Adequacy. .726
Bartlett's Test of Sphericity Approx. Chi-Square 31.690
Df 3
Sig. .000
Communalities
Initial Extraction
BE1 1.000 .751
BE2 1.000 .755
BE3 1.000 .751
Extraction Method: Principal
Component Analysis.
Total Variance Explained
Compon
ent
Initial Eigenvalues Extraction Sums of Squared Loadings
Total % of Variance Cumulative % Total % of Variance Cumulative %
1 2.257 75.234 75.234 2.257 75.234 75.234
2 .375 12.500 87.734
3 .368 12.266 100.000
Extraction Method: Principal Component Analysis.
57
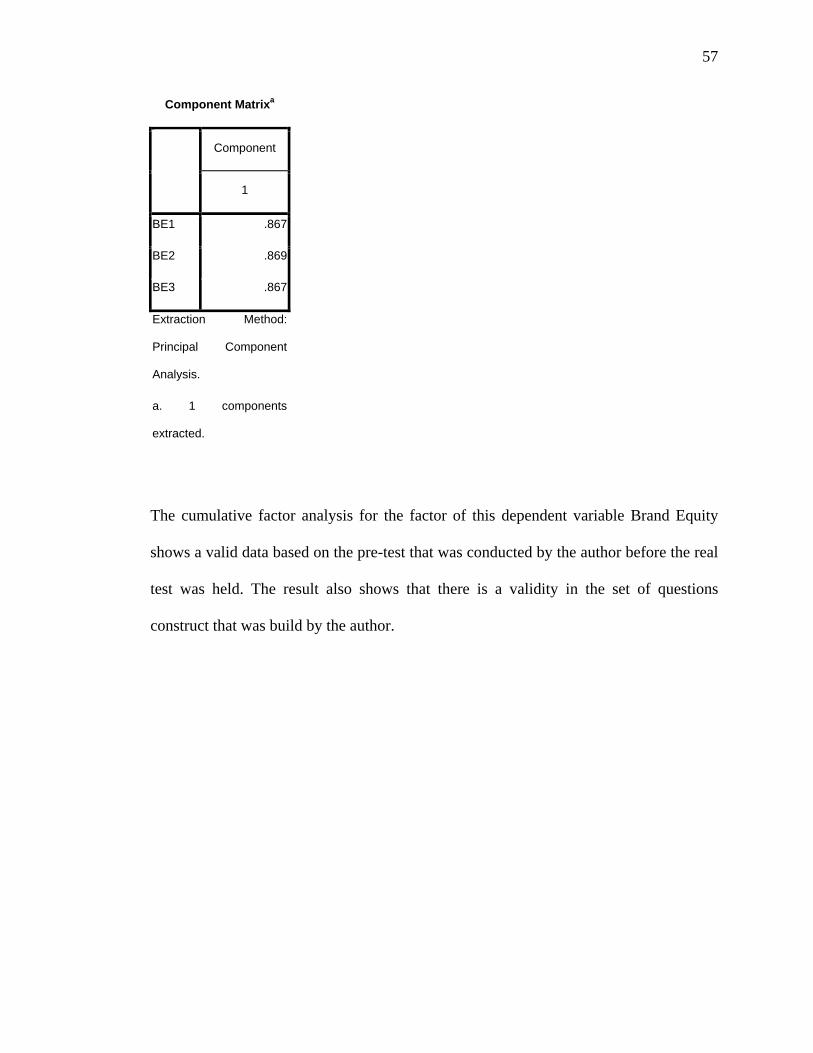
Component Matrixa
Component
1
BE1 .867
BE2 .869
BE3 .867
Extraction Method:
Principal Component
Analysis.
a. 1 components
extracted.
The cumulative factor analysis for the factor of this dependent variable Brand Equity
shows a valid data based on the pre-test that was conducted by the author before the real
test was held. The result also shows that there is a validity in the set of questions
construct that was build by the author.
58
4.3 Research Analysis
4.3.1 Correlations
Correlation using Pearson correlation is a simple but powerful way to look at the linear
relationship between two Matrix variables (Malhotra, 2009). Pearson correlation is
calculated with having a significant level lower than 0.05. The pearson correlation
shows the relationshipsof the variables.
59
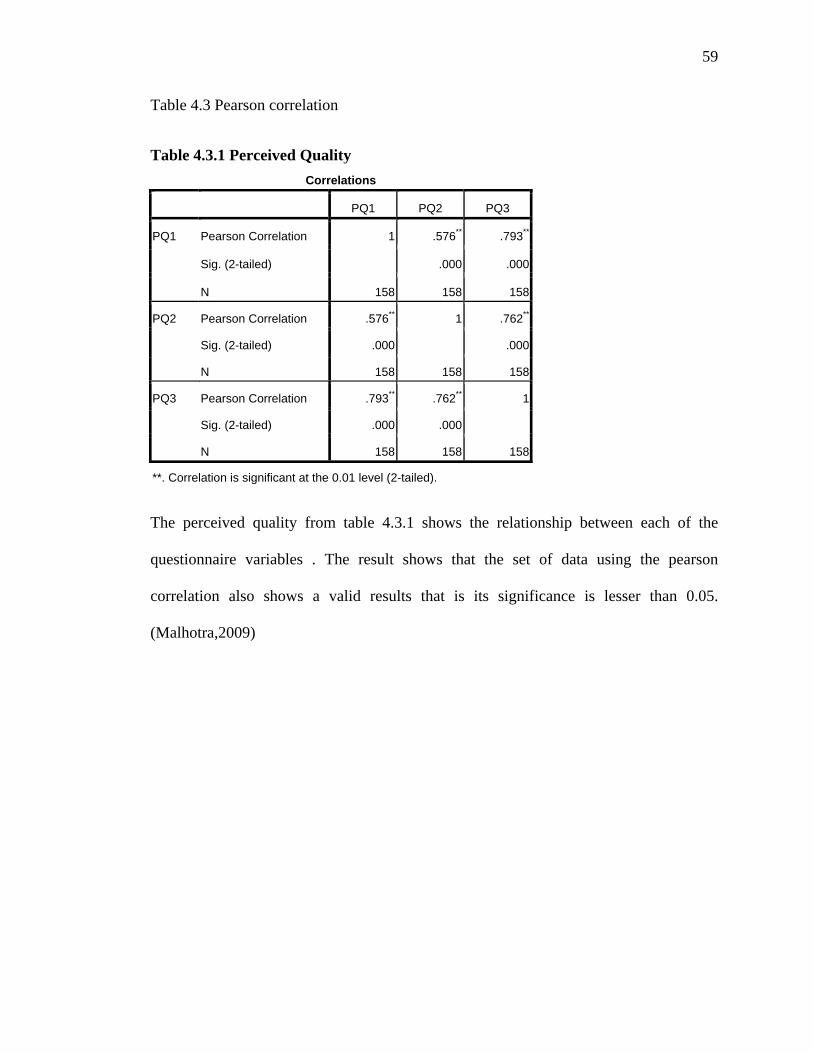
Table 4.3 Pearson correlation
Table 4.3.1 Perceived Quality Correlations
PQ1 PQ2 PQ3
PQ1 Pearson Correlation 1 .576** .793**
Sig. (2-tailed) .000 .000
N 158 158 158
PQ2 Pearson Correlation .576** 1 .762**
Sig. (2-tailed) .000 .000
N 158 158 158
PQ3 Pearson Correlation .793** .762** 1
Sig. (2-tailed) .000 .000
N 158 158 158
**. Correlation is significant at the 0.01 level (2-tailed).
The perceived quality from table 4.3.1 shows the relationship between each of the
questionnaire variables . The result shows that the set of data using the pearson
correlation also shows a valid results that is its significance is lesser than 0.05.
(Malhotra,2009)
60
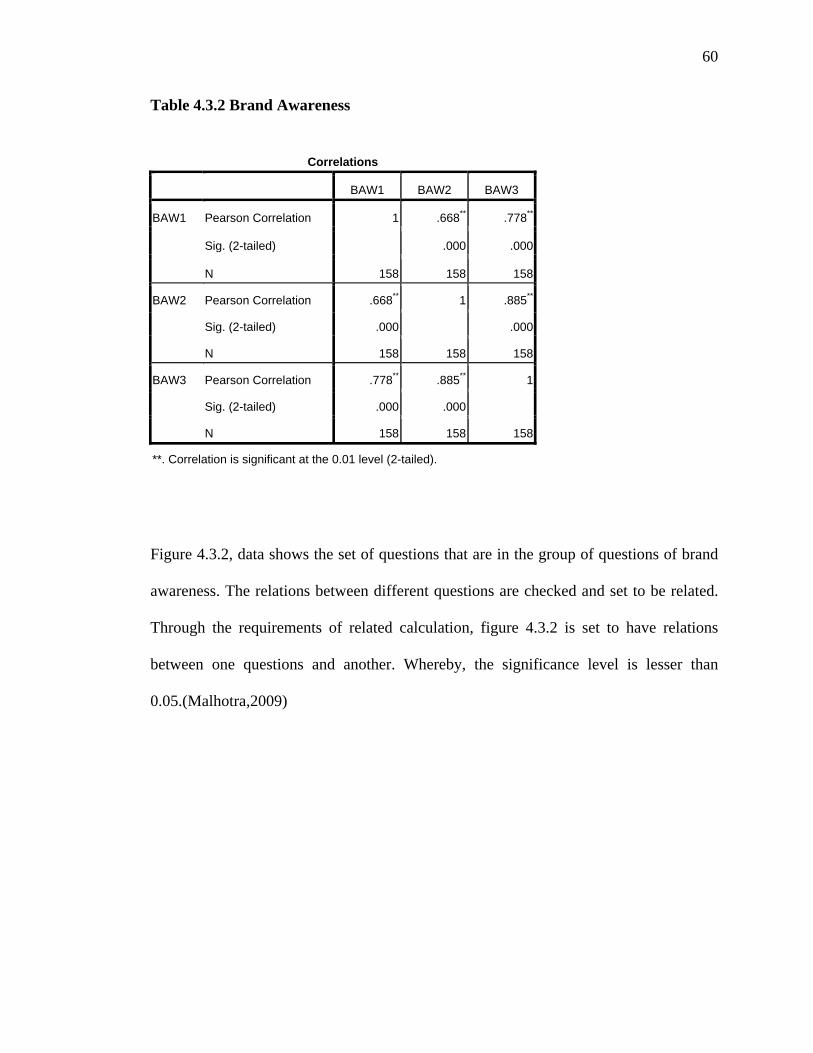
Table 4.3.2 Brand Awareness
Correlations
BAW1 BAW2 BAW3
BAW1 Pearson Correlation 1 .668** .778**
Sig. (2-tailed) .000 .000
N 158 158 158
BAW2 Pearson Correlation .668** 1 .885**
Sig. (2-tailed) .000 .000
N 158 158 158
BAW3 Pearson Correlation .778** .885** 1
Sig. (2-tailed) .000 .000
N 158 158 158
**. Correlation is significant at the 0.01 level (2-tailed).
Figure 4.3.2, data shows the set of questions that are in the group of questions of brand
awareness. The relations between different questions are checked and set to be related.
Through the requirements of related calculation, figure 4.3.2 is set to have relations
between one questions and another. Whereby, the significance level is lesser than
0.05.(Malhotra,2009)
61
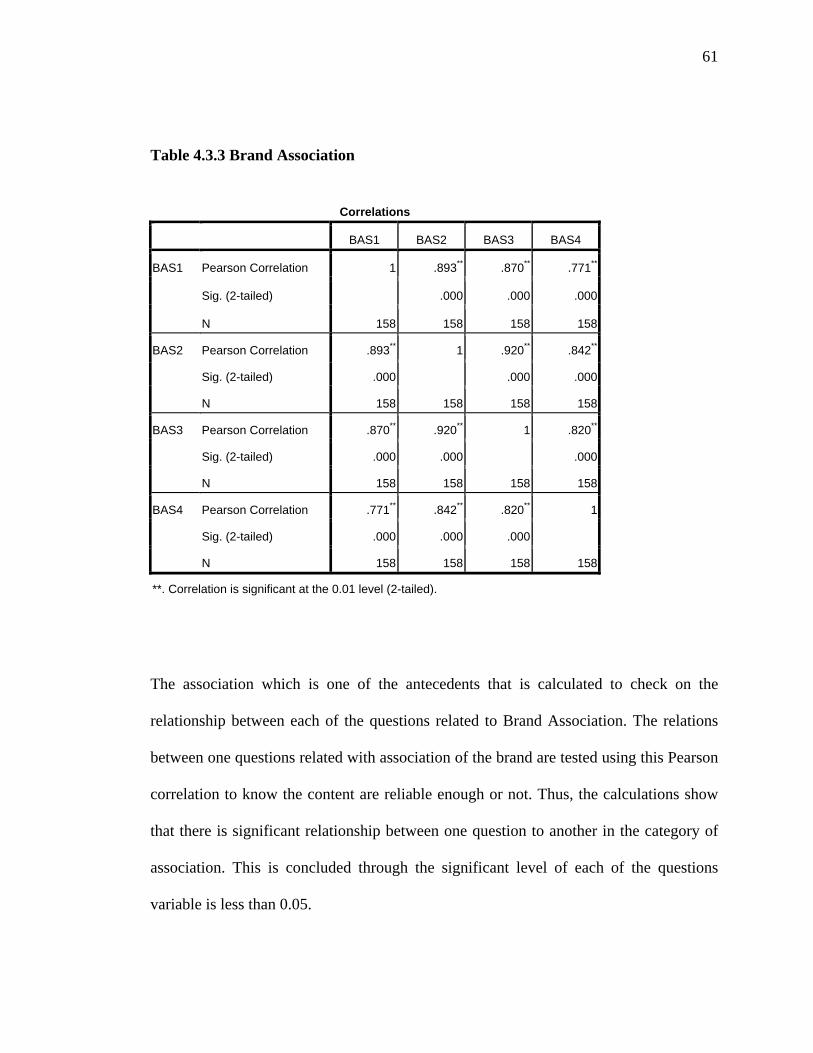
Table 4.3.3 Brand Association
Correlations
BAS1 BAS2 BAS3 BAS4
BAS1 Pearson Correlation 1 .893** .870** .771**
Sig. (2-tailed) .000 .000 .000
N 158 158 158 158
BAS2 Pearson Correlation .893** 1 .920** .842**
Sig. (2-tailed) .000 .000 .000
N 158 158 158 158
BAS3 Pearson Correlation .870** .920** 1 .820**
Sig. (2-tailed) .000 .000 .000
N 158 158 158 158
BAS4 Pearson Correlation .771** .842** .820** 1
Sig. (2-tailed) .000 .000 .000
N 158 158 158 158
**. Correlation is significant at the 0.01 level (2-tailed).
The association which is one of the antecedents that is calculated to check on the
relationship between each of the questions related to Brand Association. The relations
between one questions related with association of the brand are tested using this Pearson
correlation to know the content are reliable enough or not. Thus, the calculations show
that there is significant relationship between one question to another in the category of
association. This is concluded through the significant level of each of the questions
variable is less than 0.05.
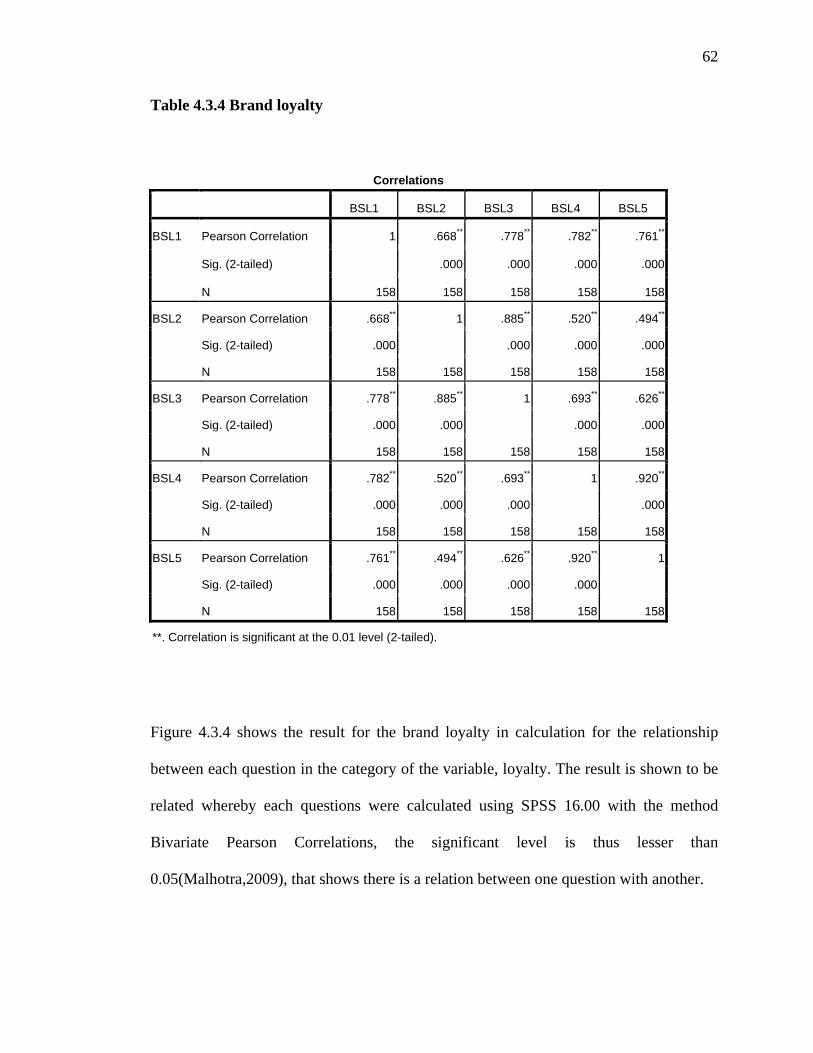
62
Table 4.3.4 Brand loyalty
Correlations
BSL1 BSL2 BSL3 BSL4 BSL5
BSL1 Pearson Correlation 1 .668** .778** .782** .761**
Sig. (2-tailed) .000 .000 .000 .000
N 158 158 158 158 158
BSL2 Pearson Correlation .668** 1 .885** .520** .494**
Sig. (2-tailed) .000 .000 .000 .000
N 158 158 158 158 158
BSL3 Pearson Correlation .778** .885** 1 .693** .626**
Sig. (2-tailed) .000 .000 .000 .000
N 158 158 158 158 158
BSL4 Pearson Correlation .782** .520** .693** 1 .920**
Sig. (2-tailed) .000 .000 .000 .000
N 158 158 158 158 158
BSL5 Pearson Correlation .761** .494** .626** .920** 1
Sig. (2-tailed) .000 .000 .000 .000
N 158 158 158 158 158
**. Correlation is significant at the 0.01 level (2-tailed).
Figure 4.3.4 shows the result for the brand loyalty in calculation for the relationship
between each question in the category of the variable, loyalty. The result is shown to be
related whereby each questions were calculated using SPSS 16.00 with the method
Bivariate Pearson Correlations, the significant level is thus lesser than
0.05(Malhotra,2009), that shows there is a relation between one question with another.
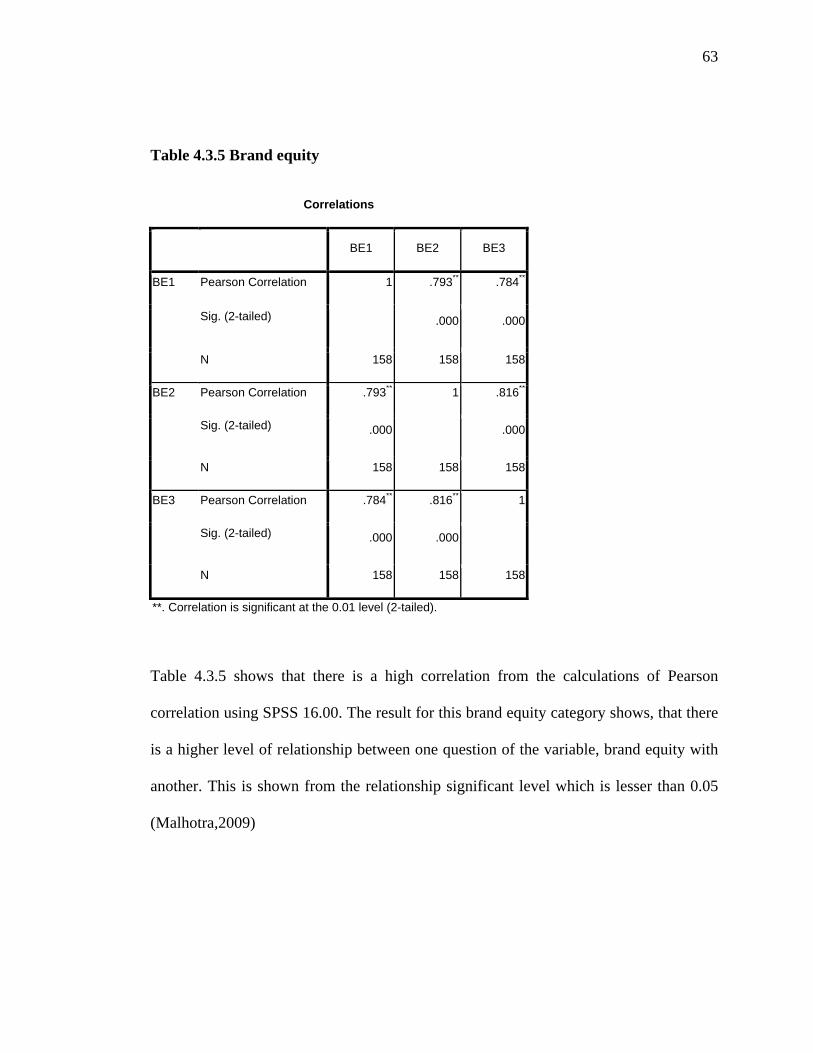
63
Table 4.3.5 Brand equity
Correlations
BE1 BE2 BE3
BE1 Pearson Correlation 1 .793** .784**
Sig. (2-tailed) .000 .000
N 158 158 158
BE2 Pearson Correlation .793** 1 .816**
Sig. (2-tailed) .000 .000
N 158 158 158
BE3 Pearson Correlation .784** .816** 1
Sig. (2-tailed) .000 .000
N 158 158 158
**. Correlation is significant at the 0.01 level (2-tailed).
Table 4.3.5 shows that there is a high correlation from the calculations of Pearson
correlation using SPSS 16.00. The result for this brand equity category shows, that there
is a higher level of relationship between one question of the variable, brand equity with
another. This is shown from the relationship significant level which is lesser than 0.05
(Malhotra,2009)
64
4.3.2 Regression
Regression used in extent of correlation, enabling the author to examine the relationship
between one variable and several others. (Malhotra, 2009).In this case the author use
simple linear regression to check the relationship between the factors effecting brand
equity and multiple regression to know the strength of association between the 4 four
factors with the dependent variable which is brand equity.
Since the data set in the questionnaire are seen to be valid and reliable the next test that
was calculated is to find the relationship between variable of the dependent and
independent variables. With the help of SPSS, the regression is calculated. In regression
the r square is calculated to know how fit the model is. Both the simple linear and
multiple regressions gives the result of R square. In this statistical calculation, the
relationship is valid when the r square is greater than 0.5 as to know the variances of the
dependent variable to that of the independent variable (Malhotra, 2009). While the
significant value should be less than 0.05 to know the various hypothesis that are
accepted in the study and the ones that are rejected (Malhotra,2006). The (B) in this
statistical calculations is used to know the negative or positive relation between the
independent and dependent variable. In this research the author used both simple linear
and multiple regressions to evaluate the results and test the research questions.
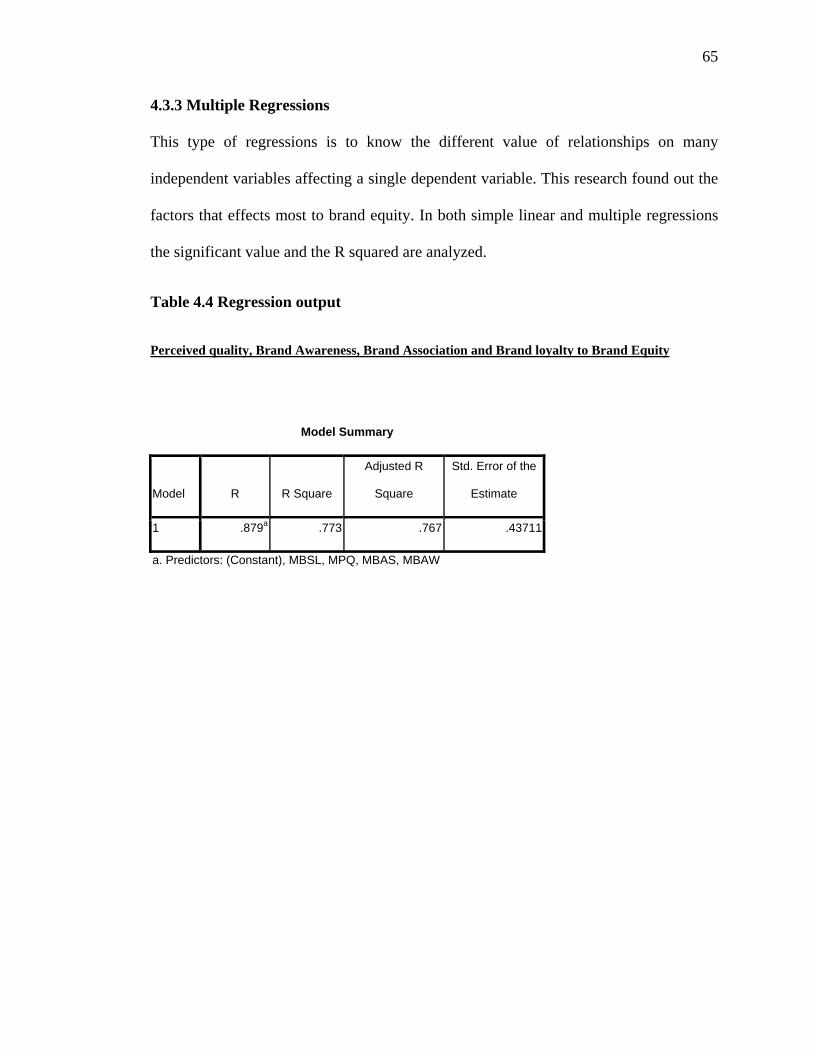
65
4.3.3 Multiple Regressions
This type of regressions is to know the different value of relationships on many
independent variables affecting a single dependent variable. This research found out the
factors that effects most to brand equity. In both simple linear and multiple regressions
the significant value and the R squared are analyzed.
Table 4.4 Regression output
Perceived quality, Brand Awareness, Brand Association and Brand loyalty to Brand Equity
Model Summary
Model R R Square
Adjusted R
Square
Std. Error of the
Estimate
1 .879a .773 .767 .43711
a. Predictors: (Constant), MBSL, MPQ, MBAS, MBAW
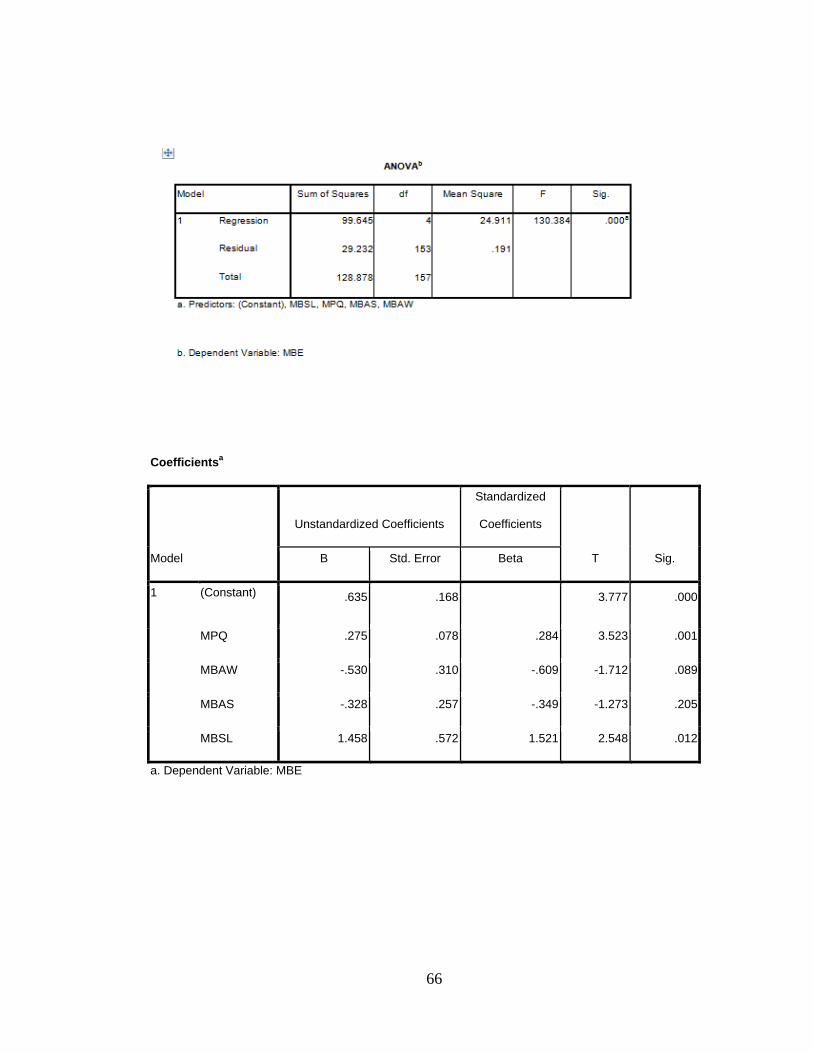
66
Coefficientsa
Model
Unstandardized Coefficients
Standardized
Coefficients
T Sig. B Std. Error Beta
1 (Constant) .635 .168 3.777 .000
MPQ .275 .078 .284 3.523 .001
MBAW -.530 .310 -.609 -1.712 .089
MBAS -.328 .257 -.349 -1.273 .205
MBSL 1.458 .572 1.521 2.548 .012
a. Dependent Variable: MBE
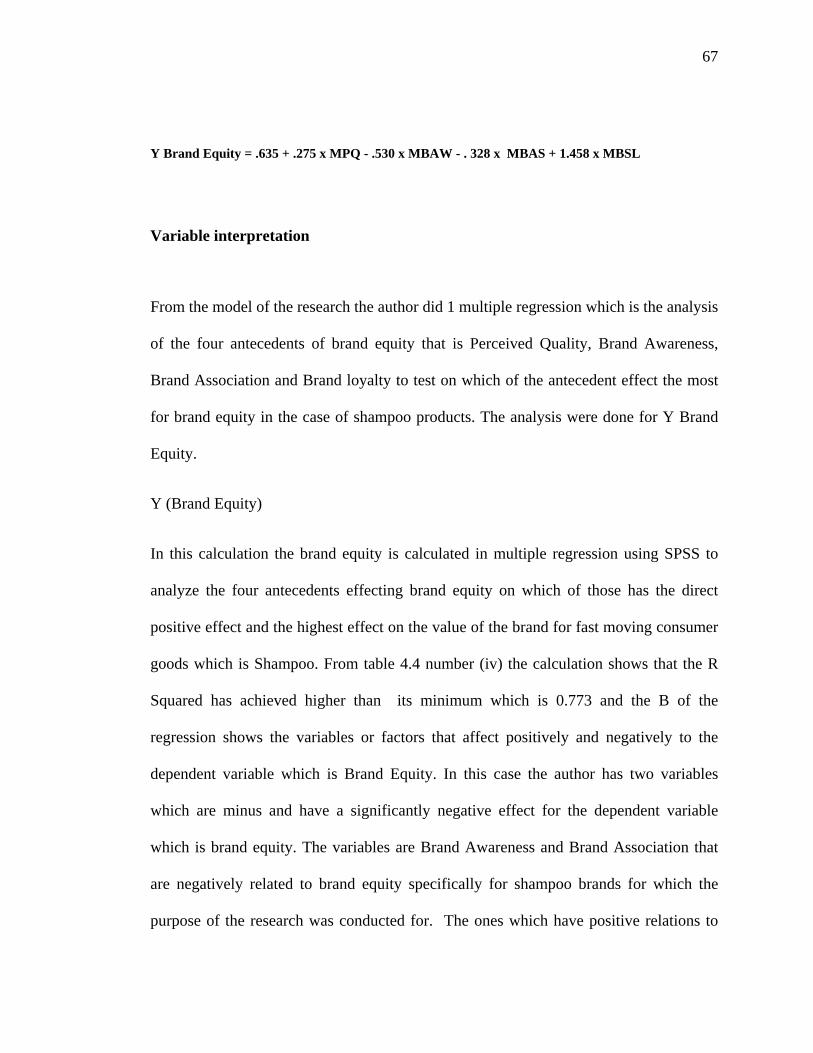
67
Y Brand Equity = .635 + .275 x MPQ - .530 x MBAW - . 328 x MBAS + 1.458 x MBSL
Variable interpretation
From the model of the research the author did 1 multiple regression which is the analysis
of the four antecedents of brand equity that is Perceived Quality, Brand Awareness,
Brand Association and Brand loyalty to test on which of the antecedent effect the most
for brand equity in the case of shampoo products. The analysis were done for Y Brand
Equity.
Y (Brand Equity)
In this calculation the brand equity is calculated in multiple regression using SPSS to
analyze the four antecedents effecting brand equity on which of those has the direct
positive effect and the highest effect on the value of the brand for fast moving consumer
goods which is Shampoo. From table 4.4 number (iv) the calculation shows that the R
Squared has achieved higher than its minimum which is 0.773 and the B of the
regression shows the variables or factors that affect positively and negatively to the
dependent variable which is Brand Equity. In this case the author has two variables
which are minus and have a significantly negative effect for the dependent variable
which is brand equity. The variables are Brand Awareness and Brand Association that
are negatively related to brand equity specifically for shampoo brands for which the
purpose of the research was conducted for. The ones which have positive relations to
68
brand equity are perceived quality and brand loyalty. With this calculation the
significant value also shows the no linear relationship and accepted hypothesis ,in this
case the accepted hypothesis that have a significant value lesser than 0.05 are brand
loyalty and perceived quality having brand loyalty to achieve a better relation to brand
equity in compare to the other factors.
The regression formula is:
Y Brand Equity = .635 + .275 x MPQ - .530 x MBAW - . 328 x MBAS + 1.458 x
MBSL
This means when perceived quality increase by 1 also when there is increase in brand
loyalty by 1 there is also there is a highly increase in brand equity by .275 and 1.458
having all the other variables stay constant. While when there is an increase in brand
awareness by 1 and brand association 1 there will have a reduce in brand equity by .328
and .530.
H1: Perceived quality have a direct effect to brand equity
H2 Brand Association is directly affected to brand equity
H3: Brand Awareness is related directly to brand equity
H4: Brand loyalty is related directly to brand equity
From the 4 hypothesis there are two significant values that are accepted in this statistical
calculation through multiple regressions.
69
H1 : The perceived quality that is the perception of customers about the quality of the
brand matters a lot for brand equity. From the calculations is shown that there has been a
positive direct effect for the independent variable perceived quality with the dependent
variable brand equity. The B that shows a positive effect and a significant level that is
lower than 0.05 shows that the hypothesis is accepted. Whereby, perceived quality have
a direct positive relationship to brand equity.
H2: The Brand Awareness that is the awareness of the brand by the customers are less
likely affecting the brand equity of the shampoo products as table 4.4 (iv) shows that the
awareness of the brand brings a negative relation to the value of brand in the case of
shampoo in Jakarta market with a respondents limited to 158 people. The no linear
relationship between the awareness of the brand with the over all equity of shampoo is
because usually in most shampoo advertising the brand is exposed everywhere in the
supermarket,in billboards. It only shows on the existence of the brand but the quality
that it promises is sometimes left behind. Which are in this research shown that the
quality perceived by the people are very important. Thus awareness need to be
completed with the persuaded and informed quality that it promises not only branding
them.
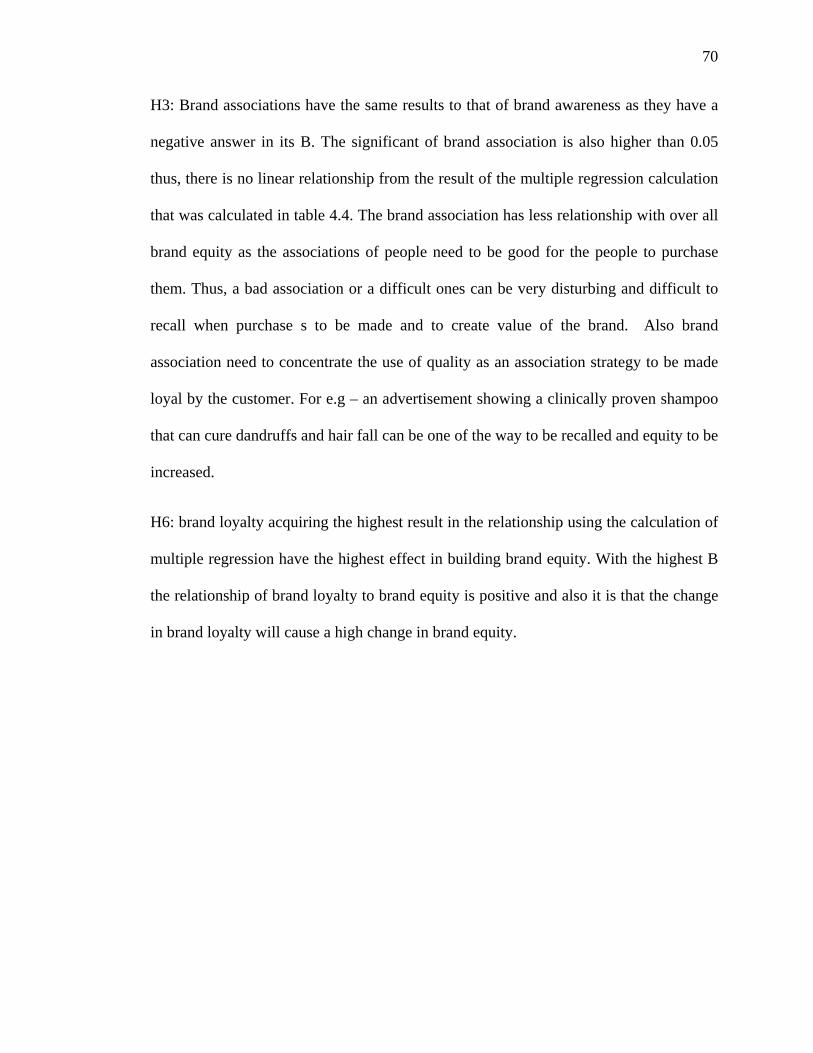
70
H3: Brand associations have the same results to that of brand awareness as they have a
negative answer in its B. The significant of brand association is also higher than 0.05
thus, there is no linear relationship from the result of the multiple regression calculation
that was calculated in table 4.4. The brand association has less relationship with over all
brand equity as the associations of people need to be good for the people to purchase
them. Thus, a bad association or a difficult ones can be very disturbing and difficult to
recall when purchase s to be made and to create value of the brand. Also brand
association need to concentrate the use of quality as an association strategy to be made
loyal by the customer. For e.g – an advertisement showing a clinically proven shampoo
that can cure dandruffs and hair fall can be one of the way to be recalled and equity to be
increased.
H6: brand loyalty acquiring the highest result in the relationship using the calculation of
multiple regression have the highest effect in building brand equity. With the highest B
the relationship of brand loyalty to brand equity is positive and also it is that the change
in brand loyalty will cause a high change in brand equity.
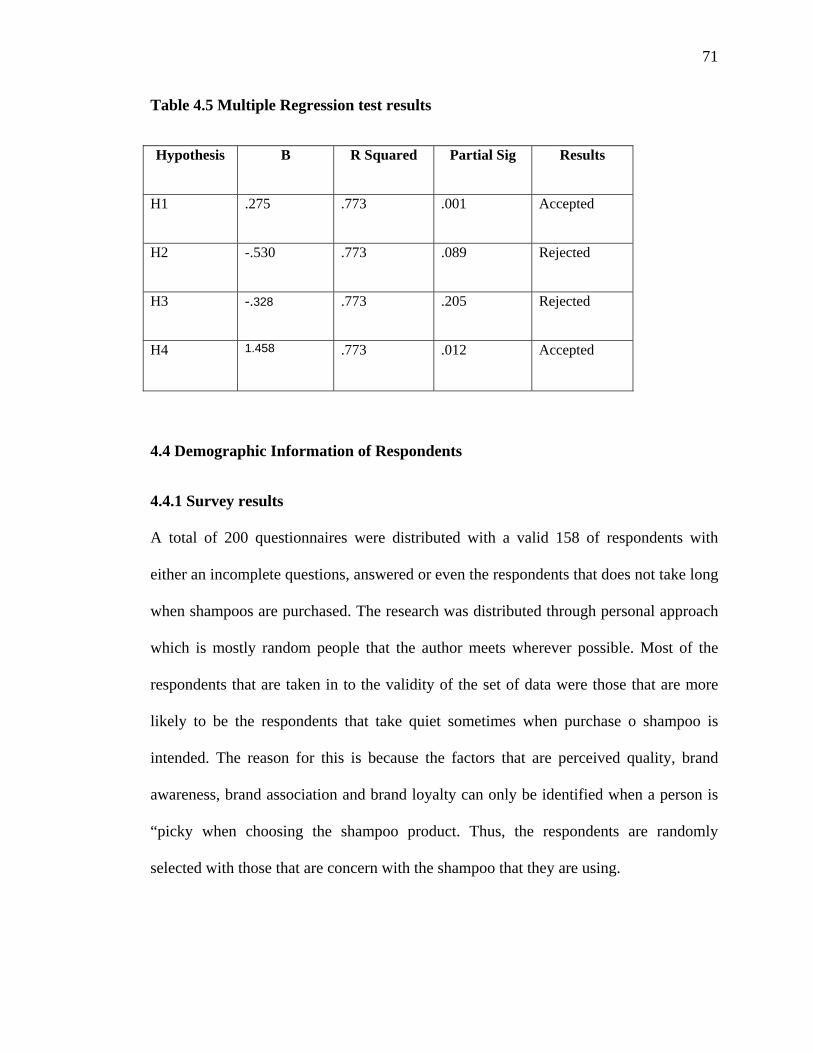
71
Table 4.5 Multiple Regression test results
Hypothesis B R Squared Partial Sig Results
H1 .275 .773 .001 Accepted
H2 -.530 .773 .089 Rejected
H3 -.328 .773 .205 Rejected
H4 1.458 .773 .012 Accepted
4.4 Demographic Information of Respondents
4.4.1 Survey results
A total of 200 questionnaires were distributed with a valid 158 of respondents with
either an incomplete questions, answered or even the respondents that does not take long
when shampoos are purchased. The research was distributed through personal approach
which is mostly random people that the author meets wherever possible. Most of the
respondents that are taken in to the validity of the set of data were those that are more
likely to be the respondents that take quiet sometimes when purchase o shampoo is
intended. The reason for this is because the factors that are perceived quality, brand
awareness, brand association and brand loyalty can only be identified when a person is
“picky when choosing the shampoo product. Thus, the respondents are randomly
selected with those that are concern with the shampoo that they are using.
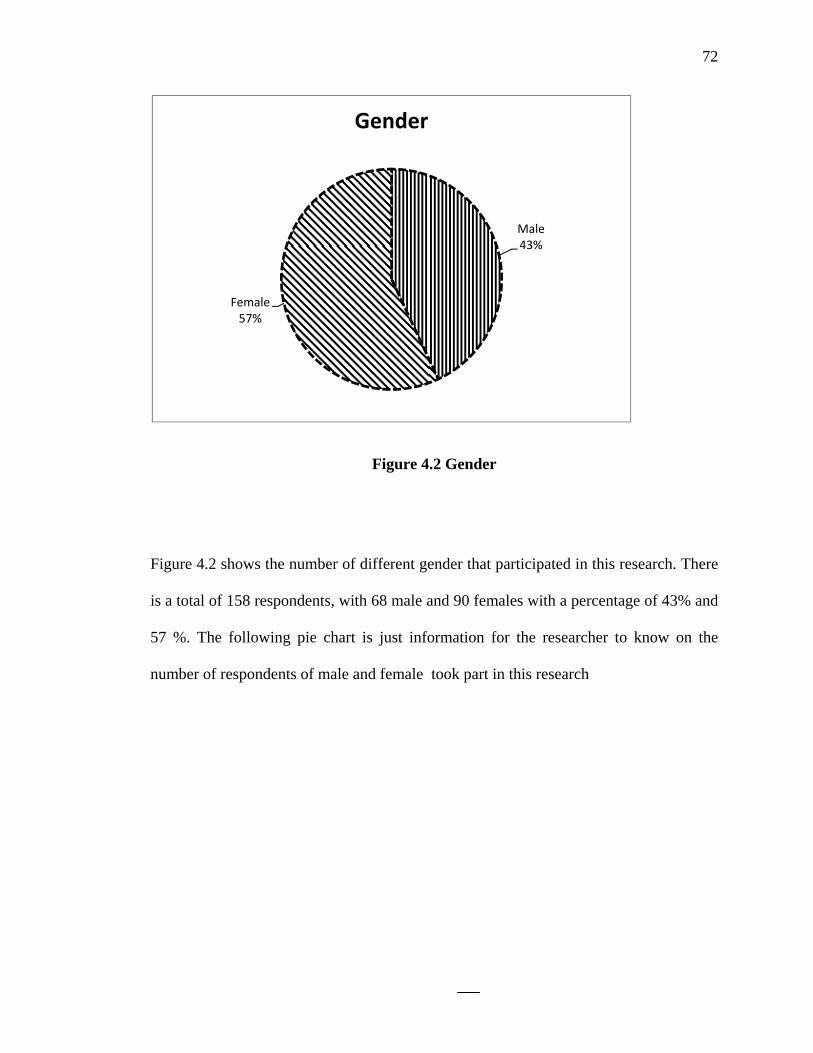
72
Figure 4.2 Gender
Figure 4.2 shows the number of different gender that participated in this research. There
is a total of 158 respondents, with 68 male and 90 females with a percentage of 43% and
57 %. The following pie chart is just information for the researcher to know on the
number of respondents of male and female took part in this research
Male43%
Female57%
Gender
73
Figure 4.3 Age
The respondents of the research are mostly those that range between 26 and 36 years
old,mostly those respondents that the author gave the questionnaire when passing by on
a supermarket or many other places where shampoos are sold,and the rest are mostly
university students and also colleagues.
<151% 16‐25
8%
>4729%
37‐4731%
26‐3631%
Age
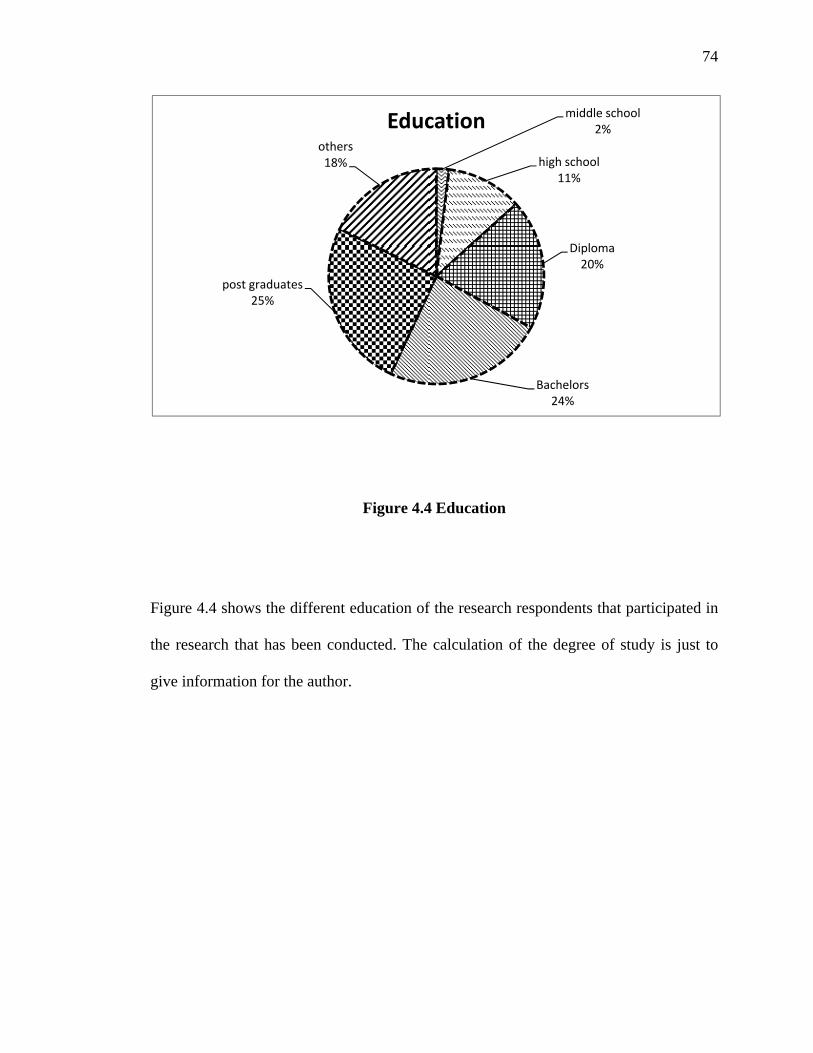
74
Figure 4.4 Education
Figure 4.4 shows the different education of the research respondents that participated in
the research that has been conducted. The calculation of the degree of study is just to
give information for the author.
middle school2%
high school11%
Diploma20%
Bachelors24%
post graduates25%
others18%
Education
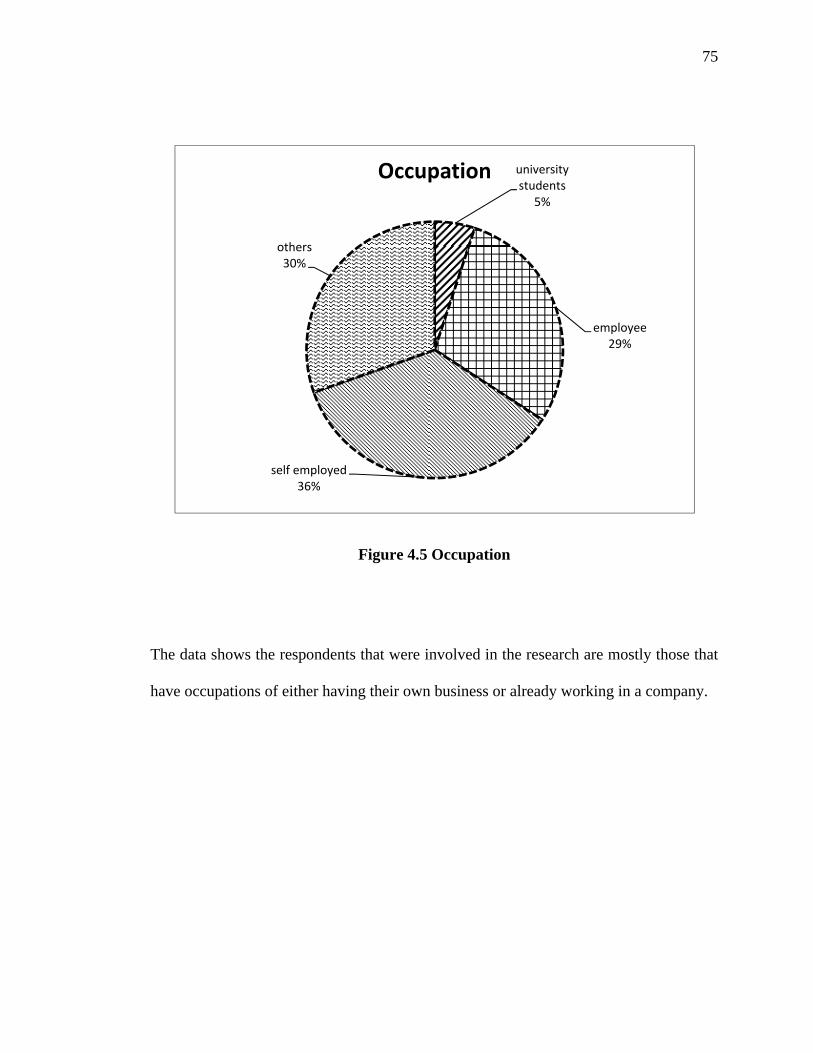
75
Figure 4.5 Occupation
The data shows the respondents that were involved in the research are mostly those that
have occupations of either having their own business or already working in a company.
university students
5%
employee29%
self employed36%
others30%
Occupation
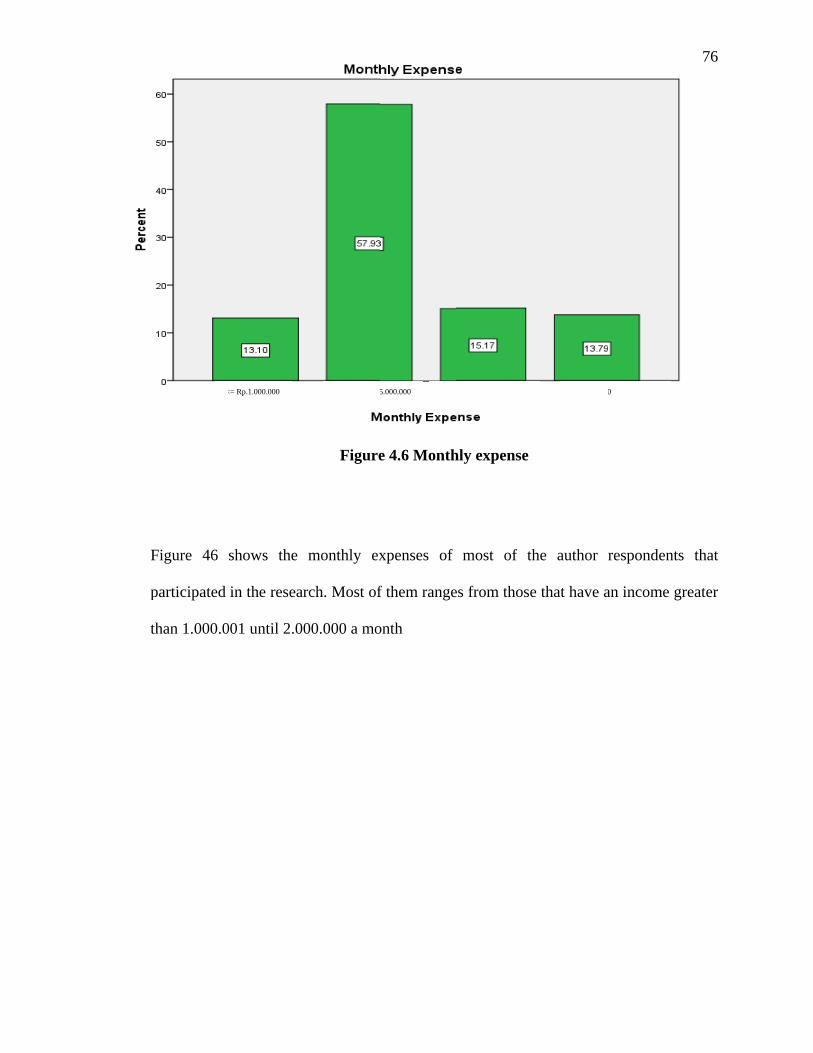
F
p
t
Figure 46
participated
than 1.000.0
<
shows the
in the resear
001 until 2.00
<= Rp.1.000.000
Figure
monthly ex
rch. Most of
00.000 a mo
Rp.1.000.001-5
e 4.6 Month
xpenses of
f them range
onth
5.000.000 Rp. 5
hly expense
most of th
es from those
5.000.001-10.000.000
he author r
e that have a
>10.000.000
respondents
an income gr
0
76
that
reater
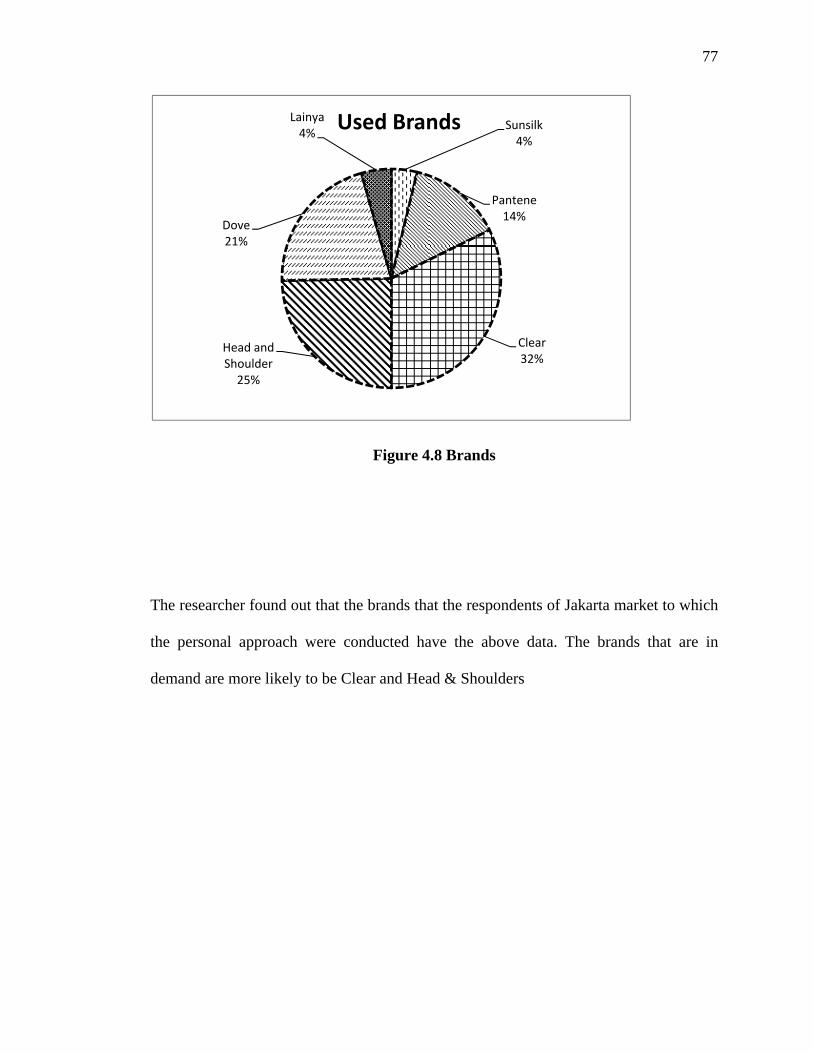
77
Figure 4.8 Brands
The researcher found out that the brands that the respondents of Jakarta market to which
the personal approach were conducted have the above data. The brands that are in
demand are more likely to be Clear and Head & Shoulders
Sunsilk4%
Pantene14%
Clear32%
Head and Shoulder25%
Dove21%
Lainya4%
Used Brands
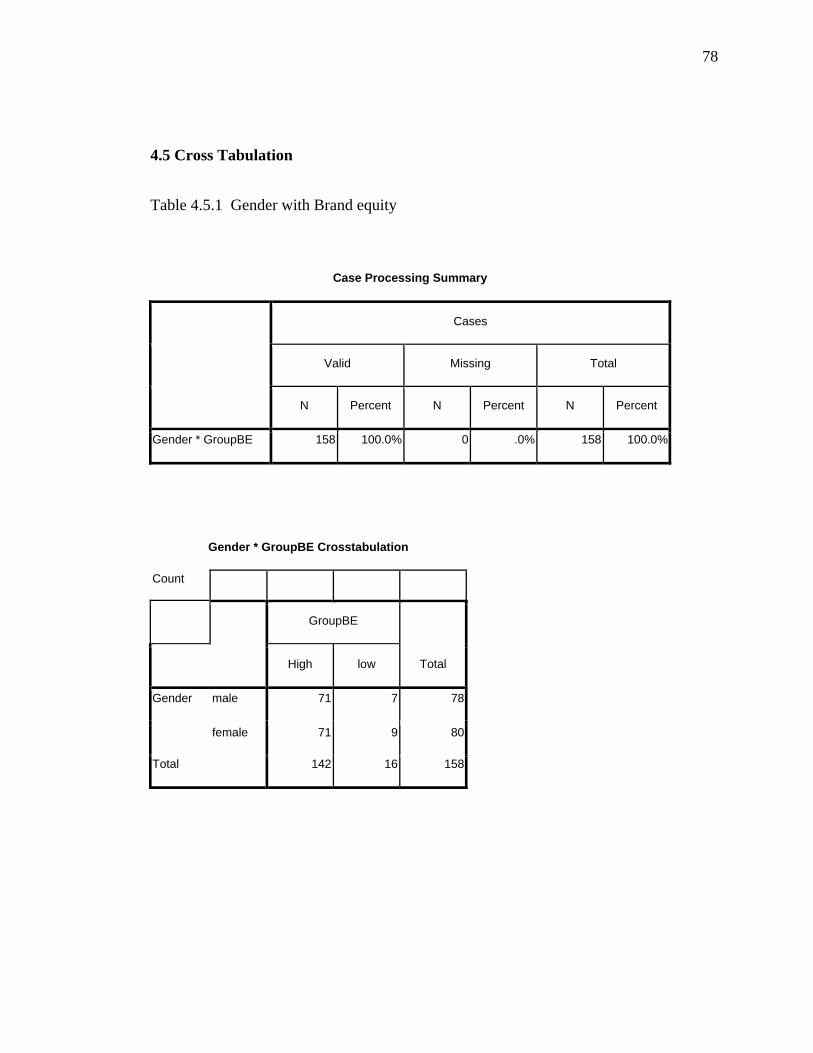
78
4.5 Cross Tabulation
Table 4.5.1 Gender with Brand equity
Case Processing Summary
Cases
Valid Missing Total
N Percent N Percent N Percent
Gender * GroupBE 158 100.0% 0 .0% 158 100.0%
Gender * GroupBE Crosstabulation
Count
GroupBE
Total High low
Gender male 71 7 78
female 71 9 80
Total 142 16 158
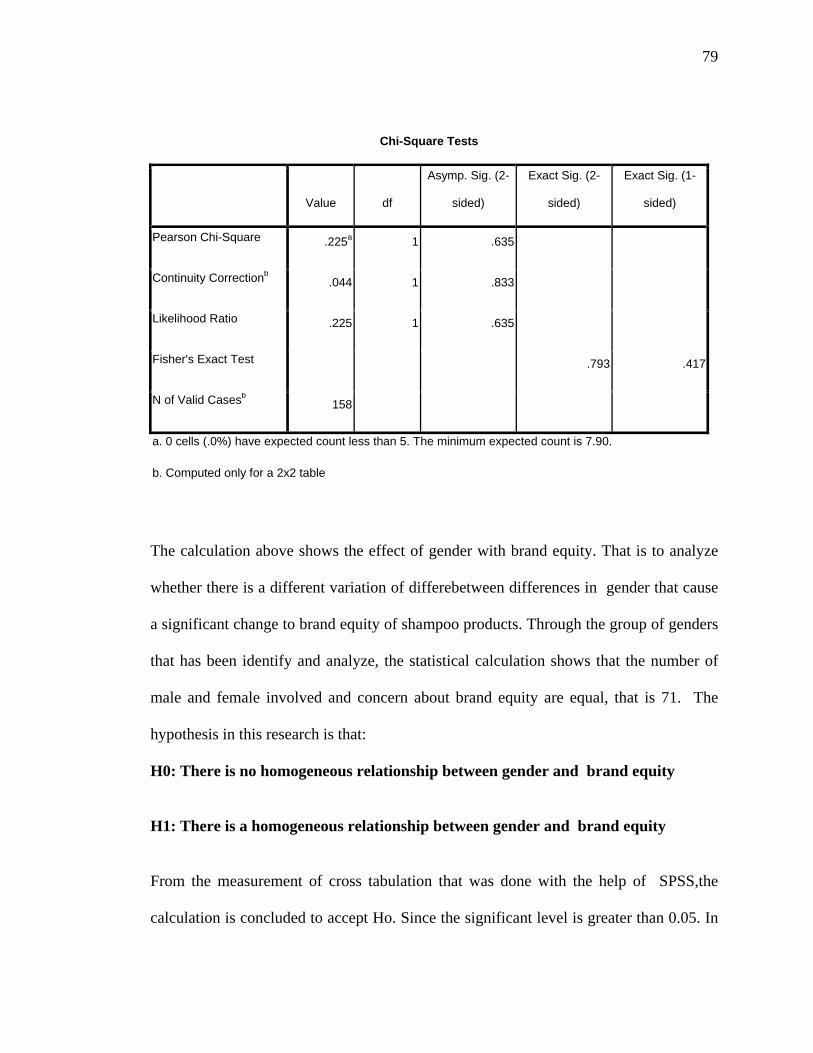
79
Chi-Square Tests
Value df
Asymp. Sig. (2-
sided)
Exact Sig. (2-
sided)
Exact Sig. (1-
sided)
Pearson Chi-Square .225a 1 .635
Continuity Correctionb .044 1 .833
Likelihood Ratio .225 1 .635
Fisher's Exact Test .793 .417
N of Valid Casesb 158
a. 0 cells (.0%) have expected count less than 5. The minimum expected count is 7.90.
b. Computed only for a 2x2 table
The calculation above shows the effect of gender with brand equity. That is to analyze
whether there is a different variation of differebetween differences in gender that cause
a significant change to brand equity of shampoo products. Through the group of genders
that has been identify and analyze, the statistical calculation shows that the number of
male and female involved and concern about brand equity are equal, that is 71. The
hypothesis in this research is that:
H0: There is no homogeneous relationship between gender and brand equity
H1: There is a homogeneous relationship between gender and brand equity
From the measurement of cross tabulation that was done with the help of SPSS,the
calculation is concluded to accept Ho. Since the significant level is greater than 0.05. In
80
other words, there is no effect in the relationship of different genders with brand equity
for fast moving consumer goods which is shampoo.
81
CHAPTER V
CONCLUSION AND RECOMMENDATION
In this chapter the author will elaborate more on the findings to add up on the
explanation in the previous chapter. This chapter consists of the summary of the
findings, Managerial Implications, Limitations of the current research and also
recommendation for future researcher
5.1 Conclusion
The research focused on the factors of Brand Awareness, Brand Association, Perceived
quality and Brand loyalty on the overall Brand Equity. The brand equity measured in
this research is for fast moving consumer goods, specifically shampoo brands within the
Jakarta area. The reason the author uses shampoo brands to focus in this research is
because shampoo is a fast moving consumer products category which is usually a low
involvement product to be purchased but it has a high influence on the appearance of
people
The main motivation of this research is to give information to the author on which of the
following factors: Perceived Quality, Brand Awareness, Brand Association and Brand
Loyalty has greater affect to building brand equity specifically for shampoo brands in
Jakarta area. The result of the research shows that Perceived Quality and Brand loyalty
affects the most to the Overall BE, compared to the other two factors in shampoo
products,that is brand awareness and brand association. The result of the cross tabulation
also
82
shows that neither gender nor the level of education has any affect to the brand equity of
shampoo product.
The research as informed earlier have 4 research questions that would be answered when
the research is conducted by the author. Following are the analysis and brief answers to
the research being conducted:
RQ 1. Does perceived quality has a significant positive direct effect on brand
equity?
H1The following hypothesis was calculated using a multiple regression. The result
shows that there is a relationship between perceived quality with brand equity or most
commonly known as the value of the brand. Perception of quality in brands like
shampoo is highly needed when continuous purchasing is focused. These shampoo
brands especially those which are newly introduced will need a better perception of
quality than existing brands of shampoo. Perception is normally the thoughts for things
that have never been used before. The perception of quality is thus identified as the first
insight a person have over the brand when is first time shown to them. The analysis of
this research also shows that the perception of quality cause a high influence to brand
equity rather than brand awareness and brand association.
83
RQ 2: Does brand awareness has a significant positive direct effect on brand
equity?
H2- An analysis of the calculations shows that there are effects for brand awareness with
brand equity. The awareness of people over shampoo brand causes them to be able to
analyze the brand further. Awareness of the brand acts as a bridge for the parent brand
that a positive awareness of customer over the brand will cause positive brand equity.
The awareness of brands are mostly those which can be through their names, packaging,
taglines, the advertisements they show and many other causes of awareness to be built
are used now a days to make people aware of the existence of the brand .When the
author put together the brand awareness in comparison to the factors effecting brand
equity, it is unlikely to cause a positive relationship with brand equity.
RQ 3: Does brand association has a significant positive direct effect on brand
equity?
H3- Most of the consumers analyze a brand of shampoo through the association that
they create in their mind to be able to remember the characteristics of brand. Through
the calculation by SPSS the research shows that there is a relationship between
association and Brand Equity using the simple linear regression that there is an affect of
association for the building up of value in a brand. But these associations of brand are
less likely to be effective if compared with Perceived Quality, Brand Awareness, Brand
Association and Brand Loyalty. An association which is used to indicate a brand are
mostly the tag line, the advertisements, the colour it represents and also the packaging.
84
By this type of branding people may associate it with specially the product itself that
makes them easy to purchase and remember on its characteristics.
RQ 4 : Does brand loyalty has a significant positive direct effect on brand equity?
H4 – The result from the SPSS calculation shows that Brand loyalty is the most
powerful factor in building brand equity. As consumers become loyal to the brand, they
will be less likely to change their perception about any information available in their
surroundings. A loyal consumer of shampoo will be less likely to change their shampoo
brands. The analysis of the research shows that loyalty achieves the highest influencing
factors causing brand equity. This shows that the loyalty of the brand over shampoo
products cause a high value to be placed in the brand.
85
5.2 Managerial Implications:
(A) Perceived Quality
• For marketers to better understand that the perception of quality is the
next best factors that can be included when a company seeks to improve
their brand equity.
• The perception of quality such as the ingredients that is used and also the
approval clinic that support the promising message of these shampoo
products are effective in building brand equity for consumers.
• The research shows that the quality that customer perceived about a
brand will be able to create the value to increase deliberately. This can be
a strategy for marketer to focus its shampoo brand in developing a good
perception in the quality of the shampoo brand.
• To increase perception in quality marketer can concerned on the
communication like “the shampoo is clinically proven by an adequate
research in America as anti dandruff’
86
(B) Brand Awareness
• From the research, it shows that the advertising should focus on the
quality of the shampoo that it delivers to the customer. Not only
concentrating on exposing the brand solely.
• When awareness is implemented by the marketer there is a tendency that
this might be successful for branding of the product to be remembered
when purchase is intended. Mostly awareness is mainly used for newly
introduced shampoo to be known for its existence in the eye of the
customer.
• Awareness can exist when the products is exposed continuously in
people’s mind for e.g.- Give free samples or participate during events
• Brand awareness can be developed through a continuous advertisement
and exposure to customer For e.g.- the advertisement shows the quality of
the product to be able to reduce hair fall and dandruff that was given a
testimonial from a person. This awareness in people testimonial can be
remembered on decision making during purchase.
87
(C) Brand Association
• This is used by people as an indicator to remember a product. Marketer
use this make people remember when purchase is intended
• When a product associated is perceived bad by the people, then this
would cause negative result to the whole product development.
• An association is regarded by the product that the marketer presents to
the consumer. Thus, when association is to be implemented to gain brand
equity a careful strategy in brand association is to be made.
• A good association have to be built which can be through, creative tag
lines, green packaging and doing a cause relationship marketing.
• Association may be having less relation to brand equity but it helps to
improve company brand image, thus association must be positive to
create positive responses.
88
(D) Brand Loyalty
• Based on the findings through the calculations using spss,it can give
information for marketer that loyalty of the brand cause a high effect on
the overall brand equity.
• Being loyal to a shampoo brand will increase the overall BE and more
importantly generate repeat purchase in confirmed.
• Marketer thus, should have a high goal on achieving brand loyalty for
shampoo to gain value for the brand.
• Brand loyalty exist when there are satisfaction derived by the customer.
Customer satisfaction can be fulfilled through continuously developing
and updating the product or service as per the need of the customers and
also having to know the culture of the customer and the type of
promotions they focus.
• For e.g. different geographic area have different response to ‘discounted
products’’ thus, Company especially those of shampoo products should
know which promotions type to focus. Whether in terms of discount,
attract9ve packaging, bundling or many other of its type.
89
5.3 Limitations of the research
Since the research was conducted within 4 months period, thus allow the author to only
distribute to 200 respondents, in which 158 were valid respondents, therefore the level
of accuracy of the research only represent a small portion of the total population of
Indonesia. Due to this time constraints further research is un available to be generated.
Like, comparing between genders on which of them are brand sensitive when
purchasing a shampoo.
Due to time constraint the research was conducted only in Jakarta area. As this research
is a replication of the previous one, the variables effecting brand equity only consists of
4 factors. The factors or antecedents effecting brand equity are Perceived Quality, Brand
Awareness, Brand Association, Brand loyalty. The findings were limited to these factors
whereby there might be many potential factors effecting brand equity, which are, price,
market behaviour and brand origin. In other words the independent factors are less in
number to influence the dependent variable which is brand equity.
90
5.4 Recommendations for future research
For future research there are still certain points that the author was not able to cover.
- The changes of shampoo brands are increasing deliberately almost every day,
thus the research have to be updated accordingly.
- With more sufficient factors effecting Brand Equity a higher and deeper level of
accuracy can be resulted.
- As the limited variables caused un in adequate data, may be in the future
research, the researcher can build up more variables to make a sufficient and
reliable data.
- In the future the author can further compare the strategy between one shampoo
brands with another. That uses almost the same strategy to increase brand equity
and analyze which of them are more successful than another.
- For the next research more respondents can be used to support a higher and
deeper accuracy with greater level of effectiveness . So that the data is useful for
the readers, researchers and marketer of shampoo brands.
- Future researchers should consider the relationship between education and brand
equity using cross tabulation in order to know which of the segment in education
has higher effects to brand equity in overall.
91
BIBLIOGRAPHY
Aaker, L. (1994, March 3). Managing brand equity: Capitalizing on the value of a brand
name. Free press newyork, 29, 247-248.
Ailawadi, Kusum , and Kevin Lane Keller. "Understanding retail branding: conceptual
insights and research priorities." Journal of Retailing 10.008 (2004): 21. Print.
Arjun Chaudhuri, Morris B. Holbrook (2001). The Chain of Effects from Brand Trust
and Brand Affect to Brand Performance: The Role of Brand Loyalty. Journal of
Marketing: Vol. 65, No. 2, pp. 81-93.
Bogart, L. (1973). What Makes a Brand Name Familiar. Journal of Marketing Research,
10(1), 17-22.Cornell Hospitality Quaterly
Bowen,J.,& Shoemaker,S. (1998).Loyalty:a strategic commitment. Las vegas: Cornell
Hospitality Quaterly
Brand equity Pictures, Brand equity Image, others Photo Gallery. (n.d.). Collection of
Pictures, Videos, Quotes, Jokes, SMS - Withfriendship.com. Retrieved March 30, 2012,
from http://withfriendship.com/user/cyborg/brand-equity.php
Dennis A. Pitta, Lea Prevel Katsanis, (1995) "Understanding brand equity for successful
brand extension", Journal of Consumer Marketing, Vol. 12 Iss: 4, pp.51 – 64
“DescriptiveStatistics.”Social Research Methods,N.p.,n.d, Web,12 Apr.2012.
http://www.socialresearchmethods.net/kb/statdesc.php.
92
George S. Low, Charles W. Lamb Jr, (2000) "The measurement and dimensionality of
brand associations", Journal of Product & Brand Management, Vol. 9 Iss: 6, pp.350 -
370
Henk Roest, Rik Pieters, (1997) "The nomological net of perceived service quality",
International Journal of Service Industry Management, Vol. 8 Iss: 4, pp.336 – 351
Henrik Uggla, (2006),"The corporate brand association base: A conceptual model for
the creation of inclusive brand architecture", European Journal of Marketing, Vol. 40
Iss: 7 pp. 785 – 802
ICE TRACK : Exxpansion of Multi National FMCG Companies to Indonesia.(n.d.).ICE
TRACK.Retrieved March 30,2012 from
http://icetrack.blogspot.com/2011//07/expansion-of-multi-national-fmcg.html
Inferential statistics.Social research methods.N.p.n.d. Web, 12 Apr .2012.
http://wwwsocia;researchmethods.net/kb/st
Hofmann, A. (2008). EMPLOYMENT BRAND: THE CORE OF THE EMPLOYMENT
RELATIONSHIP. Middle east: Amanda Hofmann.
Keller, K. L. (0). Building customer based-brand equity. Cambridge: Kevin lane Keller.
Luarn,Pin.” A customer Loyalty Model for E-service Context.” Journal of Electronic
Commerce Research 4.4 (2003) :74-77.Print
Lane Keller, Kevin. "conceptualizing,measuring and managing customer- based brand
equity." Journal of Marketing 1 (1993): 22. Print.
93
N.K, Malhotra..Marketing research.United States: Pearson Education,2006.Print.
N.K, Malhotra..Marketing research.United States: Pearson Education,2009.Print.
Percy, L. (2006). Psychology and Marketing. USA: Wiley Periodicals.
Products << Carousel Highlights.’ Carousel, N.p., n.d. Web. 11 Apr.2012.
<http://www.carouselstrands.com/highlight
“Quantitative Research Design.”sportscience. N.p., n.d. Web. 10 June
2012.<http://www.sportsci.org/jour/0001/wg
Romaniuk,J.(2006). Comparing prompted and unprompted methods for measuring
consumer brand association.journal of targeting,measurement and analysis for
marketing,15(3),11.
Tong, X. and Hawley, J.M. (2009). Measuring customer-based brand equity: Empirical
evidence from the sportswear market in China. Journal of Product & Brand
Management. 18(4), 262-271.
Yaseen,N.(2001). (Impact of brand awareness, perceived quality and customer loyalty
on brand profitability and purchase intention. Journal of contemporary research in
business,3(8),833
94
APPENDIX
Appendix A: Questionnairre
BINUS UNIVERSITY
BINUS INTERNATIONAL
Kepada para responden yang terhormat,
Saya adalah murid marketing dari BINUS University International dan sebagai
persyaratan untuk menyelesaikan kuliah saya di bidang marketing, saya sedang menulis
sebuah skripsi tentatng “The measurement of customer based brand equity for fast
moving consumer goods in Jakarta.”
Saya mohon waktu anda untuk mengisi pertanyaan berikut unutk memudahkan saya
untuk mengumpulkan data data yang relevan untuk skripsi saya. Data data yang
diberikan kepada saya adalah untuk akademis dan kerahasiaan informasi akan dijamin
oleh saya.Terimak kasih atas waktu dan perhatian anda
Hormat Saya,
Chandni Nanwani
95
1. Jenis Kelamin
a.Laki-Laki
b.Perempuan
2. Usia
a. < 15
b.15-25 tahun
c.26-36 tahun
d.37-47 tahun
e.> 47 tahun
3.Pekerjaan
a.Pelajar
b.Mahasiswa/i
c.Karyawan
d.Wiraswata
e.Lainnya (Sebutkan) _____________________
96
4.Pendidikan Terakhir
a.SMP (Sekolah Menengah Pertama)
b.SMA (Sekolah Menengah Atas)
c.Diploma/D-3
d.Sarjana
e. Pascasarjana
f. Lainya(Sebutkan)________
5. Pengeluaran per bulan
a.> Rp 1.000.000
b.Rp 1.000.001 – Rp 5.000.000
c. Rp 5.000.001 – Rp 10.000.000
d. Rp 10.000.001 – Rp 25,.000.000
e. Rp 25.000.001 – Rp 50.000.000
97
6.Tipe Shampoo apa yang anda gunakan?(pilih satu)
a.Sunsilk
b.Pantene
c.Clear
d.Head and shoulder
e. Dove
f.Lainnya (Sebutkan)
_____________________
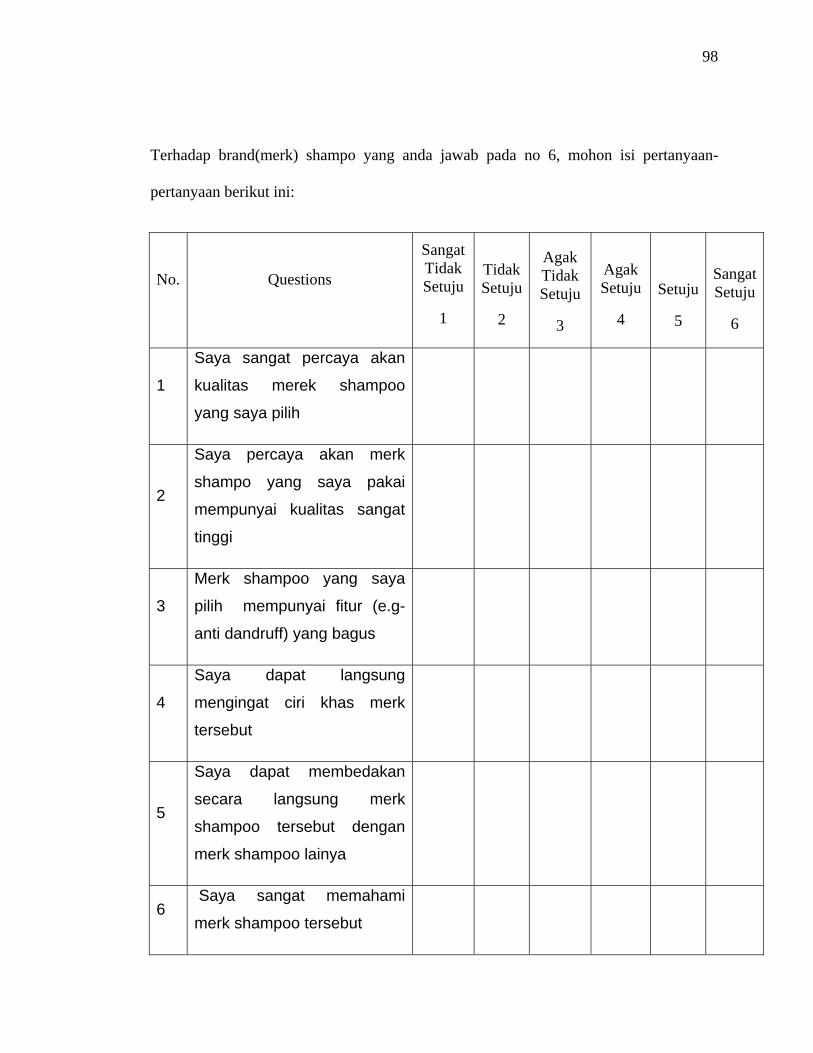
98
Terhadap brand(merk) shampo yang anda jawab pada no 6, mohon isi pertanyaan-
pertanyaan berikut ini:
No. Questions
Sangat Tidak Setuju
1
Tidak Setuju
2
Agak Tidak Setuju
3
Agak Setuju
4
Setuju
5
Sangat Setuju
6
1
Saya sangat percaya akan
kualitas merek shampoo
yang saya pilih
2
Saya percaya akan merk
shampo yang saya pakai
mempunyai kualitas sangat
tinggi
3
Merk shampoo yang saya
pilih mempunyai fitur (e.g-
anti dandruff) yang bagus
4
Saya dapat langsung
mengingat ciri khas merk
tersebut
5
Saya dapat membedakan
secara langsung merk
shampoo tersebut dengan
merk shampoo lainya
6 Saya sangat memahami
merk shampoo tersebut
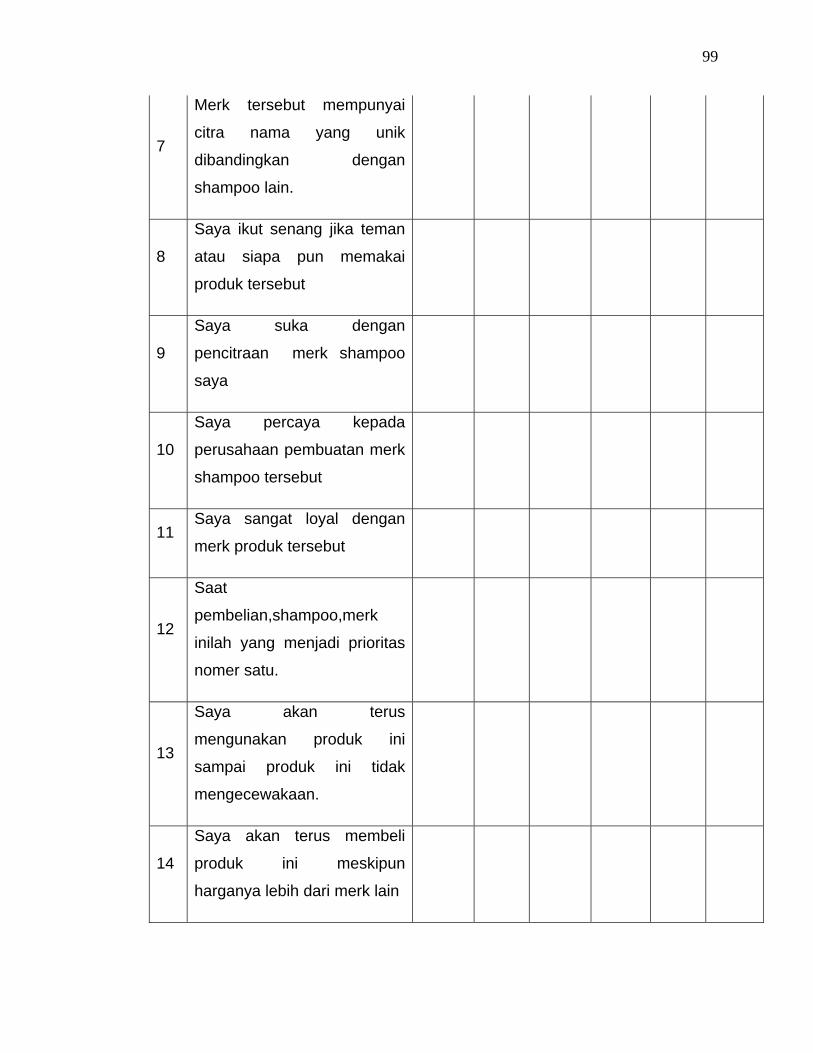
99
7
Merk tersebut mempunyai
citra nama yang unik
dibandingkan dengan
shampoo lain.
8
Saya ikut senang jika teman
atau siapa pun memakai
produk tersebut
9
Saya suka dengan
pencitraan merk shampoo
saya
10
Saya percaya kepada
perusahaan pembuatan merk
shampoo tersebut
11 Saya sangat loyal dengan
merk produk tersebut
12
Saat
pembelian,shampoo,merk
inilah yang menjadi prioritas
nomer satu.
13
Saya akan terus
mengunakan produk ini
sampai produk ini tidak
mengecewakaan.
14
Saya akan terus membeli
produk ini meskipun
harganya lebih dari merk lain
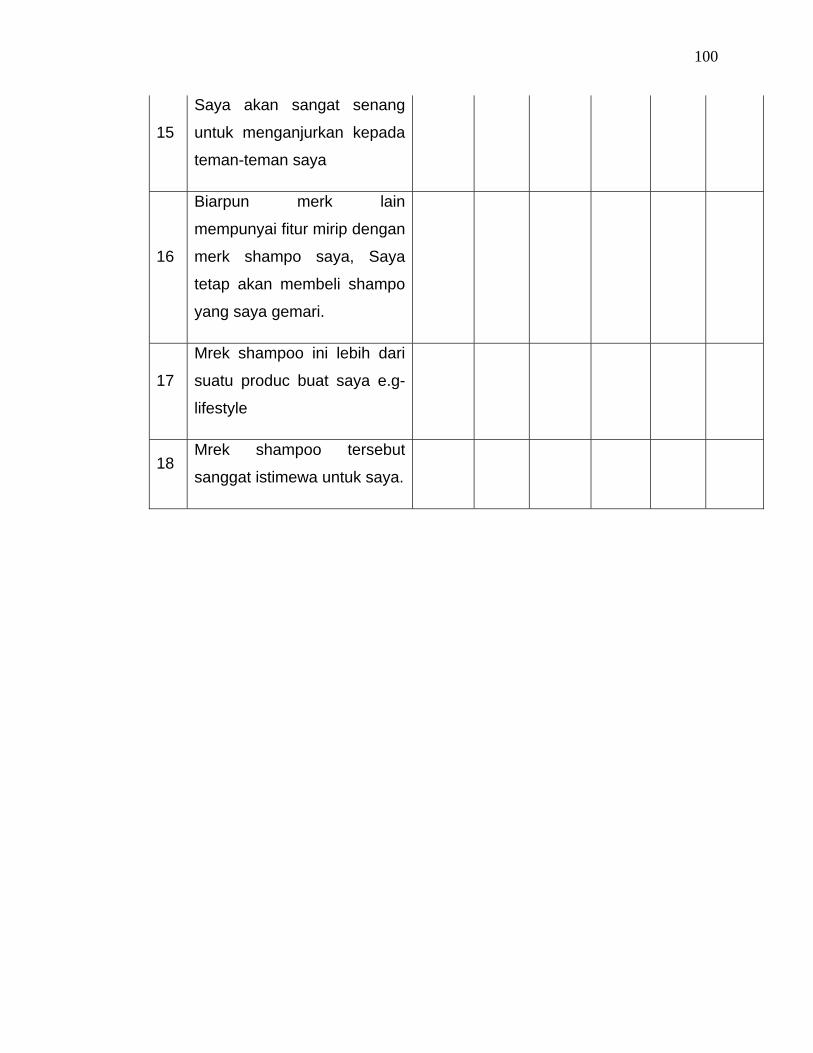
100
15
Saya akan sangat senang
untuk menganjurkan kepada
teman-teman saya
16
Biarpun merk lain
mempunyai fitur mirip dengan
merk shampo saya, Saya
tetap akan membeli shampo
yang saya gemari.
17
Mrek shampoo ini lebih dari
suatu produc buat saya e.g-
lifestyle
18 Mrek shampoo tersebut
sanggat istimewa untuk saya.
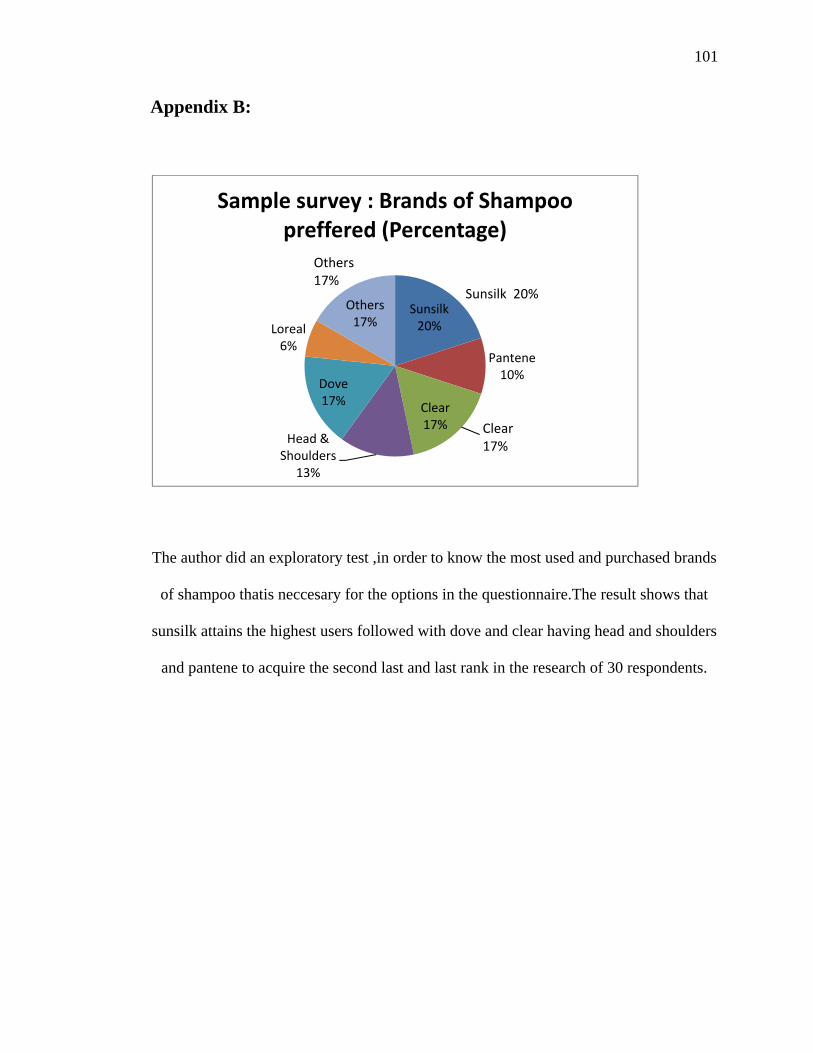
101
Appendix B:
The author did an exploratory test ,in order to know the most used and purchased brands
of shampoo thatis neccesary for the options in the questionnaire.The result shows that
sunsilk attains the highest users followed with dove and clear having head and shoulders
and pantene to acquire the second last and last rank in the research of 30 respondents.
Sunsilk20%
Pantene10%
Clear17%
Head & Shoulders
13%
Dove17%
Loreal6%
Others17%
Sample survey : Brands of Shampoo preffered (Percentage)
Clear17%
Sunsilk 20%
Others17%
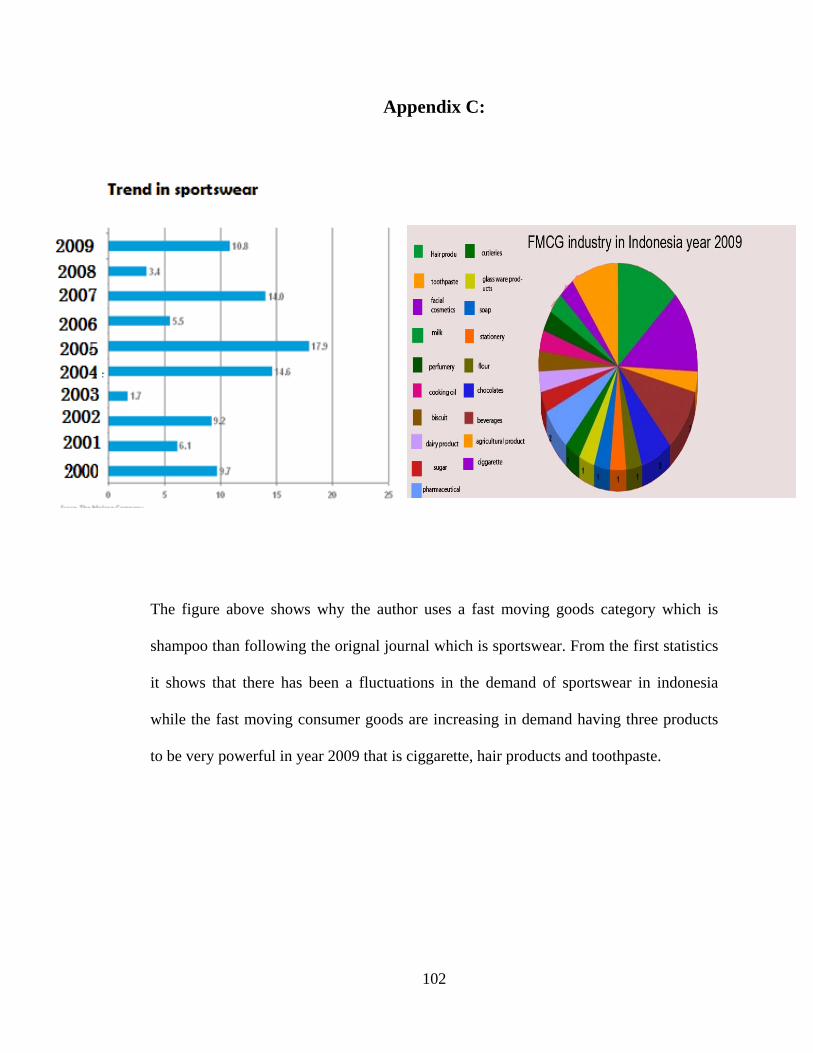
102
Appendix C:
The figure above shows why the author uses a fast moving goods category which is
shampoo than following the orignal journal which is sportswear. From the first statistics
it shows that there has been a fluctuations in the demand of sportswear in indonesia
while the fast moving consumer goods are increasing in demand having three products
to be very powerful in year 2009 that is ciggarette, hair products and toothpaste.